
Impacts of Large-Scale Groundwater Exploitation Based on Long-Term Evolution of Hydraulic Heads in Dhaka City, Bangladesh

 , , ,
, , ,
Abstract
:1. Introduction
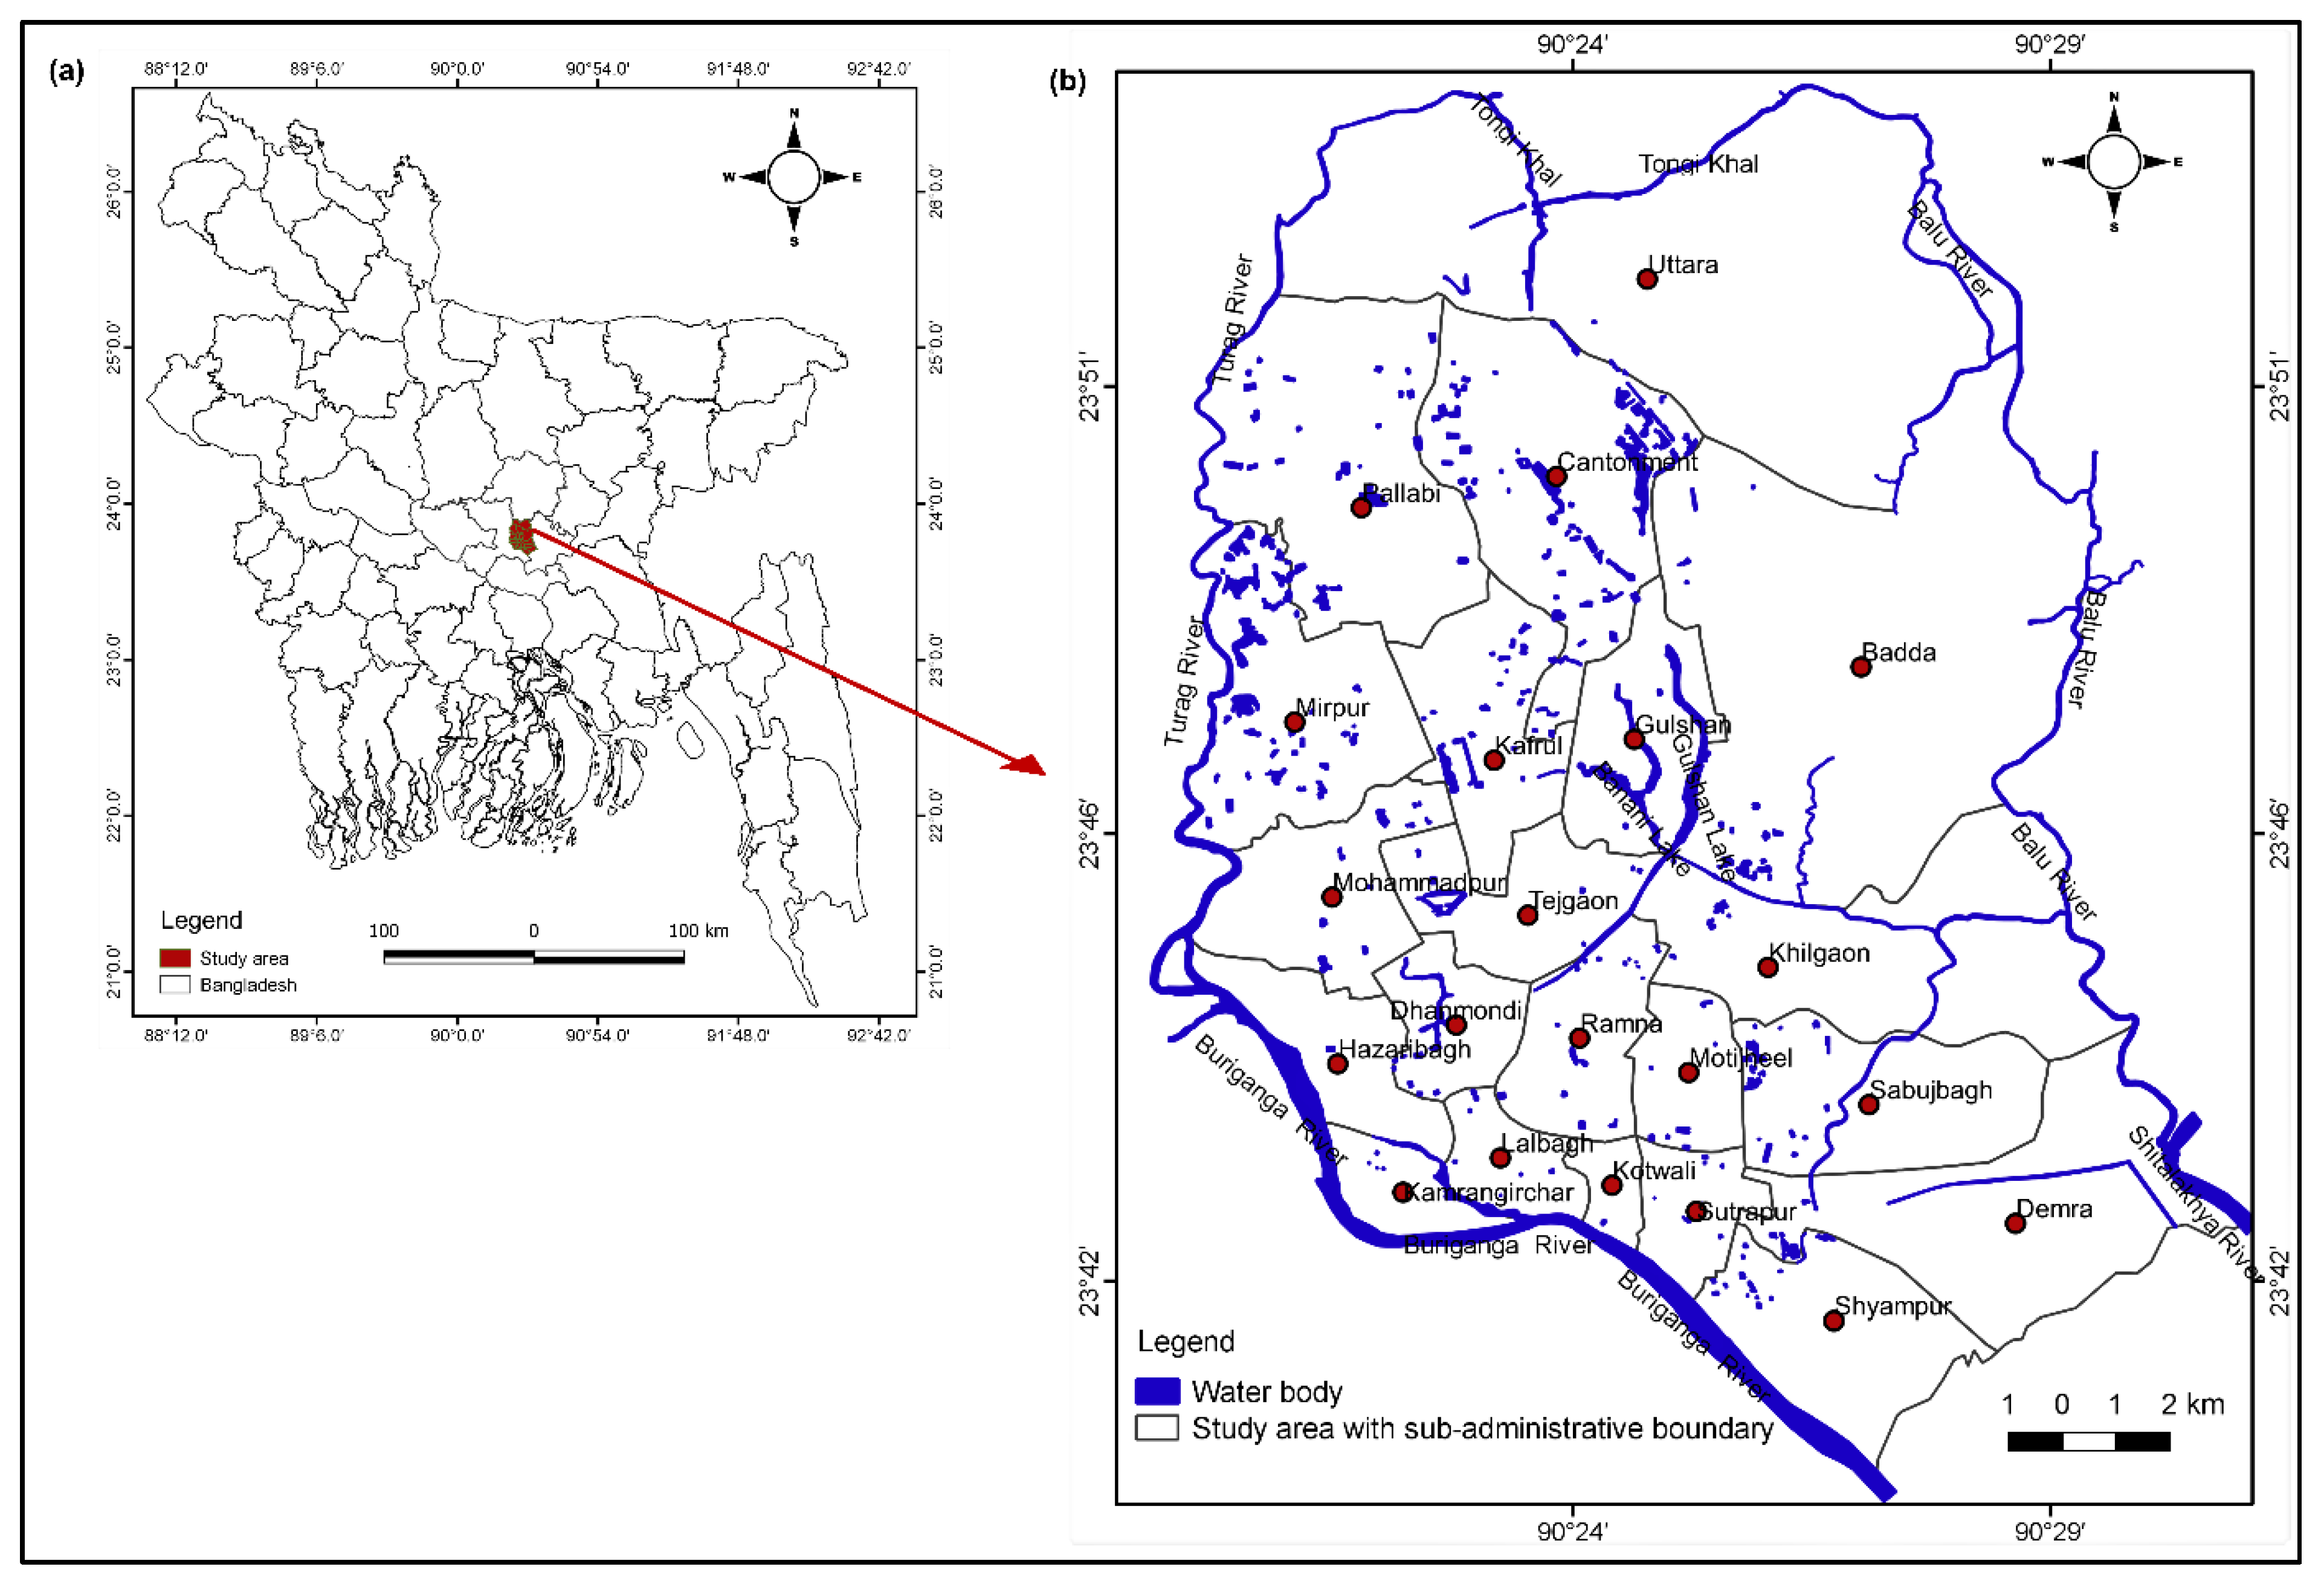
2. Study Area
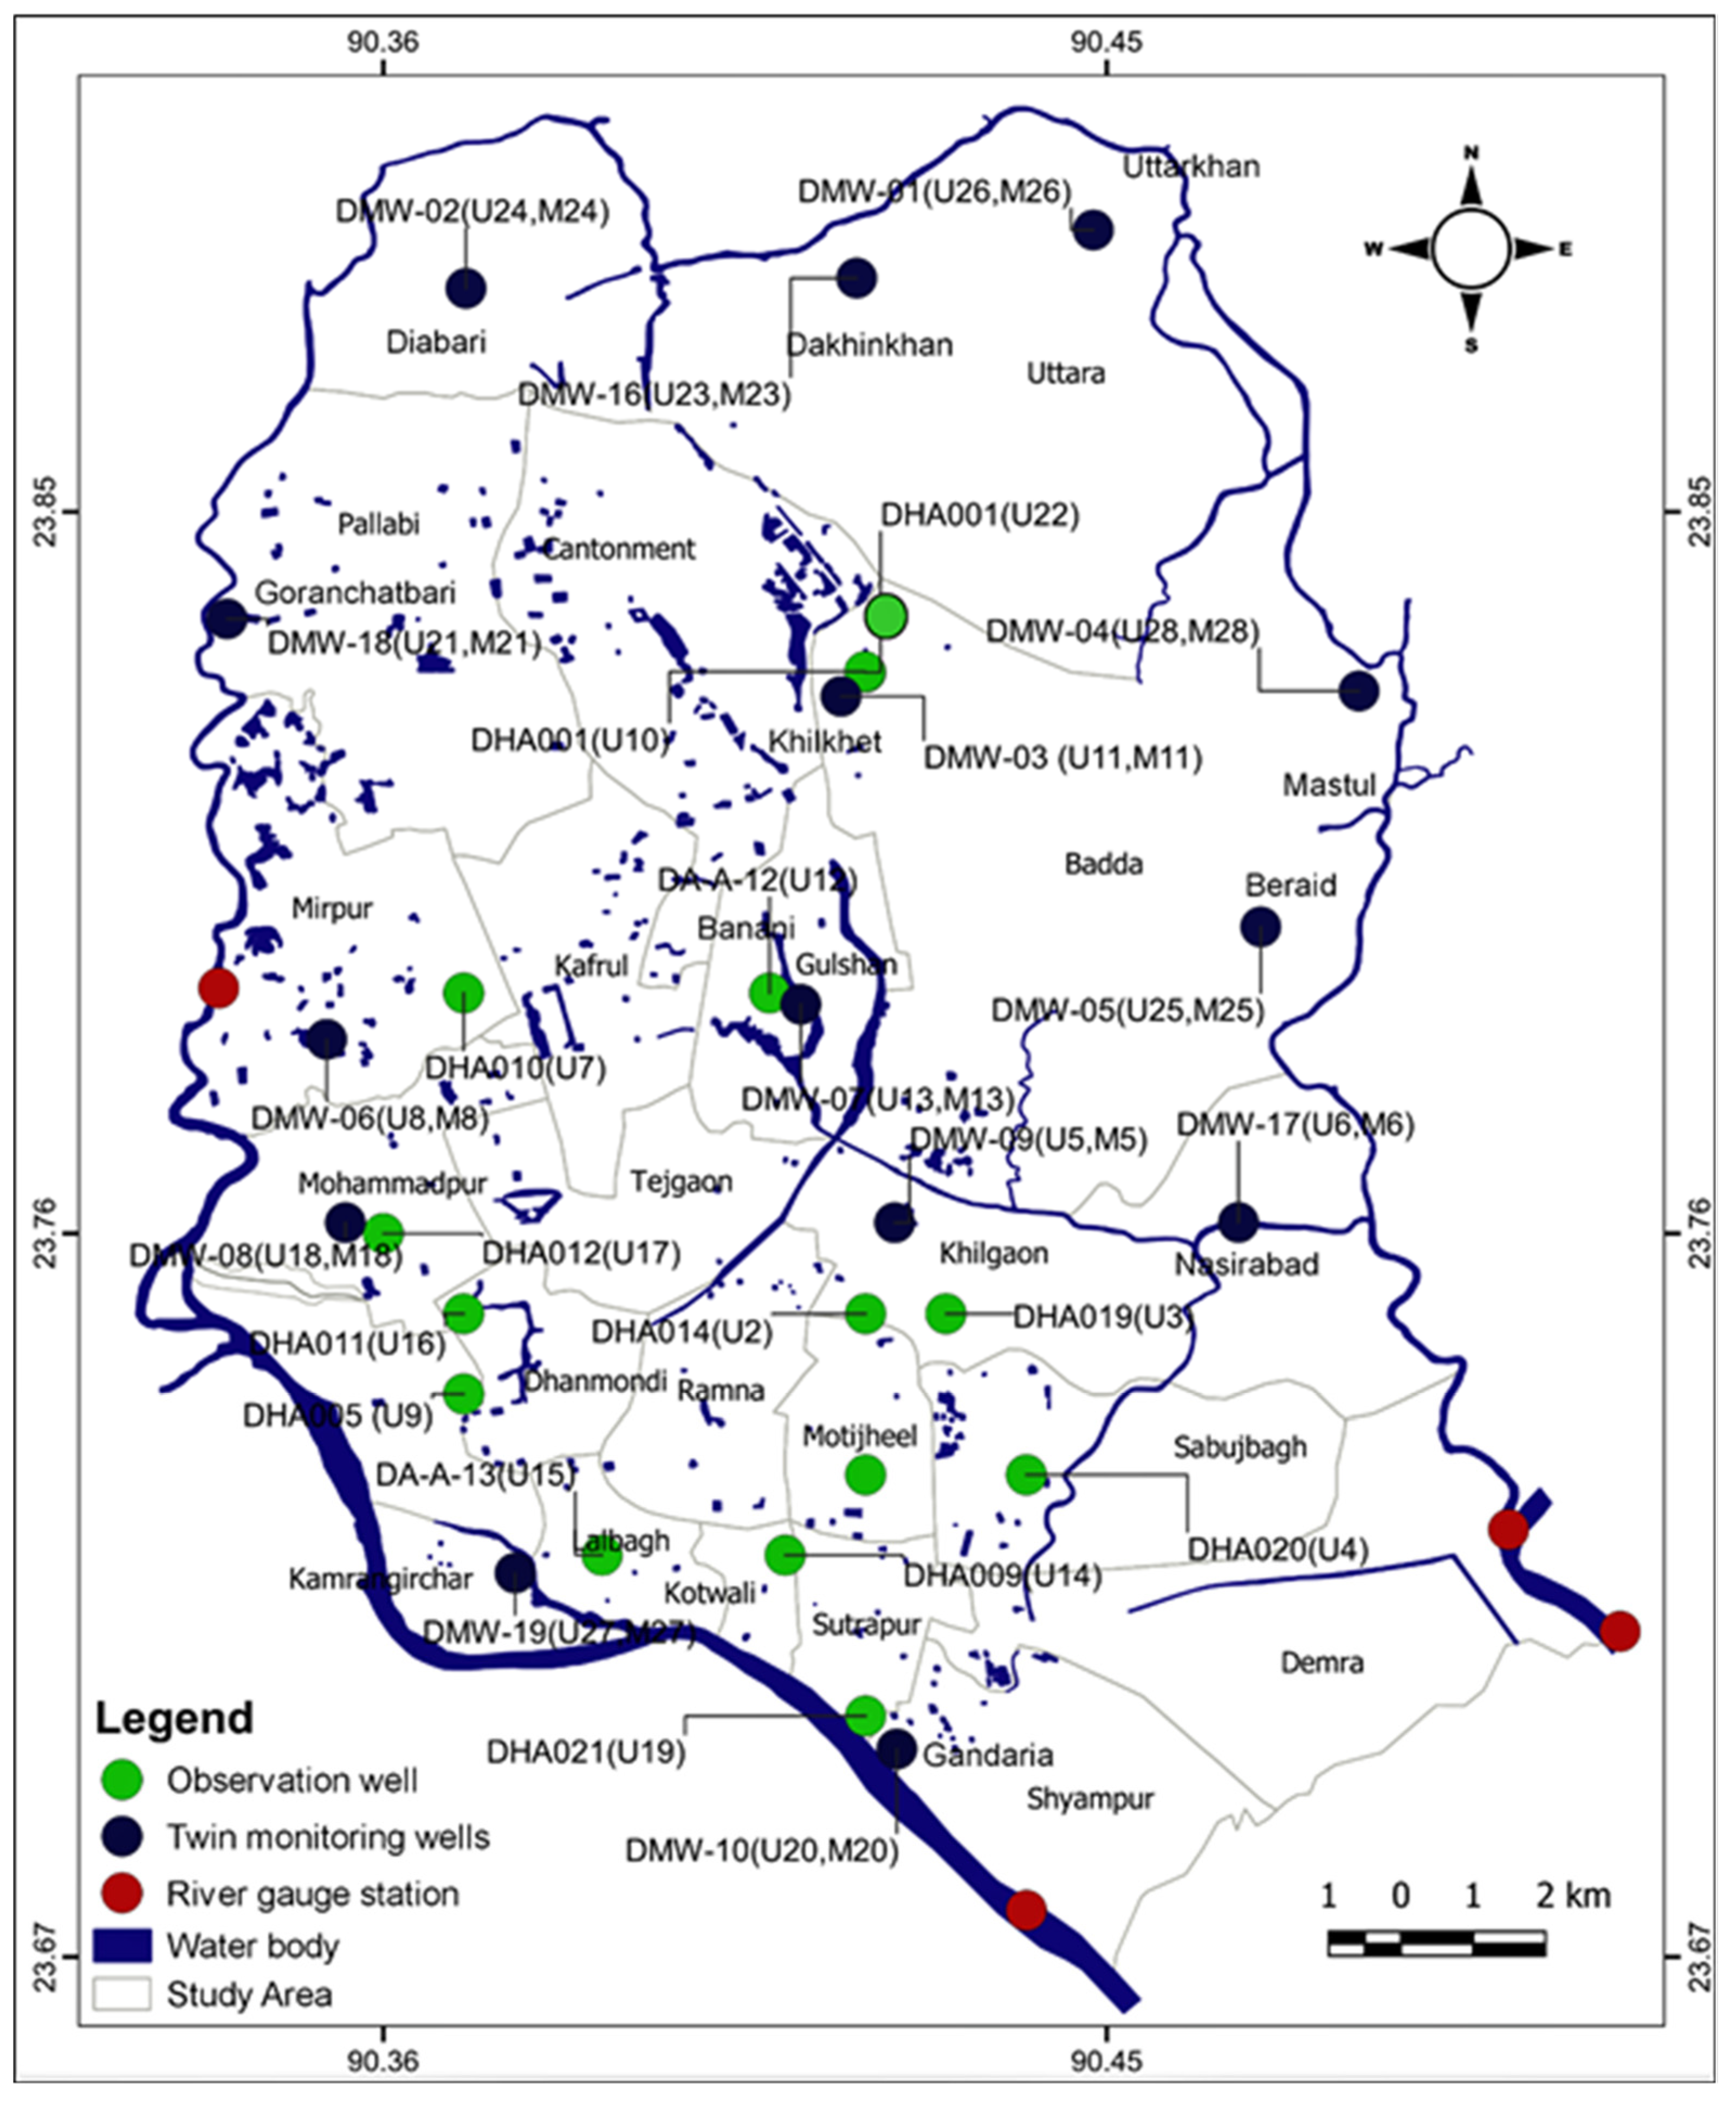
2.1. Location and Extent
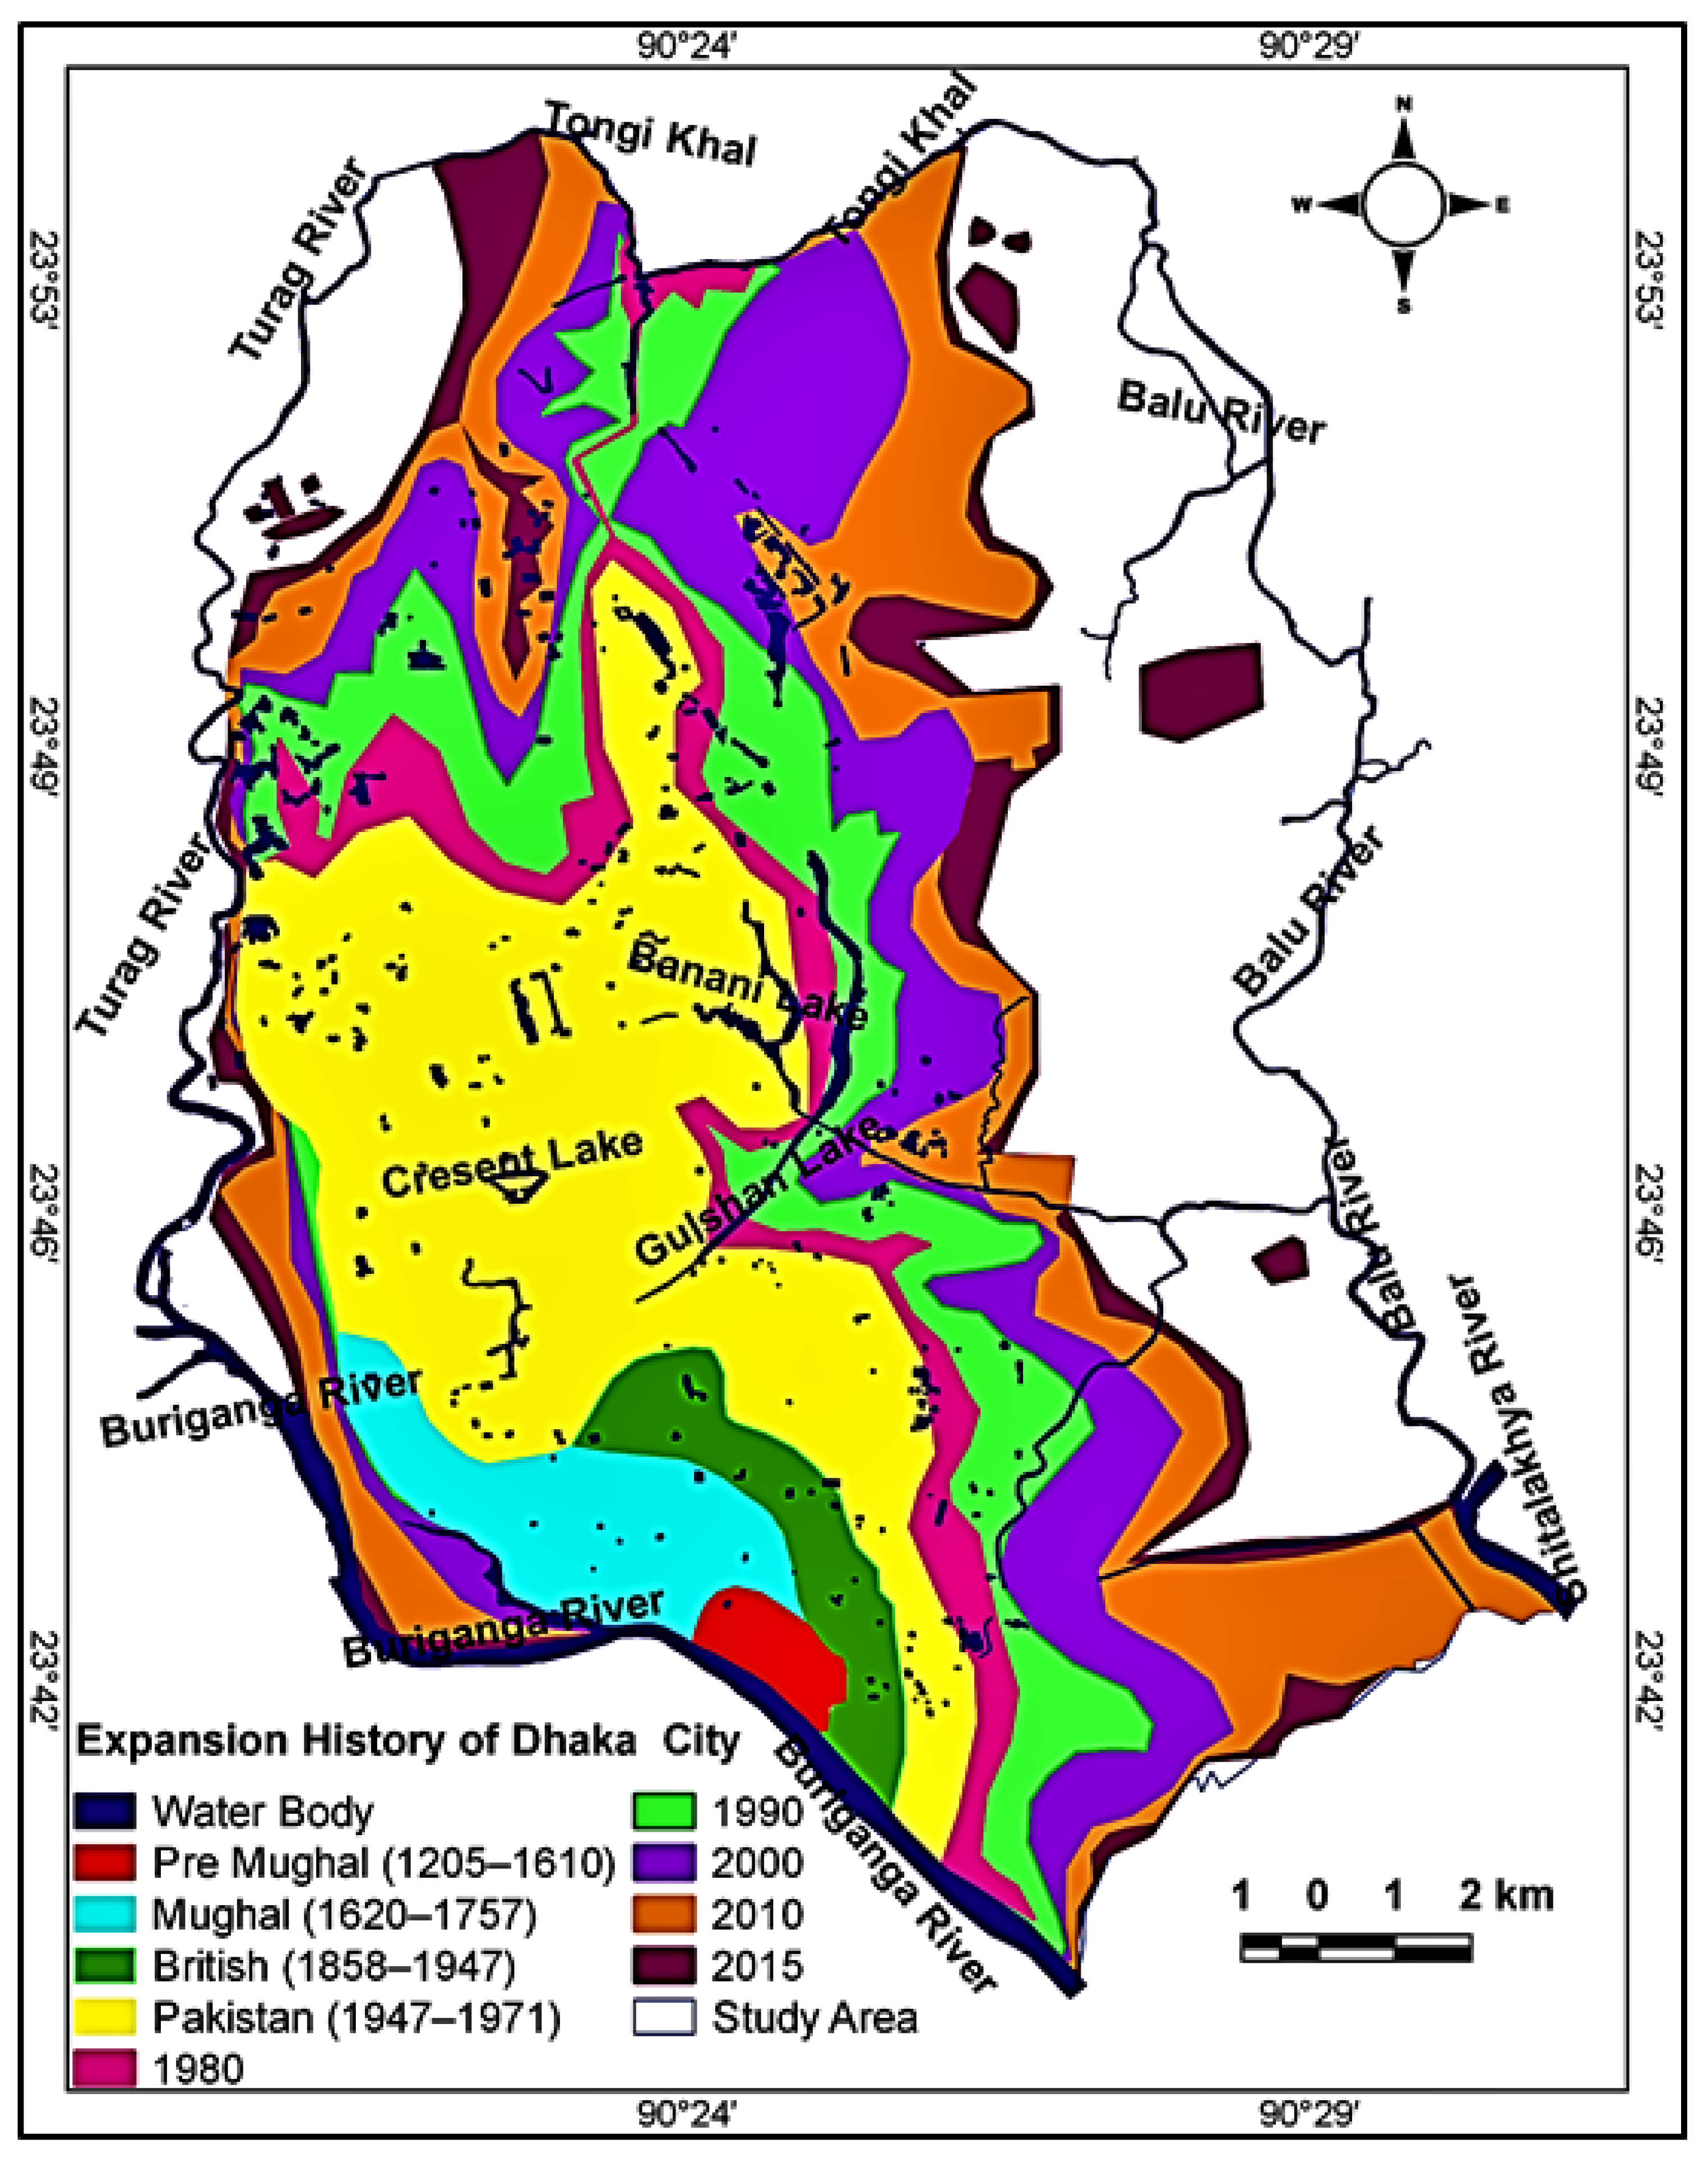
2.2. History of the Expansion of Dhaka City

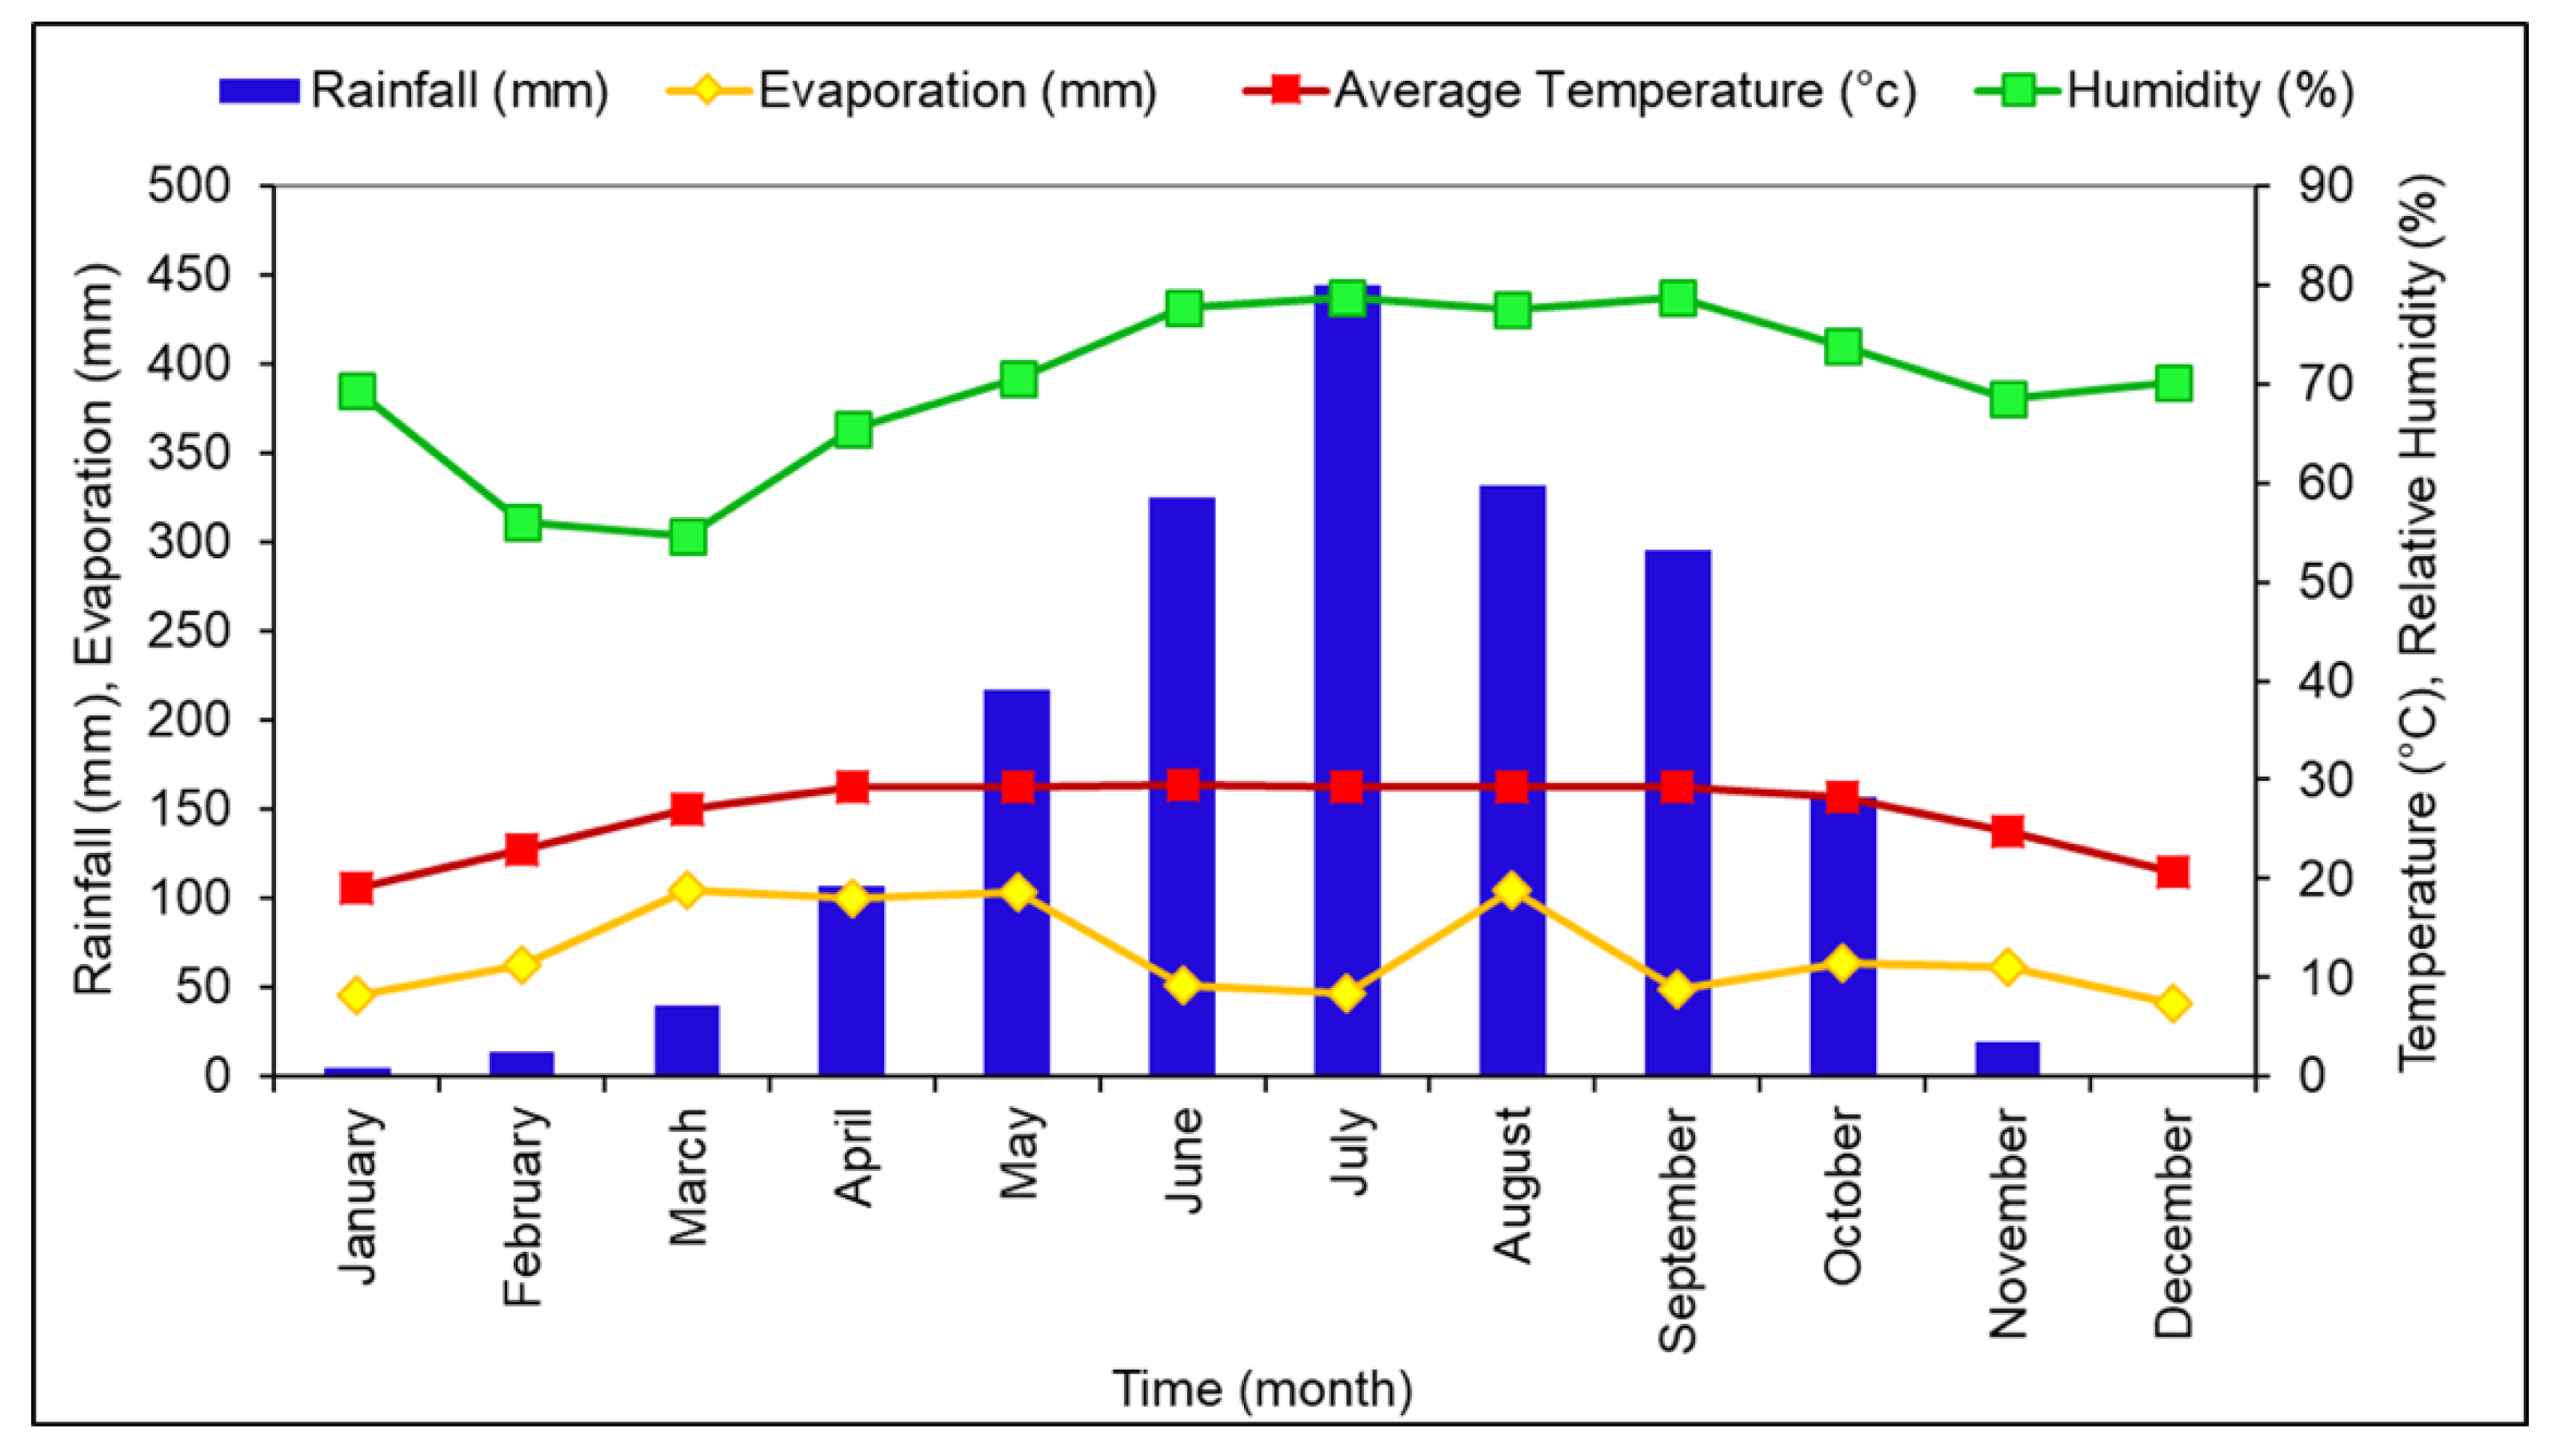
2.3. Climate
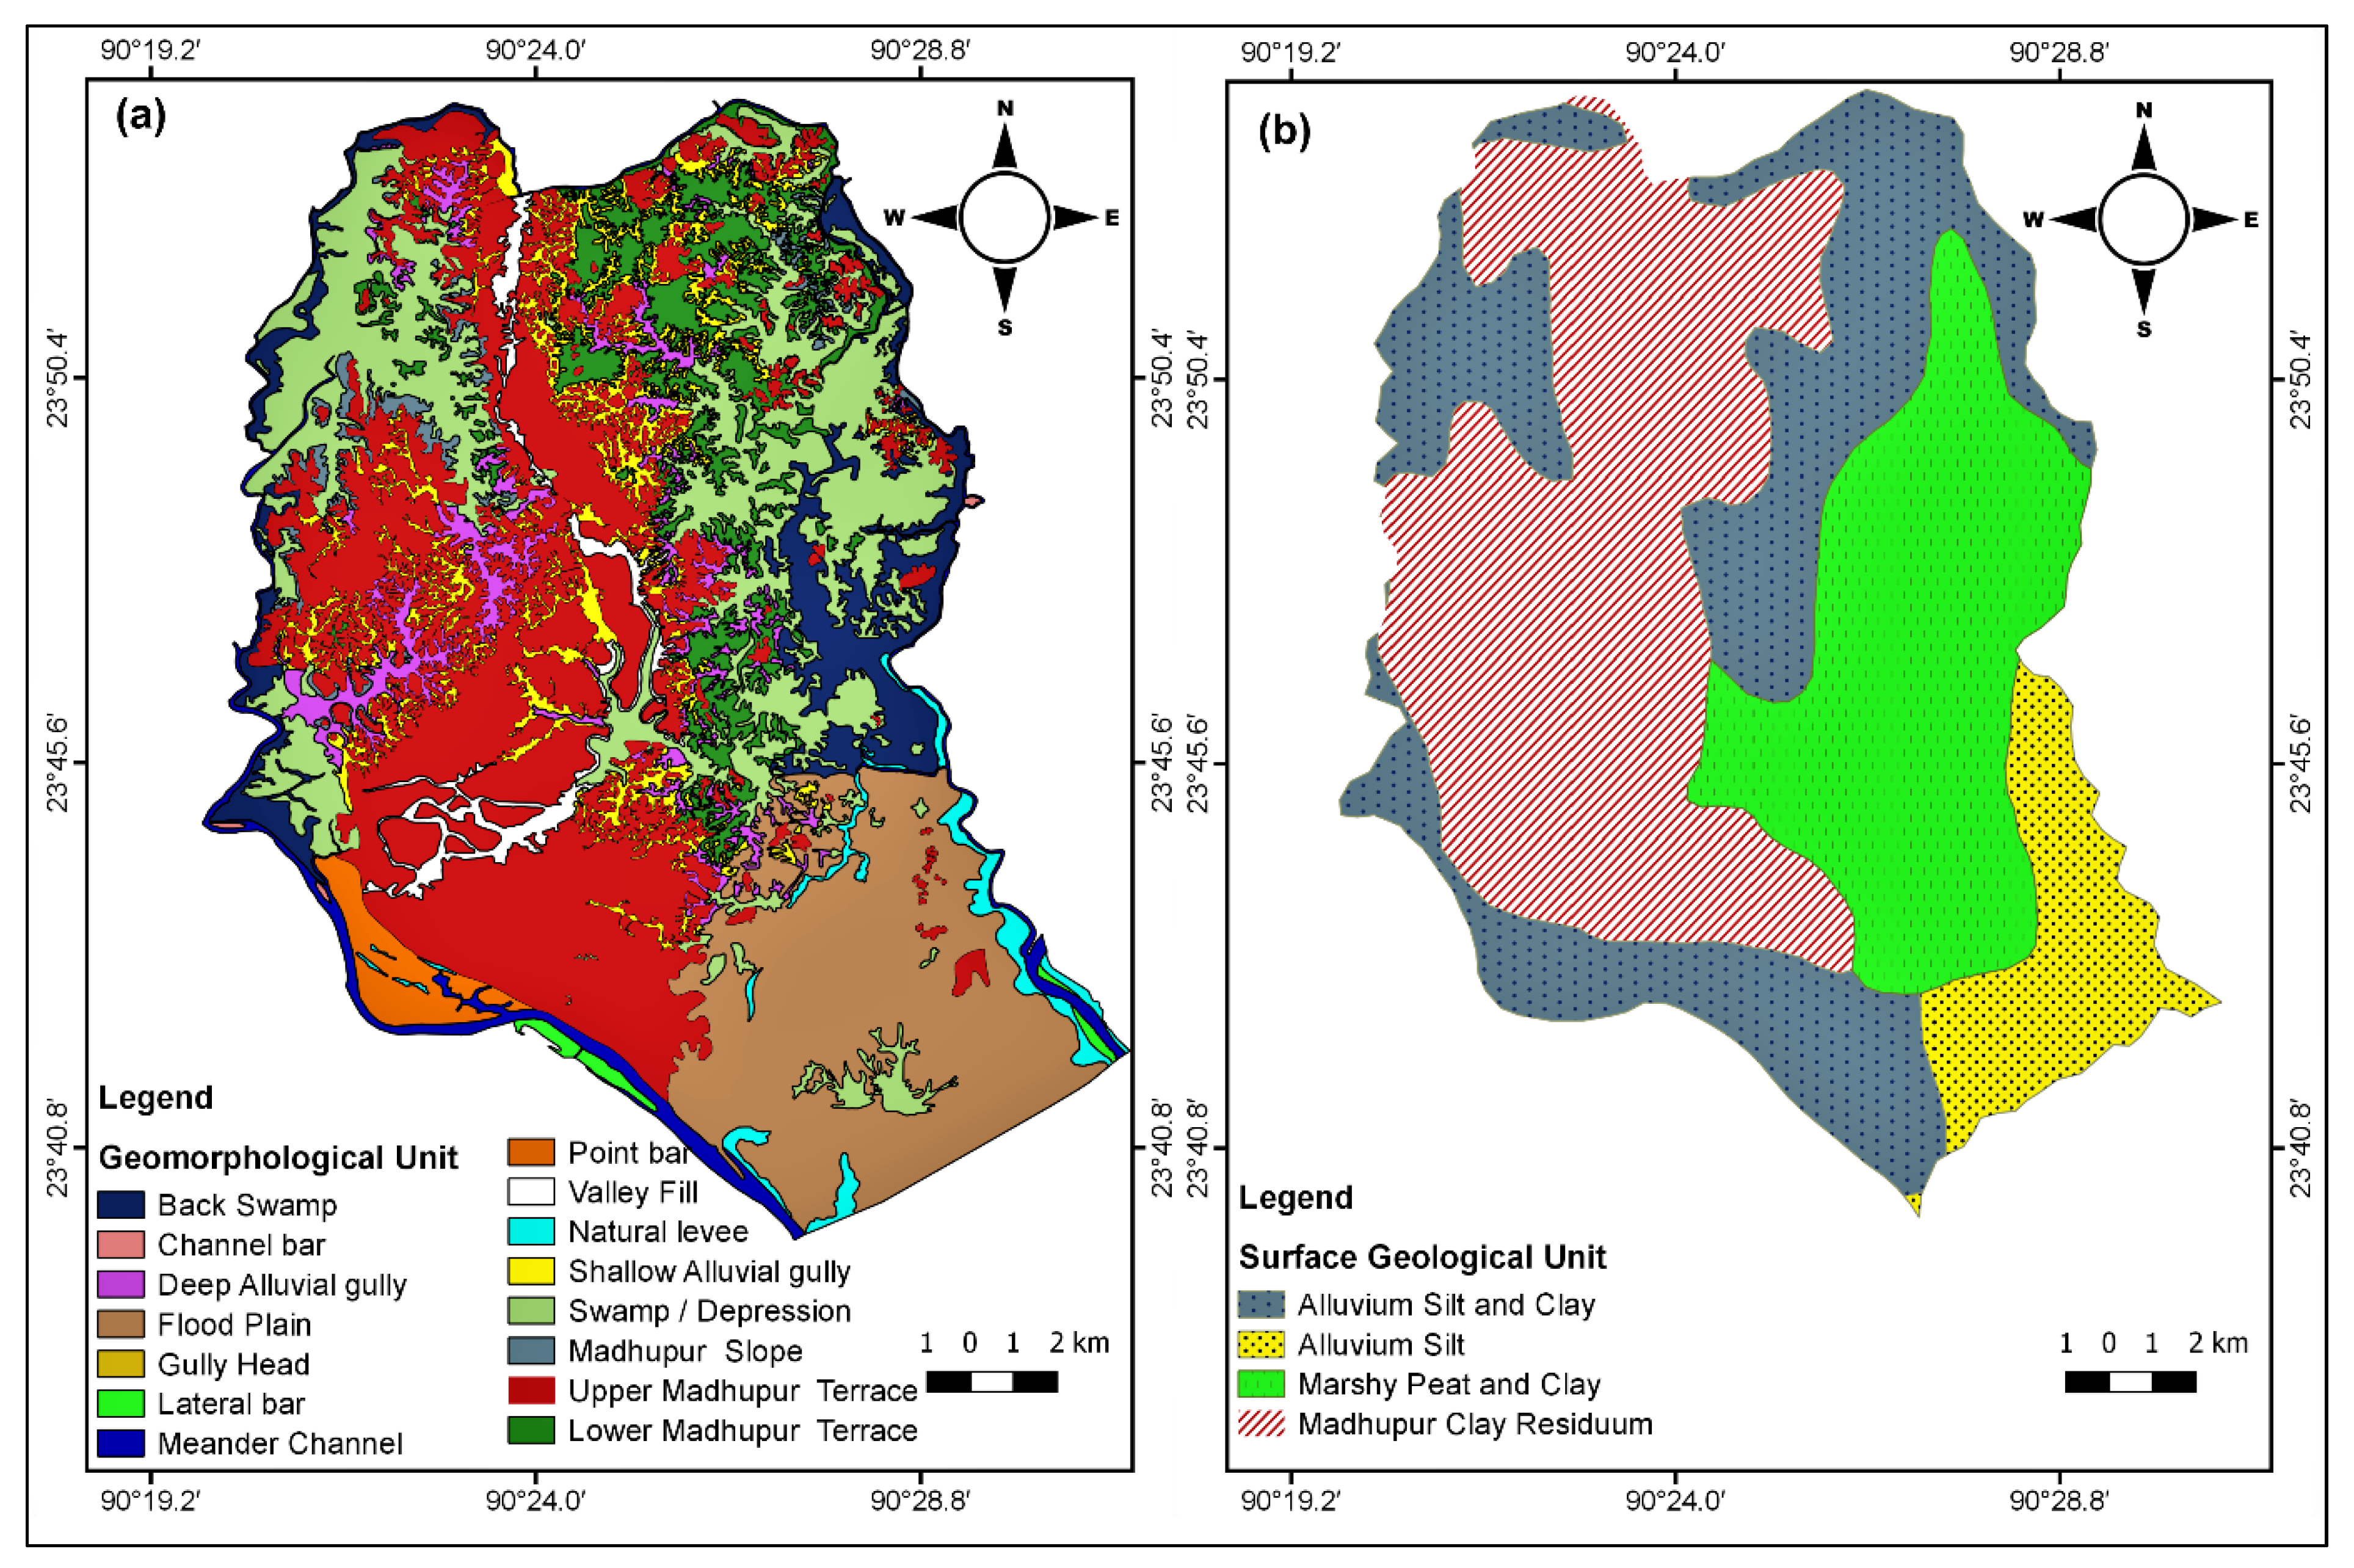
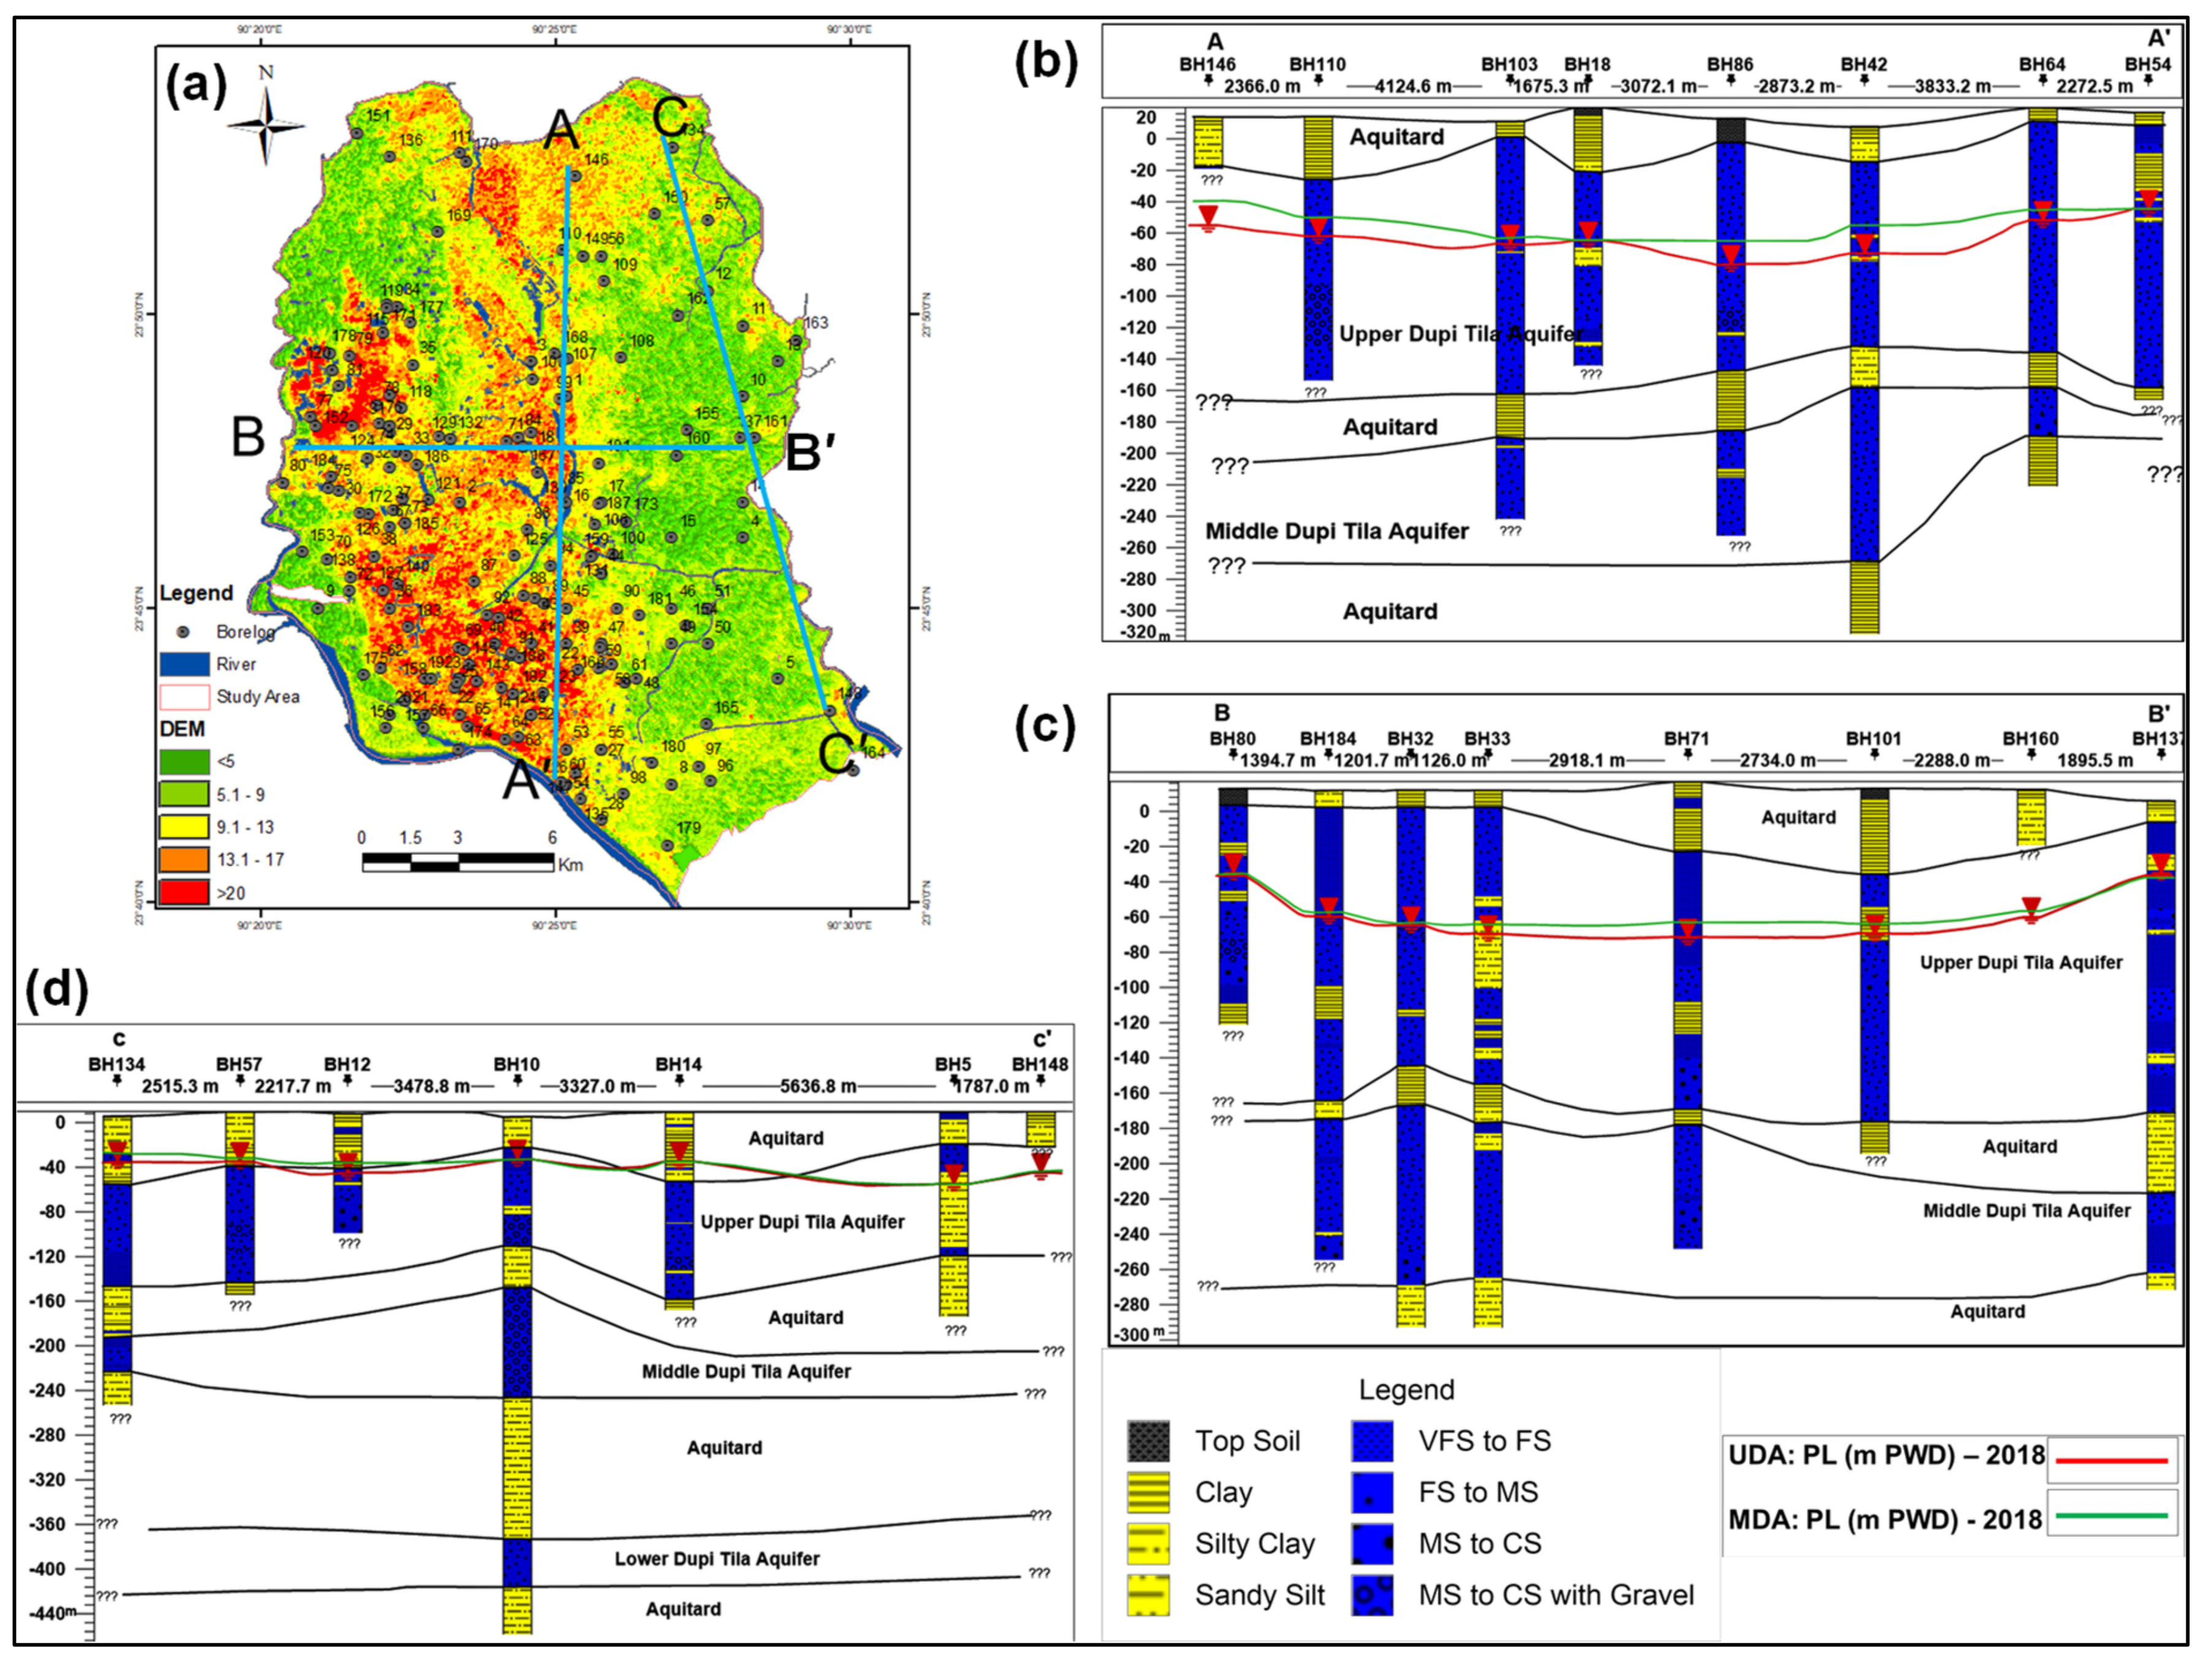
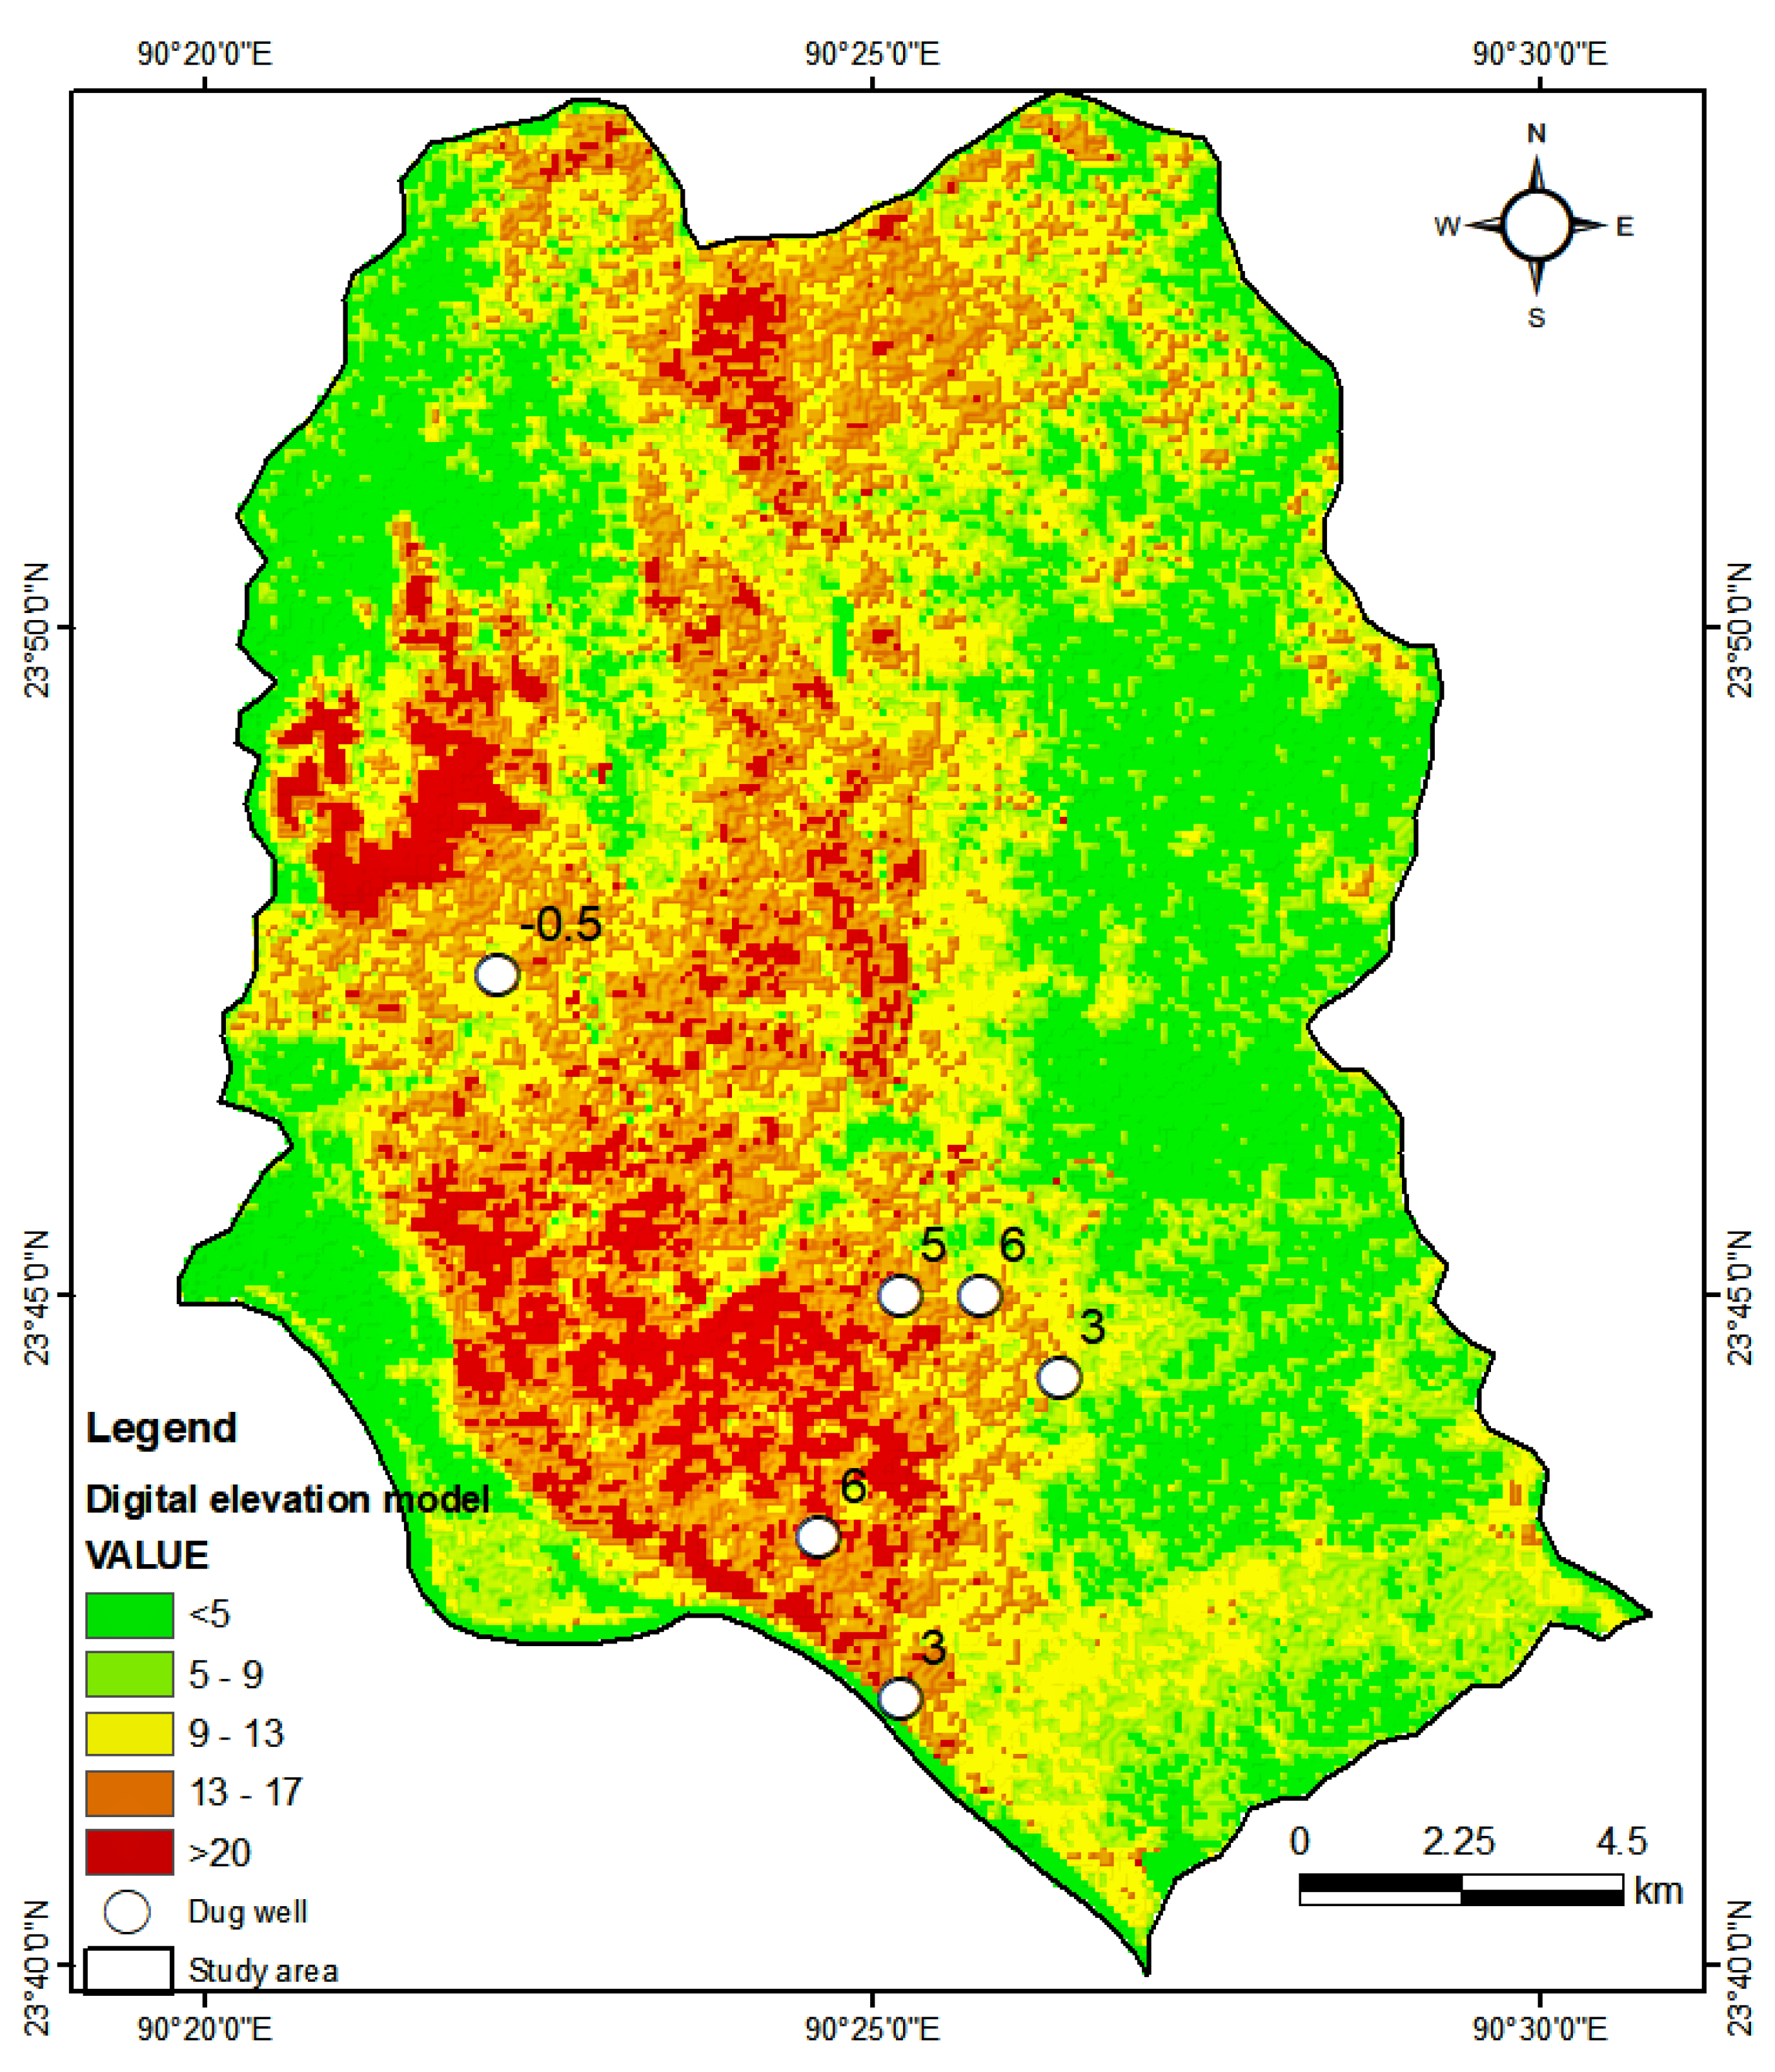
2.4. Geomorphology, Surface Geology and Topography
2.5. Geology
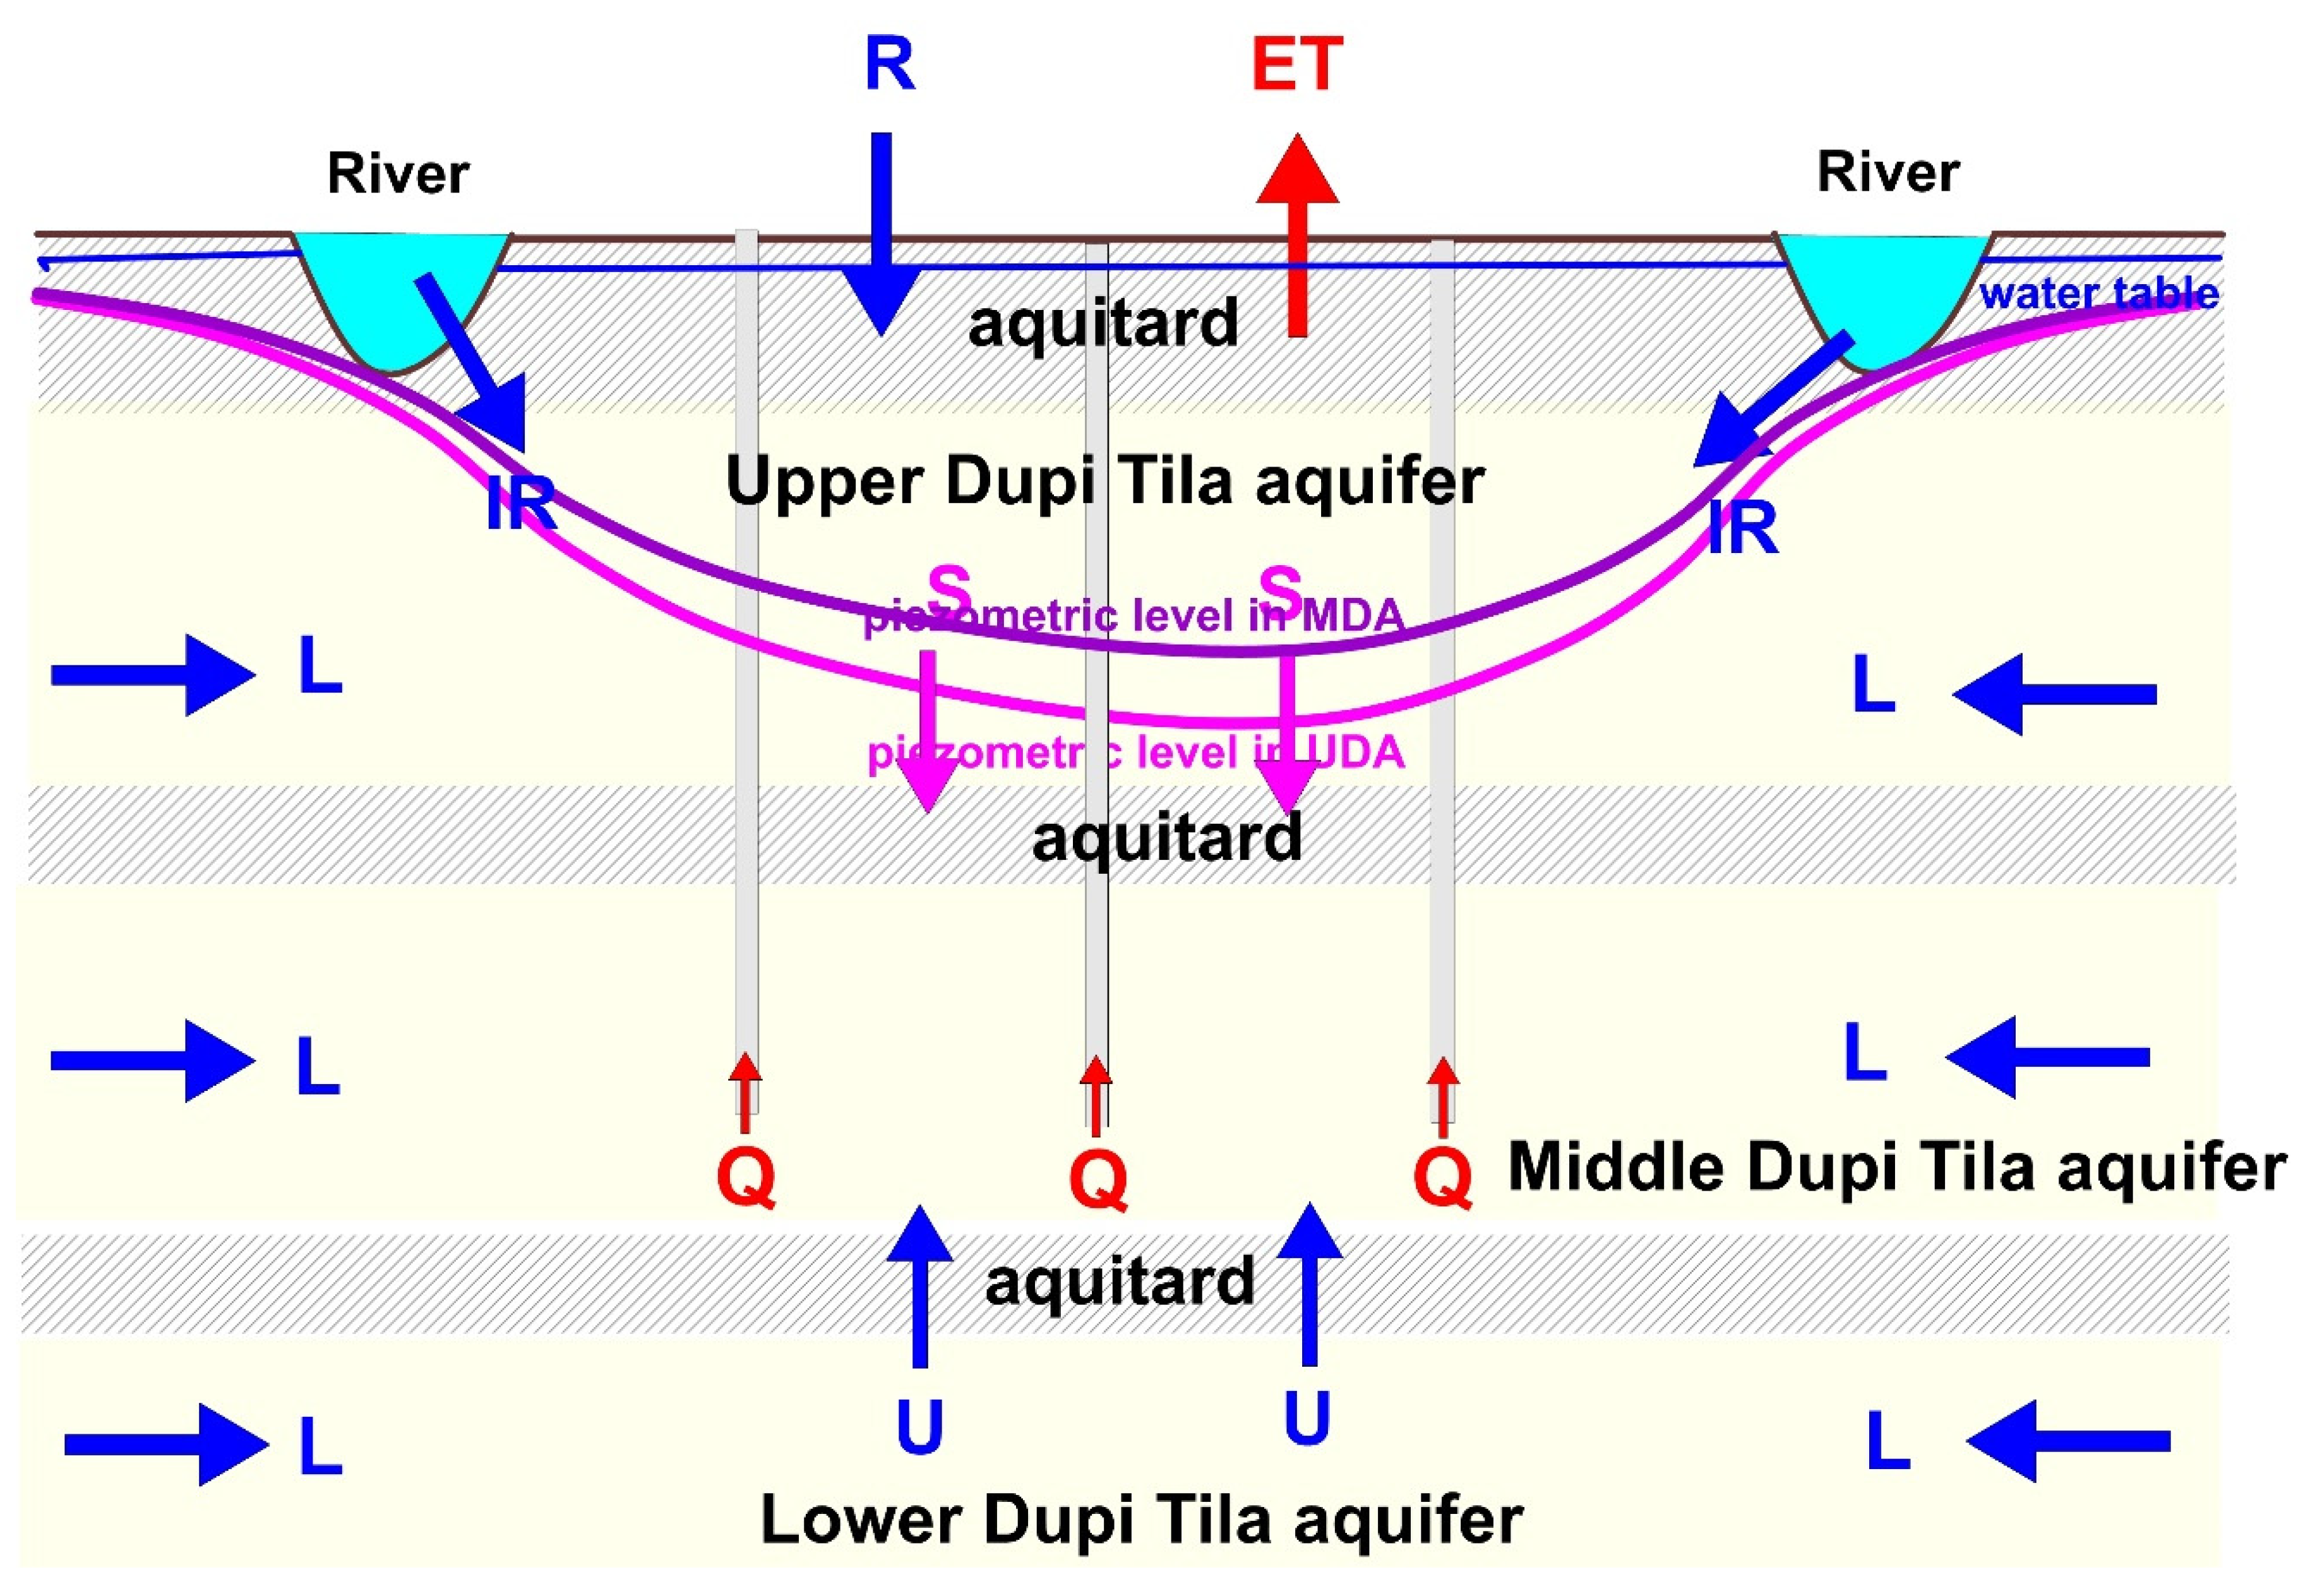
2.6. Hydrostratigraphy and Aquifer Delineation
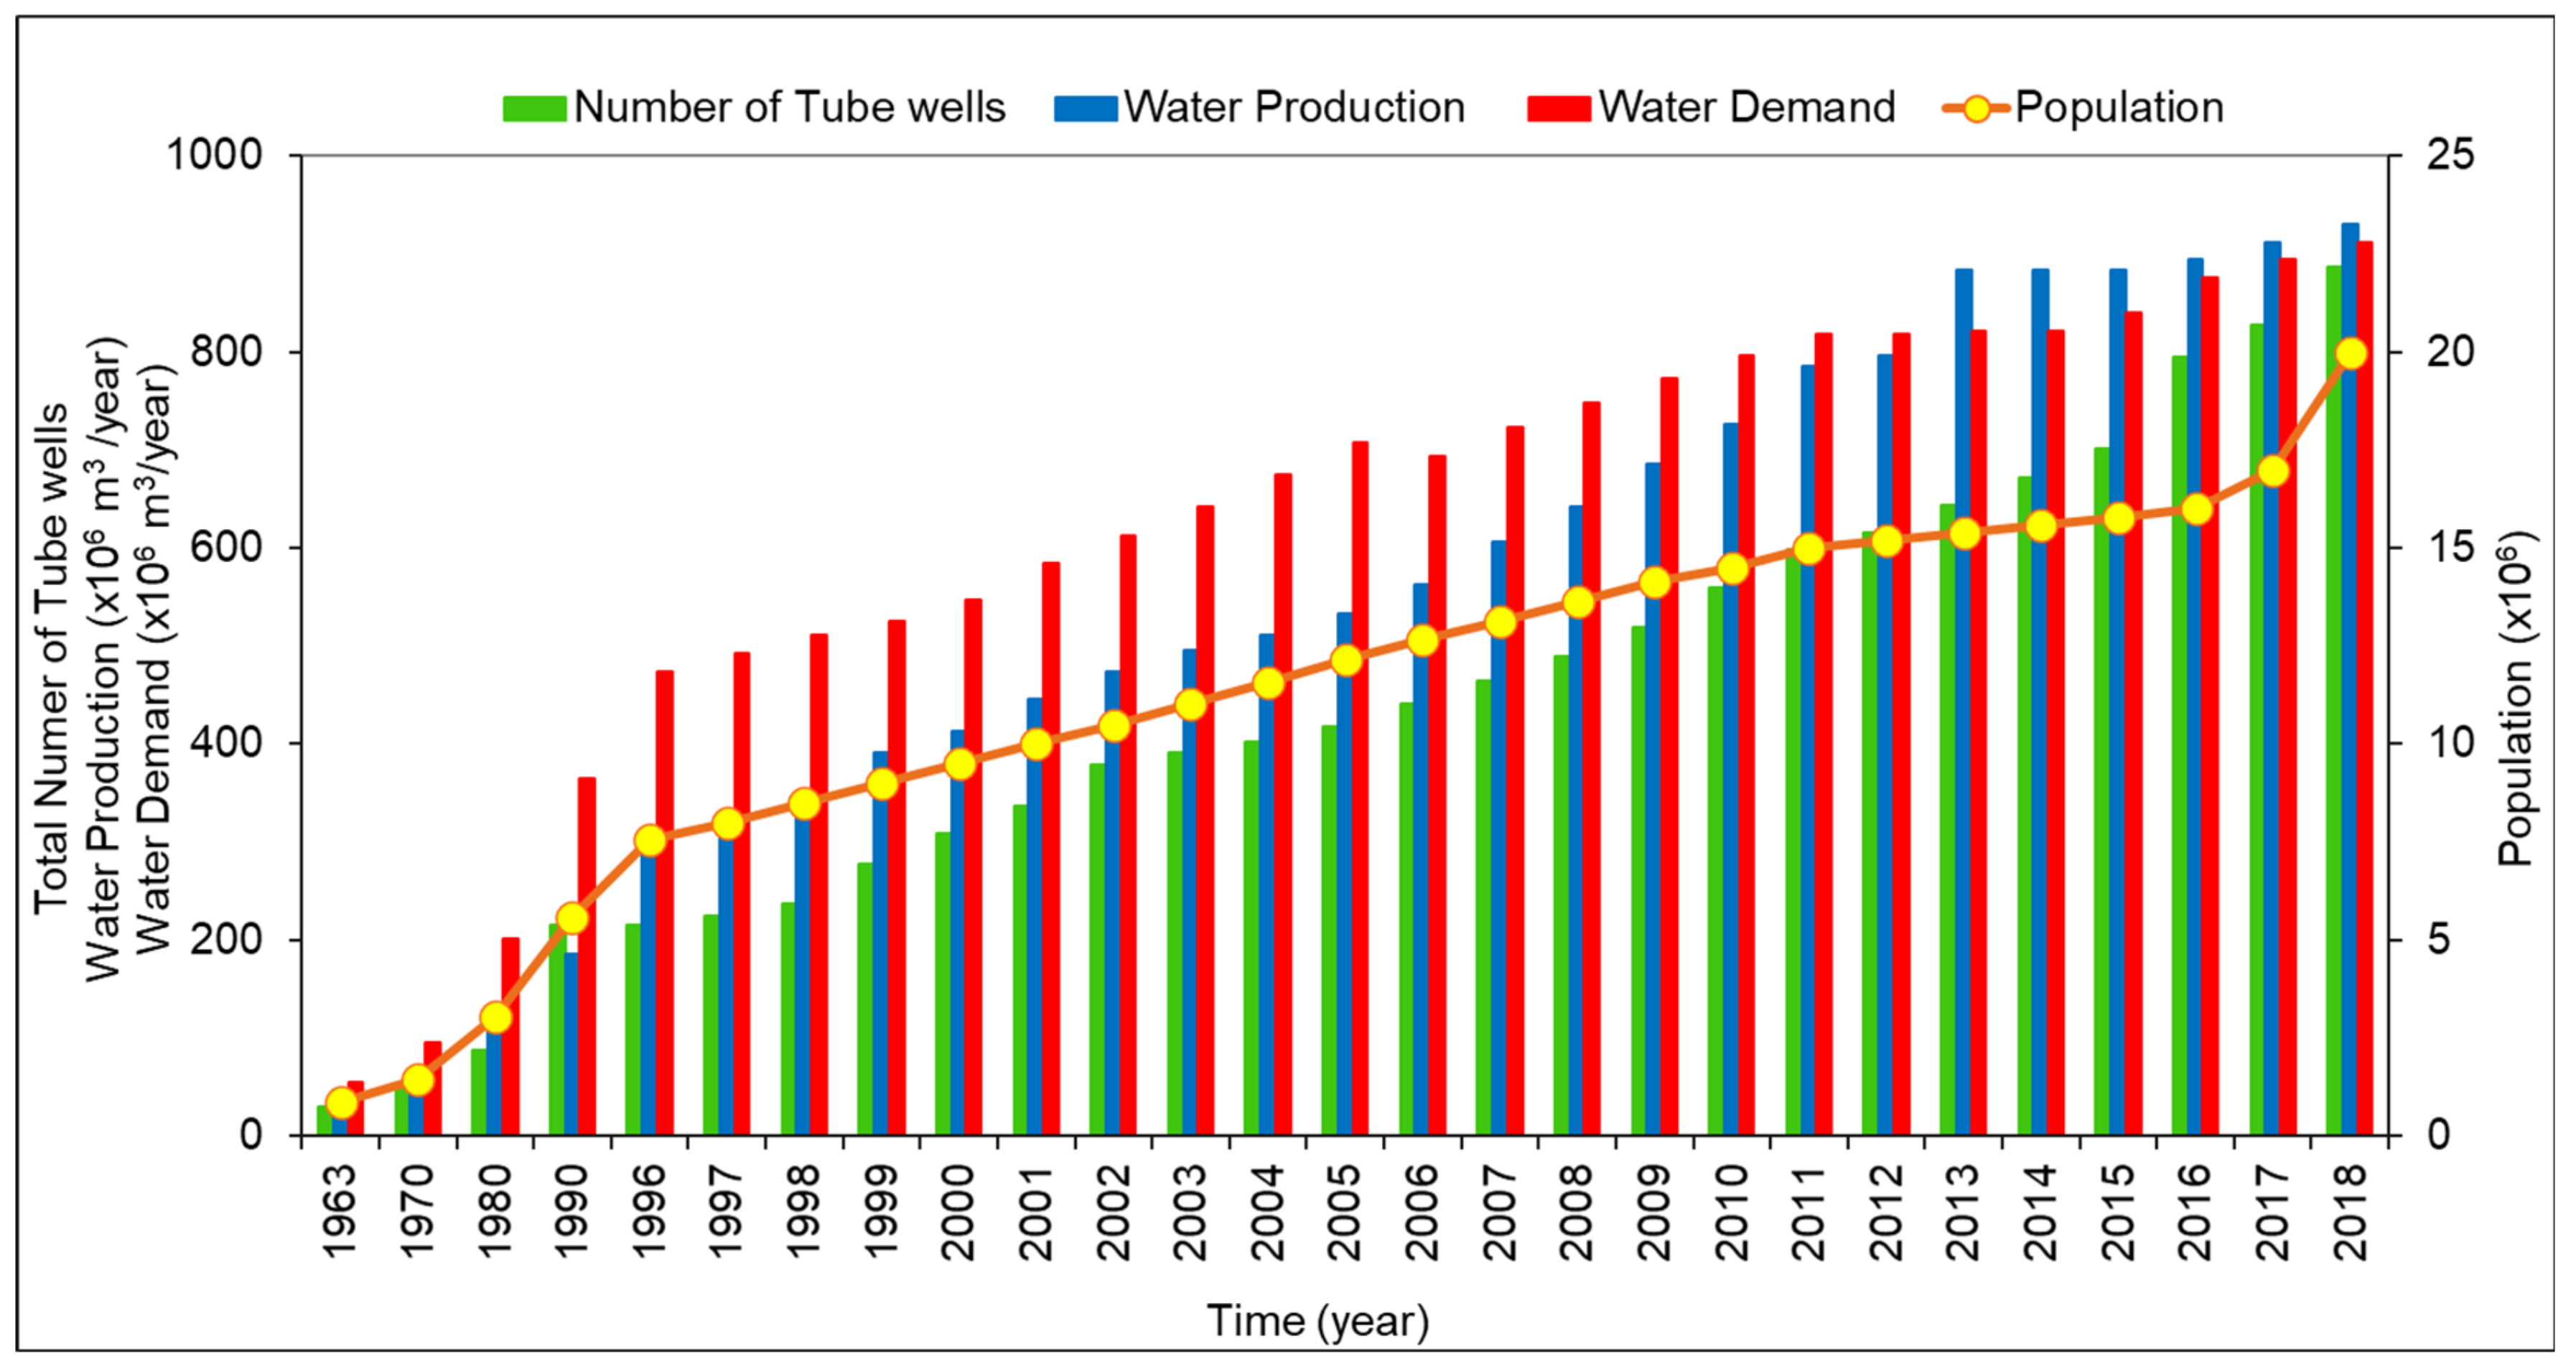
3. Abstraction Scenario for an Expanding Dhaka City
4. Methodology: Groundwater Level and Piezometric Data Collection
5. Results
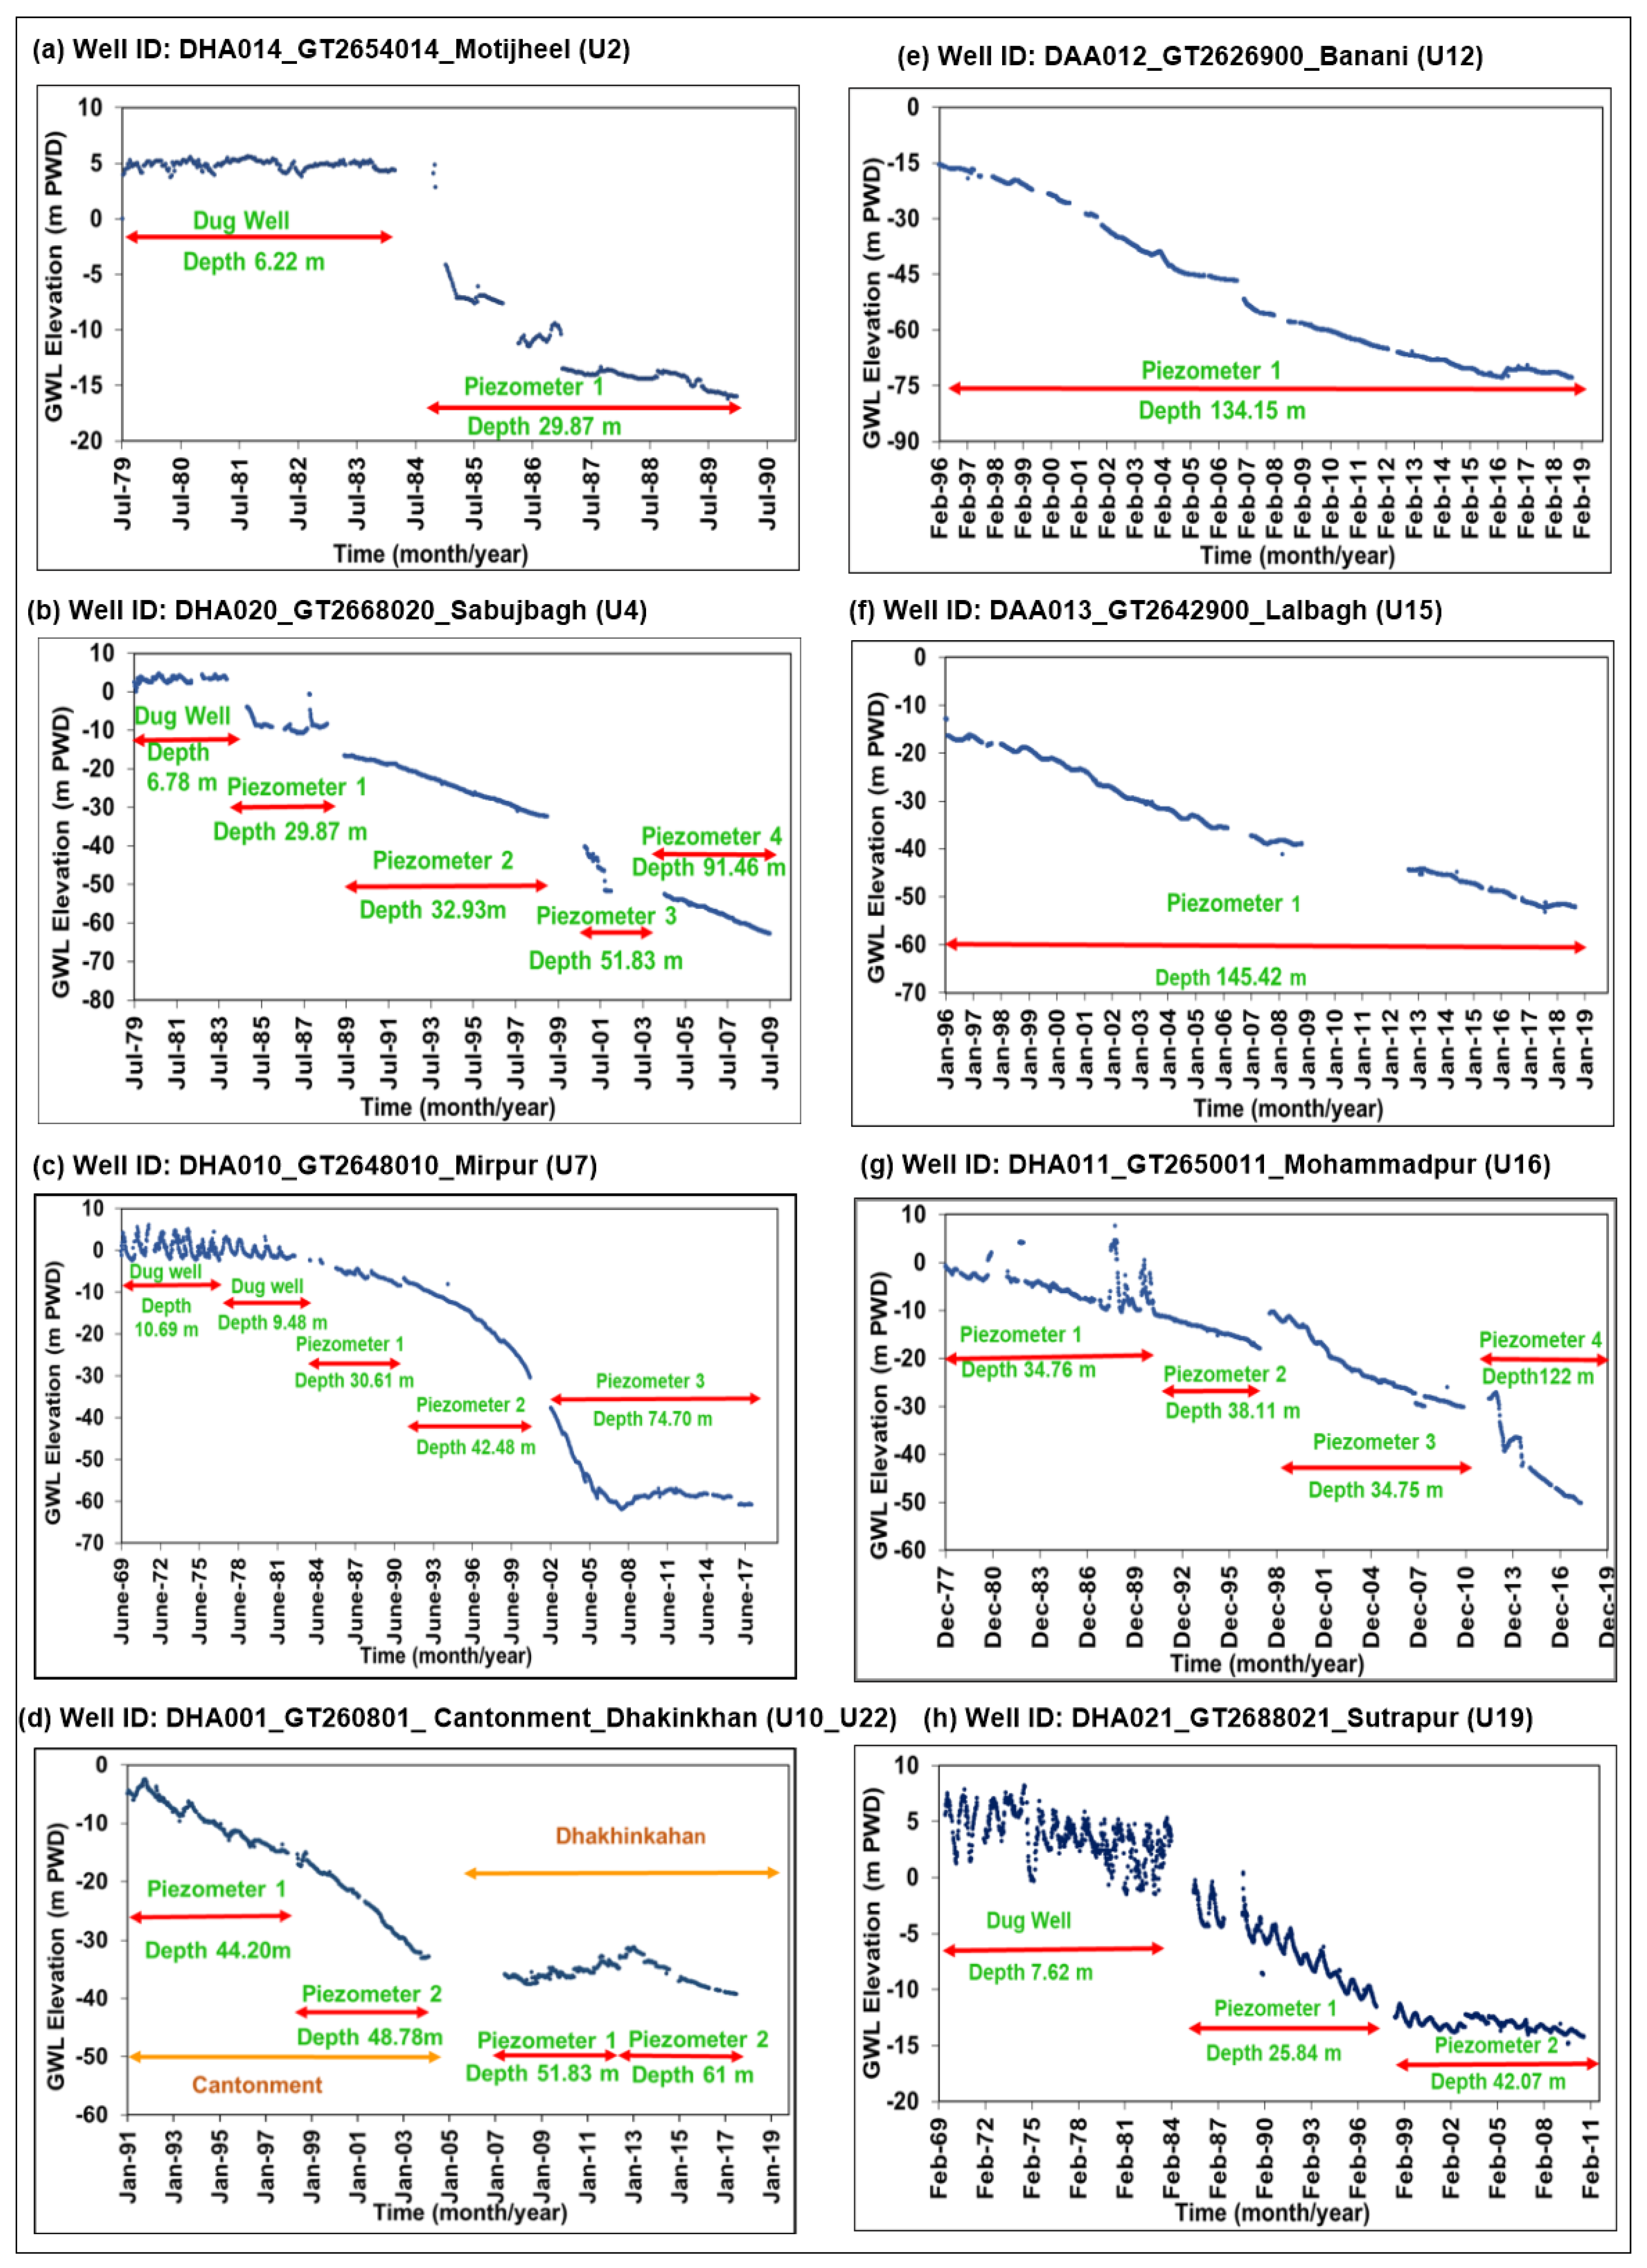
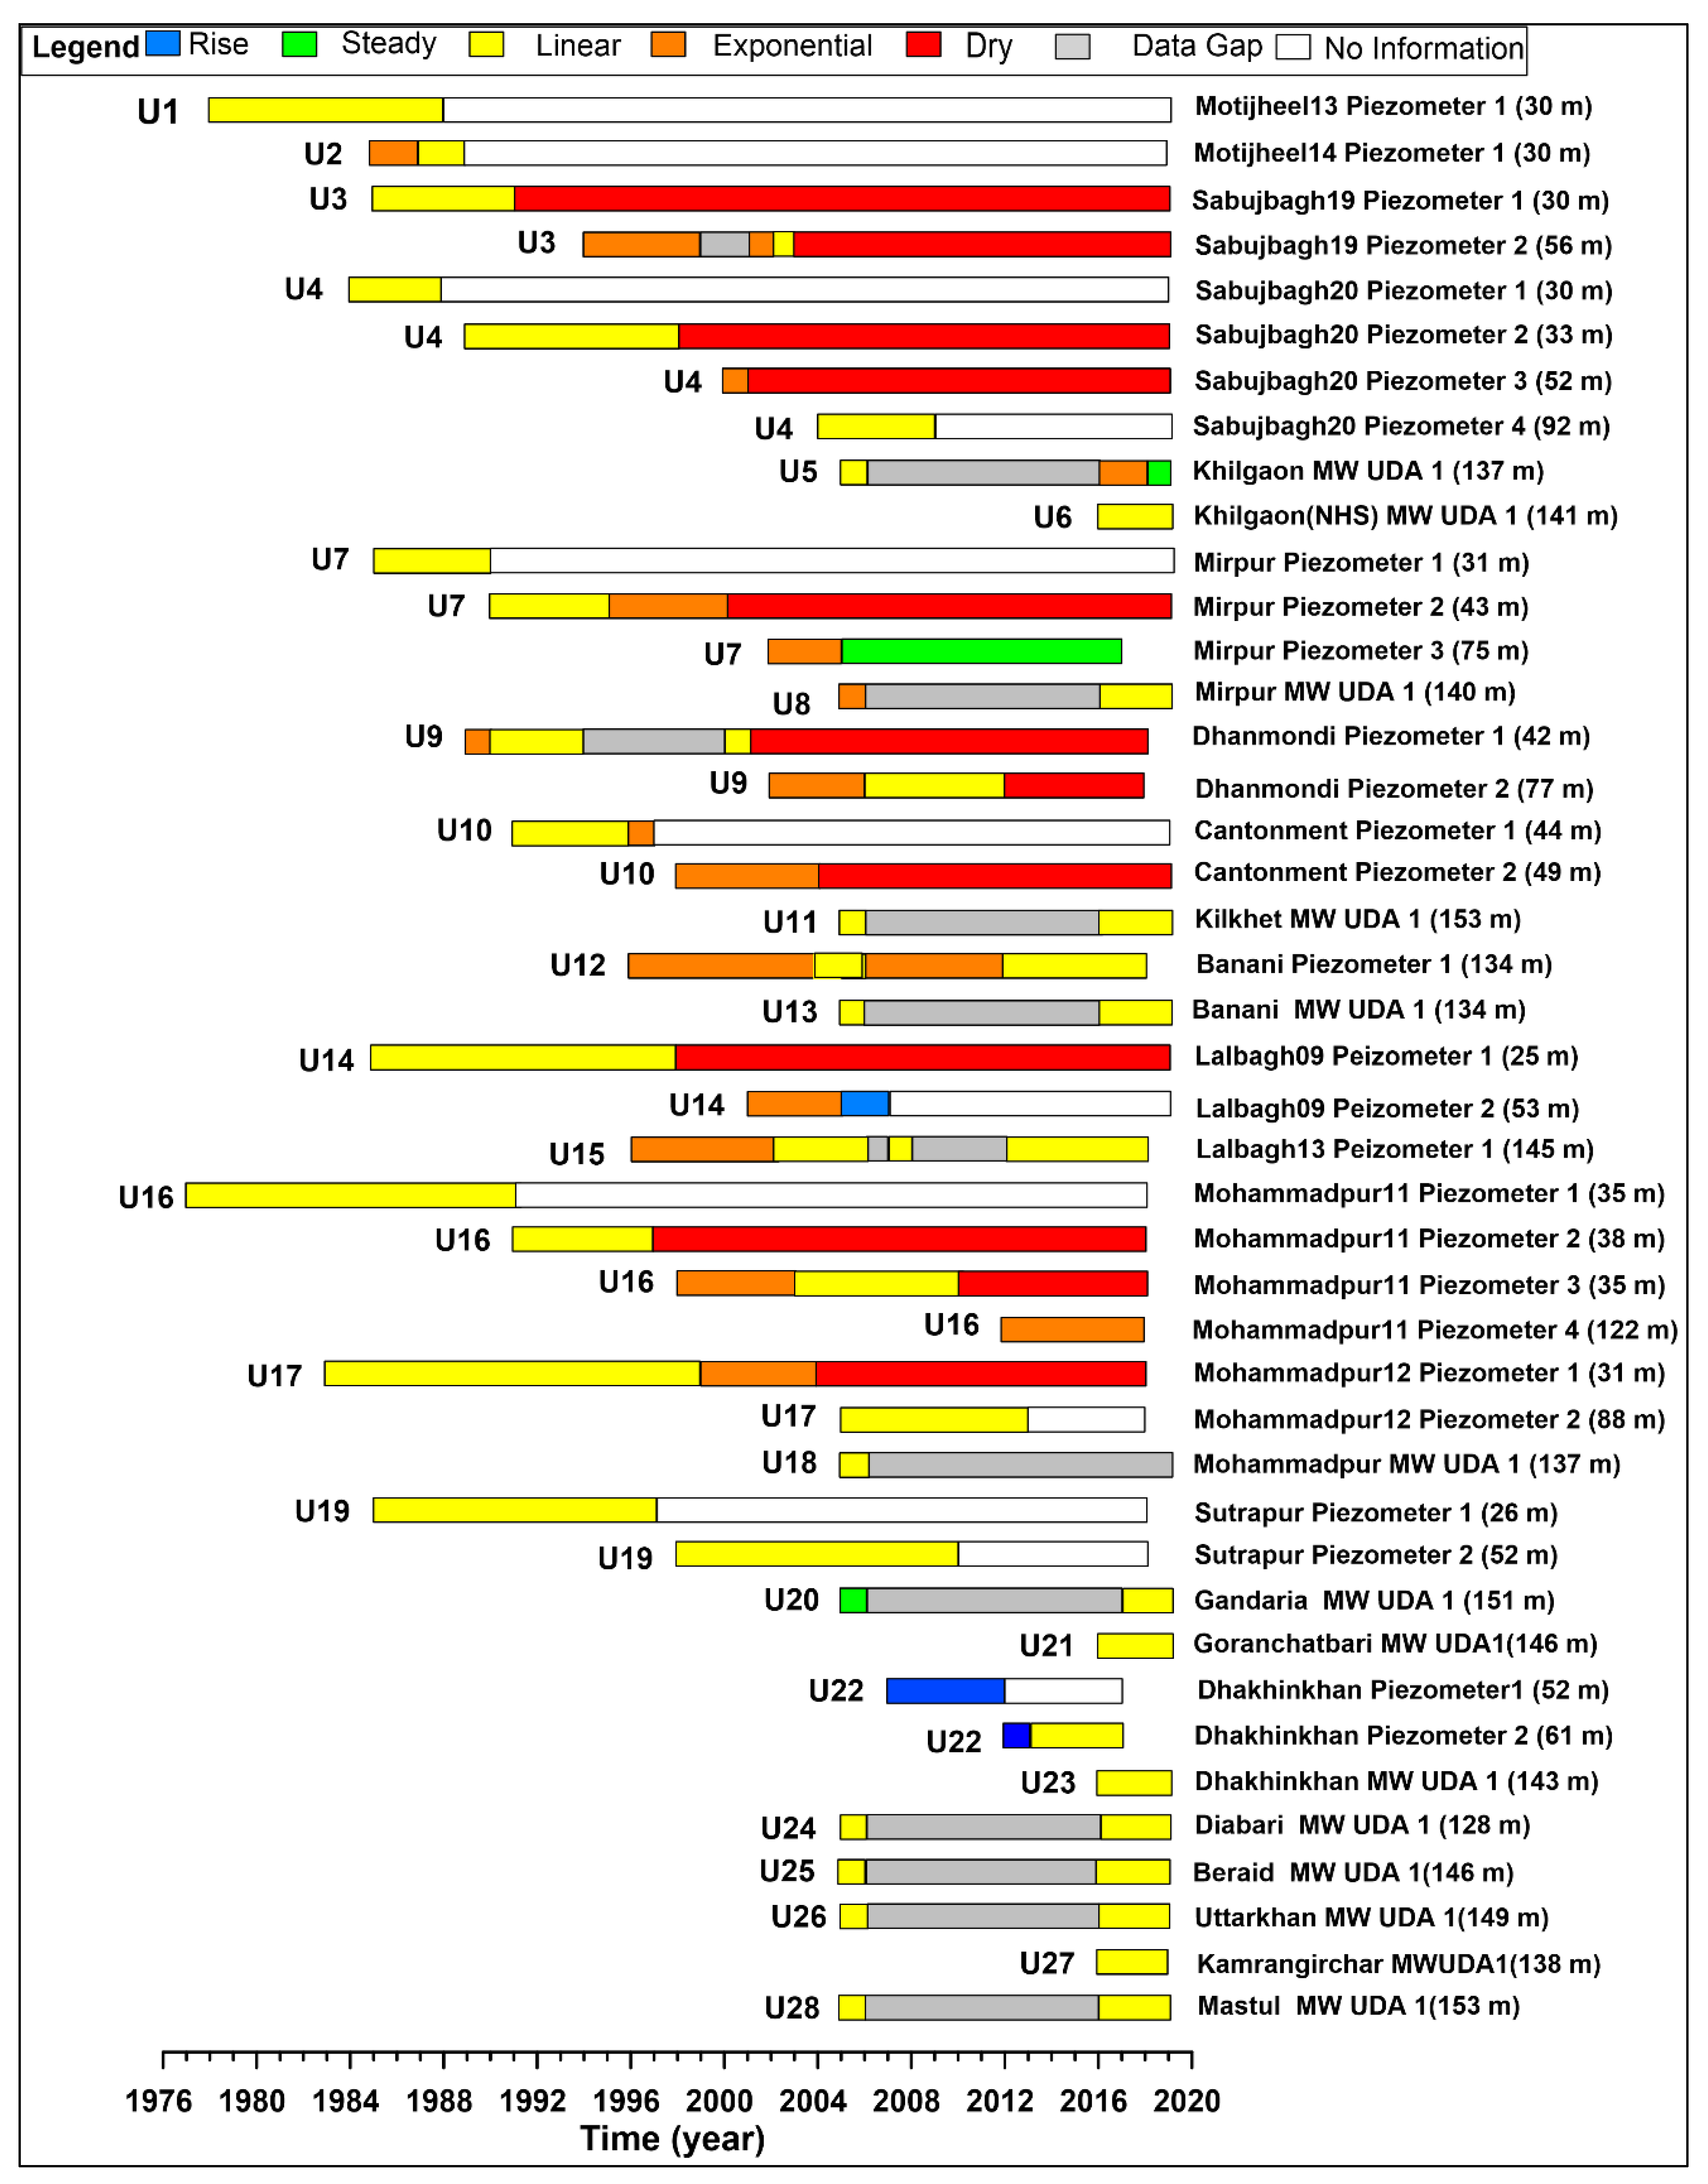
5.1. Long-Term Hydrographs: Analysis of PL Fluctuation
5.1.1. Motijheel (South-Central Part of Dhaka City)
5.1.2. Sabujbagh (Southeast Part of Dhaka City)
5.1.3. Mirpur (Central West Part of Dhaka City)
5.1.4. Cantonment and Dhakinkhan (Central North of Dhaka City)
5.1.5. Banani (Central Part of Dhaka City)
5.1.6. Lalbagh (Southwestern Part of Dhaka City)
5.1.7. Mohammadpur (Southwestern Part of Dhaka City)
5.1.8. Sutrapur (South of Dhaka City)
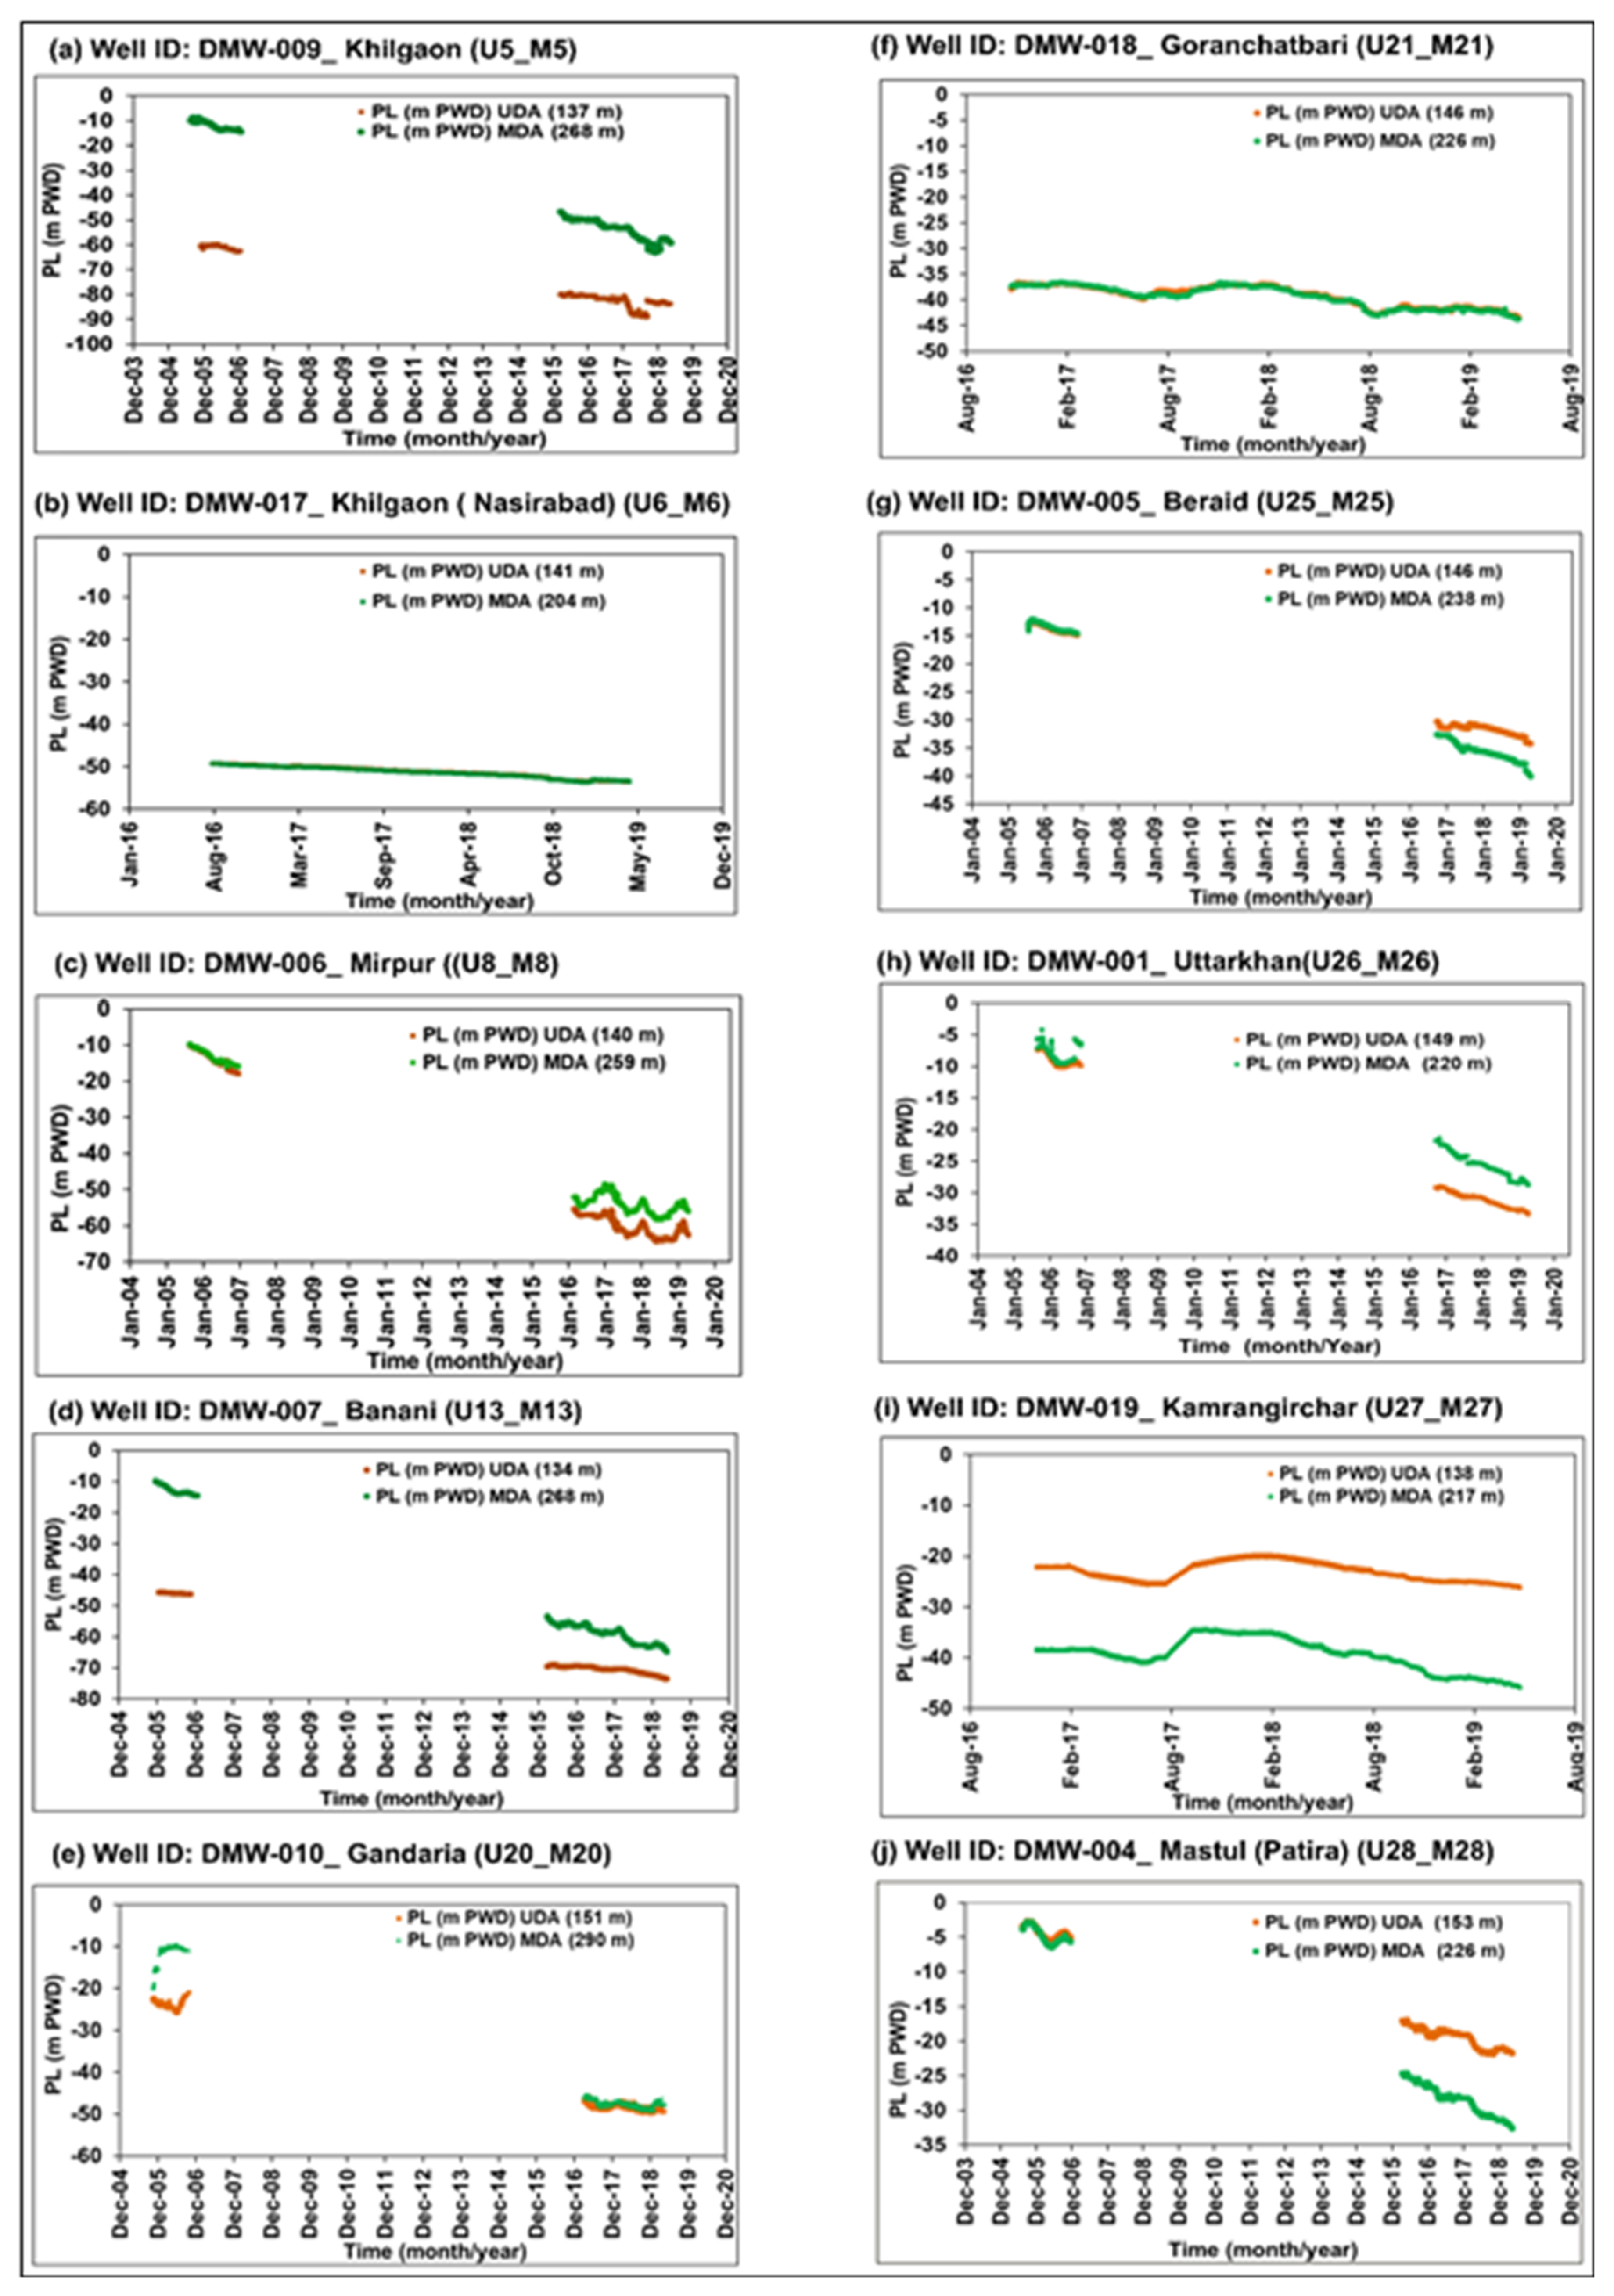
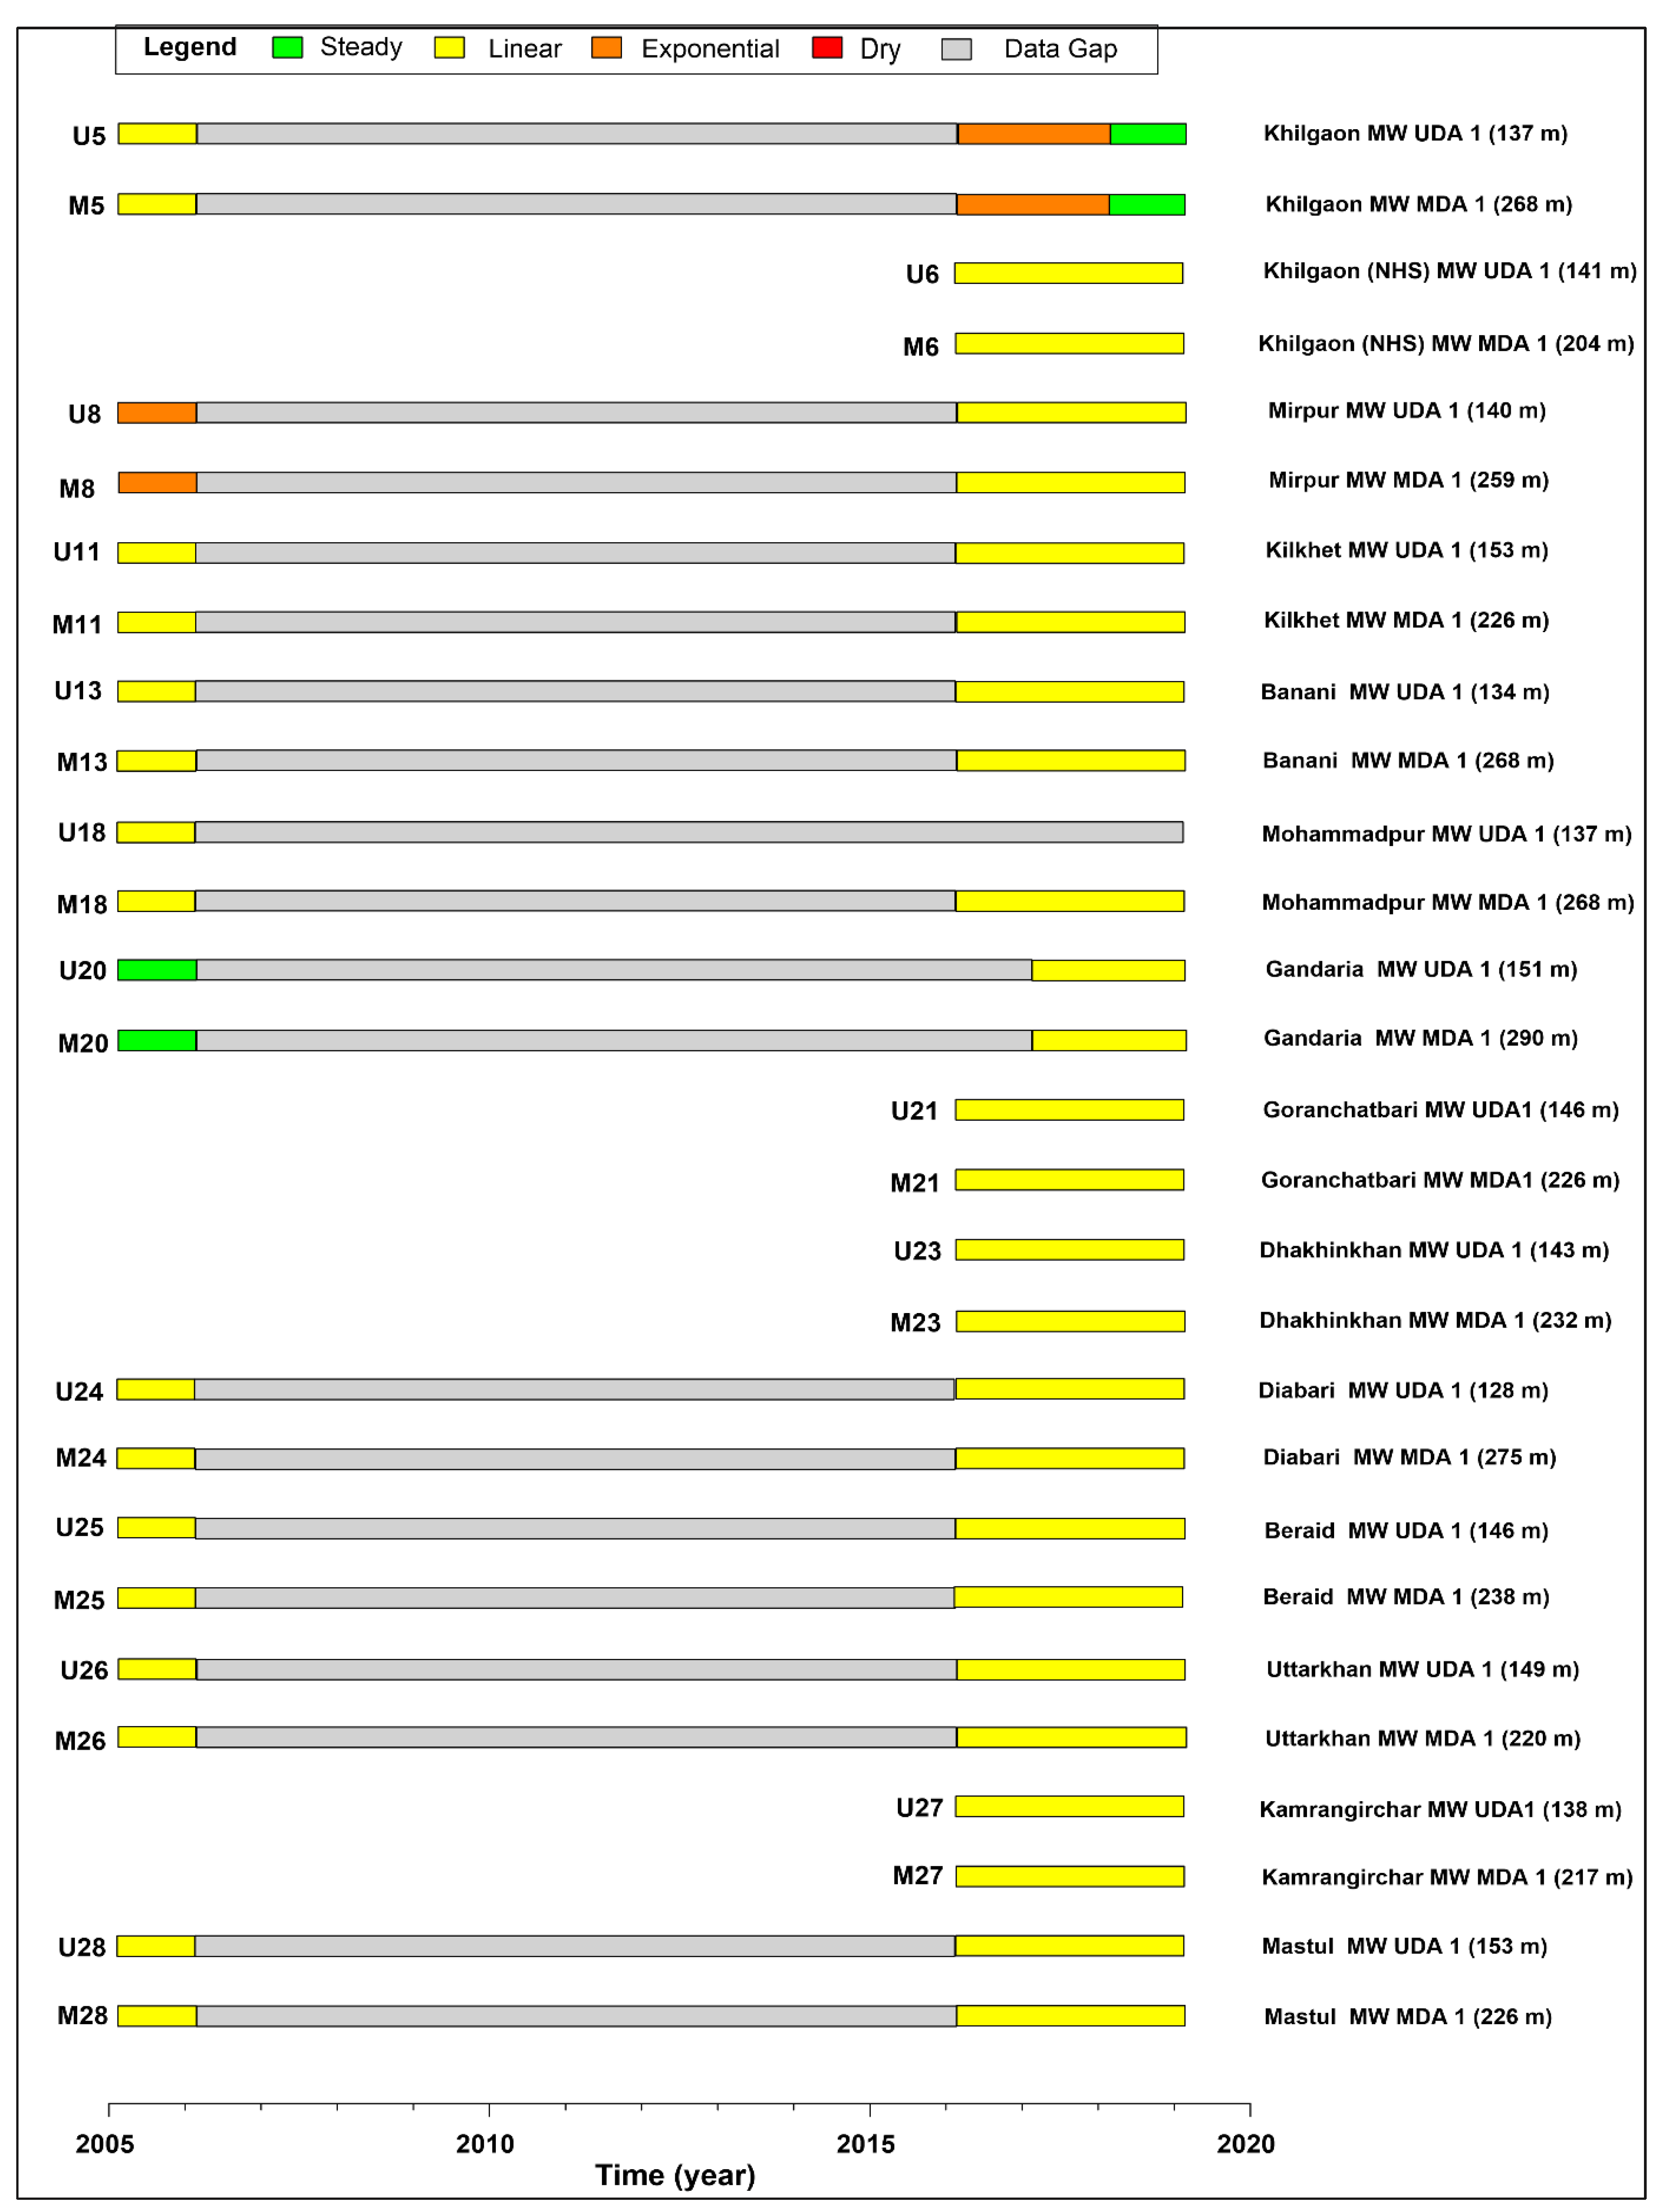
5.2. Twin Hydrographs: Analysis and Comparison of PL in UDA and MDA
5.3. Piezometric Map Analysis
5.3.1. Spatial Distribution of Water Table of Shallow Aquifer for 1980
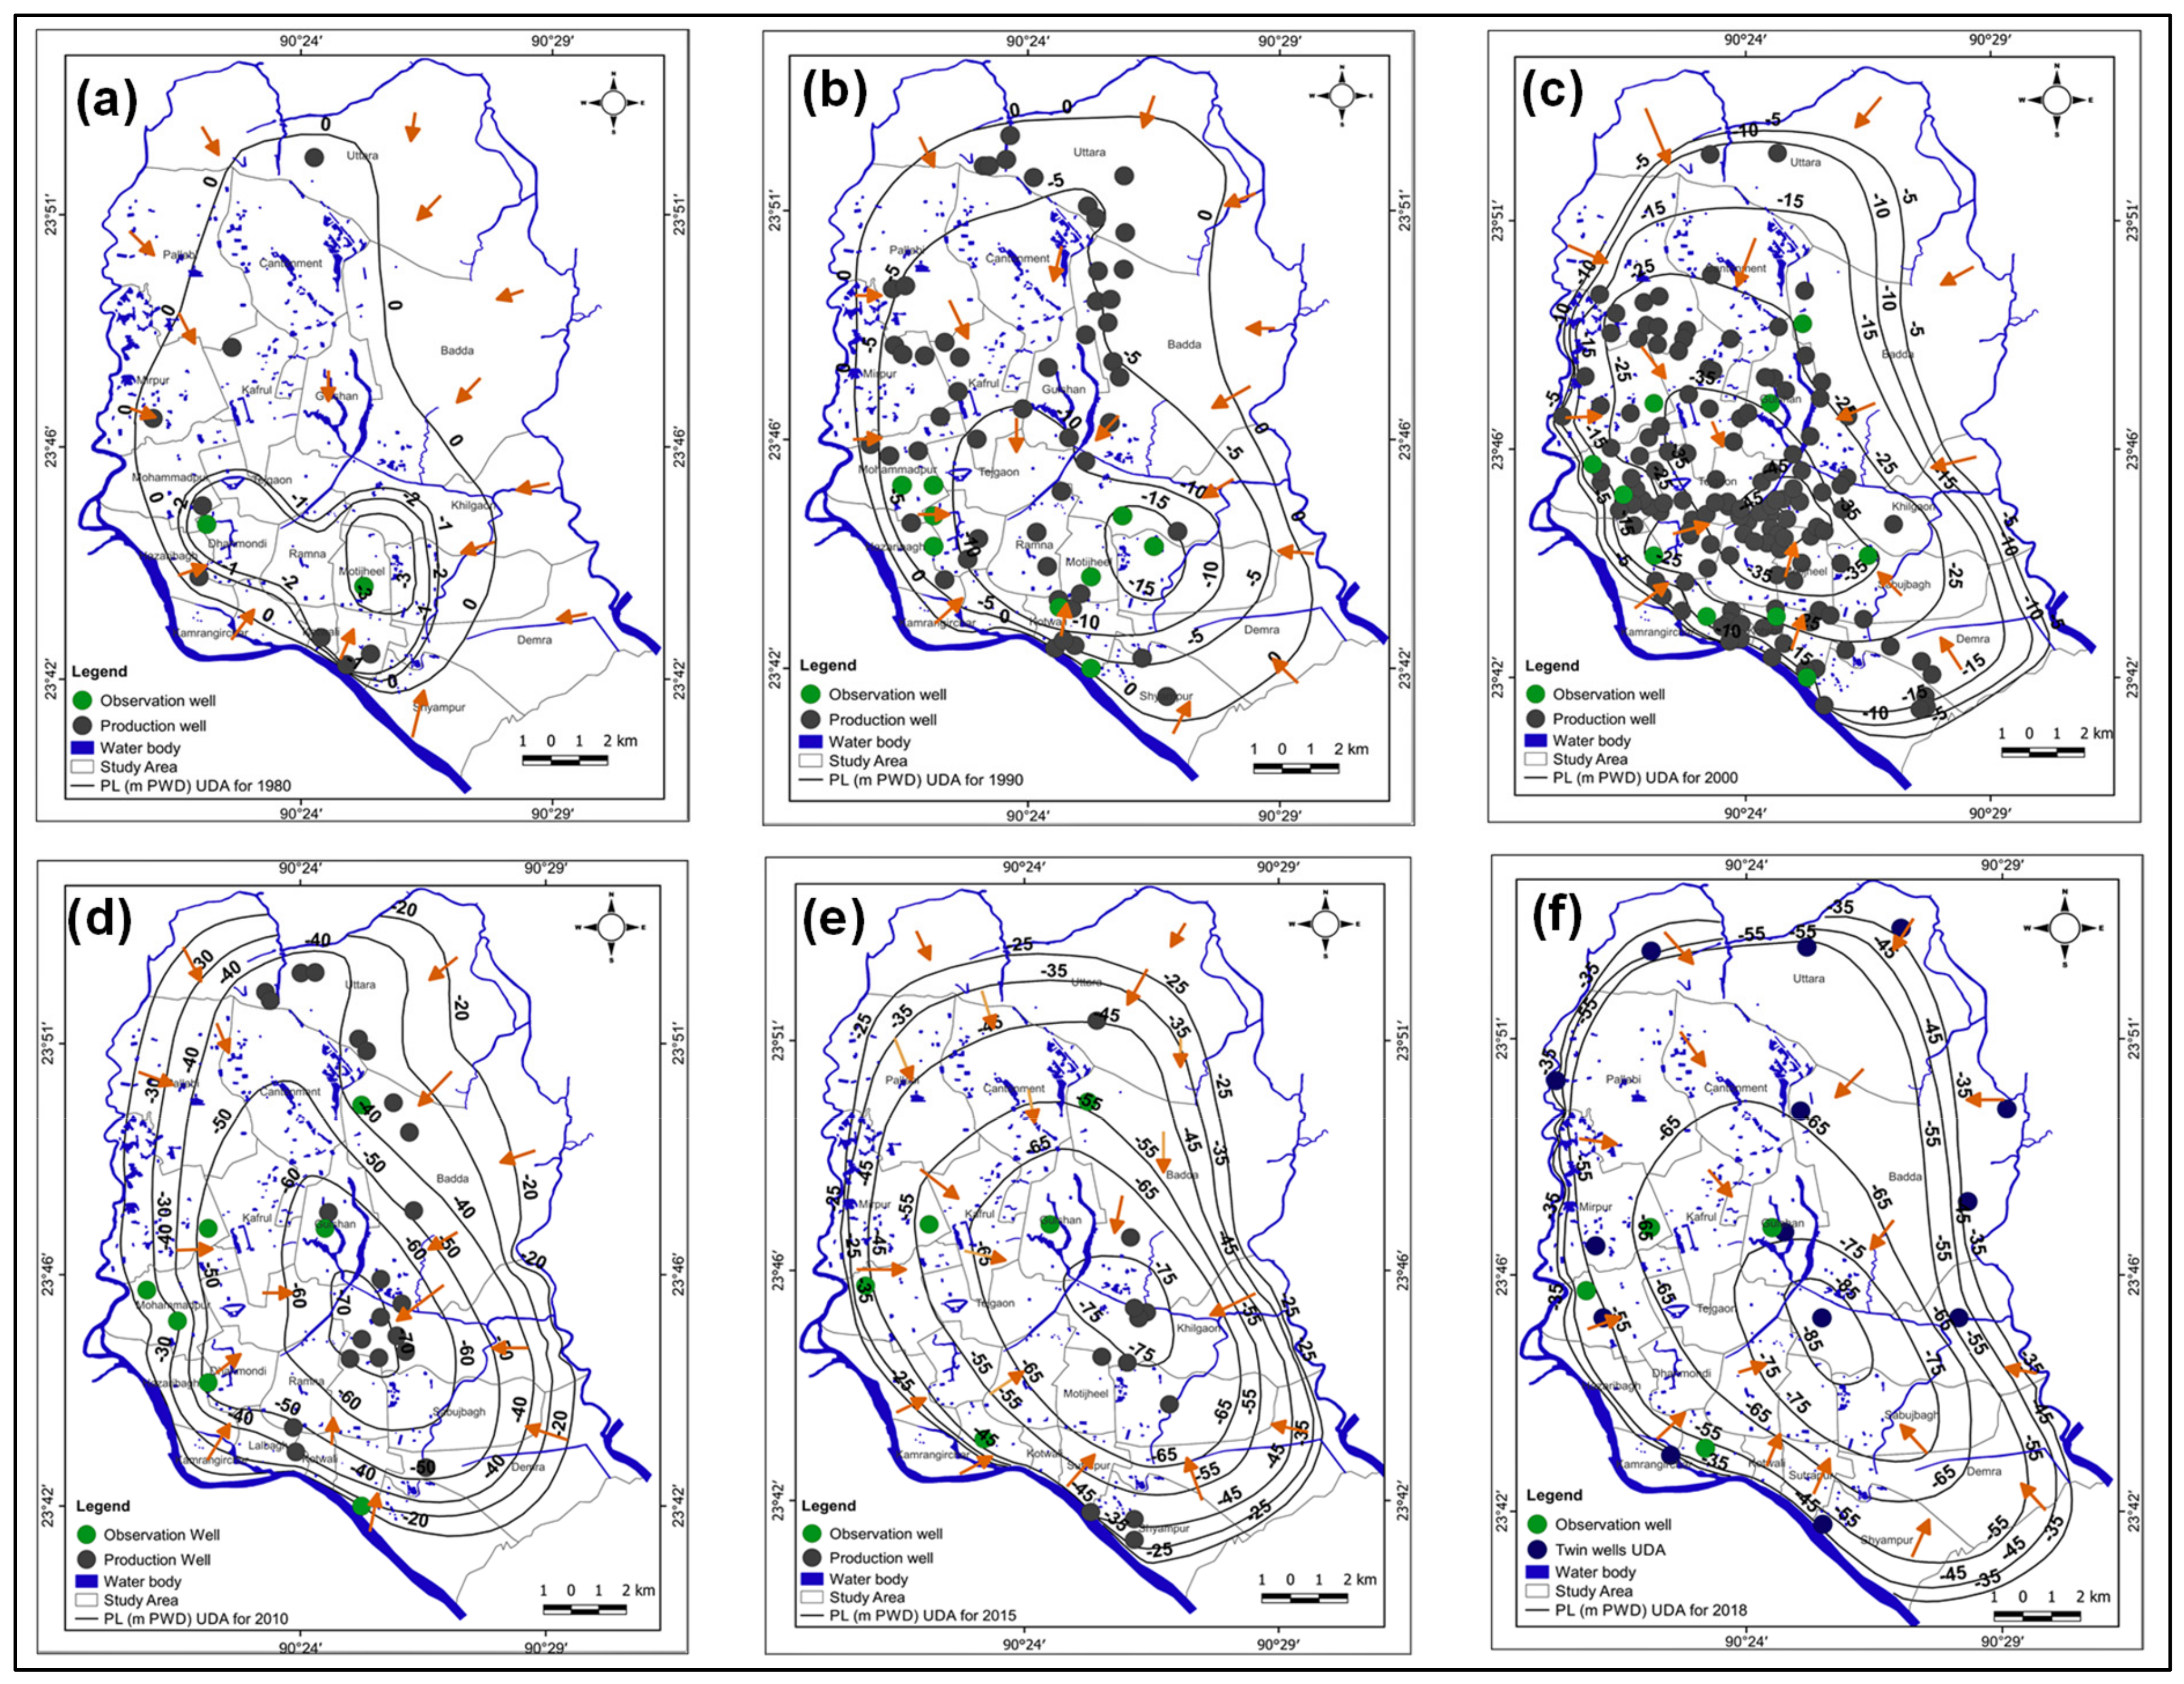
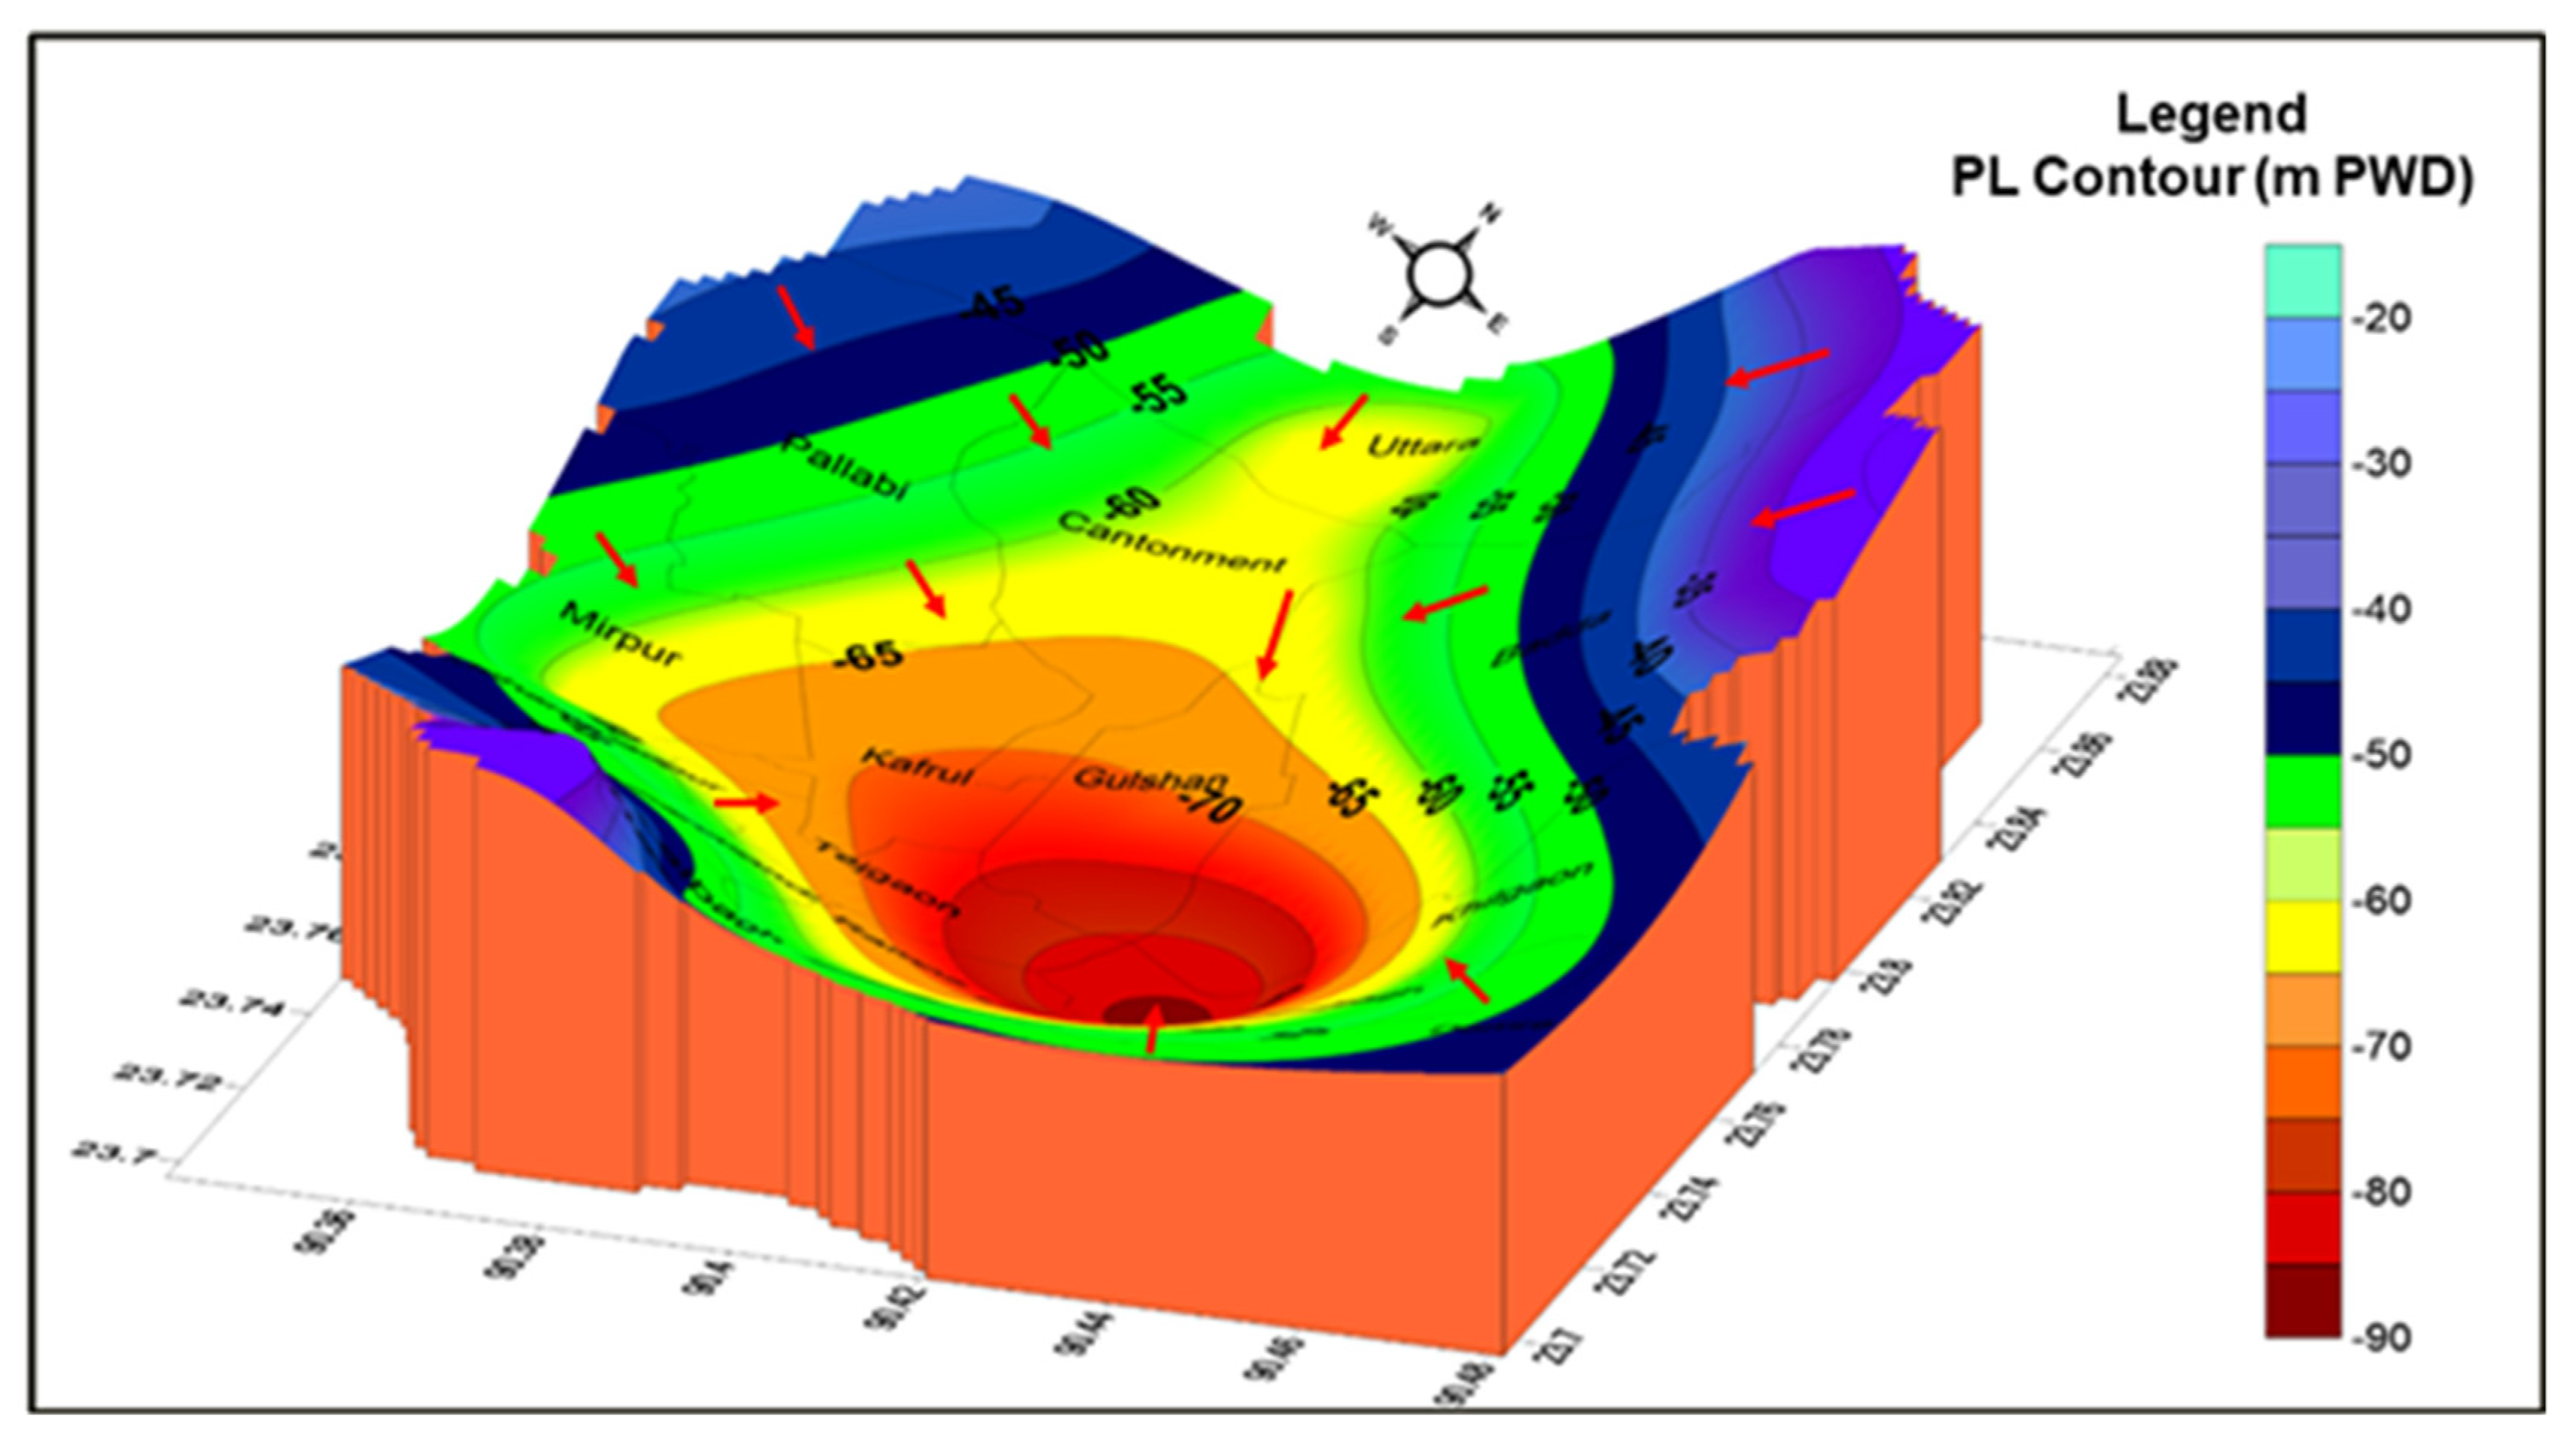
5.3.2. Spatial and Temporal Distribution of Piezometric Level for UDA
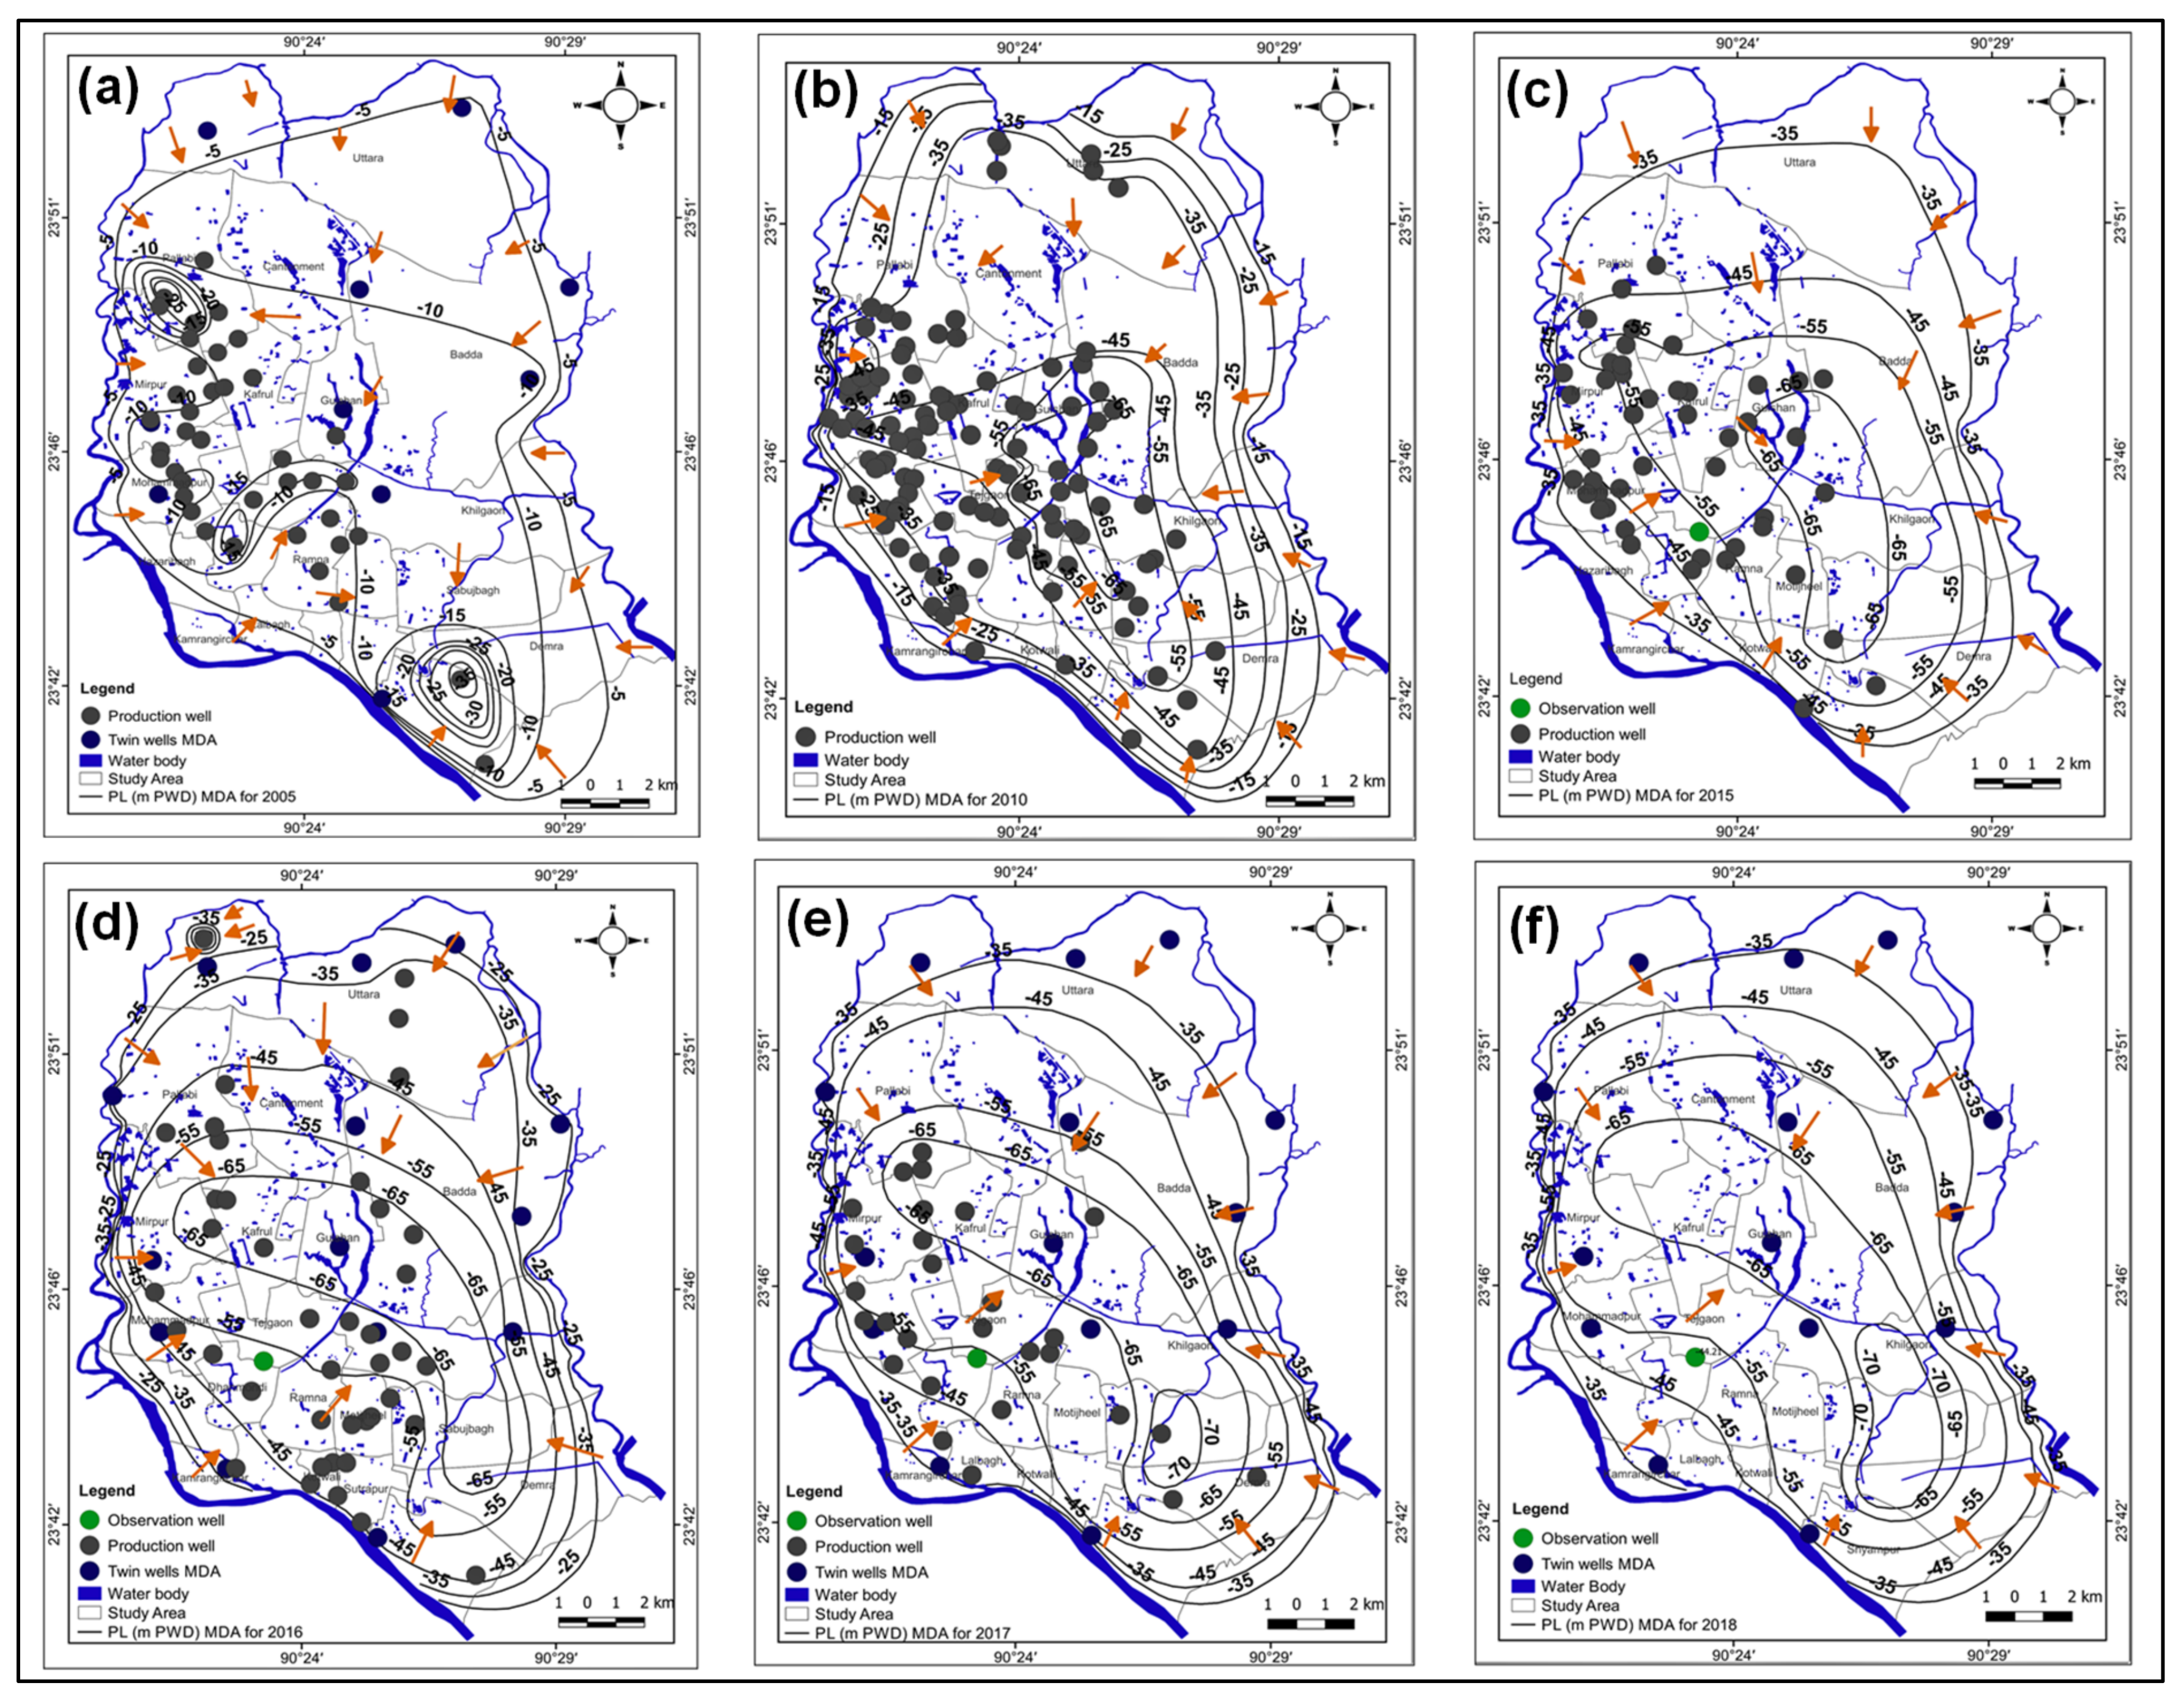
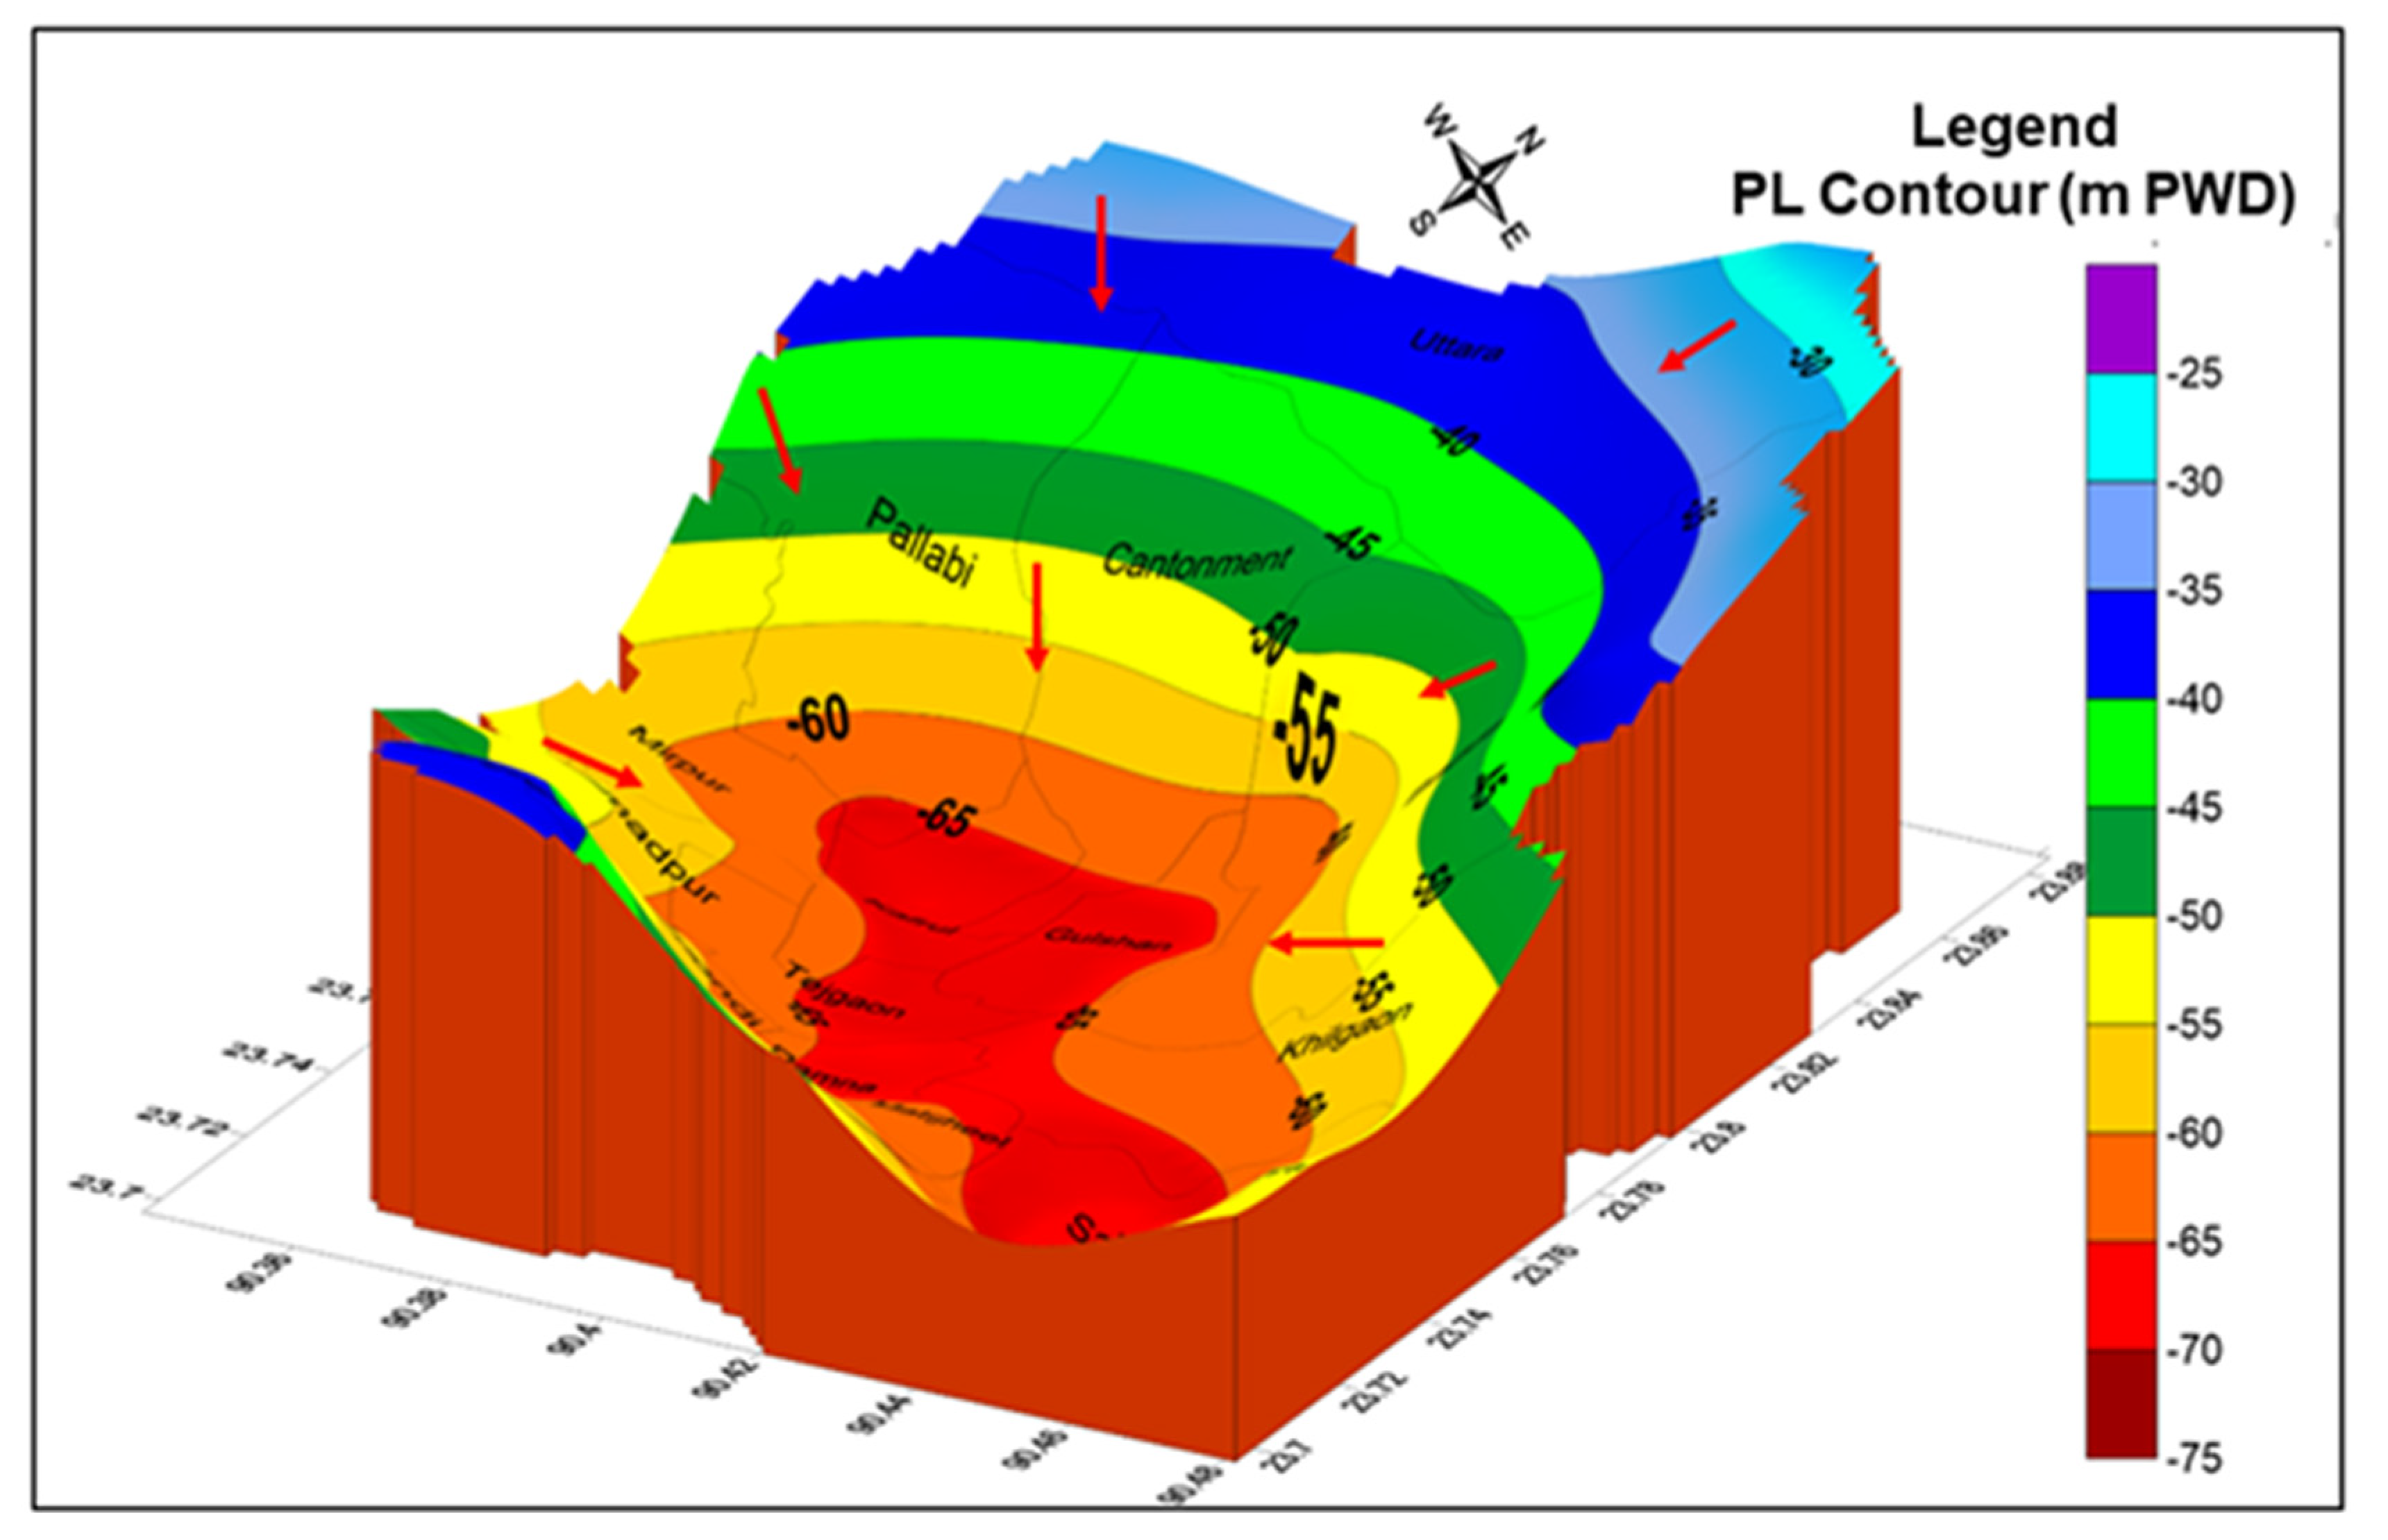
5.3.3. Spatial and Temporal Distribution of Piezometric Level for MDA
6. Discussion
7. Conclusions
Author Contributions
Funding
Institutional Review Board Statement
Informed Consent Statement
Data Availability Statement
Acknowledgments
Conflicts of Interest
References
- Hoque, M.A.; Hoque, M.M.; Ahmed, K.M. Declining groundwater level and aquifer dewatering in Dhaka metropolitan area, Bangladesh: Causes and quantification. Hydrogeol. J. 2007, 15, 1523–1534. [Google Scholar] [CrossRef]
- Long, D.; Yang, W.; Scanlon, B.R.; Zhao, J.; Liu, D.; Burek, P.; Pan, Y.; You, L.; Wada, Y. South-to-North Water Diversion stabilizing Beijing’s groundwater levels. Nat. Commun. 2020, 11, 1–10. [Google Scholar] [CrossRef] [PubMed]
- Zhou, Y.; Dong, D.; Liu, J.; Li, W. Upgrading a regional groundwater level monitoring network for Beijing Plain, China. Geosci. Front. 2013, 4, 127–138. [Google Scholar] [CrossRef] [Green Version]
- Naik, P.K.; Tambe, J.A.; Dehury, B.N.; Tiwari, A.N. Impact of urbanization on the groundwater regime in a fast growing city in central India. Environ. Monit. Assess. 2008, 146, 339–373. [Google Scholar] [CrossRef] [PubMed]
- Qureshi, A.S.; McCornick, P.G.; Sarwar, A.; Sharma, B.R. Challenges and prospects of sustainable groundwater management in the Indus Basin, Pakistan. Water Resour. Manag. 2010, 24, 1551–1569. [Google Scholar] [CrossRef] [Green Version]
- Rodell, M.; Velicogna, I.; Famiglietti, J.S. Satellite-based estimates of groundwater depletion in India. Nature 2009, 460, 999–1002. [Google Scholar] [CrossRef] [Green Version]
- Urrutia, J.; Jódar, J.; Medina, A.; Herrera, C.; Chong, G.; Urqueta, H.; Luque, J.A. Hydrogeology and sustainable future groundwater abstraction from the Agua Verde aquifer in the Atacama Desert, northern Chile. Hydrogeol. J. 2018, 26, 1989–2007. [Google Scholar] [CrossRef]
- Famiglietti, J.S.; Lo, M.; Ho, S.L.; Bethune, J.; Anderson, K.; Syed, T.H.; Swenson, S.C.; de Linage, C.R.; Rodell, M. Satellites measure recent rates of groundwater depletion in California’s Central Valley. Geophys. Res. Lett. 2011, 38, L03403. [Google Scholar] [CrossRef] [Green Version]
- Longuevergne, L.; Scanlon, B.R.; Wilson, C.R. GRACE Hydrological estimates for small basins: Evaluating processing approaches on the High Plains Aquifer, USA. Water Resour. Res. 2010, 46, W11517. [Google Scholar] [CrossRef]
- Voss, K.A.; Famiglietti, J.S.; Lo, M.; De Linage, C.; Rodell, M.; Swenson, S.C. Groundwater depletion in the Middle East from GRACE with implications for transboundary water management in the Tigris-Euphrates-Western Iran region. Water Resour. Res. 2013, 49, 904–914. [Google Scholar] [CrossRef] [Green Version]
- Werner, A.D.; Zhang, Q.; Xue, L.; Smerdon, B.D.; Li, X.; Zhu, X.; Yu, L.; Li, L. An initial inventory and indexation of groundwater mega-depletion cases. Water Resour. Manag. 2013, 27, 507–533. [Google Scholar] [CrossRef]
- Van Camp, M.; Walraevens, K. Recovery scenarios for deep over-exploited aquifers with limited recharge: Methodology and application to an aquifer in Belgium. Environ. Geol. 2009, 56, 1505–1516. [Google Scholar] [CrossRef]
- Mays, L.W. Groundwater resources sustainability: Past, present, and future. Water Resour. Manag. 2013, 27, 4409–4424. [Google Scholar] [CrossRef]
- Konikow, L.F.; Kendy, E. Groundwater depletion: A global problem. Hydrogeol. J. 2005, 13, 317–320. [Google Scholar] [CrossRef]
- Chaussard, E.; Wdowinski, S.; Cabral-Cano, E.; Amelung, F. Land subsidence in central Mexico detected by ALOS InSAR time-series. Remote Sens. Environ. 2014, 140, 94–106. [Google Scholar] [CrossRef]
- Novelo, J.A.M.; Tapia, L.R. The growth of water demand in Mexico City and the over-exploitation of its aquifers. In Water resources in Mexico; Springer: Berlin/Heidelberg, Germany, 2012; pp. 395–406. [Google Scholar]
- Scanlon, B.R.; Faunt, C.C.; Longuevergne, L.; Reedy, R.C.; Alley, W.M.; McGuire, V.L.; McMahon, P.B. Groundwater depletion and sustainability of irrigation in the US High Plains and Central Valley. Proc. Natl. Acad. Sci. USA 2012, 109, 9320–9325. [Google Scholar] [CrossRef] [Green Version]
- Doell, P.; Mueller Schmied, H.; Schuh, C.; Portmann, F.T.; Eicker, A. Global-scale assessment of groundwater depletion and related groundwater abstractions: Combining hydrological modeling with information from well observations and GRACE satellites. Water Resour. Res. 2014, 50, 5698–5720. [Google Scholar] [CrossRef]
- Wada, Y.; Wisser, D.; Bierkens, M.F. Global modeling of withdrawal, allocation and consumptive use of surface water and groundwater resources. Earth Syst. Dyn. Discuss. 2014, 5, 15–40. [Google Scholar] [CrossRef] [Green Version]
- Chen, M.; Tomás, R.; Li, Z.; Motagh, M.; Li, T.; Hu, L.; Gong, H.; Li, X.; Yu, J.; Gong, X. Imaging land subsidence induced by groundwater extraction in Beijing (China) using satellite radar interferometry. Remote Sens. 2016, 8, 468. [Google Scholar] [CrossRef] [Green Version]
- Gleeson, T.; VanderSteen, J.; Sophocleous, M.A.; Taniguchi, M.; Alley, W.M.; Allen, D.M.; Zhou, Y. Groundwater sustainability strategies. Nat. Geosci. 2010, 3, 378–379. [Google Scholar] [CrossRef]
- Condon, L.E.; Maxwell, R.M. Simulating the sensitivity of evapotranspiration and streamflow to large-scale groundwater depletion. Sci. Adv. 2019, 5, eaav4574. [Google Scholar] [CrossRef] [Green Version]
- Mendonça, B.; Sandwell, D. Satellite Interferometric Investigations of Subsidence Events Associated with Groundwater Extraction in Sao Paulo, Brazil. Int. J. Geol. Environ. Eng. 2016, 10, 127–133. [Google Scholar]
- Van Camp, M.; Radfar, M.; Walraevens, K. Assessment of groundwater storage depletion by overexploitation using simple indicators in an irrigated closed aquifer basin in Iran. Agric. Water Manag. 2010, 97, 1876–1886. [Google Scholar] [CrossRef]
- Bangladesh Bureau of Statistics (BBS). Statistical Yearbook of Bangladesh, Bangladesh Bureau of Statistics (BBS); Ministry of Planning, Government of People’s Republic of Bangladesh: Dhaka, Bangladesh, 2011.
- Dhaka Water Supply and Sewerage Authority (DWASA). Annual Report (2018–2019); DWASA: Dhaka, Bangladesh, 2018. Available online: https://dwasa.org.bd/annual-reports/ (accessed on 30 August 2020).
- Khan, M.R.; Koneshloo, M.; Knappett, P.S.; Ahmed, K.M.; Bostick, B.C.; Mailloux, B.J.; Mozumder, R.H.; Zahid, A.; Harvey, C.F.; Van Geen, A. Megacity pumping and preferential flow threaten groundwater quality. Nat. Commun. 2016, 7, 1–8. [Google Scholar] [CrossRef] [PubMed]
- Knappett, P.; Mailloux, B.; Choudhury, I.; Khan, M.; Michael, H.; Barua, S.; Mondal, D.; Steckler, M.; Akhter, S.; Ahmed, K. Vulnerability of low-arsenic aquifers to municipal pumping in Bangladesh. J. Hydrol. 2016, 539, 674–686. [Google Scholar] [CrossRef] [Green Version]
- Lyu, H.-M.; Shen, S.-L.; Wu, Y.-X.; Zhou, A.-N. Calculation of groundwater head distribution with a close barrier during excavation dewatering in confined aquifer. Geosci. Front. 2021, 12, 791–803. [Google Scholar] [CrossRef]
- Ahmed, K. Dupi Tila Aquifer of Dhaka: Hydraulic and Hydrochemical Response to Extensive Exploitation; Groundwater in the Urban Environment: Selected City Profiles; IAH: London, UK, 1999; Volume 21, pp. 19–30. [Google Scholar]
- Konikow, L.F. Contribution of global groundwater depletion since 1900 to sea-level rise. Geophys. Res. Lett. 2011, 38, L18601. [Google Scholar] [CrossRef] [Green Version]
- Gleeson, T.; Wada, Y.; Bierkens, M.F.; Van Beek, L.P. Water balance of global aquifers revealed by groundwater footprint. Nature 2012, 488, 197–200. [Google Scholar] [CrossRef] [PubMed]
- Alley, W.M.; Reilly, T.E.; Franke, O.L. Sustainability of Ground-Water Resources; US Department of the Interior, US Geological Survey: Sunrise Valley Drive Reston, VA, USA, 1999; Volume 1186.
- Hiscock, K.M.; Rivett, M.O.; Davison, R.M. Sustainable groundwater development. Geol. Soc. Lond. Spec. Publ. 2002, 193, 1–14. [Google Scholar] [CrossRef]
- Council of Canadian Academies. The Sustainable Management of Groundwater in Canada; Expert Panel on Groundwater, Report to the Government of Canada; Ministry of Industry: Ottawa, ON, Canada, 2009.
- Lóaiciga, H.A.; Leipnik, R.B. Theory of sustainable groundwater management: An urban case study. Urban Water 2001, 3, 217–228. [Google Scholar] [CrossRef]
- Loáiciga, H.A. Sustainable groundwater management: The theory of a game. In Critical Transitions in Water and Environmental Resources Management; Amer Society of Civil Engineers: Reston, VA, USA, 2004; pp. 1–10. [Google Scholar]
- McMahon, P.; Plummer, L.; Böhlke, J.; Shapiro, S.; Hinkle, S. A comparison of recharge rates in aquifers of the United States based on groundwater-age data. Hydrogeol. J. 2011, 19, 779. [Google Scholar] [CrossRef]
- URSS. World Water Balance and Water Resources of the Earth; UNESCO: Paris, France, 1978. [Google Scholar]
- Van Bracht, M. Made to Measure: Information Requirements and Groundwater Level Monitoring Networks. Ph.D. Thesis, Vrije Universiteit Amsterdam, Amsterdam, The Netherlands, 2001. [Google Scholar]
- Hasan, M. The Vulnerability of the Dupi Tila Aquifer. Dhaka, Bangladesh. Ph.D. Thesis, University College London, University of London, London, UK, 1999, unpublished. [Google Scholar]
- Darling, W.; Burgess, W.; Hasan, M. Isotopic Evidence for Induced River Recharge to the Dupi Tila Aquifer in the Dhaka Urban Area, Bangladesh; (IAEA-TECDOC-1298); International Atomic Energy Agency (IAEA): Vienna, Austria, 2002. [Google Scholar]
- Morris, B.L.; Seddique, A.A.; Ahmed, K.M. Response of the Dupi Tila aquifer to intensive pumping in Dhaka, Bangladesh. Hydrogeol. J. 2003, 11, 496–503. [Google Scholar] [CrossRef] [Green Version]
- Akther, H.; Ahmed, M.; Rasheed, K. Spatial and temporal analysis of groundwater level fluctuation in Dhaka city, Bangladesh. Asian J. Earth Sci. 2009, 2, 49–57. [Google Scholar] [CrossRef] [Green Version]
- Ahmed, K.M.; Islam, M.S.; Sultana, S.; Ahmed, S.; Rabbani, G. Changes in the Groundwater Regime of Dhaka City: A Historical Perspective; Environment of Capital Dhaka-Plants Wildlife Gardens Parks Air Water Earthquake; Asiatic Society of Bangladesh: Dhaka, Bangladesh, 2011; pp. 383–400. [Google Scholar]
- Shamsudduha, M.; Taylor, R.G.; Ahmed, K.M.; Zahid, A. The impact of intensive groundwater abstraction on recharge to a shallow regional aquifer system: Evidence from Bangladesh. Hydrogeol. J. 2011, 19, 901–916. [Google Scholar] [CrossRef]
- Rahman, M.A.; Wiegand, B.A.; Badruzzaman, A.; Ptak, T. Hydrogeological analysis of the upper Dupi Tila Aquifer, towards the implementation of a managed aquifer-recharge project in Dhaka City, Bangladesh. Hydrogeol. J. 2013, 21, 1071–1089. [Google Scholar] [CrossRef]
- Hoque, M.; McArthur, J.; Sikdar, P.; Ball, J.; Molla, T. Tracing recharge to aquifers beneath an Asian megacity with Cl/Br and stable isotopes: The example of Dhaka, Bangladesh. Hydrogeol. J. 2014, 22, 1549–1560. [Google Scholar] [CrossRef]
- Wu, Y.-X.; Lyu, H.-M.; Han, J.; Shen, S.-L. Dewatering–induced building settlement around a deep excavation in soft deposit in Tianjin, China. J. Geotech. Geoenviron. Eng. 2019, 145, 05019003. [Google Scholar] [CrossRef]
- Wu, Y.-X.; Shen, S.-L.; Lyu, H.-M.; Zhou, A. Analyses of leakage effect of waterproof curtain during excavation dewatering. J. Hydrol. 2020, 583, 124582. [Google Scholar] [CrossRef]
- Shen, S.-L.; Lyu, H.-M.; Zhou, A.; Lu, L.-H.; Li, G.; Hu, B.-B. Automatic control of groundwater balance to combat dewatering during construction of a metro system. Autom. Constr. 2021, 123, 103536. [Google Scholar] [CrossRef]
- Quayyum, S.; Rahman, M.M.; Mohsin, M. Sustainable Water Supply in Dhaka City: Present & Future. In Proceedings of the Asian Science and Technology Seminar, Thailand, Bangkok, Thailand, 10–11 March 2008. [Google Scholar]
- Monsur, M. Stratigraphical and palaeomagnetical studies of some quaternary deposits of the Bengal Basin, Bangladesh. Ph.D. Thesis, Vrije University, Brussels, Belgium, 1990; p. 241, unpublished. [Google Scholar]
- Morgan, J.P.; McIntire, W.G. Quaternary geology of the Bengal basin, East Pakistan and India. Geol. Soc. Am. Bull. 1959, 70, 319–342. [Google Scholar] [CrossRef]
- Islam, N. DHAKA: From City to Megacity: Perspectives on People, Places; Planning and Development Issues; University of Dhaka: Dhaka, Bangladesh, 1996. [Google Scholar]
- Mowla, Q.A. Review of Dhaka structure plan 2016–2035; Official Report Submitted to RAJUK; RAJUK: Dhaka, Bangladesh, 2015.
- Ahmed, B.; Hasan, R.; Maniruzzaman, K. Urban morphological change analysis of Dhaka city, Bangladesh, using space syntax. ISPRS Int. J. Geo-Inf. 2014, 3, 1412–1444. [Google Scholar] [CrossRef]
- Chowdhury, A.; Faruqui, S. Physical growth of Dhaka city. In Dhaka: Past, Present and Future; Asiatic Society of Bangladesh: Dhaka, Bangladesh, 1989; pp. 43–61. [Google Scholar]
- Chowdhury, A.M. Dhaka, 2nd ed.; Asiatic Society of Bangladesh: Dhaka, Bangladesh, 2012. [Google Scholar]
- Hassan, M.M.; Southworth, J. Analyzing land cover change and urban growth trajectories of the mega-urban region of Dhaka using remotely sensed data and an ensemble classifier. Sustainability 2018, 10, 10. [Google Scholar] [CrossRef] [Green Version]
- Hossain, S. Social Formations of the Megacity of Dhaka: A Review Essay; Elsevier: Amsterdam, The Netherlands, 2013. [Google Scholar]
- Kabir, A.; Parolin, B. Planning and development of Dhaka–A story of 400 years. In Proceedings of the 15th International Planning History Society Conference, San Paulo, Brazil, 15–18 July 2012. [Google Scholar]
- Mahtab-uz-Zaman, Q.; Lau, S.S. City expansion policy versus compact city demand: The case of Dhaka. In The Compact Cities: Sustainable Urban Form for Developing Countries; Jenks, M., Burgess, R., Eds.; Springer: Berlin/Heidelberg, Germany, 2000; pp. 141–1152. [Google Scholar]
- Uddin, A.S.; Mohuya, F.A. Growth and Development of Dhaka North: 1971–2011. J. Asiat. Soc. Bangladesh (Hum.) 2013, 58, 303–334. [Google Scholar]
- Huq, S.; Alam, M. Flood management and vulnerability of Dhaka City. In Building Safer Cities; World Bank Publications: Washington, DC, USA, 2003; p. 121. [Google Scholar]
- Talukder, S.H. Managing Megacities: A Case Study of Metroplitan Regional Governance for Dhaka; Murdoch University: Murdoch, Australia, 2006. [Google Scholar]
- Islam, N. Dhaka Now: Contemporary Urban Development Bangladesh Geographical Society Dhaka; Bangladesh Geographical Society: Dhaka, Bangladesh, 2005. [Google Scholar]
- Kamal, A.M.; Midorikawa, S. GIS-based geomorphological mapping using remote sensing data and supplementary geoinformation: A case study of the Dhaka city area, Bangladesh. Int. J. Appl. Earth Obs. Geoinf. 2004, 6, 111–125. [Google Scholar] [CrossRef]
- Asian Disaster Preparedness Centre (ADPC). Engineering Geological Map for Seismic Hazard and Vulnerability Assessment of Dhaka, Chittagong and Sylhet City Corporation Area, OYO International Corporation; CDMP: Dhaka, Bangladesh, 2009. [Google Scholar]
- EPC/MMP. Dhaka Region Groundwater and Subsidence Study, Report Prepared by Engineering and Planning Consultants in Association with Sir M. MacDonald and Partners Ltd. (UK) for Dhaka WASA; DWASA: Dhaka, Bangladesh, 1991.
- Aggarwal, P.K.; Froehlich, K.; Basu, A.; Poreda, R.; Kulkarni, K.; Tarafdar, S.; Mohamed, A.; Nasir, A.; Alamgir, H.; Mizanur, R. A Report on Isotope Hydrology of Groundwater in Bangladesh: Implications for Characterization and Mitigation of Arsenic in Groundwater; International Atomic Energy Agency: Vienna, Austria, 2000. [Google Scholar]
- Davies, J.; Exley, C. Short Term BGS Pilot Project to Assess the Hydrochemical Character of the Main Aquifer Units of the Central and North-Eastern Bangladesh and Possible Toxicity of Groundwater to Fish and Humans: Appendices 1–5; British Geological Survey: Keyworth, UK, 1992. [Google Scholar]
- Khandoker, R. Origin of elevated Barind-Madhupur areas, Bengal basin: Result of neotectonic activities. Bangladesh J. Geol. 1987, 6, 1–9. [Google Scholar]
- Maitra, M.K.; Akhter, S. Neotectonics in Madhupur tract its surroundings floodplains. Dhaka Univ. J. Earth Environ. Sci. 2011, 12, 83–89. [Google Scholar]
- Davies, J. The Pilot Study into Optimum Well Design: IDA 4000 Deep Tube Well II Project. Volume 2: The Geology of the Alluvial Aquifers of Central Bangladesh; British Geology Survey Technical Report WD/89/9.; British Geological Survey: Keyworth, UK, 1989. [Google Scholar]
- BGS; DPHE. Arsenic Contamination of Groundwater in Bangladesh; British Geological Survey Technical Report, WC/00/19. 4 Volumes; British Geological Survey: Keyworth, UK, 2001. [Google Scholar]
- Islam, M.B.; Firoz, A.; Foglia, L.; Marandi, A.; Khan, A.R.; Schüth, C.; Ribbe, L. A regional groundwater-flow model for sustainable groundwater-resource management in the south Asian megacity of Dhaka, Bangladesh. Hydrogeol. J. 2017, 25, 617–637. [Google Scholar] [CrossRef]
- Gani, M.R.; Alam, M.M. Fluvial facies architecture in small-scale river systems in the Upper Dupi Tila Formation, northeast Bengal Basin, Bangladesh. J. Asian Earth Sci. 2004, 24, 225–236. [Google Scholar] [CrossRef]
- Iqbal Hossain, M. Evaluation of Aquifer Characteristics of Dhaka City Using Pumped Well Data. Master’s Thesis, Water Resources Engineering (WRE). BUET, Dhaka, Bangladesh, 1997. [Google Scholar]
- DWASA; IWM. Resource Assessment and Monitoring of Water Supply Sources for Dhaka City. Final Report on Resource Assessment; Dhaka Water Supply and Sewerage Authority (DWASA): Dhaka, Bangladesh, 2006; Main Report; Volume I.
- Available online: https://earthexplorer.usgs.gov/ (accessed on 15 January 2020).
- Ralhan, O.P. The Great Gurus of the Sikhs; Anmol Publications PVT. LTD.: Anmol, India, 2002; 1678p, ISBN1 -10:8174884793. ISBN2 -13:978-8174884794. [Google Scholar]
- DWASA; IWM. Establishment of Groundwater Monitoring system in Dhaka City for Aquifer System and DWASA Production Wells; DWASA: Dhaka, Bangladesh, 2016. [Google Scholar]
- Bangladesh Water Development Board (BWDB). Effects of Overwithdrawal of Groundwater in Dhaka City; BWDB Water Supply Paper 519, Groundwater Circle-II; BWDB: Dhaka, Bangladesh, 1991.
- Bangladesh Bureau of Statistics (BBS). Bangladesh Population Census. Field Report of Different Upazilas of Dhaka District; Statistics and Informatics Division (SID); Ministry of Planning: Dhaka, Bangladesh, 2001.
- Ahmed, K.; Burgess, W. Surface Water and Groundwater Interaction in Bangladesh Hydrogeology; Groundwater Resources and Development in Bangladeshbackground to the Arsenic Crisis, Agricultural Potential and the Environment, AA Rahman, P. Ravenscroft; et al., Bangladesh Centre for Advanced Studies; University Press Ltd.: Dhaka, Bangladesh, 2003. [Google Scholar]
- Ravenscroft, P. Overview of the Hydrogeology of Bangladesh. Groundwater Resources and Development in Bangladesh–Background to the Arsenic Crisis, Agricultural Potential and the Environment; University Press Ltd.: Dhaka, Bangladesh, 2003. [Google Scholar]
- Khan, T.A. Dhaka Water Supply and Sewerage Authority: Performance and Challenges; DWASA Report; DWASA: Dhaka, Bangladesh, 2013. [Google Scholar]
- Islam, M.; Van Camp, M.; Hossain, D.; Sarker, M.M.R.; Khatun, S.; Walraevens, K. The Impact of Urbanization and Rapid Population Growth on the Groundwater Regime in Dhaka City, Bangladesh; Copernicus Meetings: Göttingen, Germany, 2021. [Google Scholar]
- Custodio, E. Aquifer overexploitation: What does it mean? Hydrogeol. J. 2002, 10, 254–277. [Google Scholar] [CrossRef]


| Twin Well Id | Location | UDA PL (m PWD) 2018 | MDA PL (m PWD) 2018 | Difference of Drawdown in UDA (m/year) 2017–2018 | Difference of Drawdown in MDA (m/year) 2017–2018 |
|---|---|---|---|---|---|
| DMW-01 | Uttar Khan | −31.92 | −26.76 | 1.66 | 2.6 |
| DMW-02 | Diabari | −40.1 | −33.14 | 3.66 | 2.84 |
| DMW-03 | Khilkhet | −62.12 | −48.56 | 1.82 | 2.43 |
| DMW-04 | Mastul, Patira | −20.91 | −30.24 | 2.35 | 2.13 |
| DMW-05 | Beraid | −31.99 | −36.5 | 0.9 | 0.83 |
| DMW-06 | Mirpur | −62.87 | −56.45 | 2.85 | 4.6 |
| DMW-07 | Banani | −71.24 | −61.48 | 1.51 | 4.97 |
| DMW-08 | Mohammadpur | - | −52.86 | - | 1.53 |
| DMW-09 | Khilgaon | −85.65 | −57.87 | 3.98 | 5.75 |
| DMW-10 | Gandaria | −48.75 | −48.23 | 0.3 | 1.91 |
| DMW-16 | Dakhinkhan | −59.51 | −36.28 | 3.07 | 3.93 |
| DMW-17 | Nasirabad, Khilgaon | −52.14 | −52.25 | 1.6 | 1.6 |
| DMW-18 | Goranchatbari | −40.12 | −40.32 | 2.3 | 2.4 |
| DMW-19 | Kamrangirchar | −21.34 | −37.6 | 0 | 0 |
Publisher’s Note: MDPI stays neutral with regard to jurisdictional claims in published maps and institutional affiliations. |
© 2021 by the authors. Licensee MDPI, Basel, Switzerland. This article is an open access article distributed under the terms and conditions of the Creative Commons Attribution (CC BY) license (https://creativecommons.org/licenses/by/4.0/).
Share and Cite
Islam, M.; Van Camp, M.; Hossain, D.; Sarker, M.M.R.; Khatun, S.; Walraevens, K. Impacts of Large-Scale Groundwater Exploitation Based on Long-Term Evolution of Hydraulic Heads in Dhaka City, Bangladesh. Water 2021, 13, 1357. https://doi.org/10.3390/w13101357
Islam M, Van Camp M, Hossain D, Sarker MMR, Khatun S, Walraevens K. Impacts of Large-Scale Groundwater Exploitation Based on Long-Term Evolution of Hydraulic Heads in Dhaka City, Bangladesh. Water. 2021; 13(10):1357. https://doi.org/10.3390/w13101357
Chicago/Turabian StyleIslam, Mazeda, Marc Van Camp, Delwar Hossain, Md. Mizanur Rahman Sarker, Shahina Khatun, and Kristine Walraevens. 2021. "Impacts of Large-Scale Groundwater Exploitation Based on Long-Term Evolution of Hydraulic Heads in Dhaka City, Bangladesh" Water 13, no. 10: 1357. https://doi.org/10.3390/w13101357