
A Comprehensive Study of the Impact of Large-Scale Landscape Pattern Changes on the Watershed Ecosystem


1
Faculty of Resources and Environmental Science, Hubei University, Wuhan 430062, China
2
State Key Laboratory of Information Engineering in Surveying, Mapping and Remote Sensing, Wuhan University, Wuhan 430079, China
3
Environmental Monitoring Center Station of Hubei Province, Wuhan 430071, China
*
Author to whom correspondence should be addressed.
Water 2021, 13(10), 1361; https://doi.org/10.3390/w13101361
Submission received: 26 March 2021
/
Revised: 8 May 2021
/
Accepted: 10 May 2021
/
Published: 14 May 2021
(This article belongs to the Special Issue Water and the Ecosphere in the Anthropocene)
Abstract
:The South-to-North Water Diversion Project (SNWD) is the world’s largest inter-basin water diversion project, and the Danjiangkou Reservoir is a water source of the middle route project of the SNWD. Dynamic monitoring of ecological environment changes in Danjiangkou Water source area can provide theoretical support for reservoir water storage security and ecosystem protection. In this study, the water storage of Danjiangkou reservoir was estimated and its dynamic change was analyzed. On this basis, the changes of landscape pattern and ecosystem services value caused by the SNWD project were analyzed. The results show that the reservoir storage presented an obvious growth trend from 2000 to 2019, especially after the middle route of the SNWD was opened in 2014. After the implementation of the SNWD project, the vegetation degradation in Danjiangkou reservoir area was obvious, which is mainly related to the expansion of construction land. The ecosystem service value of the Danjiangkou Reservoir was mainly determined by the water conservation supply value and climate regulation value. After the implementation of the SNWD project, the values of water conservation and supply, climate regulation, and hydropower generation showed an increasing trend, while the values of fixing carbon and releasing oxygen, and organic matter production showed a decreasing trend.
1. Introduction
The available freshwater resources on the Earth are unevenly distributed in time and space due to differences in geographical locations and climate conditions. With the increase in population and the rapid development of the social economy, the demand for water in many areas is increasing, which aggravates the imbalance between the supply and demand of water resources. Indeed, recent studies have indicated that new infrastructure in urban areas may significantly accelerate the urban development and, consequently, the water demand [1]. Though some soft measures can help to cope with the increasing water demand [1,2], inevitably, large-scale projects are eventually required to leverage and support the urban development beyond a certain point.
The uneven distribution of water resources is a problem many countries are experiencing. Inter-basin water transfer is considered to be an effective way to solve the uneven distribution of water resources in time and space [3]. In these projects, water resources are transferred from one basin to another through human intervention so that water resources are redistributed according to human needs; these diversions can alleviate the contradiction between the supply and demand of water resources and realize the optimal allocation of water resources among basins. Therefore, many countries and regions have built inte-basin water transfer projects [4,5,6], and scientific management and allocation of water resources [7,8].
China’s South-to-North Water Diversion Project (SNWD) is the largest and most expensive inter-basin water transfer project worldwide. The project was implemented to solve the problem of the unbalanced distribution of water resources in China by transferring water resources from the Yangtze River to the Haihe, Huaihe, and Yellow River basins [9]. Three routes are planned for the SNWD: the east route, the middle route, and the west route. The operation of the middle route project started in December 2014, and it greatly alleviated the water shortage problem in northern China and brought large economic and ecological benefits to the water resource transfer area [10]. However, the construction of inter-basin water transfer projects changes the temporal and spatial distribution of water resources and the water regime, interferes with the natural hydrological cycle, and has a complex impact on the ecological environment of the water transfer area [11]. The results show that the heightening and impoundment of Danjiangkou Dam increased the reservoir capacity, and periodic artificial storage causes the reservoir capacity to fluctuate frequently [12]. The problems of permanent land occupation, water storage, and inundation and migration caused by the water diversion project have had an impact on the land-use pattern of the water source area and have affected the ecosystem function of the water diversion area [13,14]. Artificial water regulation causes frequent land and water alternation, promotes vegetation succession in the water level fluctuation area, reduces species diversity in the reservoir area, and affects the ecological balance [15,16]. However, some studies have shown that to protect the water quality of the core water source area, several ecological protection measures have been implemented upstream of the Danjiangkou Reservoir, and these measure have significantly increased the regional vegetation coverage and improved the ecological environment [17]. Therefore, focusing on the temporal and spatial changes in water resources, land cover and ecological effects in the lower Danjiangkou Reservoir area is of great value to the safety and scientific water transfer of the middle route project.
At present, in the assessment of the ecological environment change in the Danjiangkou Reservoir area under the water transfer project, many scholars have conducted research from the following aspects: research was conducted regarding the impact of the water transfer project on the water environment through an analysis of the dynamic change in the water volume in the Danjiangkou Reservoir area [18,19]; the impact of the water diversion project on the regional ecological environment was analyzed based on the land cover change in the Danjiangkou Reservoir area [13]; market value theory was used to calculate the ecological value of the water diversion project in different periods, and the ecological benefits brought by the water diversion project were evaluated [20,21]; and the impact of periodic dam impoundment on aquatic ecosystem and biodiversity in the basin was investigated [20]. These results provide ideas and a foundation for further study of the ecological environmental changes in the Danjiangkou Reservoir area. Based on the water supply of the middle route project in 2014, the scientific identification of the ecological environment change characteristics and the response law of the water source area before and after water diversion must be comprehensively analyzed [22,23]. However, the impact of the water transfer project on the ecological environment of Danjiangkou has been mostly based on scenario assumptions and prejudgments under planning conditions, and research on the current actual water transfer conditions has been limited. Additionally, the long-term mechanism of ecological compensation in the core water source area of Danjiangkou has not been established, and the contradiction between its ecological contribution and ecological compensation is becoming increasingly prominent. Currently, research on the value of the reservoir ecosystem services mostly draws lessons from the lake basin evaluation method, constructs the value system of reservoir ecosystem services, and quantitatively evaluates the change in the Danjiangkou Reservoir ecosystem service value in two ways to improve the incentive system of ecological environment protection and basin ecological compensation mechanisms. Therefore, this study takes Danjiangkou Reservoir and its Hanjiang River basin as the research object, calculates and analyzes the spatiotemporal dynamic changes in the landscape pattern before and after water diversion, discusses the change law of the watershed ecological environment under the effect of the water diversion project, constructs an evaluation system of the reservoir ecosystem service value, and quantitatively analyzes the effect of the water diversion project on the watershed ecosystem.
2. Study Area and Data
2.1. Study Area
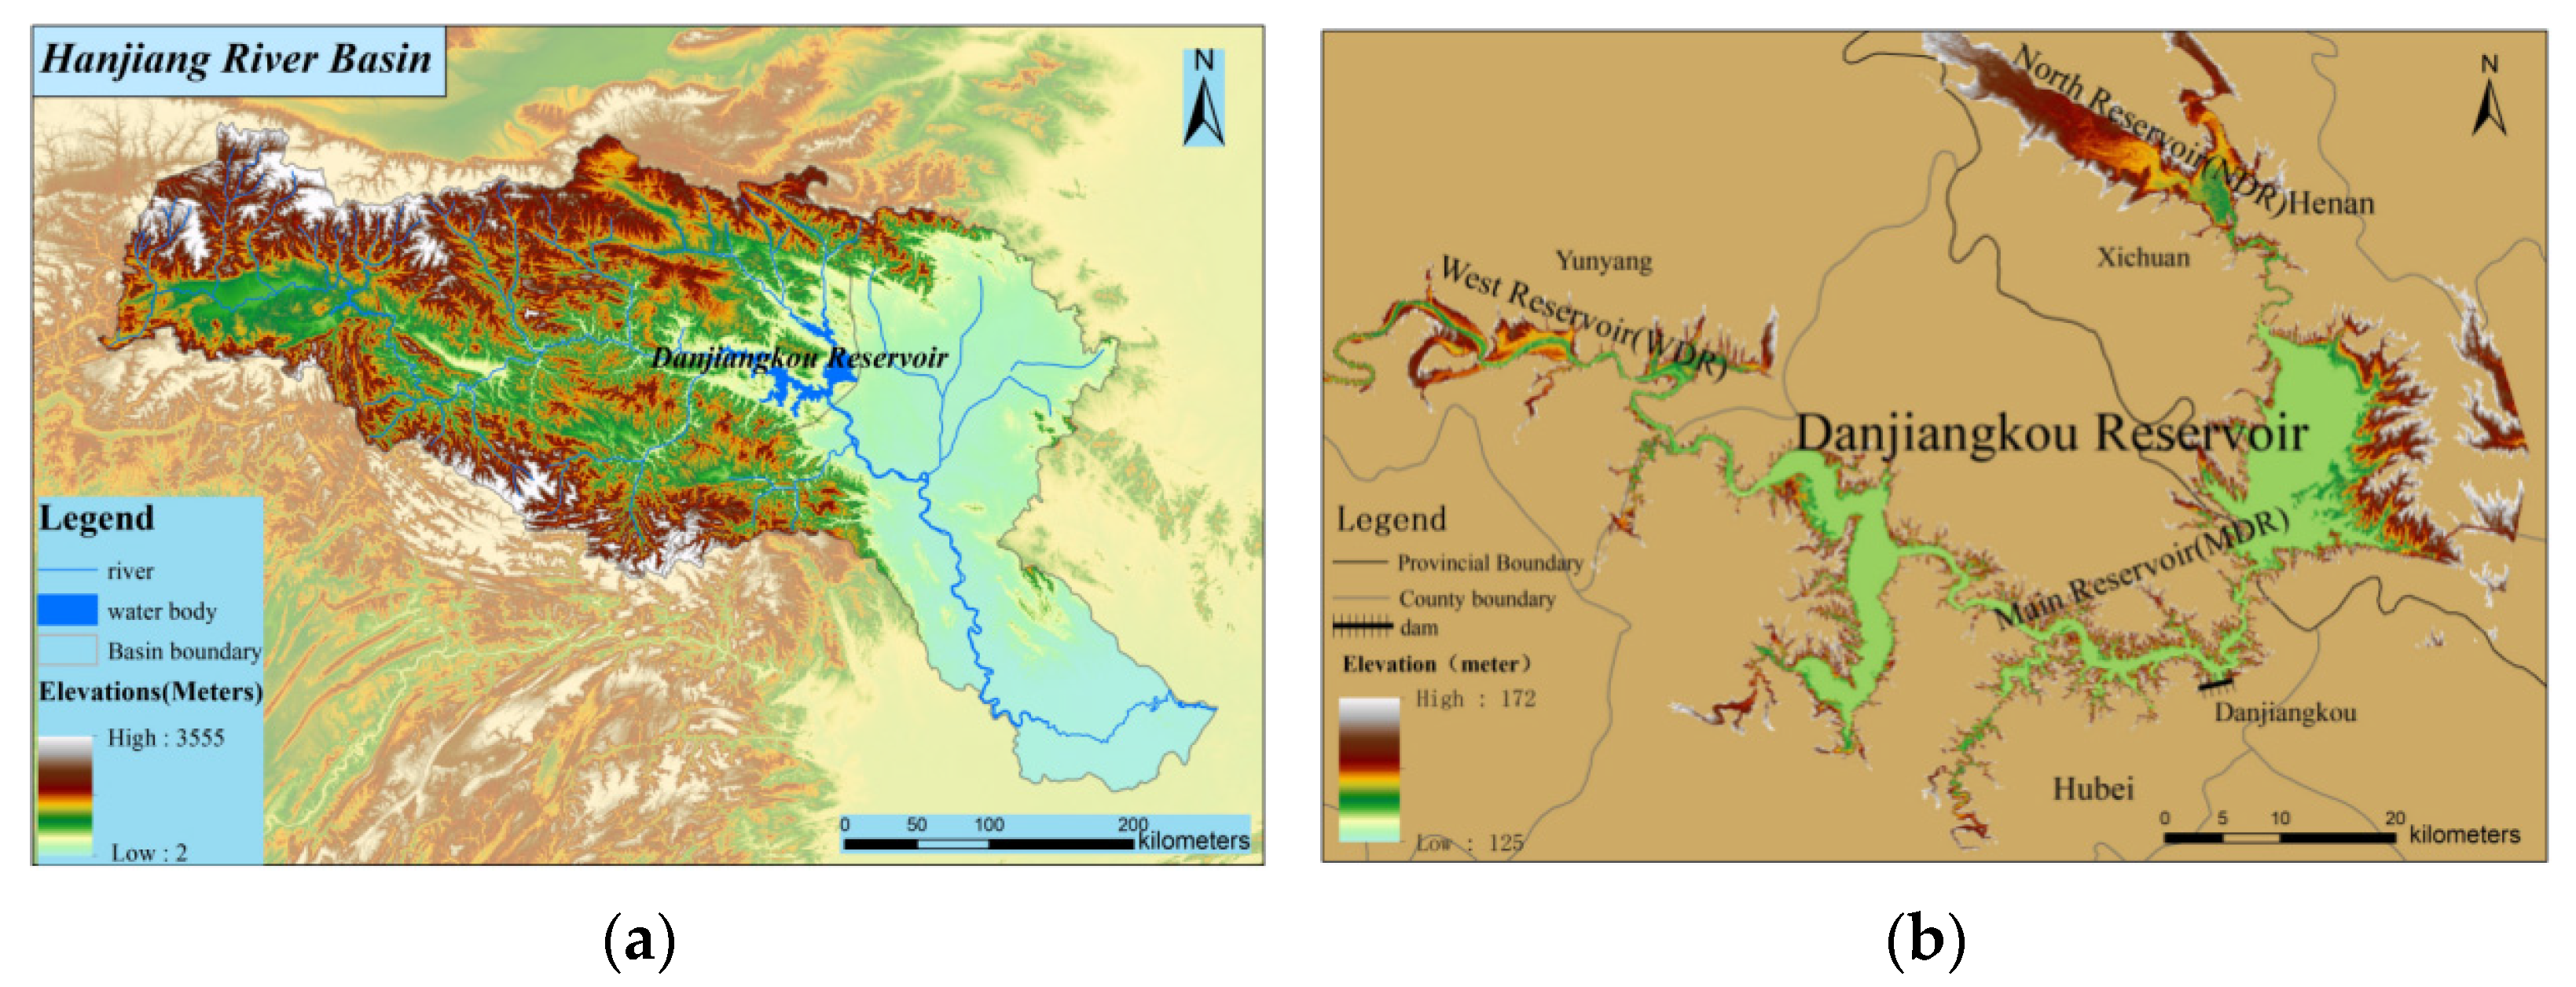
The Danjiangkou Reservoir (32°36′–33°48′ N; 110°59′–111°49′ E) is the core water source area of the middle route project of the SNWD in China (Figure 1). It is a large-scale water control project that was built in China to enhance the comprehensive development and management of the Hanjiang River basin. The project is divided into two phases. The initial project was completed in 1973, with a water area of 727.9 km2 and a coastline of 1750 km under normal water level. Then, the dam heightening project was completed in 2013, with a water area of 1059.6 km2 and a coastline of 2167 km. The average annual water area of the reservoir is 480.38 km2, and the average inflow is 39.48 billion cubic meters per year, of which approximately 90% comes from the Hanjiang River and 10% from the Danjiang River.
The Hanjiang River, upon which the Danjiangkou Reservoir is located, is the largest tributary of the Yangtze River, with a total length of 1532 km and a drainage area of approximately 1.507 × 10⁵ square kilometers. The Hanjiang River basin belongs to the East Asia subtropical monsoon climate zone, with four distinct seasons; it has a mild and humid climate, abundant water, an annual average temperature of 15–16.5 °C, and an annual average precipitation amount of 700–1300 mm.
2.2. Data
The data used in this study included remote sensing image data, land-use data, meteorological station data, and statistical data; the data list is shown in Table 1.
2.3. Methods
2.3.1. Land-Use Change
The land-use transfer matrix is the main method used to quantitatively study the area change in different land-use types and reveal the mutual conversion between various types of land use. It can reflect the structural characteristics and change direction of land-use types in a study area with data [24]. The specific calculation formula is as follows:
where i and j represent the land-use types of the Hanjiang River basin in 2000 and 2020, respectively; n represents the total number of land-use types; and sij is the total area transformed from class i to class j in the study period.
2.3.2. Water Storage Estimation Model
The normalized difference water index (NDWI) can partly eliminate the influence of the solar elevation angle, sensor angle, and atmospheric condition, and it can also be used to extract water information and accurately capture the change characteristics of large-scale water in a long time series. We used the NDWI to extract the water range.
The basic idea of the reservoir storage calculation process is to differentiate the entire reservoir into a finite number of regular quadrangular prisms with the same floor space and different lateral edge lengths in a direction perpendicular to the water surface. The length of the lateral edge is the elevation difference between the top and the bottom in the vertical direction. The volume of the regular quadrangular prism is the product of the lateral edge lengths and the floor space. Then, according to the principle of integration, the reservoir storage is equal to the sum of all differential regular quadrangular prism volumes [25]. The calculation formula for reservoir storage can be described as follows:
where V represents the reservoir storage, S represents the floor space of the regular quadrangular prism, and Hαβj represents the length of the regular quadrangular prism in the digital elevation model (DEM) pixel unit (α,β).
In the calculation process of the Danjiangkou Reservoir capacity, SRTM DEM UTM data from February 2000 were selected to simulate the bottom elevation of the reservoir (the water level at this time was 134 m, which was close to the lowest water level in history).
2.3.3. Temporal and Spatial Changes in the NDVI
In this paper, the slope of the least squares method (OLS) was used to establish the linear regression relationship between year (i) and the normalized difference vegetation index (NDVI) (Xi). The average annual NDVI change in the Hanjiang River basin before and after water diversion was analyzed. The slope formula of the OLS curve is as follows:
where the θslope represents the change slope of variable Xi, i represents the year, Xi represents the NDVI value of the corresponding year in year i, and n is the study period. When θslop > 0, the NDVI shows an increasing trend, and when θslop < 0, the NDVI shows a decreasing trend.
2.3.4. Ecosystem Service Value Estimation
Ecosystem services refer to the natural environmental conditions and effects that human beings rely on to survive and sustain and all the benefits that humans receive directly or indirectly from ecosystems [26]. At present, the classification system of the Millennium Ecosystem Assessment project (MA) is the most influential in the study of ecosystem services classification [27].
In this paper, the classification of ecosystem services is based on the classification method of the MA. According to the characteristics of ecosystem services provided by the reservoir, the ecosystem service values of organic production [28], fixing carbon and releasing oxygen [29], climate regulation [30], water storage, conservation and supply [30], and hydropower generation [31] were estimated. The calculation methods of the different ecosystem service values are shown in Table 2.
3. Results
3.1. Landscape Pattern Change
3.1.1. Land-Use Change
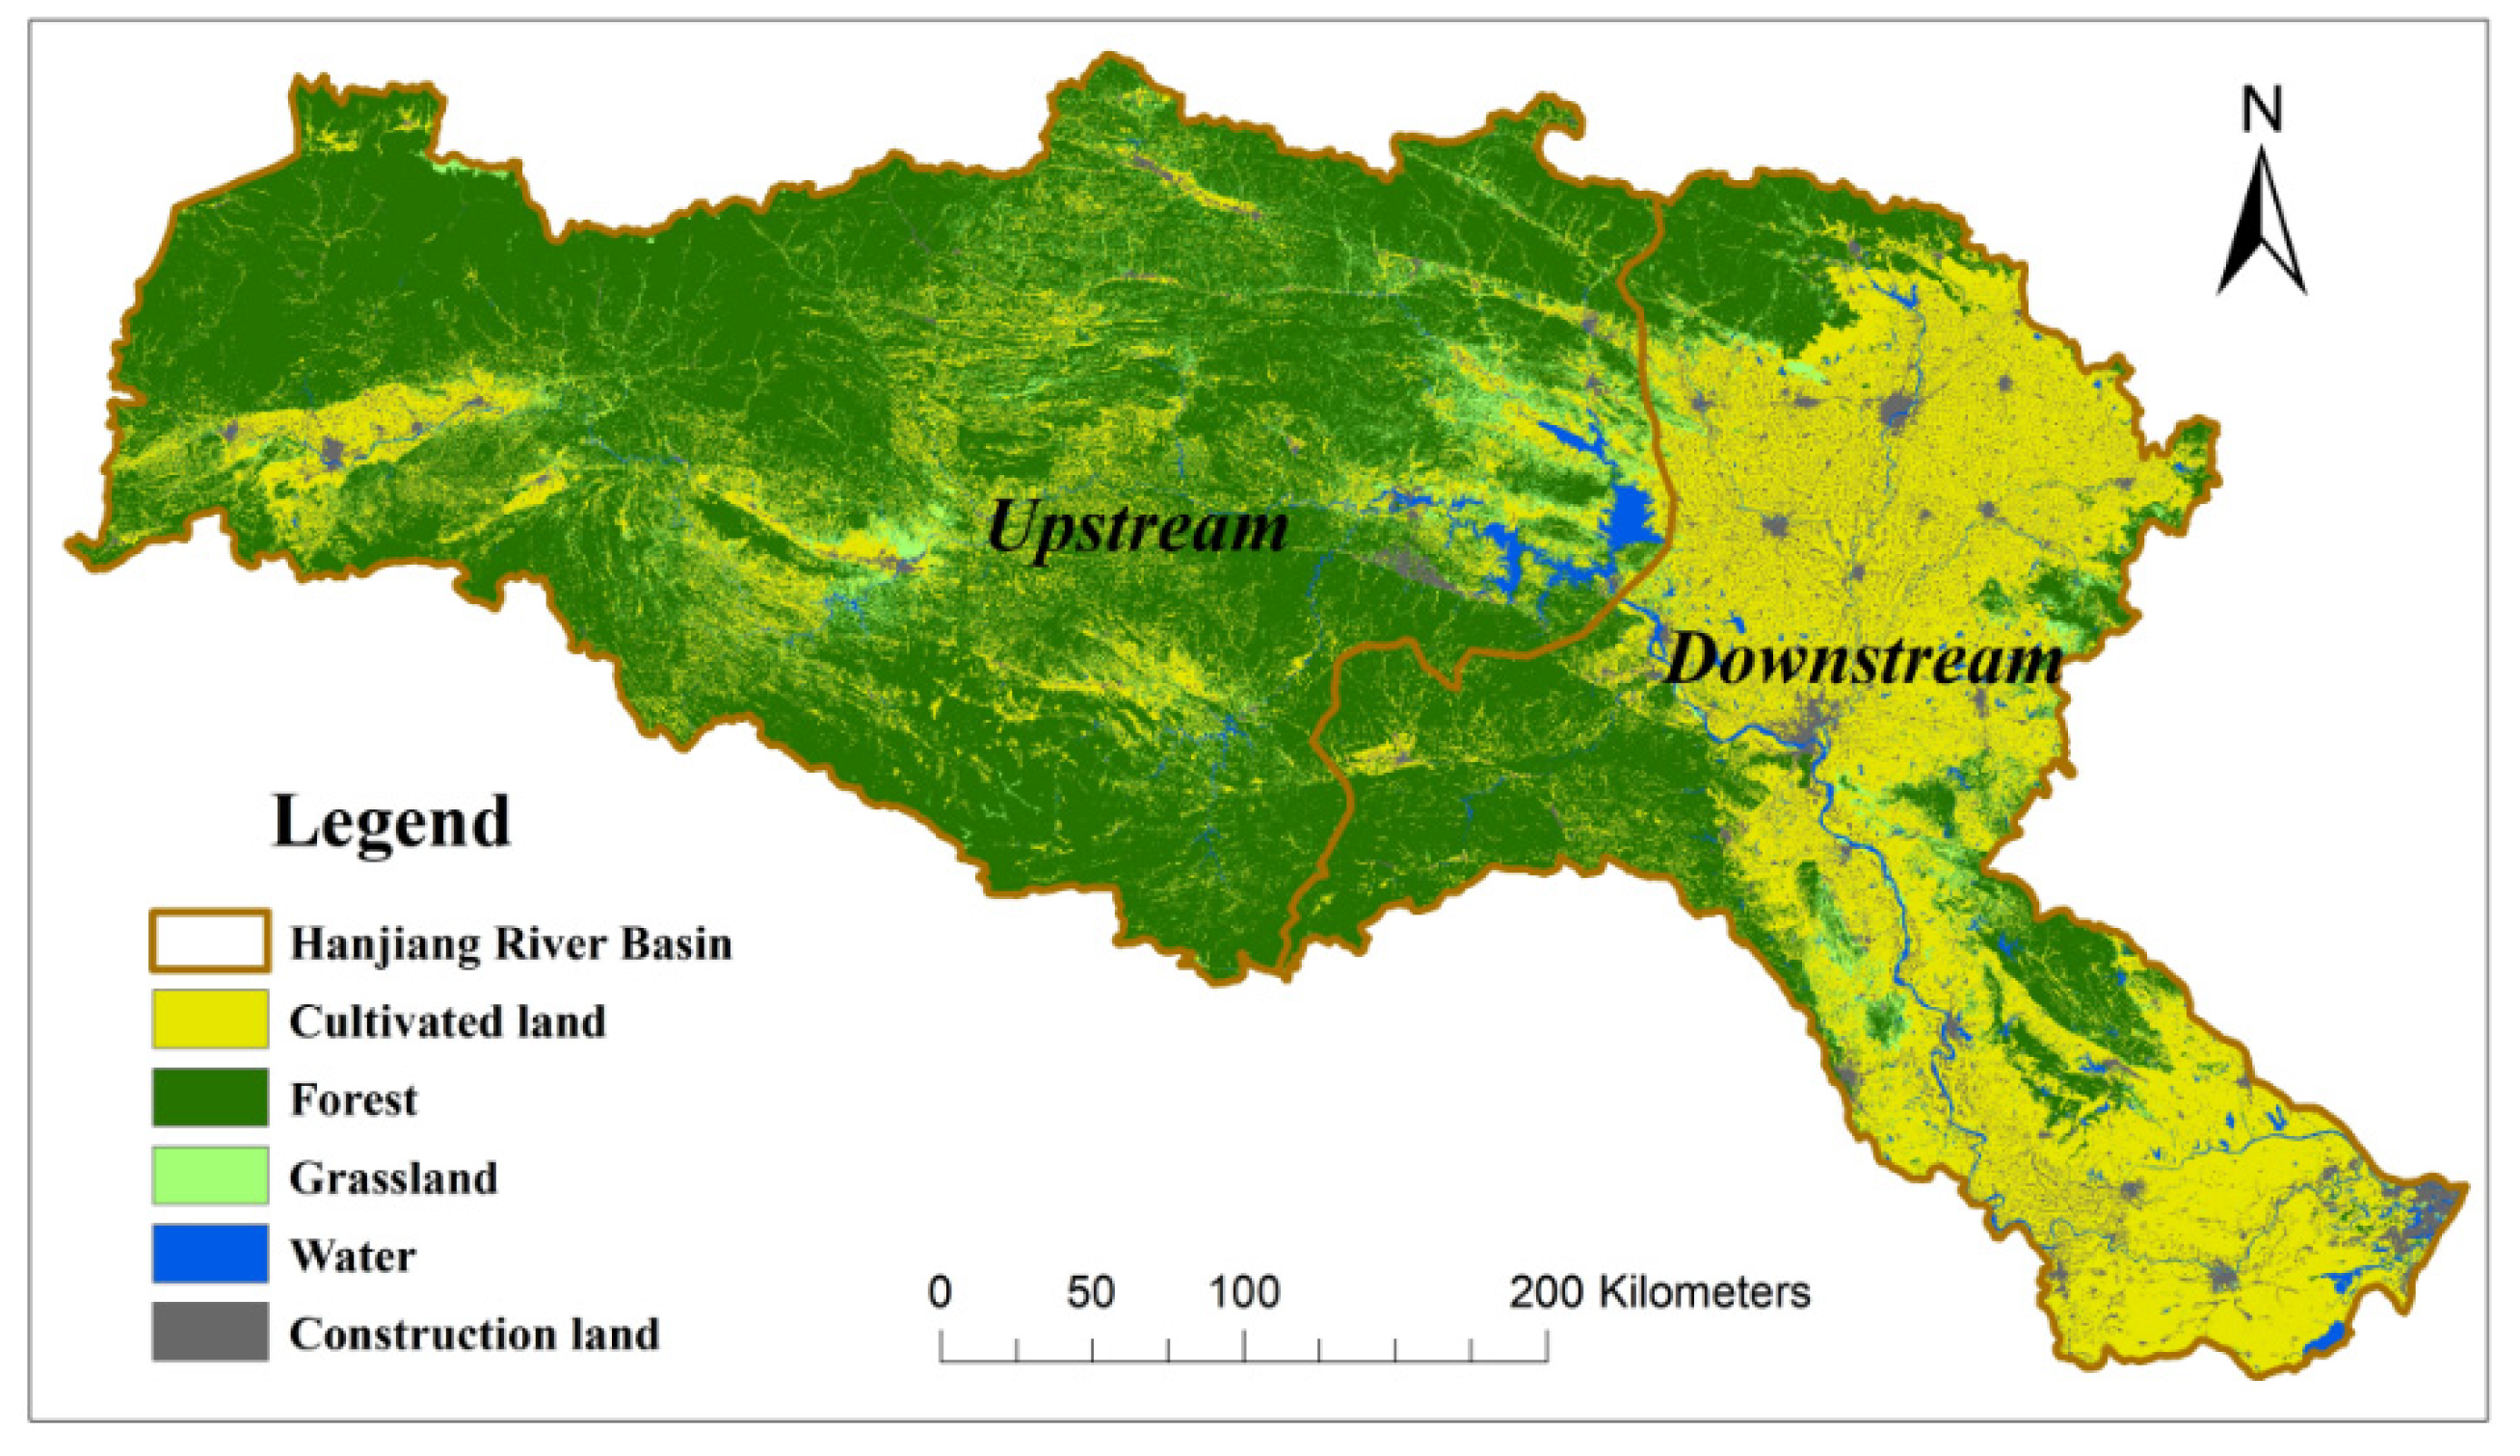
Figure 2 shows the spatial distribution of land use in the Hanjiang River basin in 2020. The land use in the upstream was mainly forest and cultivated land, while that in the downstream was mainly cultivated land and construction land. The cultivated land in the upstream was mainly distributed on both sides of the river, and the forest land was mainly distributed in the high altitude. The cultivated land in the downstream was mainly distributed in the Nanyang Basin and Jianghan Plain, and the construction land was mainly distributed around the central cities.
Table 3 shows the land-use change from 2000 to 2020. The land-use changes in the Hanjiang River basin were as follows: cultivated land, grassland, and forest decreased; water and construction land increased. Cultivated land, forest, and grassland decreased by 1331.82 km2, 36.2 km2, and 1969.63 km2, respectively, while water, construction land and unused land increased by 132.15 km2 and 3205.5 km2, respectively. The land-use type with the largest area change was construction land, followed by grassland and cultivated land. The increase in construction land area mainly came from cultivated land, forest, and grassland. The decrease in cultivated land area was mainly converted into construction land. The decrease in grassland area was mainly converted to forest.
Therefore, the transformation of land use from 2000 to 2020 was as follows: construction land encroached on cultivated land, forest and grassland, and grassland transformed into forest.
3.1.2. Water Area Change
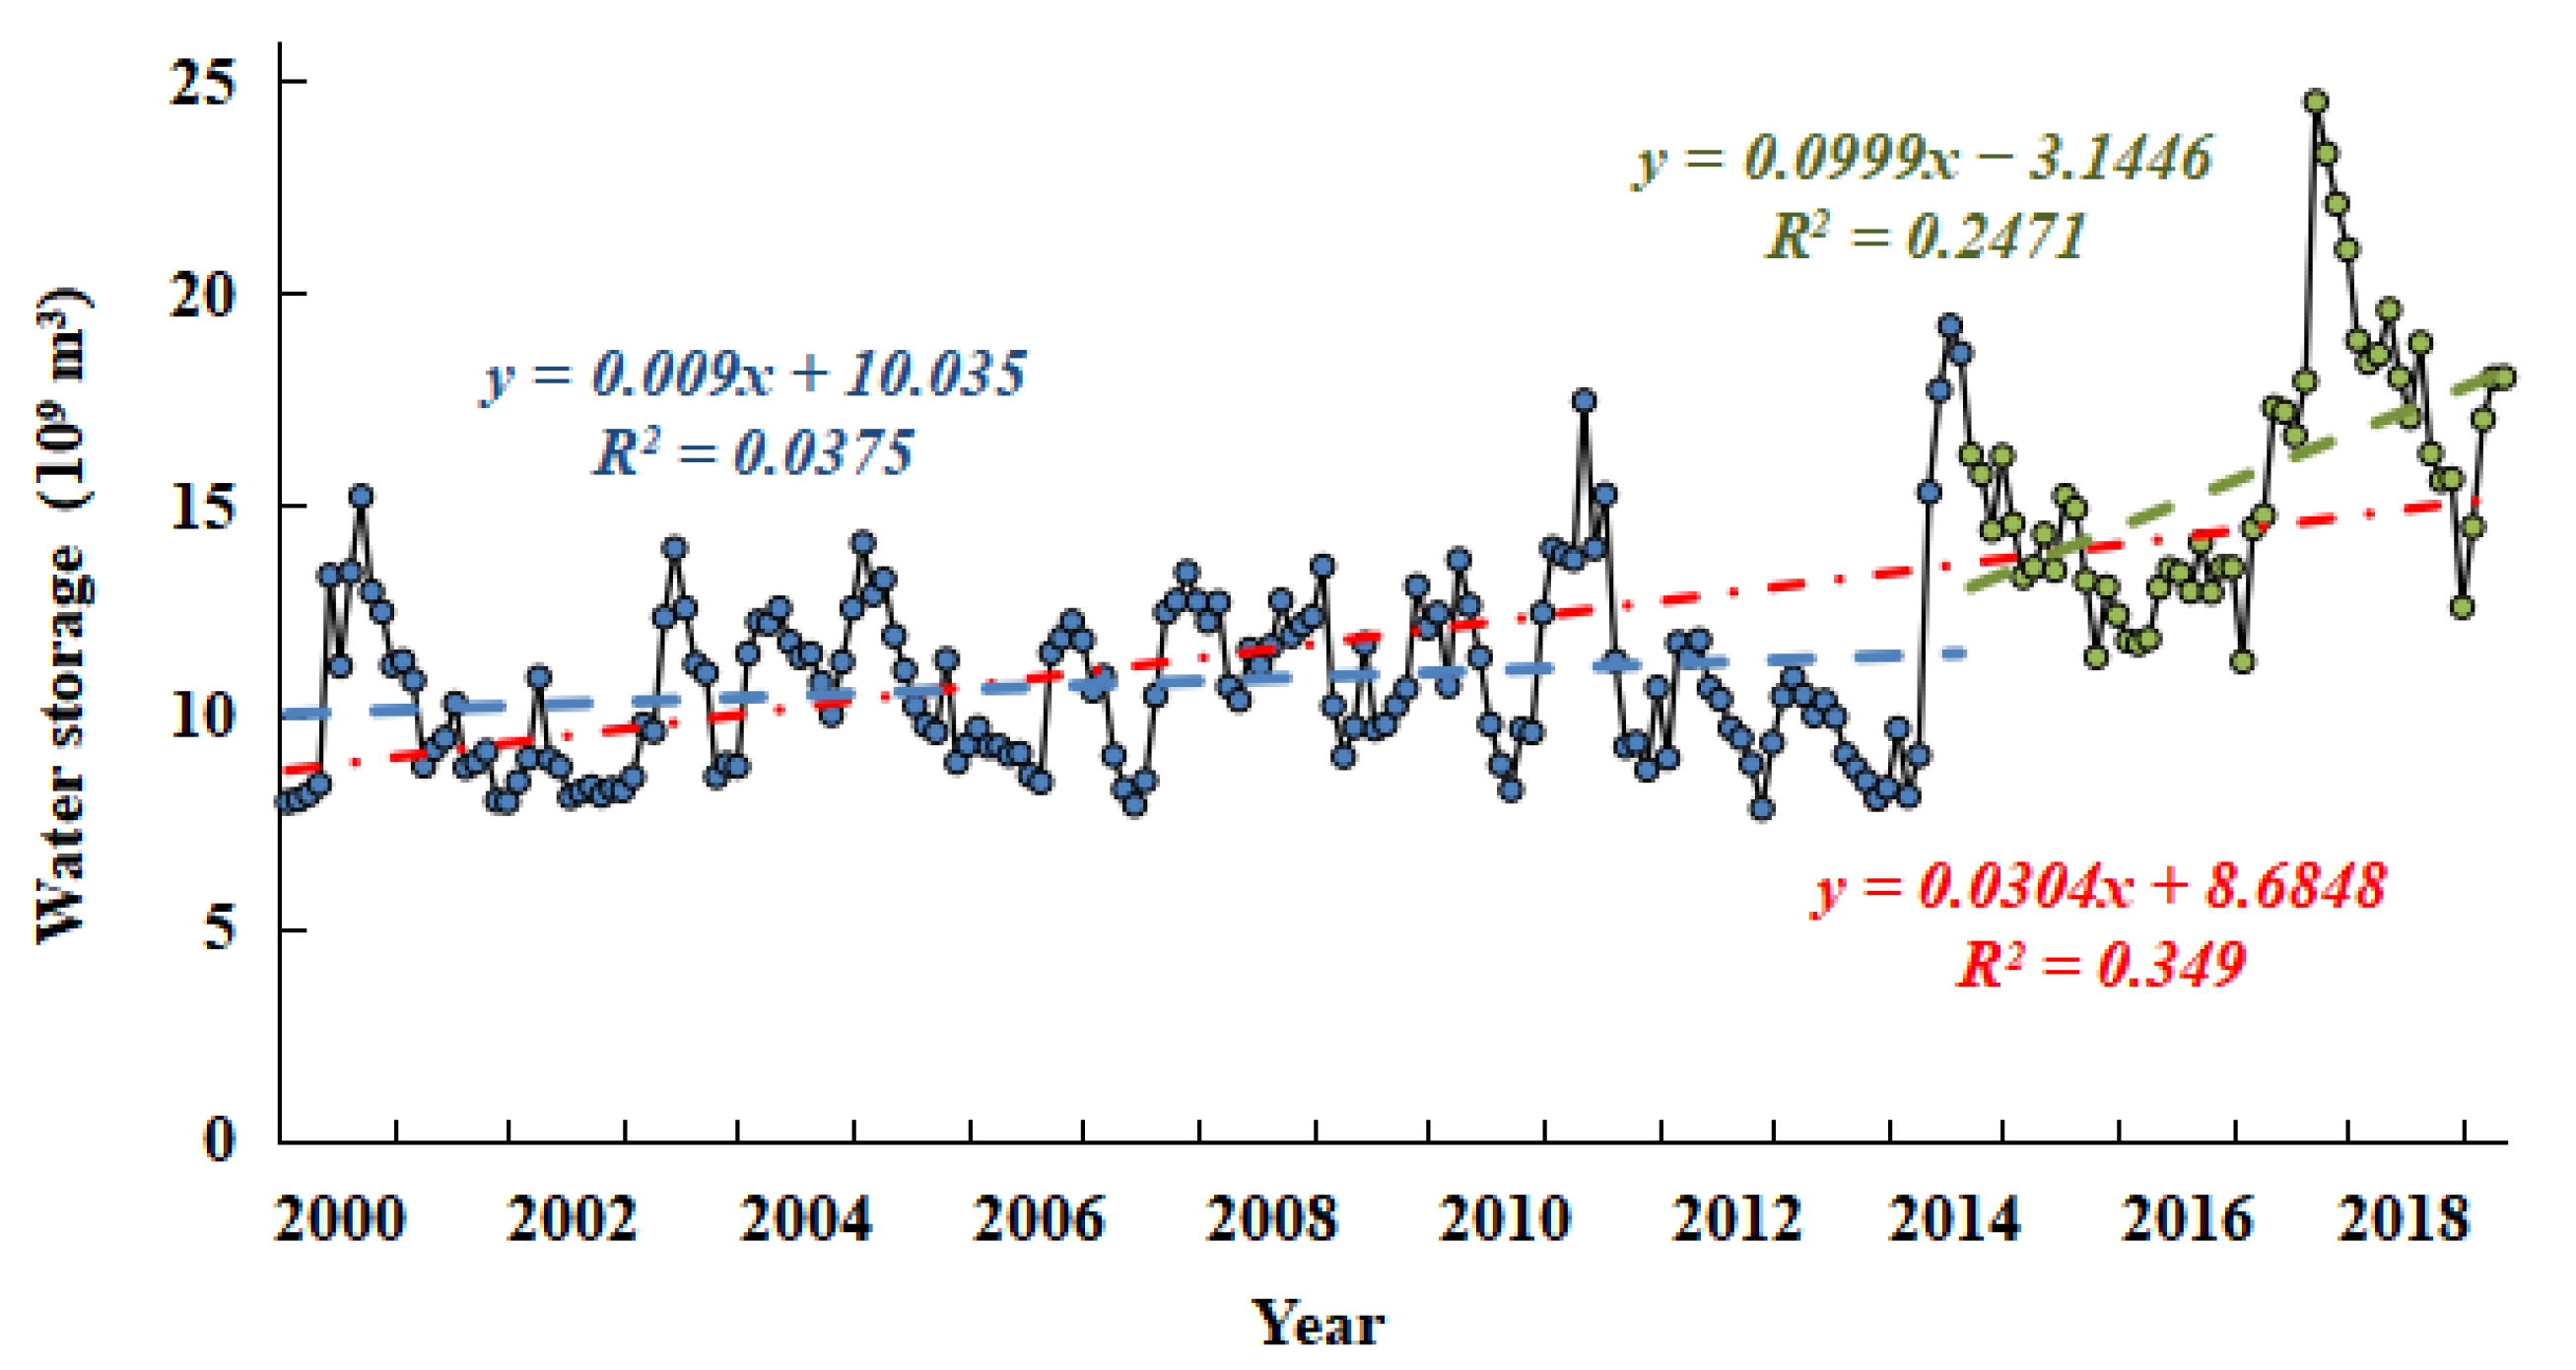
The monthly average storage of the Danjiangkou Reservoir from 2000 to 2019 was composed of a time series (Figure 3), and the change characteristics and trend of the reservoir storage were analyzed. The reservoir storage fluctuated in the range of 6–26 × 109 cubic meters for a long time, with an average value of 1.18 × 10¹⁰ cubic meters. However, the standard deviation of the monthly average reservoir storage was 2.3 × 10⁹ cubic meters, which was 21.93% of the average reservoir storage for many years. This result showed that the reservoir storage was relatively stable between months. Under climate conditions and artificial storage, the reservoir storage is unlikely to increase or decrease sharply.
Based on the variation trend and fitting curve of the monthly average reservoir storage, the reservoir storage fluctuated in the range of 6–20 × 109 cubic meters with an average of 1 × 10¹⁰ cubic meters before the water diversion project. After the water diversion project, the reservoir storage fluctuated in the range of 1–2.6 × 10¹⁰ cubic meters with an average of 1.6 × 10¹⁰ cubic meters, the reservoir storage showed a significant increasing trend, and the seasonal fluctuation of reservoir storage was enhanced.
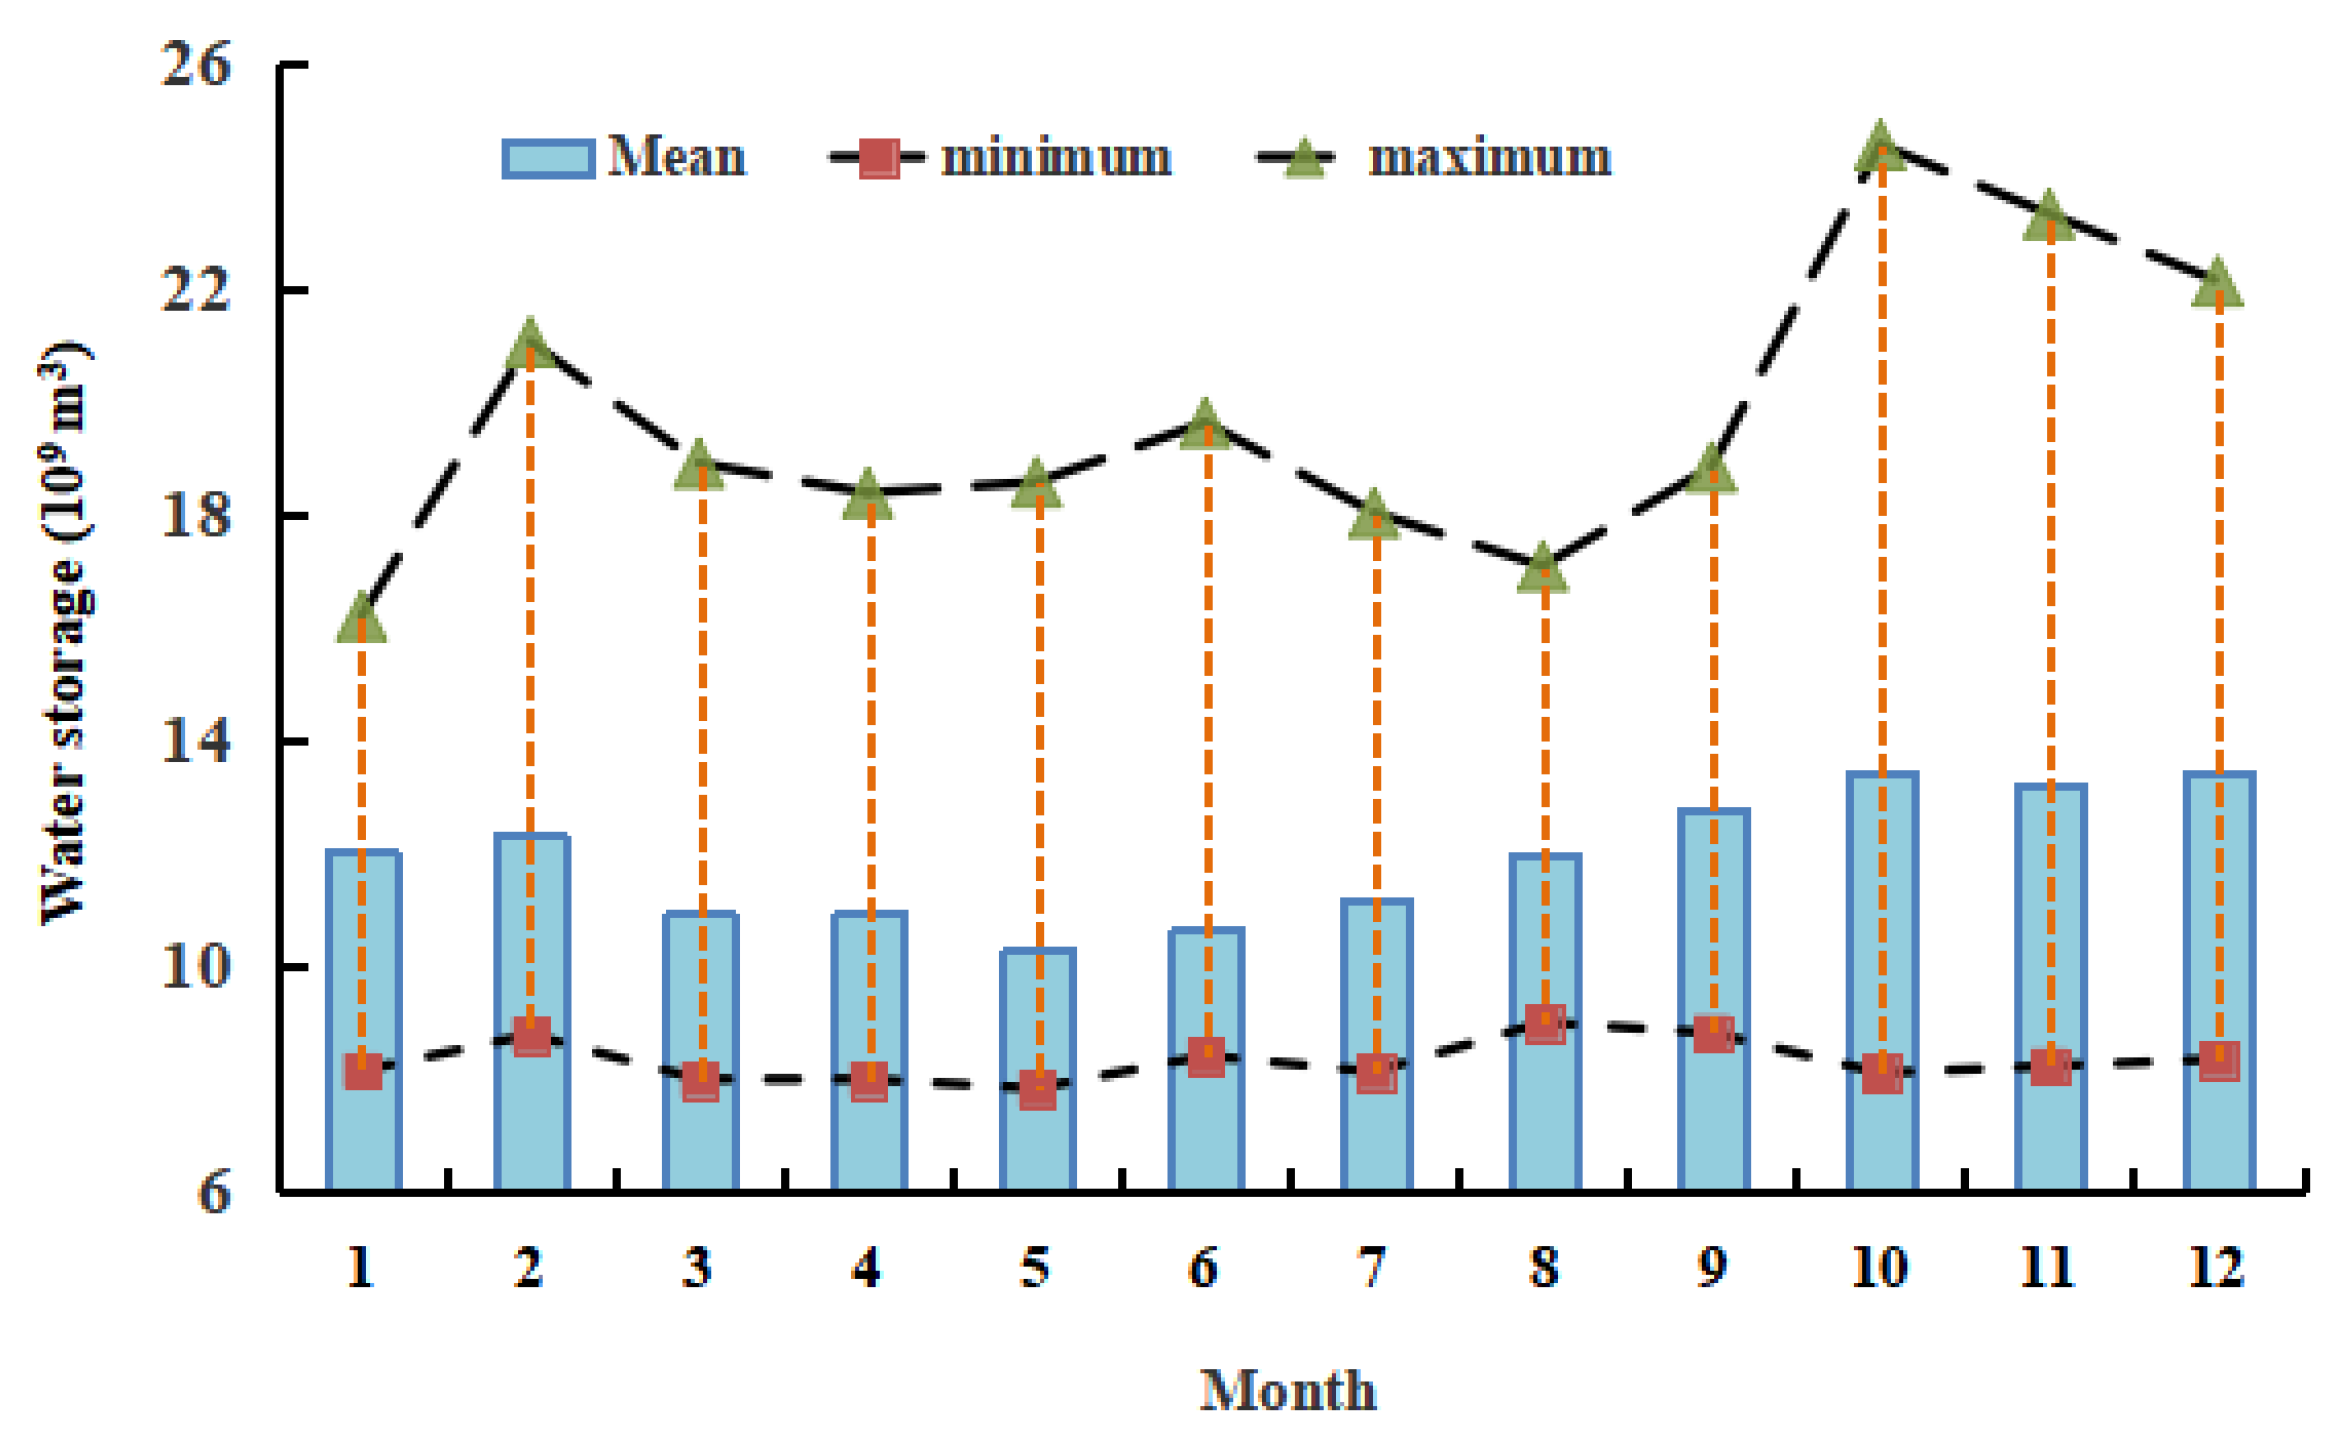
Figure 4 shows the monthly average reservoir storage change for many years. From October to December, the maximum monthly reservoir storage was more than 2.2 × 10¹⁰ cubic meters, and the values in other months were equal or less than 2.2 × 10¹⁰ cubic meters. The reservoir storage reached 2.2 × 10¹⁰ cubic meters a total of 17 times, the frequency of reaching this reservoir storage in each month was as follows: 2 in September, 5 in October, 4 in November, 4 in December, and 2 in January, which shows that the maximum reservoir storage appeared most frequently from October to December. The minimum monthly reservoir storage had no obvious fluctuation, with a value range of 7.9–9 × 10⁹ cubic meters. The average monthly reservoir storage showed a trend of first decreasing and then increasing. It gradually decreased from January to May and increased significantly from June to October, reaching a maximum reservoir storage of 1.34 × 10¹⁰ cubic meters at a rate of 7.08 × 10⁸ cubic meters per month; finally, the value remained unchanged from October to December. The correlation coefficient between the monthly maximum reservoir storage and the monthly average reservoir storage was 0.85.
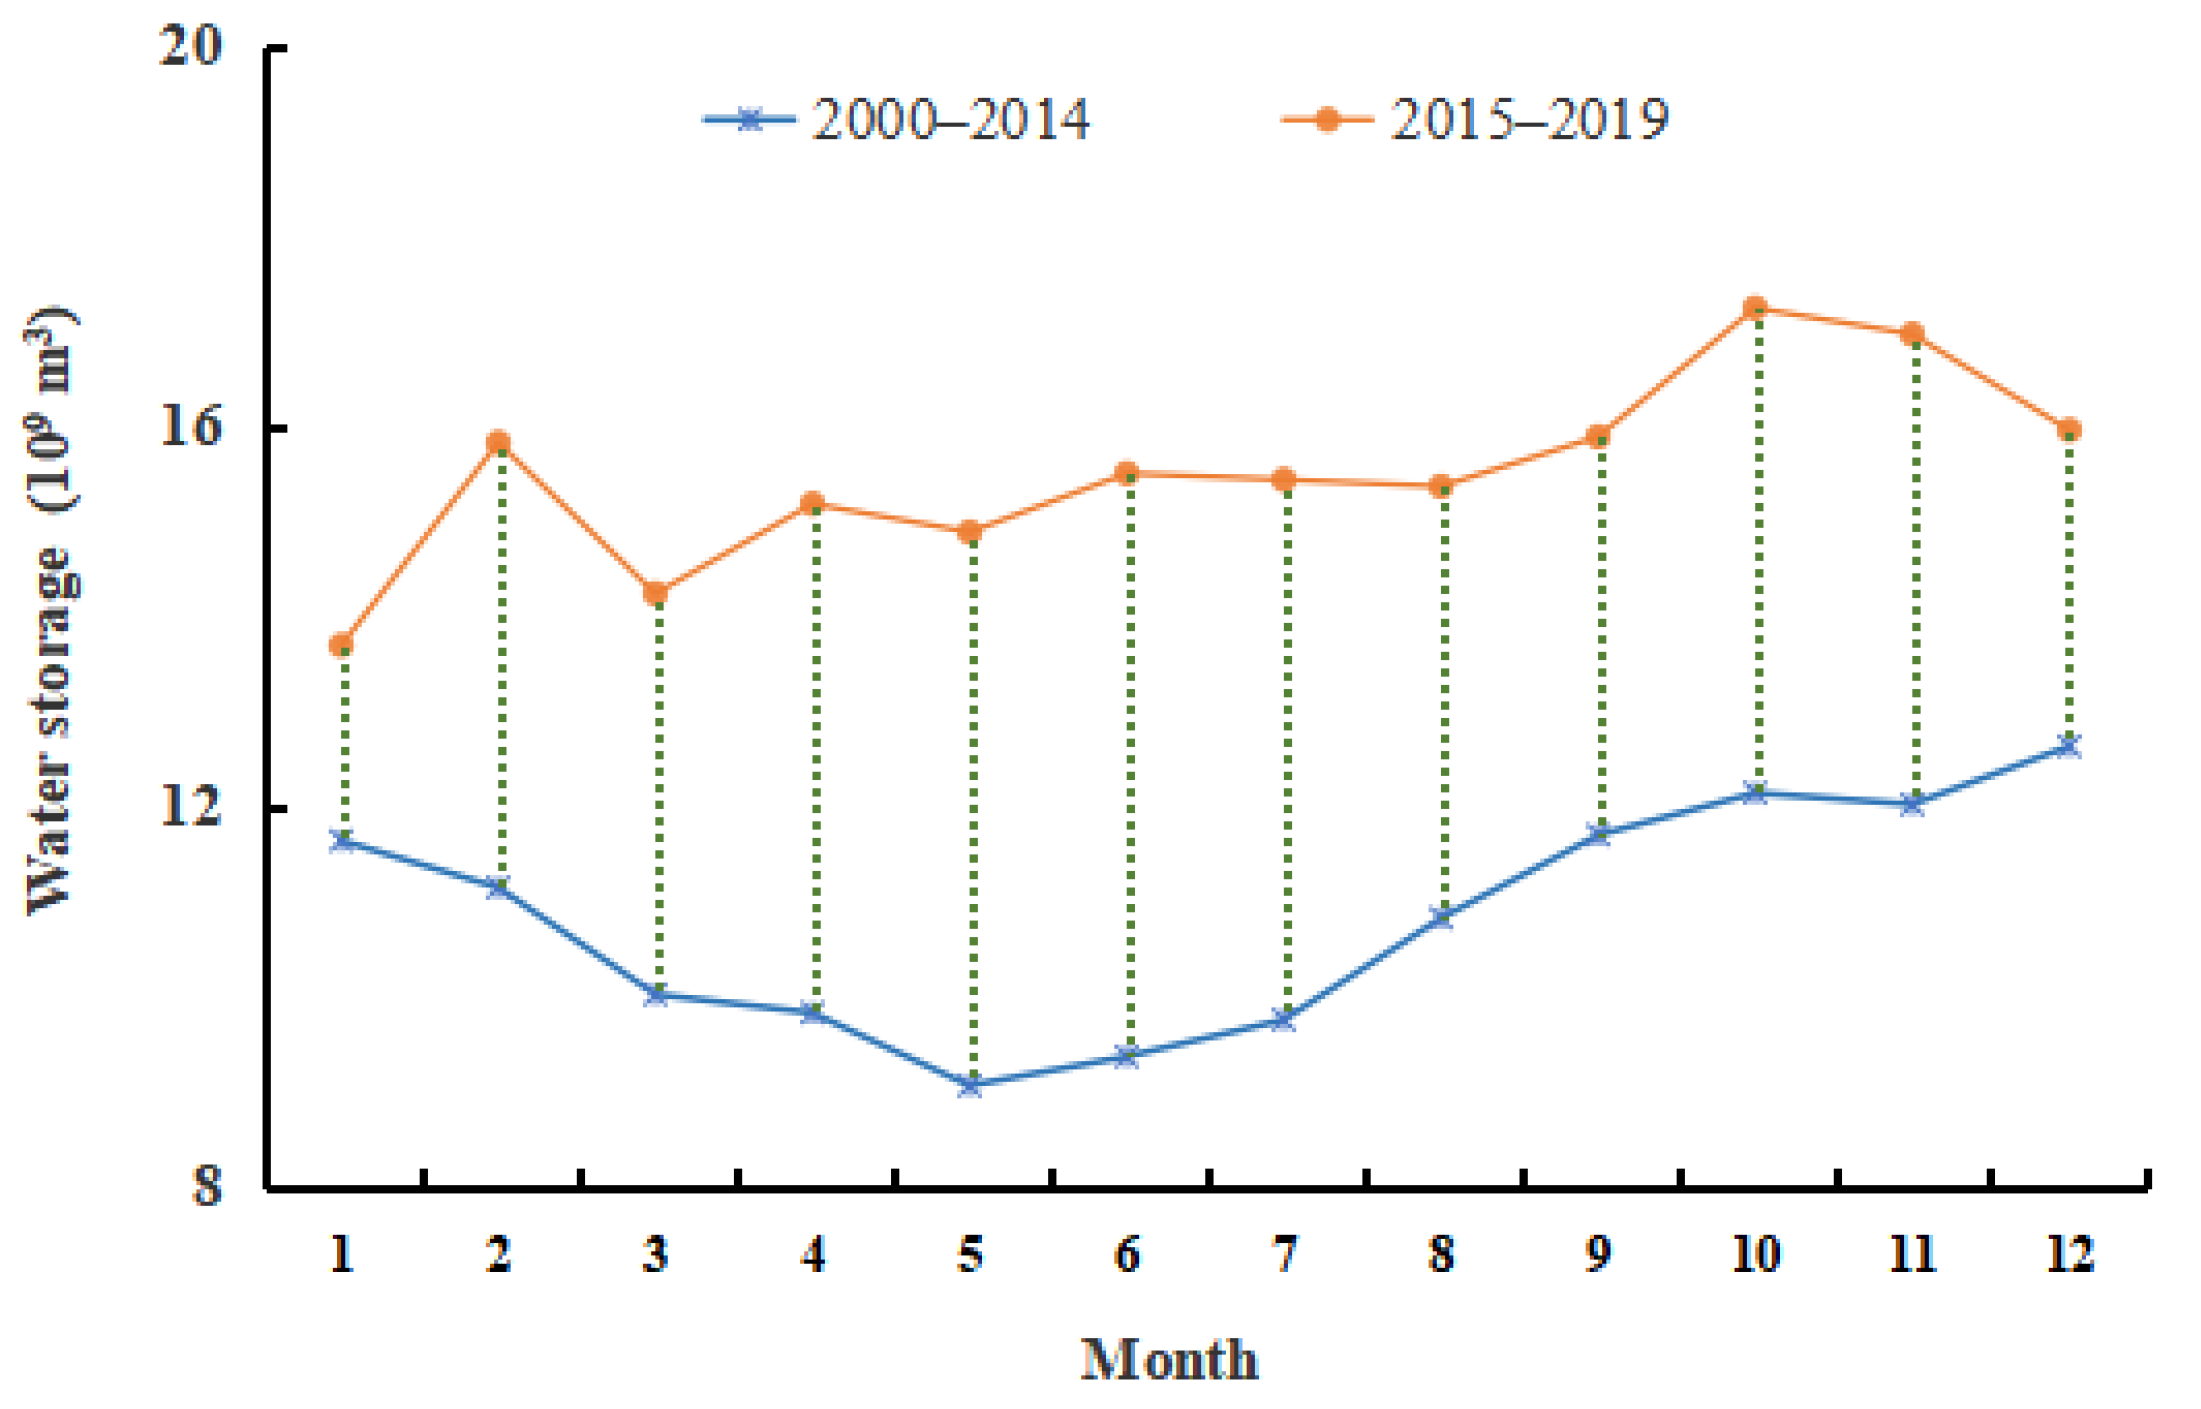
Figure 5 shows the change in the average monthly reservoir storage before and after water diversion. The figure shows that the average monthly reservoir storage before water diversion was 9–13 × 109 cubic meters, showing a trend of first decreasing and then increasing, specifically, the reservoir storage showed a decreasing trend from January to May and an obvious increasing trend from May to December. After water diversion, the average monthly reservoir storage ranged from 1.3 × 10¹⁰ cubic meters to 1.8 × 10¹⁰ cubic meters, which was approximately 1.44 times that before water diversion. In the trend, the seasonal fluctuation was small, the fluctuation increased from January to October and decreased from October to December. The monthly average reservoir storage increased significantly after the water diversion project, the monthly variation trend different from that before the water diversion project; additionally, the reservoir storage increased significantly in the dry season.
3.1.3. NDVI Changes
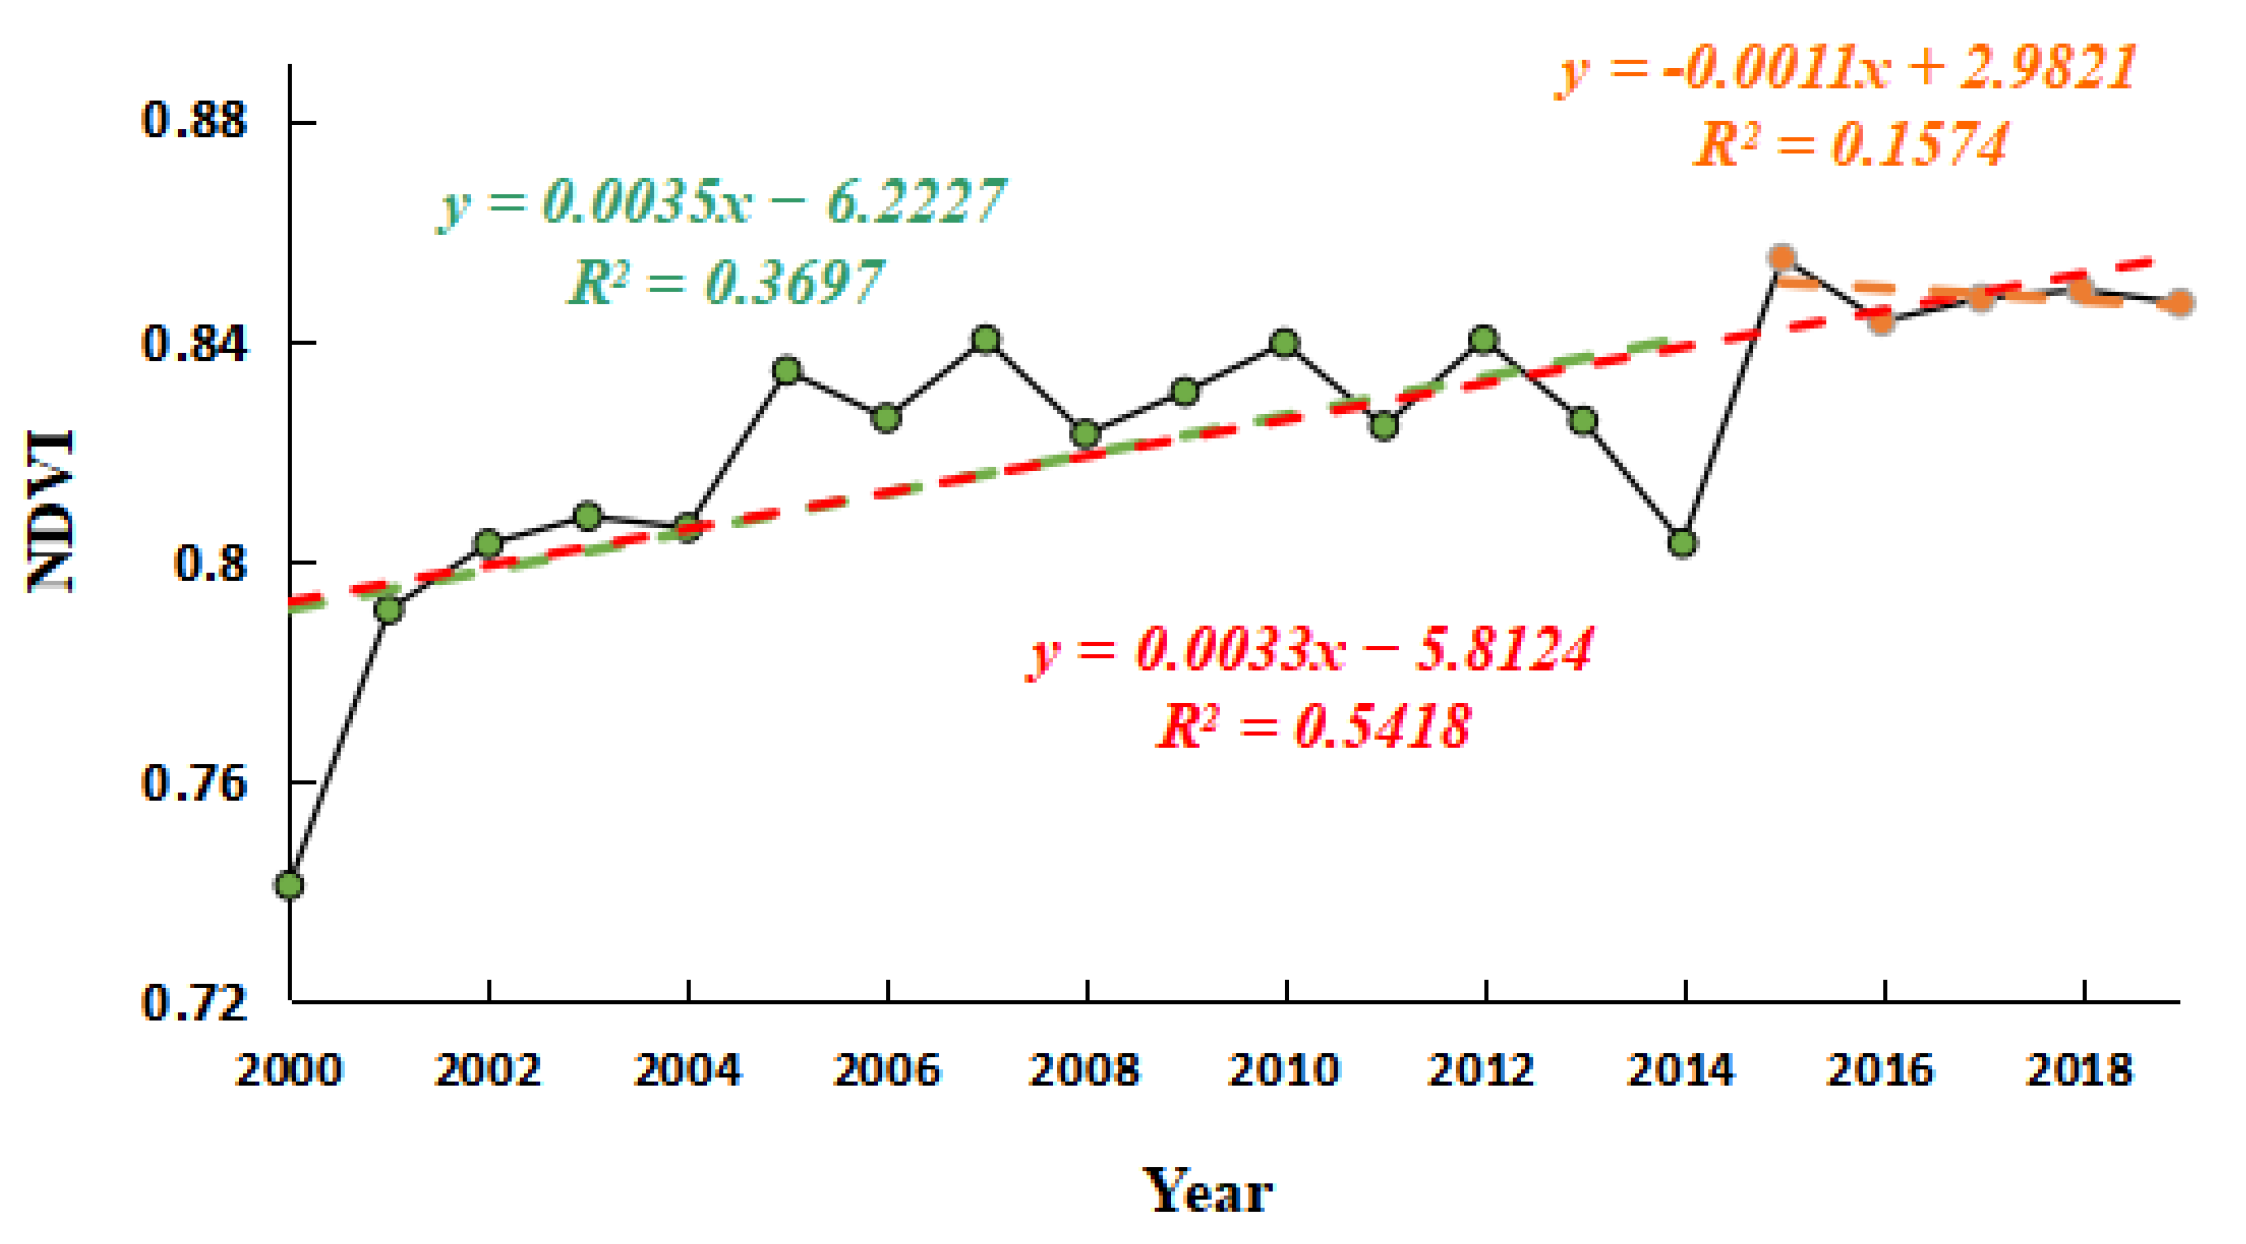
The NDVI in the study period was selected to monitor the change in vegetation cover (Figure 6). From 2000 to 2019, the average annual NDVI of the Hanjiang River basin showed an increasing trend, with a growth rate of 3.3 × 10⁻⁵/year. The minimum annual NDVI value appeared in 2000 (NDVI = 0.74), and the maximum value appeared in 2015 (NDVI = 0.85). The increasing NDVI trend was obvious from 2000 to 2007, and the change trend was gentle from 2008 to 2019. However, the NDVI decreased significantly from 2012 to 2014.
Before the water diversion project, the average annual NDVI value in the Hanjiang River basin was 0.82, and the change rate was 3.5 × 10⁻⁵/year. After the water diversion project, the average annual NDVI value in the Hanjiang River basin was 0.85, and the change rate was −1.1 × 10⁻⁵/year. After the water diversion project, the NDVI showed a trend of degradation.
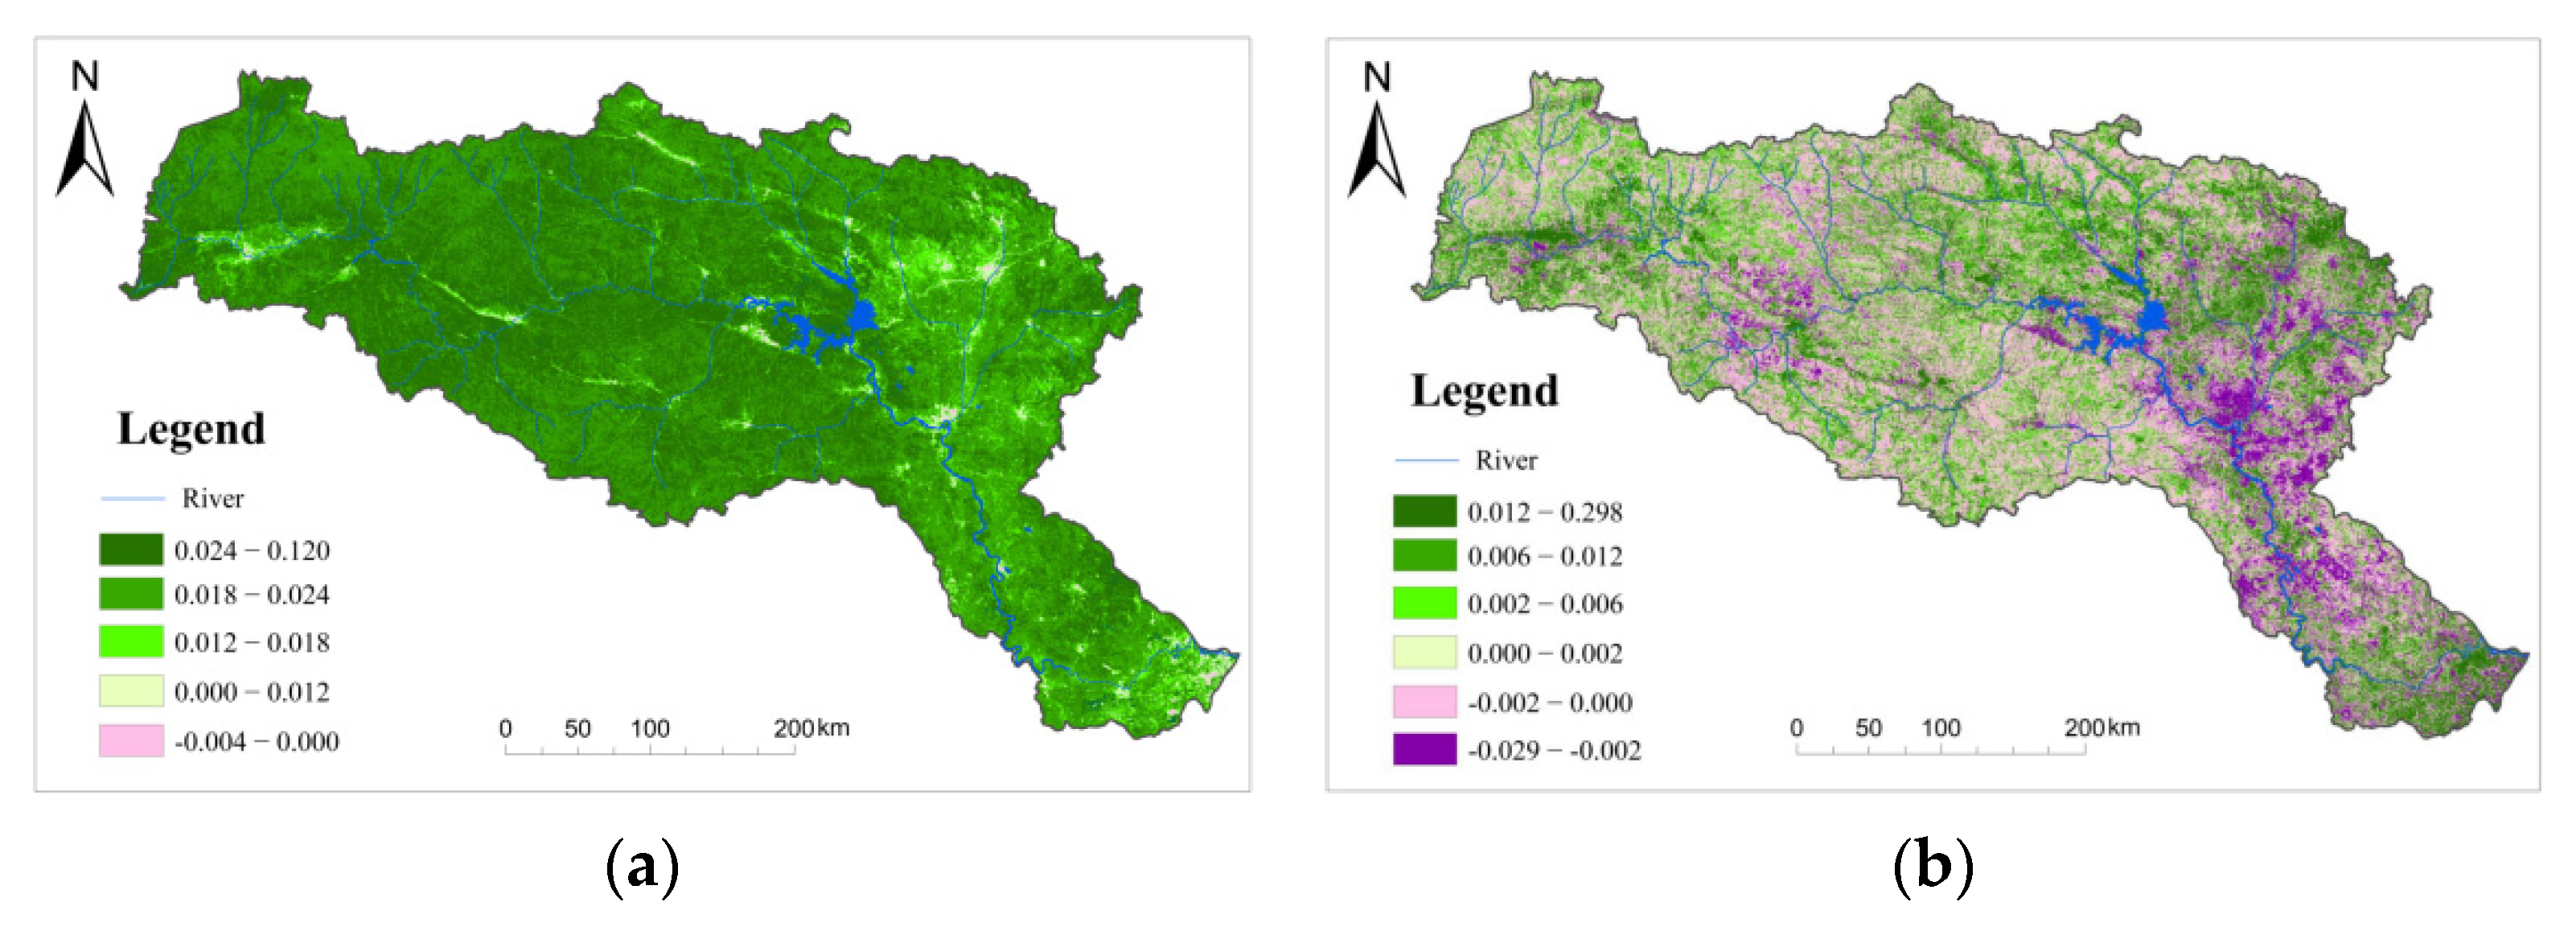
The NDVI changes in the Hanjiang River basin before and after water transfer showed obvious spatial heterogeneity (Figure 7). From 2000 to 2019, the average annual NDVI increased by 75.88% and decreased by 24.12%. From 2000 to 2014, the NDVI showed an increasing trend, with 99.21% of the pixels showing an increasing trend and only 0.79% of the pixels showing a decreasing trend. In 2015–2019, the NDVI mainly increased, with 52.55% of the pixels showing an increasing trend and 47.45% of the pixels showing a decreasing trend. Compared with that before water diversion, the NDVI decreased significantly after water diversion. Spatially, the increasing trend of the NDVI upstream of the Danjiangkou Reservoir was significant before water diversion, while that downstream of the Danjiangkou Reservoir was relatively stable. After water diversion, the NDVI decreased on both sides of the river upstream of the reservoir and mainly increased in other areas. In the Danjiangkou Reservoir and downstream of the reservoir, the NDVI showed a significant decreasing trend, and the areas with significant decreases were concentrated in the downstream central cities and the farming areas on both sides of the river.
3.2. Estimation of Service Values of the State System
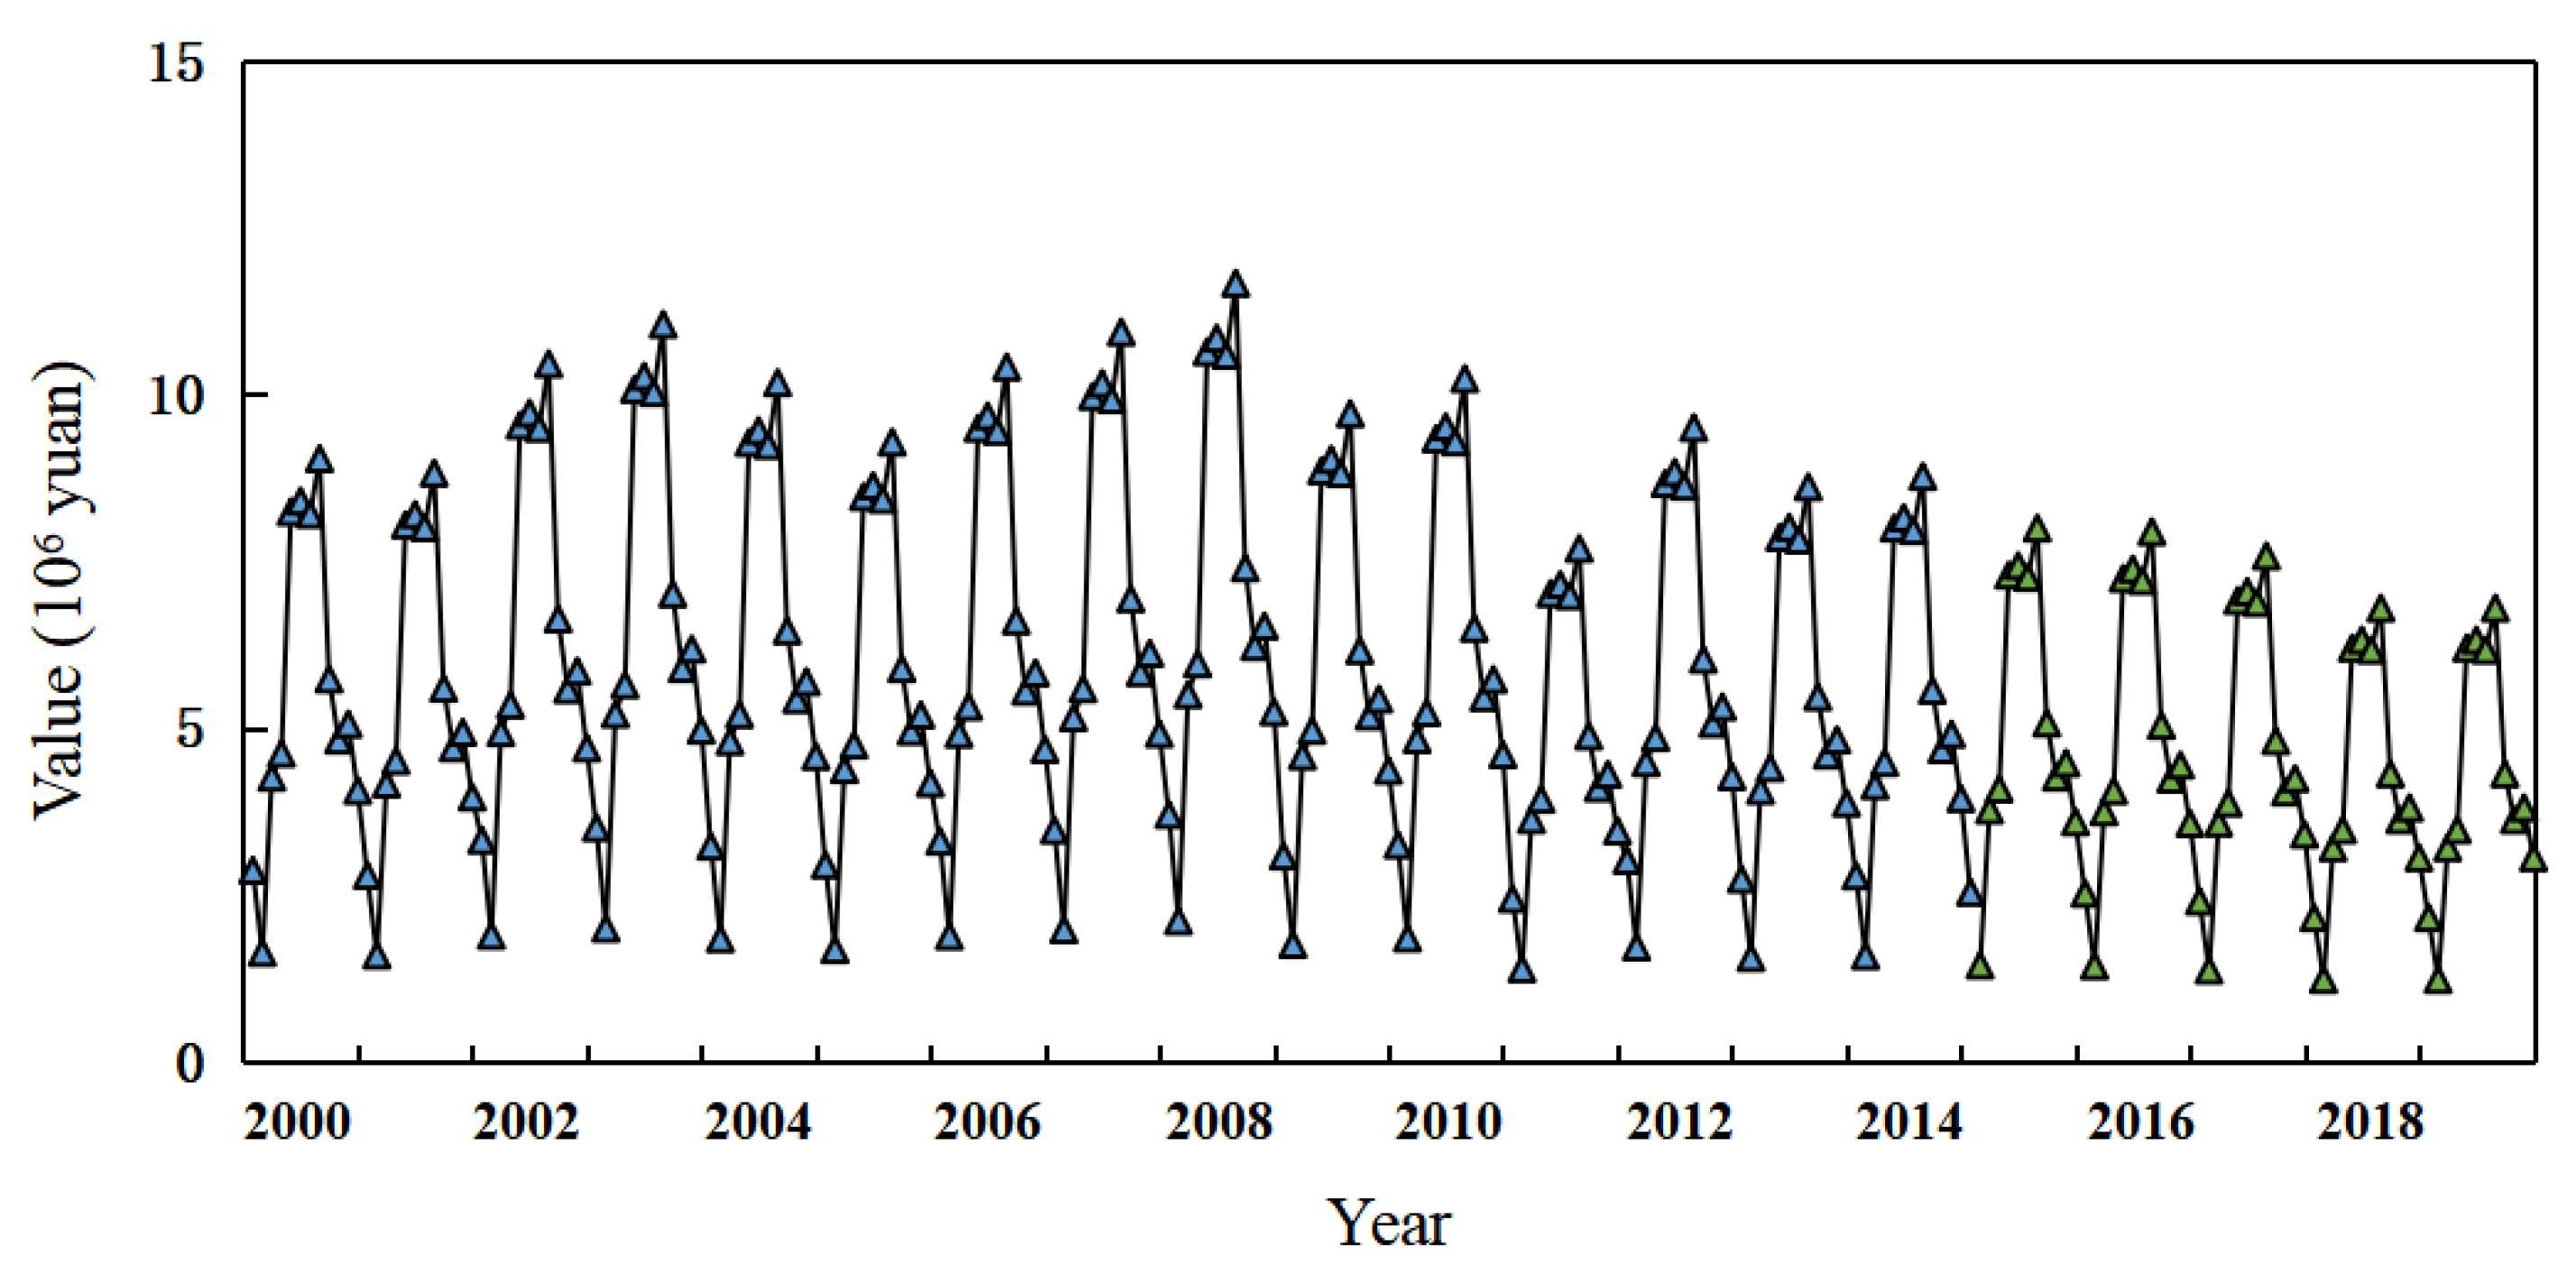
3.2.1. Fixing Carbon and Releasing Oxygen
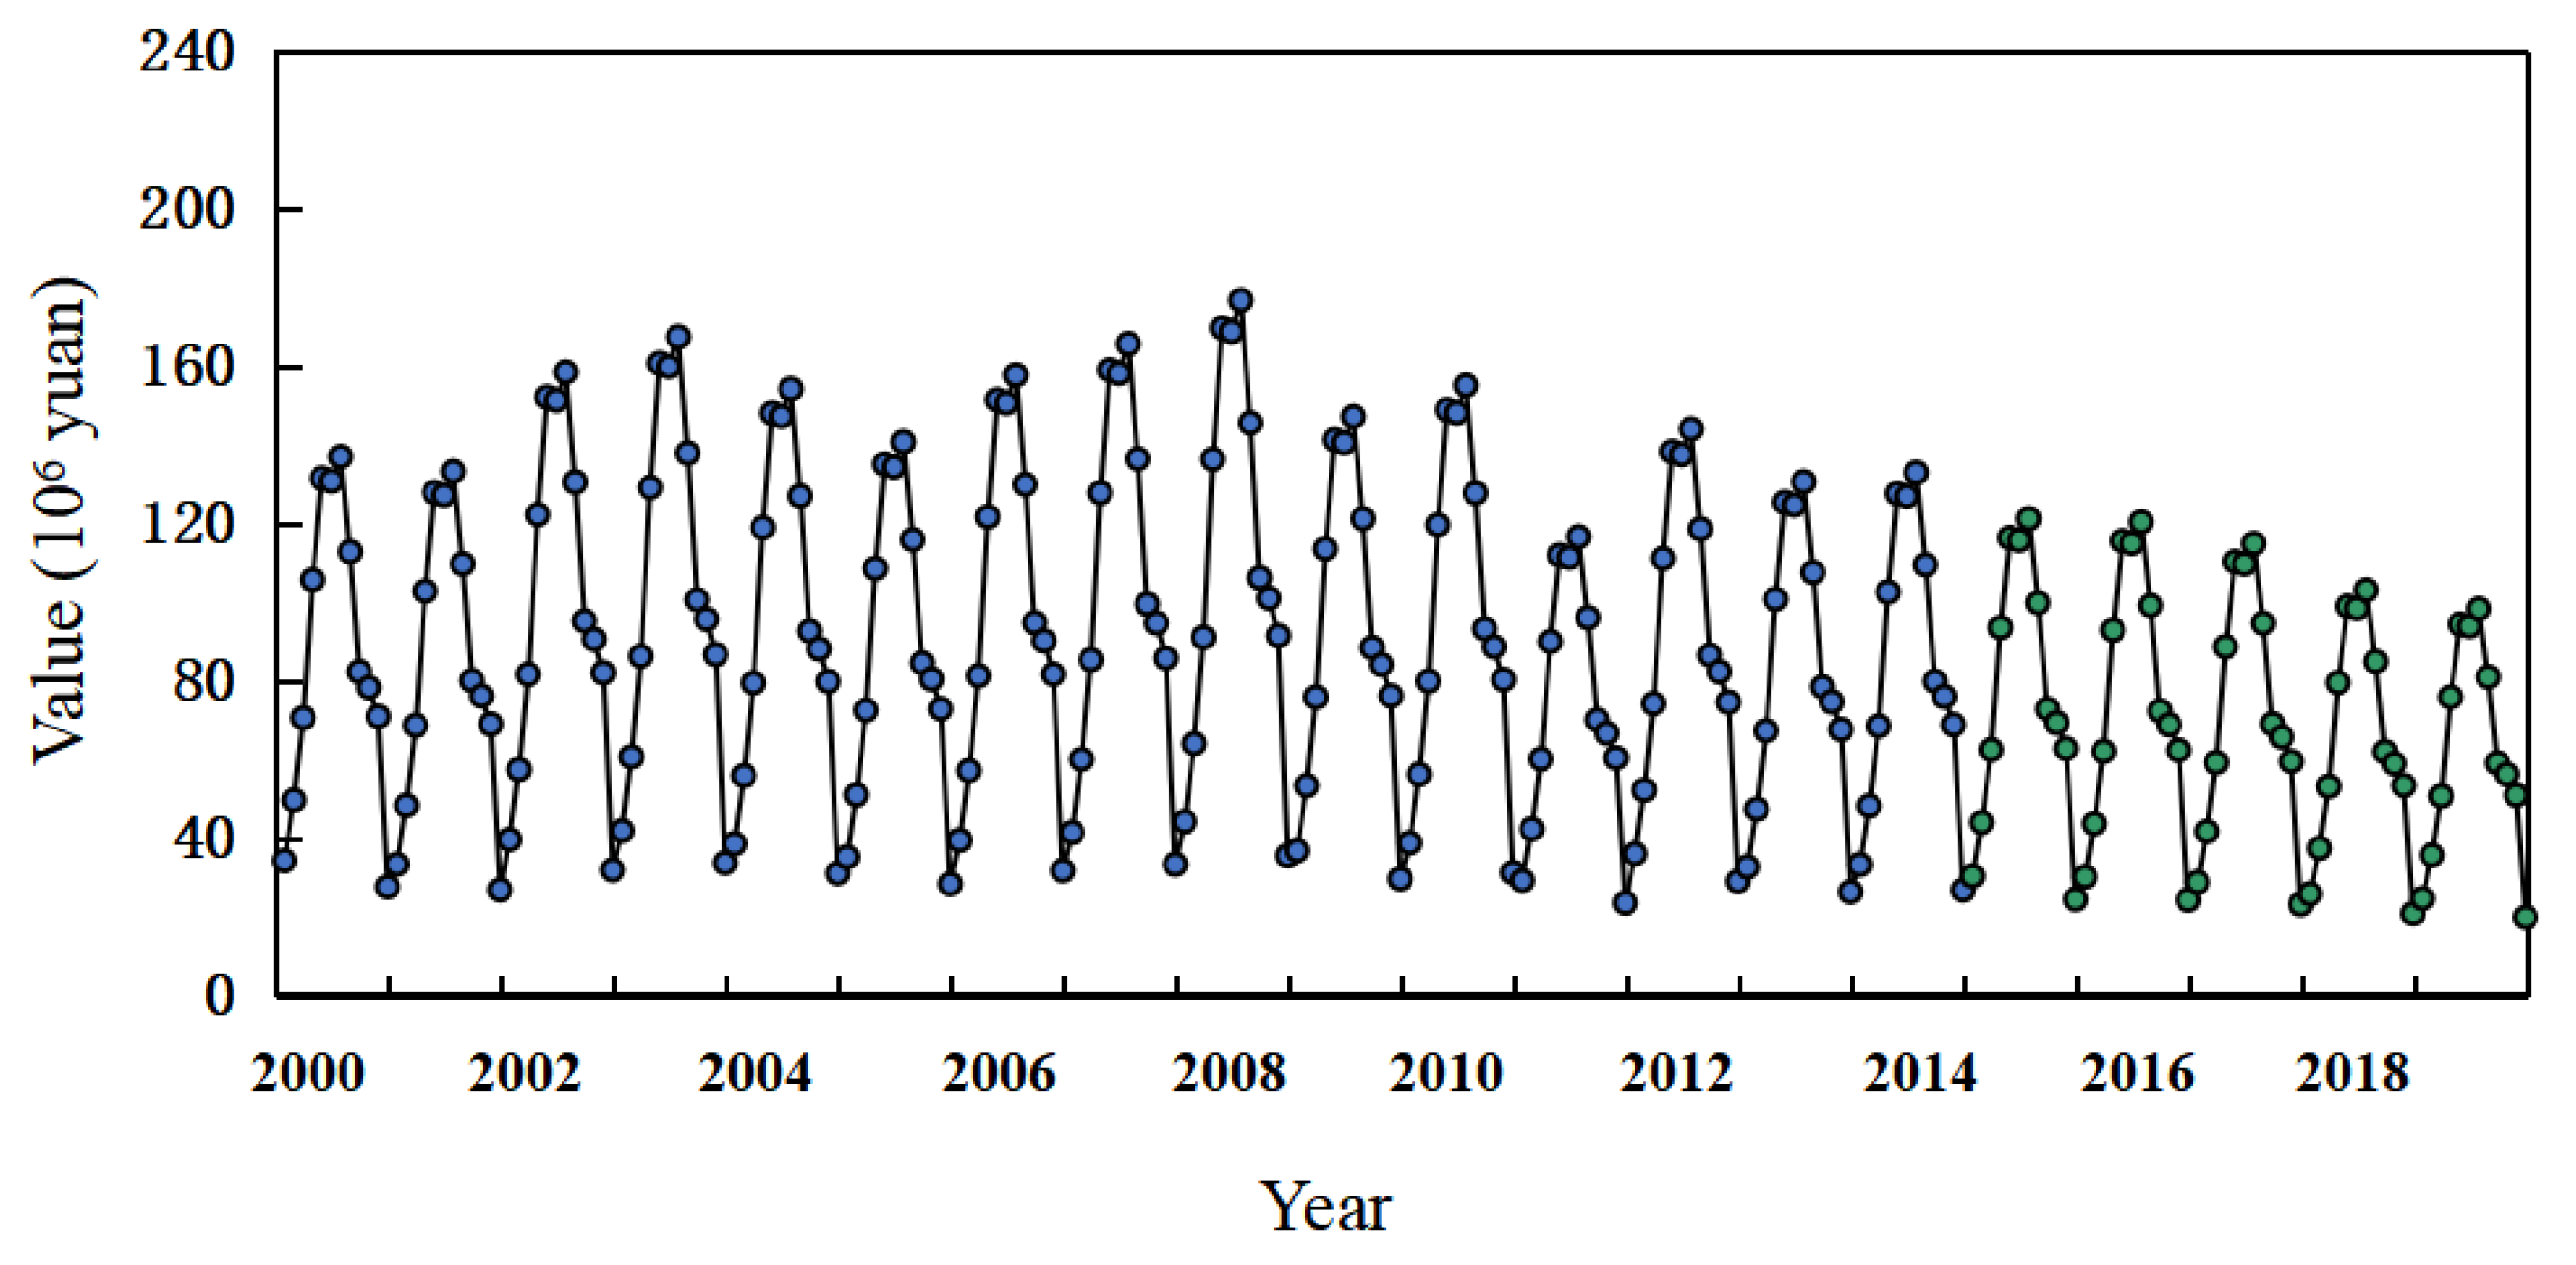
Fixing carbon and releasing oxygen means that plants convert carbon dioxide into oxygen through photosynthesis and fix carbon in carbon dioxide into plants. The value of fixing carbon and releasing oxygen of the Danjiangkou Reservoir ecosystem reflects the photosynthesis intensity of vegetation and microorganisms (cyanobacteria, etc.) in the reservoir and drawdown area, and the value showed interannual and seasonal changes with the intensity of photosynthesis (Figure 8). From 2000 to 2019, the annual variation in the value of oxygen release and carbon sequestration presented a fluctuating downward trend. The average value of carbon fixation and oxygen release services was 1.04 × 10⁹ yuan/year, of which the value of oxygen release was 4.57 × 10⁸ yuan/year, and the value of carbon dioxide fixation was 5.85 × 10⁸ yuan/year.
After water diversion, the fixing carbon and releasing oxygen value decreased, and the rate was further accelerated. Before water diversion, fixing carbon and releasing oxygen value decreased at a rate of 7.7 × 10⁶ yuan/year. After the water diversion project, the value of fixing carbon and releasing oxygen at a rate of 4.76 × 10⁷ yuan/year, which was 6.17 times that before water diversion.
3.2.2. Organic Production
Organic production refers to the use of solar energy to synthesize inorganic compounds (CO2, H2O) into organic matter. This production supports the whole life system and is the food foundation of all consumers and reducers. Figure 9 shows the sequence diagram of the organic production service value of the Danjiangkou Reservoir and the water level fluctuation area from 2000 to 2019. The annual change in organic production value showed a significant downward trend, with a change trend of 1.26 × 10⁶ yuan/year.
The decrease in the organic production value ecosystem may have been caused by the increase in reservoir storage, the expansion of water area, and the decrease in water level area. After water diversion, the rate of decrease in the organic production value was further accelerated. Before the water diversion project, the rate of decrease in the organic production value was 5.03 × 10⁵ yuan/year. After water diversion, the organic production value at a rate of 3.08 × 10⁶ yuan/year, which was 6.14 times that before water diversion.
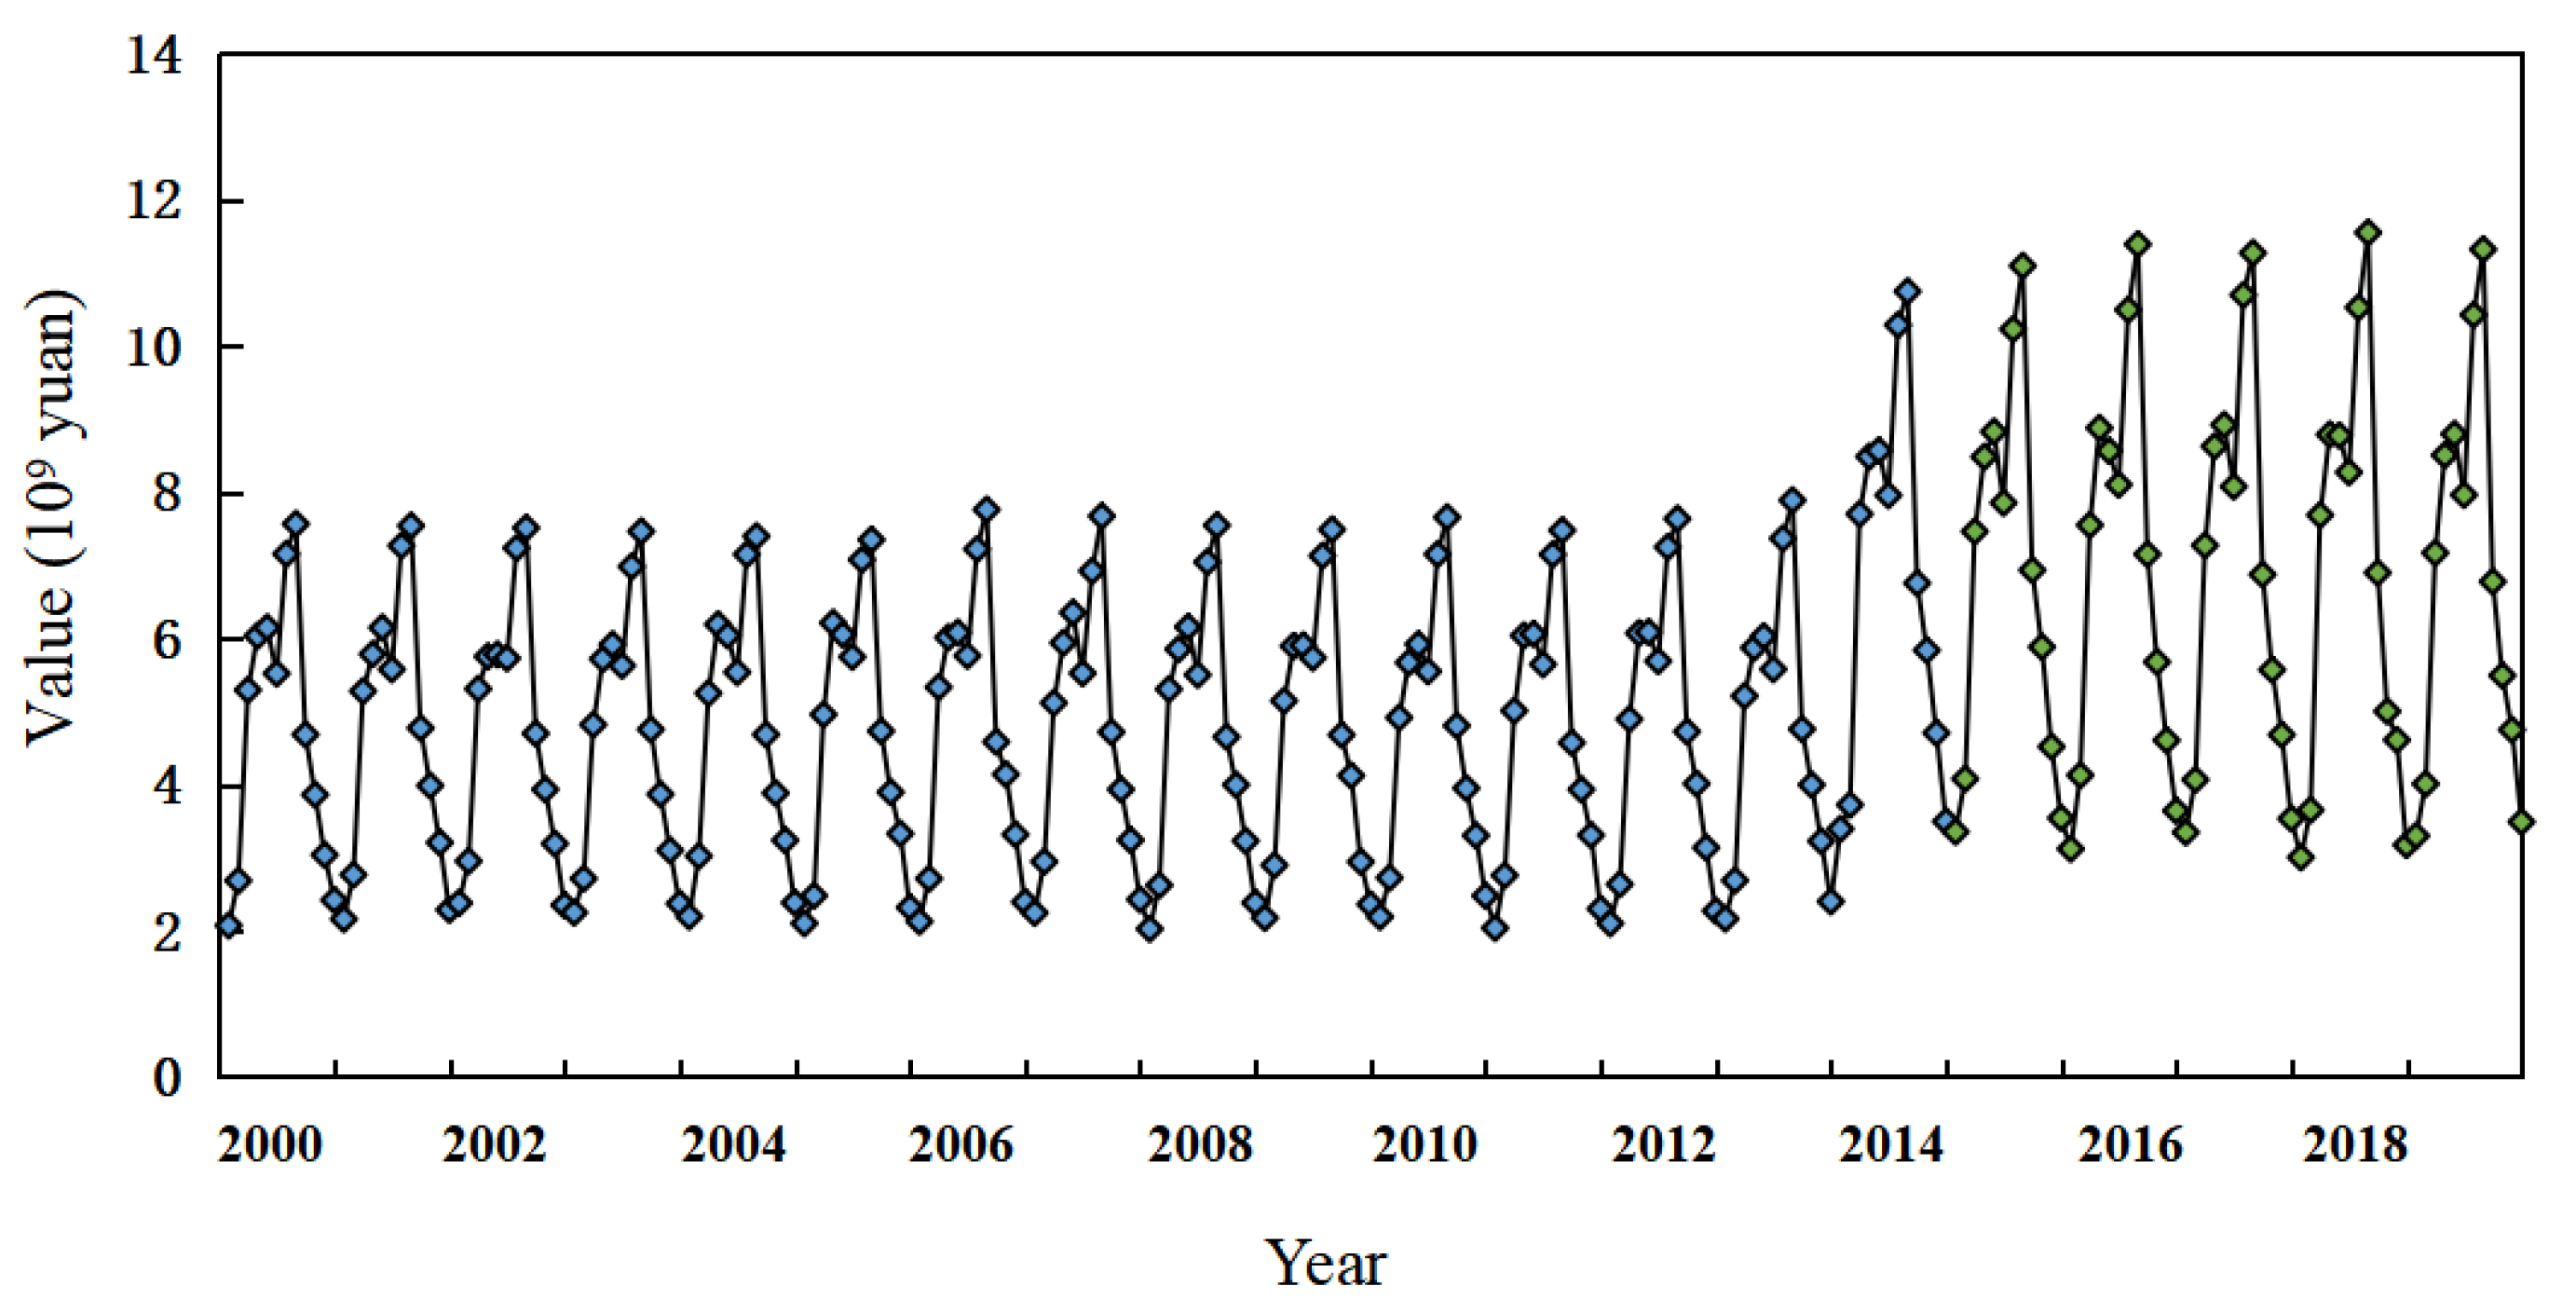
3.2.3. Climate Regulation
The reservoir regulates the climate through evapotranspiration and in other ways. The evaporation of the reservoir water surface and water level fluctuation area can be estimated by considering the rainfall, temperature, relative air humidity, reservoir water area and water level fluctuation area in different months. The climate regulation value of Danjiangkou Reservoir from 2000 to 2019 was estimated (Figure 10).
From 2000 to 2019, the climate regulation value presented a fluctuating upward trend, with a change trend of 1.6 × 10⁹ yuan/year. The maximum value appeared in 2016, reaching 8.33 × 10¹⁰ yuan, and the minimum value appeared in 2003, reaching 5.55 × 10¹⁰ yuan. Since 2014, the value of climate regulation has increased significantly, with a change trend of 2.7 × 10⁹ yuan/year. The average value of climate regulation from 2000 to 2019 was 6.43 × 10¹⁰ yuan/year, which included 5.65 × 10¹⁰ yuan/year from 2000 to 2013 and 8.23 × 10¹⁰ yuan/year from 2014 to 2016. This result may have been related to the heightening of the Danjiangkou Reservoir dam, the increase in reservoir capacity, and the increase in reservoir water area and reservoir drawdown area. The calculation of the climate adjustment value is mainly based on surface and water evaporation, and it includes the monthly temperature, precipitation, air humidity, and water area data. As a reservoir area with a large area of open water, the evapotranspiration amount is very high. By absorbing heat and providing water vapor, increasing air humidity and so on, the reservoir can affect the regional microclimate and influence global climate change. In the context of global warming, this value is more important to human beings.
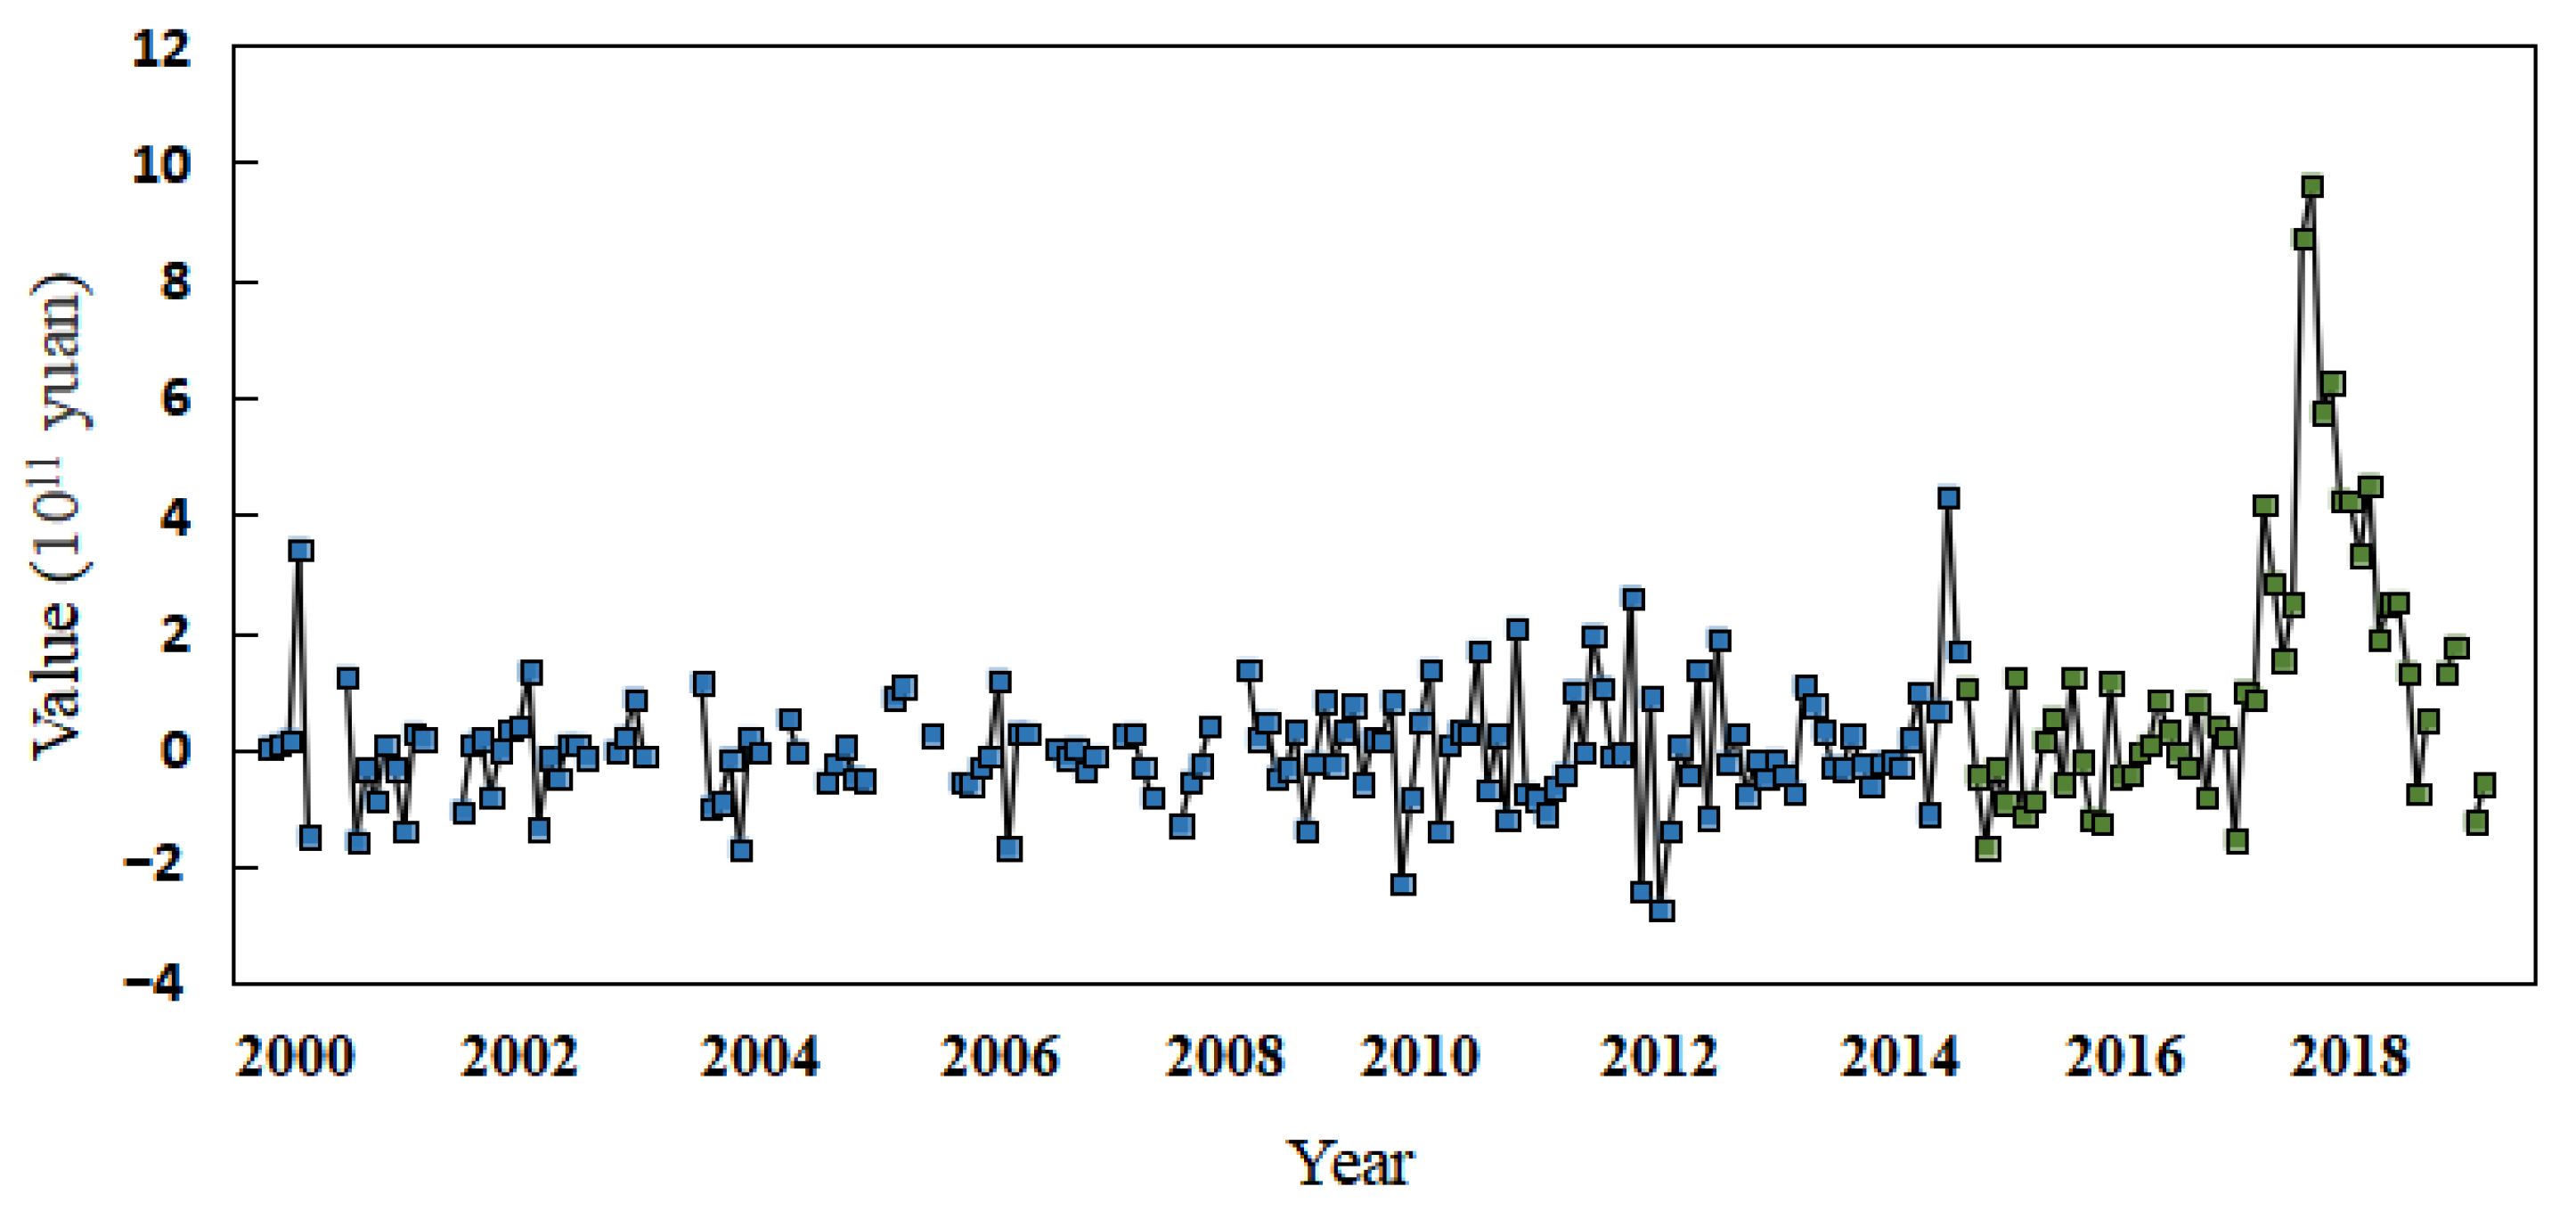
3.2.4. Water Conservation and Supply Value
Based on the monthly water storage, rainfall, evaporation of the Danjiangkou Reservoir, the monthly water supply to the city, especially from the middle route of the SNWD, and the unit capacity cost of the Danjiangkou Reservoir (the total investment in reservoir construction was 2013 billion yuan, the capacity was 29 billion cubic meters, and the unit capacity cost was 6.94 yuan/cubic meter) were used to calculate the value of water conservation and supply in 2000–2019 (Figure 11).
From 2000 to 2019, according to the fitting curve, the value of water conservation and supply increased gradually. The increasing trend of the water conservation value was relatively stable from 2000 to 2014, and the value of water conservation increased significantly from 2015 to 2019, which was 47.27 times that before water diversion. This result was related to the opening of the Danjiangkou Reservoir water diversion project. In December 2014, the Danjiangkou Reservoir began to transfer water. The amount of water transferred increased each month, and the value of the water supply also increased each month, reaching a maximum in 2019, with a water supply of 9.91 × 10⁹ cubic meters and a value of 1.98 × 10⁹ yuan.
3.2.5. Hydropower Generation Value
Located on the dam of the Danjiangkou Reservoir, the Danjiang hydropower station is equipped with six Francis turbine generators with a total installed capacity of 9 × 10⁵ kW and an average annual power generation of 3.83 × 10⁹ kWh. The Danjiang hydropower plant relies on the reservoir storage to generate electricity, and the plant provides a considerable hydropower generation value. The annual power generation data obtained from the Danjiang hydropower station, Danjiangkou Reservoir flood control information network, and other channels were used to calculate the hydropower generation value, as shown in Table 4.
From 2000 to 2019, the total power generation of Danjiangkou Dam presented a fluctuating growth trend, with a relatively gentle growth trend of 1.4 × 10⁸ kWh/year; however, the interannual fluctuation was large. The total power generation in the past 20 years was 6.47 × 10¹⁰ kWh, with an average annual power generation of 3.24 × 10⁹ kWh. The largest power generation was in 2005 with a value of 4.69 × 10⁹ kWh, and the lowest power generation was in 2014 with a value of 1.75 × 10⁹ kWh. The hydropower generation value of Danjiangkou Dam presented a fluctuating growth trend, with a change rate of 5 × 10⁵ yuan/year. The total power generation value over 20 years was 2.43 × 10¹⁰ yuan, and the average power generation value was 2.31 × 10⁹ yuan/year. The highest power generation value was 4.18 × 10¹⁰ yuan in 2005, and the lowest power generation value was 6.58 × 10⁸ yuan in 2014.
4. Discussion
In this study, we propose a practical method for estimating water storage and its dynamics based on remote sensing images. Accuracy of storage capacity calculation is critical to research results. Our research lacks actual measurement data for verification; however, Liu et al. [25] used 30-m Landsat TM/ETM+ images to verify the storage capacity estimation results, and shown that the temporal variations in the water storage can be well represented using the remotely sensed estimates.
Danjiangkou reservoir play important roles in flood control, drinking water supply, irrigation, power generation, recreation, and navigation and other important benefits. However, the implementation of the water transfer project has also changed the ecological environment of the reservoir area [32]. Affected by climate change and artificial regulation, after the implementation of the water diversion project, the water storage of Danjiangkou reservoir increased significantly, and seasonal fluctuations increased, which is consistent with the research of Liu et al. [12]. With the development of the middle route of the SNWD and the popularization of the concept of ecological civilization, the local government has taken a series of ecological measures, including natural forest protection projects, returning farmland to forest projects, and a number of water conservancy compensation projects. The implementation of these projects has improved the regional vegetation coverage to a certain extent [33]. However, it was found that the implementation of a water diversion project aggravates the phenomenon of construction land occupying cultivated land and woodland. Additionally, the vegetation around the reservoir is periodically flooded, which affects the growth of the surrounding vegetation. In the downstream of the Danjiangkou Reservoir, vegetation degradation in the central city and the farming areas on both sides of the river is obvious, and this degradation is related to the rapid economic development leading to urban expansion, the phenomenon of construction land occupying cultivated land and woodland, and unreasonable agricultural farming methods.
With the water supply of the middle route project in 2014, the Danjiangkou Dam showed a decreasing trend in the values of oxygen release and carbon fixation and organic matter production. The implementation of the water diversion project has caused construction land to occupy woodland and grassland. Additionally, dam heightening has reduced the water volume in the middle and lower reaches of the Hanjiang River and has had adverse effects on agricultural irrigation. To pursue higher agricultural production benefits, people reclaim woodland and grassland for agricultural land, resulting in the reduction of carbon storage and the weakening of carbon fixation and oxygen release capacity. However, due to the implementation of the water diversion project, the discharge volume of Danjiangkou Reservoir has been reduced, the water level of the river channel has been lowered, the flow rate has slowed, some rivers have narrowed, and the water temperature has declined; these changes cause changes in the growth environment of aquatic organisms and further reduce the organic matter production capacity of the reservoir and the water level fluctuation zone [34].
The water quantity and ecological environment of the reservoir directly affect the safety of water diversion in the water source area. Currently, the implementation of the water diversion project has caused changes in the landscape patterns of the water source area and its watershed and has had some negative impacts on the ecological environment, especially in the middle and lower reaches of the reservoir area. Therefore, in follow-up regional planning, we should speed up the construction of the cascade channelization project of the middle and lower reaches of the Hanjiang River, the water diversion project from the Yangtze River to the Hanjiang River and the water supplement project of the Dongjinghe River, as well as the construction of the continued supporting and water-saving reconstruction project of the large-scale water diversion irrigation area of the Hanjiang River; additionally, we should establish a scientific ecological compensation mechanism. Furthermore, we should improve the security mechanism, strengthen the management of the river basin, establish nature reserves to enrich plant species, reduce the negative impact of landscape fragmentation caused by dam heightening, strengthen the connectivity of the ecosystem, and prevent the service network of the river basin ecosystem from being affected. In addition, efforts should be made to protect the ecological environment, implement policies and regulations on basin environmental protection, and plan and develop ecological protection as an industry [35].
5. Conclusions
Taking the Danjiangkou Reservoir and its Hanjiang River basin as the research object, combined with multisource data such as remote sensing images, land-use data, meteorological station data, and statistical data, this paper analyzed the dynamic changes in landscape patterns in the Hanjiang River basin from 2000 to 2019 and estimated the ecosystem service value of the Danjiangkou Reservoir area by using an indirect material conversion method based on market theory. On this basis, the ecological impact of the water diversion project on the water source area was analyzed. The main conclusions are as follows:
During the study period, the land-use change in the Hanjiang River basin mainly showed decreases in cultivated land, grassland, and forest; and increases in water and construction land. The land-use types that changed significantly were construction land, cultivated land, and forest land, and the land conversion mode was mainly construction land occupying cultivated land, forest land, and grassland; additionally, grassland was transformed to forest land.
From 2000 to 2019, the average annual water volume of the Danjiangkou Reservoir was 1.18 × 10¹⁰ cubic meters, the maximum water volume was 2.45 × 10¹⁰ cubic meters, and the minimum water volume was 7.81 × 10⁹ cubic meters. In the long term, the water volume of the Danjiangkou Reservoir showed an increasing trend, especially after the middle route of the SNWD was implemented in 2014, after which the water volume gradually increased. The direct reason for the gradual increase in water volume was the heightening of the dam and the increase in water storage. From the aspect of inter-monthly variations in reservoir storage, after the implementation of the water diversion project, the monthly average reservoir storage presented a significant increasing trend, and the seasonal fluctuation of reservoir storage was enhanced.
Before water diversion, the average annual NDVI value in the Hanjiang River basin was 0.82, and the change rate was 3.5 × 10⁻³/year. After water diversion, the average annual NDVI value was 0.85, and the change rate was −1.1 × 10⁻³/year. The water diversion project has had a great impact on the NDVI downstream of the Danjiangkou Reservoir, which was related to the destruction of the surrounding vegetation and the economic development downstream.
From 2000 to 2019, the order of ecosystem service value of the Danjiangkou Reservoir was as follows: water conservation and supply value > climate regulation value > hydropower generation value > fixing carbon and releasing oxygen value > organic production value. The ecosystem service value of the Danjiangkou Reservoir was mainly determined by the water conservation and supply, climate regulation value. With the additional water supply from the middle route project in 2014, the Danjiangkou Dam showed an increasing trend in the three values of water conservation and supply, climate regulation and hydropower generation, and a decreasing trend in the values of fixing carbon and releasing oxygen, organic production.
Author Contributions
The authors undertook different tasks for this paper. H.L. designed the research and revised the paper. H.D., Y.H. and Y.Z. analyzed the data. L.Z. wrote the paper. All authors have read and agreed to the published version of the manuscript.
Funding
This research was financially supported by the National Key Research and Development Program of China (2018YFC1506500) and National Natural Science Foundation of China (41971402).
Institutional Review Board Statement
Not applicable.
Informed Consent Statement
Not applicable.
Data Availability Statement
Data developed in this study will be made available on request to the corresponding authors.
Conflicts of Interest
The authors declare no conflict of interest. The funders had no role in the design of the study; in the collection, analyses, or interpretation of data; in the writing of the manuscript, or in the decision to publish the results.
References
- Rozos, E.; Baki, S.; Bouziotas, D.; Makropoulos, C. Exploring the link between urban development and water demand: The impact of water-aware technologies and options. In Proceedings of the Computing and Control for the Water Industry (CCWI) 2011, Exeter, UK, 5–7 September 2011; CCWI2011-311. University of Exeter: Exeter, UK, 2011. [Google Scholar]
- Kossieris, P.; Panayiotakis, A.; Tzouka, K.; Gerakopoulou, P.; Rozos, E.; Makropoulos, C. An eLearning approach for improving household water efficiency. Procedia Eng. 2014, 89, 1113–1119. [Google Scholar] [CrossRef] [Green Version]
- Feng, S.; Li, L.X.; Duan, Z.G.; Zhang, J.L. Assessing the impacts of South-to-North Water Transfer Project with decision support systems. Decis. Support Syst. 2007, 42, 1989–2003. [Google Scholar] [CrossRef]
- Biswas, A.K.; Zuo, D.; Nickum, J.E.; Liu, C. Long-Distance Water Transfer: A Chinese Case Study and International Experience; Tycooly International: Dublin, Ireland, 1983. [Google Scholar]
- Snaddon, C.D.; Wishart, M.J.; Davies, B.R. Some implications of inter-basin water transfers for river ecosystem functioning and water resources management in southern Africa. Aquat. Ecosyst. Health Manag. 1998, 1, 159–182. [Google Scholar] [CrossRef]
- Feldman, D.L. Tennessee’s Inter-Basin Water Transfer Act: A changing water policy agenda. Water Policy 2001, 3, 1–12. [Google Scholar] [CrossRef]
- Rozos, M. Learning, Urban Water Resources Management and Operating Policy. Resources 2019, 8, 173. [Google Scholar] [CrossRef] [Green Version]
- Castelletti, A.; Galelli, S.; Restelli, M.; Soncini-Sessa, R. Tree-based reinforcement learning for optimal water reservoir operation. Water Resour. Res. 2010, 46, W09507. [Google Scholar] [CrossRef]
- Rogers, S.; Barnett, J.; Webber, M.; Finlayson, B.; Wang, M. Governmentality and the conduct of water: China’s South-North Water Transfer Project. Trans. Inst. Br. Geogr. 2016, 41, 429–441. [Google Scholar] [CrossRef]
- Zeng, Z.X.; Zhang, H.; Shan, B.Q.; Yang, H.G. Analysis of industrial pollution sources of the middle and lower reaches of hanjiang river basin. Resour. Environ. Yangtze Basin 2014, 23, 252–259. [Google Scholar]
- Whitehead, P.G.; Wilby, R.L.; Battarbee, R.W.; Kernan, M.; Wade, A.J. A review of the potential impacts of climate change on surface water quality. Hydrol. Sci. J. 2009, 54, 101–123. [Google Scholar] [CrossRef]
- Liu, H.; Wu, J.; Yin, J. Evaluation and change of Danjiangkou Reservoir dynamic capacity. Chin. J. Appl. Ecol. 2018, 29, 2658–2666. [Google Scholar]
- Shen, Z.H.; Zhang, Q.F.; Yue, C.; Zhao, W.; Hu, Z.W.; Lv, N.; Tang, Y.Y. The Spatial Pattern of Land Use/Land Cover in the Water Supplying Area of the Middle-Route of the South-to-North Water Diversion (MR-SNWD) Project. Acta Geogr. Sin. 2006, 61, 633–644. [Google Scholar]
- Dong, M.T.; Tang, M.F.; Li, S.Y.; Cao, H.M.; Deng, H.B.; Wu, G. Effects of water transfer project construction on vegetation patterns. Acta Ecol. Sin. 2016, 36, 6656–6663. [Google Scholar]
- Su, W.C. Main ecological and environmental problems of water-level-fluctuation zone (WLFZ) in Three Gorges reservoir and their controlling measures. J. Yangtze River Sci. Res. Inst. 2004, 21, 32–34. [Google Scholar]
- Wang, C.; Zhang, H.; Lei, J.S.; Jia, H.Y.; Lei, P.; Yin, W. Ecological barrier constructing of steep slope reservoir bank in the water source of Middle Route of South-to-North Water Diversion Project. Chin. J. Environ. Eng. 2020, 14, 2930–2937. [Google Scholar]
- Liu, H.; Huang, Y.F.; Zheng, L. Effects of climate and human activities on vegetation cover changes in Danjiangkou Water Source Areas. Trans. Chin. Soc. Agric. Eng. 2020, 36, 97–105. [Google Scholar]
- Yang, Q.; Ping, X.; Shen, H.; Xu, J.; Wang, P.; Zhang, B. A novel flushing strategy for diatom bloom prevention in the lower-middle Hanjiang River. Water Res. 2012, 46, 2525–2534. [Google Scholar] [CrossRef] [PubMed]
- Kuo, Y.M.; Liu, W.; Zhao, E.; Li, R.; Yao, L.; Muñoz-Carpena, R. Water quality variability in the middle and down streams of Han River under the influence of the Middle Route of South-North Water Diversion Project, China. J. Hydrol. 2018, 569, 218–229. [Google Scholar] [CrossRef]
- Lu, Z.; Ma, X.; Sang, W.; Fan, Y. Ecological benefit assessment of the South-North Water Transfer Project: An eastern route. Int. J. Sustain. Dev. World Ecol. 2006, 13, 221–227. [Google Scholar] [CrossRef]
- Liu, H.; Wu, J.; Chen, X.L. Study on spatial-temporal change andtrade-off/synergy relationships of ecosystem services in the Danjiangkou water source area. Acta Ecol. Sin. 2018, 38, 4609–4624. [Google Scholar]
- Zhao, J.; Li, H.; Cai, X.; Chen, F.; Wang, L.; Yu, D.; Li, C. Long-term (2002–2017) Impact of Danjiangkou Dam on Thermal Regimes of Downstream Han River (China) using Landsat Thermal Infrared Imagery. J. Hydrol. 2020, 589, 125135. [Google Scholar] [CrossRef]
- Cao, S.J.; Xia, R.; Zhang, Y.; Li, Z.Y.; Ren, Y.X.; Ta, L. Characteristics and Response of Ecological Environment in Downstream of Hanjiang River before and after Running of Middle Route of South-to-North Water Diversion Project. Res. Environ. Sci. 2020, 33, 1431–1439. [Google Scholar]
- Chen, L.; Zhou, S.L.; Zhou, B.B.; Lv, C.T. Characteristics and Driving Forces of Regional Land Use Transition Based on the Leading Function Classification: A Case Study of Jiangsu Province. Econ. Geogr. 2015, 35, 155–162. [Google Scholar]
- Liu, H.; Yin, J.; Feng, L. The Dynamic Changes in the Storage of the Danjiangkou Reservoir and the Influence of the South-North Water Transfer Project. Sci. Rep. 2018, 8, 8710. [Google Scholar] [CrossRef] [PubMed] [Green Version]
- Daily, G.C.; Polasky, S.; Goldstein, J. Ecosystem services in decision making: Time to deliver. Front. Ecol. Environ. 2009, 7, 21–28. [Google Scholar] [CrossRef] [Green Version]
- Brauman, K.A.; Daily, G.C.; Duarte, T.K. The nature and value of ecosystem services: An overview highlighting hydrologic services. Annu. Rev. Environ. Resour. 2007, 32, 67–98. [Google Scholar] [CrossRef]
- Ren, Z.Y.; Liu, Y.X. Contrast in vegetation net primary productivity estimation models and ecological effect value evaluation in Northwest China. Chin. J. Eco-Agric. 2013, 21, 494–502. [Google Scholar] [CrossRef]
- Salles, J.M. Valuing biodiversity and ecosystem services: Why put economic values on Nature? Comptes Rendus Biol. 2011, 334, 469–482. [Google Scholar] [CrossRef]
- Jiang, B.; Zhang, L.; Ouyang, Z.Y. Ecosystem services valuation of Qinghai Lake. Chin. J. Appl. Ecol. 2015, 26, 3137–3144. [Google Scholar]
- Urbaniak, M.; Kiedrzynska, E.; Zalewski, M. The role of a lowland reservoir in the transport of micropollutants, nutrients and the suspended particulate matter along the river continuum. Hydrol. Res. 2012, 43, 400–411. [Google Scholar] [CrossRef]
- Wang, Y.; Wang, D.; Wu, J. Assessing the impact of Danjiangkou reservoir on ecohydrological conditions in Hanjiang River, china. Ecol. Eng. 2015, 81, 41–52. [Google Scholar] [CrossRef]
- Du, Y.; Wang, X.L.; Cai, S.M. Effect and countermeasure of the middle route project of south to north water transfer on ecology and environment in the middle and lower reaches of Hanjiang River. Bull. Chin. Acad. Sci. 2005, 20, 477–482. [Google Scholar]
- Fan, Y.L.; Hu, N.; Ding, S.Y. The influence of dam on downstream landscape pattern and ecosystem services. Chin. J. Ecol. 2017, 36, 240–247. [Google Scholar]
- Mina, M.; Bugmann, H.; Cordonnier, T.; Irauschek, F.; Klopcic, M.; Pardos, M.; Cailleret, M. Future ecosystem services from European mountain forests under climate change. J. Appl. Ecol. 2016, 54, 389–401. [Google Scholar] [CrossRef]
Figure 1.
(a) Geographical location of the Hanjiang River basin; (b) Geographical location of the Danjiangkou Reservoir.
Figure 1.
(a) Geographical location of the Hanjiang River basin; (b) Geographical location of the Danjiangkou Reservoir.

Figure 2.
Land-use type distribution of the Hanjiang River basin in 2020.

Figure 3.
Monthly average reservoir storage change trend from 2000 to 2019.

Figure 4.
Variation trend of monthly average storage capacity from 2000 to 2019.

Figure 5.
Monthly average reservoir storage change from 2000 to 2014 and from 2015 to 2019.

Figure 6.
Annual average NDVI change trend from 2000 to 2019.

Figure 7.
(a) Spatial change in the NDVI from 2000 to 2014; (b) spatial change in the NDVI from 2015 to 2019.
Figure 7.
(a) Spatial change in the NDVI from 2000 to 2014; (b) spatial change in the NDVI from 2015 to 2019.

Figure 8.
Monthly value of fixing carbon and releasing oxygen from 2000 to 2019.

Figure 9.
Monthly value of organic production from 2000 to 2019.

Figure 10.
Monthly value of climate regulation from 2000 to 2019.

Figure 11.
Monthly value of water conservation and supply from 2000 to 2019.


Table 1.
Data and sources used in the study.
| Type | Time | Product | Source |
|---|---|---|---|
| LandsatTM/ETM+/OLI | 2000–2019 | 16-day return period with 30-m spatial resolution | https://www.usgs.gov/ accessed on 9 October 2020 |
| HJ-1A/B | 2008–2019 | 2-day return period with 30-m spatial resolution | http://www.cresda.com/CN/ accessed on 9 October 2020 |
| Elevation | February 2000 | SRTM DEM UTM | https://lpdaac.usgs.gov/ accessed on 7 June 2017 |
| GlobeLand30 | 2000, 2020 | Global land cover with 30-m spatial resolution | http://www.globallandcover.com/ accessed on 9 October 2020 |
| MOD13Q | 2000–2019 | 8-day synthetic NDVI with 250-m spatial resolution | https://lpdaac.usgs.gov/ accessed on 9 October 2020 |
| Meteorological Data | 2000–2019 | Monthly precipitation and average temperature at meteorological stations | http://data.cma.cn/ accessed on 9 October 2020 |
| MOD17A3H | 2000–2019 | Annual Net Primary Productivity (NPP) of 1-km spatial resolution | https://ladsweb.modaps.eosdis.nasa.gov/search/ accessed on 9 October 2020 |
| MOD15A2H | 2000–2019 | 8-day synthetic FPAR with 1-km spatial resolution | https://ladsweb.modaps.eosdis.nasa.gov/search/ accessed on 9 October 2020 |
| Statistical data | 2000–2019 | Social and economic data, water supply, water price, etc., of water conveyance area and water receiving area | Statistical yearbook and organization release data |
Table 2.
Calculation methods of ecosystem service values.
| Ecosystem Service Value | Method |
|---|---|
| Organic production | where: V—value of NPP (yuan); A—value of NPP (t · c/(hm2.a)); B—standard coal coefficient (1); Q1—heat converted by the material quality of NPP (kJ/g); Q2—heat converted by standard coal (kJ/g); P—price of unit standard coal (yuan/t). The heat converted from NPP material quality is 6.7 kJ/g, that of standard coal is 10 kJ/g, and the unit price of standard coal is 345.5 yuan/t. |
| Fixing carbon and releasing oxygen | where Vc—the value of carbon fixation (yuan); Vq—the value of oxygen released (yuan); Pc—the price of CO2 fixed in the market (yuan/t); Pq—the price of O2 released from the market (yuan/t). According to the eighth forest ecological assessment, the value of carbon sequestration price is 1281 yuan/t. Based on the website of the Ministry of Health of the People’s Republic of China (http://wsb.moh.gov.cn/ accessed on 9 October 2020), the average price of oxygen is 1299.07 yuan/t. |
| Climate regulation | where Vt—service value of climate regulation (yuan); Qt—power consumption of unit volume water converted into steam (kWh/m3); Et—water surface evaporation (M3); Pt—electricity price (yuan/kWh). Using the consumption of a humidifier to calculate the value of water surface evaporation to adjust the climate, taking the power of 32 W household humidifier, which is more common in the market as the calculation, the power consumption of converting 1 m3 water into steam is approximately 125 kWh, and the electricity price is 0.3771 yuan/kWh. |
| Water storage, conservation and supply | The formula of the supply value of water source diversion is as follows: where Q—the water supply value of the reservoir; V—the water supply; and P—the water price.Water conservation service value formula: where Vr—water conservation service value (yuan); Qr—water conservation capacity (m3); Pr—construction cost per unit capacity (yuan/m3). The annual investment cost of reservoir construction in China is 0.67 yuan for every one m3 of reservoir capacity. |
| Hydropower generation | where Ve—the service value of hydropower generation; We—the hydropower generation capacity; and Pe—the market price. |
Table 3.
Land-use transfer matrix (km2) from 2000 to 2020.
| 2020 | ||||||
|---|---|---|---|---|---|---|
| 2000 | Cultivated Land | Forest | Grassland | Water | Construction Land | |
| Cultivated Land | 44,547.10 | 1851.39 | 403.55 | 868.59 | 3328.31 | |
| Forest | 2642.16 | 82,064.24 | 2246.40 | 299.83 | 247.53 | |
| Grassland | 768.75 | 3454.54 | 4455.43 | 259.29 | 209.03 | |
| Water | 1110.27 | 73.42 | 60.27 | 1945.87 | 71.61 | |
| Construction Land | 598.84 | 20.37 | 11.74 | 20.02 | 2841.60 | |
Table 4.
Hydropower generation and value from 2000 to 2016.
| Year | 2000 | 2001 | 2002 | 2003 | 2004 | 2005 | 2006 | 2007 | 2008 | 2009 | 2010 | 2011 | 2012 | 2013 | 2014 | 2015 | 2016 | 2017 | 2018 | 2019 |
|---|---|---|---|---|---|---|---|---|---|---|---|---|---|---|---|---|---|---|---|---|
| Generating capacity * | 29 | 29 | 21 | 34 | 33 | 47 | 29 | 26 | 24 | 43 | 44 | 41 | 43 | 30 | 18 | 37 | 21 | 25 | 42 | 29 |
| Value * | 11 | 11 | 8 | 13 | 13 | 18 | 11 | 10 | 9 | 16 | 17 | 15 | 16 | 11 | 7 | 14 | 8 | 9 | 16 | 11 |
* The unit of generating capacity is 1 × 10⁸ kWh, and the unit of value is 1 × 10⁸ yuan.
Publisher’s Note: MDPI stays neutral with regard to jurisdictional claims in published maps and institutional affiliations. |
© 2021 by the authors. Licensee MDPI, Basel, Switzerland. This article is an open access article distributed under the terms and conditions of the Creative Commons Attribution (CC BY) license (https://creativecommons.org/licenses/by/4.0/).
Share and Cite
MDPI and ACS Style
Liu, H.; Di, H.; Huang, Y.; Zheng, L.; Zhang, Y. A Comprehensive Study of the Impact of Large-Scale Landscape Pattern Changes on the Watershed Ecosystem. Water 2021, 13, 1361. https://doi.org/10.3390/w13101361
AMA Style
Liu H, Di H, Huang Y, Zheng L, Zhang Y. A Comprehensive Study of the Impact of Large-Scale Landscape Pattern Changes on the Watershed Ecosystem. Water. 2021; 13(10):1361. https://doi.org/10.3390/w13101361
Chicago/Turabian StyleLiu, Hai, Heng Di, Yuefei Huang, Liang Zheng, and Yuan Zhang. 2021. "A Comprehensive Study of the Impact of Large-Scale Landscape Pattern Changes on the Watershed Ecosystem" Water 13, no. 10: 1361. https://doi.org/10.3390/w13101361
Note that from the first issue of 2016, this journal uses article numbers instead of page numbers. See further details here.