
Earth Observations Based Assessment of Impact of COVID-19 Lockdown on Surface Water Quality of Buddha Nala, Punjab, India


1
Department of Soil and Water Engineering, Punjab Agricultural University, Ludhiana 141004, India
2
Geohealth and Hydrology Laboratory, Department of Environmental Engineering Sciences, University of Florida, Gainesville, FL 32607, USA
*
Authors to whom correspondence should be addressed.
Water 2021, 13(10), 1363; https://doi.org/10.3390/w13101363
Submission received: 29 January 2021
/
Revised: 15 April 2021
/
Accepted: 21 April 2021
/
Published: 14 May 2021
(This article belongs to the Special Issue Management and Monitoring of Urban and Rural Ecological Water Resources)
Abstract
:The novel coronavirus disease (COVID-19) halted almost all the industrial scale anthropogenic activities across the globe, resulting in improvements in water and air quality of megacities. Here, using Sentinel-2A data, we quantified impact of COVID-19 lockdown on the water quality parameters in one of the largest perennial creeks i.e., the Buddha Nala located in District Ludhiana in India. This creek has long been considered as a dumping ground for industrial wastes and has resulted in surface and ground water pollution in the entire lower Indus Basin. Normalized Difference Vegetation Index (NDVI), Normalized Difference Water Index (NDWI), Normalized Difference Chlorophyll Index (NDCI), Nitrogen Content Index (NI), Normalized Difference Turbidity Index (NDTI), and Total Suspended Matter (TSM) were compared prior (2019) and during (2020) lockdown in the creek. There was a significant enhancement in NDVI, NDWI, NDCI, and NI values, and reduction in NDTI and TSM values during the lockdown period. When compared with prior year (2019), the values of indices suggested an improvement in water quality and an indicative change in aquatic ecology in the creek. The impact of the COVID-19 lockdown on the improvement in water quality of Buddha Nala was more evident in the upstream and downstream sections than the middle section. This is intriguing since the middle section of the creek was continually impacted by domestic household effluents. The earth observation inspired methodology employed and findings are testament to the discriminatory power to employ remote sensing data and to develop protocols to monitor water quality in regions where routine surveillance of water remains cost prohibitive.
1. Introduction
The devastating coronavirus pandemic (COVID-19) was first reported in December 2019 in Wuhan city, China [1,2] and has since spread in the entire world. The World Health Organization (WHO) reported, on 2 July 2020 at 05:30 GMT, that there are 10.5 million confirmed COVID-19 human cases (WHO, 2020) with a global reach of this disease in about 216 countries. About 627,168 human cases have been identified in India alone (https:/www.covid19india.org/, accessed on 2 July 2020) and the numbers continue to increase dramatically as of this study.
Rapid transmission of this virus generally occurs through human to human interaction. Without adequate supply of vaccines or medicines, most of the nations have resorted to a mechanism of widespread lockdowns to suppress transmissibility of disease in human population [3]. The Government of India enforced a total lockdown in country after midnight of 24 March 2020 [4] to limit spread of virus in human communities. In India, the nationwide lockdown was implemented in phases, such as phase 1 or Lockdown-1: 25 March 2020–14 April 2020 (21 days), Lockdown-2: 15 April 2020–3 May 2020 (19 days), Lockdown-3: 4 May 2020–17 May 2020 (14 days), and Lockdown-4: 18 May 2020–31 May 2020 (14 days). On May 30, it was announced that the lockdown restrictions would be lifted and existing lockdown would be extended to only containment areas (high risk regions) until June 30. This was termed as unlock 1.0, and unlock 2.0 which was declared from 1 July 2020 to 31 July 2020 (31 days). Studies have reported that environmental conditions in major industrial cities have improved in terms of reduced pollution either of the air or water around the world as a result of the lockdowns [2,5,6,7,8,9,10,11]. Social isolation had an additional effect on human life, economy, and environment [12]. As a result of aggressive lockdowns, factories/industries was forced to close their operations and transport networks were almost at a standstill. This apparently resulted in dramatic improvement in air quality across the megacities of India [2,3,13,14,15,16,17,18,19,20]. It was also expected that the riverine water ecology will be considerably improved [21,22], especially along those creeks which form a corridor passage between heavily industrialized cities and large rivers. Without strict implementation of river water quality standards in India, water bodies have been severely abused and polluted because of rapid urbanization, industrialization, and overexploitation of water resources. During the lockdown period, major industrial sources of pollution such as industrial wastewater disposal, crude oil, heavy metals, and plastics [23] were expected to have been stopped from mixing with natural water. Although level of water pollution was expected to diminish, yet quantification of the status of water quality during the lockdown period is important for two reasons since it (i) will provide a window of opportunity to rethink role of human activities through interventions to mitigate environmental pollution in the short- and long-term and (ii) provides an environment to explore new tools that can be used to quickly monitor water quality parameters and then compare it with historical available datasets.
In-situ methods for measurements of water quality parameters are precise, but are generally labor-intensive and time-consuming [24]. Moreover, these estimates are limited to point information, thus generalization of overall health of a stream is an oversimplification of a complex ecological issues of water stream [25]. In an exhaustive exercise (2018) carried out by the Central Pollution Control Board (CPCB), India’s Nodal Pollution Monitoring Agency, it had reported that India has over 351 polluted rivers (https://www.downtoearth.org.in/news/governance/as-told-to-parliament-july-15-2019-351-polluted-riverstretches-on-323-rivers-identified-during-2018-65647, accessed on 30 March 2020), and most of those are located along with large urban/industrial corridors [3]. The application of remote sensing based satellite data can provide a major breakthrough for a quick understanding of surface water quality. Satellite datasets can enhance utility of in-situ data and can provide spatially explicit and temporally frequent observational points that can be processed to map the extent and quality of water bodies at a regional or even global scale, and to monitor their dynamics at regular and frequent time intervals [26].
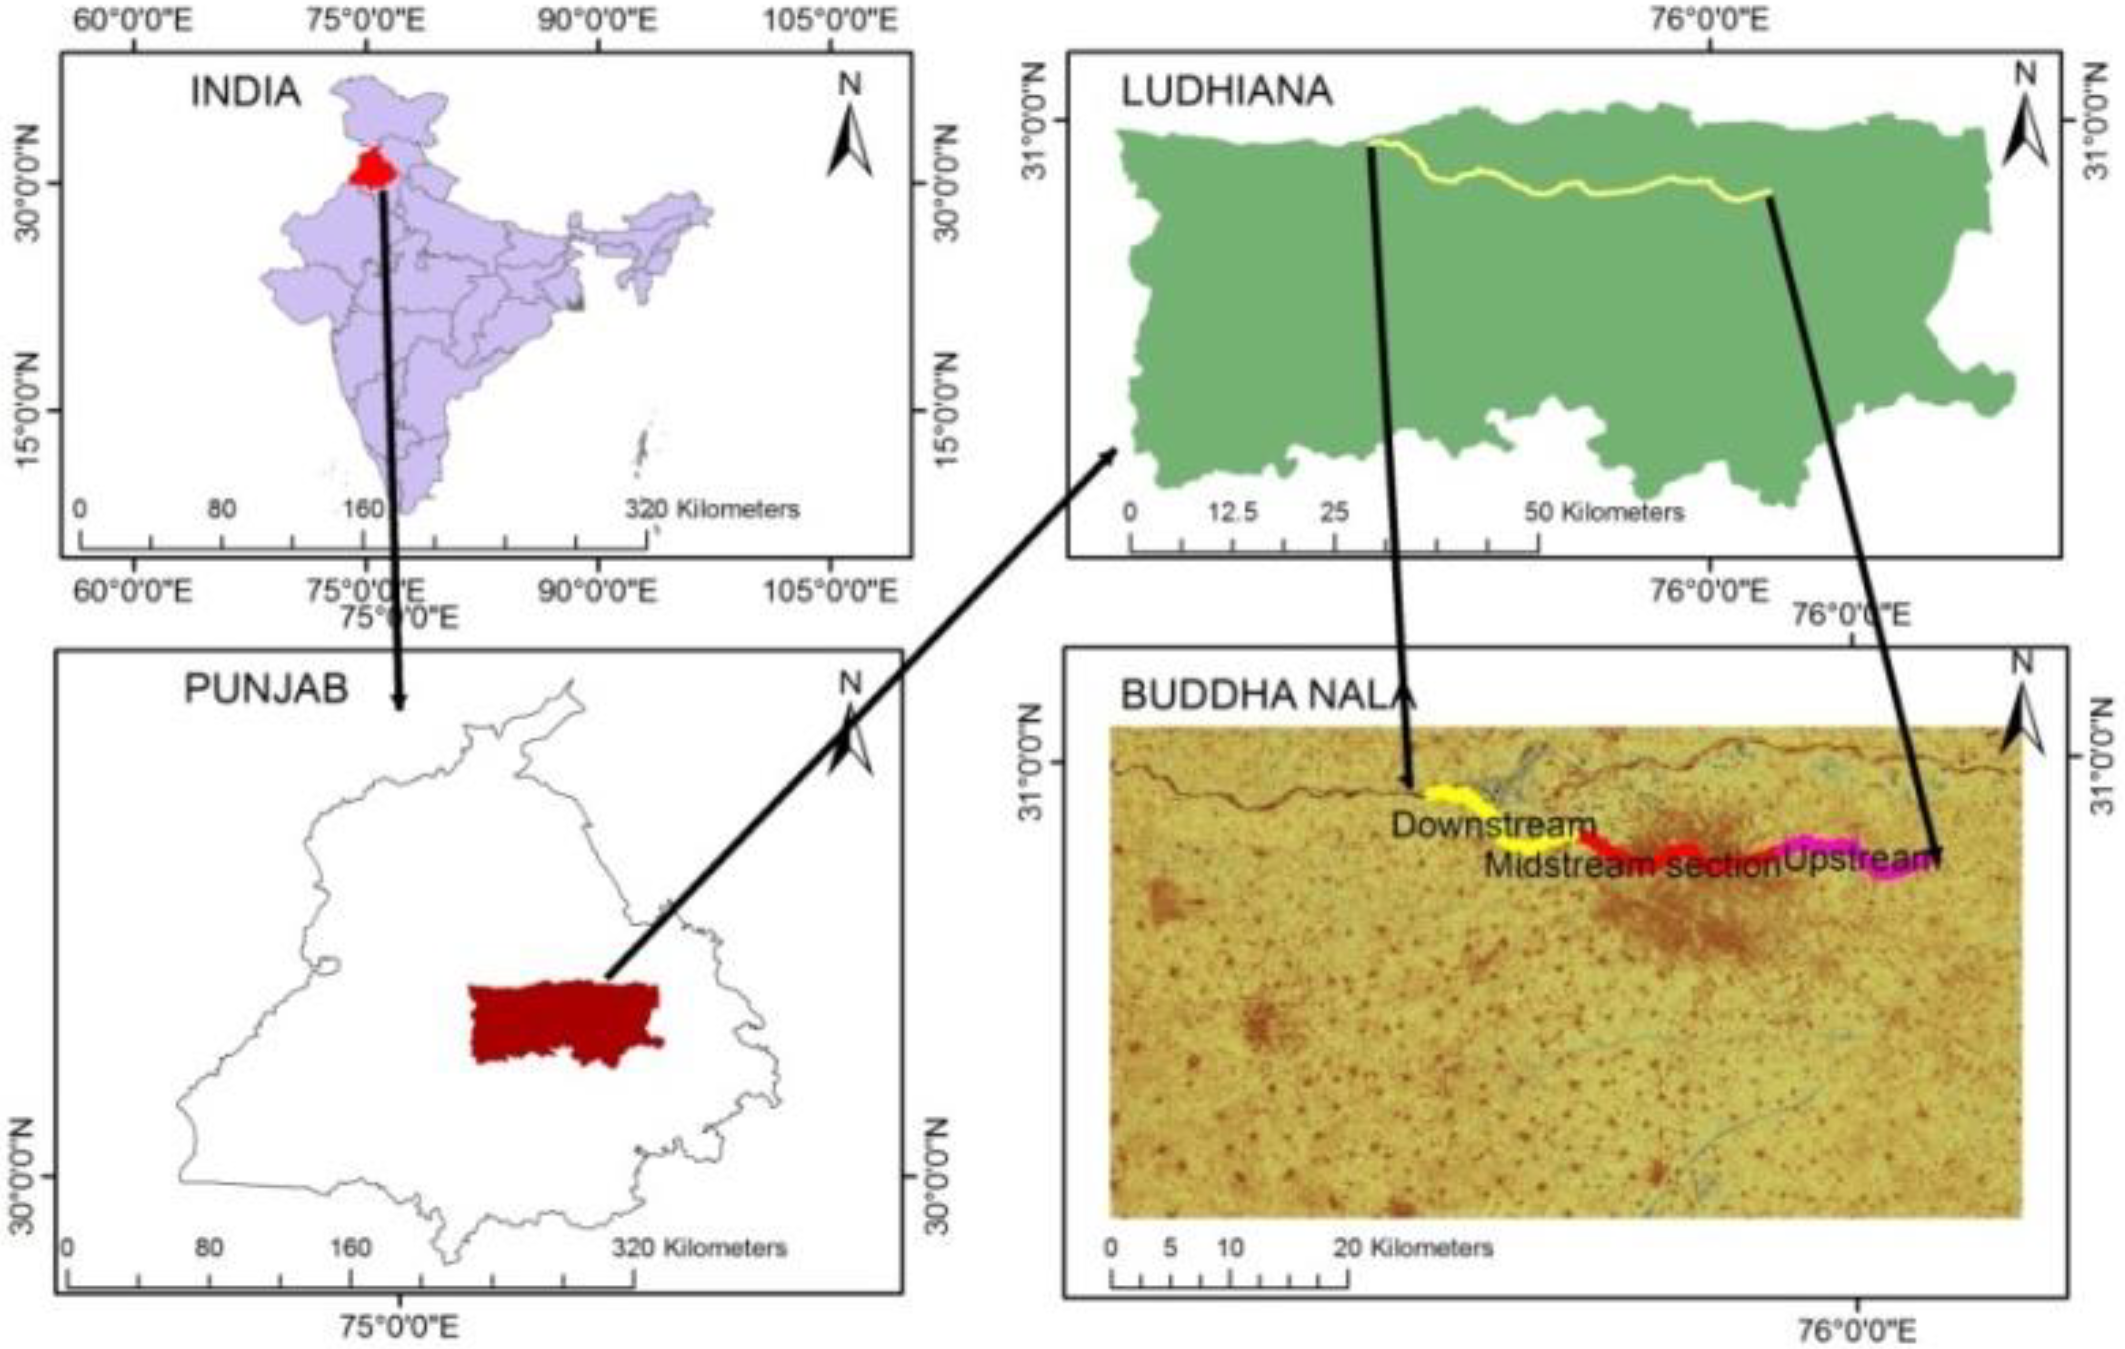
Our region of interest is Buddha Nala, which is an important drainage line of Ludhiana district in Punjab, India (Figure 1), is a tributary of Sutlej River. Historically, this creek was a source of clean water prior to rapid and uncontrolled industrialization along the banks of this creek. However, over the years, it is severely contaminated by accumulating industry effluents, sewage, dairy, and domestic waste, before draining into the Sutlej River, while flowing through the highly populous industrial city of Ludhiana. This contaminated water is being used by farmers to irrigate crops in this area and findings of several studies suggest accumulation of toxic metals in soils over a period of and uptake by crops that have resulted in high potential for phytotoxicity and an enhanced risk of entering into the food chain [27,28]. Hence, it has become paramount to regularly monitor the water quality of Buddha Nala. COVID-19 lockdown restrictions provided a window of opportunity to compare and contrast water quality parameters in this creek. In this study, an attempt has been made to quantify impact of COVID-19 lockdown on water pollution levels of Buddha Nala by analyzing the satellite data at appropriate spatial and temporal scales.
2. Study Area
Buddha Nala is a natural creek (or a flood drainage line) of Ludhiana district and meanders around 30°55′59″ N latitude and finally meets Sutlej at 30°58′59″ N and 75°37′49″ E. In the late nineteenth century, it was a clean water stream, as reported in the gazetteer of 1904: “Immediately under the high bank along the old course of the Satluj now runs a perennial stream called the Buddha Nala. The water, except during floods, is perfectly clear and is used freely for drinking purposes”.
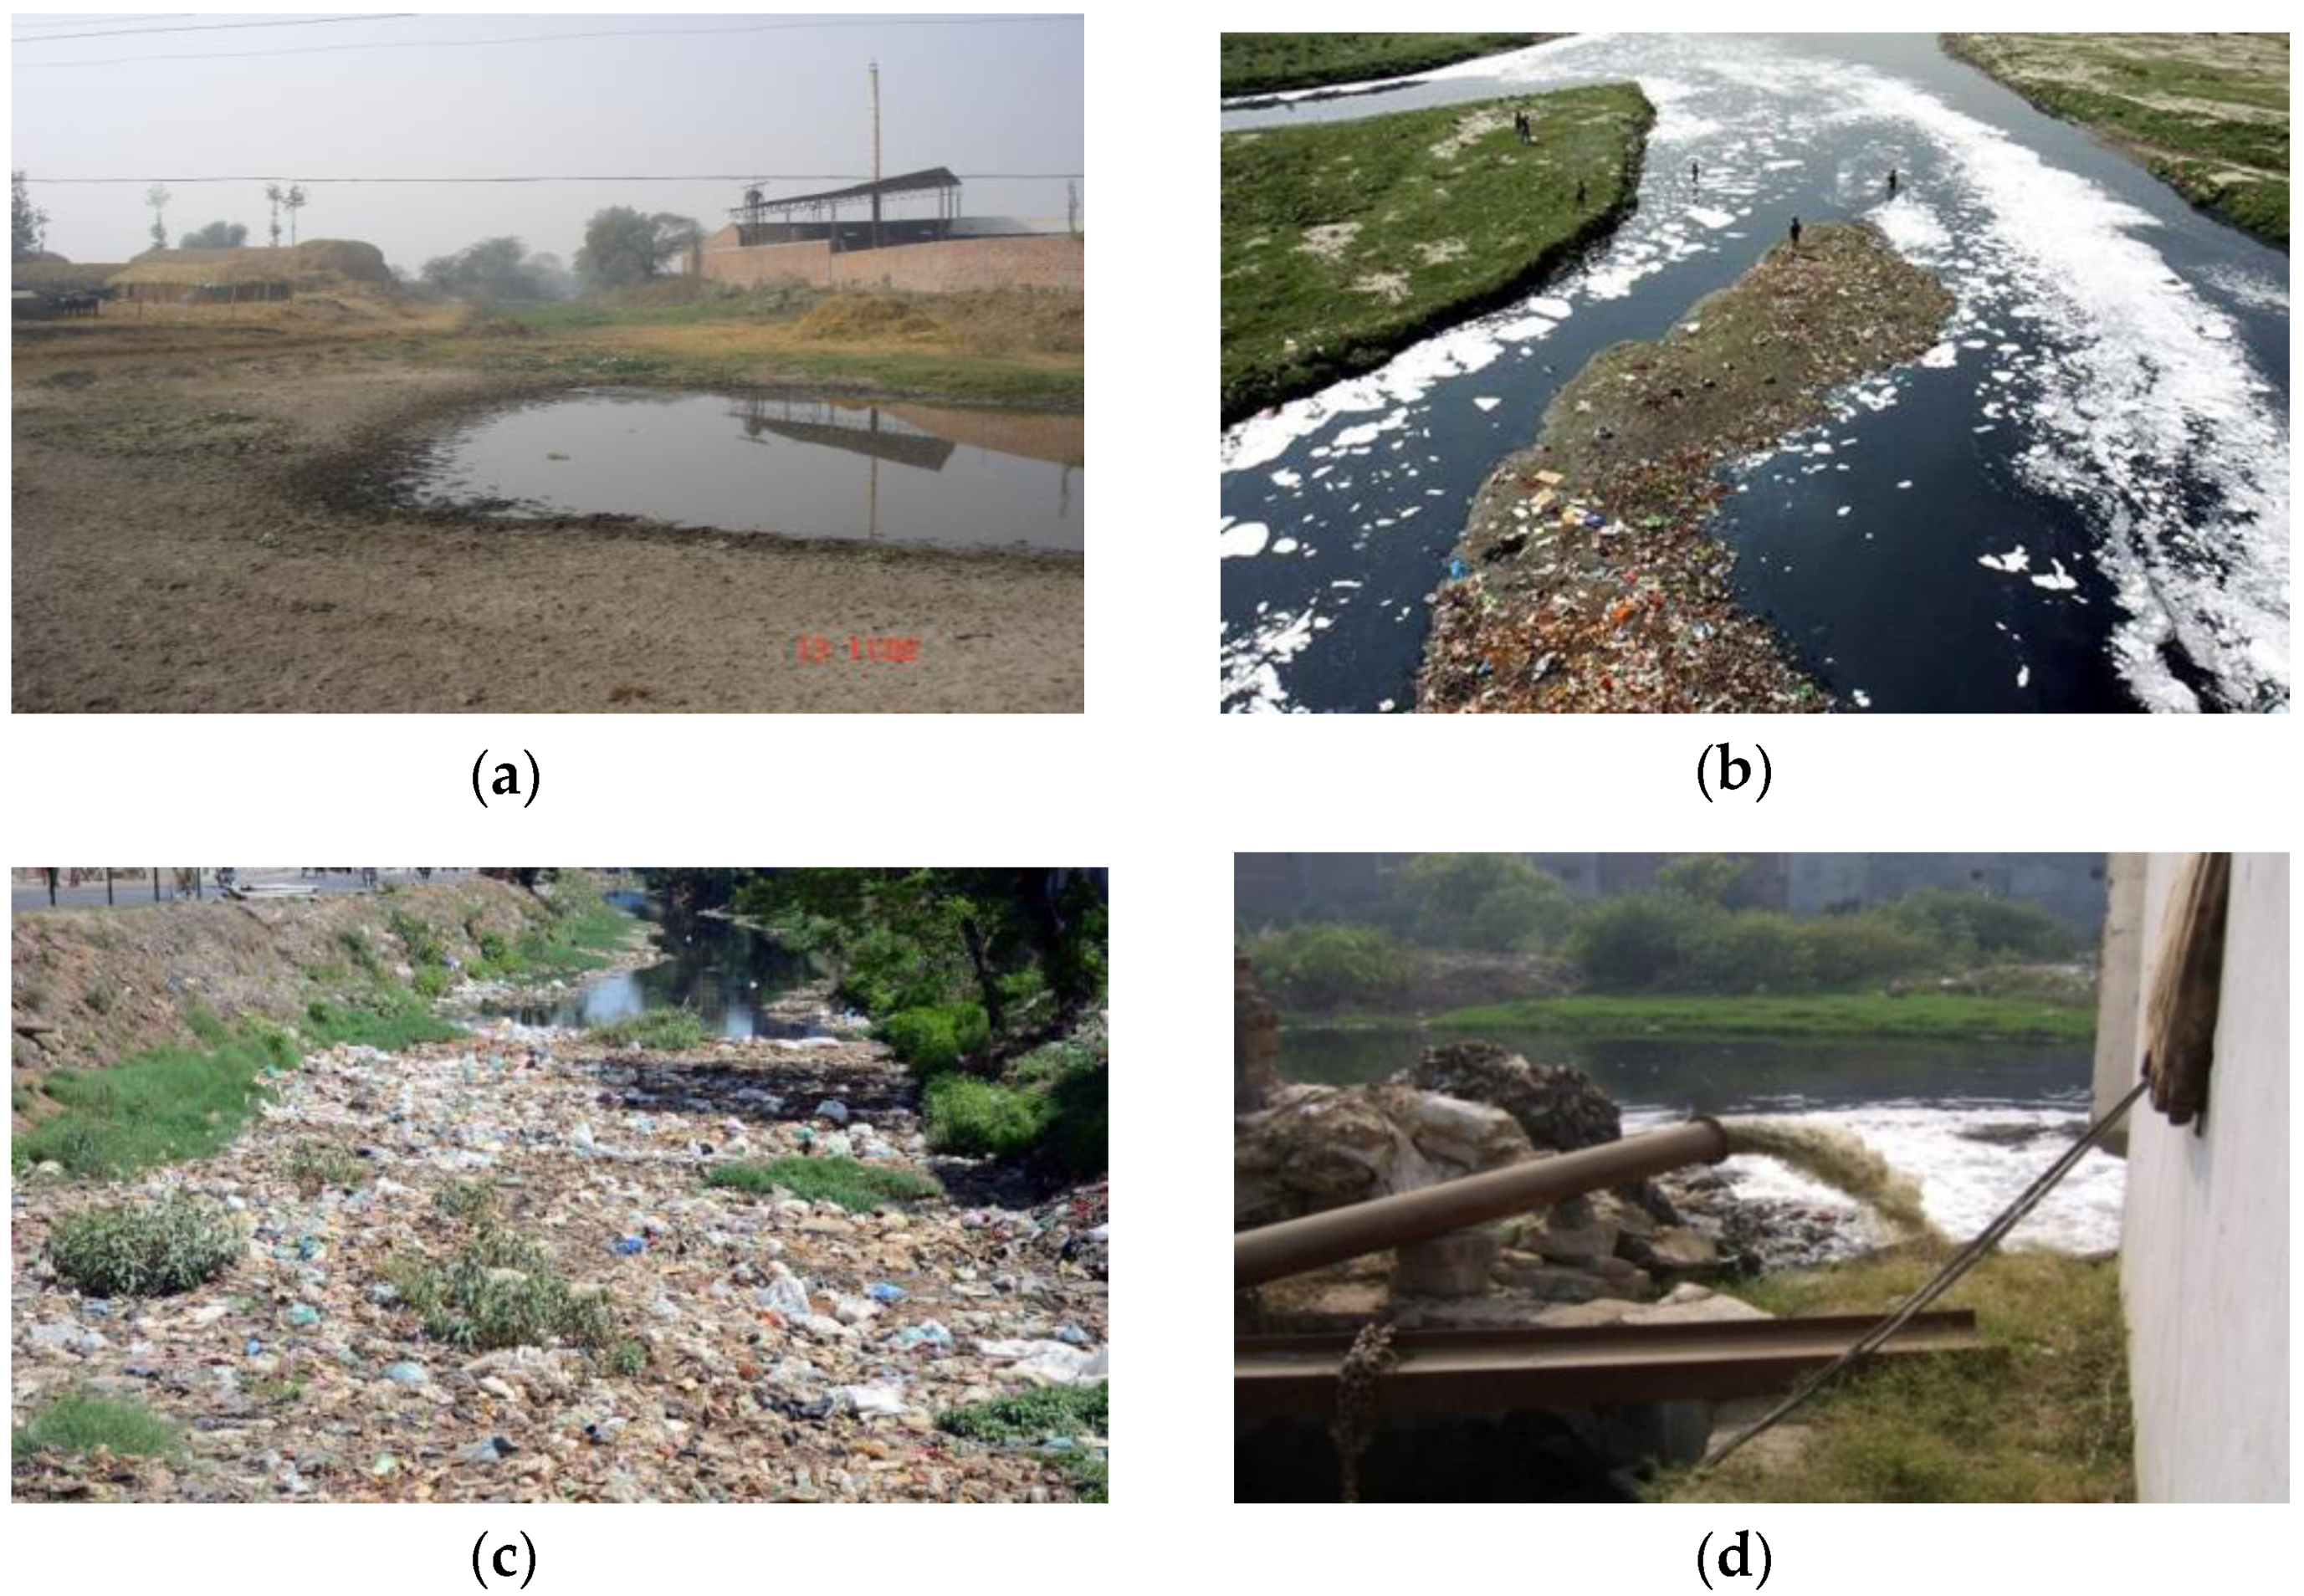
Buddha Nala, originates in the village of Koom Kalan of Ludhiana, Punjab, and runs for 47 km to Walipur Kalan, where it merges with the river Sutlej. This stream carrying freshwater was formerly known as ‘Buddha Dariya’. Over the years, the name got changed to Buddha Nala (drain) owing to the sewage, industrial and domestic waste that is dumped into it in the 14 km stretch within Ludhiana city municipal corporation limits beginning from Tajpur road (Figure 1). Of the total 2423 industrial units in Punjab polluting the Sutlej, the majority, 2028, are in Ludhiana, including 228 dyeing and 1649 electroplating and surface treatment units which directly or indirectly release untreated waste into the Nala (https://www.hindustantimes.com/cities/lockdown-effect-effluent-discharge-in-ludhiana-s-buddha-nullah-drops/story-uUFPVk7yWWxBRW727eztwK.html, accessed on 30 March 2020). Once an asset to the city, the stream is now a source of public nuisance and poses a serious health hazard. It has polluted surface water as well as groundwater. Residents in many colonies in the city of Ludhiana have been compelled to remain in the midst of stench and in fear of disease outbreaks for several days after rotting, contaminated water from overflowing Buddha Nala flooded the streets and their homes (Figure 2).
3. Materials and Methods
3.1. Data Used
Sentinel-2A dataset was used to estimate the water quality parameter of Buddha Nala. Sentinel-2A satellites were launched on 23 June 2015. It is a multi-spectral instrument (MSI) that provides data in 13 spectral bands ranging from visible and near-infrared to short wave infrared (443–2190 nm) regions, with a swath width of 290 km. Sentinel-2A data have the spatial resolution of 10 m (four visible and near-infrared bands), 20 m (six red edge and shortwave infrared bands), and 60 m (three atmospheric correction bands). Description of each band and wavelength regions are given in Table 1.
For the years 2019 and 2020, data was downloaded for different dates in the same month (March, April, May, and June). For year 2019, data of 9 March, 24 April, 28 May, and 12 June 2019 was collected, based on the visibility. Similarly, for year 2020, data was downloaded for 18 March 2020, 27 March 2020, 7 May 2020, 27 May 2020, and 26 June 2020; according to the dates of various phase of lockdown and unlock conditions, declared by the Government of India. Six different remotely sensed indices (shown in Table 2) were analyzed to represent water quality parameters, namely Normalized Difference Vegetation Index (NDVI), Normalized Difference Water Index (NDWI), Normalized Difference Chlorophyll Index (NDCI), Normalized Turbidity Difference Index (NDTI), Nitrogen Index (NI), and Total Suspended Matter (TSM).
Field data regarding discharges and water quality were obtained for upstream and downstream section from Punjab Pollution Control Board (PPCB) (http://www.ppcb.gov.in/index.aspx, accessed on 30 March 2020) and Irrigation Department to validate findings of our study. Accordingly, average discharge into Buddha Nala for March 2, March 16, and March 22, of the year of 2020 was recorded as 255 cubic feet per second (cusecs), 220 cusecs, and 197 cusecs respectively, and during the lockdown periods there has been no discharge from the industry and only the sewerage water is entering the drain so far (https://www.hindustantimes.com/cities/lockdown-effect-effluent-discharge-in-ludhiana-s-buddha-nullah-drops/story-uUFPVk7yWWxBRW727eztwK.html, accessed on 30 March 2020).
3.2. Estimation of Water Quality Indices
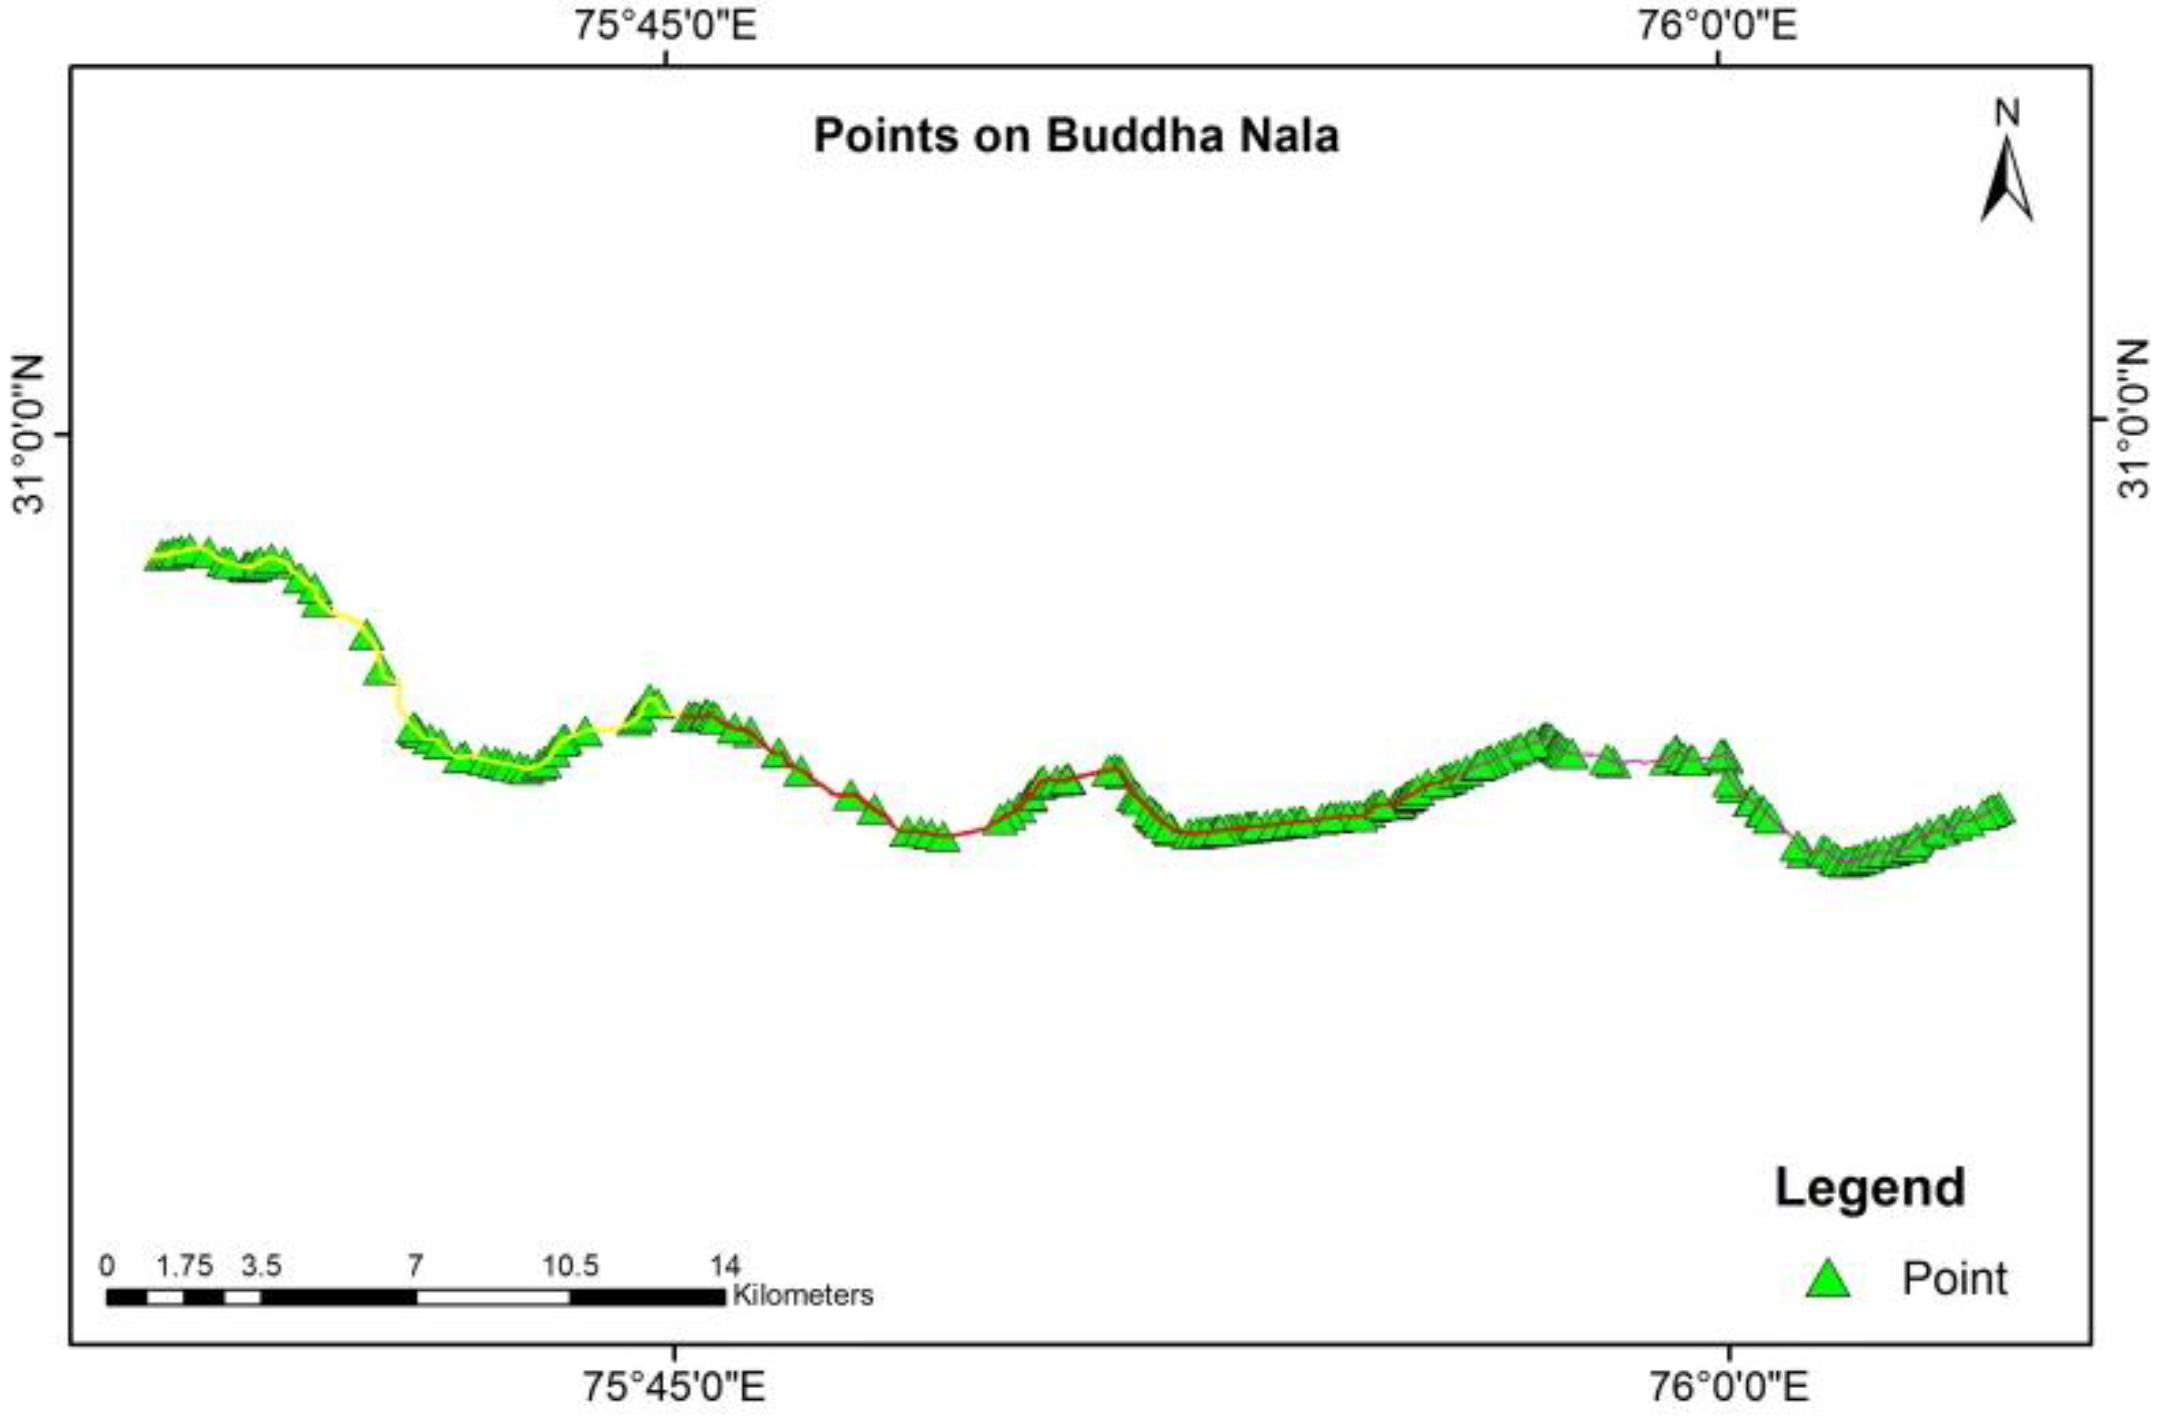
Shapefile of Buddha Nala was extracted from Google Earth Engine. Since in-situ collection of water sample during lockdown period was not possible, remote sensing and GIS techniques have been applied to analyze the spatial distribution of water quality at Nala section [29,30,31]. Water quality indices, e.g., NDVI, NDWI, NDCI, NDTI, NI, and TSM, were estimated by using band rationing of different band of Sentinel-2 for this creek. NDTI increases with turbidity. TSM values increase with increasing total suspended solids. Similarly, higher value of NDVI, NDCI, and NI indicate high vegetation growth and positive values of NDWI are suggestive of improvements in water quality. Different bands were clipped from shapefile of Buddha Nala and rationing was done by using the empirical equations shown in Table 2. Average pixel was identified from the different bands in Buddha Nala section for estimation of indices. Indices were calculated in ArcGIS domain by using a raster calculator and were represented in spatial form. The points were dropped on different sections of Buddha Nala and raster values for indices were extracted using “extract values to point” tool of ArcGIS. Visual representation of indices was also done for understanding changes of indices values with time in various creek sections. Different indices were compared with values of previous year (2019) to verify change in water quality of Buddha Nala as a function of phase wise country-wide lockdown. Buddha Nala was further divided into 3 sections namely upstream, middle, and downstream sections, wherein the middle section passes through Ludhiana city and discharges industrial and domestic effluents, while the upstream and downstream section were composed of predominantly agricultural croplands. Spatial resolution of freely available data is one of the limitations in conducting precise analysis for a small area. Therefore, in this study, width of Buddha Nala varied between 10 to 20 m. Average water quality index for each of the section was obtained by averaging the values of point indices (213 points) and analyzed (Figure 3).
4. Results and Discussions
4.1. Results
4.1.1. Comparison of Indices Prior and during Lockdown Period
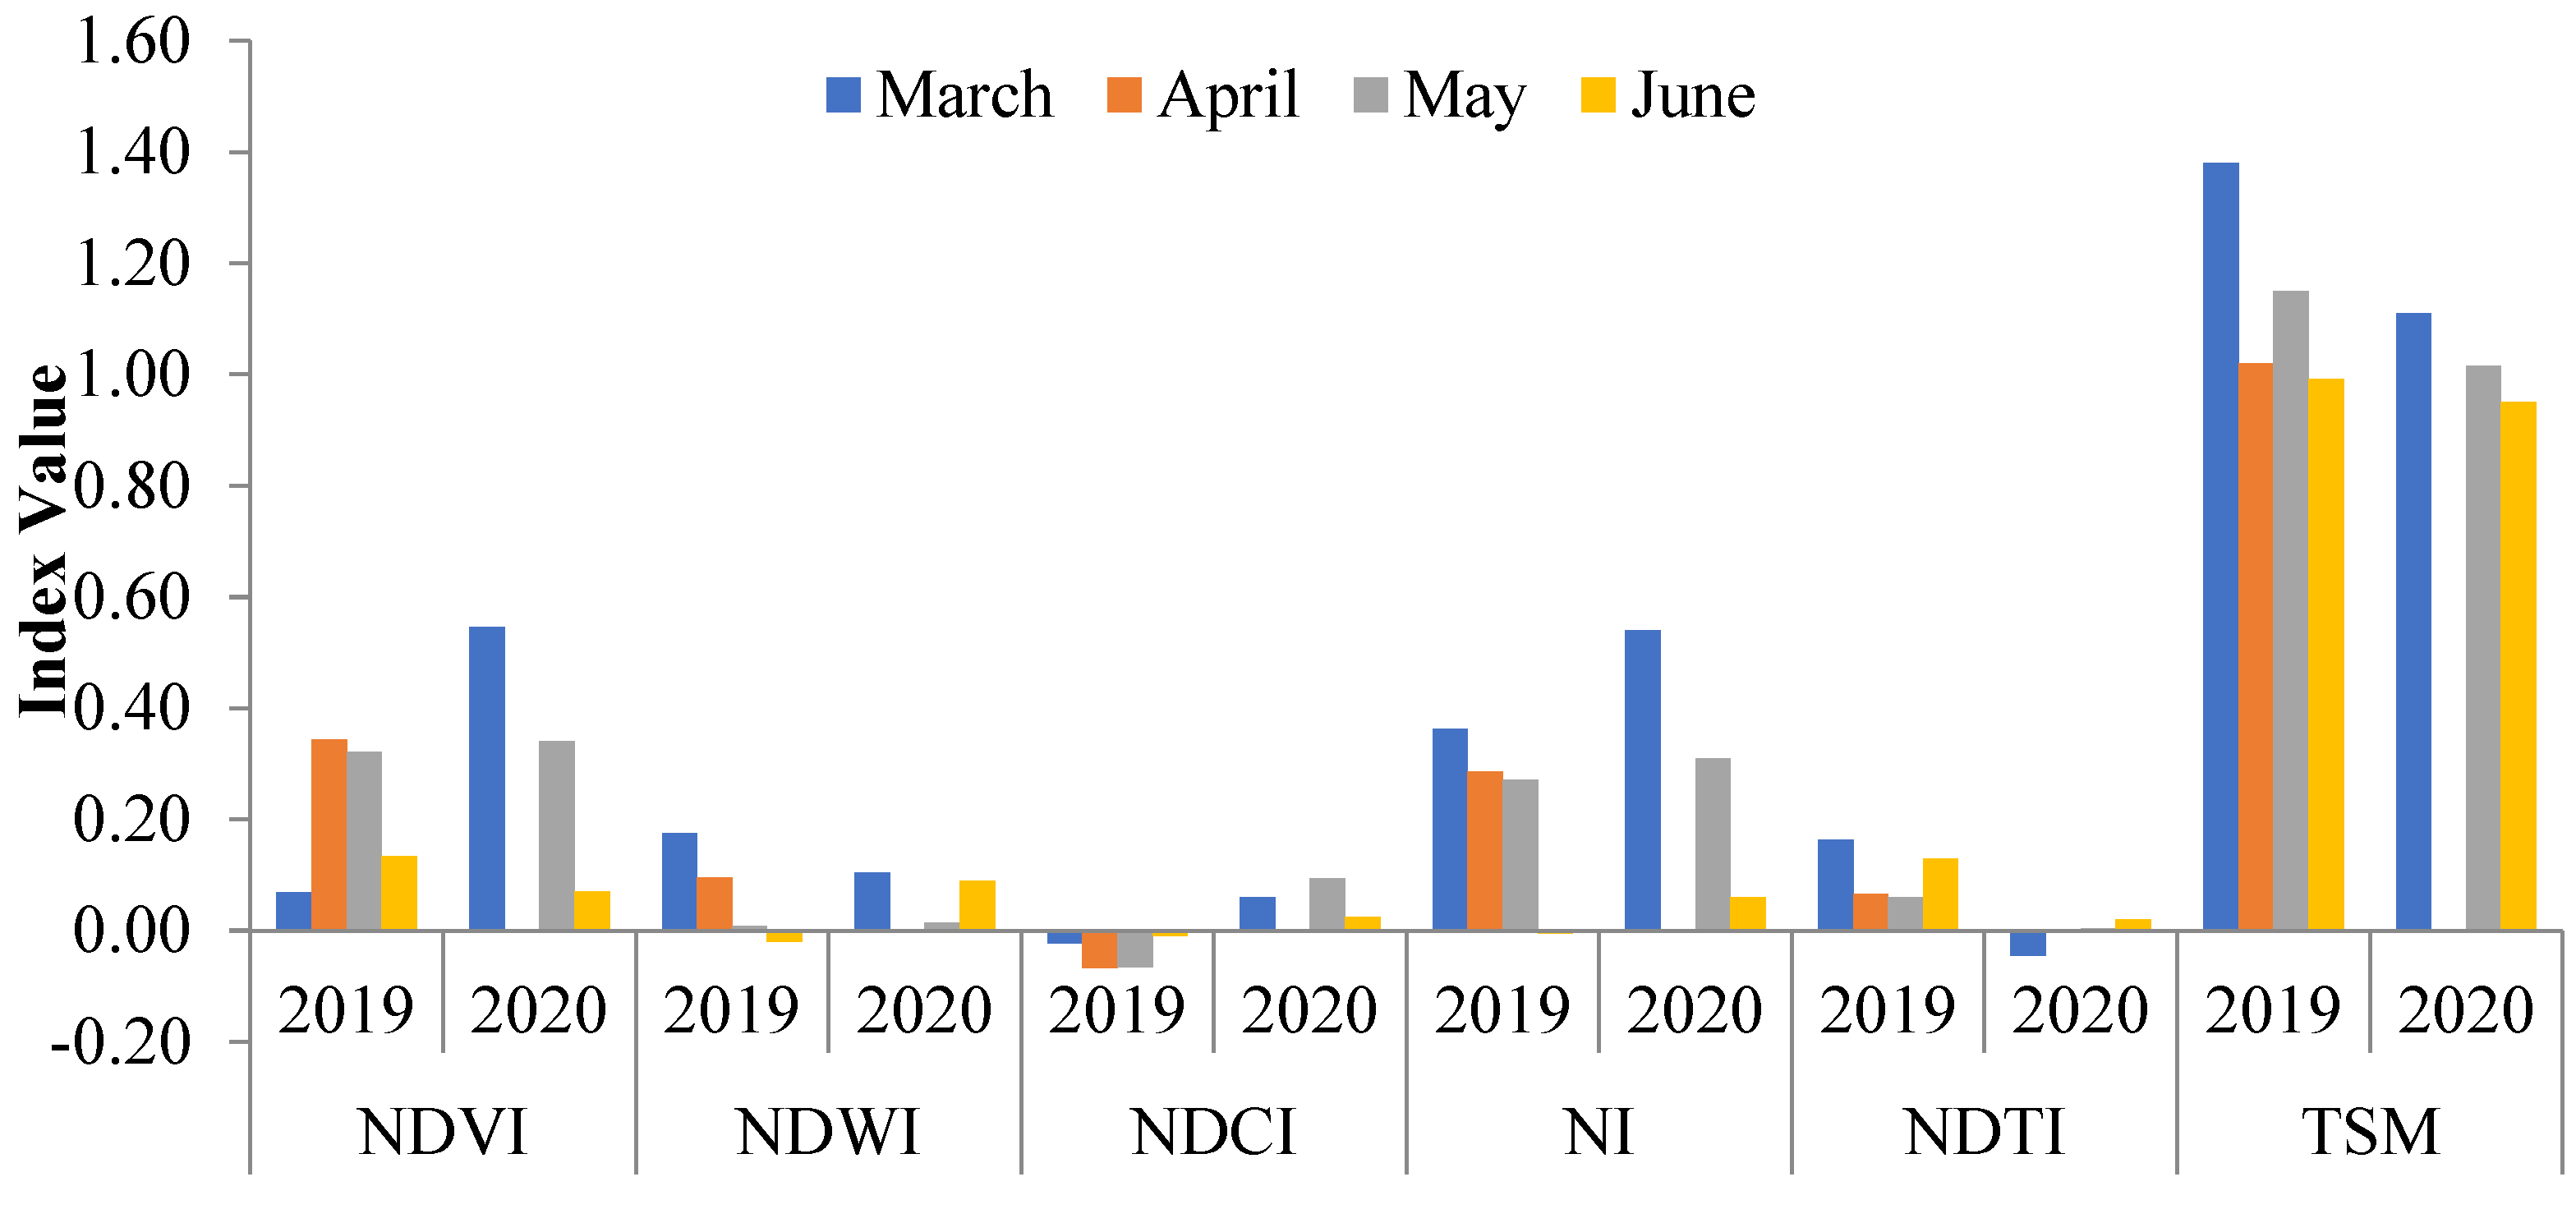
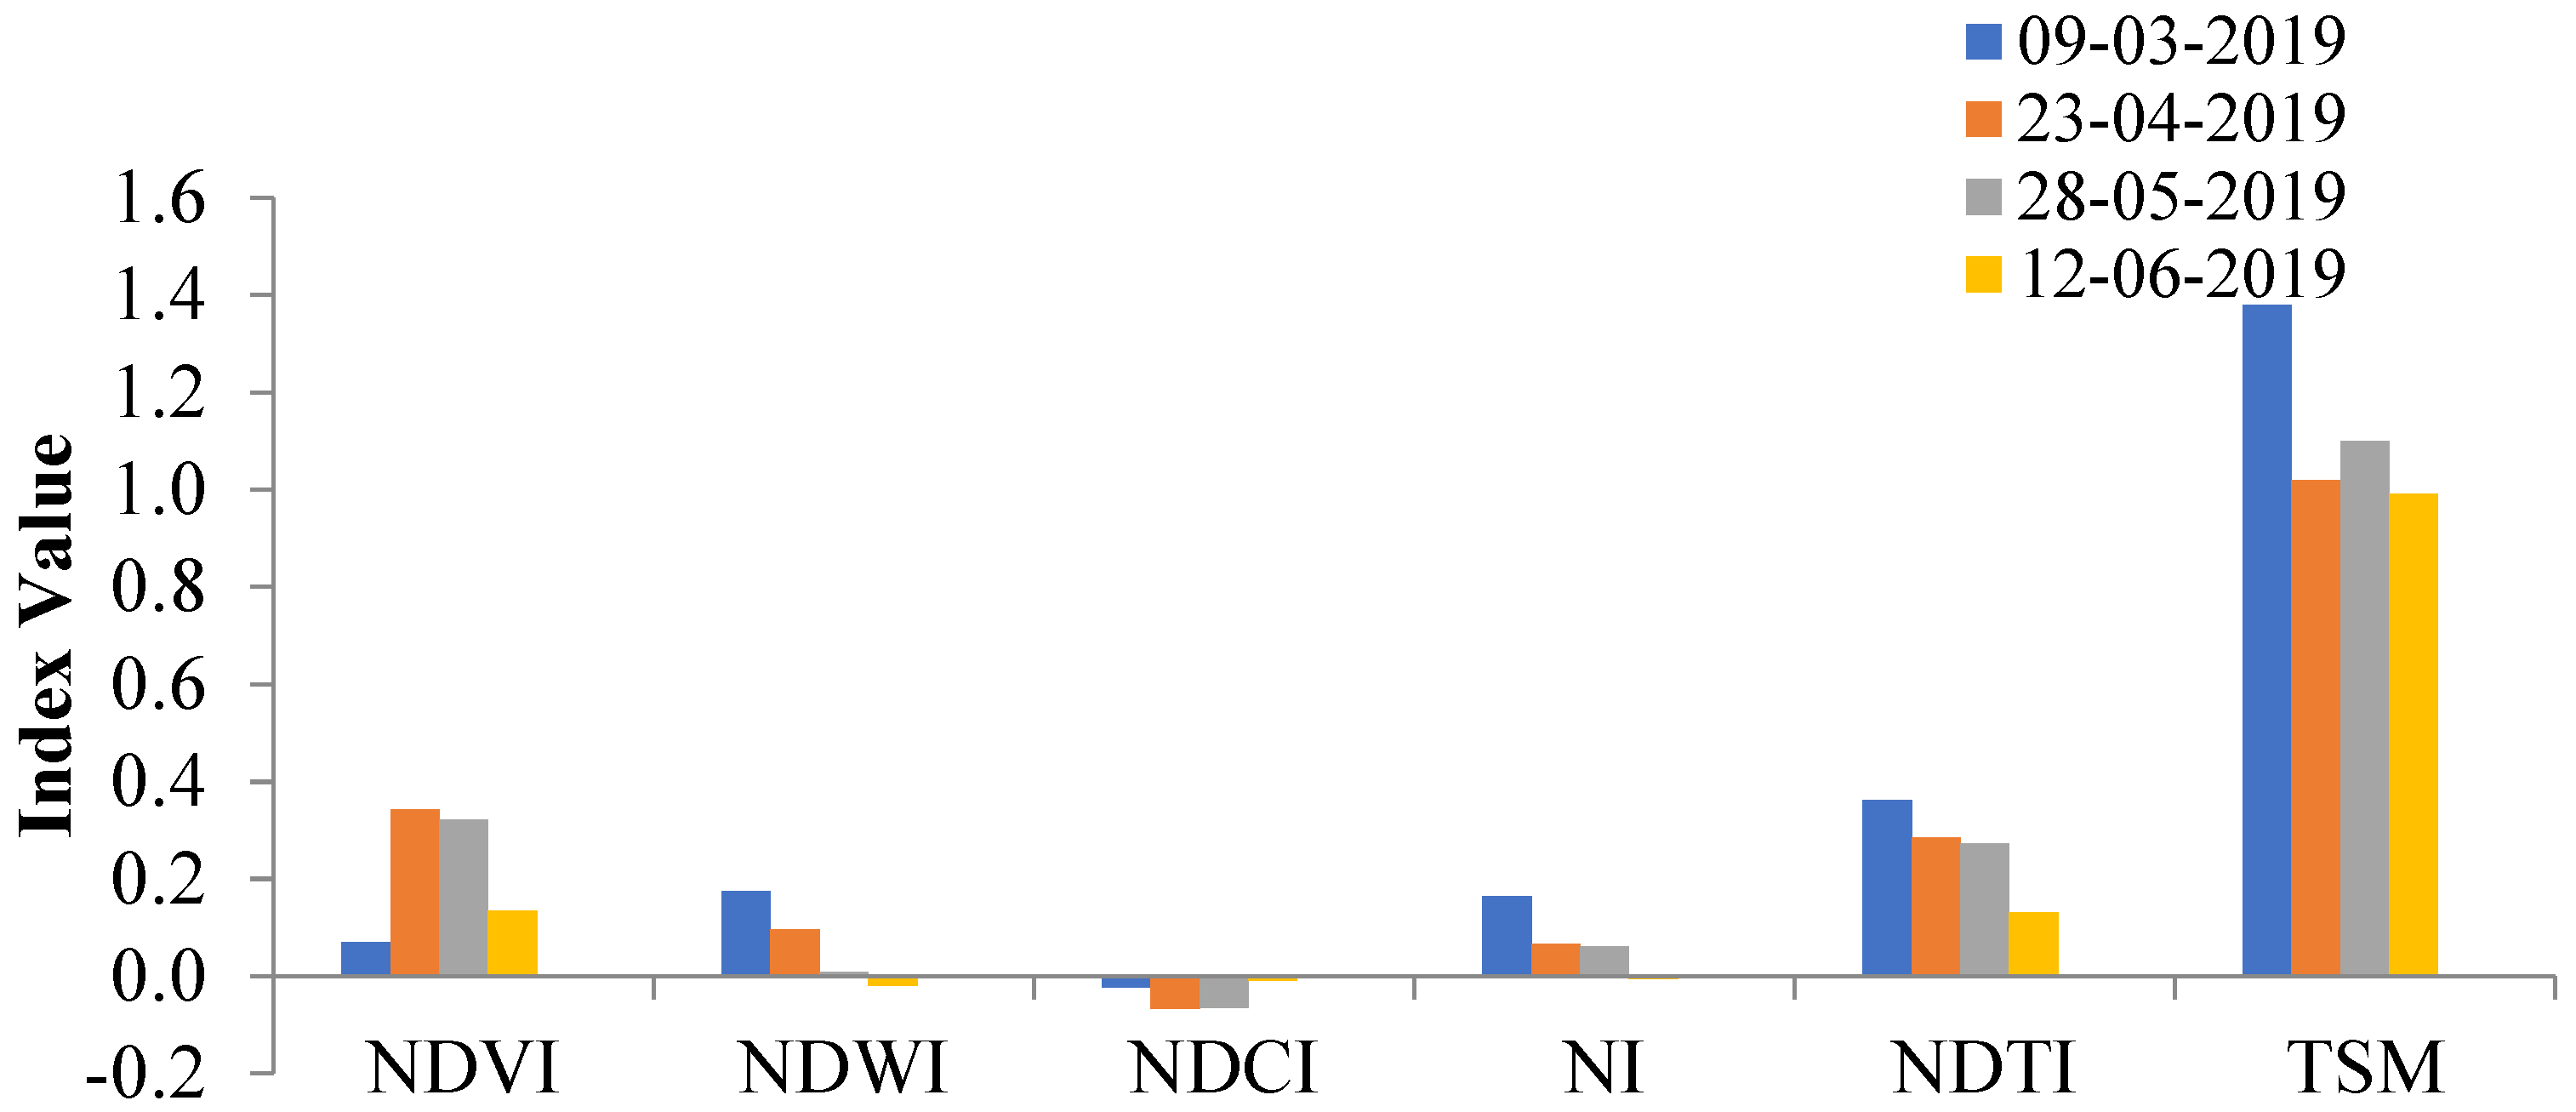
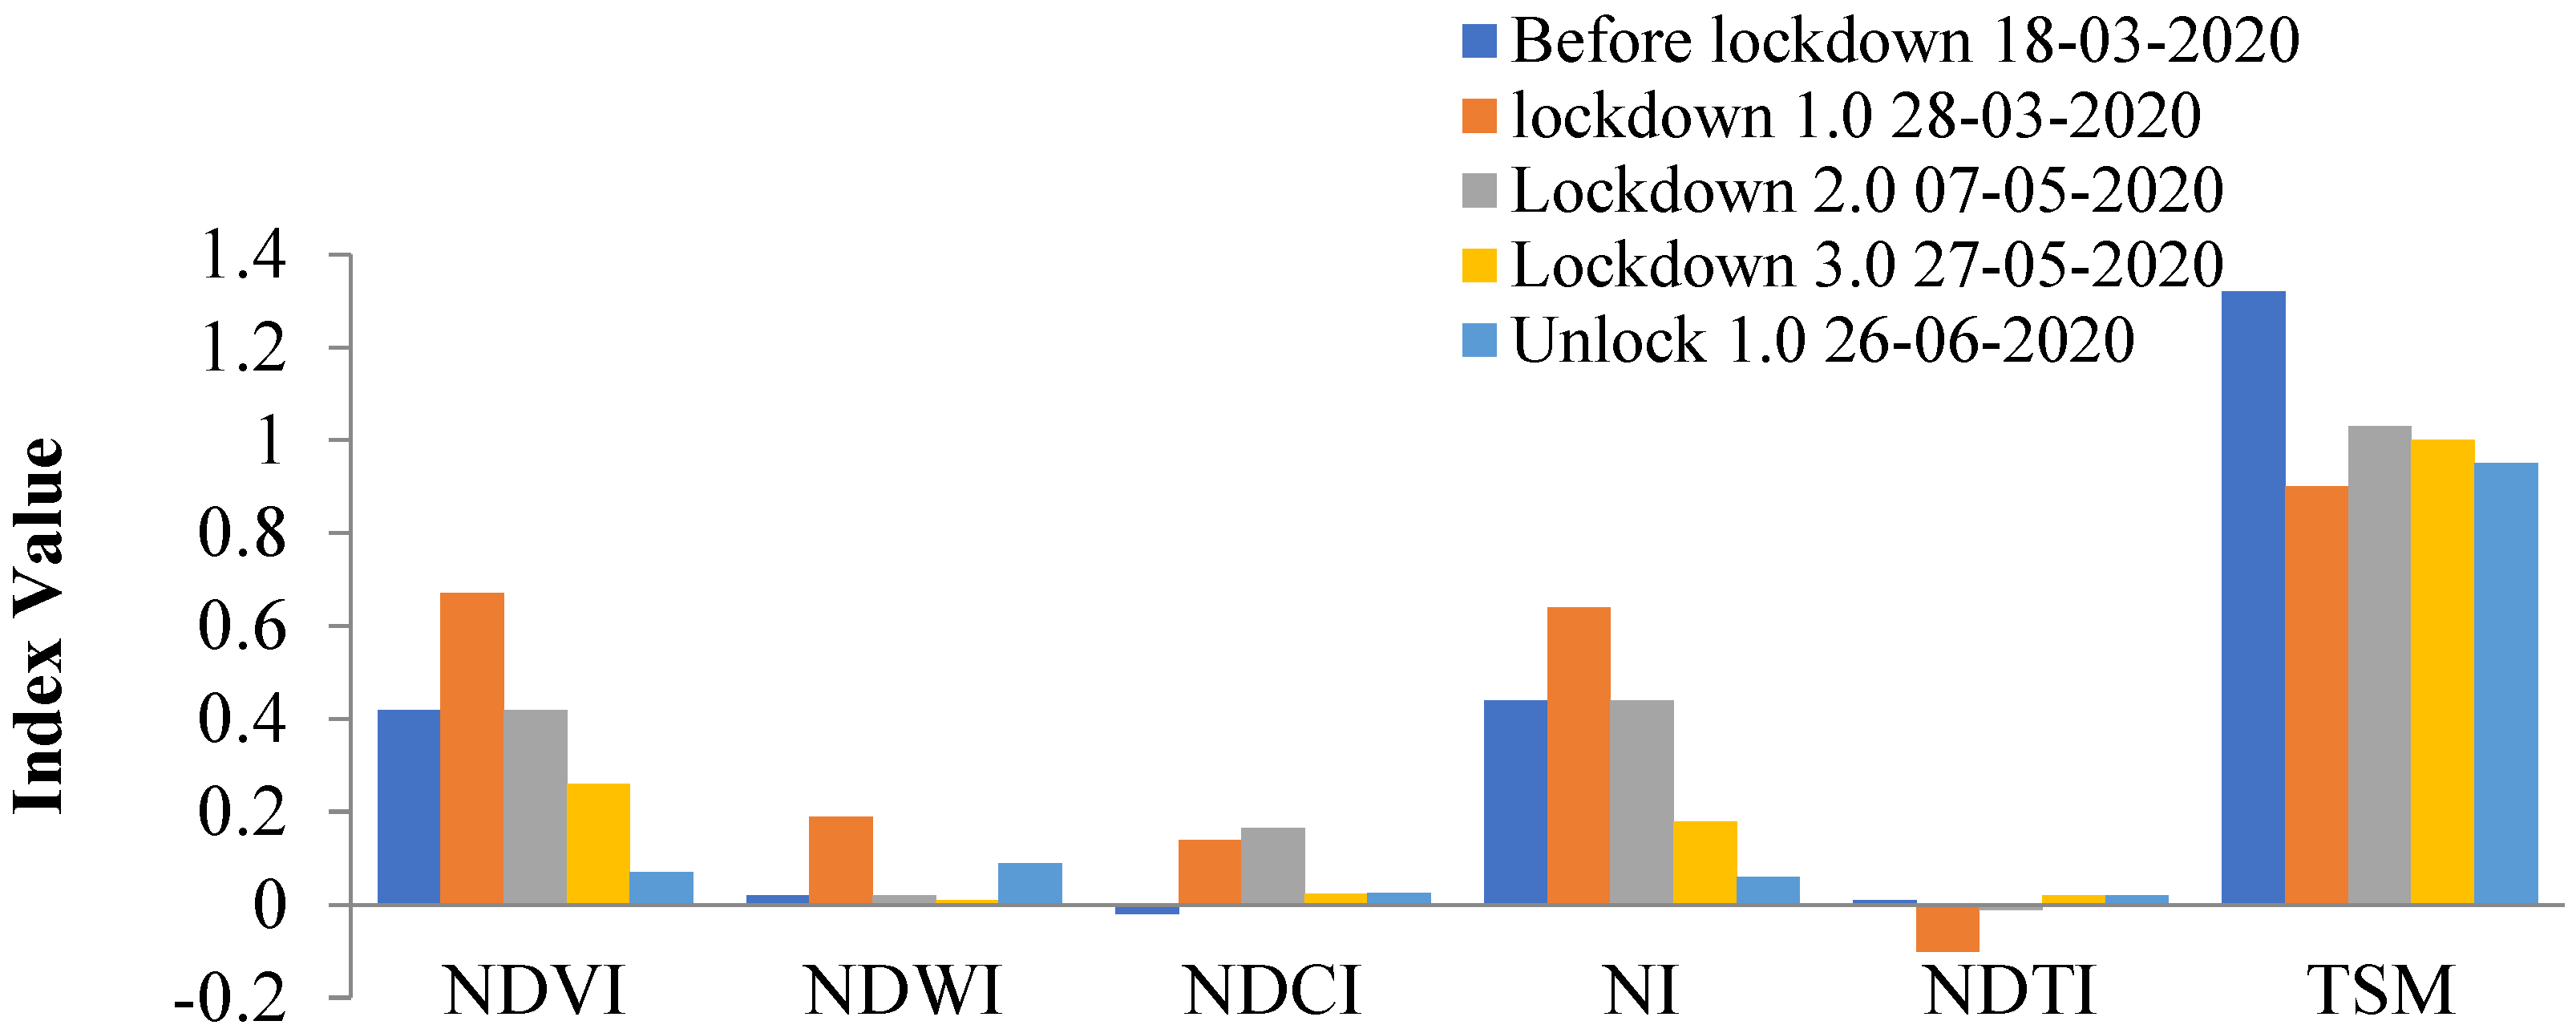
When compared with 2019 for same months, NDVI, NDWI, NDCI, and NI showed a significant improvement in values. NDTI and TSM values decreased during the COVID-19 lockdown (Figure 4 and Table 3). The water quality indices also varied with different phases of lockdown, with NDVI, NDWI, NDCI, and NI values showing an increase and NDTI and TSM values decreased during the first phase of lockdown. The statistical t-test (α = 0.05) confirmed a significant variation in water indices for the years of 2019 and 2020, and before and after lockdown (Table 3).
Variation of water quality indices during different months for the years of 2019 and 2020 are shown in Figure 5 and Figure 6. Monthly variation of indices was first calculated for particular months of the year 2019 and 2020. There was a significant variation in indices values from March to May, for year 2020 and 2019. In March, 2020 some indices namely NDVI, NDWI, NI, and NDCI were of lower values, while NDTI and TSM was higher when compared with values during the month of April and May 2020. Values again, deteriorated in the month of June 2020. Monthly variation in NDVI and NDWI values were comparable for both years; although there was a significant increase in NDVI for the year 2020. NDVI values generally range between −1.0 and 1.0. Lower NDVI values (NDVI < 0.2) indicate moisture−stressed vegetation whereas higher values (NDVI > 0.2) is indicative of greener vegetation in Buddha Nala [32,39]. The result of NDVI implies; that the water quality improved and supported growth of vegetation in and around creek section, which was not evident in the similar months of previous year (2019). Many researchers have used NDCI to quantify the chlorophyll−a concentration in turbid water. It ranges from −1 to +1, as the positive values indicate high chlorophyll concentration in water [31,34,40,41,42] and negative values (NDCI < 0) indicate the low chlorophyll presence in the water body. NDCI has negative values ((NDCI < 0) in year 2019, which increased significantly during the year 2020. Similarly, NI values were also increased in 2020. This indicates enhanced vegetation activity in Nala, and probable reduction in the pollution levels. Decrease in turbidity level and total suspended matter in the creek were also evident from low NDTI and TSM values in 2020 as compared to 2019 for all months under consideration. The negative values of NDTI denote relatively clean water, whereas values above 0.2 are rather turbid [3,35,42]. In 2020, there was an increase in NDTI and TSM values after lockdown 4.0 and unlock 1.0 due to many relaxations provided by the government in the industrial and other agricultural activities. It was also observed from the analysis that water quality deteriorates in summer months.
4.1.2. Section Wise Analysis
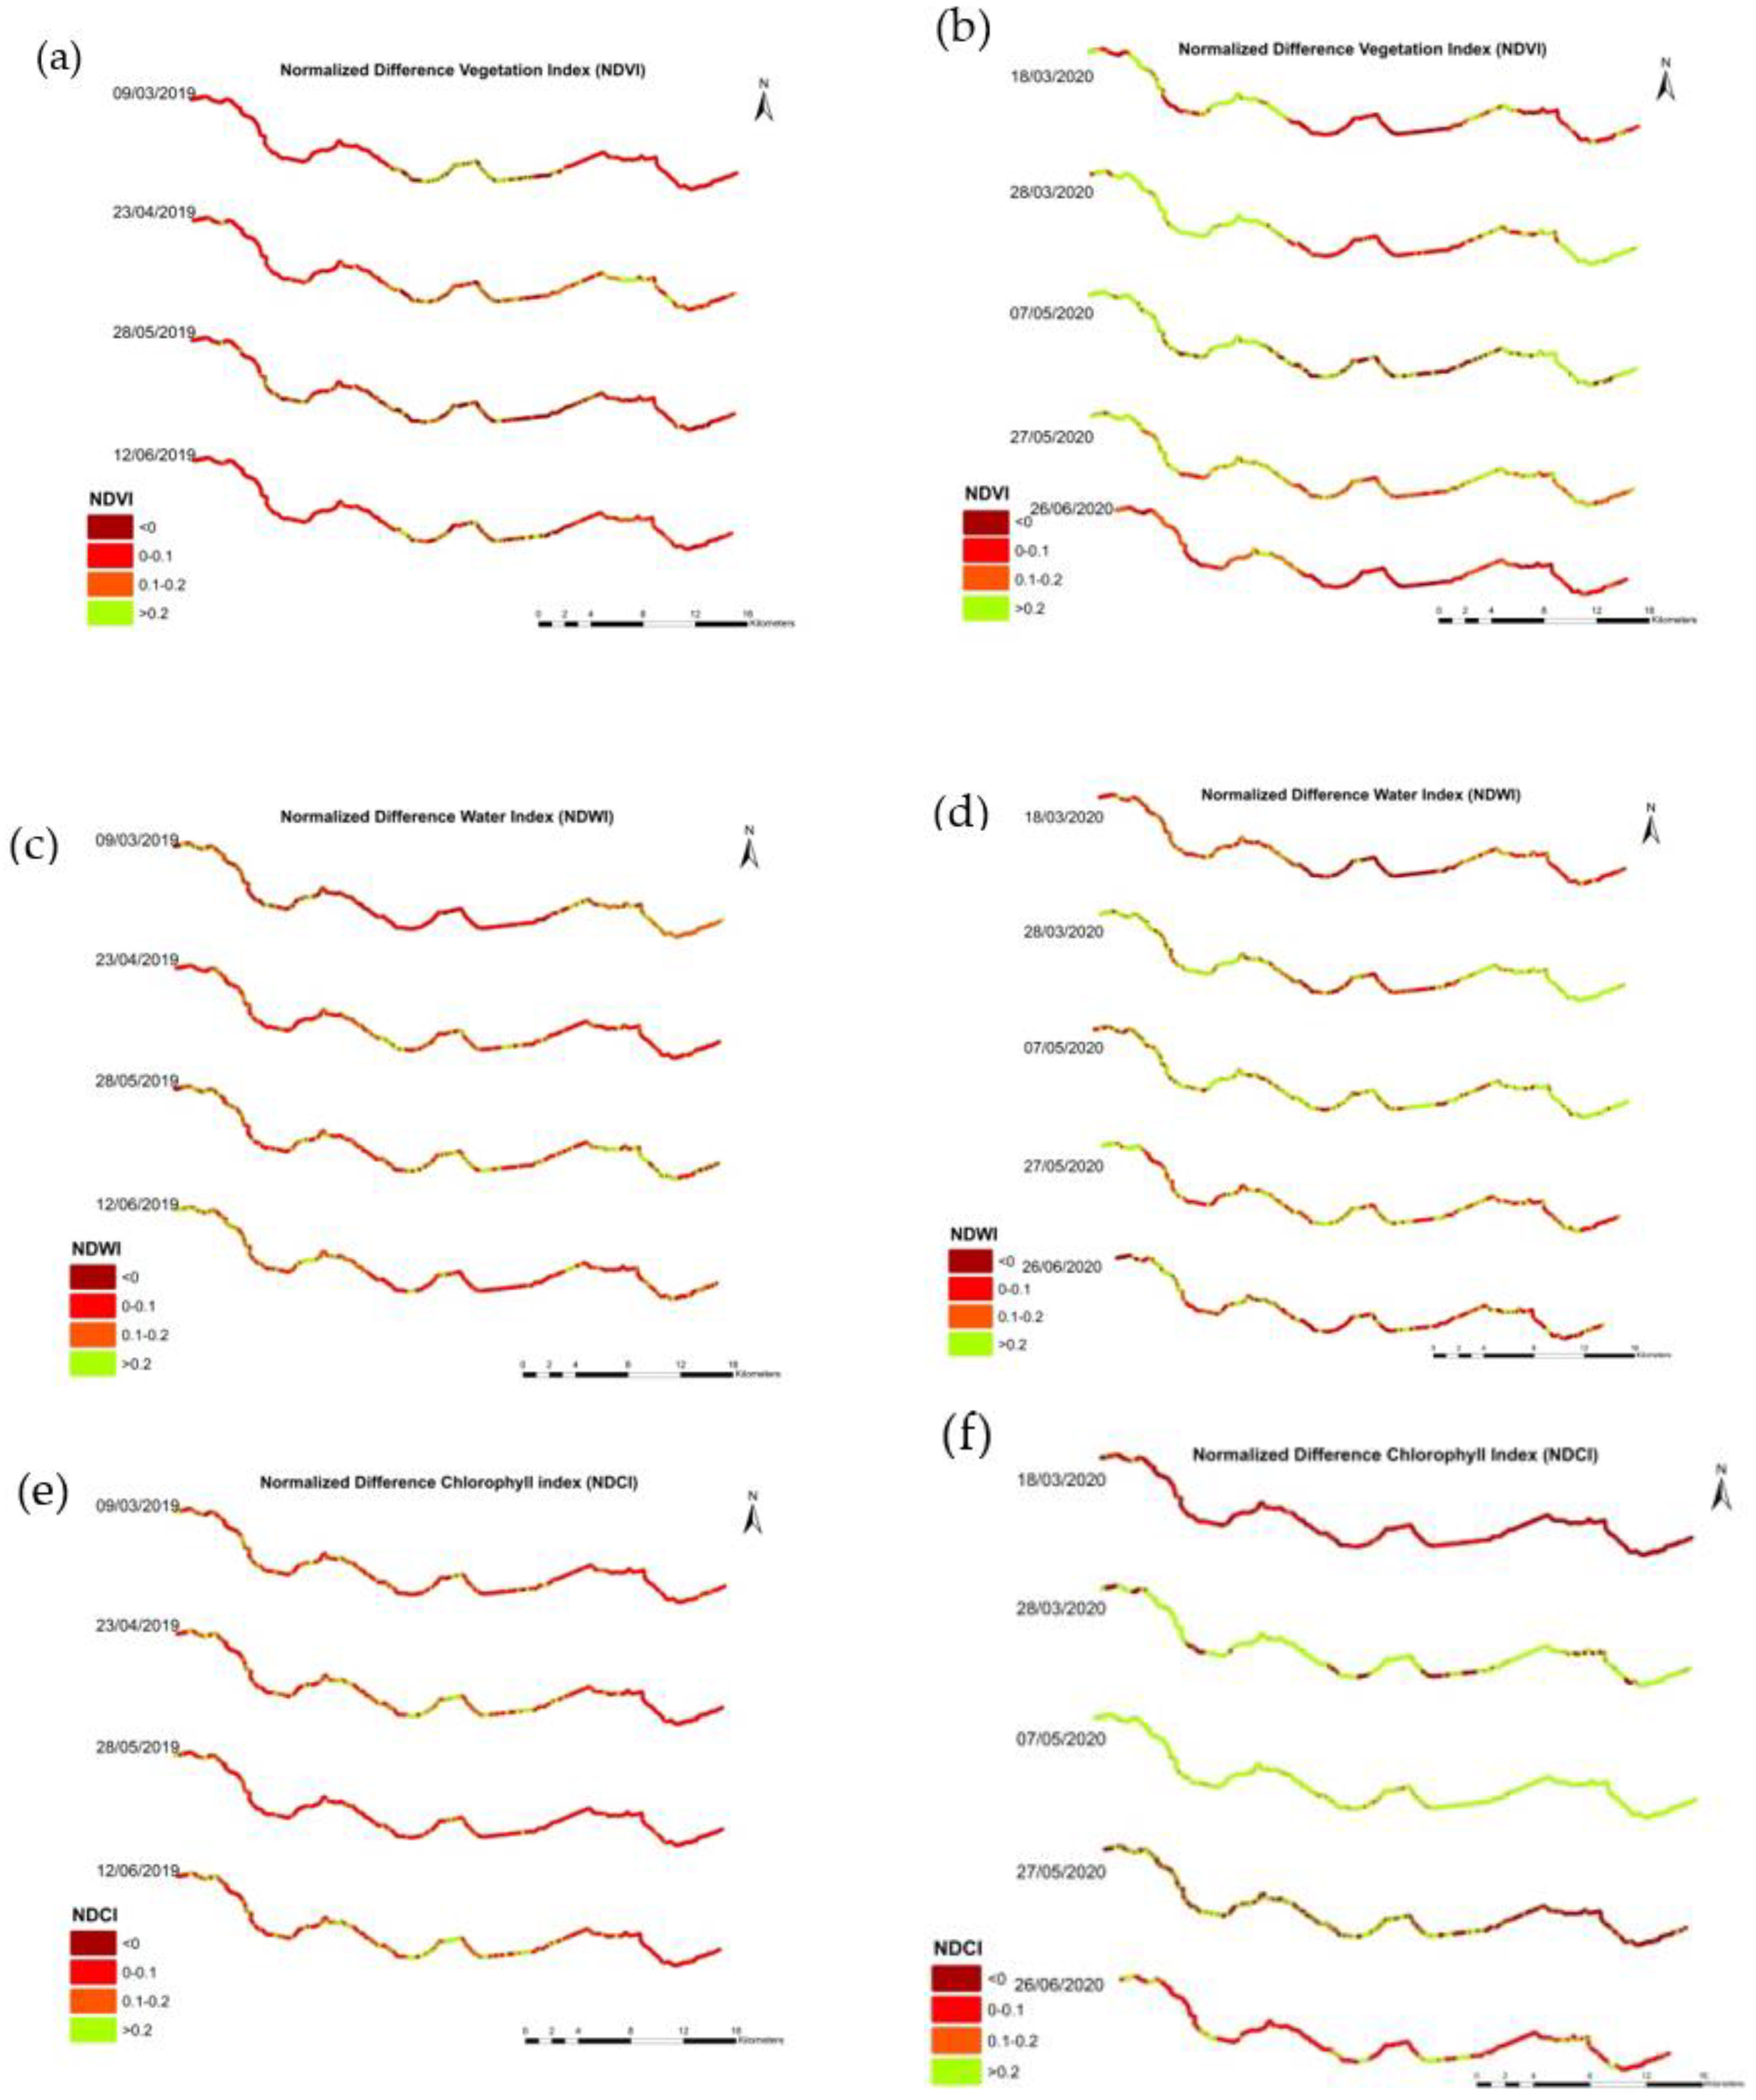
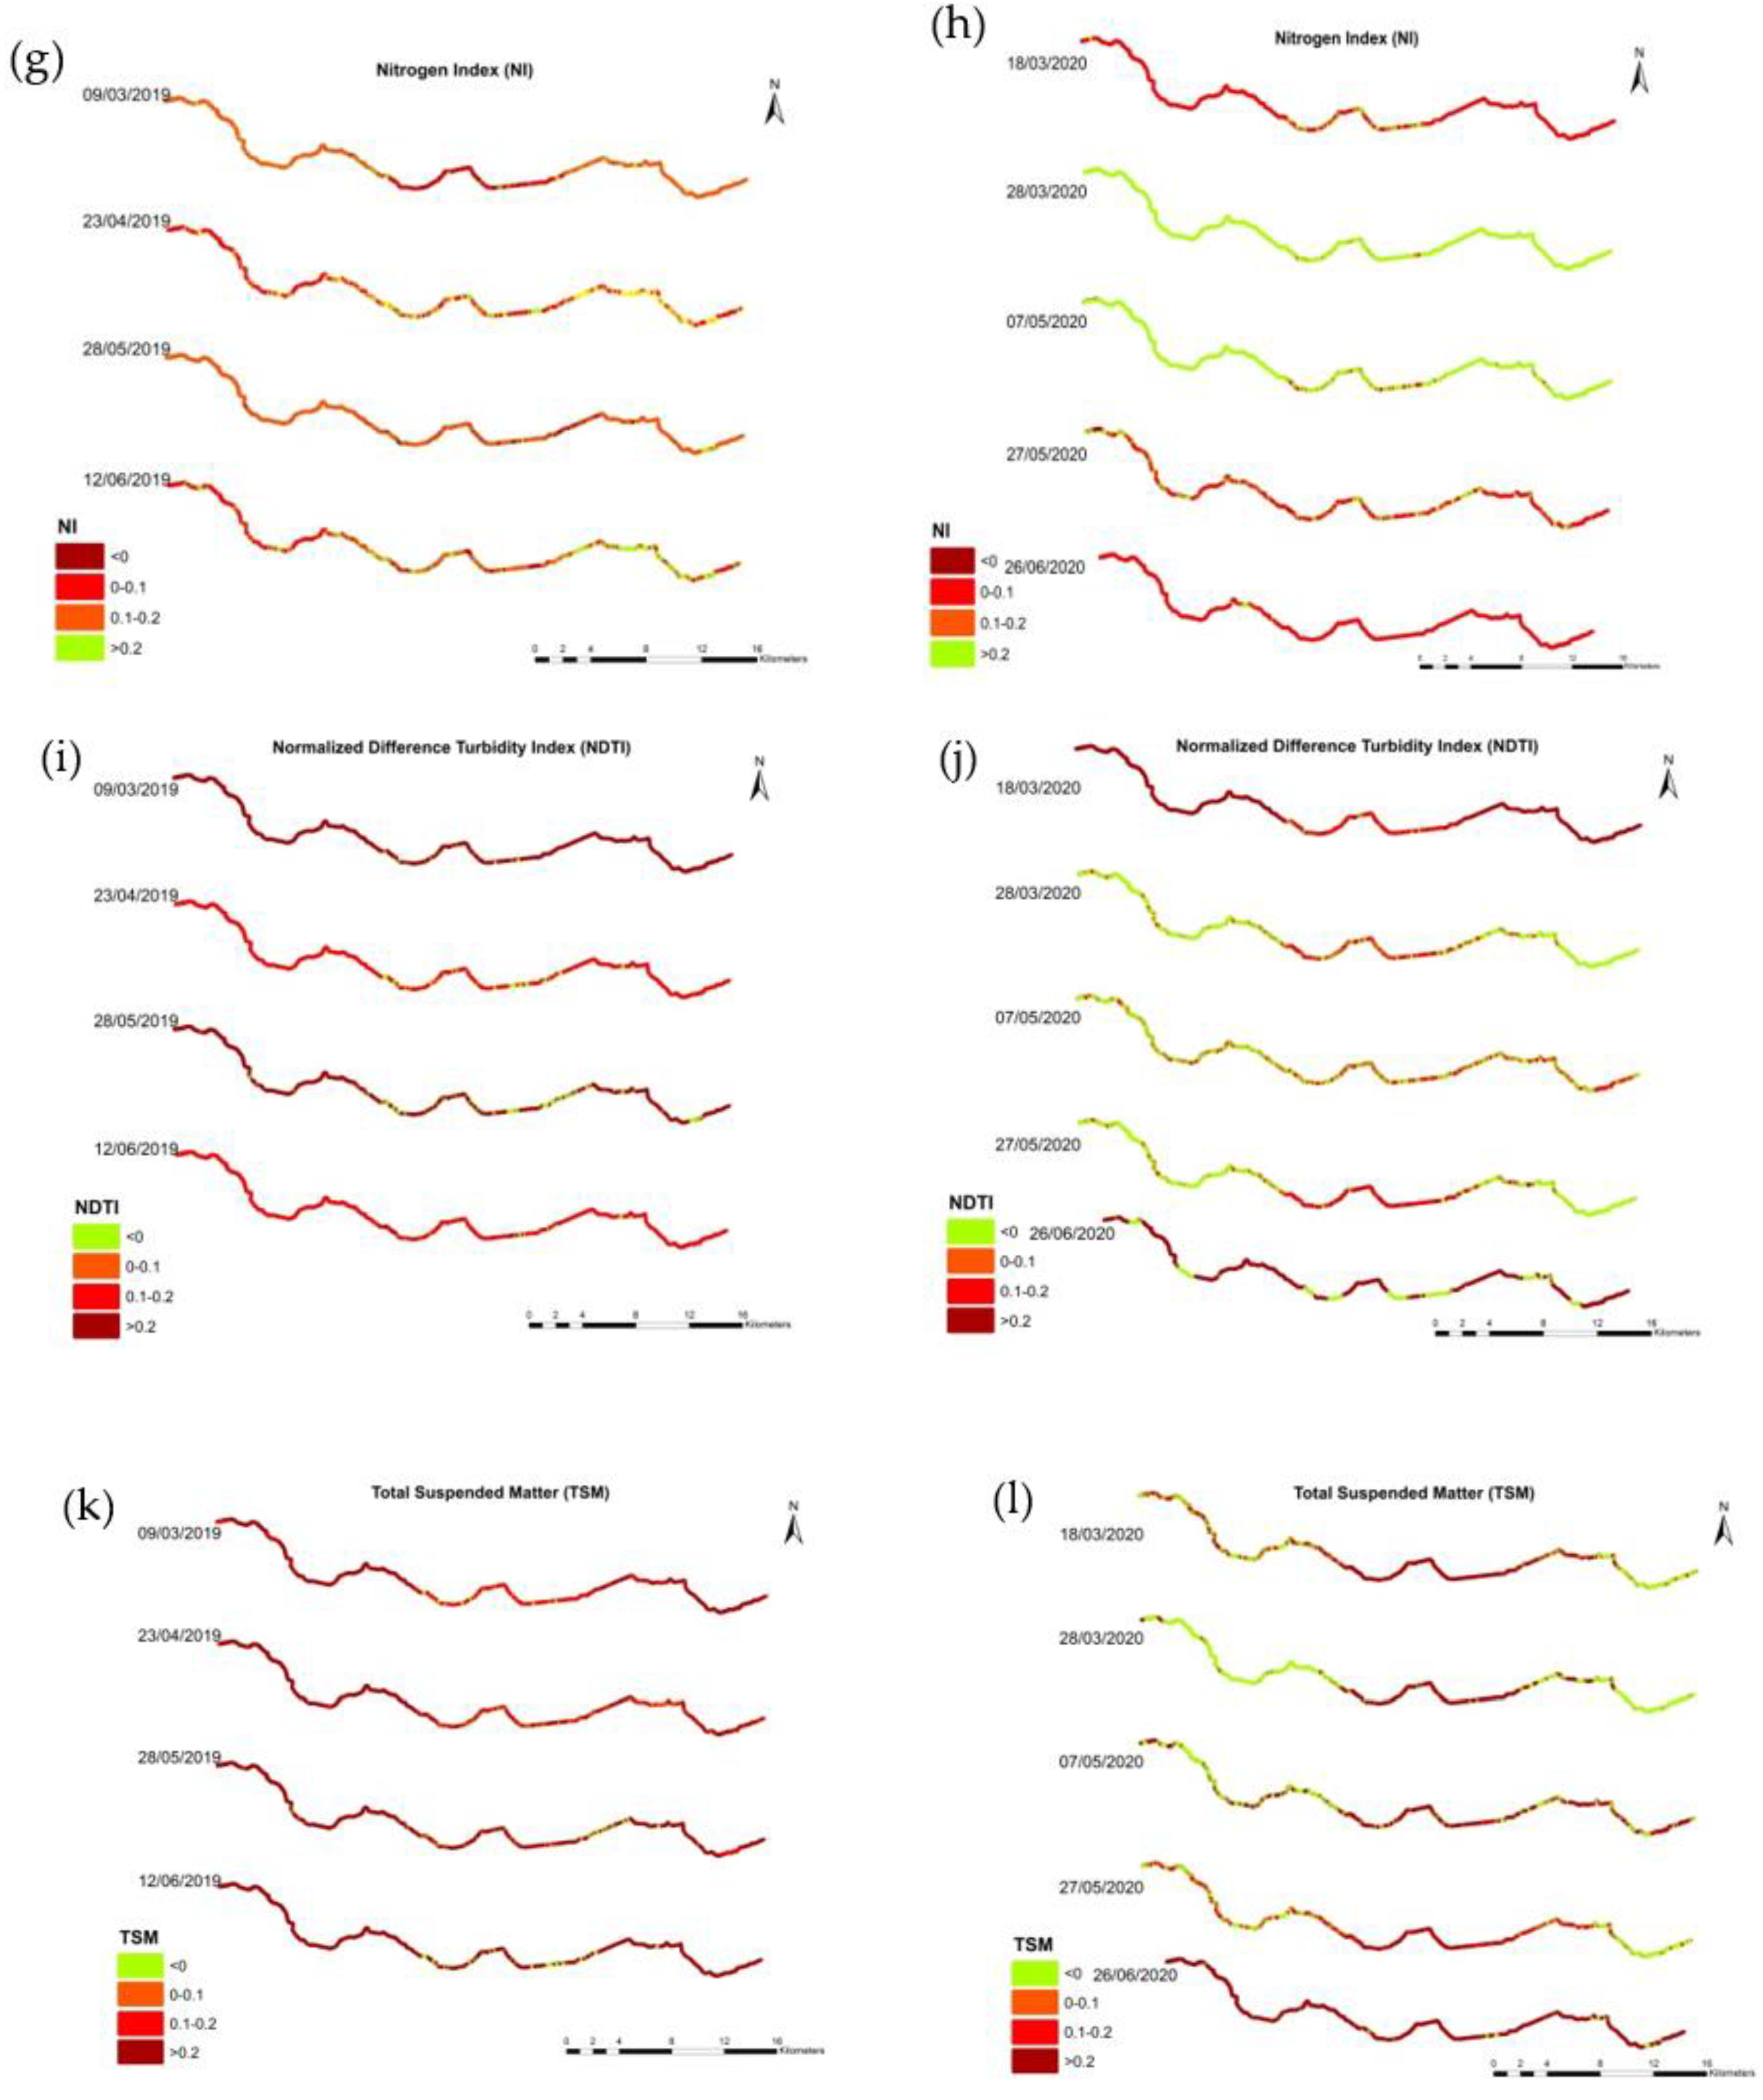
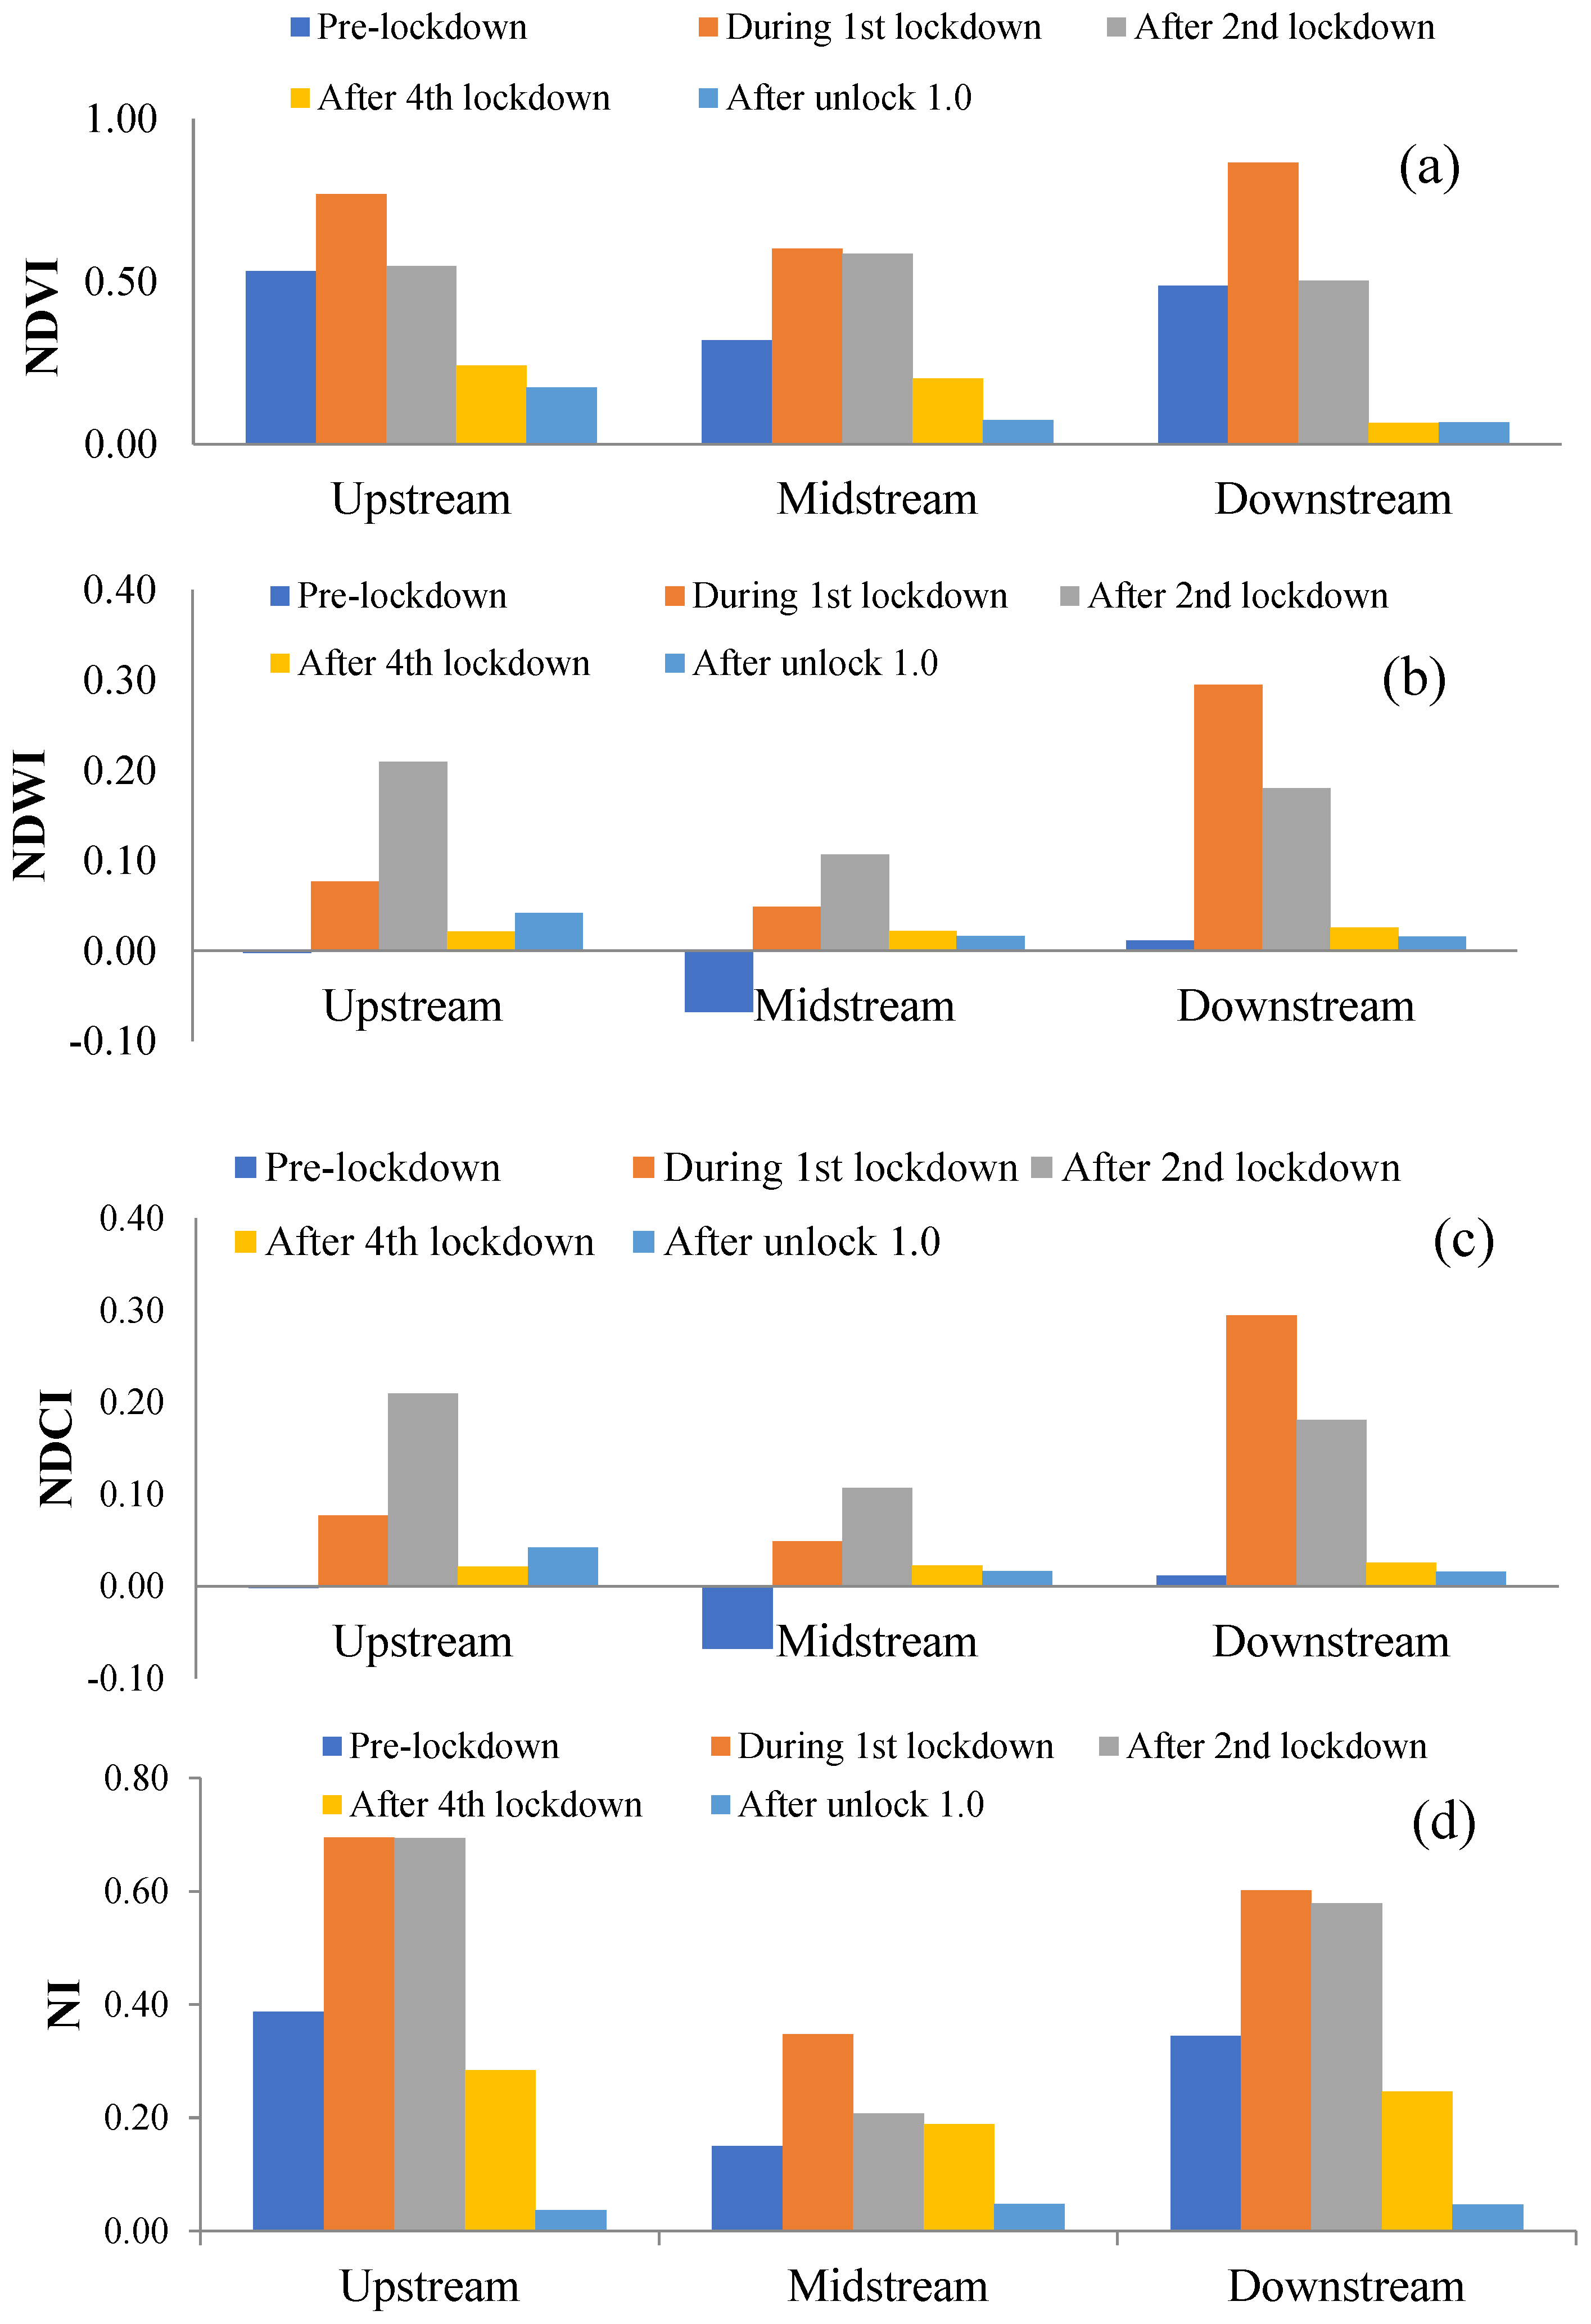
Spatial analysis of NDVI, NDWI, NDCI, and NI values in different sections of Buddha Nala suggested that an overall improvement in water quality in downstream section followed by upstream and middle section (Figure 7a–j and Figure 8). In Figure 7, different color classes were taken for all sections for visual explanation of the indices, and NDVI values were found to be marginally high in upstream and downstream section (Figure 7a,b) prior to lockdown. The middle section of Nala passes through the Ludhiana city and lower NDVI values may be attributed to disposal of city waste (sewage water) to the Nala. During the lockdown periods, high NDVI values (approaching 1) were observed in the midstream (Figure 7b). The positive NDVI value indicates possible vegetation growth activity in and around the water body. Increased vegetation will lead to enhanced sediment deposition in Nala section which results in aerobic conditions and thus enhancement in the quality of water (see Wardlow et al. [32] for similar assessment). A significant improvement in the NDVI values were observed during the lockdown periods as compared to NDVI values during the same period of year 2019 (Figure 7a,b). Similar to the NDVI values, NDWI also increased as industrial and agricultural work stopped/reduced during different phases of lockdown. It was observed that a significant improvement of NDWI during the lockdown periods than previous year of 2019 (Figure 7c,d). A negative NDWI value at upstream and middle section before lockdown indicates that barren land with no water surface, whereas the positive value of NDWI indicates the water with vegetation surface [43,44]. Similarly, NDCI and NI values significantly improved during lockdown periods at Nala section as compared to year 2019 (Figure 7e–h). Estimated NDCI and NI values for study area was close to other studies in India and other countries’ water body see references [31,34,36,42]. TSM and NDTI values significantly decreased during lockdown periods at Nala sections as compared to year of 2019 and pre-lockdown periods (Figure 7i–l). Xu et al. 2021 [45] also found a decreased concentration of total suspended solid (TSS) during COVID-19 lockdown periods in China. As the unlock started, the effluents from the industrial and agricultural sector increased in the Nala, and TSM and NDTI values increased subsequently.
4.2. Discussions
It was observed that NDCI values were very low at beginning of lockdown and after unlock-1 but it was significantly high during the lockdown for all the stream sections (Figure 8c). The increase in NDCI values is perhaps due to the growth of aquatic vegetation (thus changes in aquatic ecology) and thus an increase in values of NDVI were observed as well. NDCI values significantly changed during lockdowns. Similarly, NI values (Figure 8d) were found to be high at upstream and downstream of Nala.
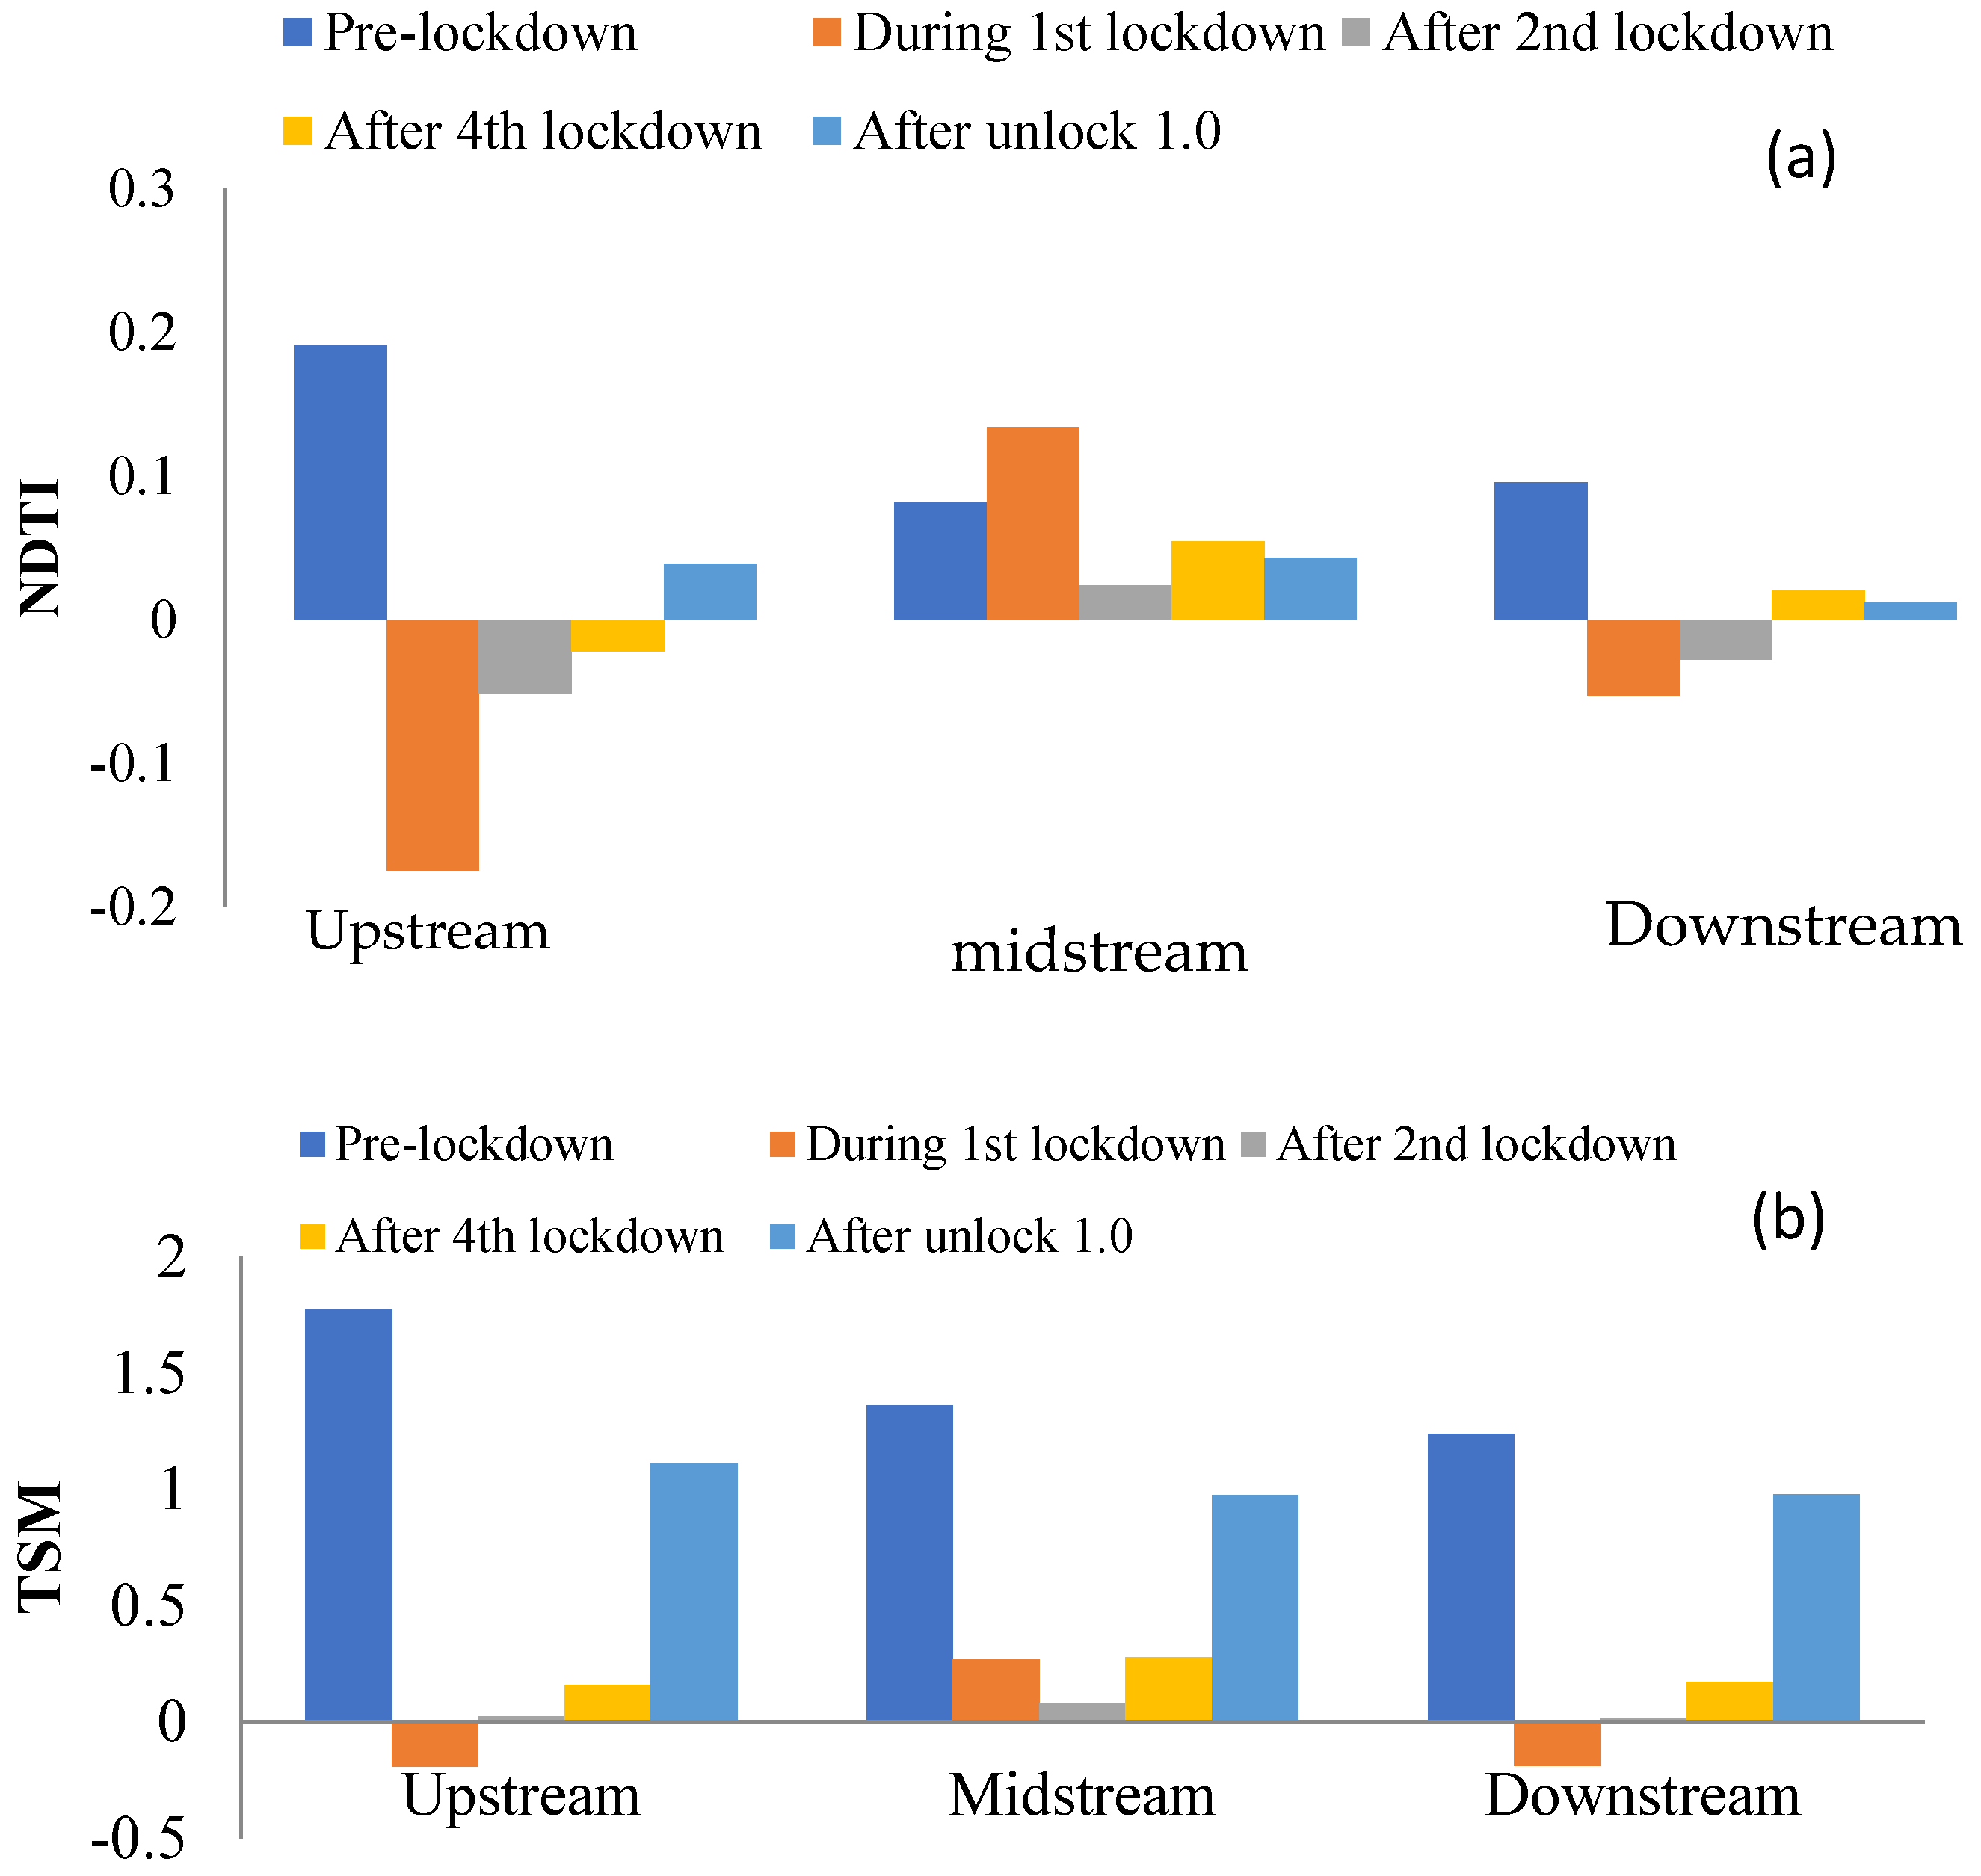
Maximum NDTI and TSM values were in midstream section of Buddha Nala which flows through Ludhiana City (Figure 9a,b). Highest NDTI and TSM values were observed in upstream section, before lockdown, and these values drastically decreased during first lockdown, more so in the upstream and downstream sections of Buddha Nala. High NDTI values were found at beginning of lockdown and after unlock-1 for this study area. This is perhaps due to drop in industrial and domestic effluent discharge during lockdown. TSM values, which indicate suspended matter in water, Ref. [34] also showed trends similar to NDTI. After unlock-1, there was a sudden rise in TSM values in the Nala perhaps because of agricultural and industrial activities.
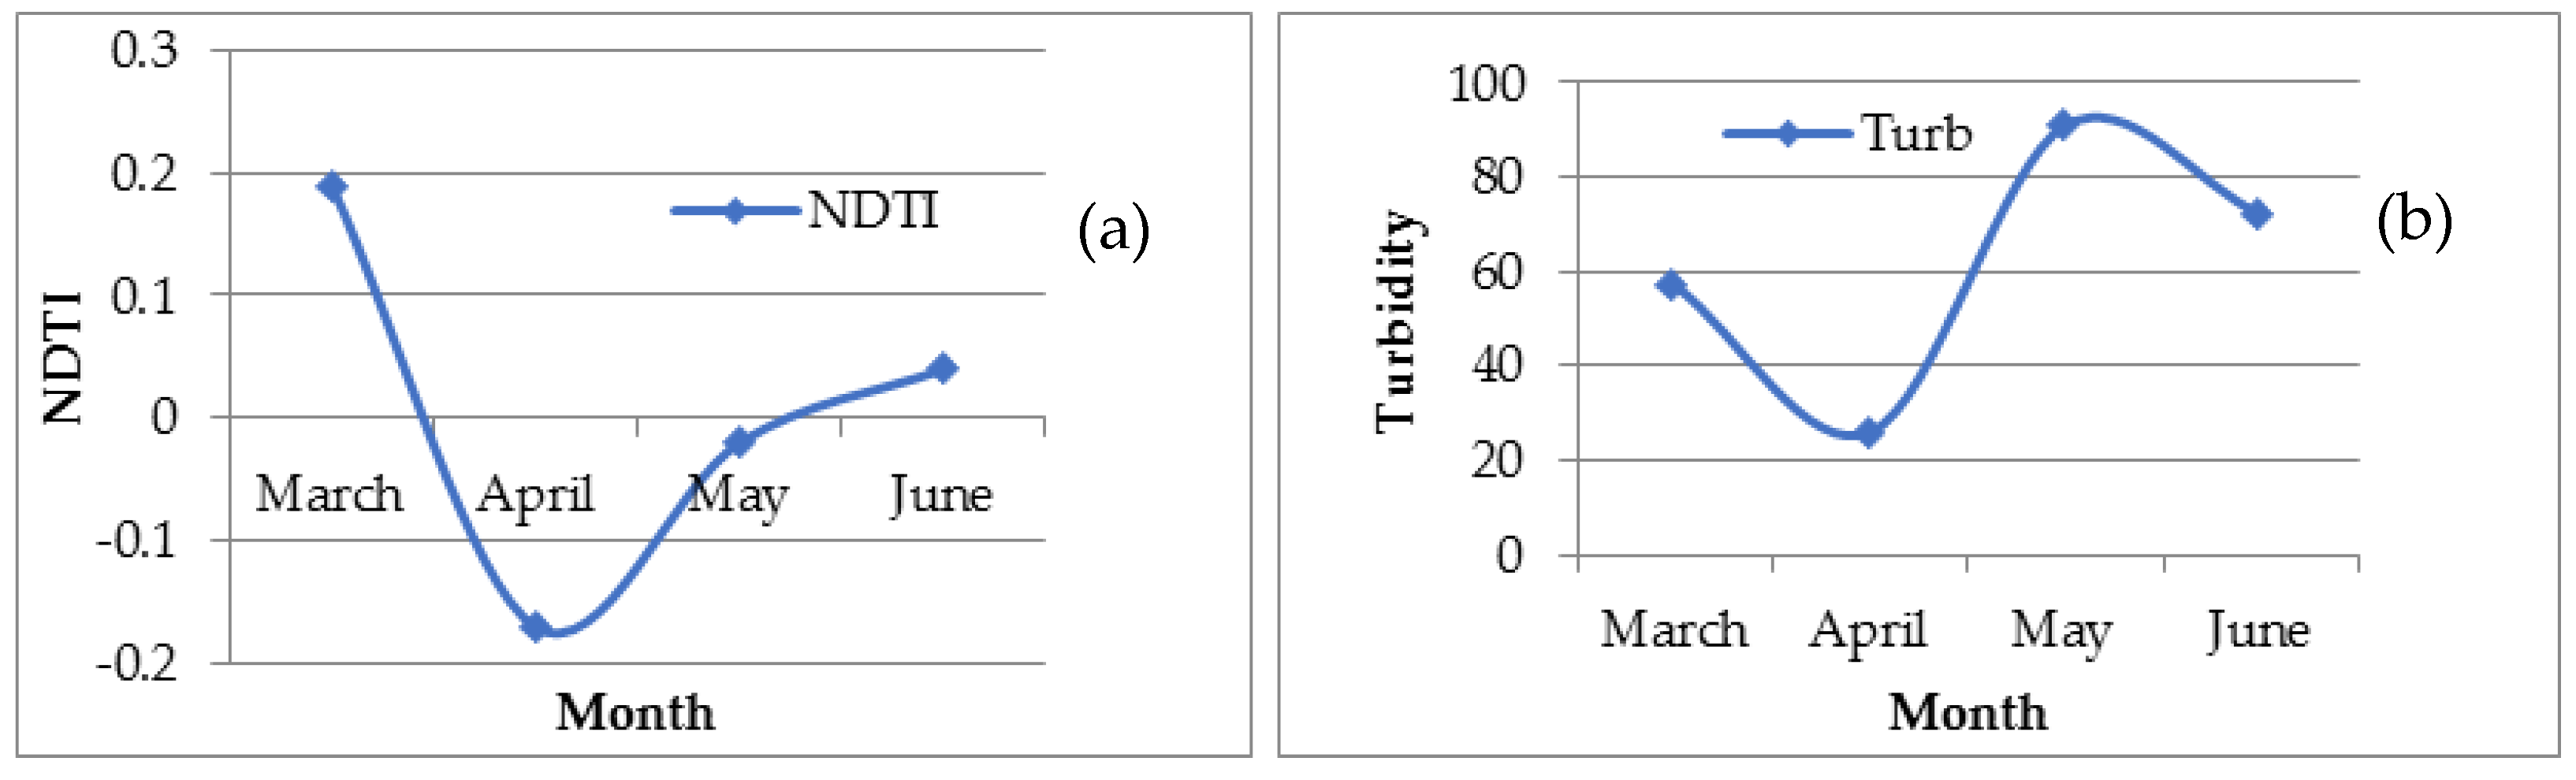
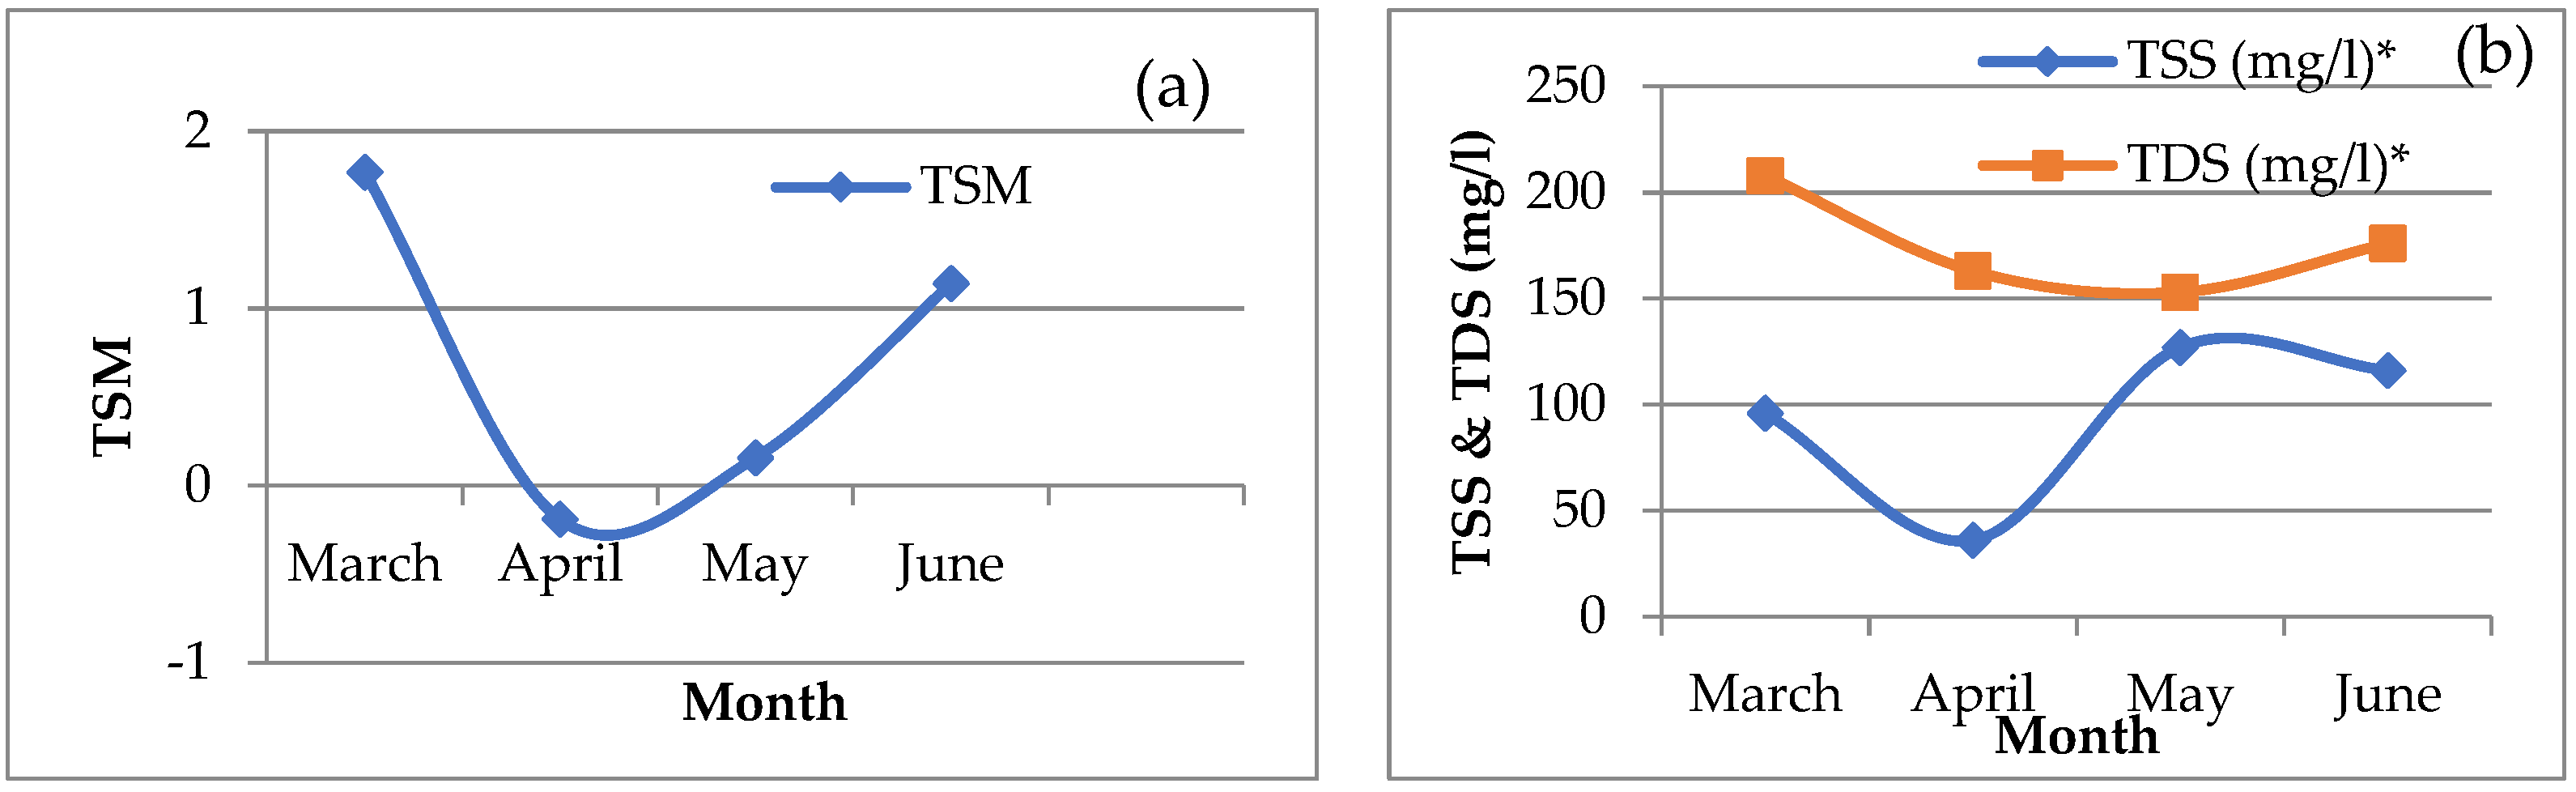
Comparison of indices was done with available in−situ data obtained from Punjab Pollution Control Board (PPCB) (Table 4). It is evident from Table 4, that the value of turbidity (Turb) level at the upstream section was higher for the month of March in comparison to April 2020 and increased again as the lockdown ended. The NDTI values also showed comparable results with in-situ turbidity (Turb) values for the upstream section (Figure 10a,b). Similarly, the Total Suspended Solid (TSS), and Total Dissolved Solid (TDS) and TSM values decreased for the month of April as compared to pre- and post-lockdown (Figure 11a,b). The results of in−situ and satellite based observations show the similar trend for upstream and imply that the water quality has improved during the lockdown.
5. Conclusions
The present study used a remote sensing-based approach to analyze impact of Covid-19 lockdown on surface water quality of Buddha Nala. Using Sentinel-2A images, six indices (namely NDVI, NDWI, NDCI, NDTI, NI, and TSM), it was found that the lockdown was effective in improving the water quality (and thus ecology) of Buddha Nala. The findings of the study were also validated with the field data of Punjab Pollution Control Board. The highest improvement in water quality was observed in downstream section of Buddha Nala evident from increased NDVI, NDWI, NDCI, and NI values and decreased NDTI and TSM values. Middle section of creek that passes through the city also showed significant improvement but the NDTI, and TSM levels were increased with easing of restrictions and opening of industrial and other activities. This study shows an overall improvement in water quality and vegetation growth in the Buddha Nala during the lockdown periods. Analysis also pointed at deterioration in the water quality of Buddha Nala during the summer months, which may be due to high evaporation losses and increased domestic and industrial effluents. These findings and the methodology employed can be used to provide a reasonable indication of the water quality status of other surface water bodies and identify problematic areas in terms of pollution levels. This study also demonstrates application of remote sensing techniques for the water quality assessment, which will likely to be of effective for regular monitoring of water quality and ecology in regions that do not have routine collection of water surveillance programs.
Author Contributions
S.D. conducted the study with suggestions from S.K. and A.J.; and S.D. & S.K. wrote the original and A.J. revised manuscript. All authors have read and agreed to the published version of the manuscript.
Funding
This research is not yet funded.
Institutional Review Board Statement
Not applicable.
Informed Consent Statement
Not applicable.
Data Availability Statement
The data presented in this study are available on request from the corresponding author. The remote sensing data are publicly available.
Acknowledgments
The authors would like to acknowledge Department of Soil and Water Engineering, Punjab Agricultural University for providing research platform. Funding and computation support from UF-ESSIE to Antar Jutla is duly recognized.
Conflicts of Interest
The authors declare no conflict of interest.
References
- Travaglio, M.; Yu, Y.; Popovic, R.; Selley, L.; Leal, N.S.; Martins, L.M. Links between air pollution and COVID-19 in England. MedRxiv 2020. [Google Scholar] [CrossRef]
- Chauhan, A.; Singh, R.P. Decline in PM2.5 concentrations over major cities around the world associated with COVID-19. Environ. Res. 2020, 187, 109634. [Google Scholar] [CrossRef] [PubMed]
- Patel, P.P.; Mondal, S.; Ghosh, K.G. Some respite for India’s dirtiest river? Examining the Yamuna’s water quality at Delhi during the COVID-19 lockdown period. Sci. Total Environ. 2020, 744, 140851. [Google Scholar] [CrossRef] [PubMed]
- The Lancet. India under COVID-19 lockdown. Lancet 2020, 395, 1315. [Google Scholar] [CrossRef]
- Braga, F.; Scarpa, G.M.; Brando, V.E.; Manfè, G.; Zaggia, L. COVID-19 lockdown measures reveal human impact on water transparency in the Venice Lagoon. Sci. Total Environ. 2020, 736, 139612. [Google Scholar] [CrossRef]
- Collivignarelli, M.C.; Abbà, A.; Bertanza, G.; Pedrazzani, R.; Ricciardi, P.; Miino, M.C. Lockdown for CoViD-2019 in Milan: What are the effects on air quality? Sci. Total Environ. 2020, 732, 139280. [Google Scholar] [CrossRef]
- Dantas, G.; Siciliano, B.; França, B.B.; da Silva, C.M.; Arbilla, G. The impact of COVID-19 partial lockdown on the air quality of the city of Rio de Janeiro, Brazil. Sci. Total Environ. 2020, 729, 139085. [Google Scholar] [CrossRef]
- Lal, P.; Kumar, A.; Kumar, S.; Kumari, S.; Saikia, P.; Dayanandan, A.; Adhikari, D.; Khan, M. The dark cloud with a silver lining: Assessing the impact of the SARS COVID-19 pandemic on the global environment. Sci. Total Environ. 2020, 732, 139297. [Google Scholar] [CrossRef]
- Li, L.; Li, Q.; Huang, L.; Wang, Q.; Zhu, A.; Xu, J.; Liu, Z.; Li, H.; Shi, L.; Li, R.; et al. Air quality changes during the COVID-19 lockdown over the Yangtze River Delta Region: An insight into the impact of human activity pattern changes on air pollution variation. Sci. Total Environ. 2020, 732, 139282. [Google Scholar] [CrossRef] [PubMed]
- Muhammad, S.; Long, X.; Salman, M. COVID-19 pandemic and environmental pollution: A blessing in disguise? Sci. Total Environ. 2020, 728, 138820. [Google Scholar] [CrossRef] [PubMed]
- Otmani, A.; Benchrif, A.; Tahri, M.; Bounakhla, M.; Chakir, E.M.; El Bouch, M.; Krombi, M. Impact of Covid-19 lockdown on PM10, SO2 and NO2 concentrations in Salé City (Morocco). Sci. Total Environ. 2020, 735, 139541. [Google Scholar] [CrossRef]
- Ghosh, A.; Nundy, S.; Mallick, T.K. How India is dealing with COVID-19 pandemic. Sens. Int. 2020, 1, 100021. [Google Scholar] [CrossRef]
- Kambalagere, Y. A Study on Air Quality Index (AQI) of Bengaluru, Karnataka during Lockdown Period to Combat Corona-virus Disease (Covid-19): Air Quality Turns ‘Better’ from ‘Hazardous’. Stud. Indian Place Names 2020, 40, 59–66. [Google Scholar]
- Mahato, S.; Pal, S.; Ghosh, K.G. Effect of lockdown amid COVID-19 pandemic on air quality of the megacity Delhi, India. Sci. Total Environ. 2020, 730, 139086. [Google Scholar] [CrossRef] [PubMed]
- Sharma, S.; Zhang, M.; Anshika; Gao, J.; Zhang, H.; Kota, S.H. Effect of restricted emissions during COVID-19 on air quality in India. Sci. Total Environ. 2020, 728, 138878. [Google Scholar] [CrossRef] [PubMed]
- CPCB Central Pollution Control Board. Impact of Lockdown on Water Quality of River Ganga CPCB; Ministry of Environment, Forest and Climate Change, Government of India: New Delhi, India. Available online: https://cpcb.nic.in/openpdffile.php?id=TGF0ZXN0RmlsZS8yOTNfMTU4Nzk3ODU3MV9tZWRpYXBob3RvMTY3MDYucGRm= (accessed on 12 May 2020).
- Paital, B.; Das, K.; Parida, S.K. Inter nation social lockdown versus medical care against COVID-19, a mild environmental insight with special reference to India. Sci. Total Environ. 2020, 728, 138914. [Google Scholar] [CrossRef]
- Saadat, S.; Rawtani, D.; Hussain, C.M. Environmental perspective of COVID-19. Sci. Total Environ. 2020, 728, 138870. [Google Scholar] [CrossRef]
- Yunus, A.P.; Masago, Y.; Hijioka, Y. COVID-19 and surface water quality: Improved lake water quality during the lockdown. Sci. Total Environ. 2020, 731, 139012. [Google Scholar] [CrossRef] [PubMed]
- Singhal, S.; Matto, M. COVID-19 Lockdown: A Ventilator for Rivers. 2020. Available online: https://www.downtoearth.org.in/blog/covid-19-lockdown-a-ventilator-for-rivers- (accessed on 17 April 2020).
- Mani, K.A.S. The Lockdown Cleaned the Ganga More Than ‘NamamiGange’ Ever Did. Available online: https://science.thewire.in/environment/ganga-river-lockdown-cleaner-namami-gange-sewage-treatment-ecological-flow/2020 (accessed on 19 April 2020).
- Shukla, N.; Srivastava, S. Lockdown Impact: Ganga Water in Haridwar Becomes ‘Fit to Drink’ After Decades. India Today. 22 April 2020. Available online: https://www.indiatoday.in/india/story/lockdown-impact-ganga-water-in-haridwar-becomes-fit-to-drink-after-decades-1669576-2020-04-22 (accessed on 22 April 2020).
- Hader, D.P.; Banaszak, A.T.; Villafañe, V.E.; Narvarte, M.A.; González, R.A.; Helbling, E.W. Anthropogenic pollution of aquatic ecosystems: Emerging problems with global implications. Sci. Total Environ. 2020, 713, 136586. [Google Scholar] [CrossRef]
- Quang, N.H.; Sasaki, J.; Higa, H.; Huan, N.H. Spatiotemporal Variation of Turbidity Based on Landsat 8 OLI in Cam Ranh Bay and Thuy Trieu Lagoon, Vietnam. Water 2017, 9, 570. [Google Scholar] [CrossRef] [Green Version]
- Gholizadeh, M.H.; Melesse, A.M.; Reddi, L. A Comprehensive Review on Water Quality Parameters Estimation Using Remote Sensing Techniques. Sensors 2016, 16, 1298. [Google Scholar] [CrossRef] [Green Version]
- Huang, C.; Chen, Y.; Zhang, S.; Wu, J. Detecting, Extracting, and Monitoring Surface Water from Space Using Optical Sensors: A Review. Rev. Geophys. 2018, 56, 333–360. [Google Scholar] [CrossRef]
- Dheri, G.S.; Brar, M.S.; Malhi, S.S. Heavy-Metal Concentration of Sewage-Contaminated Water and Its Impact on Underground Water, Soil, and Crop Plants in Alluvial Soils of Northwestern India. Commun. Soil Sci. Plant Anal. 2007, 38, 1353–1370. [Google Scholar] [CrossRef]
- Jindal, R.; Sharma, C. Studies on water quality of Sutlej River around Ludhiana with reference to physicochemical parameters. Environ. Monit. Assess. 2010, 174, 417–425. [Google Scholar] [CrossRef]
- Govindaraj, S.; Saravanakumar, A. Validation of Chlorophyll and TSM in Vellar River by Using Sentinel 2 MSI Southeast Coast of India Tamil Nadu. Int. J. Sci. Technol. Res. 2019, 8, 10. [Google Scholar]
- Garg, V.; Aggarwal, S.P.; Chauhan, P. Changes in turbidity along Ganga River using Sentinel-2 satellite data during lockdown associated with COVID-19. Geomat. Nat. Hazards Risk 2020, 11, 1175–1195. [Google Scholar] [CrossRef]
- Avdan, Z.Y.; Kaplan, G.; Goncu, S.; Avdan, U. Monitoring the Water Quality of Small Water Bodies Using High-Resolution Remote Sensing Data ISPRS. Int. J. Geo Inf. 2019, 8, 553. [Google Scholar] [CrossRef] [Green Version]
- Wardlow, B.D.; Egbert, S.L.; Kastens, J.H. Analysis of time-series MODIS 250 m vegetation index data for crop classification in the U.S. Central Great Plains. Remote Sens. Environ. 2007, 108, 290–310. [Google Scholar] [CrossRef] [Green Version]
- McFeeters, S.K. The use of the Normalized Difference Water Index (NDWI) in the delineation of open water features. Int. J. Remote Sens. 1996, 17, 1425–1432. [Google Scholar] [CrossRef]
- Buma, W.; Lee, S.-I. Evaluation of Sentinel-2 and Landsat 8 Images for Estimating Chlorophyll-a Concentrations in Lake Chad, Africa. Remote Sens. 2020, 12, 2437. [Google Scholar] [CrossRef]
- Lacaux, J.; Tourre, Y.; Vignolles, C.; Ndione, J.; Lafaye, M. Classification of ponds from high-spatial resolution remote sensing: Application to Rift Valley Fever epidemics in Senegal. Remote Sens. Environ. 2007, 106, 66–74. [Google Scholar] [CrossRef]
- Elhag, M.; Gitas, I.; Othman, A.; Bahrawi, J.; Gikas, P. Assessment of Water Quality Parameters Using Temporal Remote Sensing Spectral Reflectance in Arid Environments, Saudi Arabia. Water 2019, 11, 556. [Google Scholar] [CrossRef] [Green Version]
- Gitelson, A.A.; Merzlyak, M.N. Remote estimation of chlorophyll content in higher plant leaves. Int. J. Remote Sens. 1997, 18, 2691–2697. [Google Scholar] [CrossRef]
- Toming, K.; Kutser, T.; Uiboupin, R.; Arikas, A.; Vahter, K.; Paavel, B. Mapping Water Quality Parameters with Sentinel-3 Ocean and Land Colour Instrument imagery in the Baltic Sea. Remote Sens. 2017, 9, 1070. [Google Scholar] [CrossRef] [Green Version]
- Gessesse, A.A.; Melesse, A.M. Temporal relationships between time series CHIRPS-rainfall estimation and eMODIS-NDVI satellite images in Amhara Region, Ethiopia. In Extreme Hydrology and Climate Variability; Elsevier: Amsterdam, The Netherlands, 2019; pp. 81–92. [Google Scholar] [CrossRef]
- Gitelson, A.A.; Zhou, J.; Gurlin, D.; Moses, W.; Ioannou, I.; Ahmed, S.A. Algorithms for remote estimation of chlorophyll-a in coastal and inland waters using red and near infrared bands. Opt. Express 2010, 18, 24109–24125. [Google Scholar] [CrossRef] [Green Version]
- Mishra, S.; Mishra, D.R. Normalized difference chlorophyll index: A novel model for remote estimation of chlorophyll-a concentration in turbid productive waters. Remote Sens. Environ. 2012, 117, 394–406. [Google Scholar] [CrossRef]
- Duan, H.; Zhang, Y.; Zhang, B.; Song, K.; Wang, Z. Assessment of Chlorophyll-a Concentration and Trophic State for Lake Chagan Using Landsat TM and Field Spectral Data. Environ. Monit. Assess. 2006, 129, 295–308. [Google Scholar] [CrossRef] [PubMed]
- Subramaniam, S.; Saxena, M. Automated algorithm for extraction of wetlands from IRS Resourcesat LISS III data. In Proceedings of the ISPRS Bhopal 2011 Workshop, International Archives of the Photogrammetry, Remote Sensing and Spatial Information Sciences; 2011; Volume 38, pp. 193–198. Available online: https://www.int-arch-photogramm-remote-sens-spatial-inf-sci.net/XXXVIII-8-W20/193/2011/isprsarchives-XXXVIII-8-W20-193-2011.pdf (accessed on 8 November 2011).
- Guha, S.; Govil, H.; Gill, N.; Dey, A. Analytical study on the relationship between land surface temperature and land use/land cover indices. Ann. GIS 2020, 26, 201–216. [Google Scholar] [CrossRef]
- Xu, H.; Xu, G.; Wen, X.; Hu, X.; Wang, Y. Lockdown effects on total suspended solids concentrations in the Lower Min River (China) during COVID-19 using time-series remote sensing images. Int. J. Appl. Earth Obs. Geoinf. 2021, 98, 102301. [Google Scholar] [CrossRef]
Figure 1.
Location of the study area.

Figure 2.
Waste being disposed in Buddha Nala; (a) Dry bed of Buddha Nala, (b) Industrial waste effluent into Buddha Nala, (c) Garbage dumping in Buddha Nala, and (d) Sewage being pumped into BuddhaNala. (Reference: https://citizenmatters.in/ludhiana-buddha-dariya-nulla-pollution-clean-up-failure-12966, accessed on 30 March 2020).

Figure 3.
Sampling points on Buddha Nala.

Figure 4.
Comparisons of different indices for 2019 and 2020.

Figure 5.
Water quality indices for four months in 2019.

Figure 6.
Water quality indices prior, during and after Covid-19 lockdown.

Figure 7.
Spatial variation of NDVI, NDWI, NDCI, NI, NDTI and TSM in (a–k) 2019 and (d–l) 2020.


Figure 8.
Variation in (a) NDVI, (b) NDWI, (c) NDCI, and (d) NI values of Buddha Nala in different sections and during different phases of lockdown.
Figure 8.
Variation in (a) NDVI, (b) NDWI, (c) NDCI, and (d) NI values of Buddha Nala in different sections and during different phases of lockdown.

Figure 9.
Variation in (a) NDTI and (b) TSM values of the Buddha Nala in different sections and during different phases of lockdown.
Figure 9.
Variation in (a) NDTI and (b) TSM values of the Buddha Nala in different sections and during different phases of lockdown.

Figure 10.
Comparable results between (a) NDCI, and (b) in-situ data (Turbidity).

Figure 11.
Comparable results between (a) TSM, and (b) in-situ data (TSS).


Table 1.
Bands details of Sentinel-2A multispectral images.
| Band (Wavelength Region) | Resolution (m) | Central Wavelength (nm) |
|---|---|---|
| Band 1 (Coastal aerosol) | 60 | 443 |
| Band 2 (Blue) | 10 | 490 |
| Band 3 (Green) | 10 | 560 |
| Band 4 (Red) | 10 | 665 |
| Band 5 (Vegetation red edge) | 20 | 750 |
| Band 6 (Vegetation red edge) | 20 | 740 |
| Band 7 (Vegetation red edge) | 20 | 783 |
| Band 8 (NIR) | 10 | 842 |
| Band 8A (Vegetation red edge) | 20 | 865 |
| Band 9 (Water Vapor) | 60 | 945 |
| Band 10 (SWIR-Cirrus) | 60 | 1375 |
| Band 11 (SWIR) | 20 | 1610 |
| Band 12 (SWIR) | 20 | 2190 |
Table 2.
Different water quality indices used to quantity water quality.
| Sr. No. | Index | Band Ratio | Description of Indices | Reference |
|---|---|---|---|---|
| 1 | Higher NDVI Indicates the vegetation growth in the water body. | Wardlow et al., 2007; [32] | ||
| 2 | The higher the NDWI value, the better the water quality. | McFeeters, 1996; [33] | ||
| 3 | Higher NDCI indicates the vegetaion growth and reduction of pollution in the water body. | Buma & Lee, 2020; Avdan et al., 2019; [31,34] | ||
| 4 | NDTI indicates the presence of turbidity in the water. | Lacaux, et al., 2007; Elhag, et al., 2019; [35,36] | ||
| 5 | Higher NI indicates the raised runoff load of N in the water body. | Gitelson, 1997 [37] | ||
| 6 | Higher values indicates the presence of total suspended solid | Toming et al., 2017; [38] |
NIR = Near Infra-red band; R = Red band; B3 = Green band; B4 = Red band; B5 = Vegetation red edge band; B8 = NIR band.
Table 3.
Comparison of different indices for year of 2019 and 2020.
| T−Test for the Year 2019 and 2020 | ||||||
|---|---|---|---|---|---|---|
| NDVI | NDWI | NDCI | NI | NDTI | TSM | |
| March | −26.17 (2.004) | 7.01 (2.0) | 5.89 (1.99) | −5.58 (1.98) | −1.37 (1.99) | −9.12 (2.00) |
| May | −0.88 (1.98) | −7.55 (1.99) | −2.43 (1.99) | −12.26 (1.99) | −14.34 (1.99) | −12.31 (2.00) |
| June | 8.99 (1.99) | 0.44 (1.98) | −2.13 (1.98) | −9.01 (2.00) | −5.61 (1.98) | −4.55 (2.00) |
| T−Test for Different Phases of Lockdown | ||||||
| NDVI | NDWI | NDCI | NI | NDTI | TSM | |
| March–May | −9.53 (1.98) | −4.86 (1.98) | −1.52 (1.98) | −4.19 (1.98) | −6.37 (1.99) | 1.86 (1.99) |
| March–June | −0.88 (1.98) | −2.31 (1.99) | −6.84 (2.0) | −14.57 (1.99) | −6.18 (1.99) | −3.71 (1.99) |
Inside the ( ) Values in parentheses represent t−critical.
Table 4.
Comparison of indices with in-situ data.
| Upstream Section | ||||
|---|---|---|---|---|
| 2020 | March | April | May | June |
| Turb (NTU) * | 57 | 26 | 91 | 72 |
| NDTI | 0.19 | −0.17 | −0.02 | 0.04 |
| TSS (mg/L) * | 96 | 36 | 127 | 116 |
| TDS (mg/L) * | 208 | 163 | 153 | 176 |
| TSM | 1.77 | −0.19 | 0.158 | 1.14 |
| Downstream Section | ||||
| 2020 | March | April | May | June |
| Turb (NTU) * | 19 | 40 | 84 | 42 |
| NDTI | 0.1 | −0.05 | 0.02 | 0.01 |
| TSS (mg/L) * | 25 | 66 | 109 | 81 |
| TDS (mg/L) * | 264 | 244 | 179 | 237 |
| TSM | 1.23 | −0.188 | 0.17 | 0.97 |
* in-situ data obtained from PPCB.
Publisher’s Note: MDPI stays neutral with regard to jurisdictional claims in published maps and institutional affiliations. |
© 2021 by the authors. Licensee MDPI, Basel, Switzerland. This article is an open access article distributed under the terms and conditions of the Creative Commons Attribution (CC BY) license (https://creativecommons.org/licenses/by/4.0/).
Share and Cite
MDPI and ACS Style
Das, S.; Kaur, S.; Jutla, A. Earth Observations Based Assessment of Impact of COVID-19 Lockdown on Surface Water Quality of Buddha Nala, Punjab, India. Water 2021, 13, 1363. https://doi.org/10.3390/w13101363
AMA Style
Das S, Kaur S, Jutla A. Earth Observations Based Assessment of Impact of COVID-19 Lockdown on Surface Water Quality of Buddha Nala, Punjab, India. Water. 2021; 13(10):1363. https://doi.org/10.3390/w13101363
Chicago/Turabian StyleDas, Susanta, Samanpreet Kaur, and Antarpreet Jutla. 2021. "Earth Observations Based Assessment of Impact of COVID-19 Lockdown on Surface Water Quality of Buddha Nala, Punjab, India" Water 13, no. 10: 1363. https://doi.org/10.3390/w13101363
Note that from the first issue of 2016, this journal uses article numbers instead of page numbers. See further details here.