
Simulation and Assessment of Future Glacial Lake Outburst Floods in the Poiqu River Basin, Central Himalayas


1
Key Laboratory of Western China’s Environmental Systems (Ministry of Education), College of Earth and Environmental Sciences, Lanzhou University, Lanzhou 730000, China
2
Institute of Tibetan Plateau Research, Chinese Academy of Sciences, Beijing 100101, China
3
CAS Centre for Excellence in Tibetan Plateau Earth Sciences, Chinese Academy of Sciences, Beijing 100101, China
4
School of Science, Tibet University, Lhasa 850011, China
*
Author to whom correspondence should be addressed.
Water 2021, 13(10), 1376; https://doi.org/10.3390/w13101376
Submission received: 17 April 2021
/
Revised: 12 May 2021
/
Accepted: 13 May 2021
/
Published: 15 May 2021
(This article belongs to the Section Hydrology)
Abstract
:A glacial lake outburst flood (GLOF) is a typical glacier-related hazard in high mountain regions. In recent decades, glacial lakes in the Himalayas have expanded rapidly due to climate warming and glacial retreat. Some of these lakes are unstable, and may suddenly burst under different triggering factors, thus draining large amounts of water and impacting downstream social and economic development. Glacial lakes in the Poiqu River basin, Central Himalayas, have attracted great attention since GLOFs originating there could have a transboundary impact on both China and Nepal, as occurred during the Cirenmaco GLOF in 1981 and the Gongbatongshaco GLOF in 2016. Based on previous studies of this basin, we selected seven very high-risk moraine-dammed lakes (Gangxico, Galongco, Jialongco, Cirenmaco, Taraco, Beihu, and Cawuqudenco) to simulate GLOF propagation at different drainage percentage scenarios (i.e., 25%, 50%, 75%, and 100%), and to conduct hazard assessment. The results show that, when any glacial lake is drained completely or partly, most of the floods will enter Nepal after raging in China, and will continue to cause damage. In summary, 57.5 km of roads, 754 buildings, 3.3 km2 of farmland, and 25 bridges are at risk of damage due to GLOFs. The potentially inundated area within the Chinese part of the Poiqu River basin exceeds 45 km2. Due to the destructive impacts of GLOFs on downstream areas, appropriate and effective measures should be implemented to adapt to GLOF risk. We finally present a paradigm for conducting hazard assessment and risk management. It uses only freely available data and thus is easy to apply.
1. Introduction
Increasing snow and ice meltwater is being detected in many glacierized areas due to climate warming and glacial retreat [1,2,3,4,5,6]. This situation greatly favors the formation and expansion of glacial lakes [7,8,9]. During the period of 1990 to 2015, the Himalayan glacial lakes increased 8% in number, from 4549 to 4950, and 14% in area, from 398 km2 to 455 km2 [10], thus increasing the potential risk of glacial lake outburst floods (GLOFs). A GLOF is a typical glacier-related hazard. It is defined as a large amount of water that suddenly flows out of a lake dammed by moraine, landslide, bedrock, or glacier-ice, and is characterized by high peak discharge and short duration [11]. Triggers for GLOF events are variable. When the area near a glacial lake is unstable and likely to generate snow/ice avalanches, landslides, and rockfalls, such lakes may be more susceptible to an outburst. When a heavy precipitation event triggers GLOF, the mixed flooding will cause a longer affected distance and larger inundated area [12,13].
Among the different types of GLOFs, floods originating from moraine-dammed lakes have been extensively studied by scholars due to their uniform spatial distribution, obvious breach, and easy identification by remote sensing images. Since 1900, more than 150 such GLOF events have been identified in the Himalayas [14,15,16], and more than half were caused by snow/ice avalanches [17]. Unfortunately, several catastrophic GLOFs have caused thousands of deaths in the Himalayas [18]. The most devastating GLOF event occurred on 16 June 2013, killing more than 6000 people in India [19,20].
Previous studies largely focused on the distribution of and changes to glacial lakes [7,8,9,10,21], the identification of potentially dangerous glacial lakes [22,23,24,25,26,27,28,29], and the reconstruction of GLOF processes [30,31,32,33,34,35]. However, only sporadic research has been conducted involving future GLOF simulation and detailed downstream hazard/risk assessment in specific regions of the Himalayas [26,36,37,38]. Therefore, there is an urgent need to predict the impact of future GLOFs on downstream areas, estimate the flood path, depth, and velocity, and prepare hazard maps for scientific and policymaking usage.
In this study, we selected a glacierized catchment, the Poiqu River basin of the Central Himalayas, as an experimental site for conducting GLOF simulation. We also present an easily applied paradigm for assessing GLOF hazard. Our specific goals were to: (i) model GLOFs from different high-risk moraine-dammed lakes, (ii) evaluate GLOF impacts under different lake drainage percentage scenarios (25%, 50%, 75%, and 100%), and (iii) draw hazard maps to provide reference for future prevention and mitigation measures. Based on previous glacial lake risk assessment results [26], we selected seven very high-risk moraine-dammed lakes—namely Gangxico, Galongco, Jialongco, Cirenmaco, Taraco, Beihu, and Cawuqudenco—in the Poiqu River basin to simulate outburst floods. We used HEC-RAS (Hydrologic Engineering Center River Analysis System) version 5.0.7 software to simulate the extent, velocity, and depth of GLOF inundation. We also collected information on infrastructure and farmland by digitizing high-resolution satellite images.
2. Study Area
2.1. Geographical and Climatic Setting
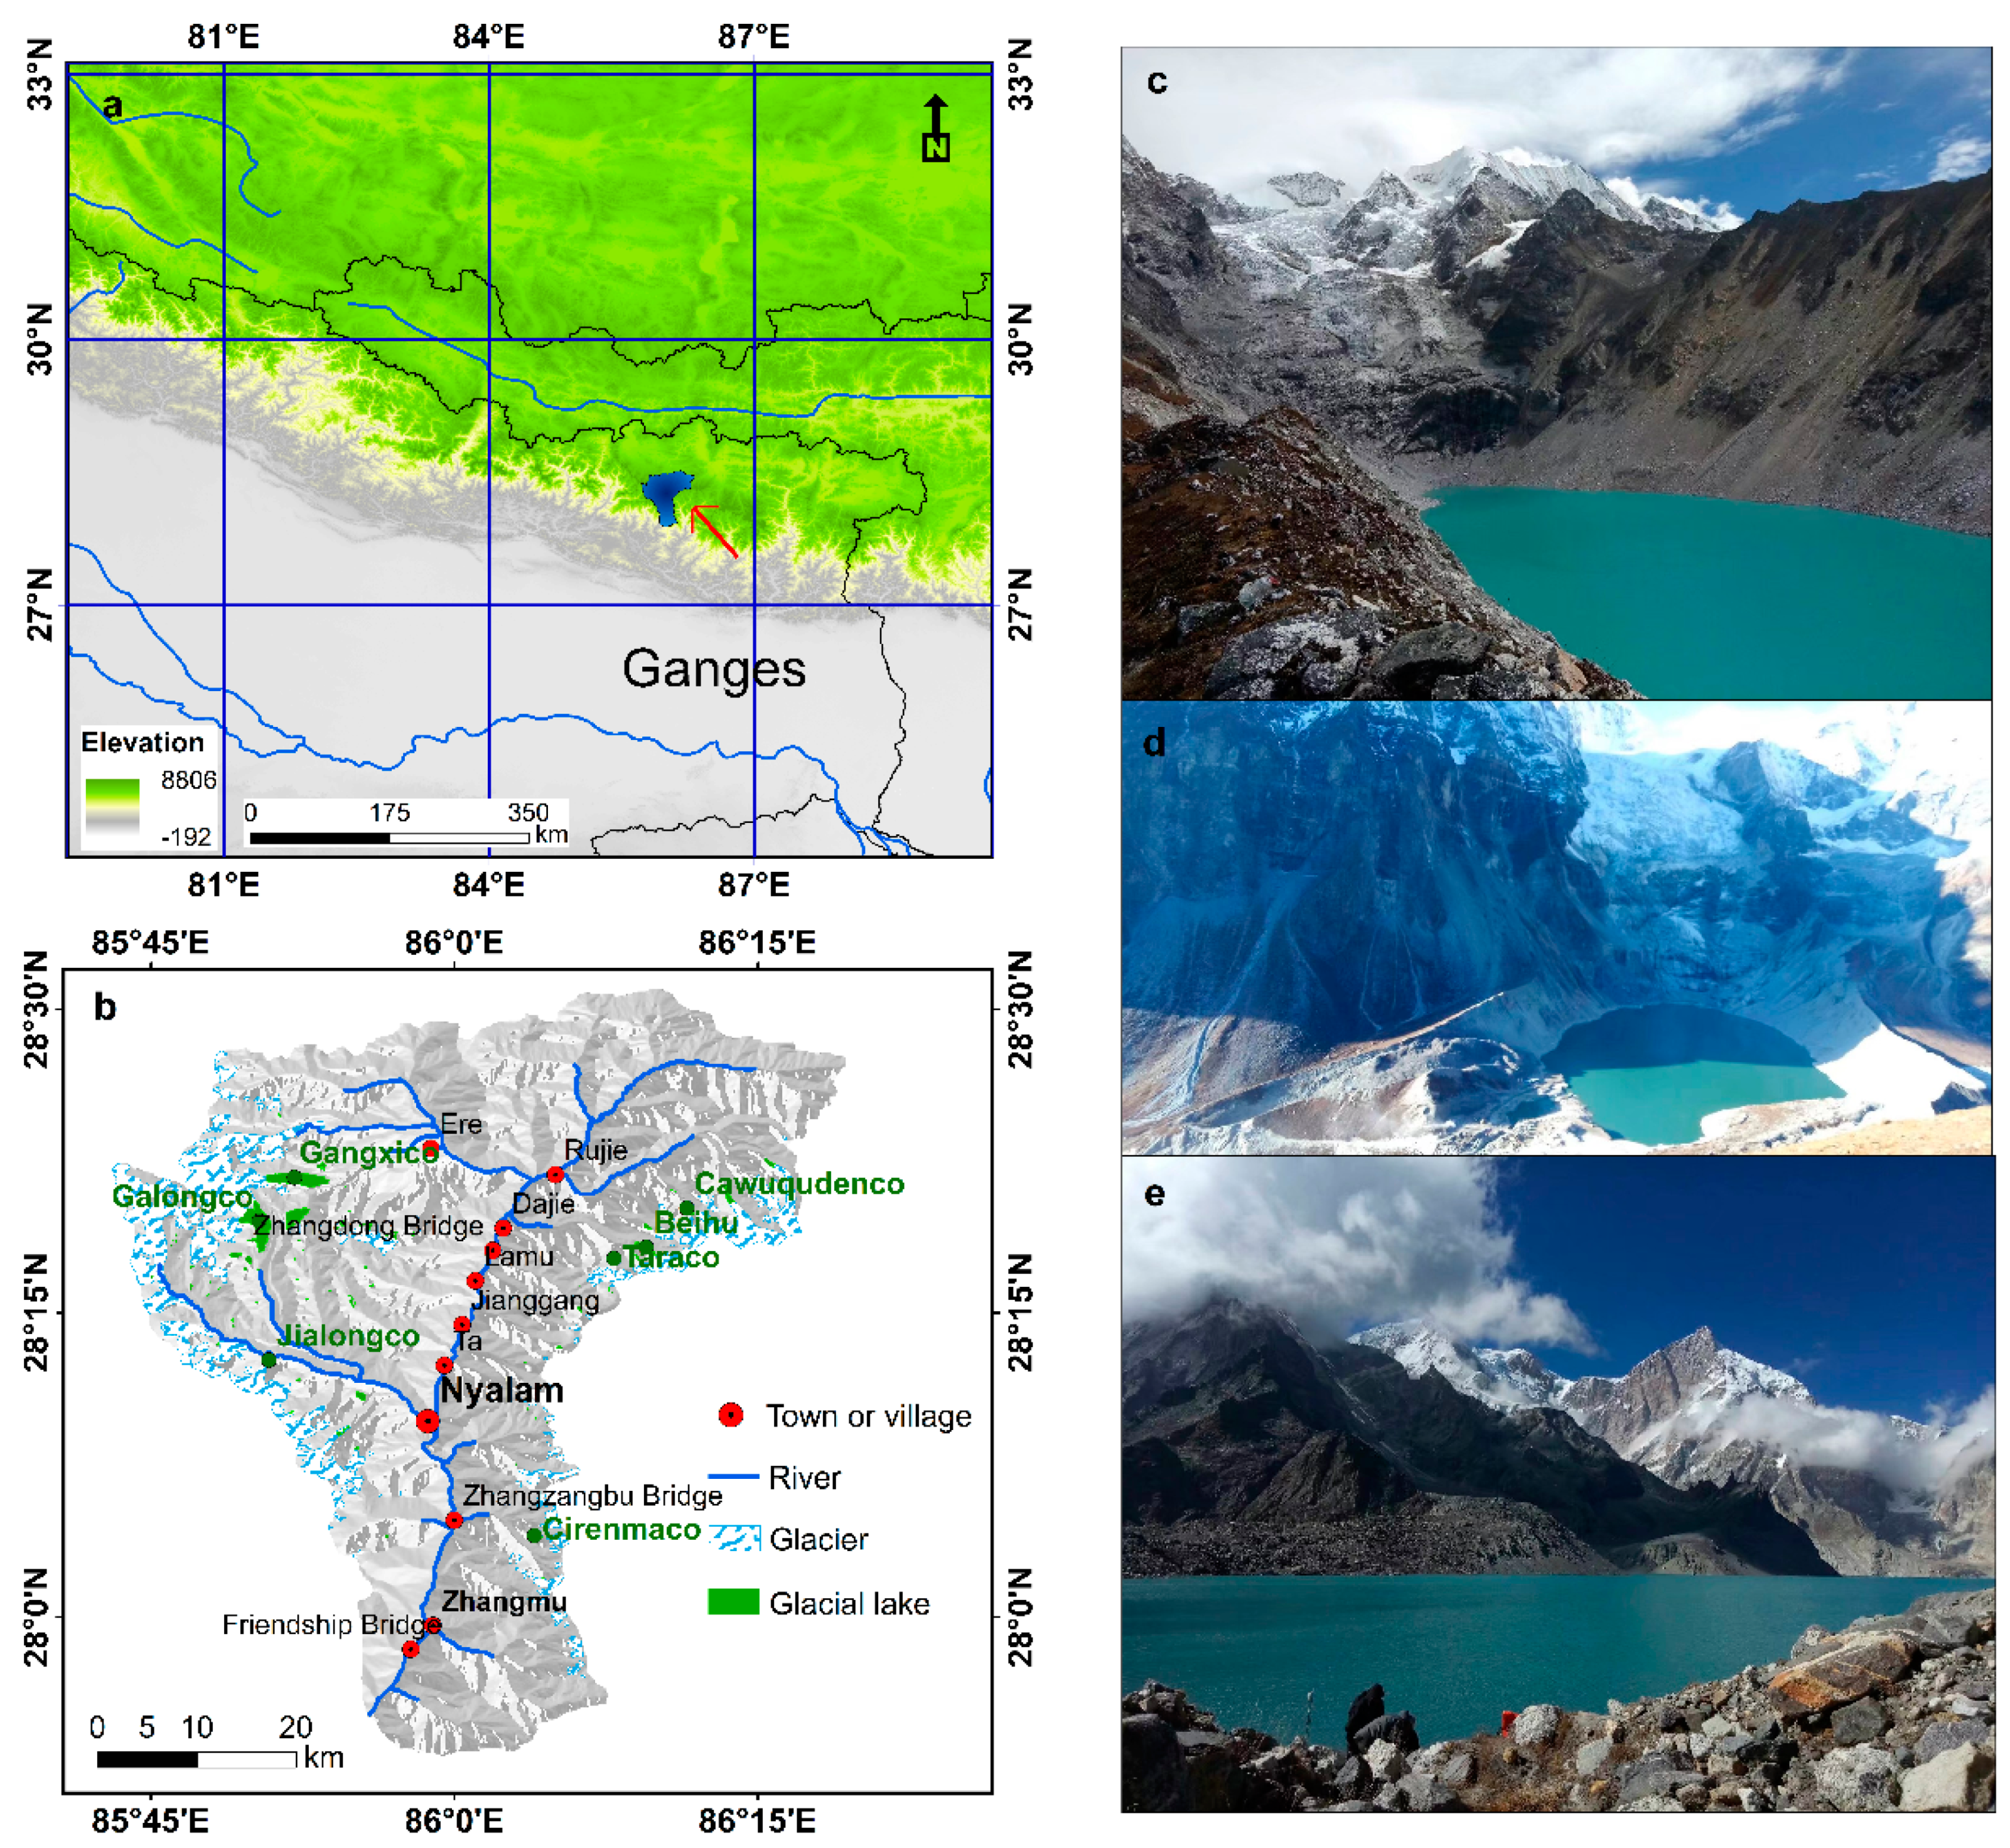
The Poiqu River basin is located on the southern slope of the Central Himalayas. This river is one of the main tributaries of the Ganges (Figure 1). Its watershed area is 2072 km2. Due to the basin’s large altitude differences, its climate includes the subtropical zone, warm temperate zone, cold temperate zone, and alpine tundra zone. Many studies have been conducted on temporal and spatial glacial lake changes, as well as hazard/risk assessment in the basin [26,36,39,40,41]. The latest results reveal that glacial lakes in the basin expanded by approximately 110% between 1964 and 2017, and the average retreat rate of glaciers was 1.4 km2·a−1 between 1975 and 2015 [21]. The area had 59 glacial lakes with mother glaciers in 2018. Galongco is the largest glacial lake in the basin and has experienced steady growth for more than 40 years, expanding from 1.23 km2 to 5.38 km2 during the period 1976–2018.
According to observations from the Nyalam station (3810 m a.s.l.) of the China Meteorological Data Network (1967–2012), the basin’s mean annual temperature was 3.7 °C, and mean annual precipitation was 650.7 mm. The six-year (2006–2011) average temperature at Zhangmu station (2480 m a.s.l.), south of Nyalam station, was 12.8 °C and the average precipitation was 2820 mm [31].
2.2. Historical GLOFs
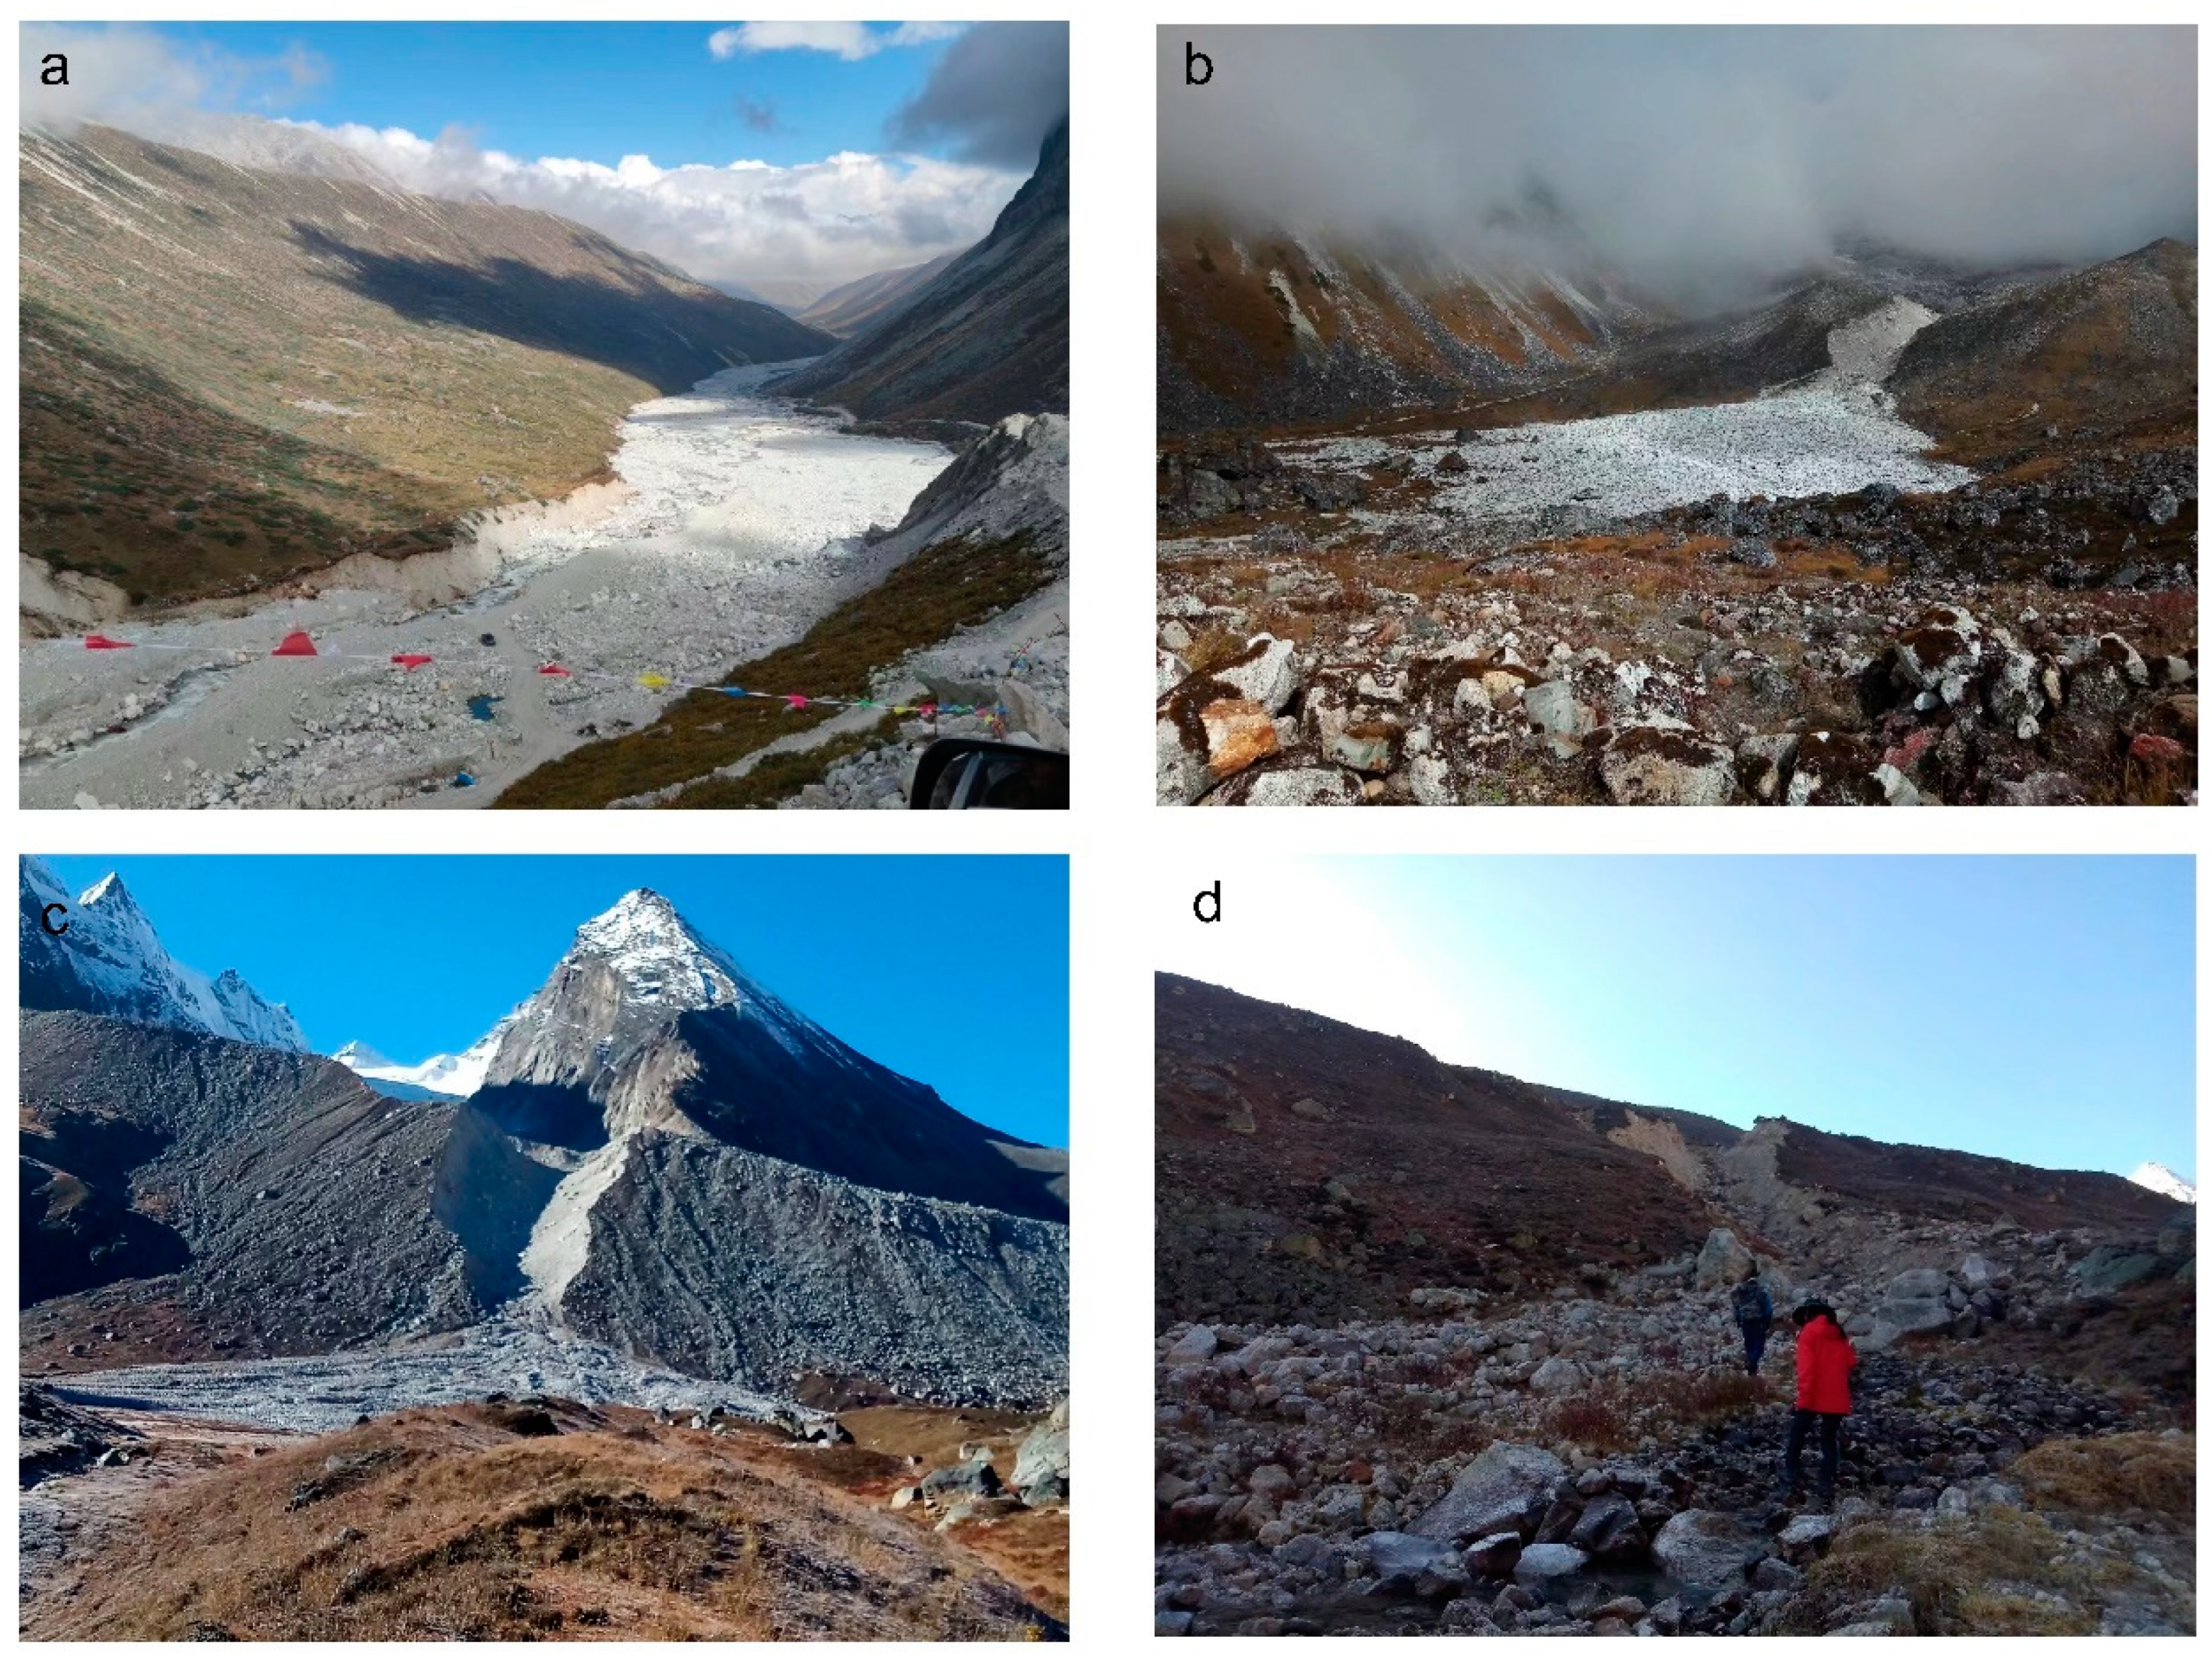
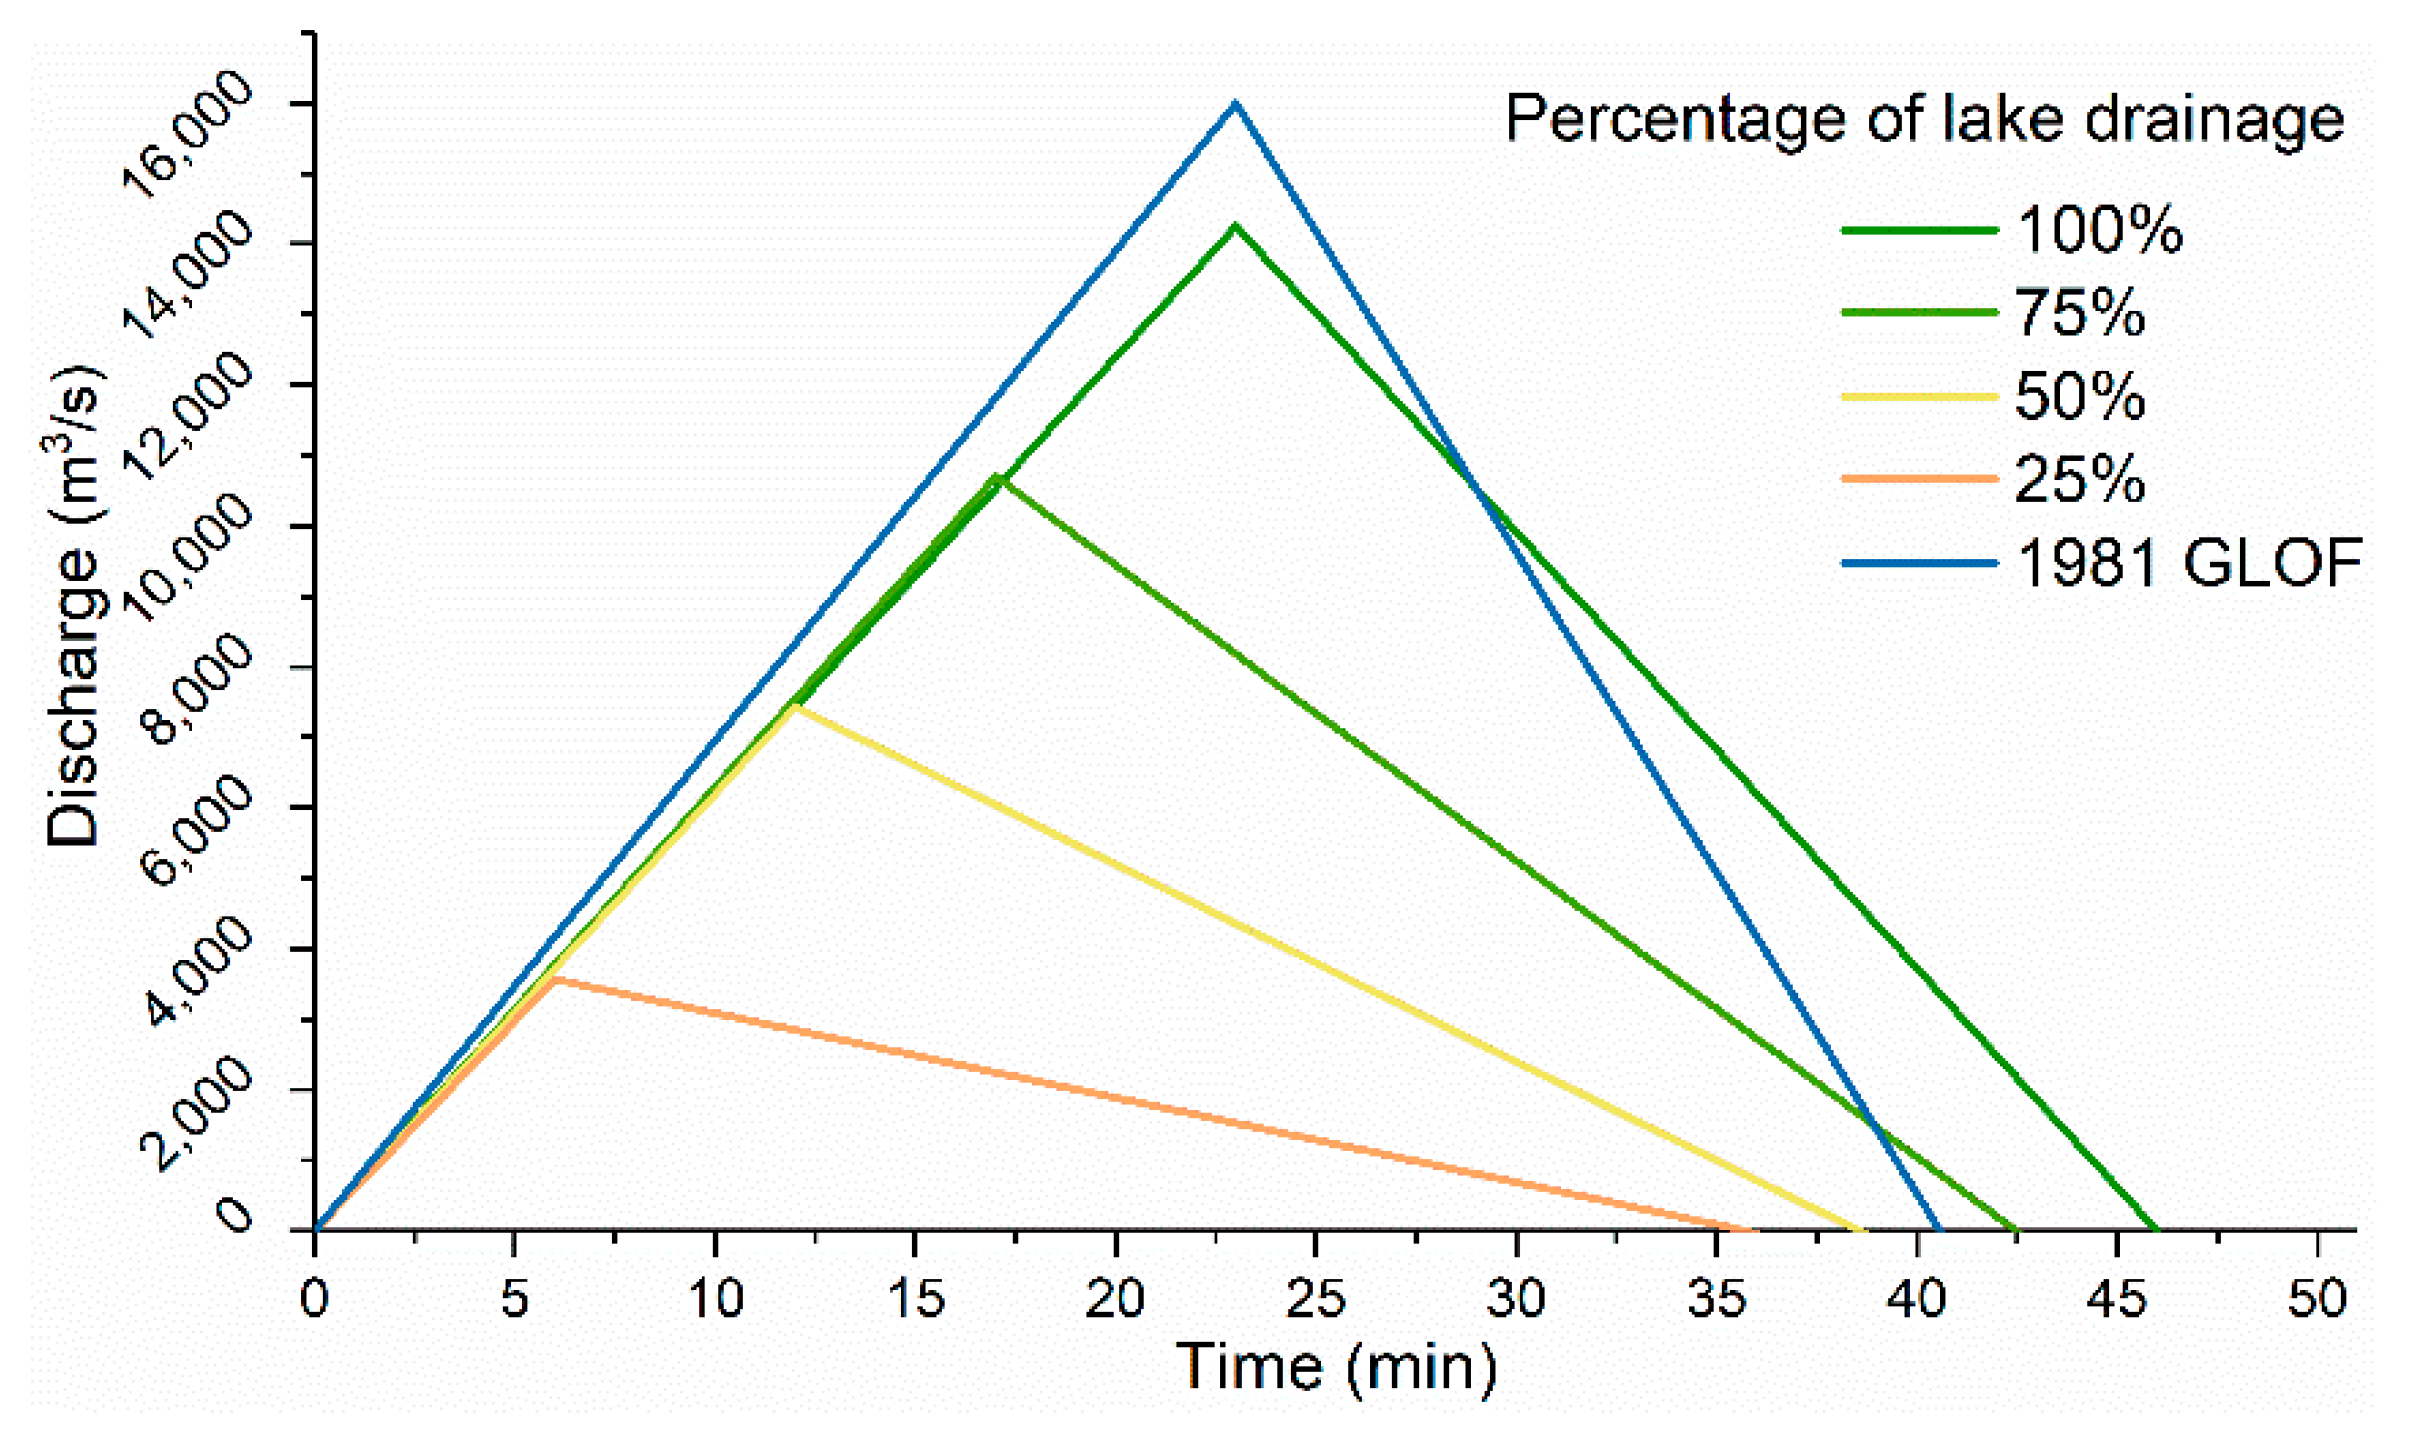
Twelve GLOFs occurred in the basin in the past 100 years. For example, the Taraco GLOF occurred on 28 August 1935. The resulting flood destroyed hundreds of acres of farmland and caused damage along 30 km of river channel [42]. Cirenmaco GLOFs occurred repeatedly in 1964, 1981, and 1983 (Figure 1c). The most severe event was the 1981 flood, which was marked by a peak discharge exceeding 16,000 m3·s−1 and killed approximately 100 people downstream [40,42,43]. Other examples are the Jialongco GLOFs of 23 May and 29 June 2002 (Figure 1d and Figure 2a). Enhanced glacier meltwater and precipitation presumably triggered the outburst, destroying the Nyalam Hydropower Station and approximately 27 km of road downstream, thus resulting in an economic loss of approximately USD 1.5 million [44]. A recent GLOF occurred on 5 July 2016 at Gongbatongshaco (Figure 2b). The flood destroyed a hydropower station in Nepal, causing an economic loss of approximately USD 70 million [15,45]. In addition, another five GLOFs which might have occurred before the 1980s were detected [41,46] (Figure 2c,d).
3. Data and Methods
3.1. Remote Sensing Data
As the first new satellite of the GaoFen (GF) series, GF1 produces multispectral remote sensing images with high spatial resolution and wide field of view (WFV). A total of three GF1 images—acquired on 12 December 2017, 28 December 2017, and 7 October 2018—were used to map buildings, roads, bridges, and certain other objects through manual identification. The High Mountain Asia (HMA) 8-meter digital elevation model (DEM), provided by the NASA Earth data (https://search.earthdata.nasa.gov/search, accessed on 20 December 2019) in 2017, was selected to provide input data for flood modeling. It is a digital elevation model of Asian high mountain glaciers and snowfall regions generated by high-resolution along-track and cross-track stereoscopic images from DigitalGlobe satellites [47]. In addition, several Landsat-5 TM and Sentinel-2A images were used to demonstrate lake evolution and outburst floods.
3.2. Potentially Dangerous Glacial Lakes
Following the 2019 study by Allen et al. [26], 10 very high-risk glacial lakes were highlighted on the Tibetan Plateau, of which seven are situated in the Poiqu River basin, namely Gangxico, Galongco, Jialongco, Cirenmaco, Taraco, Beihu, and Cawuqudenco (Table 1). These lakes were selected based on outburst susceptibility (hazard) and the exposure of downstream communities, and are better representatives (total 1291 glacial lakes, >0.1 km2) than other assessment results [36,40,41]. Of these seven potentially dangerous glacial lakes, Jialongco and Galongco are located upstream of Nyalam, threatening the safety of the urban area, and the remaining lakes generally threaten some villages, such as Ere, Rujie, and Jianggang (see Figure 1b for exact locations).
3.3. HEC-RAS Model and Parameters
HEC-RAS is a two-dimensional hydraulic model and has a wide range of applications in flood prediction and reconstruction [34,48,49,50,51,52,53]. Parameters such as lake volume, peak discharge, and outburst duration in flood modeling were obtained either by field investigation or by empirical estimation. They would be used to estimate the dam-breach hydrograph, which is significant to the precision of the model output. Additionally, a high-resolution DEM and a suitable land surface roughness value can also enhance the model output.
3.3.1. Estimating Lake Volume, Peak Discharge, and Breaching Time
Lake volume is the maximum amount of water that can be involved in a GLOF. The volume–area relationship for moraine-dammed lakes (with an R2 value of 0.94, Equation (1)) proposed by Cook and Quincey (2015) [54] was used in this study. For Cirenmaco, we used a lake volume of 18 × 106 m3 based on an in-situ bathymetric survey to drive the model [31].
V = 60A − 6.2817 × 10⁶
The peak discharge (Qp) and the breaching time (Tp) were estimated using empirical equations [55,56]. Most of the equations predicting peak discharge tend to overestimate, and those predicting breaching time tend to underestimate. However, the Froehlich equations both have the lowest error compared with measured data after verification [57].
Qp = 0.607V 0.295 hw1.24
Tp = 0.00254V0.53 hb−0:9
Here, V is the outburst volume, hw is the depth of water above the breach invert at the time of failure (m), and hb is the breach height (m). These three parameters are replaced by glacial lake volume, height difference between lake water surface elevation and moraine ridge bottom elevation, and height difference between moraine dam crest elevation and moraine ridge bottom elevation, respectively (Table 2). The elevation values are extracted from DEM.
Furthermore, according to a model roughness sensitivity test and suggestions [31], 0.15 was selected as the roughness value for the channel and floodplain regions.
3.3.2. Dam-Breach Hydrograph
In the absence of measured or simulated data, the GLOF process line can be inferred indirectly [58,59]. We assume that the flood discharge will increase/decrease linearly. The outburst volume is then used as a control to draw the GLOF process line (Figure 3). This hypothetical method has been applied in many GLOF studies, and the results are in line with the actual situation [31,52,53].
3.4. Hazard Index
Complete drainage in large or medium-sized lakes has been infrequent in previous GLOFs. Therefore, we divided the lake drainage percentage into four levels: 25%, 50%, 75%, and 100%. According to an inventory of GLOF events from nine moraine-dammed lakes in the Himalayas [46], we calculated the frequency of different lake drainage scenarios (Table 3). The results indicate that among these nine outburst lakes, only one glacial lake drained more than 75% of its water volume, four lakes drained 50–75%, two lakes drained 25–50%, and two lakes drained less than 25%. Corresponding to the percentage of lake drainage, we assumed that the probability is 0.11, 0.45, 0.22, and 0.22, respectively, for the four different scenarios. Finally, we proposed an index to assess the susceptibility and extent of damage from the GLOFs, and to classify the hazard levels of the Chinese part of the Poiqu River basin. This hazard index was calculated in a spatially distributed manner.
Here, U is a union, R corresponds to the GLOF risk (Table 1), P is the likely GLOF volume from the same glacial lake in different scenarios, and D and V are the results of model running, representing the mean depth and velocity, respectively. i represents the seven very high-risk glacial lakes, with values ranging from 1 to 7, and j represents the four grades of breach water volume, with values ranging from 1 to 4. m corresponds to the four different drainage percentages and n corresponds to the seven very high-risk moraine-dammed lakes.
Additionally, the exposure of communities were estimated by summing the submerged buildings, farmland, roads, and bridges. Subsequently, the value was normalized into a range of 0–1. A value of 0 means that it would not be affected at all, and 1 means that it would be most affected.
4. Results
4.1. Impact of GLOFs
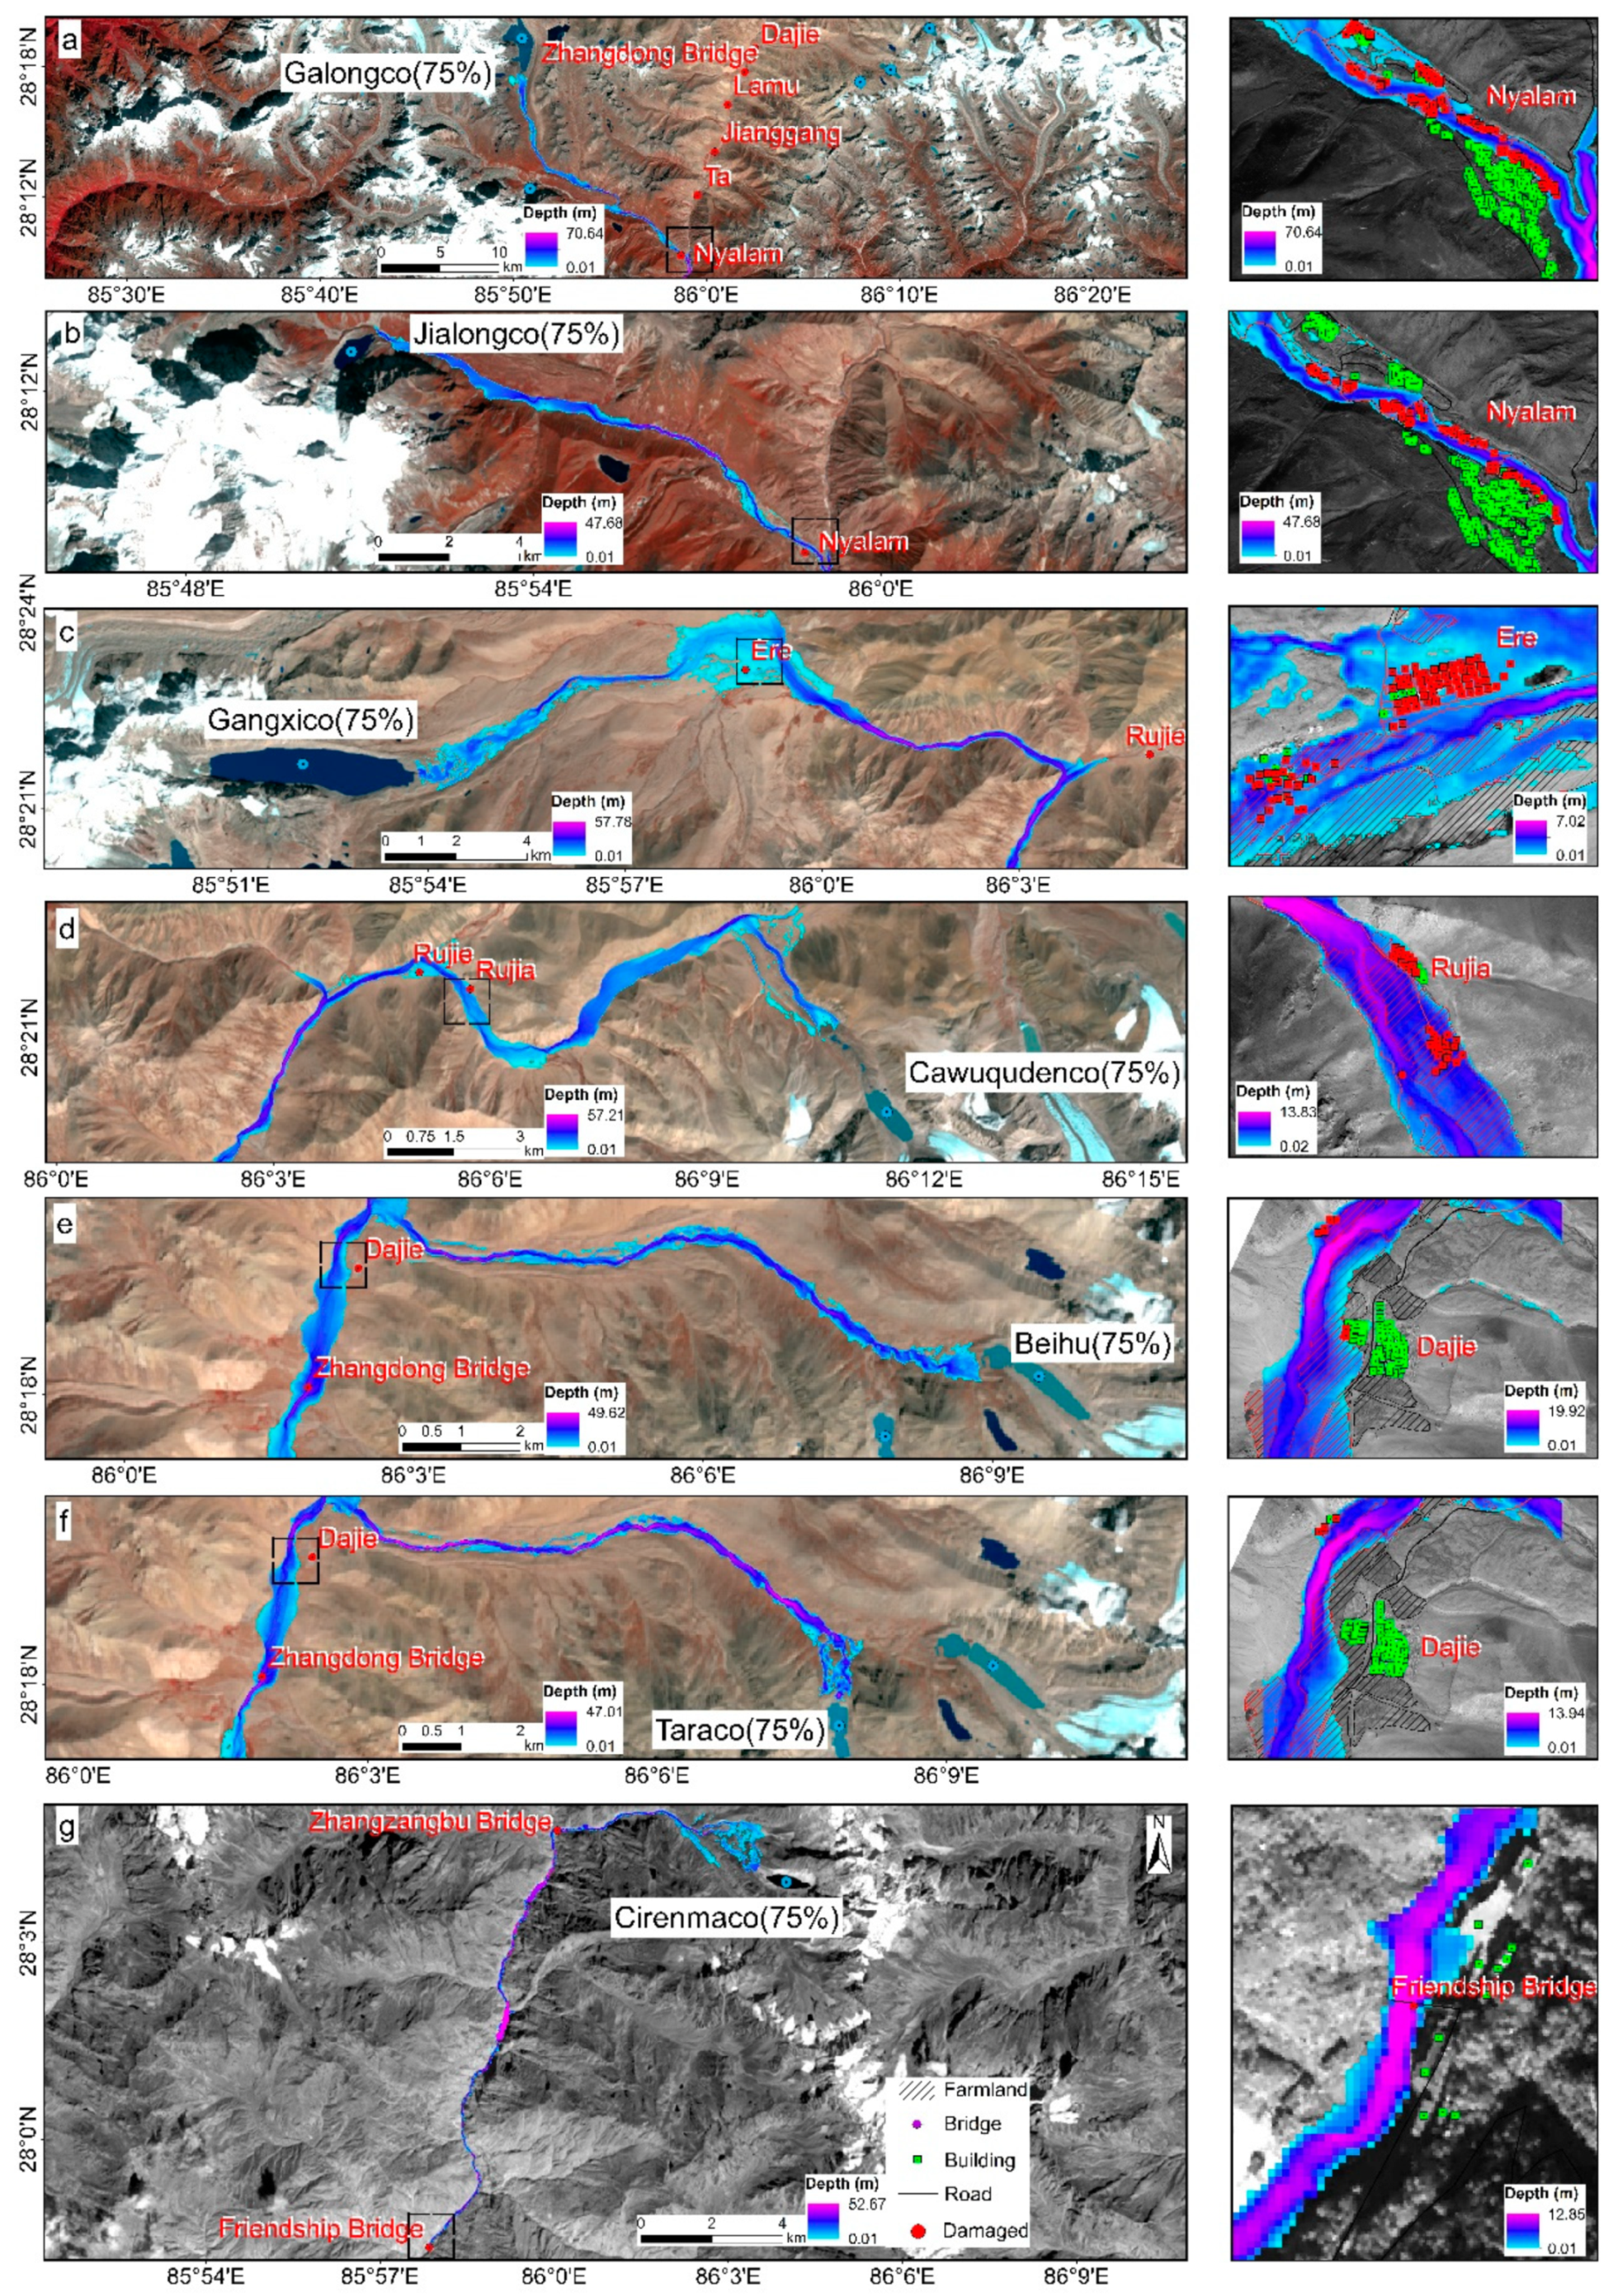
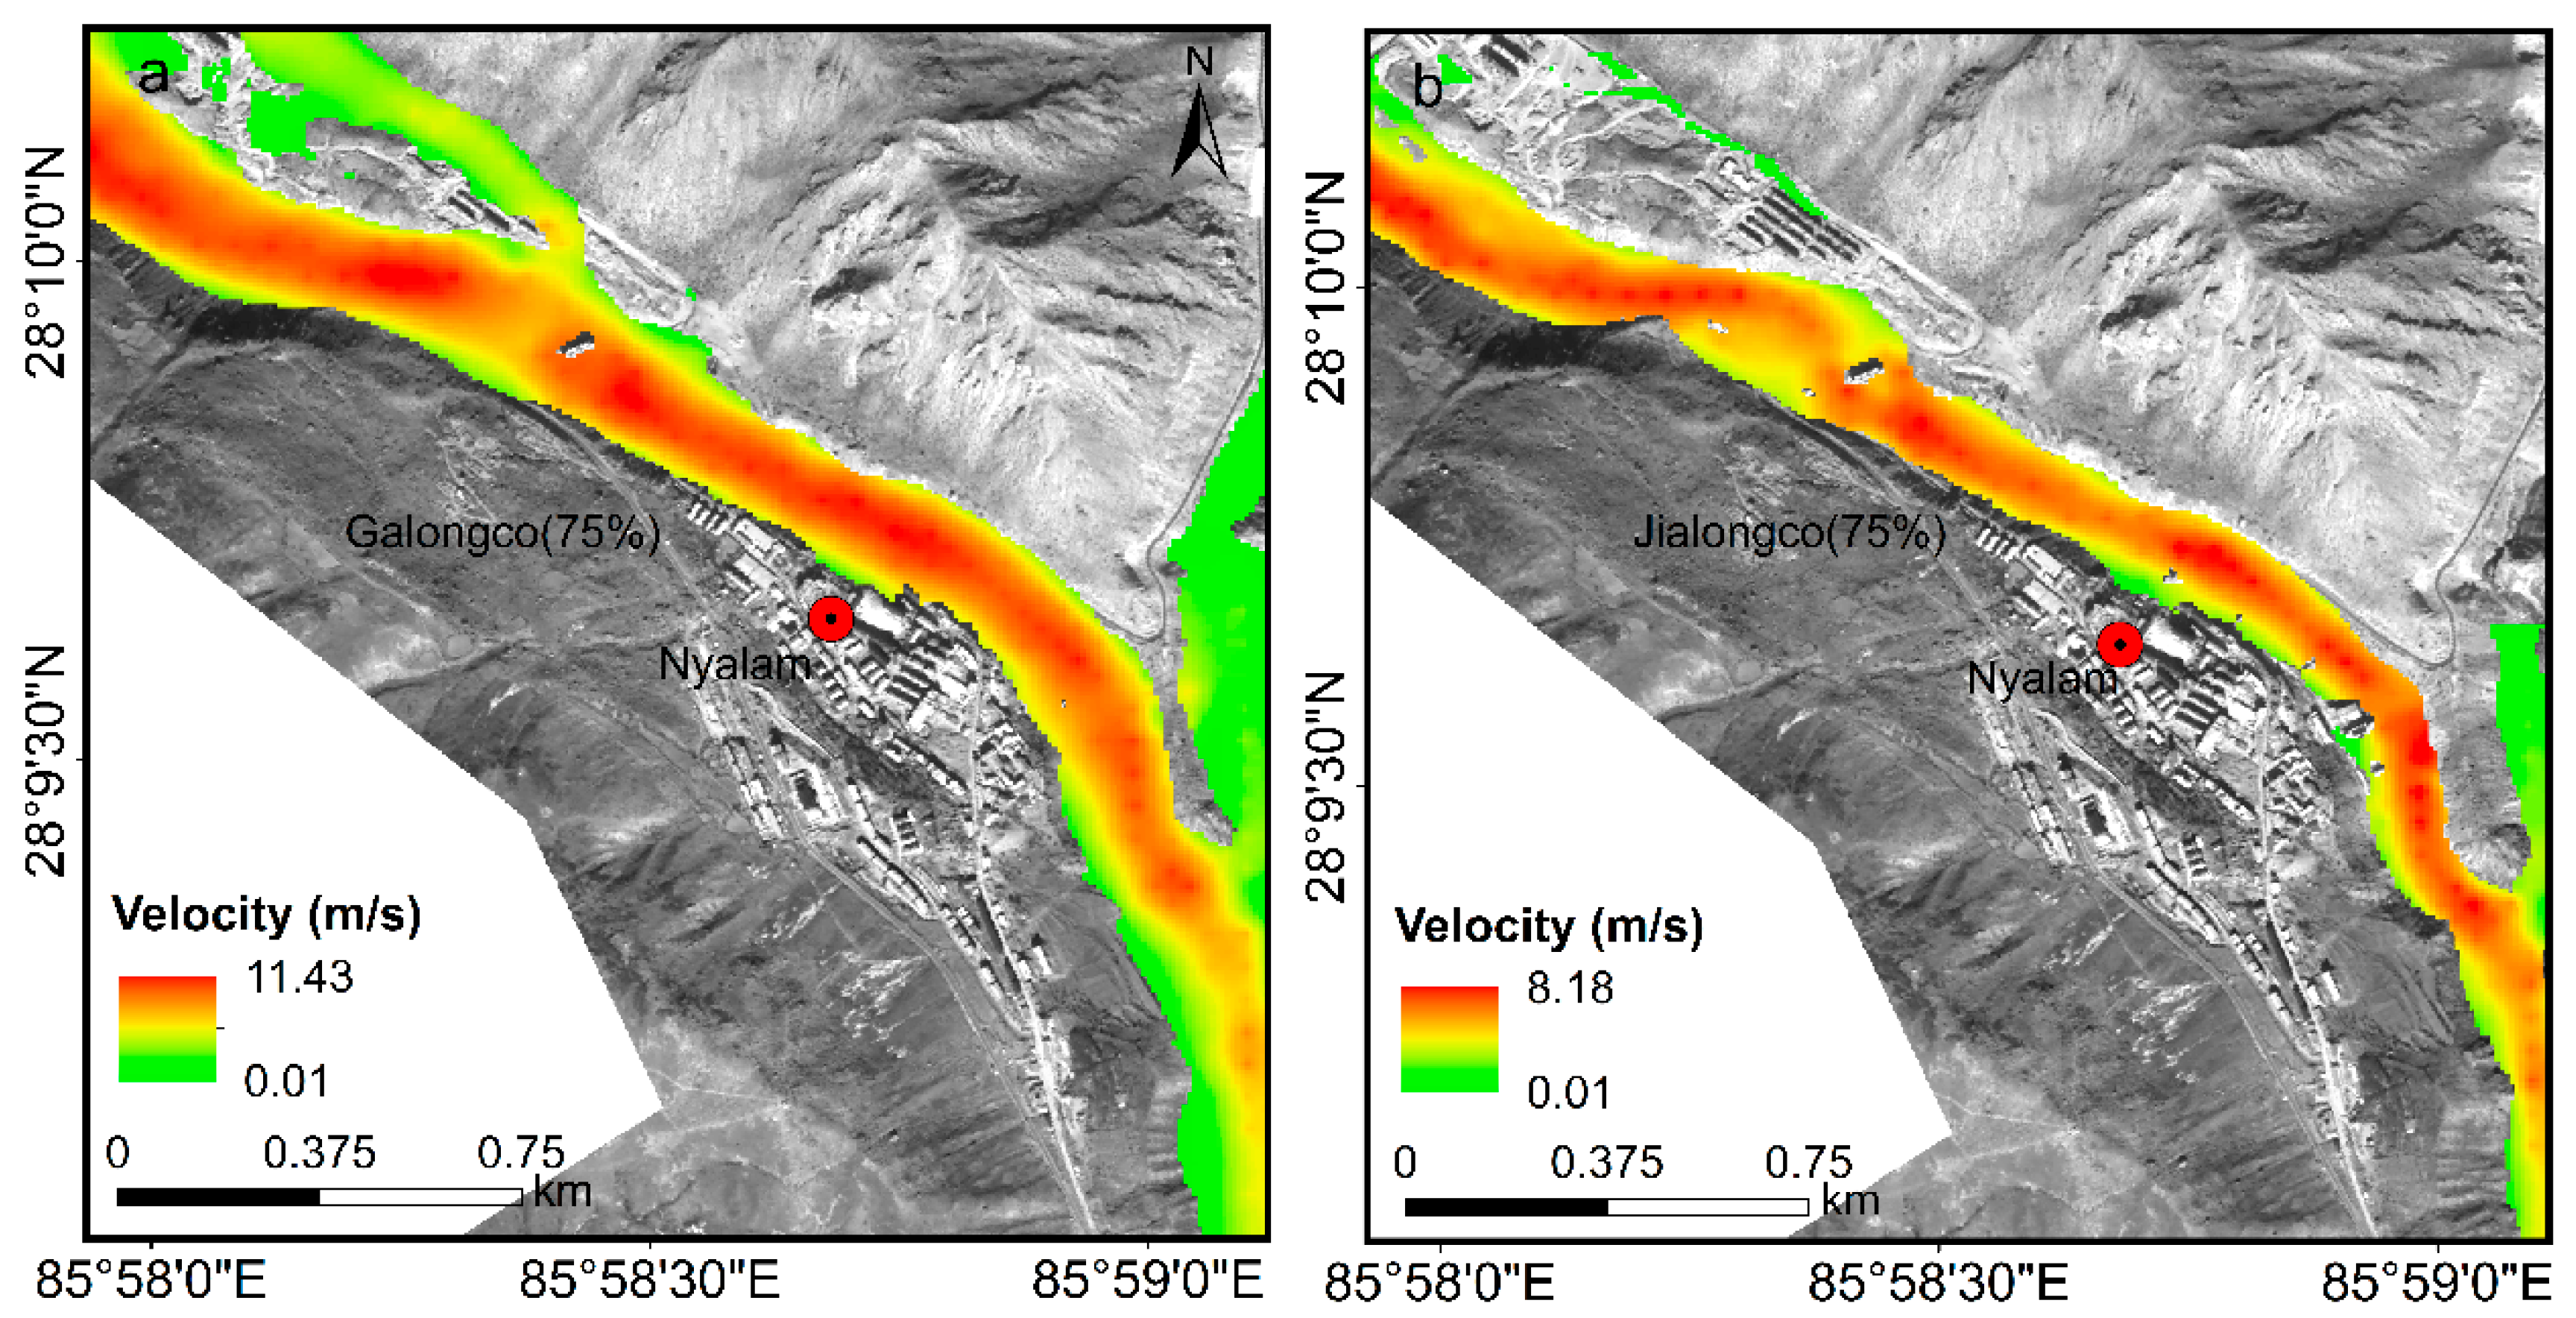
The GLOF simulation results show that if any of the seven very high-risk glacial lakes drained, it would cause serious socioeconomic impacts to downstream areas, even under the smallest drainage scenarios. After the GLOF has raged in China, it is generally projected to continue to cause damage in Nepal (Table 4). For example, a Galongco outburst at 75% volume could inundate a downstream area of up to 11.92 km2, with an average inundation depth of 17.45 m and an average flow velocity of 6.04 m/s. In addition, 12.02 km of roads and 132 buildings could be at risk (Figure 4a). A Jialongco GLOF (75% drainage scenario) could inundate an area of up to 5.61 km2, with an average inundation depth of 10.91 m and an average flow velocity of 4.41 m/s (Figure 4b). Under these 75% drainage scenarios, the upper district of Nyalam (a new area developed recently) could be threatened by floods, while the lower main district would be less threatened by flooding due to its higher location (Figure 5).
Gangxico is the second largest glacial lake in the Poiqu River basin. Several villages are located downstream. In the case of 75% outburst volume, the inundated area could be as large as 21.4 km2, with an average inundation depth and flood velocity of 13.21 m and 4.56 m/s, respectively. It is projected that 40.55 km of roads, 2.76 km2 of farmland, 507 buildings, and 18 bridges could be at risk during a GLOF (Figure 4c).
Cawuqudenco, Beihu, and Taraco are situated in the northeast of the Poiqu River basin and more than 14 villages are located downstream. If Taraco released 75% of its volume, the GLOF’s peak discharge could reach 10,494 m3/s and the inundated area could be 7.02 km2, with an average inundation depth of 5.82 m and an average flood velocity of 3.33 m/s. In addition, 5.89 km of highways, 0.83 km2 of farmland, 37 buildings, and 12 bridges could be at risk. The destructiveness of the Cawuqudenco and Beihu GLOFs are similar to the Taraco GLOF (Figure 4d–f). Cirenmaco is the most dangerous glacial lake in the Poiqu River basin. If it suddenly drained (under a 75% drainage scenario), the inundated area could be as large as 2.48 km2, with an average depth of 10.84 m (Figure 4g).
Considering the damage caused by outburst floods, the area between Dajie village and the Zhangdong Bridge upstream of the Poiqu River would be most severely impacted (Table 5). Because the valley here is relatively flat, roads and buildings are built close to the river.
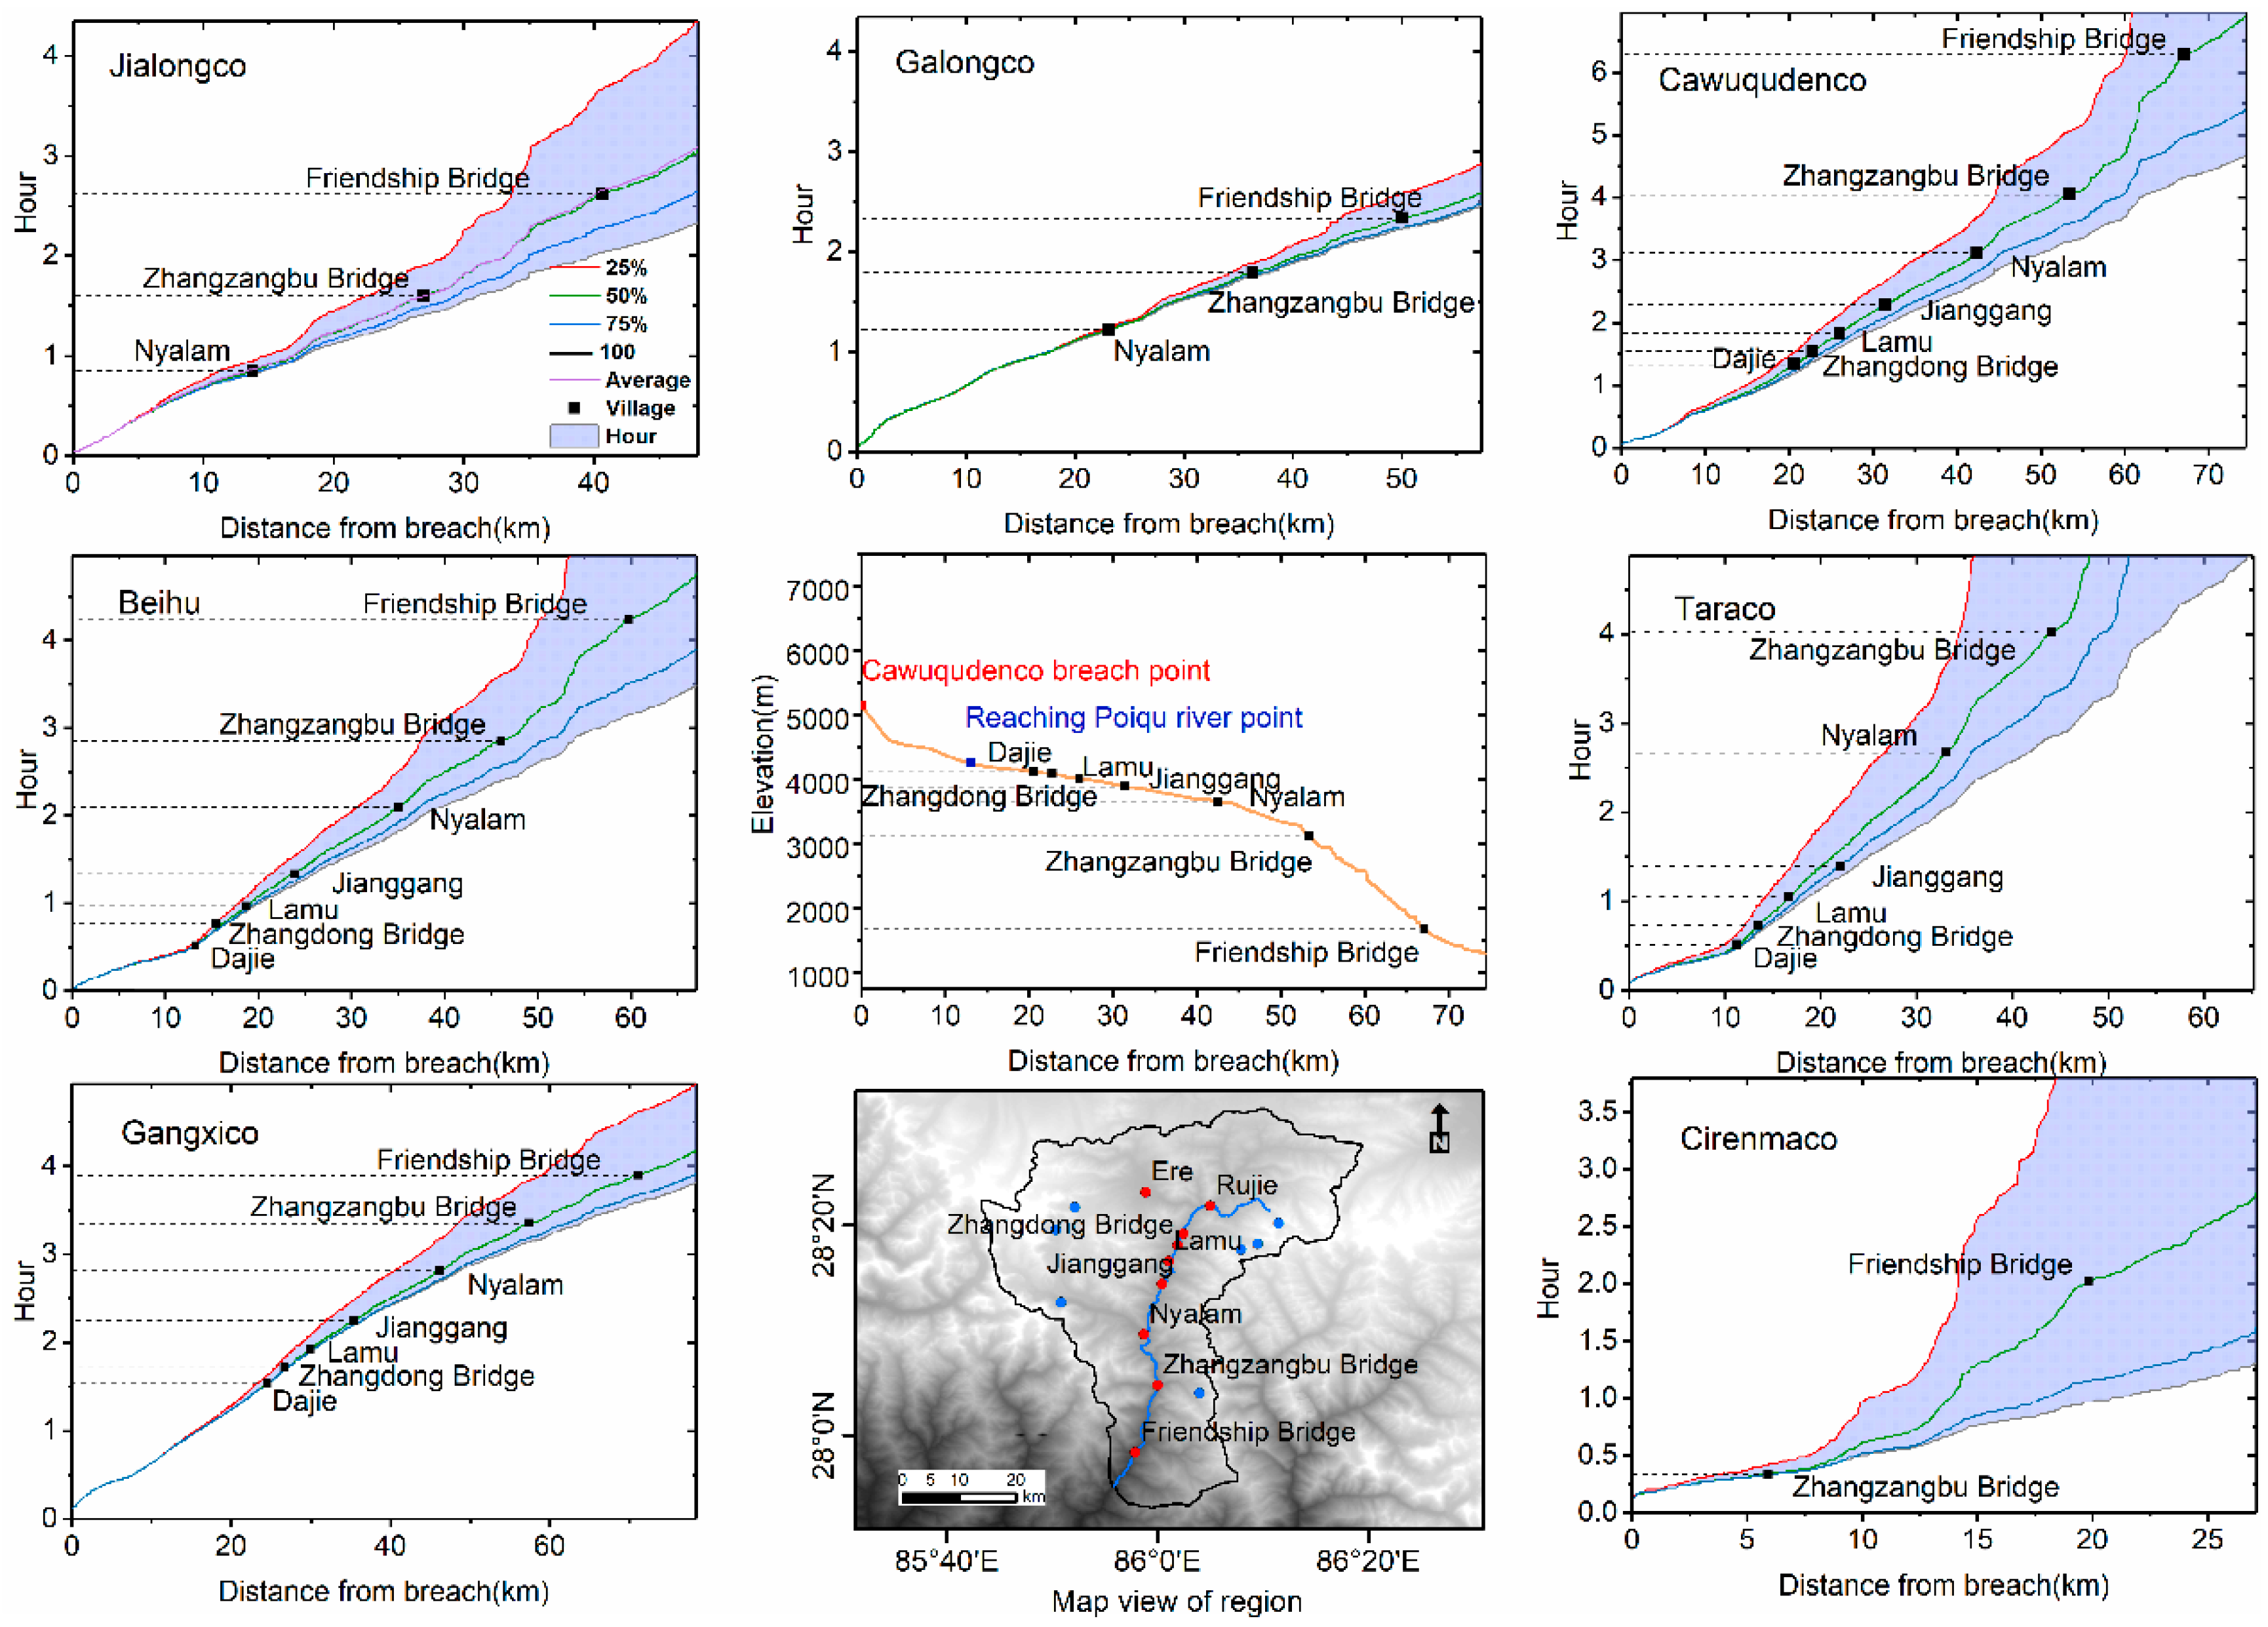
Figure 6 displays the estimated arrival time of peak discharge in the main villages and towns. The large amount of water, high peak discharge, and long duration of a Gangxico GLOF could cause the most severe damage to the Poiqu River basin. Except for villages like Ere that are very close to the glacial lake and would be quickly inundated, other settlements would have enough time to evacuate since the GLOF is projected to travel a long distance before it enters the main channel of the Poiqu River. Taraco, Beihu, and Cawuqudenco GLOFs might take more than 30 minutes to flow from tributaries to the main stream. In addition, GLOFs from Jialongco or Galongco might take at least 55 minutes to reach the upper district of Nyalam, even in the fastest moving scenario. Therefore, a GLOF early warning system at the glacial lake would be an important measure to reduce the loss of life and property.
4.2. Hazard Map
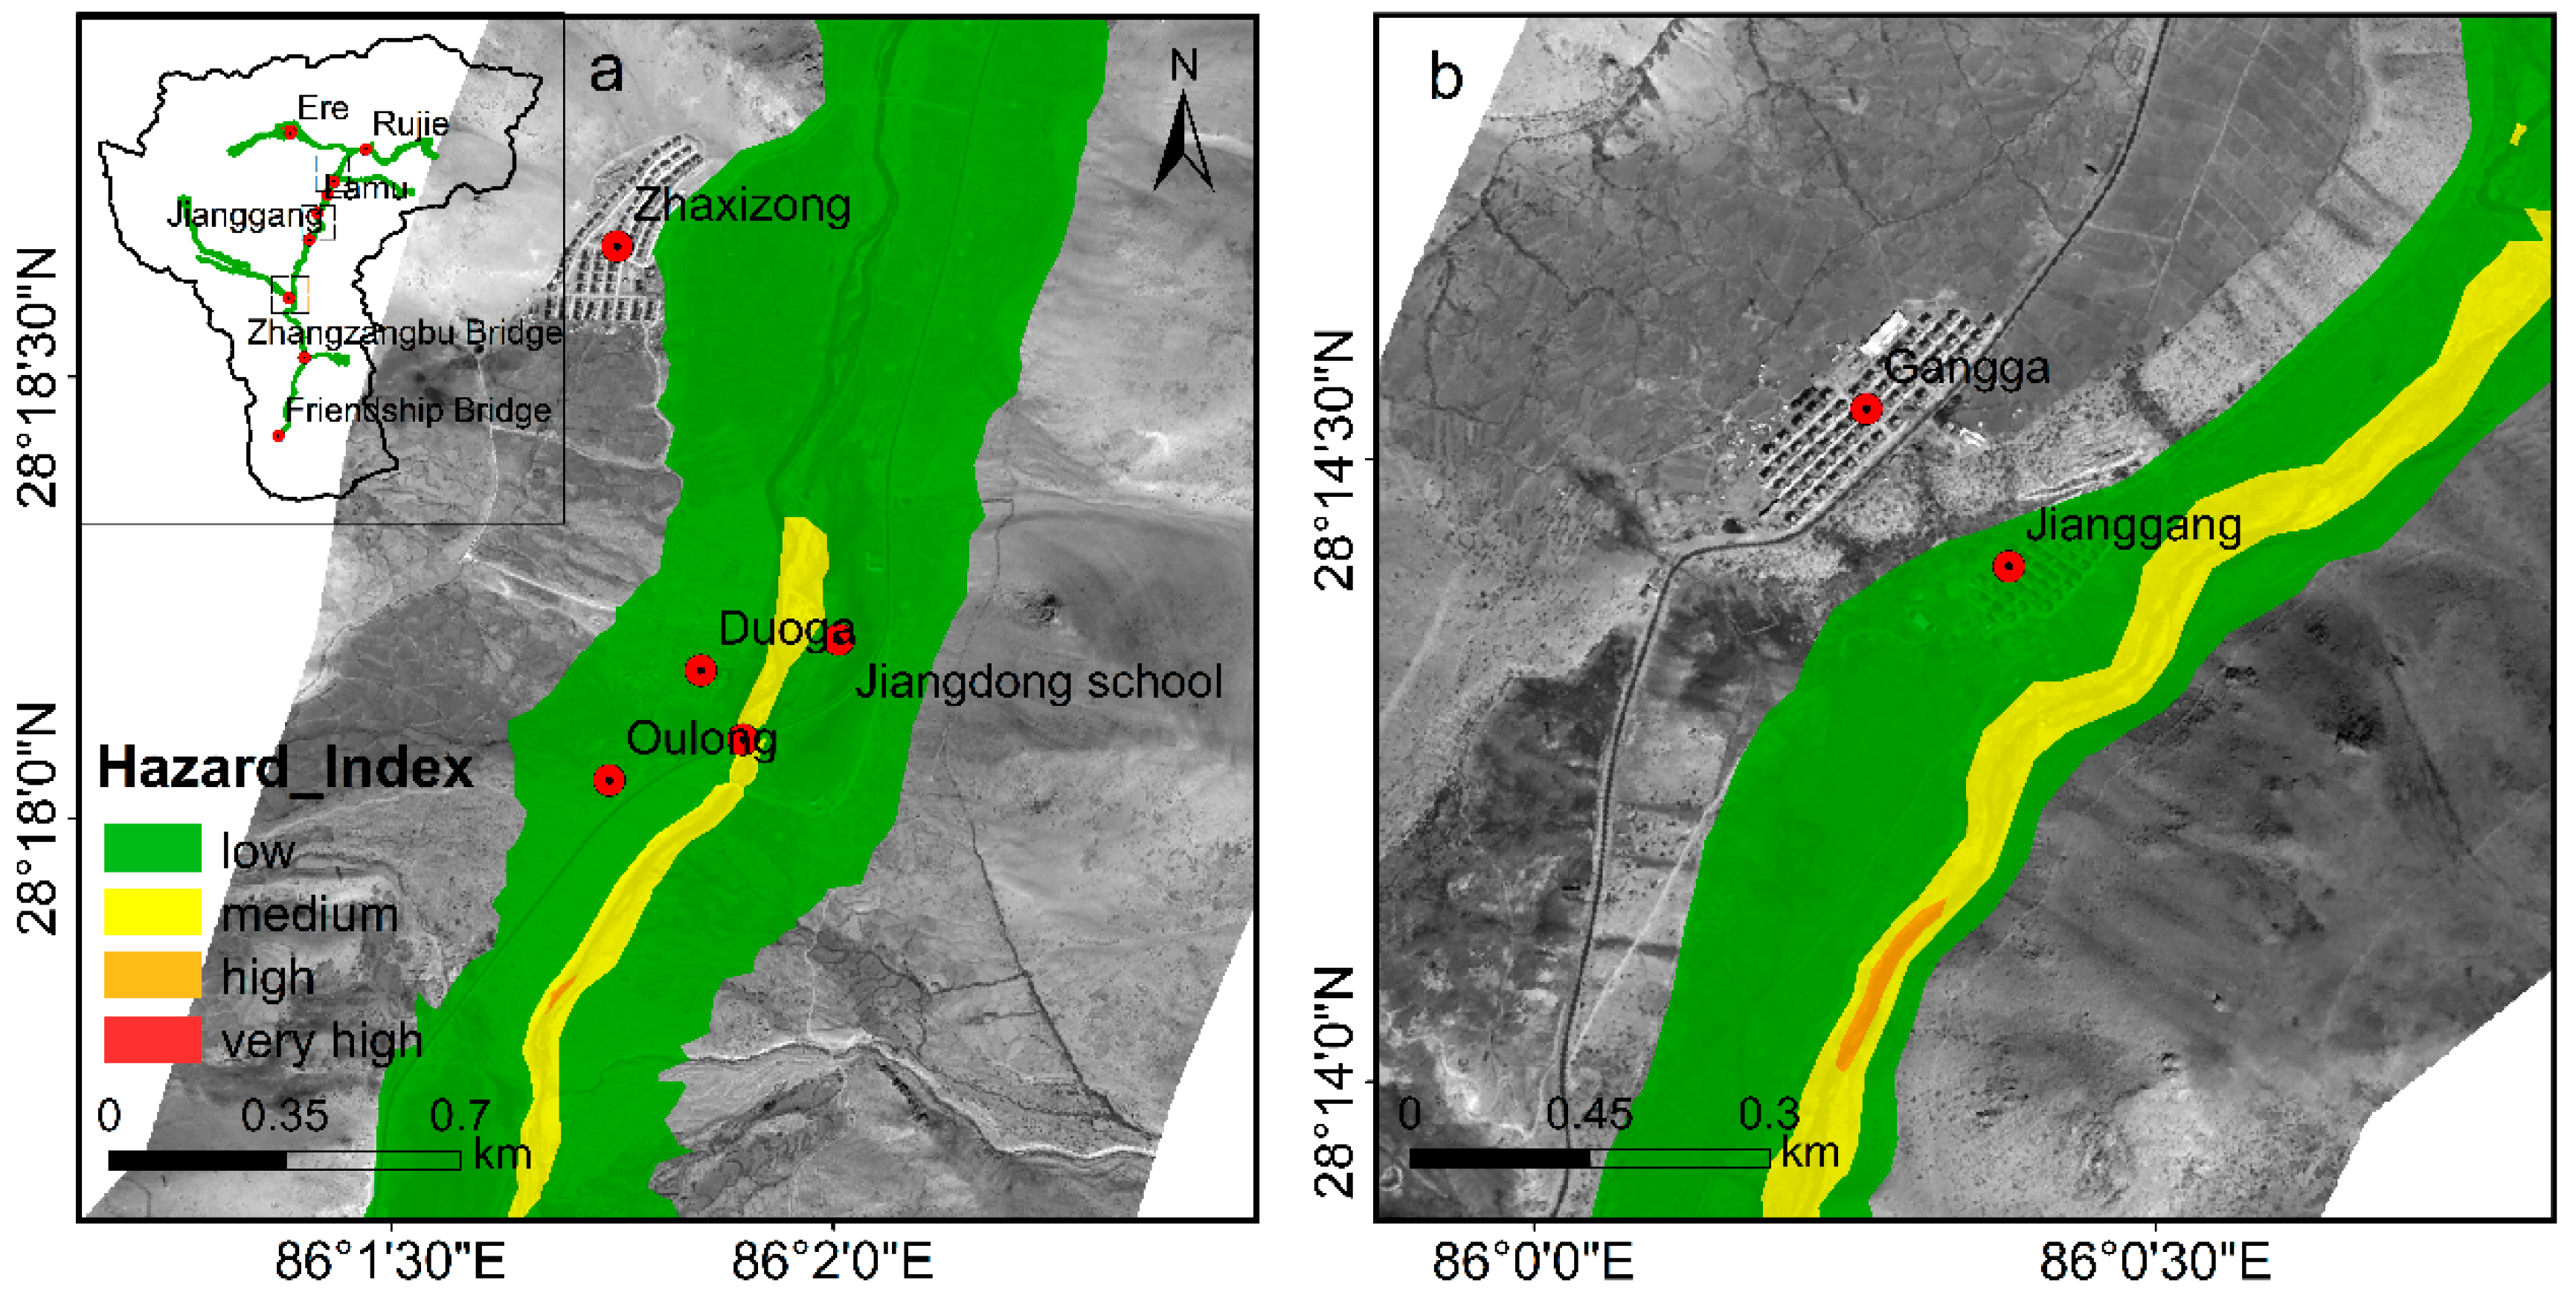
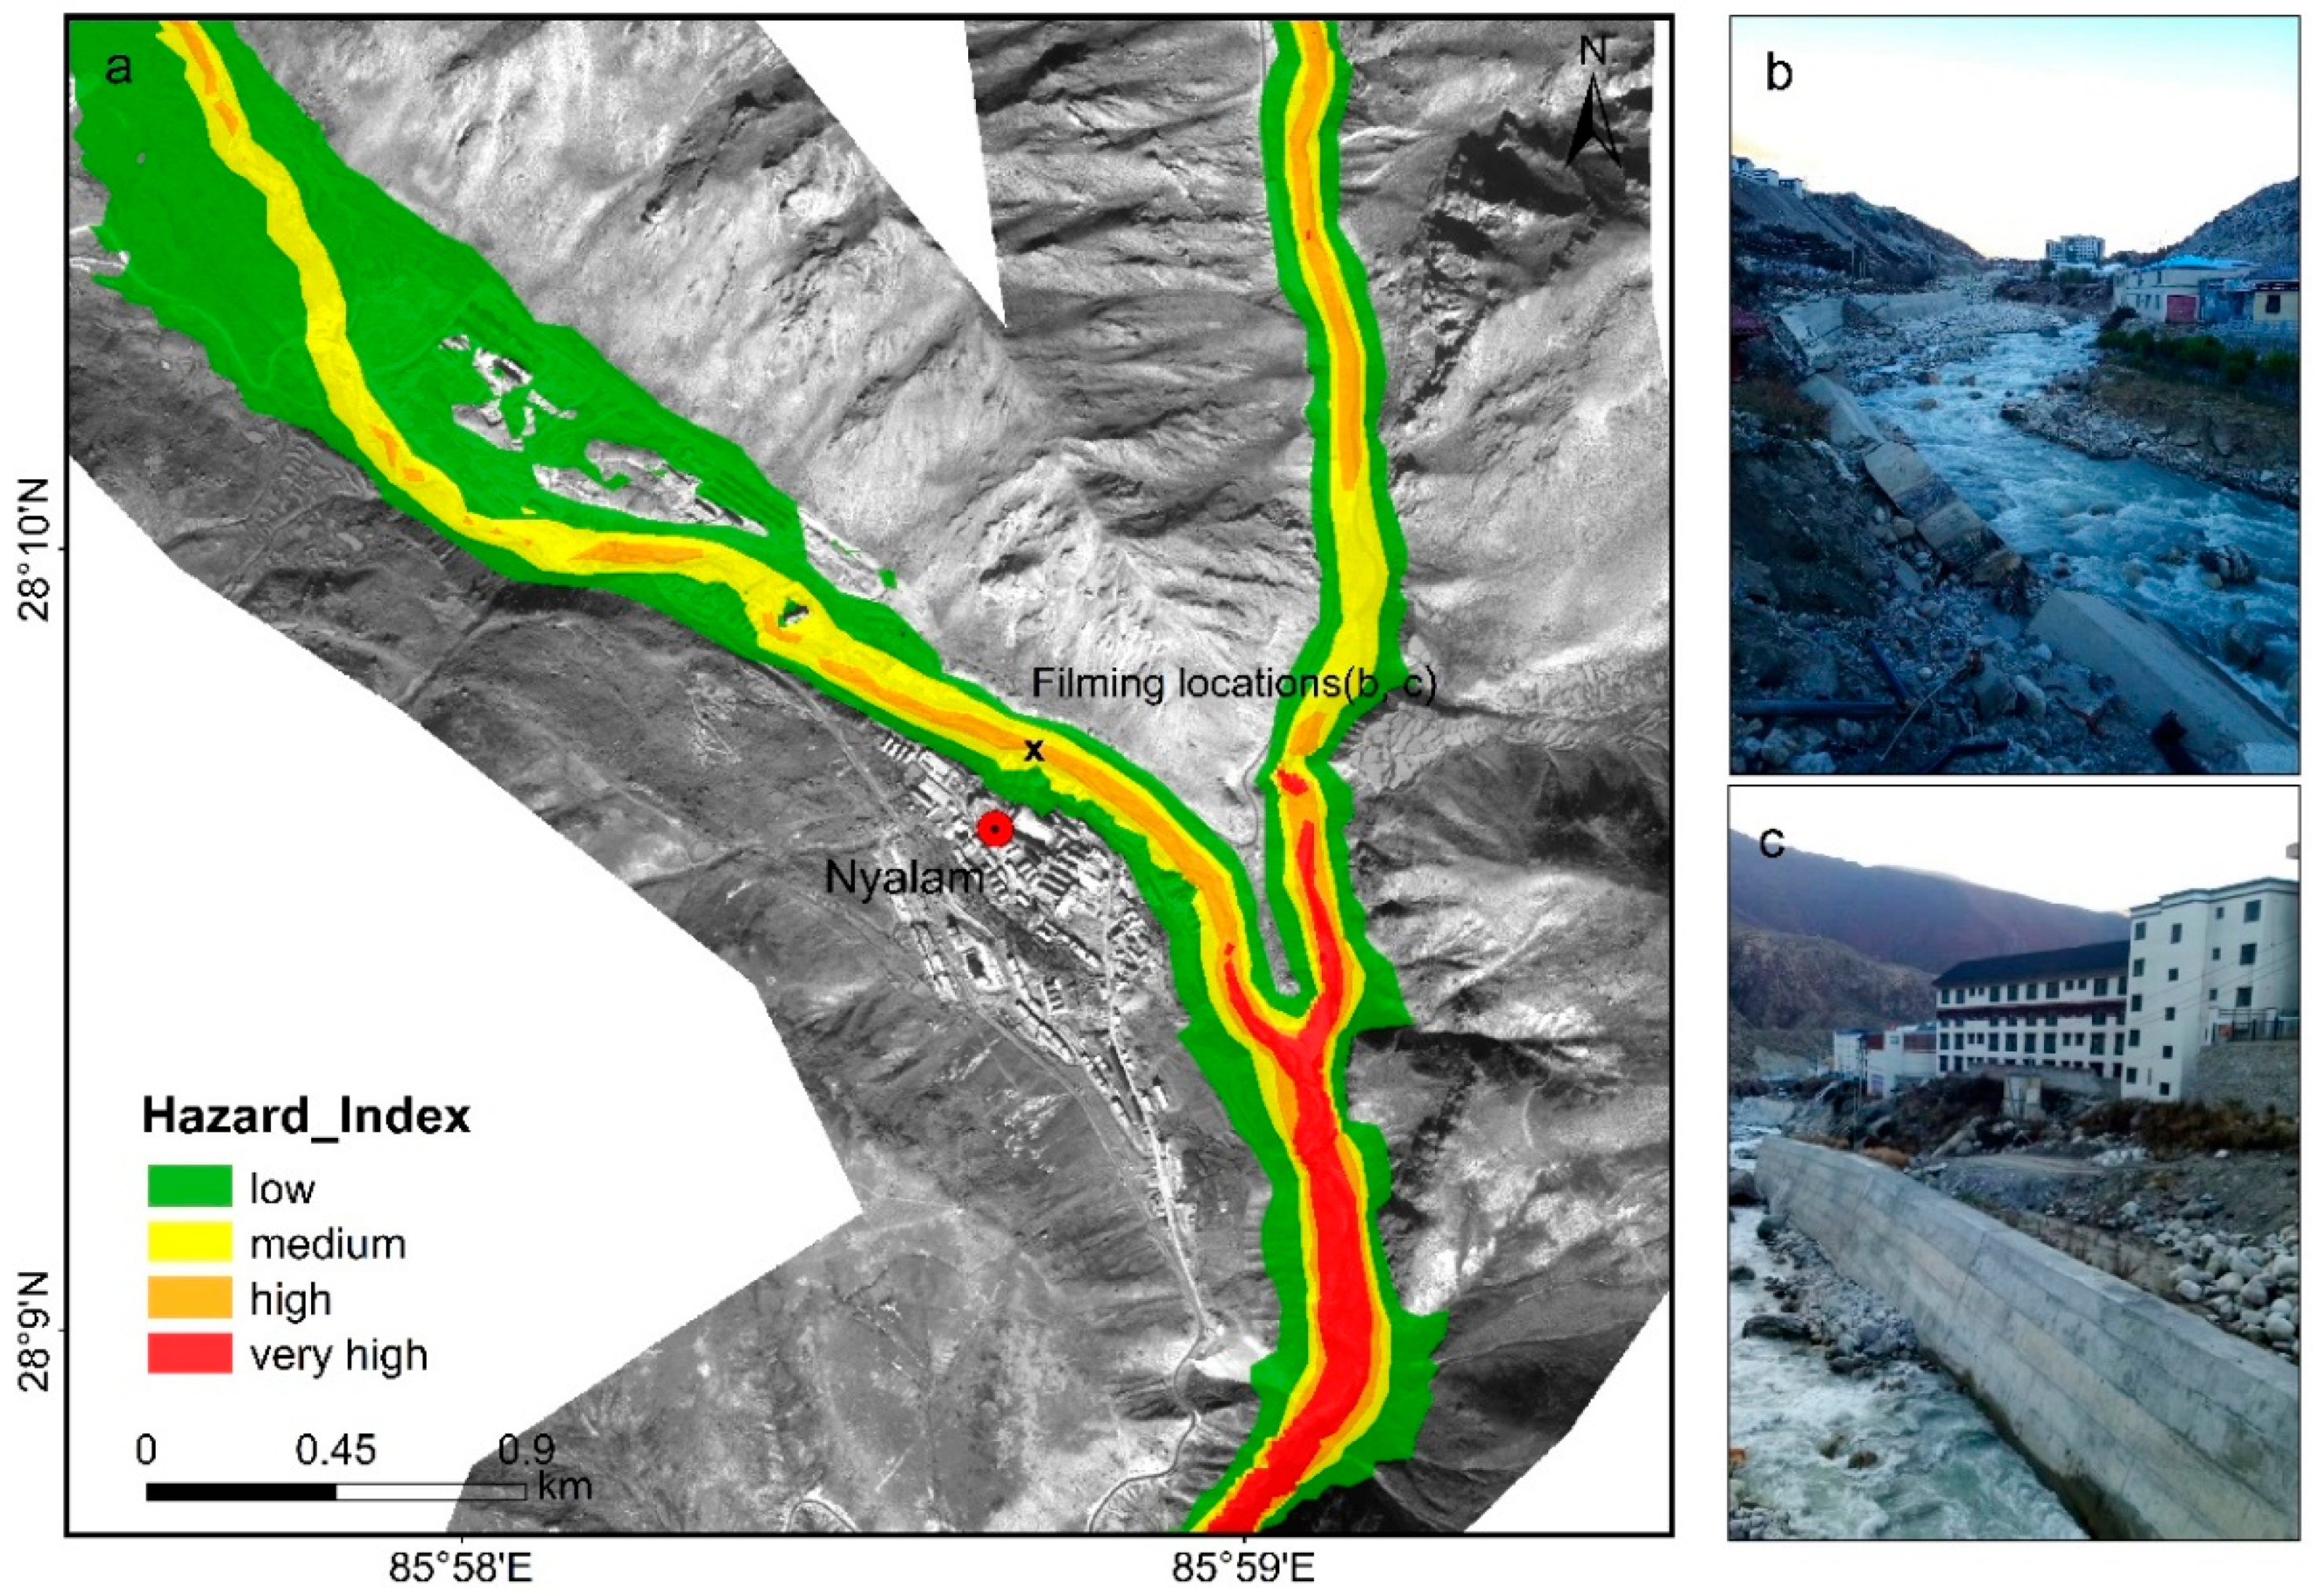
We divided hazard into four levels based on the natural Jenks classification method of ArcGIS, namely low, middle, high, and very high hazard. The hazard level is generally high or very high in the river course, since our hazard index measures susceptibility to GLOF damage and the extent of such damage. In Dajie village and its downstream area, GLOFs from Gangxico, Cawuqudenco, Beihu, and Taraco threaten safety. For example, Jiangdong Primary School and some buildings are located near the river course where they are exposed to high hazard (Figure 7). The upper main district of Nyalam near the river course is also exposed to high and very high hazard (Figure 8). Hence, future development of the region should proceed cautiously.
5. Discussion
5.1. Uncertainty Analysis
5.1.1. Clear-Water Flow
Although most GLOFs can evolve into debris flow [59], we only conducted clear-water flow simulations in this study for three reasons. First, debris flow simulation requires more parameters, which are lacking in this study. In our GLOF modeling, we either applied empirical equations to obtain parameters or avoided using complicated parameters that can only be obtained through field investigation [31,34,52,53]. Second, the clear water flow scenario in the HEC-RAS model is easy to apply and can give first-order results that improve the capability of practitioners to learn more about glacial lake hazard/risk assessment. Third, debris flow causes more severe damage near the breach, while clear-water flow can move farther distances and inundate more areas, which is more suitable for maximizing the scope of assessment [60].
5.1.2. Comparison with Other Studies
The overall behavior of GLOFs in the valley was well demonstrated based on HMA DEM (8 m). Although using HMA DEM in steep, narrow topography involves higher uncertainty than in flatter areas, it had little impact on our simulation results. Due to data limitations, we only analyzed simulation results in the Chinese part of the Poiqu River basin, which has relatively flat valleys. Moreover, the uncertainty of HMA DEM is equivalent to other DEMs, including SRTM (90 m), TanDEM-X (90 m), and PALSAR-DEM (12.5 m) (Niipele and Chen, 2019). A comparative experiment performed on these DEMs in the Nianchu River basin, Eastern Himalayas [33], indicated that the ratios of 100 random points extracted from different DEMs are close to 1:1 (the average difference is less than 3 m), and the median is less than 2 m in pairwise comparisons. In addition, we reconstructed the 1981 Cirenmaco GLOF to verify the credibility of HMA DEM, utilizing the same method as Wang et al. (2018) [31], which used STRM to model flood propagation. By comparison with in-situ measured data in six selected locations (Table 6) [42], uncertainties in the floods reconstructed by HMA DEM and STRM were analogous, and both were within 30% difference of in-situ measurements. Moreover, the presented flood characteristics are also analogous since the average flood depth was estimated to be 15.33 m and 14.21 m using STRM and HMA DEM simulations, respectively. Modeling with HMA DEM not only guarantees the reliability of model results compared with other lower-resolution DEMs, but also has better capacity to display details. This helps improve the accuracy of the modeling output and the subsequent hazard assessment.
5.1.3. Modeling Parameters
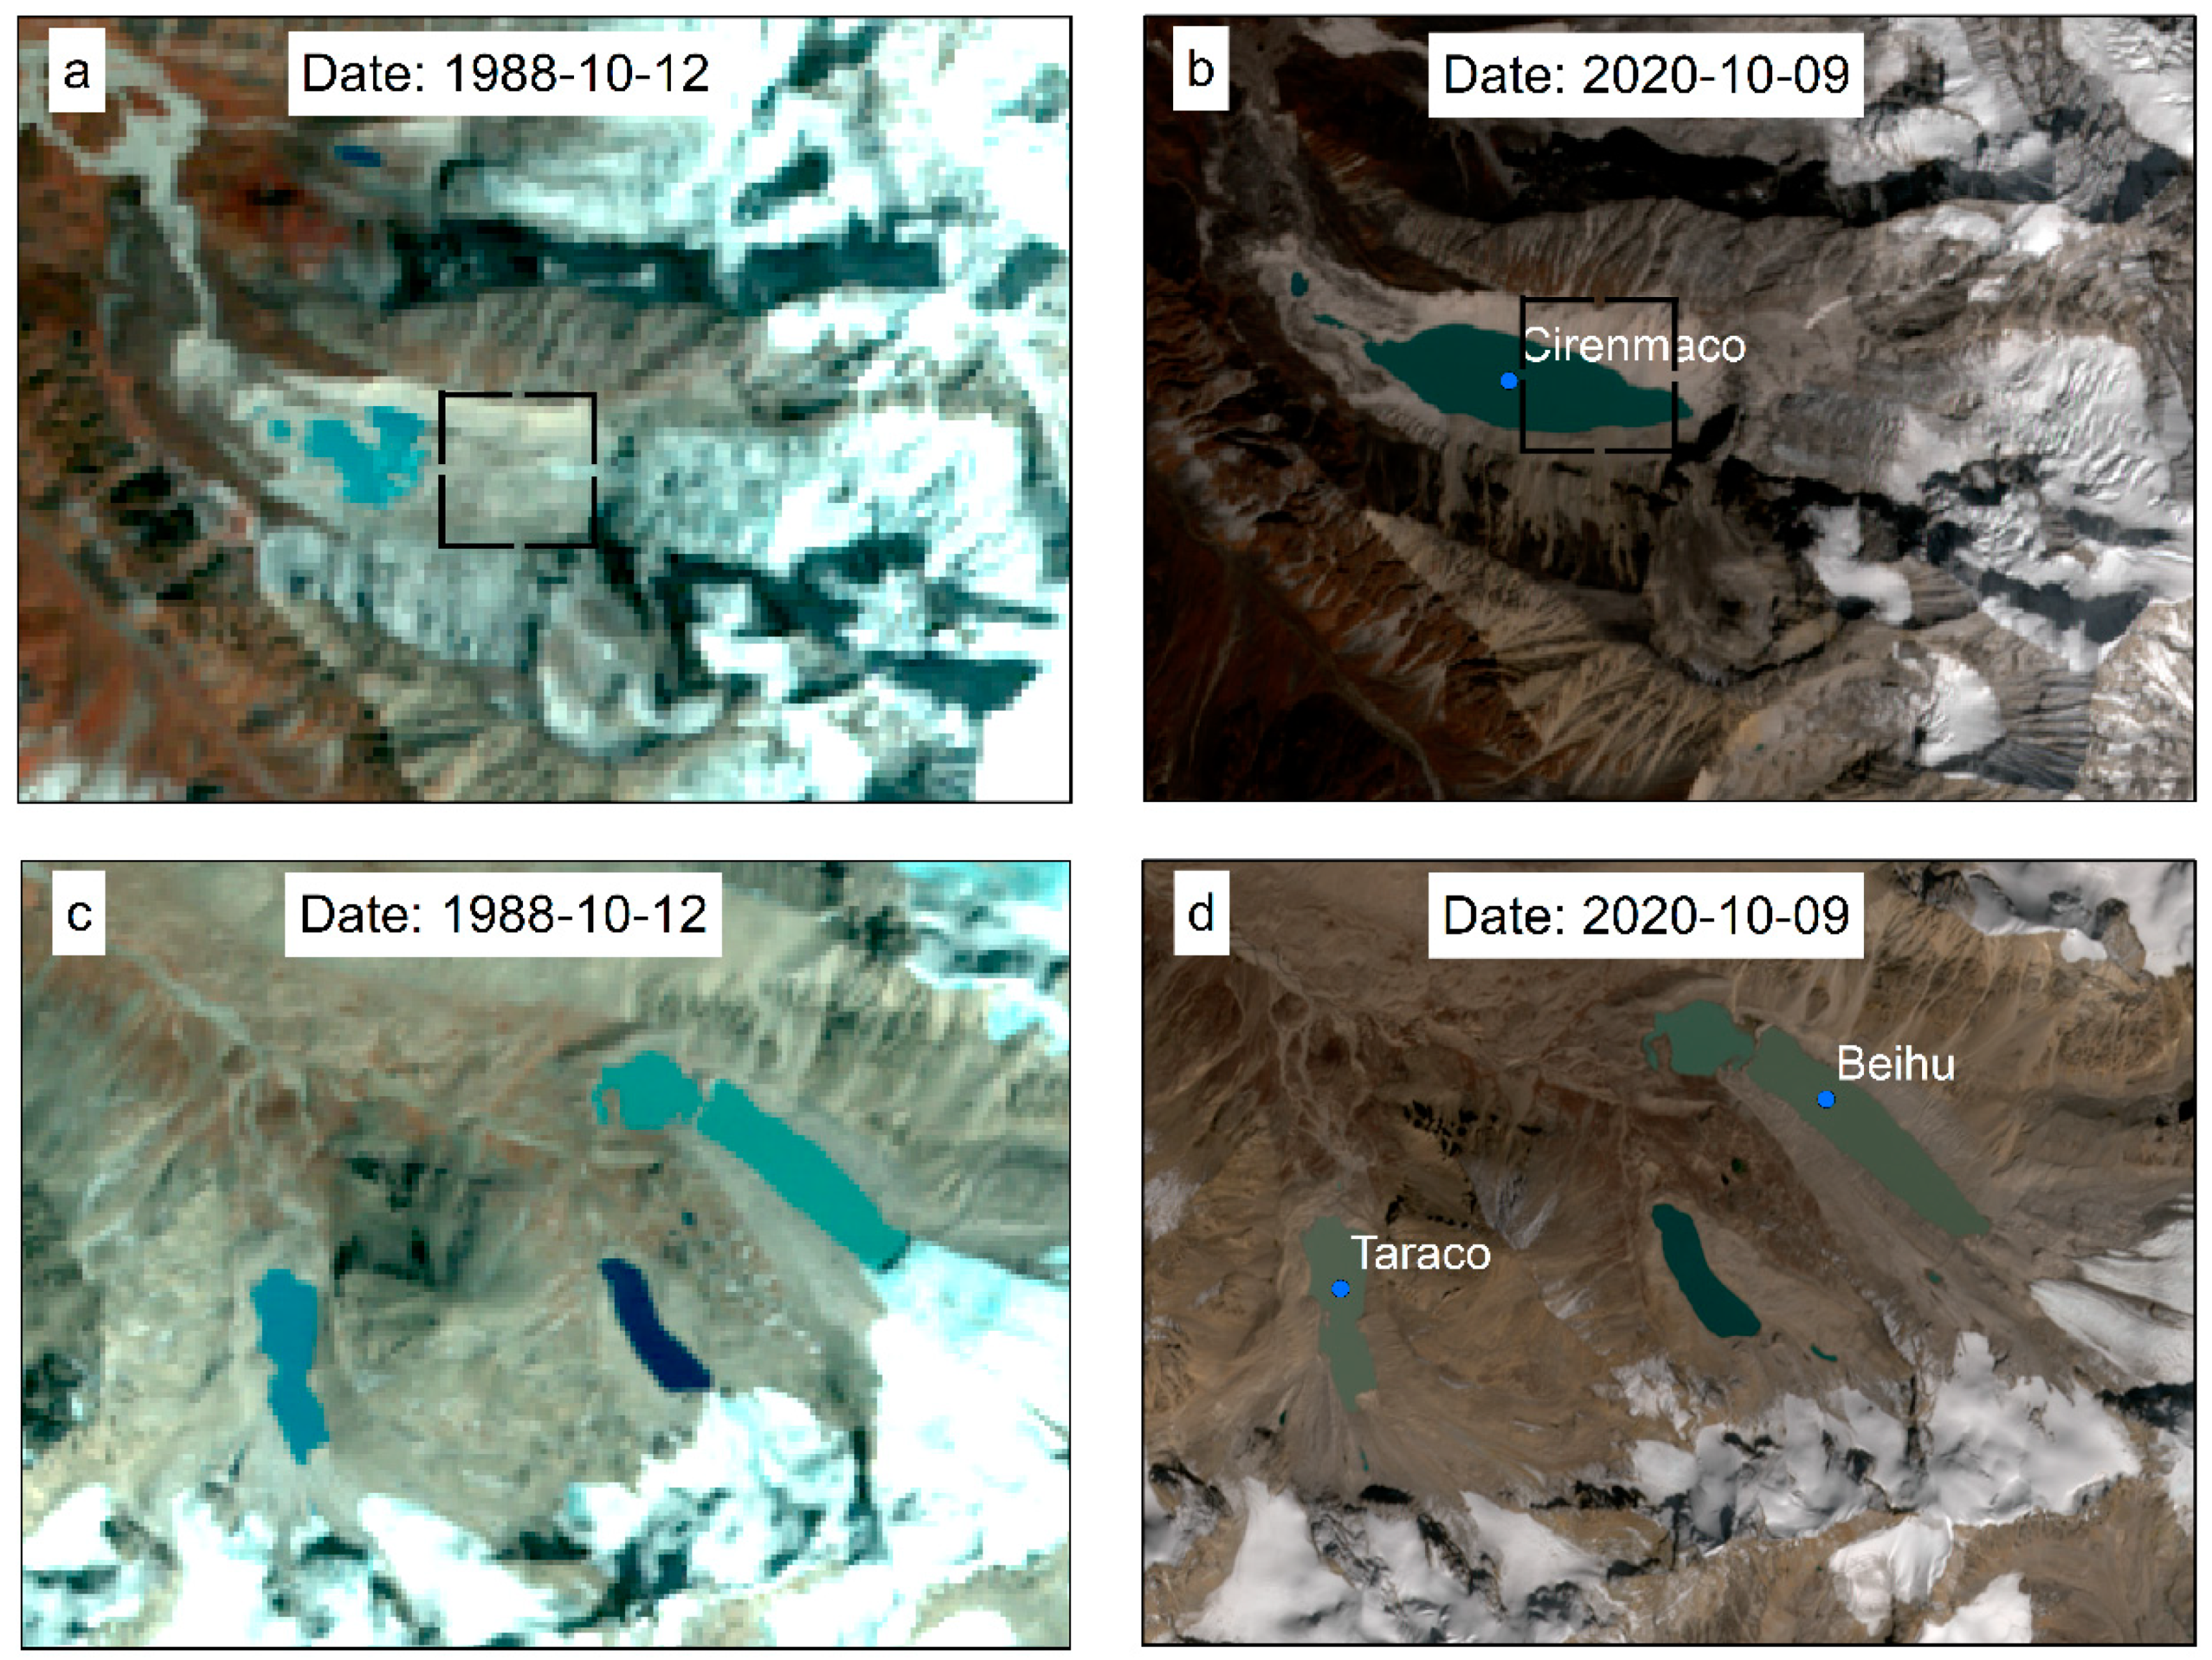
Lake volume, peak discharge, and outburst duration were estimated via empirical method, which inherently introduces uncertainty. The Cirenmaco volume was observed to be 18 × 106 m3 during a bathymetric survey in 2012 [31], which is larger than the estimation based on Equation (1) (11.24 × 10⁶ m3). Khanal et al. (2015) [36] similarly estimated the Cirenmaco volume and their result (12 × 106 m3), using a different formula, is very close to ours. Compared with other empirical formulas [61,62,63], Equation (1) is more suitable for some large or medium-sized moraine-dammed lakes that have little ice in the moraine dam and lake bottom [54]. In addition, some differences in evolution exist between Cirenmaco and the other six glacial lakes. Based on previous remote sensing images, the other six lakes likely developed in original moraine depressions. However, Cirenmaco was originally similar to a hot molten lake that gradually expanded through the continuous melting of ice at the bottom (Figure 9); its maximum depth measured in 2012 was approximately 130 m. This may be one of the most important reasons for the difference between measured data and estimated data for the Cirenmaco water volume.
5.2. Paradigm for Mapping Hazard/Risk
Due to the destructive impact of GLOFs on downstream areas, mitigating these risks has become a focus of GLOF research. Timely and effective assessment mapping is important in understanding GLOF propagation. Such mapping plays a significant role in downstream land use and urban planning, as well as in the application of prevention measures. However, some models cannot be freely downloaded or are difficult to use in the simulating process. As a result, practitioners’ efforts to learn more about glacial hazard/risk have been hampered. In this study, we aimed not only to assess future GLOF hazard/risk in the Poiqu River basin, but also to provide a paradigm for hazard assessment and risk management that uses an easier method, thus enabling broader application (Figure 10). Most of the data can be collected through free channels. The main processes are as follows:
- Prepare the data and model. The HEC-RAS model is recommended due to its free availability (https://www.hec.usace.army.mil/software/hec-ras/, accessed on 15 October 2019), ease of operation, and extensive applications. Data from DEM is a critical component in flood simulation. When any other high-resolution DEM is not available, STRM can be used because of its better accuracy and wide range of applications. The data for infrastructure or farmland may be extracted from the most recent Landsat/Sentinel-2 images or from Google Earth.
- Estimate GLOF parameters. In the absence of in-situ measured data, lake volume and peak discharge may be determined by empirical or statistical methods. For example, a model-based Bayesian was presented by [65], which utilized robust linear regression to estimate parameters. A dam-breach hydrograph may be inferred using the same method as this study or may be simulated using a 1D breach model [33,36].
- Map hazard/risk. The flood depth and velocity datasets from the HEC-RAS model can be combined with the hazard/risk index and possible lake drainage scenarios to draw a synthesized map. These datasets can also be using to make a detailed assessment of exposure for downstream infrastructure, farmland, and population.
5.3. Lessons for GLOF Management
The Poiqu River basin is severely threatened by GLOFs. A large number of high and very high-risk glacial lakes and their transboundary threats have made the region a great concern in the past few decades. This study fully demonstrated the GLOF path, depth, and velocity, as well as the arrival time of peak discharge for various villages and towns in different outburst scenarios; revealed the exposure of communities and infrastructure to the flood path; and provided a hazard map. These are of great significance not only for future development planning of the region, but also for hazard and risk assessment of glacial lakes in many regions. At present, sporadic detailed risk assessment for downstream communities of glacial lakes in the Himalayas has been conducted. Thus, integrated study of this area to respond to the threat of GLOFs is needed. The paradigm presented in this study will help more scholars to carry out hazard and risk assessment of glacial lakes.
6. Conclusions
We performed GLOF modeling using the 2D capabilities of HEC-RAS. The overall behavior of GLOFs in the Poiqu River basin was well simulated. Seven very high-risk moraine-dammed lake outbursts with different drainage percentage are presented, and the assessment of multiple GLOF hazards is provided. Meanwhile, we present a paradigm for practitioners to manage the hazard/risk caused by GLOFs.
Our results reveal that when any glacial lake drains completely or partly, most of the flooding will enter Nepal and continue to cause damage after raging in China. Galongco and Jialongco in the upper reaches of Nyalam can threaten infrastructure near the river course. Hence, we should be cautious about future development near the riverside. In total, there are 57.5 km of highways, 754 buildings, 3.3 km2 of farmland, and 25 bridges that may be threatened by GLOFs, with the affected area exceeding 45 km2 in the Chinese part of the Poiqu River basin. Villages and towns downstream from moraine-dammed lakes, except for Ere village, have more than 30 minutes to evacuate as long as early warning systems operate in a timely manner. Appropriate and effective measures should be used to adapt to GLOF hazards and promote the sustainable development of mountainous regions.
Author Contributions
Conceptualization, T.Z. and W.W., methodology, T.Z., supervision, W.W., and B.A., writing—original draft preparation, T.Z.; writing—review and editing, W.W., T.G., B.A. All authors have read and agreed to the published version of the manuscript.
Funding
The research was funded by the National Natural Science Foundation of China (Grant No. 41771088), the Strategic Priority Research Program of the Chinese Academy of Sciences (XDA20100300), and the Second Tibetan Plateau Scientific Expedition and Research Program (STEP) (2019QZKK0208).
Institutional Review Board Statement
Not applicable.
Informed Consent Statement
Not applicable.
Data Availability Statement
No supplementary materials.
Acknowledgments
We are grateful to the valuable comments and suggestions from Guoqing Zhang and Yanbin Lei.
Conflicts of Interest
The authors declare there no conflict of interest.
References
- Bolch, T.; Kulkarni, A.; Kaab, A.; Huggel, C.; Paul, F.; Cogley, J.G.; Frey, H.; Kargel, J.S.; Fujita, K.; Scheel, M.; et al. The state and fate of Himalayan glaciers. Science 2012, 336, 310–314. [Google Scholar] [CrossRef] [Green Version]
- Yao, T.; Thompson, L.; Yang, W.; Yu, W.; Gao, Y.; Guo, X.; Yang, X.; Duan, K.; Zhao, H.; Xu, B.; et al. Different glacier status with atmospheric circulations in Tibetan Plateau and surroundings. Nat. Clim. Chang. 2012, 2, 663–667. [Google Scholar] [CrossRef]
- Lutz, A.F.; Immerzeel, W.W.; Shrestha, A.B.; Bierkens, M.F.P. Consistent increase in High Asia’s runoff due to increasing glacier melt and precipitation. Nat. Clim. Chang. 2014, 4, 587–592. [Google Scholar] [CrossRef] [Green Version]
- Farinotti, D.; Longuevergne, L.; Moholdt, G.; Duethmann, D.; Mölg, T.; Bolch, T.; Vorogushyn, S.; Güntner, A. Substantial glacier mass loss in the Tien Shan over the past 50 years. Nat. Geosci. 2015, 8, 716–722. [Google Scholar] [CrossRef]
- Huss, M.; Hock, R. Global-scale hydrological response to future glacier mass loss. Nat. Clim. Chang. 2018, 8, 135–140. [Google Scholar] [CrossRef] [Green Version]
- Maurer, J.M.; Schaefer, J.M.; Rupper, S.; Corley, A. Acceleration of ice loss across the Himalayas over the last 40 years. Sci. Adv. 2019, 5, eaav7266. [Google Scholar] [CrossRef] [Green Version]
- Zhang, G.; Yao, T.; Xie, H.; Wang, W.; Yang, W. An inventory of glacial lakes in the Third Pole region and their changes in response to global warming. Glob. Planet. Chang. 2015, 131, 148–157. [Google Scholar] [CrossRef]
- Zheng, G.; Bao, A.; Li, J.; Zhang, G.; Xie, H.; Guo, H.; Jiang, L.; Chen, T.; Chang, C.; Chen, W. Sustained growth of high mountain lakes in the headwaters of the Syr Darya River, Central Asia. Glob. Planet. Chang. 2019, 176, 84–99. [Google Scholar] [CrossRef] [Green Version]
- Wang, X.; Guo, X.; Yang, C.; Liu, Q.; Wei, J.; Zhang, Y.; Liu, S.; Zhang, Y.; Jiang, Z.; Tang, Z. Glacial lake inventory of high-mountain Asia in 1990 and 2018 derived from Landsat images. Earth Syst. Sci. Data 2020, 12, 2169–2182. [Google Scholar] [CrossRef]
- Nie, Y.; Sheng, Y.; Liu, Q.; Liu, L.; Liu, S.; Zhang, Y.; Song, C. A regional-scale assessment of Himalayan glacial lake changes using satellite observations from 1990 to 2015. Remote. Sens. Environ. 2017, 189, 1–13. [Google Scholar] [CrossRef] [Green Version]
- Richardson, S.D.; Reynolds, J.M. An overview of glacial hazards in the Himalayas. Quat. Int. 2000, 65, 31–47. [Google Scholar] [CrossRef]
- Kuriqi, A.; Ali, R.; Pham, Q.B.; Gambini, J.M.; Gupta, V.; Malik, A.; Linh, N.T.T.; Joshi, Y.; Anh, D.T.; Nam, V.T.; et al. Seasonality shift and streamflow flow variability trends in central India. Acta. Geophys. 2020, 68, 1461–1475. [Google Scholar] [CrossRef]
- Islam, A.R.M.T.; Talukdar, S.; Mahato, S.; Kundu, S.; Eibek, K.U.; Pham, Q.B.; Kuriqi, A.; Linh, N.T.T. Flood susceptibility modelling using advanced ensemble machine learning models. Geosci. Front. 2021, 12, 101075. [Google Scholar] [CrossRef]
- Komori, J.; Koike, T.; Yamanokuchi, T.; Tshering, P. Glacial lake outburst events in the Bhutan Himalayas. Glob. Environ. Res. 2012, 16, 59–70. [Google Scholar]
- Nie, Y.; Liu, Q.; Wang, J.; Zhang, Y.; Sheng, Y.; Liu, S. An inventory of historical glacial lake outburst floods in the Himalayas based on remote sensing observations and geomorphological analysis. Geomorphology 2018, 308, 91–106. [Google Scholar] [CrossRef]
- Zheng, G.; Bao, A.; Allen, S.; Antonio Ballesteros-Cánovas, J.; Yuan, Y.; Jiapaer, G.; Stoffel, M. Numerous unreported glacial lake outburst floods in the Third Pole revealed by high-resolution satellite data and geomorphological evidence. Sci. Bull. 2021. [Google Scholar] [CrossRef]
- Emmer, A.; Cochachin, A. The causes and mechanisms of moraine-dammed lake failures in the Cordillera Blanca, North American Cordillera and Himalaya. AUC Geogr. 2013, 48, 5–15. [Google Scholar] [CrossRef] [Green Version]
- Carrivick, J.L.; Tweed, F.S. A global assessment of the societal impacts of glacier outburst floods. Glob. Planet. Chang. 2016, 144, 1–16. [Google Scholar] [CrossRef]
- Allen, S.K.; Rastner, P.; Arora, M.; Huggel, C.; Stoffel, M. Lake outburst and debris flow disaster at Kedarnath, June 2013: Hydrometeorological triggering and topographic predisposition. Landslides 2015, 13, 1479–1491. [Google Scholar] [CrossRef]
- Rafiq, M.; Romshoo, S.A.; Mishra, A.K.; Jalal, F. Modelling Chorabari Lake outburst flood, Kedarnath, India. J. Mt. Sci. 2019, 16, 64–76. [Google Scholar] [CrossRef]
- Zhang, G.; Bolch, T.; Allen, S.; Linsbauer, A.; Chen, W.; Wang, W. Glacial lake evolution and glacier–lake interactions in the Poiqu River basin, central Himalaya, 1964–2017. J. Glaciol. 2019, 65, 347–365. [Google Scholar] [CrossRef] [Green Version]
- Wang, W.; Yao, T.; Gao, Y.; Yang, X.; Kattel, D.B. A First-order Method to Identify Potentially Dangerous Glacial Lakes in a Region of the Southeastern Tibetan Plateau. Mt. Res. Dev. 2011, 31, 122. [Google Scholar] [CrossRef]
- Worni, R.; Huggel, C.; Stoffel, M. Glacial lakes in the Indian Himalayas--from an area-wide glacial lake inventory to on-site and modeling based risk assessment of critical glacial lakes. Sci. Total. Environ. 2013, 468–469, S71–S84. [Google Scholar] [CrossRef]
- Aggarwal, S.; Rai, S.C.; Thakur, P.K.; Emmer, A. Inventory and recently increasing GLOF susceptibility of glacial lakes in Sikkim, Eastern Himalaya. Geomorphology 2017, 295, 39–54. [Google Scholar] [CrossRef]
- Wang, S.; Qin, D.; Xiao, C. Moraine-dammed lake distribution and outburst flood risk in the Chinese Himalaya. J. Glaciol. 2017, 61, 115–126. [Google Scholar]
- Allen, S.K.; Zhang, G.; Wang, W.; Yao, T.; Bolch, T. Potentially dangerous glacial lakes across the Tibetan Plateau revealed using a large-scale automated assessment approach. Sci. Bull. 2019, 64, 435–445. [Google Scholar] [CrossRef]
- Fan, J.; An, C.; Zhang, X.; Li, X.; Tan, J. Hazard assessment of glacial lake outburst floods in Southeast Tibet based on RS and GIS technologies. Int. J. Remote. Sens. 2019, 40, 4955–4979. [Google Scholar] [CrossRef]
- Dubey, S.; Goyal, M.K. Glacial Lake Outburst Flood Hazard, Downstream Impact, and Risk Over the Indian Himalayas. Water Resour. Res. 2020, 56. [Google Scholar] [CrossRef]
- Wang, S.; Che, Y.; Xinggang, M. Integrated risk assessment of glacier lake outburst flood (GLOF) disaster over the Qinghai–Tibetan Plateau (QTP). Landslides 2020, 17, 2849–2863. [Google Scholar] [CrossRef]
- Lala, J.M.; Rounce, D.R.; McKinney, D.C. Modeling the glacial lake outburst flood process chain in the Nepal Himalaya: Reassessing Imja Tsho's hazard. Hydrol. Earth Syst. Sci. 2018, 22, 3721–3737. [Google Scholar] [CrossRef] [Green Version]
- Wang, W.; Gao, Y.; Anacona, P.I.; Lei, Y.; Xiang, Y.; Zhang, G.; Li, S.; Lu, A. Integrated hazard assessment of Cirenmaco glacial lake in Zhangzangbo valley, Central Himalayas. Geomorphology 2018, 306, 292–305. [Google Scholar] [CrossRef]
- Byers, A.C.; Chand, M.B.; Lala, J.; Shrestha, M.; Byers, E.A.; Watanabe, T. Reconstructing the History of Glacial Lake Outburst Floods (GLOF) in the Kanchenjunga Conservation Area, East Nepal: An Interdisciplinary Approach. Sustainability 2020, 12, 5407. [Google Scholar] [CrossRef]
- Nie, Y.; Liu, W.; Liu, Q.; Hu, X.; Westoby, M.J. Reconstructing the Chongbaxia Tsho glacial lake outburst flood in the Eastern Himalaya: Evolution, process and impacts. Geomorphology 2020, 370, 107393. [Google Scholar] [CrossRef]
- Maurer, J.M.; Schaefer, J.M.; Russell, J.B.; Rupper, S.; Wangdi, N.; Putnam, A.E.; Young, N. Seismic observations, numerical modeling, and geomorphic analysis of a glaical lake outburst flood in the Himalayas. Sci. Adv. 2020, 6, eaba3645. [Google Scholar] [CrossRef] [PubMed]
- Majeed, U.; Rashid, I.; Sattar, A.; Allen, S.; Stoffel, M.; Nusser, M.; Schmidt, S. Recession of Gya Glacier and the 2014 glacial lake outburst flood in the Trans-Himalayan region of Ladakh, India. Sci. Total Environ. 2021, 756, 144008. [Google Scholar] [CrossRef] [PubMed]
- Khanal, N.R.; Hu, J.; Mool, P. Glacial Lake Outburst Flood Risk in the Poiqu/Bhote Koshi/Sun Koshi River Basin in the Central Himalayas. Mt. Res. Dev. 2015, 35, 351–364. [Google Scholar] [CrossRef]
- Allen, S.K.; Linsbauer, A.; Randhawa, S.S.; Huggel, C.; Rana, P.; Kumari, A. Glacial lake outburst flood risk in Himachal Pradesh, India: An integrative and anticipatory approach considering current and future threats. Nat. Hazards 2016, 84, 1741–1763. [Google Scholar] [CrossRef] [Green Version]
- Rounce, D.R.; McKinney, D.C.; Lala, J.M.; Byers, A.C.; Watson, C.S. A new remote hazard and risk assessment framework for glacial lakes in the Nepal Himalaya. Hydrol. Earth Syst. Sci. 2016, 20, 3455–3475. [Google Scholar] [CrossRef] [Green Version]
- Chen, X.; Cui, P.; Li, Y.; Yang, Z.; Qi, Y. Changes in glacial lakes and glaciers of post-1986 in the Poiqu River basin, Nyalam, Xizang (Tibet). Geomorphology 2007, 88, 298–311. [Google Scholar] [CrossRef]
- Shrestha, A.B.; Eriksson, M.; Mool, P.; Ghimire, P.; Mishra, B.; Khanal, N.R. Glacial lake outburst flood risk assessment of Sun Koshi basin, Nepal. Geomat. Nat. Hazards Risk 2010, 1, 157–169. [Google Scholar] [CrossRef]
- Liu, M.; Chen, N.; Zhang, Y.; Deng, M. Glacial lake inventory and lake outburst flood/debris flow hazard assessment after the Gorkha earthquake in the Bhote Koshi Basin. Water 2020, 12, 464. [Google Scholar] [CrossRef] [Green Version]
- Xu, D. Characteristics of debris flow caused by outburst of glacial lake in Boqu river, Xizang, China, 1981. GeoJournal 1988, 17, 569–580. [Google Scholar] [CrossRef] [Green Version]
- Chen, N.; Hu, G.; Deng, W.; Khanal, N.; Zhu, Y.; Han, D. On the water hazards in the trans-boundary Kosi River basin. Nat. Hazards Earth Syst. Sci. 2013, 13, 795–808. [Google Scholar] [CrossRef] [Green Version]
- Chen, X.; Cui, P.; Yang, Z.; Qi, Y. Debris flows of Chongdui gully in Nyalam County, 2002: Cause and Control. J. Glaciol. Geocryol. 2006, 28, 776–781. (In Chinese) [Google Scholar]
- Cook, K.L.; Andermann, C.; Gimbert, F.; Adhikari, B.R.; Hovius, N. Glacial lake outburst floods as drivers of fluvial erosion in the Himalaya. Science 2018, 362, 53–57. [Google Scholar] [CrossRef] [Green Version]
- Veh, G.; Korup, O.; von Specht, S.; Roessner, S.; Walz, A. Unchanged frequency of moraine-dammed glacial lake outburst floods in the Himalaya. Nat. Clim. Chang. 2019, 9, 379–383. [Google Scholar] [CrossRef]
- Shean, D. High Mountain Asia 8-Meter DEMs Derived from Along-Track Optical Imagery; Version 1, [Indicate subset used]; NASA National Snow and Ice Data Center Distributed Active Archive Center: Boulder, CO, USA, 2017. [Google Scholar]
- Cenderelli, D.A.; Wohl, E.E. Peak discharge estimates of glacial-lake outburst floods and “normal” climatic floods in the Mount Everest region, Nepal. Geomorphology 2001, 40, 57–90. [Google Scholar] [CrossRef]
- Alho, P.; Russell, A.J.; Carrivick, J.L.; Käyhkö, J. Reconstruction of the largest Holocene jökulhlaup within Jökulsá á Fjöllum, NE Iceland. Quat. Sci. Rev. 2005, 24, 2319–2334. [Google Scholar] [CrossRef]
- Alho, P.; Aaltonen, J. Comparing a 1D hydraulic model with a 2D hydraulic model for the simulation of extreme glacial outburst floods. Hydrol. Process. 2008, 22, 1537–1547. [Google Scholar] [CrossRef]
- Osti, R.; Egashira, S. Hydrodynamic characteristics of the Tam Pokhari Glacial Lake outburst flood in the Mt. Everest region, Nepal. Hydrol. Process. 2009, 23, 2943–2955. [Google Scholar] [CrossRef]
- Anacona, P.I.; Mackintosh, A.; Norton, K. Reconstruction of a glacial lake outburst flood (GLOF) in the Engaño Valley, Chilean Patagonia: Lessons for GLOF risk management. Sci. Total Environ. 2015, 527, 1–11. [Google Scholar] [CrossRef] [PubMed]
- Kougkoulos, I.; Cook, S.J.; Edwards, L.A.; Clarke, L.J.; Symeonakis, E.; Dortch, J.M.; Nesbitt, K. Modelling glacial lake outburst flood impacts in the Bolivian Andes. Nat. Hazards 2018, 94, 1415–1438. [Google Scholar] [CrossRef] [Green Version]
- Cook, S.J.; Quincey, D.J. Estimating the volume of Alpine glacial lakes. Earth Surf. Dyn. 2015, 3, 559–575. [Google Scholar] [CrossRef] [Green Version]
- Froehlich, D.C. Peak outflow from breached embankment dam. J. Water Resour. Plan. Man. 1995, 121, 90–97. [Google Scholar] [CrossRef]
- Froehlich, D.C. Embankment dam breach parameters revisited. In Proceeding of The Conference on Water Resources Engineering, San Antonio, TX, USA, 14–18 August 1995; pp. 887–891. [Google Scholar]
- Wahl, T.L. Uncertainty of predictions of embankment dam breach parameters. J. Hydraul. Eng. 2004, 130, 389–397. [Google Scholar] [CrossRef]
- Worni, R.; Stoffel, M.; Huggel, C.; Volz, C.; Casteller, A.; Luckman, B. Analysis and dynamic modeling of a moraine failure and glacier lake outburst flood at Ventisquero Negro, Patagonian Andes (Argentina). J. Hydrol. 2012, 444, 134–145. [Google Scholar] [CrossRef]
- Westoby, M.J.; Glasser, N.F.; Brasington, J.; Hambrey, M.J.; Quincey, D.J.; Reynolds, J.M. Modelling outburst floods from moraine-dammed glacial lakes. Earth Sci. Rev. 2014, 134, 137–159. [Google Scholar] [CrossRef] [Green Version]
- Huggel, C.; Haeberli, W.; Kääb, A.; Bieri, D.; Richardson, S. An assessment procedure for glacial hazards in the Swiss Alps. Can. Geotech. J. 2004, 41, 1068–1083. [Google Scholar] [CrossRef]
- Huggel, C.; Kääb, A.; Haeberli, W.; Teysseire, P. Remote sensing based assessment of hazards from glacier lake outbursts: A case study in the Swiss Alps. Can. Geotech. J. 2002, 330, 316–330. [Google Scholar] [CrossRef] [Green Version]
- Fujita, K.; Sakai, A.; Takenaka, S.; Nuimura, T.; Surazakov, A.B.; Sawagaki, T.; Yamanokuchi, T. Potential flood volume of Himalayan glacial lakes. Nat. Hazards Earth Syst. Sci. 2013, 13, 1827–1839. [Google Scholar] [CrossRef] [Green Version]
- Patel, L.K.; Sharma, P.; Laluraj, C.M.; Thamban, M.; Singh, A.; Ravindra, R. A geospatial analysis of Samudra Tapu and Gepang Gath glacial lakes in the Chandra Basin. Western Himalaya. Nat. Hazards 2017, 86, 1275–1290. [Google Scholar] [CrossRef]
- Kougkoulos, I.; Cook, S.J.; Jomelli, V.; Clarke, L.; Symeonakis, E.; Dortch, J.M.; Edwards, L.A.; Merad, M. Use of multi-criteria decision analysis to identify potentially dangerous glacial lakes. Sci. Total Environ. 2018, 621, 1453–1466. [Google Scholar] [CrossRef] [PubMed]
- Veh, G.; Korup, O.; Walz, A. Hazard from Himalayan glacier lake outburst floods. Proc. Natl. Acad. Sci. USA 2020, 117, 907–912. [Google Scholar] [CrossRef] [PubMed]
Figure 1.
Study area. (a) Location of Poiqu River basin on regional map; (b) Poiqu River basin; (c–e) photos taken from a field investigation in October 2020, including (c) Cirenmaco, (d) Jialongco, and (e) Galongco.
Figure 1.
Study area. (a) Location of Poiqu River basin on regional map; (b) Poiqu River basin; (c–e) photos taken from a field investigation in October 2020, including (c) Cirenmaco, (d) Jialongco, and (e) Galongco.

Figure 2.
These photos demonstrate a distinct relationship between the shape of the breach and the eroded riverbed of GLOFs. A field investigation allowed us to observe flood traces at (a) Jialongco, (b) Gongbatongshaco, and (c,d) an unnamed lake reported by Veh et al. [46].
Figure 2.
These photos demonstrate a distinct relationship between the shape of the breach and the eroded riverbed of GLOFs. A field investigation allowed us to observe flood traces at (a) Jialongco, (b) Gongbatongshaco, and (c,d) an unnamed lake reported by Veh et al. [46].

Figure 3.
Breach hydrograph used as input to simulate the outburst flood at different drainage percentages. The example of Cirenmaco is presented in this figure.
Figure 3.
Breach hydrograph used as input to simulate the outburst flood at different drainage percentages. The example of Cirenmaco is presented in this figure.

Figure 4.
Inundation maps for GLOFs originating in (a) Galongco, (b) Jialongco, (c) Gangxico, (d) Cawuqudenco, (e) Beihu, (f) Taraco, and (g) Cirenmaco under a 75% drainage scenario.
Figure 4.
Inundation maps for GLOFs originating in (a) Galongco, (b) Jialongco, (c) Gangxico, (d) Cawuqudenco, (e) Beihu, (f) Taraco, and (g) Cirenmaco under a 75% drainage scenario.

Figure 5.
Velocity of GLOFs originating from (a) Galongco and (b) Jialongco under a 75% drainage scenario.
Figure 5.
Velocity of GLOFs originating from (a) Galongco and (b) Jialongco under a 75% drainage scenario.

Figure 6.
Arrival time of peak discharge for various villages and towns.

Figure 7.
GLOF hazard levels along the upper Poiqu River, around the (a) Jiangdong Bridge, and (b) Jianggang village.
Figure 7.
GLOF hazard levels along the upper Poiqu River, around the (a) Jiangdong Bridge, and (b) Jianggang village.

Figure 8.
GLOF hazard levels in (a) Nyalam County and (b,c) along the river. (b) View upstream and (c) view downstream.
Figure 8.
GLOF hazard levels in (a) Nyalam County and (b,c) along the river. (b) View upstream and (c) view downstream.

Figure 9.
An example of the differences in lake evolution between (a,b) Cirenmaco and (c,d) Beihu and Taraco.
Figure 9.
An example of the differences in lake evolution between (a,b) Cirenmaco and (c,d) Beihu and Taraco.

Figure 10.
A paradigm for mapping GLOF hazard/risk.


Table 1.
Summary of potentially dangerous glacial lakes.
| Lake | Long ° | Lat ° | Area (km2) | Elevation (m) | Lake Area Change (km2/10a) | Risk Index [26] |
|---|---|---|---|---|---|---|
| Gangxico | 85.87 | 28.36 | 4.57 | 5212 | 0.73 | 0.8 |
| Galongco | 85.31 | 28.84 | 5.38 | 5067 | 1.08 | 0.94 |
| Jialongco | 85.21 | 28.84 | 0.60 | 4360 | 0.12 | 0.87 |
| Cirenmaco | 86.06 | 28.06 | 0.29 | 4627 | 0.08 | 0.95 |
| Taraco | 86.13 | 28.29 | 0.23 | 5244 | 0.01 | 0.72 |
| Beihu | 86.15 | 28.30 | 0.56 | 5307 | 0.04 | 0.79 |
| Cawuqudenco | 86.19 | 28.33 | 0.53 | 5422 | 0.02 | 0.73 |
Table 2.
GLOF parameters from a complete drainage.
| Glacial Lake | V(106 m3) | hb (m) | hw (m) | Tp (min) | Qp (104 m3/s) |
|---|---|---|---|---|---|
| Gangxico | 267.97 | 89 | 67 | 79 | 3.42 |
| Galongco | 316.52 | 95 | 80 | 81 | 4.47 |
| Jialongco | 29.72 | 74 | 62 | 29 | 1.62 |
| Cirenmaco | 18 | 72 | 63 | 23 | 1.43 |
| Taraco | 7.23 | 83 | 77 | 12 | 1.40 |
| Beihu | 27.04 | 87 | 76 | 24 | 2.03 |
| Cawuqudenco | 25.58 | 80 | 63 | 25 | 1.58 |
Table 3.
Moraine-dammed lake (>0.2 km2) outburst events in the Himalayas since the late 1980s. Data from Veh et al. (2019).
Table 3.
Moraine-dammed lake (>0.2 km2) outburst events in the Himalayas since the late 1980s. Data from Veh et al. (2019).
| ID | Lake | Outburst Date | Country | Long ° | Lat ° | Date of Last Clear Image before GLOF | Date of Last Clear Image after GLOF | Area before (106 m2) | Volume before (106 m3) | Volume after (106 m3) | Volume Change (%) |
|---|---|---|---|---|---|---|---|---|---|---|---|
| 1 | Tam Pokhari | 3 September 1998 | Nepal | 86.84 | 27.74 | 1998-02-19 | 1998-10-17 | 0.58 | 10.03 | 4.59 | 54% |
| 2 | Chongbaxiaco | 6 August 2000 | China | 89.74 | 28.21 | 2001-07-23 | 2003-11-18 | 0.77 | 18.23 | 9.49 | 48% |
| 3 | Zangla Tsho | 1994 | China | 82.14 | 30.34 | 1994-07-30 | 1994-09-09 | 0.23 | 6.61 | 2.21 | 67% |
| 4 | Rejieco | 1992 | China | 88.89 | 27.97 | 1992-04-16 | 1992-11-10 | 0.27 | 8.76 | 4.18 | 52% |
| 5 | Zanglaco East | 2015–2016 | China | 82.20 | 30.31 | 2015-09-05 | 2016-05-16 | 0.30 | 4.98 | 2.79 | 44% |
| 6 | Sangwangco East | 2007–2008 | China | 90.23 | 28.28 | 2007-07-08 | 2008-12-17 | 1.04 | 28.76 | 23.05 | 20% |
| 7 | Changri Tsho III | 1998 | Bhutan | 90.81 | 27.90 | 1997-11-01 | 1998-09-10 | 0.49 | 0.64 | 0.11 | 83% |
| 8 | Kongyangmi La Tsho | 1994–1996 | India | 88.78 | 27.90 | 1994-10-31 | 1996-05-13 | 0.50 | 11.16 | 2.86 | 74% |
| 9 | Luggye Tsho | 7 October 1994 | Bhutan | 90.30 | 28.09 | 1994-09-22 | 1994-11-09 | 1.22 | 32.21 | 24.11 | 25% |
Table 4.
Parameters of GLOFs originating in different glacial lakes and causing damage in the Chinese part of the Poiqu River basin.
Table 4.
Parameters of GLOFs originating in different glacial lakes and causing damage in the Chinese part of the Poiqu River basin.
| Glacial Lake | Breach Water Volume (%) | Trans-Boundary Impact | Flooded Area (km2) | Mean Depth (m) | Max Depth (m) | Mean Velocity (m/s) | Max Velocity (m/s) | Farmland (km2) | Roads (km) | Buildings | Bridges |
|---|---|---|---|---|---|---|---|---|---|---|---|
| Gangxico | 25 | Yes | 14.77 | 7.78 | 44.70 | 3.28 | 22.09 | 1.72 | 25.96 | 284 | 17 |
| 50 | Yes | 18.71 | 10.90 | 52.62 | 4.05 | 26.39 | 2.41 | 34.58 | 440 | 18 | |
| 75 | Yes | 21.40 | 13.21 | 57.78 | 4.56 | 28.45 | 2.76 | 40.55 | 507 | 18 | |
| 100 | Yes | 23.32 | 15.06 | 63.93 | 4.93 | 29.93 | 3.00 | 44.66 | 539 | 18 | |
| Galongco | 25 | Yes | 8.76 | 10.26 | 47.87 | 4.45 | 23.71 | - | 8.93 | 79 | 10 |
| 50 | Yes | 10.59 | 14.31 | 62.25 | 5.42 | 27.81 | - | 11.20 | 111 | 10 | |
| 75 | Yes | 11.92 | 17.48 | 70.64 | 6.04 | 30.11 | - | 12.02 | 132 | 10 | |
| 100 | Yes | 13.20 | 19.14 | 76.67 | 6.30 | 29.46 | - | 12.51 | 140 | 10 | |
| Jialongco | 25 | Yes | 4.09 | 6.27 | 37.04 | 2.98 | 11.02 | - | 3.67 | 34 | 10 |
| 50 | Yes | 5.03 | 9.05 | 44.57 | 3.87 | 14.73 | - | 7.53 | 67 | 10 | |
| 75 | Yes | 5.61 | 10.91 | 47.68 | 4.41 | 16.55 | - | 9.38 | 75 | 10 | |
| 100 | Yes | 6.36 | 13.33 | 58.92 | 5.05 | 19.18 | - | 10.99 | 104 | 10 | |
| Cirenmaco | 25 | Yes | 1.79 | 5.96 | 42.26 | 3.70 | 12.63 | - | 0.03 | 2 | |
| 50 | Yes | 2.23 | 8.75 | 47.94 | 5.24 | 18.14 | - | 0.04 | 2 | ||
| 75 | Yes | 2.48 | 10.84 | 52.46 | 6.08 | 19.61 | - | 0.06 | 2 | ||
| 100 | Yes | 2.71 | 12.85 | 56.73 | 6.73 | 22.32 | - | 0.05 | 2 | ||
| Taraco | 25 | No | 3.64 | 2.85 | 11.68 | 2.29 | 8.93 | 0.27 | 1.57 | 3 | 7 |
| 50 | No | 5.59 | 4.46 | 27.58 | 2.91 | 10.65 | 0.56 | 4.01 | 11 | 11 | |
| 75 | No | 7.02 | 5.82 | 47.01 | 3.33 | 11.77 | 0.83 | 5.89 | 37 | 12 | |
| 100 | Yes | 8.54 | 7.51 | 49.98 | 3.82 | 13.28 | 1.10 | 8.69 | 85 | 13 | |
| Beihu | 25 | No | 6.33 | 5.13 | 42.21 | 2.87 | 12.26 | 0.73 | 5.26 | 22 | 12 |
| 50 | Yes | 8.54 | 7.74 | 45.64 | 3.66 | 15.24 | 1.15 | 9.37 | 90 | 13 | |
| 75 | Yes | 10.04 | 9.55 | 49.63 | 4.18 | 17.31 | 1.51 | 12.56 | 195 | 13 | |
| 100 | Yes | 11.20 | 11.12 | 53.04 | 4.62 | 18.96 | 1.70 | 15.40 | 268 | 13 | |
| Cawuqudenco | 25 | No | 8.24 | 4.40 | 49.26 | 2.46 | 9.20 | 0.81 | 8.25 | 45 | 17 |
| 50 | Yes | 10.48 | 6.31 | 54.94 | 3.06 | 11.99 | 1.15 | 13.26 | 109 | 18 | |
| 75 | Yes | 12.04 | 7.75 | 57.21 | 3.51 | 13.68 | 1.47 | 18.16 | 175 | 18 | |
| 100 | Yes | 13.01 | 9.04 | 59.30 | 3.87 | 15.95 | 1.86 | 21.98 | 322 | 18 |
Table 5.
Potential impact of GLOFs from different glacial lakes on downstream villages and towns. The values are in the range of 0–1, which is calculated from the number of submerged buildings, farmland, roads, and bridges between the sections of the villages. It represents the exposure of communities and infrastructure to the risk of GLOFs.
| Glacial Lake | Breach Water Volume (%) | Ere | Rujie | Dajie | Zhangdong Bridge | Jiangdong | Lamu | Zhaxigang | Jianggang | Ta | Nyalam | Friendship Bridge |
|---|---|---|---|---|---|---|---|---|---|---|---|---|
| Gangxico | 25 | 0.47 | 0.02 | 0.3 | 0.42 | 0.22 | 0.09 | 0.1 | 0.21 | 0.45 | 0 | 0.08 |
| 50 | 0.71 | 0.05 | 0.37 | 0.55 | 0.27 | 0.22 | 0.22 | 0.23 | 0.79 | 0 | 0.08 | |
| 75 | 0.83 | 0.07 | 0.4 | 0.56 | 0.28 | 0.24 | 0.32 | 0.23 | 0.96 | 0.01 | 0.08 | |
| 100 | 0.9 | 0.1 | 0.45 | 0.57 | 0.29 | 0.24 | 0.37 | 0.23 | 1 | 0.02 | 0.09 | |
| Galongco | 25 | 0 | 0 | 0 | 0 | 0 | 0 | 0 | 0 | 0 | 0.38 | 0.08 |
| 50 | 0 | 0 | 0 | 0 | 0 | 0 | 0 | 0 | 0 | 0.53 | 0.1 | |
| 75 | 0 | 0 | 0 | 0 | 0 | 0 | 0 | 0 | 0 | 0.61 | 0.13 | |
| 100 | 0 | 0 | 0 | 0 | 0 | 0 | 0 | 0 | 0 | 0.63 | 0.14 | |
| Jialongco | 25 | 0 | 0 | 0 | 0 | 0 | 0 | 0 | 0 | 0 | 0.18 | 0.05 |
| 50 | 0 | 0 | 0 | 0 | 0 | 0 | 0 | 0 | 0 | 0.34 | 0.06 | |
| 75 | 0 | 0 | 0 | 0 | 0 | 0 | 0 | 0 | 0 | 0.37 | 0.08 | |
| 100 | 0 | 0 | 0 | 0 | 0 | 0 | 0 | 0 | 0 | 0.51 | 0.09 | |
| Cirenmaco | 25 | 0 | 0 | 0 | 0 | 0 | 0 | 0 | 0 | 0 | 0 | 0 |
| 50 | 0 | 0 | 0 | 0 | 0 | 0 | 0 | 0 | 0 | 0 | 0.01 | |
| 75 | 0 | 0 | 0 | 0 | 0 | 0 | 0 | 0 | 0 | 0 | 0.01 | |
| 100 | 0 | 0 | 0 | 0 | 0 | 0 | 0 | 0 | 0 | 0 | 0.01 | |
| Taraco | 25 | 0 | 0 | 0.1 | 0.04 | 0.02 | 0.01 | 0.01 | 0.01 | 0.01 | 0 | 0 |
| 50 | 0 | 0 | 0.19 | 0.1 | 0.03 | 0.01 | 0.01 | 0.01 | 0.01 | 0 | 0.03 | |
| 75 | 0 | 0 | 0.25 | 0.21 | 0.09 | 0.02 | 0.03 | 0.01 | 0.01 | 0 | 0.04 | |
| 100 | 0 | 0 | 0.33 | 0.34 | 0.19 | 0.04 | 0.06 | 0.03 | 0.01 | 0 | 0.05 | |
| Beihu | 25 | 0 | 0 | 0.21 | 0.15 | 0.08 | 0.02 | 0.02 | 0.01 | 0.01 | 0 | 0.04 |
| 50 | 0 | 0 | 0.25 | 0.18 | 0.12 | 0.06 | 0.07 | 0.03 | 0.01 | 0 | 0.05 | |
| 75 | 0 | 0 | 0.34 | 0.48 | 0.25 | 0.15 | 0.12 | 0.23 | 0.14 | 0 | 0.07 | |
| 100 | 0 | 0 | 0.39 | 0.54 | 0.26 | 0.18 | 0.17 | 0.23 | 0.38 | 0 | 0.08 | |
| Cawuqudenco | 25 | 0 | 0.28 | 0.2 | 0.1 | 0.04 | 0.01 | 0.02 | 0.01 | 0.01 | 0 | 0.03 |
| 50 | 0 | 0.46 | 0.26 | 0.24 | 0.11 | 0.02 | 0.05 | 0.01 | 0.01 | 0 | 0.05 | |
| 75 | 0 | 0.6 | 0.29 | 0.36 | 0.19 | 0.05 | 0.07 | 0.04 | 0.01 | 0 | 0.06 | |
| 100 | 0 | 0.69 | 0.33 | 0.46 | 0.24 | 0.11 | 0.11 | 0.2 | 0.39 | 0 | 0.07 |
Table 6.
Reconstructed water depth at selected locations compared with observations and previous studies.
Table 6.
Reconstructed water depth at selected locations compared with observations and previous studies.
| Locations | Distance from the Lake Outlet (km) | Maximum Water Depth(m) | ||
|---|---|---|---|---|
| Xu (1988) | Wang et al. (2018) SRTM | This Study HMA, 8 m | ||
| Zhangzangbo Bridge | 6.4 | 18.5 | 23.8(28.6%) | 19.7(6.5%) |
| Friendship Bridge | 19.5 | 17.4 | 22.3(28.2%) | 25.3(45.4%) |
| Phulpin Bridge | 25.1 | 12.5 | 13.7(9.6%) | 15.2(21.6% |
| K103 Bridge | 29.5 | 22.9 | 19.1(−16.6%) | 23.2(1.3%) |
| K94 Bridge | 38.9 | 6.9 | 5.9(−14.5%) | 6.7(−2.9%) |
| Bharabise Bridge | 46.5 | 6.0 | 6.2(3.3%) | 4.4(−26.7%) |
Publisher’s Note: MDPI stays neutral with regard to jurisdictional claims in published maps and institutional affiliations. |
© 2021 by the authors. Licensee MDPI, Basel, Switzerland. This article is an open access article distributed under the terms and conditions of the Creative Commons Attribution (CC BY) license (https://creativecommons.org/licenses/by/4.0/).
Share and Cite
MDPI and ACS Style
Zhang, T.; Wang, W.; Gao, T.; An, B. Simulation and Assessment of Future Glacial Lake Outburst Floods in the Poiqu River Basin, Central Himalayas. Water 2021, 13, 1376. https://doi.org/10.3390/w13101376
AMA Style
Zhang T, Wang W, Gao T, An B. Simulation and Assessment of Future Glacial Lake Outburst Floods in the Poiqu River Basin, Central Himalayas. Water. 2021; 13(10):1376. https://doi.org/10.3390/w13101376
Chicago/Turabian StyleZhang, Taigang, Weicai Wang, Tanguang Gao, and Baosheng An. 2021. "Simulation and Assessment of Future Glacial Lake Outburst Floods in the Poiqu River Basin, Central Himalayas" Water 13, no. 10: 1376. https://doi.org/10.3390/w13101376
Note that from the first issue of 2016, this journal uses article numbers instead of page numbers. See further details here.