
Improvement Effect of Reticular Glass Fibers on the Mechanical Properties of Tailings Sand with the Lenticle (Layered Sandy Soil)


Abstract
:1. Introduction
2. Materials and Scheme
2.1. Test Materials and Sample Preparation
2.2. Experiment Scheme and Process
3. Test Results
3.1. Variation of Shear Strength and Peak Pore Pressure
- The cohesion of the sample containing the lenticle is smaller than the cohesion of the tailings fine sand. This cohesion is almost half of the cohesion of the tailings silt [30]. The internal friction angle of the sample containing the lenticle is larger than the internal friction angle of the tailings silt sample, but smaller than the internal friction angle of the tailings fine sand sample.
- The cohesion and internal friction angle of the sample containing the lenticle are compared with the tailings fine sand sample, in which the cohesion changes by 3.2 kPa (d = 2 cm) and the internal friction angle changes by 1.24° (d = 2 cm), indicating that the lenticle had a greater influence on the cohesion than the internal friction angle.
- No matter where the fibers are located, the cohesion of the specimens increase with the increase of fiber layers (within a certain range) [31], indicating that, in a certain range, the influence of the reinforced density on the cohesion of the specimens is greater than the reinforced position.
- The improving effect of fibers on cohesion varies with the reinforced position. The overall performance is as follows: at the interface > inside the tailings fine sand > inside the lenticle.
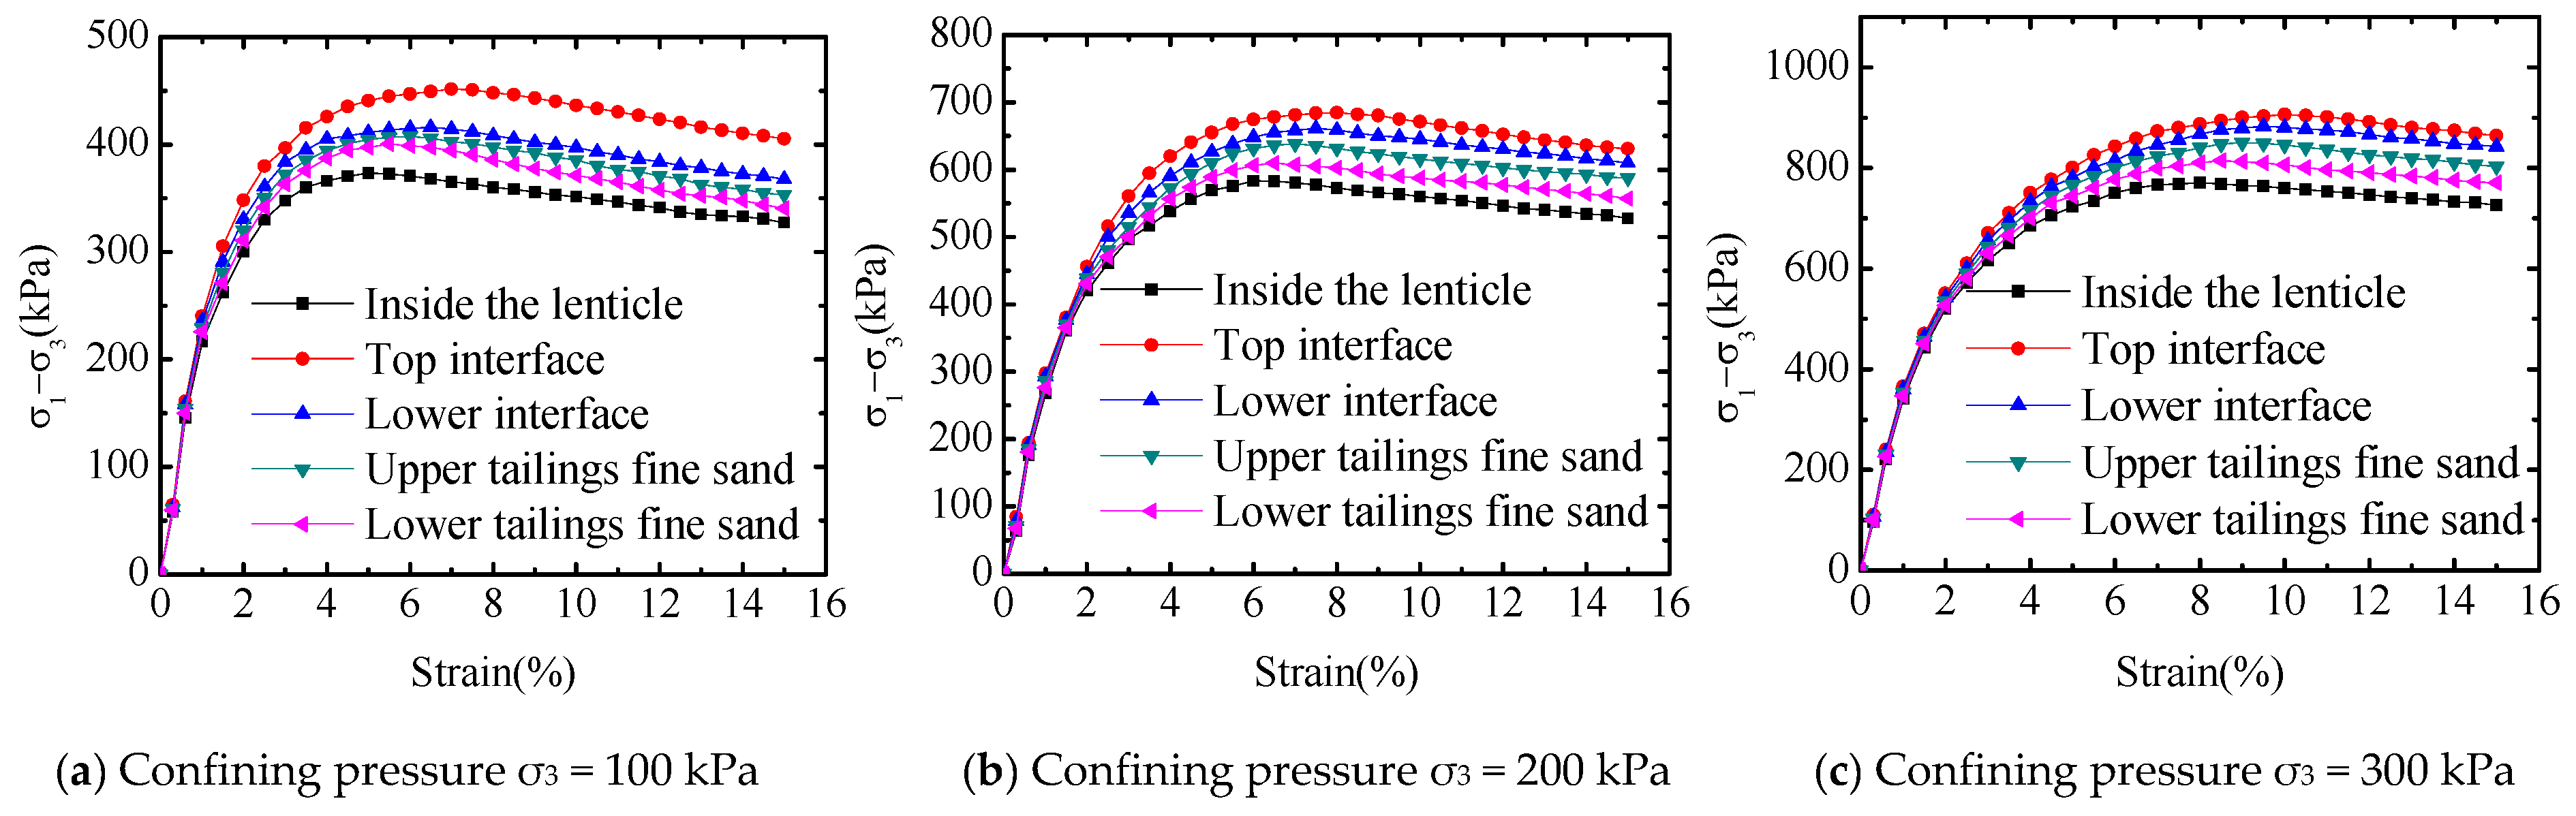
- The difference of the shear strength parameters of the sample is small when the fiber (n = 1) is placed at the upper interface and the lower interface, but that is significantly larger than the fibers placed in the lenticle, the upper tailings fine sand and the lower tailings fine sand. It is indicated that when the fiber (n = 1) is placed at the interface, the improvement on the shear strength is the best. The difference in the shear strength parameters of the sample is small when the fibers (n = 2) are placed in the lenticle and the tailings fine sand, both of which are less than the effect of the fibers (n = 2), are placed at the interface on the mechanical properties of the sample.
- When the confining pressure σ3 < 300 kPa, the change of the peak pore pressure of the sample will not exceed 10 kPa, of which the change is not obvious, and when the confining pressure σ3 = 300 kPa, the variation of the peak pore pressure will be more obvious (minimum 9 kPa, maximum 38 kPa), indicating that the influence of the fiber number n and the position of the reinforcement on the peak pore pressure of the sample will only become prominent under the larger confining pressure.
- When the lenticle thickness is d = 0 cm, 1 cm, and 2 cm, the peak pore pressure of the sample under the confining pressure of 100 kPa were 14 kPa, 18 kPa, and 25 kPa, respectively, indicating that the lenticle increased the peak pore pressure of the sample; The thickness of the lenticle is d = 2 cm, and when the fibers are placed in the lenticle, the peak pore pressure of the samples with the number of fibers n = 0, 1, two under the confining pressure of 100 kPa are, respectively 25 kPa, 22 kPa, and 17 kPa, which indicates that the addition of fibers reduce the peak pore pressure of the sample, and the decreased degree increased with the increase of fibers.
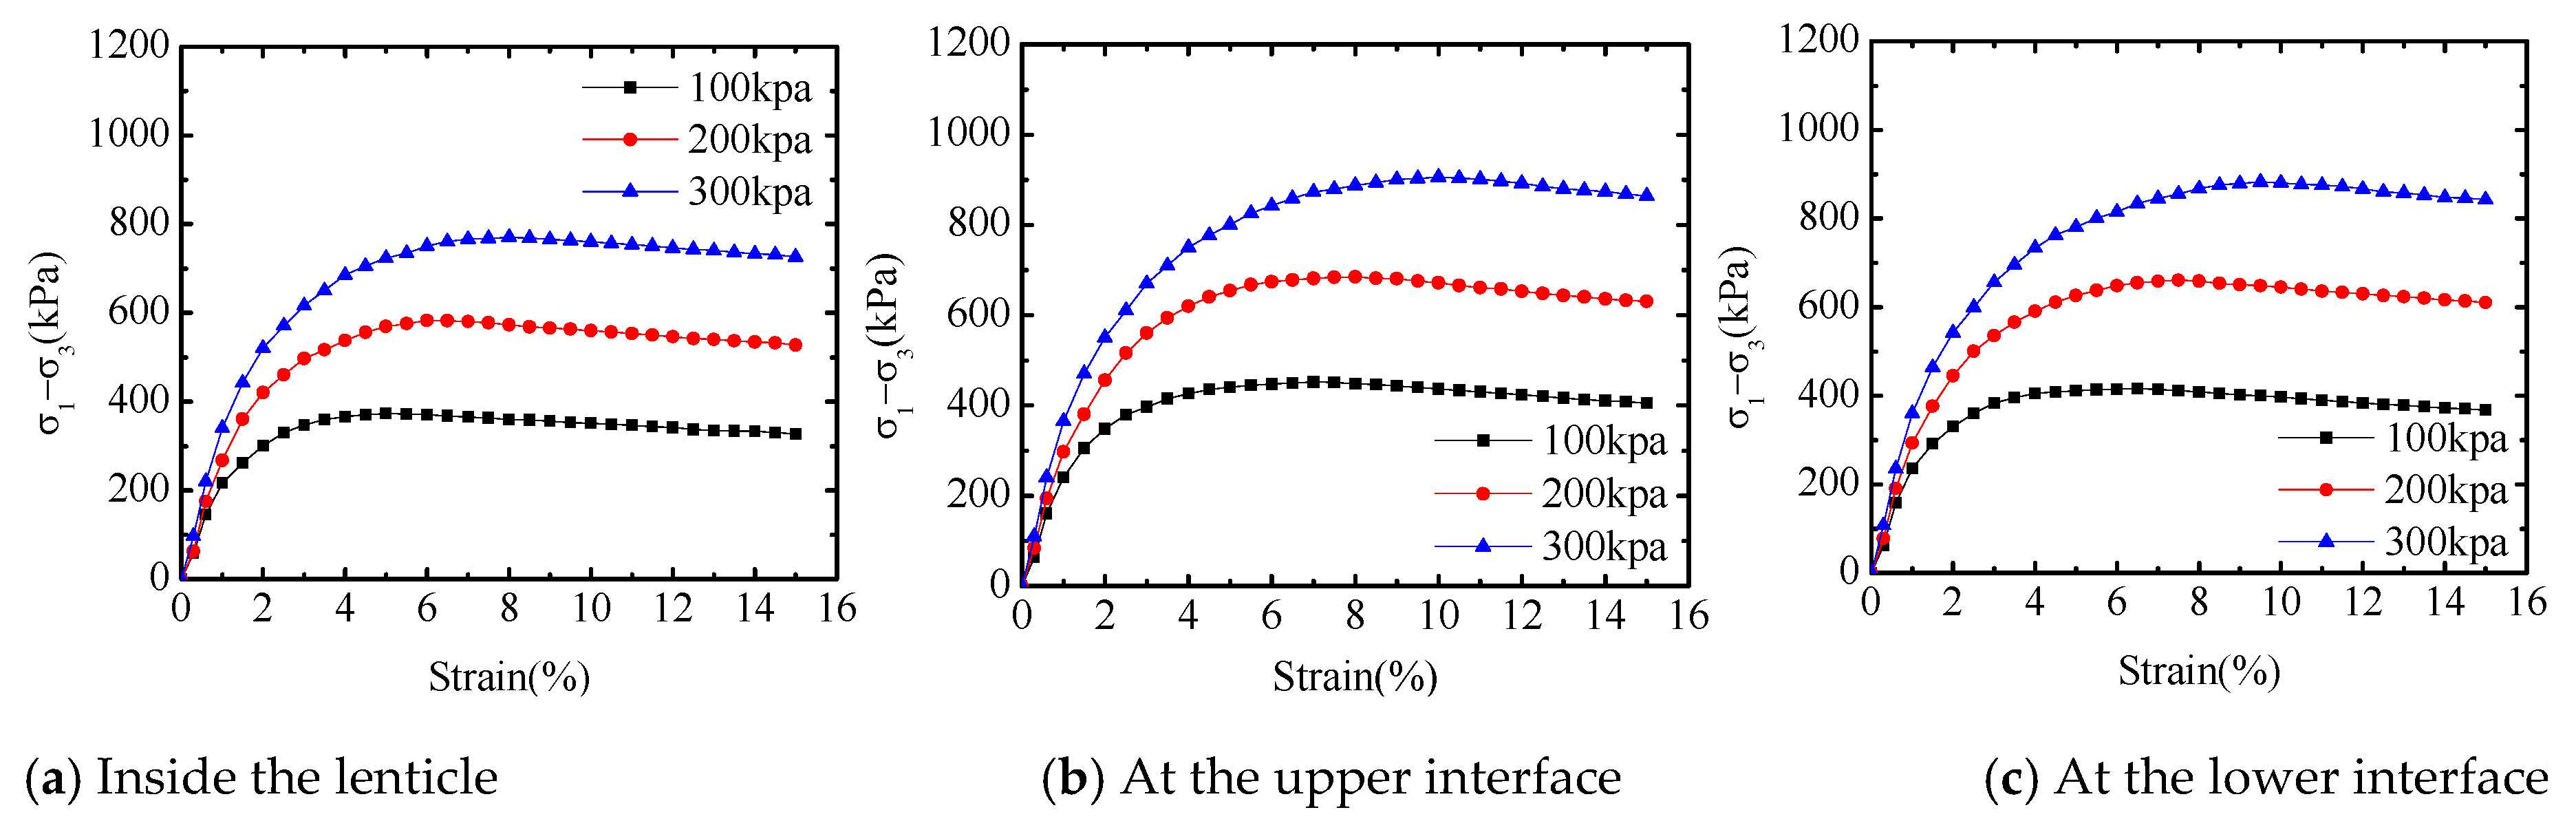
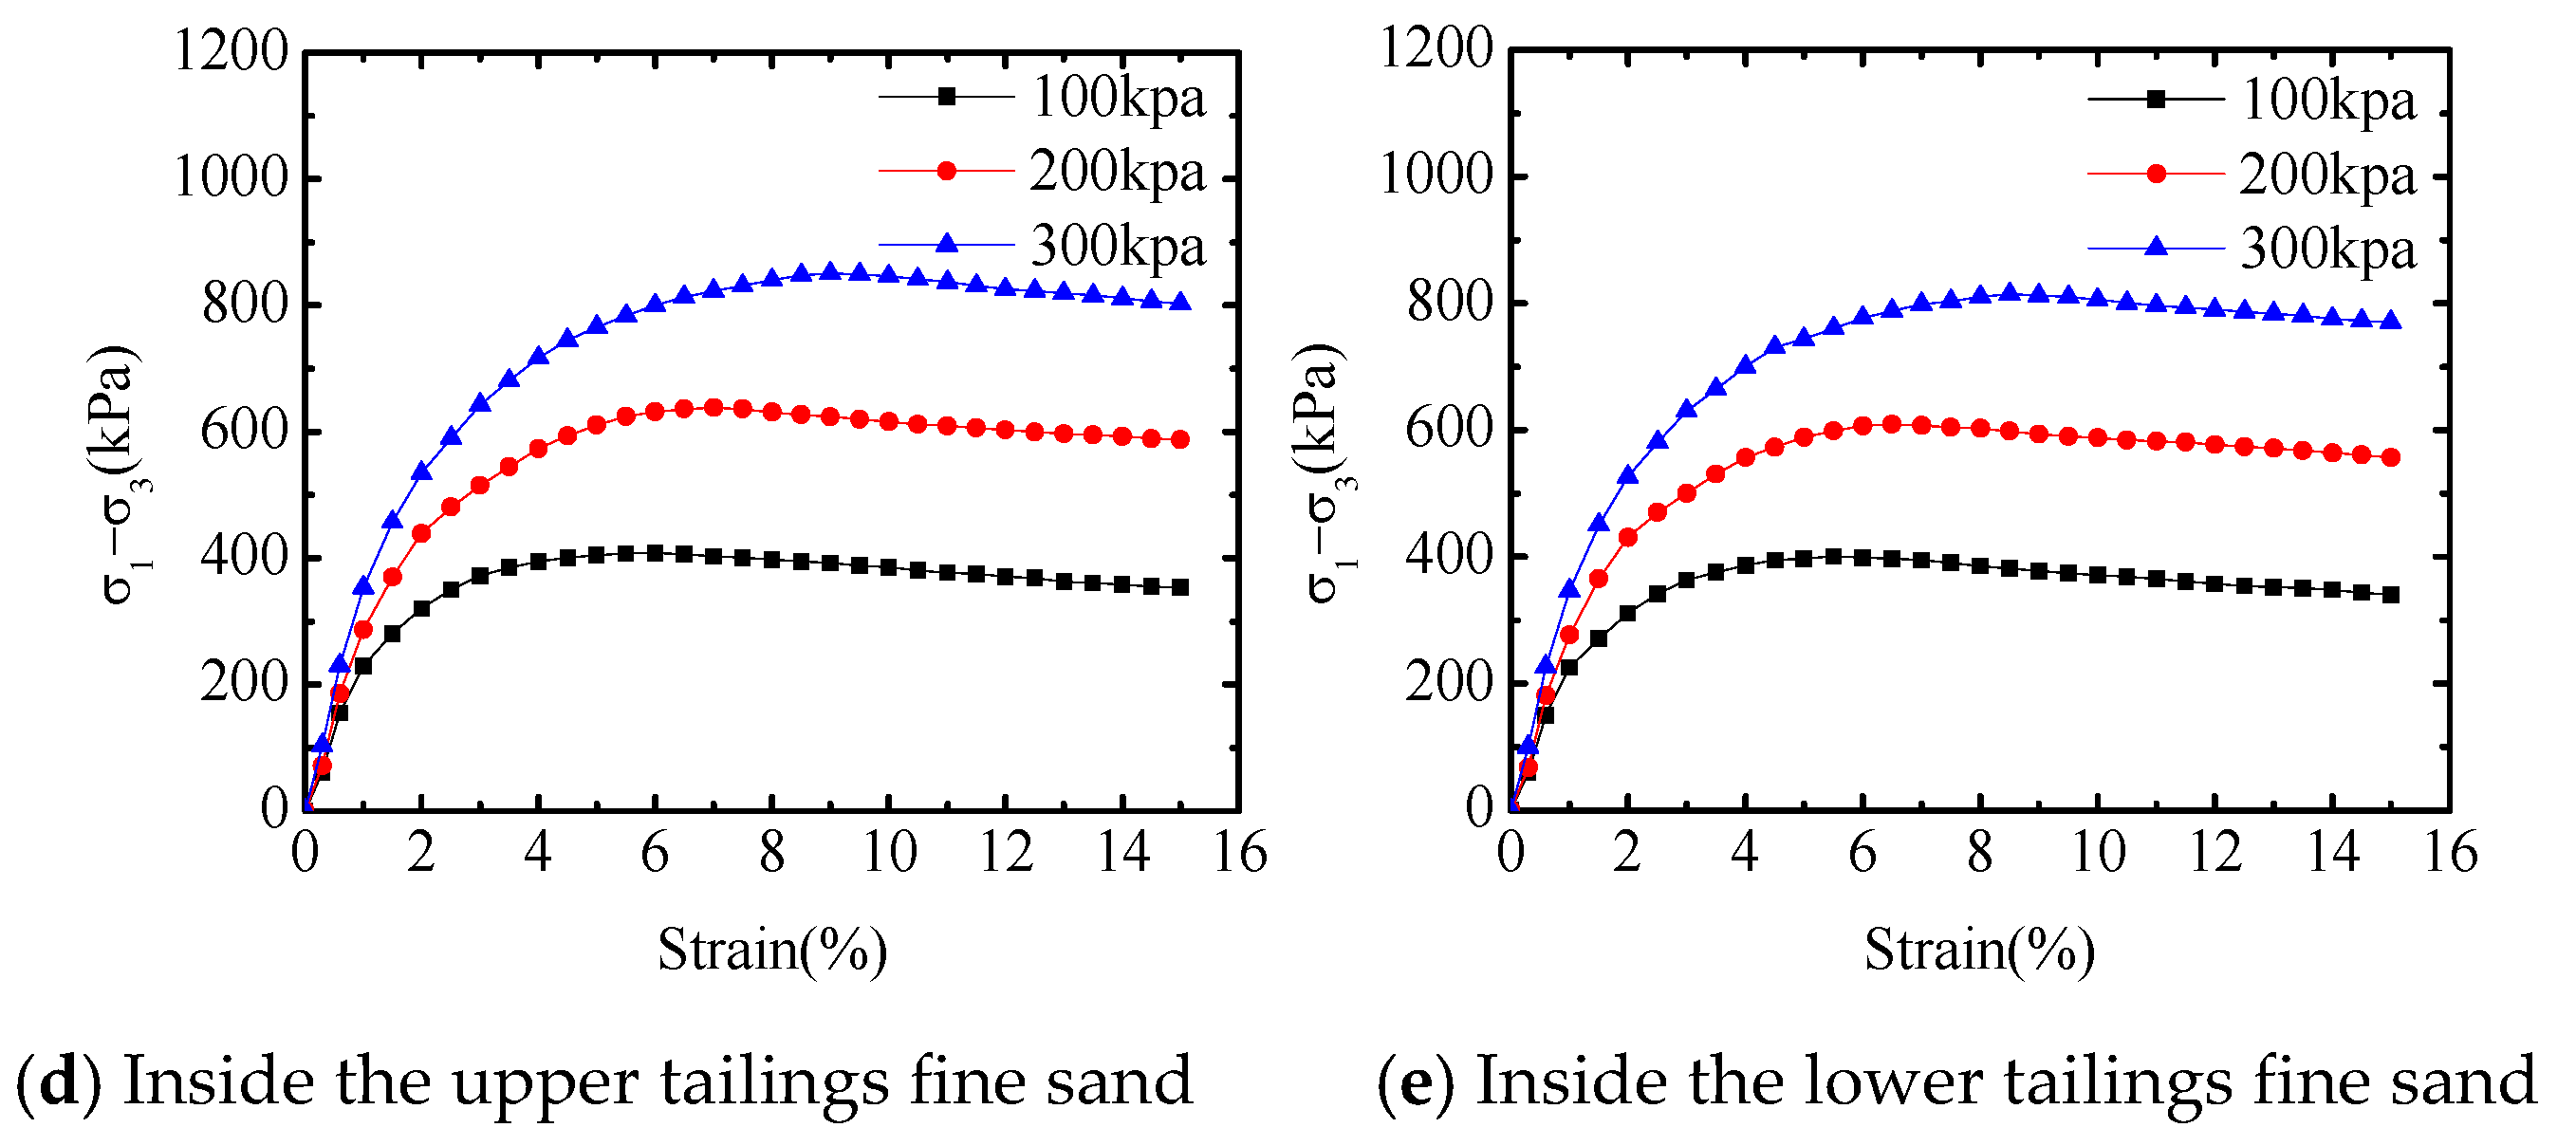
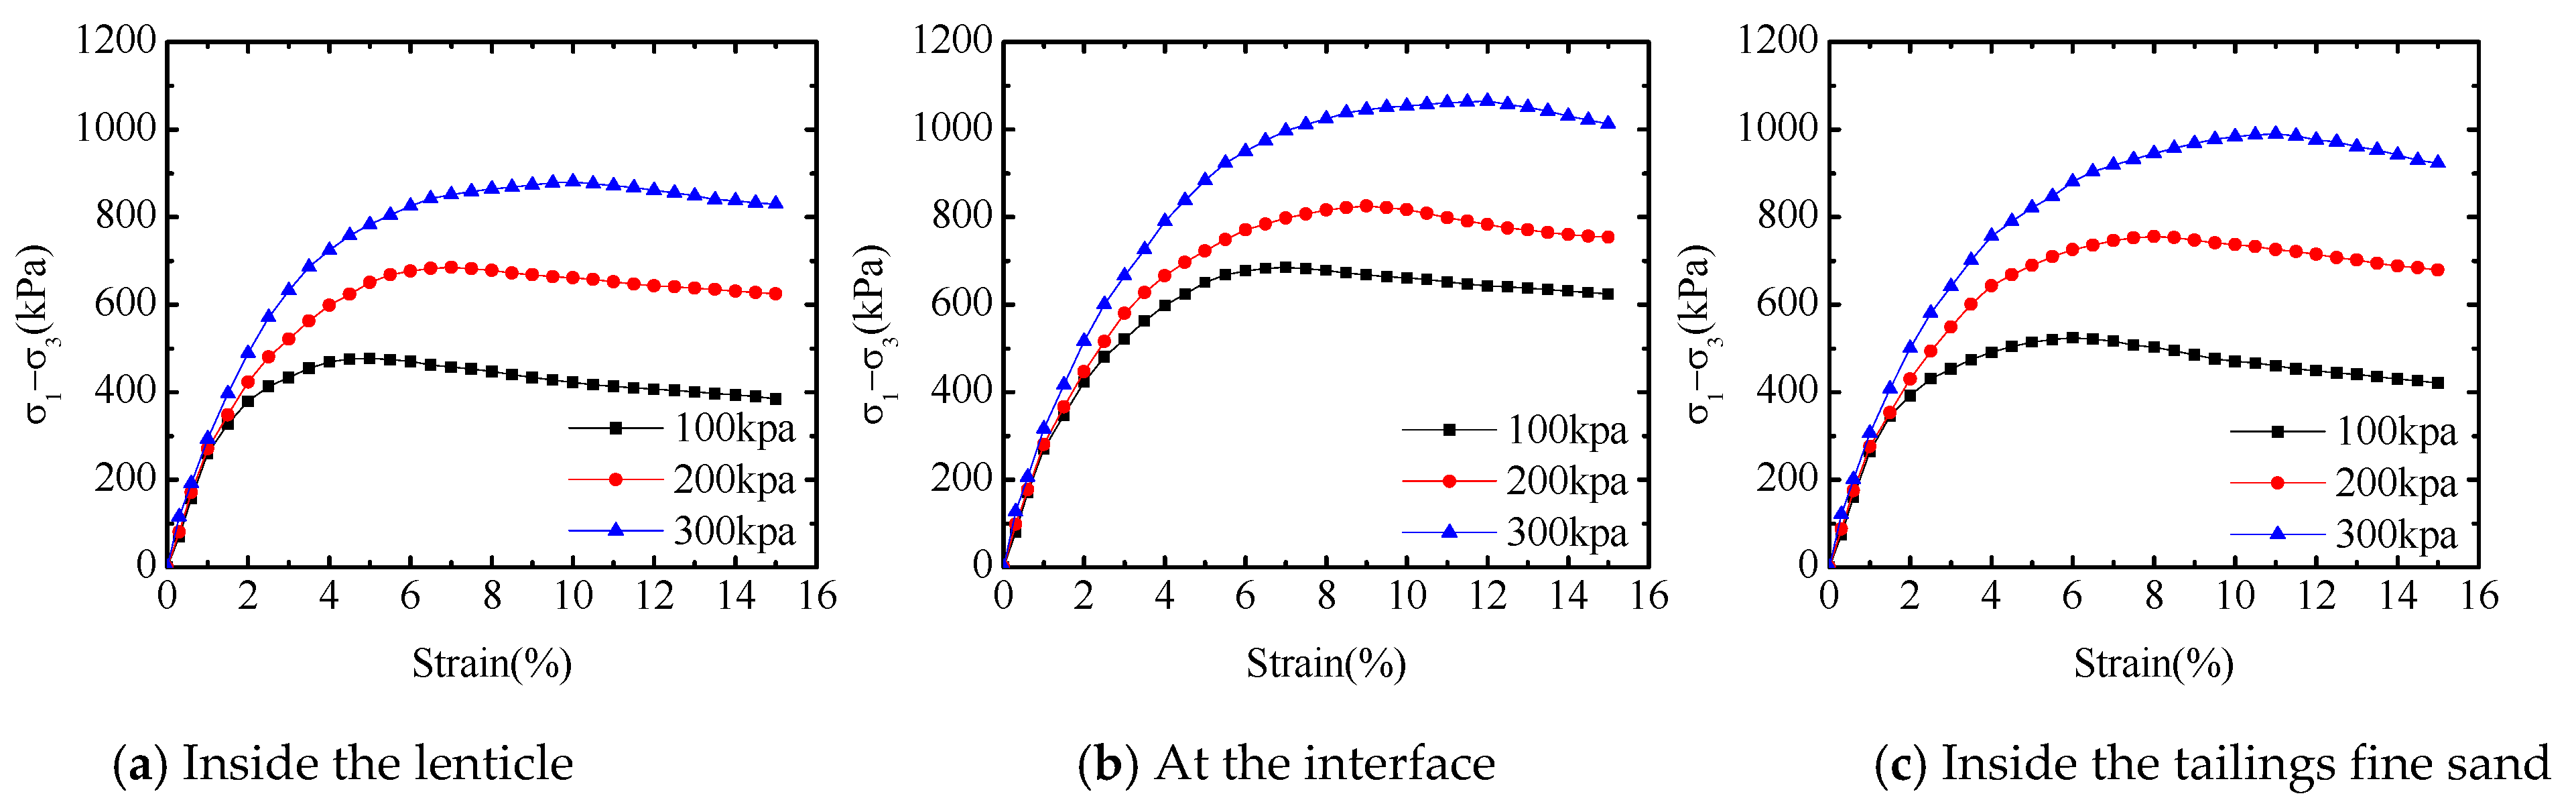
3.2. Stress-Strain Curves of Reinforced Soil
3.3. Secant Stiffness
4. Discussion
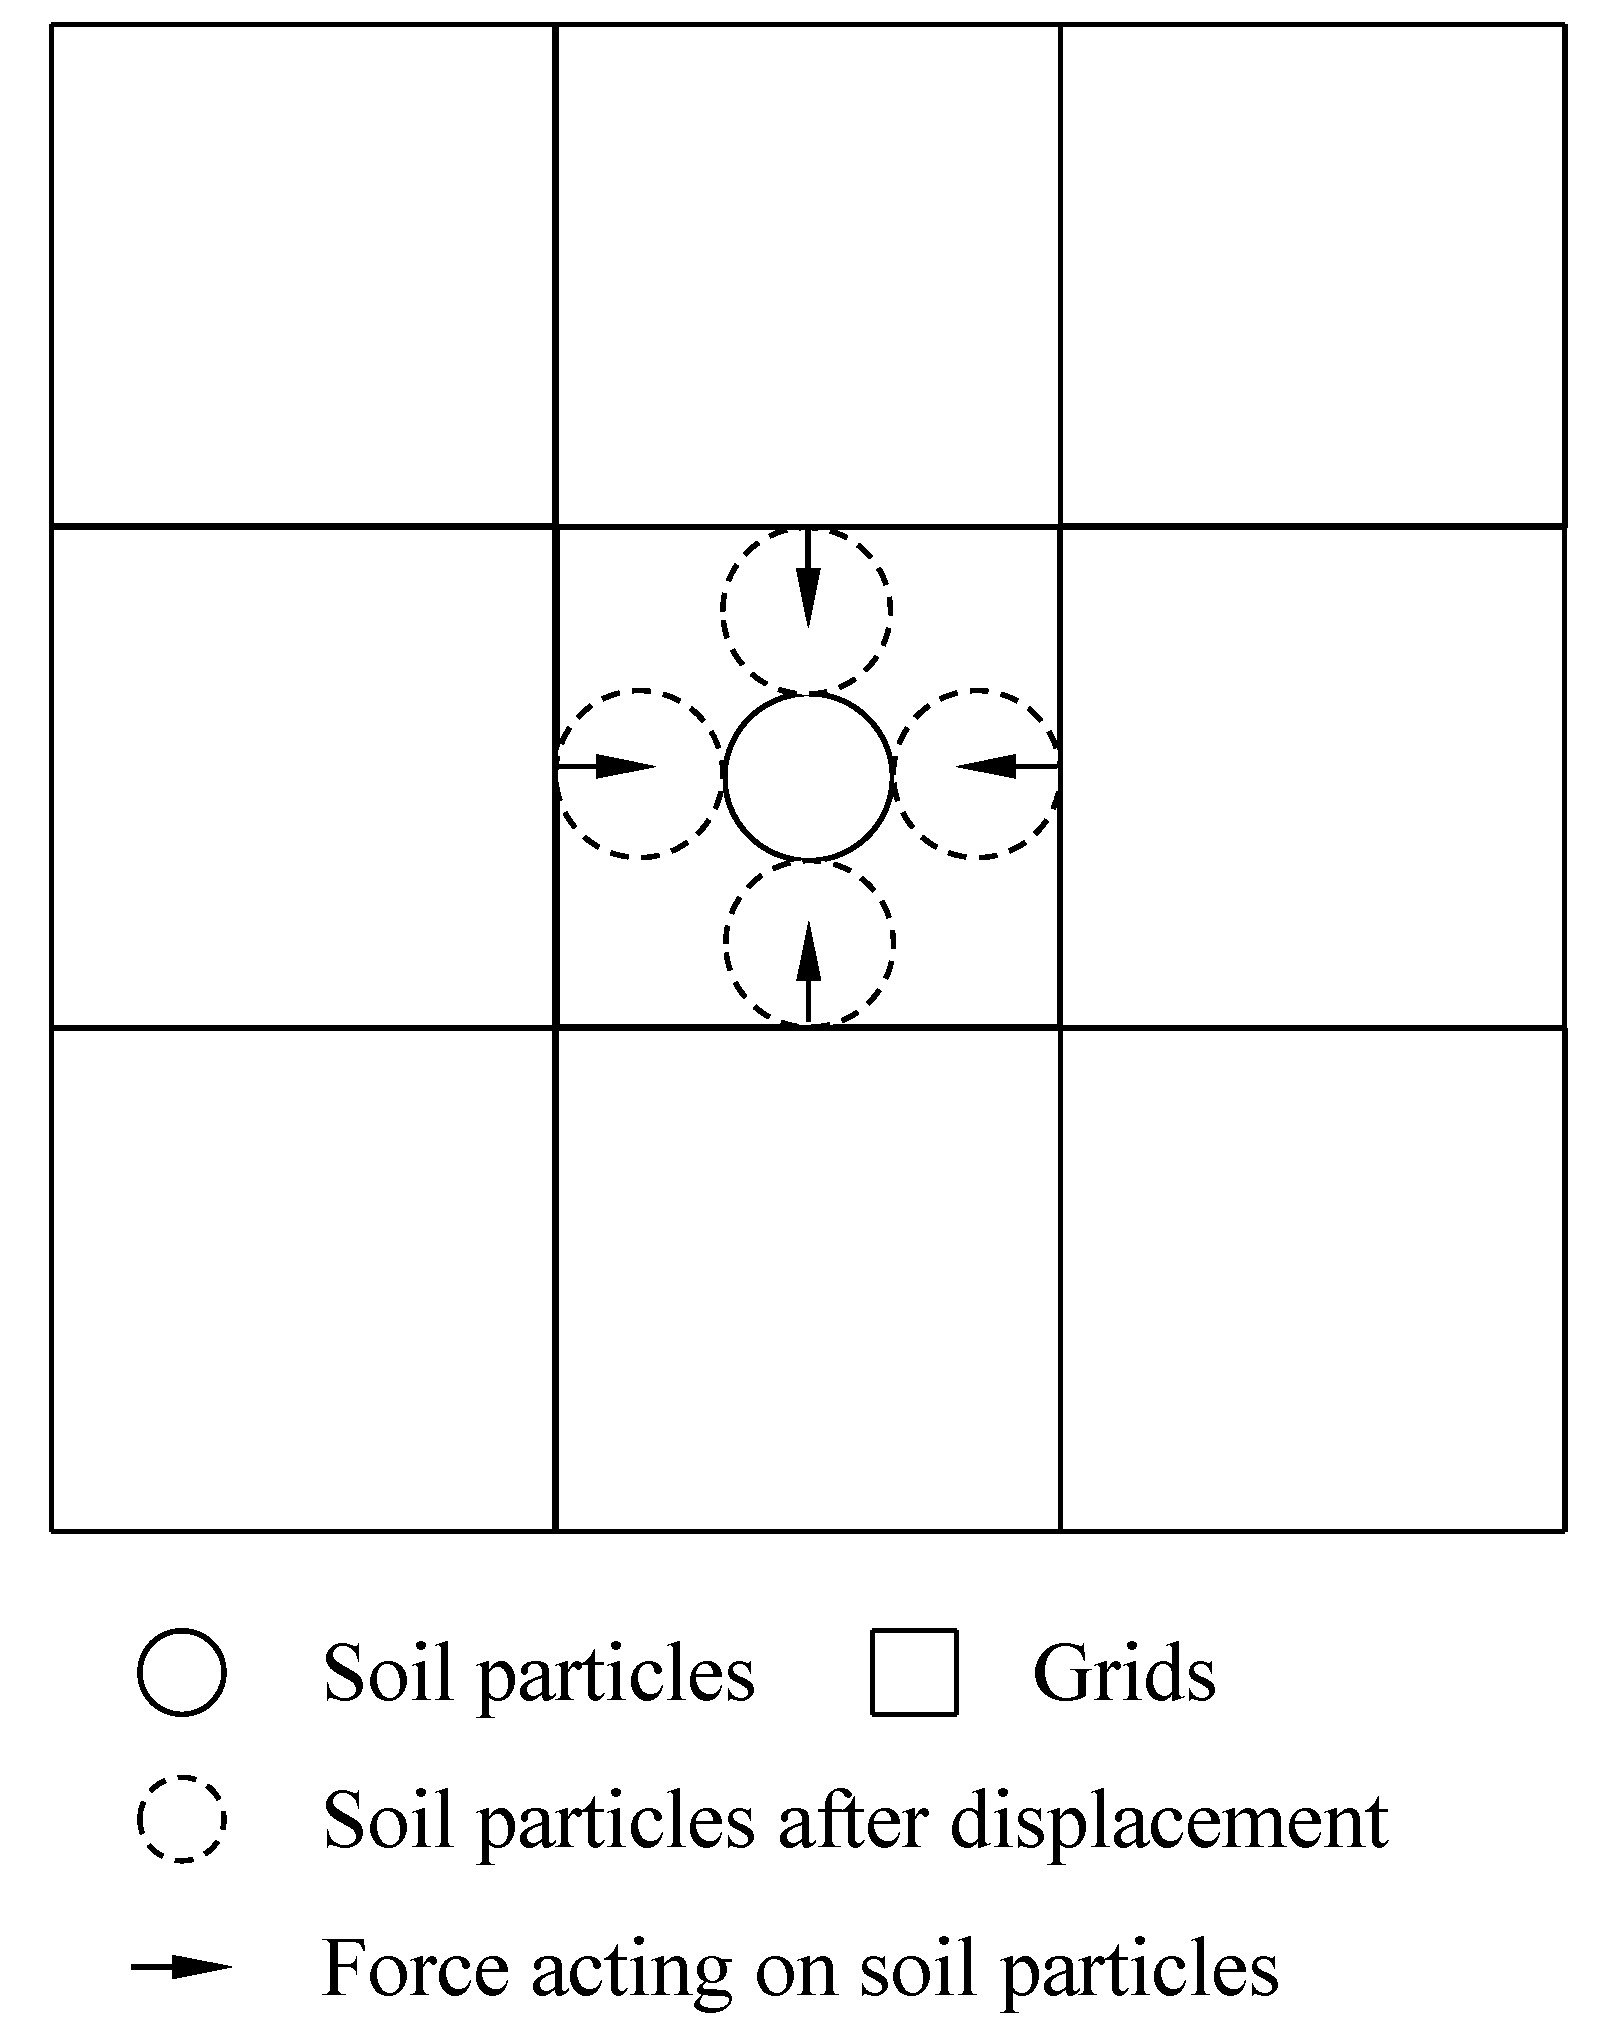
4.1. Reinforcement Mechanism
4.2. Strength and Stiffness of Reinforced Soil
4.3. Stress and Strain of Reinforced Soil
5. Conclusions
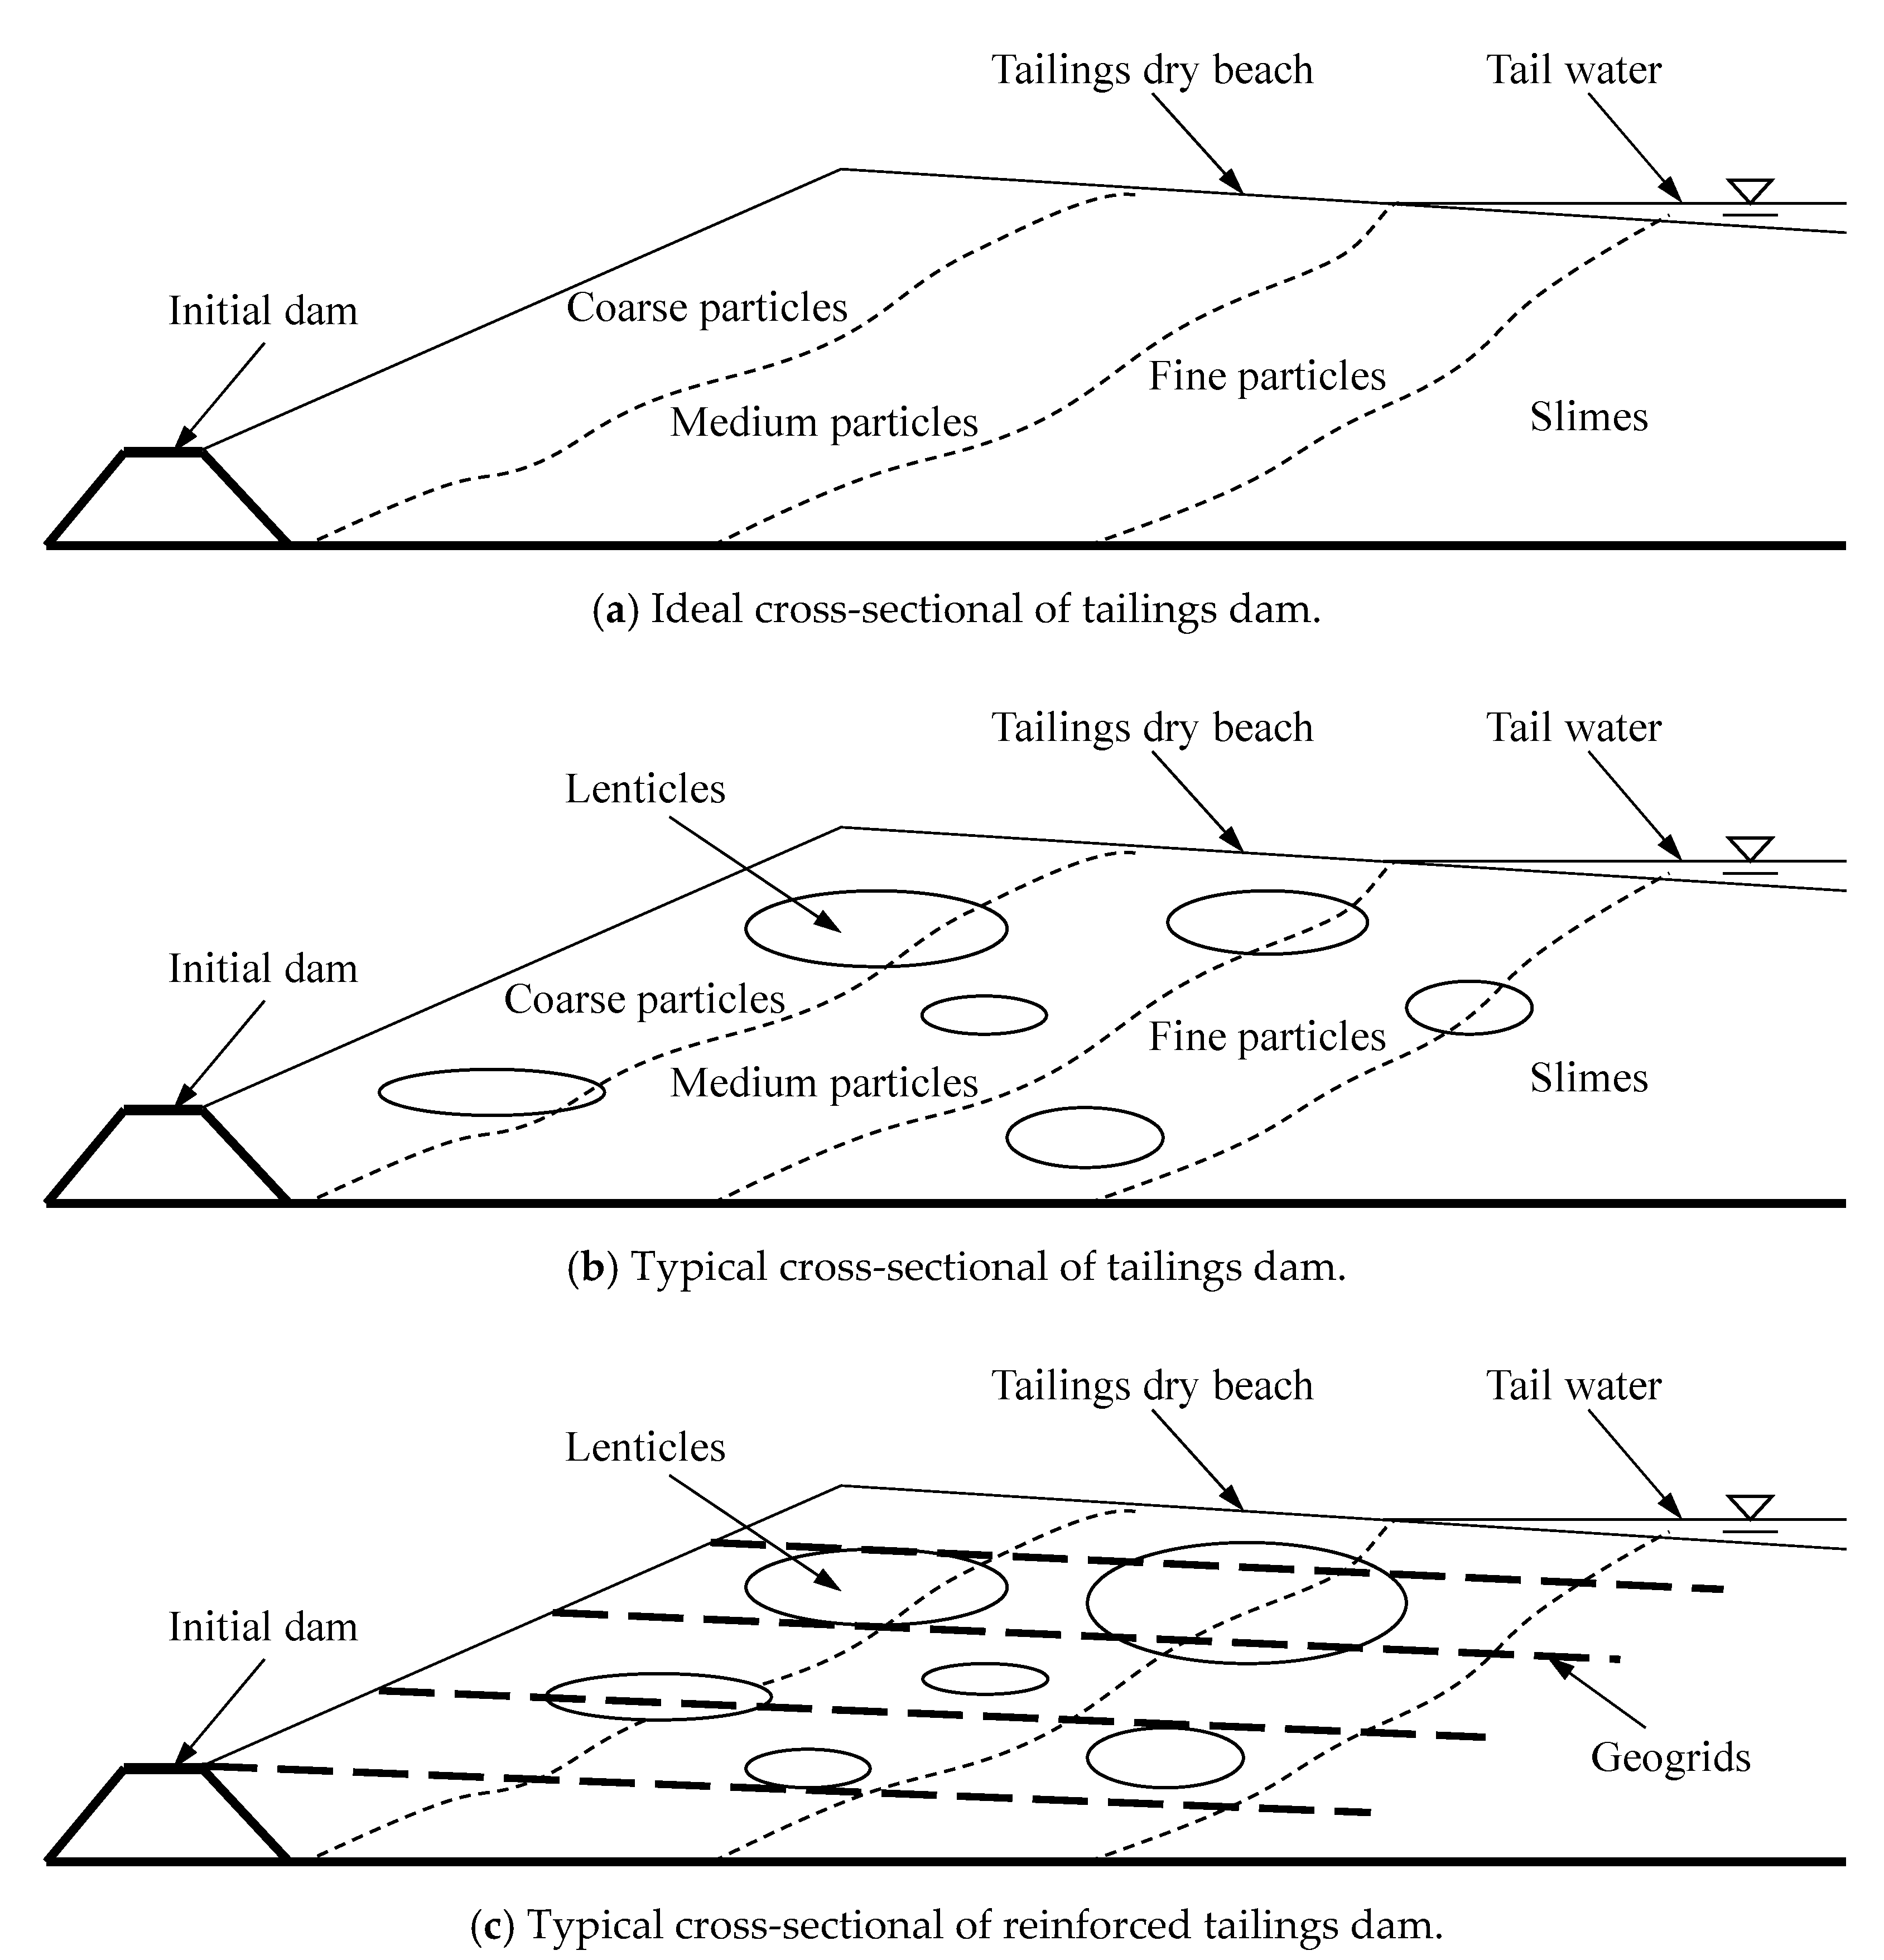
- The cohesion and internal friction angle of the tailings containing the lenticle are lower than the cohesion and internal friction angle of the tailings fine sand, and the influence of the lenticle on the cohesion is much greater than the influence on the internal friction angle. Therefore, if the tailings dam contains lenticle, the stability of the tailings dam will be greatly reduced. In the construction of tailings dam, it is of great significance to simulate the construction of tailings dam and to predict the influence range of the lens, so as to strengthen the construction of tailings dam by using the mesh fiber.
- The addition of reticular fibers improves the shear strength, stiffness and deformation resistance of the specimen, but the increase amplitude varies with the reinforced density and reinforced position, and the reticular fibers also reduce the peak pore pressure of the specimen. The shear strength, stiffness and deformation resistance of the tailings sand with a layer of reticular fiber is significantly lower than that of the two layers of the reticular fiber.
- The influence degree of the reticular fiber on the shear strength parameters of the sample varies with the position of the reinforcement, which is represented by at the interface > inside the tailings fine sand > inside the lenticle, and the improvement effect of the reticular fibers on the cohesion is much greater than that on the internal friction angle. When the lenticle is sandwiched by two layers of reticular fibers, bounded by fibers, and the tailings with lenticle are divided into the lenticle and the tailings fine sand, the mechanical properties of the tailings containing the lenticle are the strongest, which is the most beneficial to the stability of the tailings dam. It can be seen that, in the construction of tailings dam, we need to make reasonable analysis and judgment to select the position of reinforcement, so as to get the best effect of the application of materials, so as to reduce the risk of tailings dam.
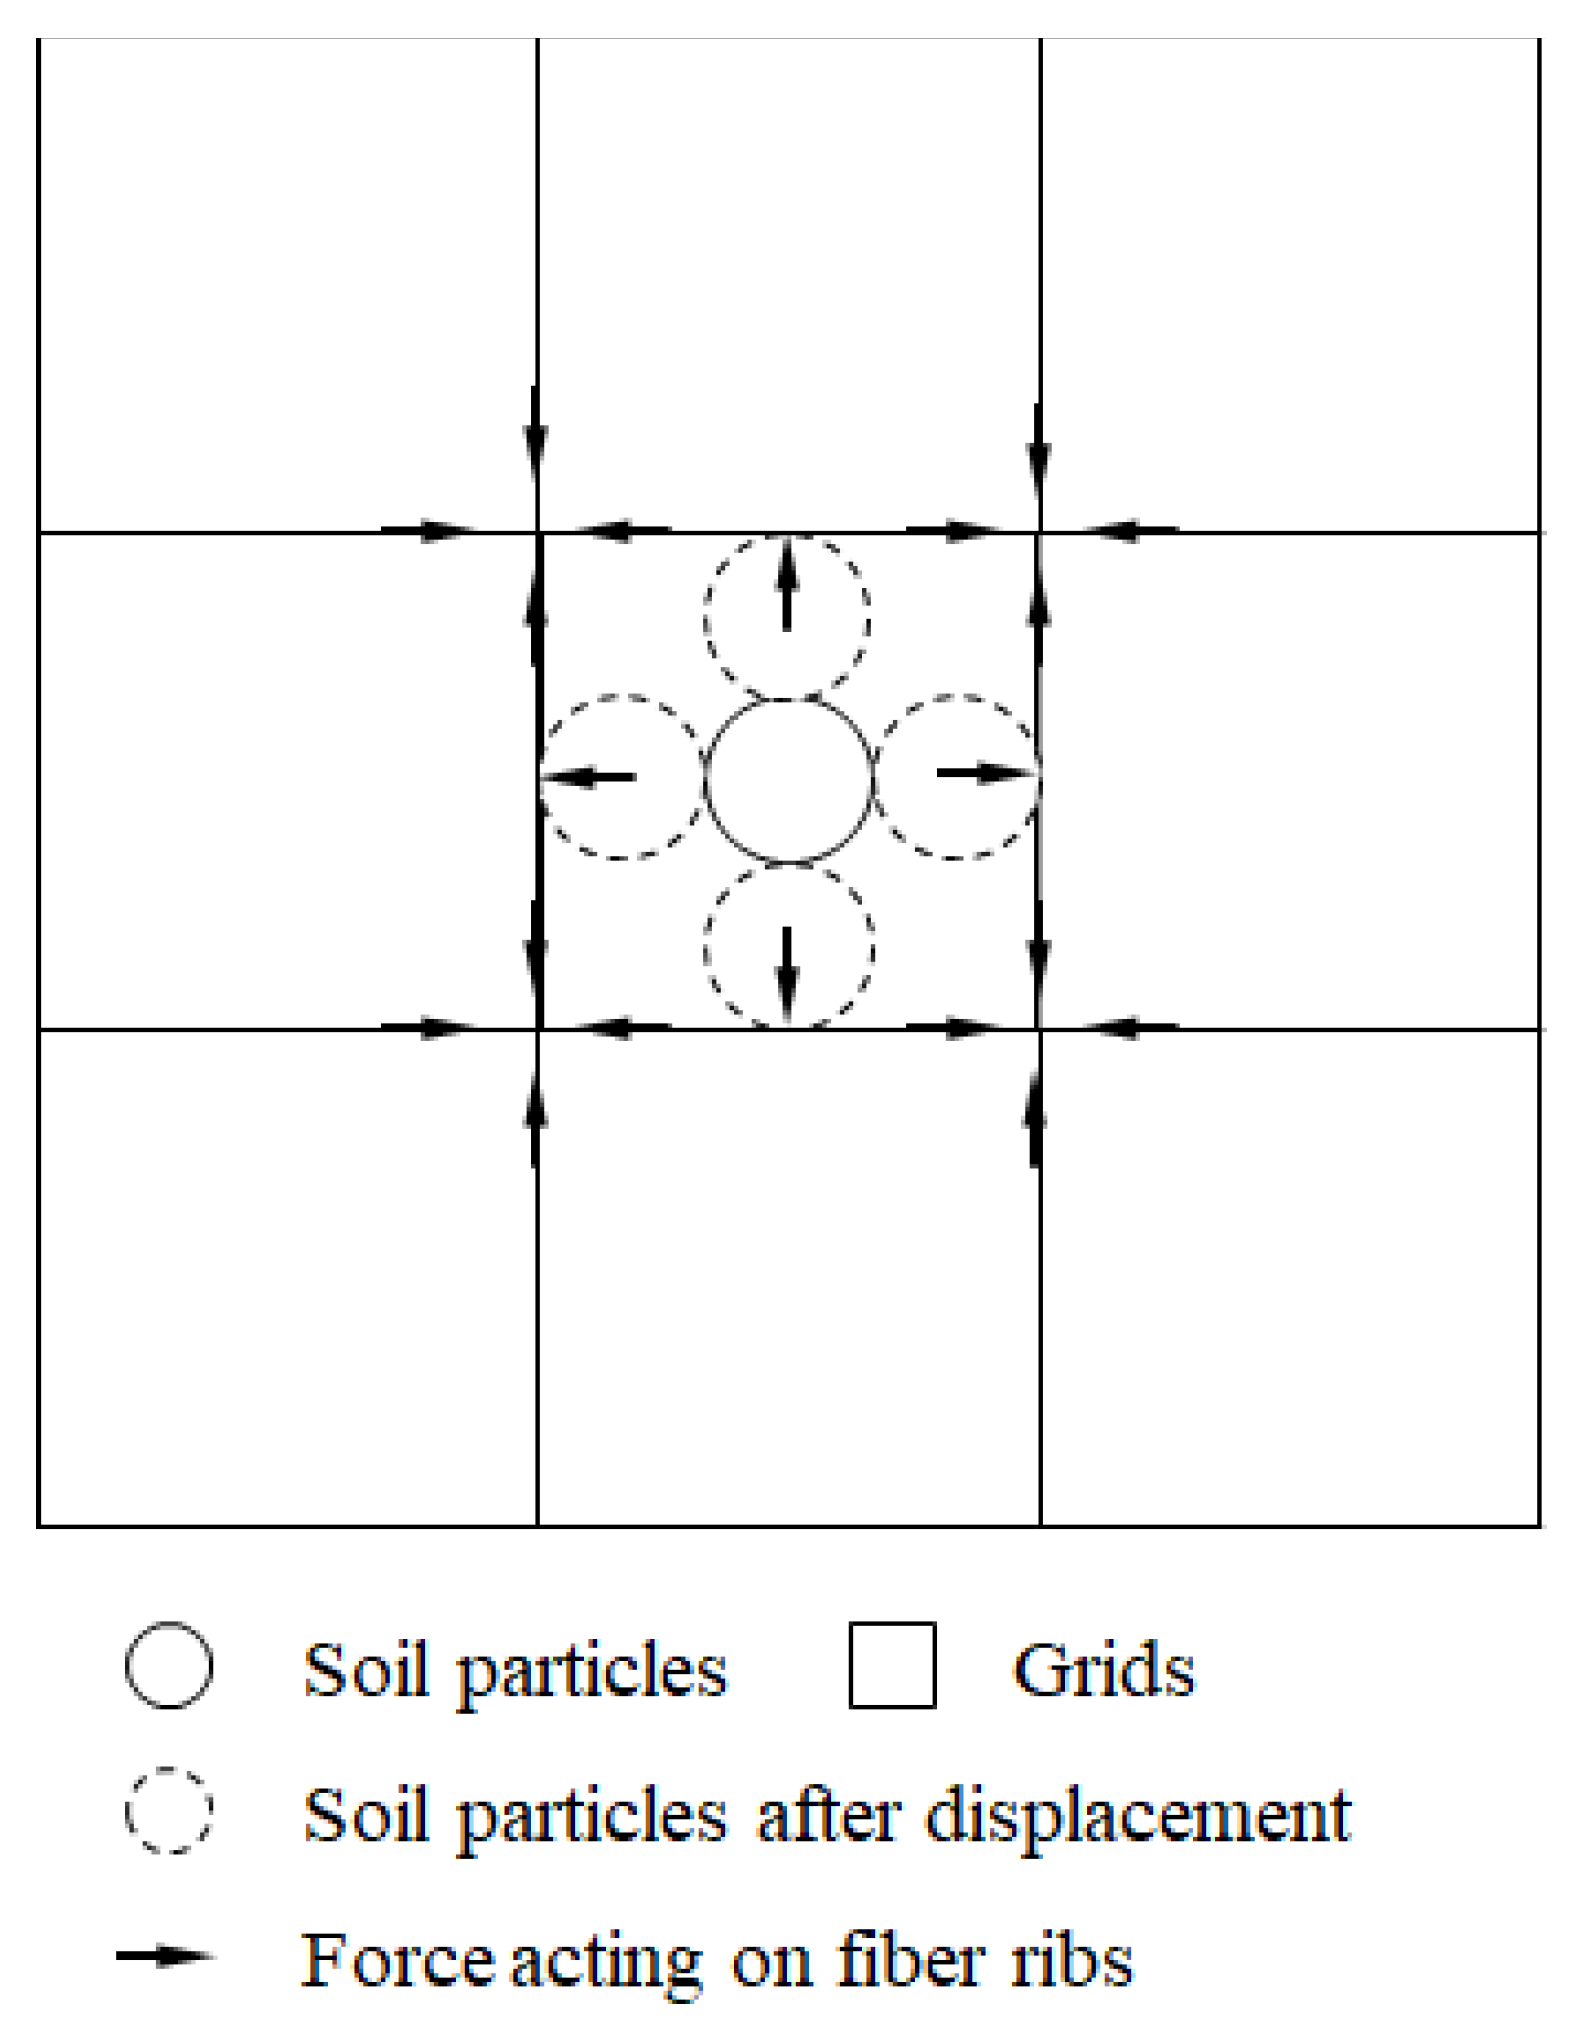
- The reinforcement effects of reticulated fibers are determined by the interaction of forces at the interface between fibers and sand. Friction, interlocking force and bond strength at the interface are the main factors controlling the benefit of fiber reinforcement, especially the friction force of fibers and interlocking force of grids. In order to strengthen the construction of tailings dam and to deal with the actual situation of complex tailings dam engineering, we can continue to study the application of various reticulation fiber materials in the future.
Author Contributions
Funding
Informed Consent Statement
Data Availability Statement
Conflicts of Interest
References
- Liu, J.; Bai, Y.; Song, Z.; Lu, Y.; Qian, W.; Kanungo, D.P. Evaluation of strength properties of sand modified with organic polymers. Polymers 2018, 10, 287. [Google Scholar] [CrossRef] [PubMed] [Green Version]
- Wu, Y.; Song, W.; Zhao, W.; Tan, X. An experimental study on dynamic mechanical properties of fiber-reinforced concrete under different strain rates. Appl. Sci. 2018, 8, 1904. [Google Scholar] [CrossRef] [Green Version]
- Rivera-Gómez, C.; Galán-Marín, C.; Bradley, F. Analysis of the influence of the fiber type in polymer matrix/fiber bond using natural organic polymer stabilizer. Polymers 2014, 6, 977–994. [Google Scholar] [CrossRef] [Green Version]
- Liu, J.; Chen, Z.-H.; Song, Z.-Z.; Bai, Y.-X.; Qian, W.; Wei, J.-H.; Kanungo, D.P. Tensile behavior of polyurethane organic polymer and polypropylene fiber-reinforced sand. Polymers 2018, 10, 499. [Google Scholar]
- Fang, S.-E.; Hong, H.-S.; Zhang, P.-H. Mechanical property tests and strength formulas of basalt fiber reinforced recycled aggregate concrete. Materials 2018, 11, 1851. [Google Scholar] [CrossRef] [Green Version]
- Zhu, H.H.; Zhang, C.C.; Tang, C.S.; Shi, B.; Wang, B.J. Modeling the pullout behavior of short fiber inreinforced soil. Geotext. Geomembr. 2014, 42, 329–338. [Google Scholar] [CrossRef]
- Wang, Y.; Guo, P.; Shan, S.; Yuan, H.; Yuan, B. Study on strength influence mechanism of fiber-reinforced expansive soil using jute. Geotech. Geol. Eng. 2016, 34, 1079–1088. [Google Scholar]
- Liu, J.; Song, Z.; Lu, Y.; Wang, Q.; Kong, F.; Bu, F.; Kanungo, D.P.; Sun, S. Improvement effect of water-based organic polymeron the strength properties of fiber glass reinforced sand. Polymers 2018, 10, 836. [Google Scholar] [CrossRef] [Green Version]
- Yin, G.; Wei, Z.; Wang, J.G.; Wan, L.; Shen, L. Interaction characteristics of geosynthetics with fine tailings in pullout test. Geosynth. Int. 2008, 15, 428–436. [Google Scholar]
- Özer, A.T.; Bromwell, L.G. Stability assessment of an earth dam on silt/clay tailings foundation: A case study. Eng. Geol. 2012, 29, 89–99. [Google Scholar] [CrossRef]
- Krekeler, M.P.S.; Morton, J.; Lepp, J.; Tselepis, C.M.; Samsonov, M.; Kearns, L.E. Mineralogical and geochemical investigation of clay-rich mine tailings from a closed phosphate mine, Bartow Florida, USA. Environ. Geol. 2008, 55, 123–147. [Google Scholar] [CrossRef]
- Li, X.B.; Jiang, W.D.; He, H.J. Study on distributing state of lenticle in tailings fill dam. Rock Soil Mech. 2004, 25, 947–949. (In Chinese) [Google Scholar]
- Homstrom, H.; Ohlander, B. Layers rich in Fe-and Mn-oxyhydroxides formed at the tailings-Pond water interface, a Possible trap for trace metals in flooded mine tailings. J. Geoehem. Explor. 2001, 74, 189–203. [Google Scholar] [CrossRef]
- Parker, G.; Paola, C.; Whipple, K.X.; Mohrig, D.; Toro-Escobar, C.M.; Halverson, M.; Skoglund, T.W. Alluvial fans formed by channelized fluvial and sheet flow. J. Hydraul. Eng. 1998, 124, 996–1004. [Google Scholar] [CrossRef]
- Stark, T.D.; Eid, H.T. Drained residual strength of cohesion soils. J. Geotech. Eng. 1994, 120, 856–871. [Google Scholar] [CrossRef]
- Al-Shayea, N.A. The combined effect of clay and moisture content of the behavior ofremolded unsaturated soils. Eng. Geol. 2001, 62, 319–342. [Google Scholar] [CrossRef]
- Tiwari, B.; Marui, H. A new method for the correlation of residual shear strength ofthe soil with mineralogical composition. J. Geotech. Geoenviron. 2005, 131, 1139–1150. [Google Scholar] [CrossRef]
- Dimitrova, R.S.; Yanful, E.K. Factors affecting the shear strength of mine tailings/claymixtures with varying clay content and clay mineralogy. Eng. Geol. 2012, 125, 11–25. [Google Scholar] [CrossRef]
- Lu, R.B.; Wang, T. Safety management technique and accident-causing analysis of dam-failure in upstream tailings pond. J. Yangtze River Sci. Res. Inst. 2009, S1, 112–117. (In Chinese) [Google Scholar]
- Yuan, W.; Bai, B.; Li, X.C.; Wang, H.B. Parameters sensitivity analysis of lenticles impacting on tailings dam safety. J. Cent. South Univ. (Sci. Technol.) 2013, 44, 1174–1183. (In Chinese) [Google Scholar]
- Li, Z.P.; Peng, Z.B.; He, Z.M.; Yuan, W. Simplification method of lenticles and its impact on safety of tailings dam. J. Cent. South Univ. (Sci. Technol.) 2017, 48, 1326–1334. (In Chinese) [Google Scholar]
- Yang, Y.; Wei, Z.; Cao, G.; Yang, Y.; Wang, H.; Zhuang, S.; Lu, T. A case study on utilizing geotextile tubesfor tailings dams construction in China. Geotext. Geomembr. 2019, 47, 187–192. [Google Scholar] [CrossRef]
- Wei, Z.; Yin, G.; Li, G.; Wang, J.G.; Wan, L.; Shen, L. Reinforced terraced fields method for fine tailings disposal. Miner. Eng. 2009, 22, 1053–1059. [Google Scholar] [CrossRef]
- Jing, X.F.; Zhou, X.; Zhao, Y.S.; Liu, K.; Chen, Y.E.; Pan, C. Study on influence of reinforcement density on overtopping failure of tailings dam. J. Saf. Sci. Technol. 2016, 12, 68–74. (In Chinese) [Google Scholar]
- Yin, G.Z.; Wei, Z.A.; Wan, L.; Zhang, D.M. TEST Study on stability of fine grained tailings dam in geo-grid reinforcement situation. Chin. J. Rock Mech. Eng. 2005, 24, 1030–1034. (In Chinese) [Google Scholar]
- Zhao, Y.S.; Jing, X.F.; Zhou, X.; Cai, Z.Y.; Liu, K.H. Experimental study on blocking action of bar strip on tailings dam overtopping. China Saf. Sci. J. 2016, 26, 94–99. (In Chinese) [Google Scholar]
- Fang, Y.; Chen, B.; Oderji, S.Y. Experimental research on magnesium phosphate cement mortar reinforced by glass fiber. Constr. Build. Mater. 2018, 188, 729–736. [Google Scholar] [CrossRef]
- Giusti, R.; Zanini, F.; Lucchetta, G. Automatic glass fiber length measurement for discontinuous fiber-reinforced composites. Compos. Part A Appl. Sci. Manuf. 2018, 112, 263–270. [Google Scholar] [CrossRef]
- Leshchinsky, B.; Evans, T.M.; Vesper, J. Microgrid inclusions to increase the strength and stiffness of sand. Geotext. Geomembr. 2016, 44, 170–177. [Google Scholar] [CrossRef]
- Zhang, Q.; Yin, G.; Wei, Z.; Fan, X.; Wang, W.; Nie, W. An experimental study of the mechanical features of layered structures in dam tailings from macroscopic and microscopic points of view. Eng. Geol. 2015, 195, 142–154. [Google Scholar] [CrossRef]
- Tran, K.Q.; Satomi, T.; Takahashi, H. Improvement of mechanical behavior of cemented soil reinforced with waste cornsilk fibers. Constr. Build. Mater. 2018, 178, 204–210. [Google Scholar] [CrossRef]
- Khan, M.Z.N.; Hao, Y.; Hao, H.; Shaikh, F.U.A.; Liu, K. Mechanical properties of ambient cured high-strength plain and hybrid fiber reinforced geopolymer composites from triaxial compressive tests. Constr. Build. Mater. 2018, 185, 338–353. [Google Scholar] [CrossRef]
- Wei, L.; Chai, S.X.; Zhang, H.Y.; Shi, Q. Mechanical properties of soil reinforced with both lime and four kinds of fiber. Constr. Build. Mater. 2018, 172, 300–308. [Google Scholar] [CrossRef]
- Bao, C.G. Study on interface behavior of geosynthetics and soil. Chin. J. Rock Mech. Eng. 2006, 25, 1735–1744. (In Chinese) [Google Scholar]
- Bauer, C.E.; Zhao, Y.J. Effect of soil dilatancy on shear strength of reinforced composites. In Proceedings of the International Conference on Geotextiles, Vienna, Austria, 7–11 April 1986; pp. 369–372. [Google Scholar]
- Cai, M.F.; He, M.C.; Liu, D.Y. Rock Mechanics and Engineering; Science Press: Beijing, China, 2005; pp. 184–187. (In Chinese) [Google Scholar]
- Zhou, Z.G.; Li, Y.Z. Research on constitutive model of reinforced soil considering viscoelasticity of geogrids. Chin. J. Rock Mech. Eng. 2011, 30, 850–857. (In Chinese) [Google Scholar]


| Parameters | Dry Density ρ/(g.cm−3) | Cohesion c/kPa | Internal Friction Angle φ/° | Permeability Coefficient K/(cm/s) | Compression Coefficient a1-2/kPa−1 | Effective Particle Size d10/mm | |
|---|---|---|---|---|---|---|---|
| Material | |||||||
| Tailings fine sand | 1.93 | 10.16 | 32.68 | 1.32 × 10⁻³ | 1.73 × 10⁻⁴ | 6.5 × 10⁻³ | |
| Tailings silt | 1.82 | 13.23 | 31.11 | 1.26 × 10⁻⁴ | 2.10 × 10⁻⁴ | 9 × 10⁻³ | |
| Parameters | Ultimate Tensile Strength/(KN/m) | Tensile Strength at Different Strains (%)/(KN/m) | ||
|---|---|---|---|---|
| Material | 2 | 5 | ||
| Fiber | 40 | 15 | 27 | |
| Condition | 1 | 2 | 3 | 4 | 5 | 6 | 7 | 8 | 9 | 10 |
|---|---|---|---|---|---|---|---|---|---|---|
| Lenticle thickness d/cm | 1 | 2 | 2 | 2 | 2 | 2 | 2 | 2 | 2 | 2 |
| Fiber quantity n/layer | 0 | 0 | 1 | 1 | 1 | 1 | 1 | 2 | 2 | 2 |
| Reinforcement position | / | / | At the upper interface | At the lower interface | Inside the lenticle | Inside the upper tailings fine sand | Inside the lower tailings fine sand | At the interface | Inside the lenticle | Inside the tailings fine sand |
| Condition | Tailings Fine Sand | Tailings Silt | d = 1, n = 0 | d = 2, n = 0 | d = 2, n = 1 | d = 2, n = 1 | d = 2, n = 1 | d = 2, n = 1 | d = 2, n = 1 | d = 2, n = 2 | d = 2, n = 2 | d = 2, n = 2 | |
|---|---|---|---|---|---|---|---|---|---|---|---|---|---|
| Results | / | / | / | / | Inside the Lenticle | At the Upper Interface | At the Lower Interface | Inside the Upper Tailings Fine Sand | Inside the Lower Tailings Fine Sand | Inside the Lenticle | At the Interface | Inside the Tailings Fine Sand | |
| Cohesion c/kPa | 10.16 | 13.23 | 6.56 | 6.96 | 20.36 | 22.36 | 22.13 | 20.86 | 20.65 | 46.68 | 48.16 | 47.13 | |
| Internal friction angle φ/° | 32.68 | 31.11 | 32.29 | 31.44 | 31.60 | 31.95 | 31.87 | 31.69 | 31.64 | 32.15 | 32.51 | 32.28 | |
| Peak pore pressure u/kPa | 100kPa | 14 | 28 | 18 | 25 | 22 | 20 | 20 | 21 | 21 | 17 | 20 | 18 |
| 200kPa | 30 | 56 | 36 | 40 | 37 | 33 | 34 | 34 | 35 | 30 | 33 | 32 | |
| 300kPa | 40 | 90 | 68 | 79 | 70 | 50 | 52 | 55 | 64 | 41 | 46 | 43 | |
| Condition | Tailings Fine Sand | d = 1, n = 0 | d = 2, n = 0 | d = 2, n = 1 | d = 2, n = 1 | d = 2, n = 1 | d = 2, n = 1 | d = 2, n = 1 | d = 2, n = 2 | d = 2, n = 2 | d = 2, n = 2 | |
|---|---|---|---|---|---|---|---|---|---|---|---|---|
| Stiffness | / | / | / | Inside the Lenticle | At the Upper Interface | At the Lower Interface | Inside the Upper Tailings Fine Sand | Inside the Lower Tailings Fine Sand | Inside the Lenticle | At the Interface | Inside the Tailings Fine Sand | |
| Secant stiffnessE50/MPa | 100kPa | 19.02 | 17.73 | 18.31 | 19.40 | 21.46 | 20.68 | 20.32 | 19.93 | 23.43 | 26.80 | 24.70 |
| 200kPa | 20.59 | 18.27 | 19.45 | 21.08 | 25.09 | 24.83 | 23.89 | 22.46 | 26.79 | 32.76 | 29.03 | |
| 300kPa | 31.32 | 27.46 | 29.33 | 32.26 | 36.78 | 35.75 | 34.50 | 33.46 | 38.42 | 42.44 | 40.46 |
| Condition | n = 1, Inside the Lenticle | n = 1, Upper Interface | n = 1, Lower Interface | n = 1, Upper Tailings Fine Sand | n = 1, Lower Tailings Fine Sand | n = 2, Inside the Lenticle | n = 2, At the Interface | n = 2, Inside the Tailings Fine Sand | |
|---|---|---|---|---|---|---|---|---|---|
| Improvement Coefficient | |||||||||
| IF | IFc | 2.93 | 3.21 | 3.18 | 3.00 | 2.97 | 6.71 | 6.92 | 6.77 |
| IFφ | 1.005 | 1.016 | 1.014 | 1.008 | 1.006 | 1.023 | 1.034 | 1.027 | |
| IFE0.3 | 100kPa | 1.06 | 1.17 | 1.13 | 1.11 | 1.09 | 1.28 | 1.46 | 1.35 |
| 200kPa | 1.08 | 1.29 | 1.28 | 1.23 | 1.15 | 1.38 | 1.68 | 1.49 | |
| 300kPa | 1.10 | 1.25 | 1.22 | 1.18 | 1.14 | 1.31 | 1.45 | 1.38 |
Publisher’s Note: MDPI stays neutral with regard to jurisdictional claims in published maps and institutional affiliations. |
© 2021 by the authors. Licensee MDPI, Basel, Switzerland. This article is an open access article distributed under the terms and conditions of the Creative Commons Attribution (CC BY) license (https://creativecommons.org/licenses/by/4.0/).
Share and Cite
Jing, X.; Pan, C.; Chen, Y.; Li, X.; Wang, W.; Hu, X. Improvement Effect of Reticular Glass Fibers on the Mechanical Properties of Tailings Sand with the Lenticle (Layered Sandy Soil). Water 2021, 13, 1379. https://doi.org/10.3390/w13101379
Jing X, Pan C, Chen Y, Li X, Wang W, Hu X. Improvement Effect of Reticular Glass Fibers on the Mechanical Properties of Tailings Sand with the Lenticle (Layered Sandy Soil). Water. 2021; 13(10):1379. https://doi.org/10.3390/w13101379
Chicago/Turabian StyleJing, Xiaofei, Changshu Pan, Yulong Chen, Xiangfu Li, Wensong Wang, and Xu Hu. 2021. "Improvement Effect of Reticular Glass Fibers on the Mechanical Properties of Tailings Sand with the Lenticle (Layered Sandy Soil)" Water 13, no. 10: 1379. https://doi.org/10.3390/w13101379