
Quantifying the Contribution of Agricultural and Urban Non-Point Source Pollutant Loads in Watershed with Urban Agglomeration


1
CAS Key Laboratory of Forest Ecology and Management, Institute of Applied Ecology, Chinese Academy of Sciences, Shenyang 110016, China
2
College of Resources and Environment, University of Chinese Academy of Sciences, Beijing 100049, China
3
Affairs Service Center of Natural Resources of Liaoning Province, Shenyang 110032, China
*
Authors to whom correspondence should be addressed.
Water 2021, 13(10), 1385; https://doi.org/10.3390/w13101385
Submission received: 16 March 2021
/
Revised: 6 May 2021
/
Accepted: 7 May 2021
/
Published: 16 May 2021
Abstract
:Urban agglomeration is a new characteristic of the Chinese urbanization process, and most of the urban agglomeration is located in the same watershed. Thus, urban non-point source (NPS) pollution, especially the characteristic pollutants in urban areas, aggravates NPS pollution at the watershed scale. Many agricultural studies have been performed at the watershed scale; however, few studies have provided a study framework for estimating the urban NPS pollution in an urban catchment. In this study, an integrated approach for estimating agricultural and urban NPS pollution in an urban agglomeration watershed was proposed by coupling the Soil and Water Assessment Tool (SWAT), the event mean concentration (EMC) method and the Storm Water Management Model (SWMM). The Hun-Taizi River watershed, which contains a typical urban agglomeration and is located in northeastern China, was chosen as the study case. The results indicated that the per unit areas of total nitrogen (TN) and total phosphorus (TP) in the built-up area simulated by the EMC method were 11.9% and 23 times higher than the values simulated by the SWAT. The SWAT greatly underestimated the nutrient yield in the built-up area. This integrated method could provide guidance for water environment management plans considering agricultural and urban NPS pollution in an urban catchment.
1. Introduction
Point source pollution and non-point source (NPS) pollution have been identified as key triggers of deteriorating water quality. In recent decades, point source pollution has been fairly controlled [1,2,3], while NPS pollution has been recognized as a critical cause of water quality degradation [4]. Agricultural and urban NPS pollution are the two main sources of NPS pollution [5]. Agricultural NPS pollution is a major reason for eutrophication of streams and lakes, contributing up to 50% of the total nitrogen (TN) and total phosphorus (TP) in China [6,7], likely due to excessive pesticide and fertilizer application [8,9]. In 2018, a total of 59% of the Chinese mainland population lived in urban areas, and the proportion is expected to increase to 80% by 2050 [10]. China has the highest population in the world and has experienced unprecedented urbanization over the last several decades; fourteen urban agglomerations have formed in recent years [11]. Rapid urbanization has led to extensive land use changes [12], converting natural land to diverse urban impervious surfaces such as roofs and roads [13,14]. The increasing proportion of impervious surfaces can dramatically alter the urban hydrology cycle by decreasing interception, storage, and infiltration as well as increasing volumes and peak flows [15,16,17]. Excessive runoff volume coupled with increased peak flow can easily wash accumulated dust off impervious urban surfaces and transport it into receiving water bodies, which can seriously affect public health and threaten environmental quality [18,19]. In addition, most of the urban agglomerations are located in the same watershed. The superimposed effects of agricultural activities and urbanization in the urban agglomeration watershed causes more serious NPS pollution, and the load amounts and pollution process need to be considered.
Field monitoring and model prediction are two major approaches adopted to quantitatively estimate NPS pollutant loads [8]. The event mean concentration (EMC) method has been widely used with a large amount of observed data to calculate NPS pollution loads from different underlying surfaces in urban areas [1,20,21]. Field monitoring data for NPS pollutant loads estimation are accurate, however, they are costly in terms of manpower and can be ineffective. With the development of computer technology, many distributed watershed models have been developed [8,20], such as the Annualized Agricultural Non-point Source (AnnAGNPS) [21], Better Assessment Science Integrating Point and Non-point Sources (BASINS) [22], Hydrological Simulation Program Fortran (HSPF) [23], the Storm Water Management Model (SWMM) [24] and the Soil and Water Assessment Tool (SWAT) [25]. The SWAT and SWMM have been adopted to simulate agricultural and urban NPS pollution worldwide [8,26,27,28,29]. However, the SWAT has limited capability in simulating the NPS pollution loads in built-up areas because the model regards the built-up area as one land use category, ignoring the process and characteristics of urban NPS pollution [30,31]. The SWMM is the most popular model for runoff analysis at a small city or community scale, with areas of several hectares to tens of square kilometers, but it is not suitable for a large urban catchment [28,32,33]. Therefore, an integrated, accurate method has become a topic of increasing interest for estimating agricultural and urban NPS pollution in an urban catchment.
In recent years, agricultural NPS pollution studies have mainly focused on the impact of best management practices, land use or climate changes on NPS pollution [32,34]. With rapid urbanization, researchers have become interested in urban NPS pollution. Most urban NPS pollution study cases are primarily focused on pollutant buildup and washoff processes, the first flush effect, pollutant concentrations, NPS control and the total pollutant mass in small cities or communities during rainfall events [29,33,35,36]. In urban NPS pollution studies, little attention has been paid to large watersheds, especially in an urban agglomeration watershed [33,37]. Urban areas have the most intensive human activities, resulting in characteristic pollutants in urban NPS pollution such as chemical oxygen demand (COD), biochemical oxygen demand (BOD), and heavy metals (Cd, Ni, Pb, Cr, Cu and Zn) compared to agricultural NPS pollution, which mainly contains nitrogen and phosphorus [19,38,39]. Many agricultural and urban NPS pollution studies have been performed separately, leaving a need for an integrated framework to quantitively calculate agricultural and urban NPS pollutant loads in an urban agglomeration watershed.
The Hun-Taizi River watershed, an important grain-producing area located in the Central Liaoning Urban Agglomeration, was chosen as a case study to estimate the impact of agriculture and urbanization on NPS pollution loads. The objective of this study is to propose an integrated framework for estimating average annual agricultural and urban NPS pollution in an urban agglomeration watershed. This integrated method can aid researchers in estimating agricultural and urban NPS pollutant loads in an urban catchment, and can also help watershed planners develop effective management strategies to mitigate NPS pollution.
2. Material and Methods
2.1. Study Area
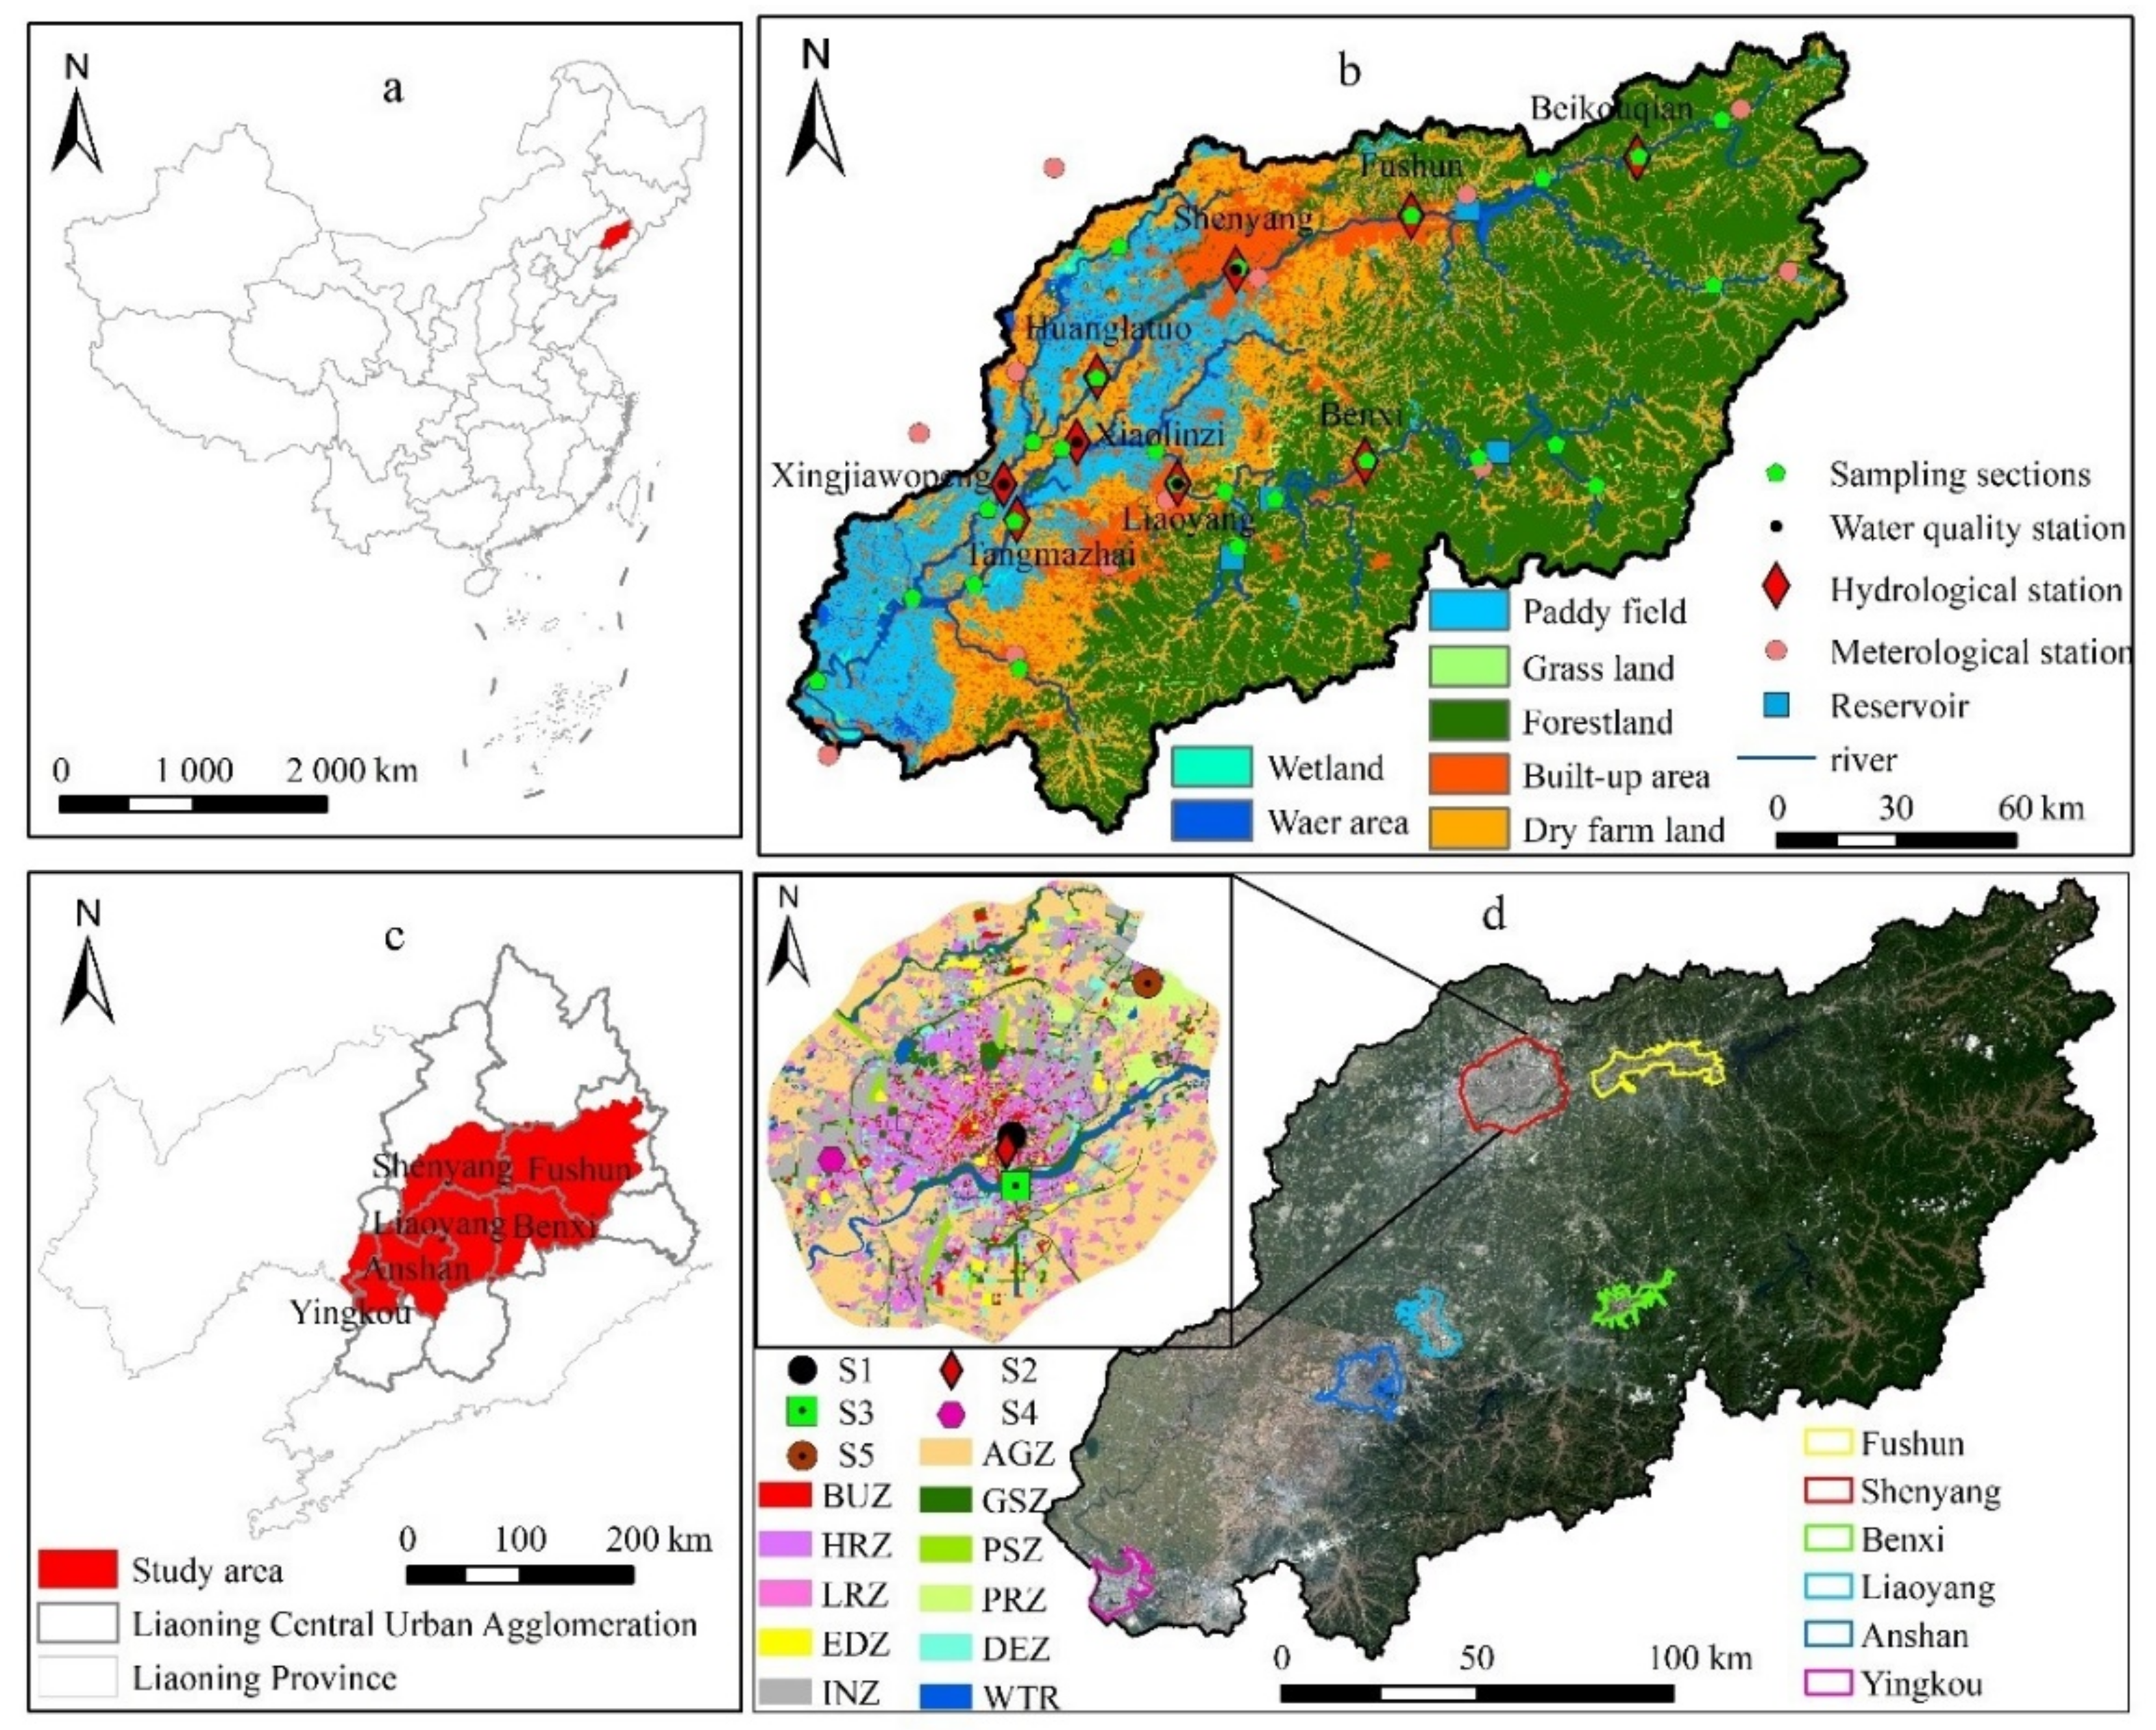
The Hun-Taizi River watershed is in Liaoning Province in northeast China and covers approximately 2.73 × 10⁴ km2 between the longitudes of 121°57′ and 125°20′ E and the latitudes of 40°27′ to 42°19′ N (Figure 1a,c). The watershed is composed of the Hun River, Taizi River and Daliao River, which flow mainly from northeast to southwest and enter the Bohai Sea in Yingkou city. It has a temperate continental monsoon climate. The average annual temperature from 1989–2018, in the study area was 8.7 °C, and the average annual precipitation was 700 mm. Approximately 70% of the precipitation in the watershed mostly occurs from June to September during monsoons. Forestlands are located mainly in the northeastern and southeastern regions and cover approximately 45% of the study area. Vegetation is dominated by mixed broad-leaved and coniferous forests, while dry farmland and paddy fields in the southwest cover 35% of the region (Figure 1b). The northeastern part of the watershed consists of low hills, while the middle and western parts are mainly alluvial plains. There are four main reservoirs (Dahuofang, Guanyinge, Shenwo and Tang), which are the most important drinking and irrigation water sources for Liaoning Province, with a total storage capacity of 6.9 × 10⁹ m3.
The study area covers most of the Central Liaoning Urban Agglomeration, which is concentrated in heavy industrial areas including six cities (Fushun, Shenyang, Benxi, Liaoyang, Anshan, and Yingkou) (Figure 1d). The urbanization rate of the study area was 57.84%, with urban and rural populations of 1.33 × 10⁷ and 0.82 × 10⁷, respectively, in 2019. The agricultural crop-sown area was 1.4 × 10⁴ km2, the total grain output was 8.48 × 10⁶ t, and a large gross domestic product (GDP) was produced, which accounted for 47.3% of Liaoning Province in 2019 [40]. In recent years, urban sprawl has accelerated in the Hun-Taizi River watershed due to the policy of “Revitalization of Old Industrial Bases in Northeast China” proposed in 2003. Owing to rapid urban development, impervious surfaces are increasing significantly.
2.2. Sampling and Data Collection
2.2.1. Sampling and Analyses
- 1.
- Water quality sampling in the Hun-Taizi River watershed
A total of 25 water quality sections were selected in the outlet of the main stream of each sub-basin, which was divided by the SWAT (Figure 1b). A total of 225 effective water samples were collected separately at each monitoring section by three sampling events with two or three parallel samplings in July and October 2018 and in April 2019. To avoid the impact of rainfall on water quality, three sampling events were conducted on sunny days. The concentrations of TN and TP were tested within 24 h of collection using alkaline potassium persulfate digestion-UV spectrophotometric and ammonium molybdate spectrophotometric methods, respectively [8,40,41].
- 2.
- Rainfall runoff samplings in different urban functional zones
The six cities in the study area are all cities with heavy industry located in the same watershed and climate zone. Five urban functional zones of Shenyang city, including the business zone (BUZ), educational zone (EDZ), high density residential zone (HRZ), industrial zone (INZ) and preservation zone (PRZ), were selected to monitor rainfall runoff (Figure 1d), which is sufficient to be representative of the whole study area. Runoff samples from the underlying surfaces of roofs, roads and grasslands were collected. Roof runoff samples were collected from building drainpipe outlets. Road runoff samples were collected at rain grates. Grassland runoff samples were collected at the outlets of sloping lawns. All rainfall runoff samples were collected using 500 mL polyethylene bottles by researchers with extensive sampling experience. Once runoff was produced, samples were collected. Once rainfall runoff started, samples were collected every 10 min for the first 60 min, every 30 min during a period of 60 to 180 min, and then every 60 min beyond 180 min until the runoff disappeared [19]. A total of 218 samples were collected during three rainfall events (8 July 2018, 14 August 2018 and 2 September 2018) in the five different functional zones in 2018 (Table S1), and 157 samples were collected during five rainfall events in 2012 [19]. The rainfall depth throughout the events was recorded using an automatic gauge with 0.25 mm/tip (RainLog 2.0).
All rainfall runoff samples were tested in the laboratory for total suspended solids (TSS), COD, TN, TP and six typical heavy metals (Pb, Cd, Cr, Cu, Ni, and Zn) within 24 h. The procedure outlined in the Standard Methods of the Examination of Water and Wastewater was adopted to measure the TSS concentrations [38]. The potassium dichromate method was used to test COD [35], and inductively coupled plasma-atomic emission spectroscopy (PerkinElmer, Shelton, Connecticut, USA, ICP-MS NexION 350X) was used to test six heavy metals [42].
2.2.2. Data Collection
- 1.
- Geographic dataset
The description of the geographic dataset (topographic data, land use and soil map) used to establish the SWAT is shown in Table S2. The digital elevation model (DEM) with 30 m resolution and a soil map with a 1:50,000 scale were collected. The land use map in 2017 was interpreted with Landsat Operational Land Imager (OLI) images. Seven land use categories were classified with an accuracy of 89.3% compared to 270 field survey points in 2017, including built-up area, water area, grassland, forestland, dry farm land, wetland and paddy field (Figure 1c).
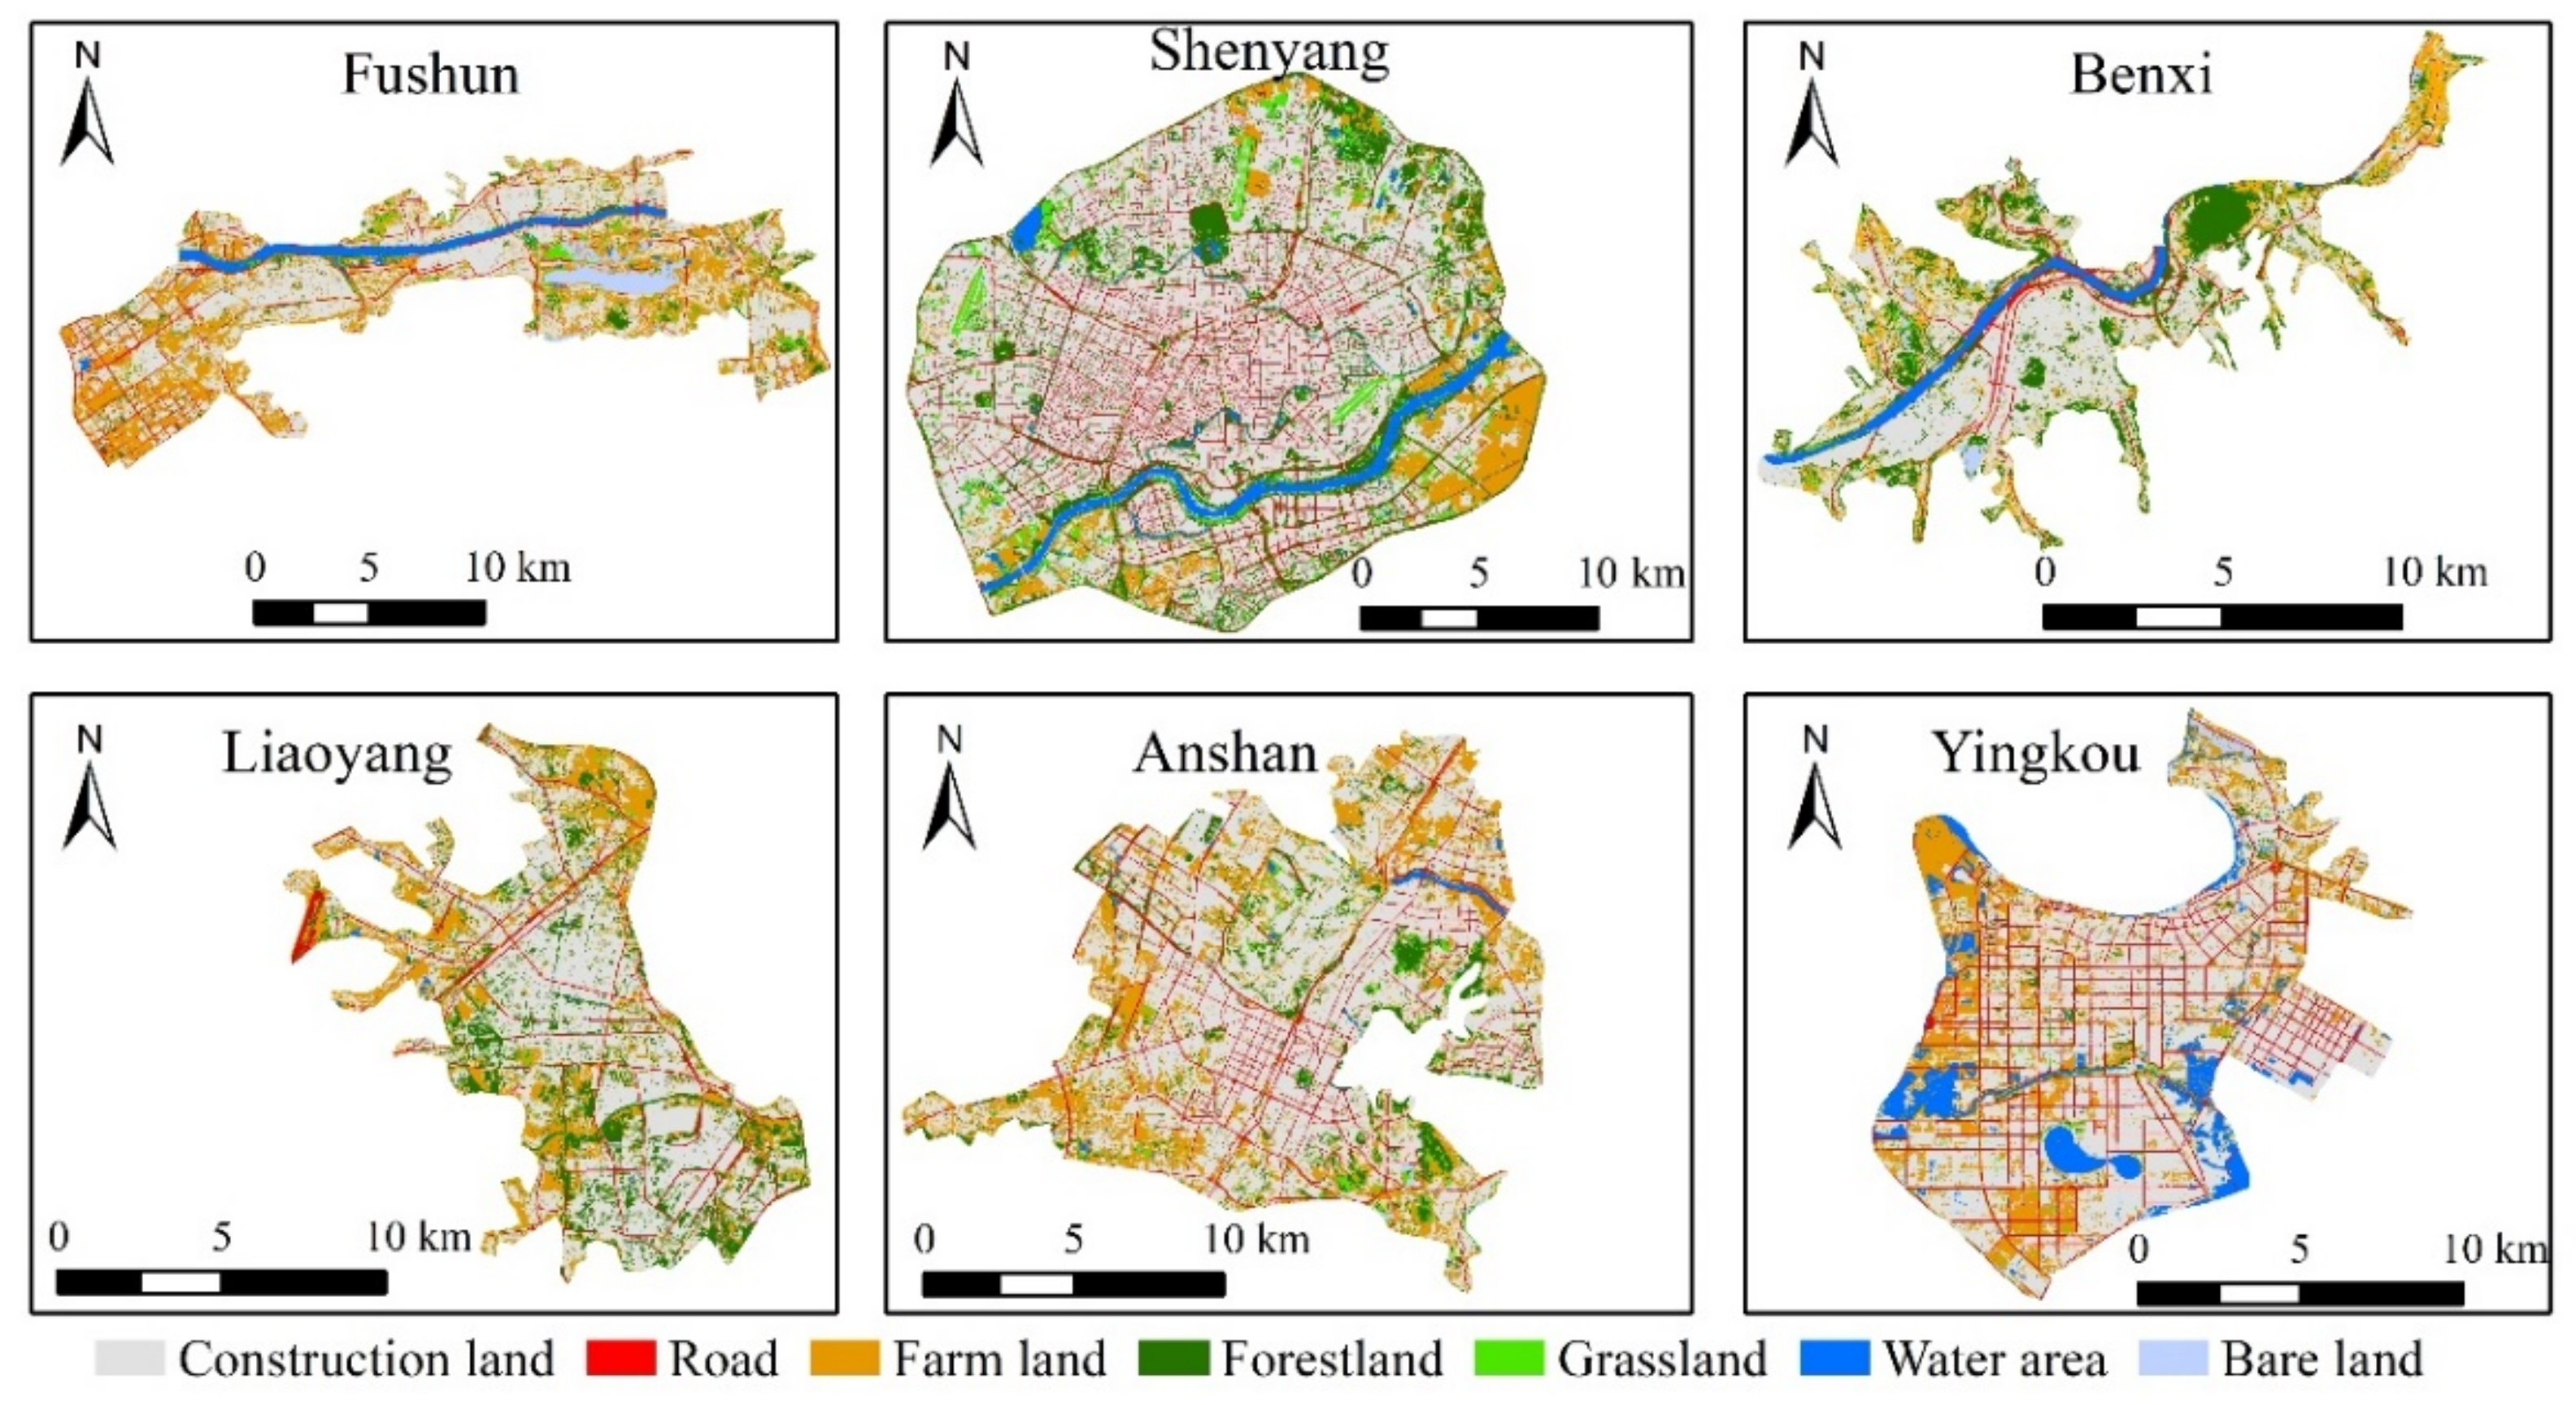
Landsat 8 OLI images in 2017 were used to manually interpret the built-up area of Shenyang, Fushun, Benxi, Liaoyang, Anshan and Yingkou (Figure 1d). The land use map of the built-up area was interpreted based on the Sentinel 2 images in 2017 (10 m × 10 m), including construction land, road, grassland, forestland, farmland, water area and bare land (Figure 2). The accuracy of interpretation was 88.5% compared with 360 field survey points in 2017.
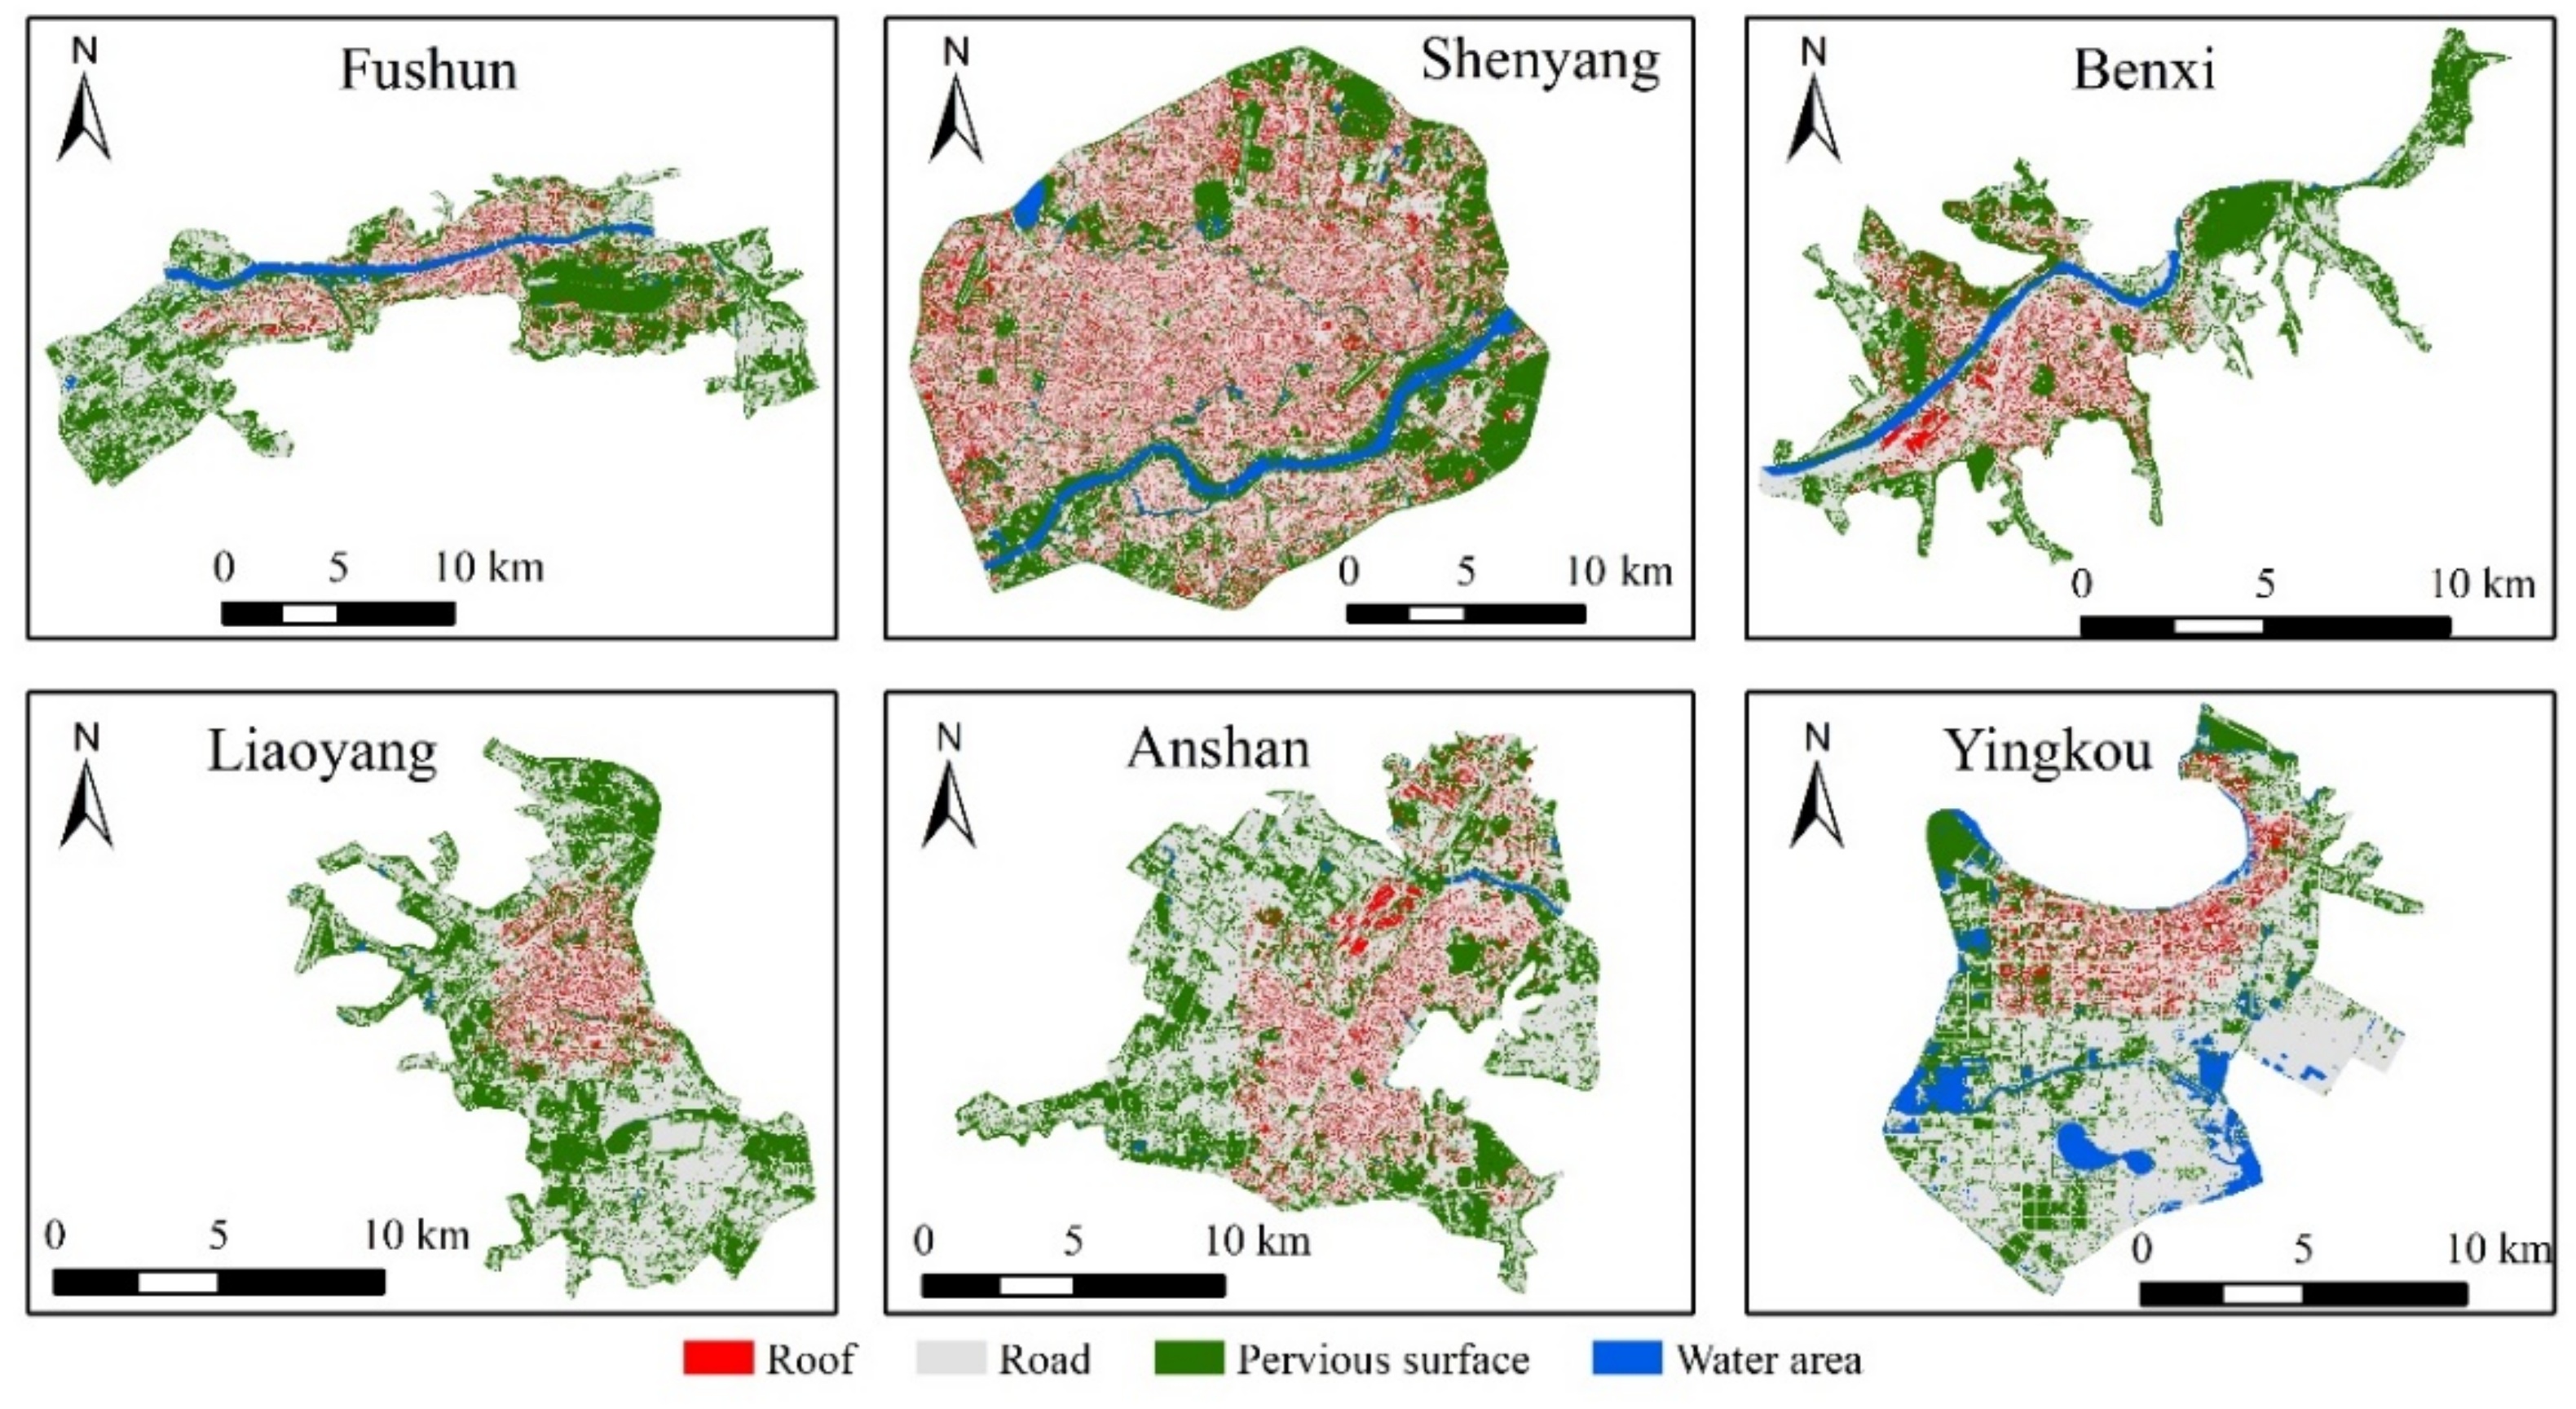
The roof dataset of the six cities was extracted from the QuickBird images (0.61 × 0.61 m), which was collected in 2013 using the software package Brista and updated in 2017 [39]. The land use map of the urban area in 2017 was updated by the roof map. For further analysis, the land use types were reclassified as roof, road (including road and other construction land), pervious surface (grassland, forestland, farmland and bare land) and water area (Figure 3).
- 2.
- Weather and hydrological dataset
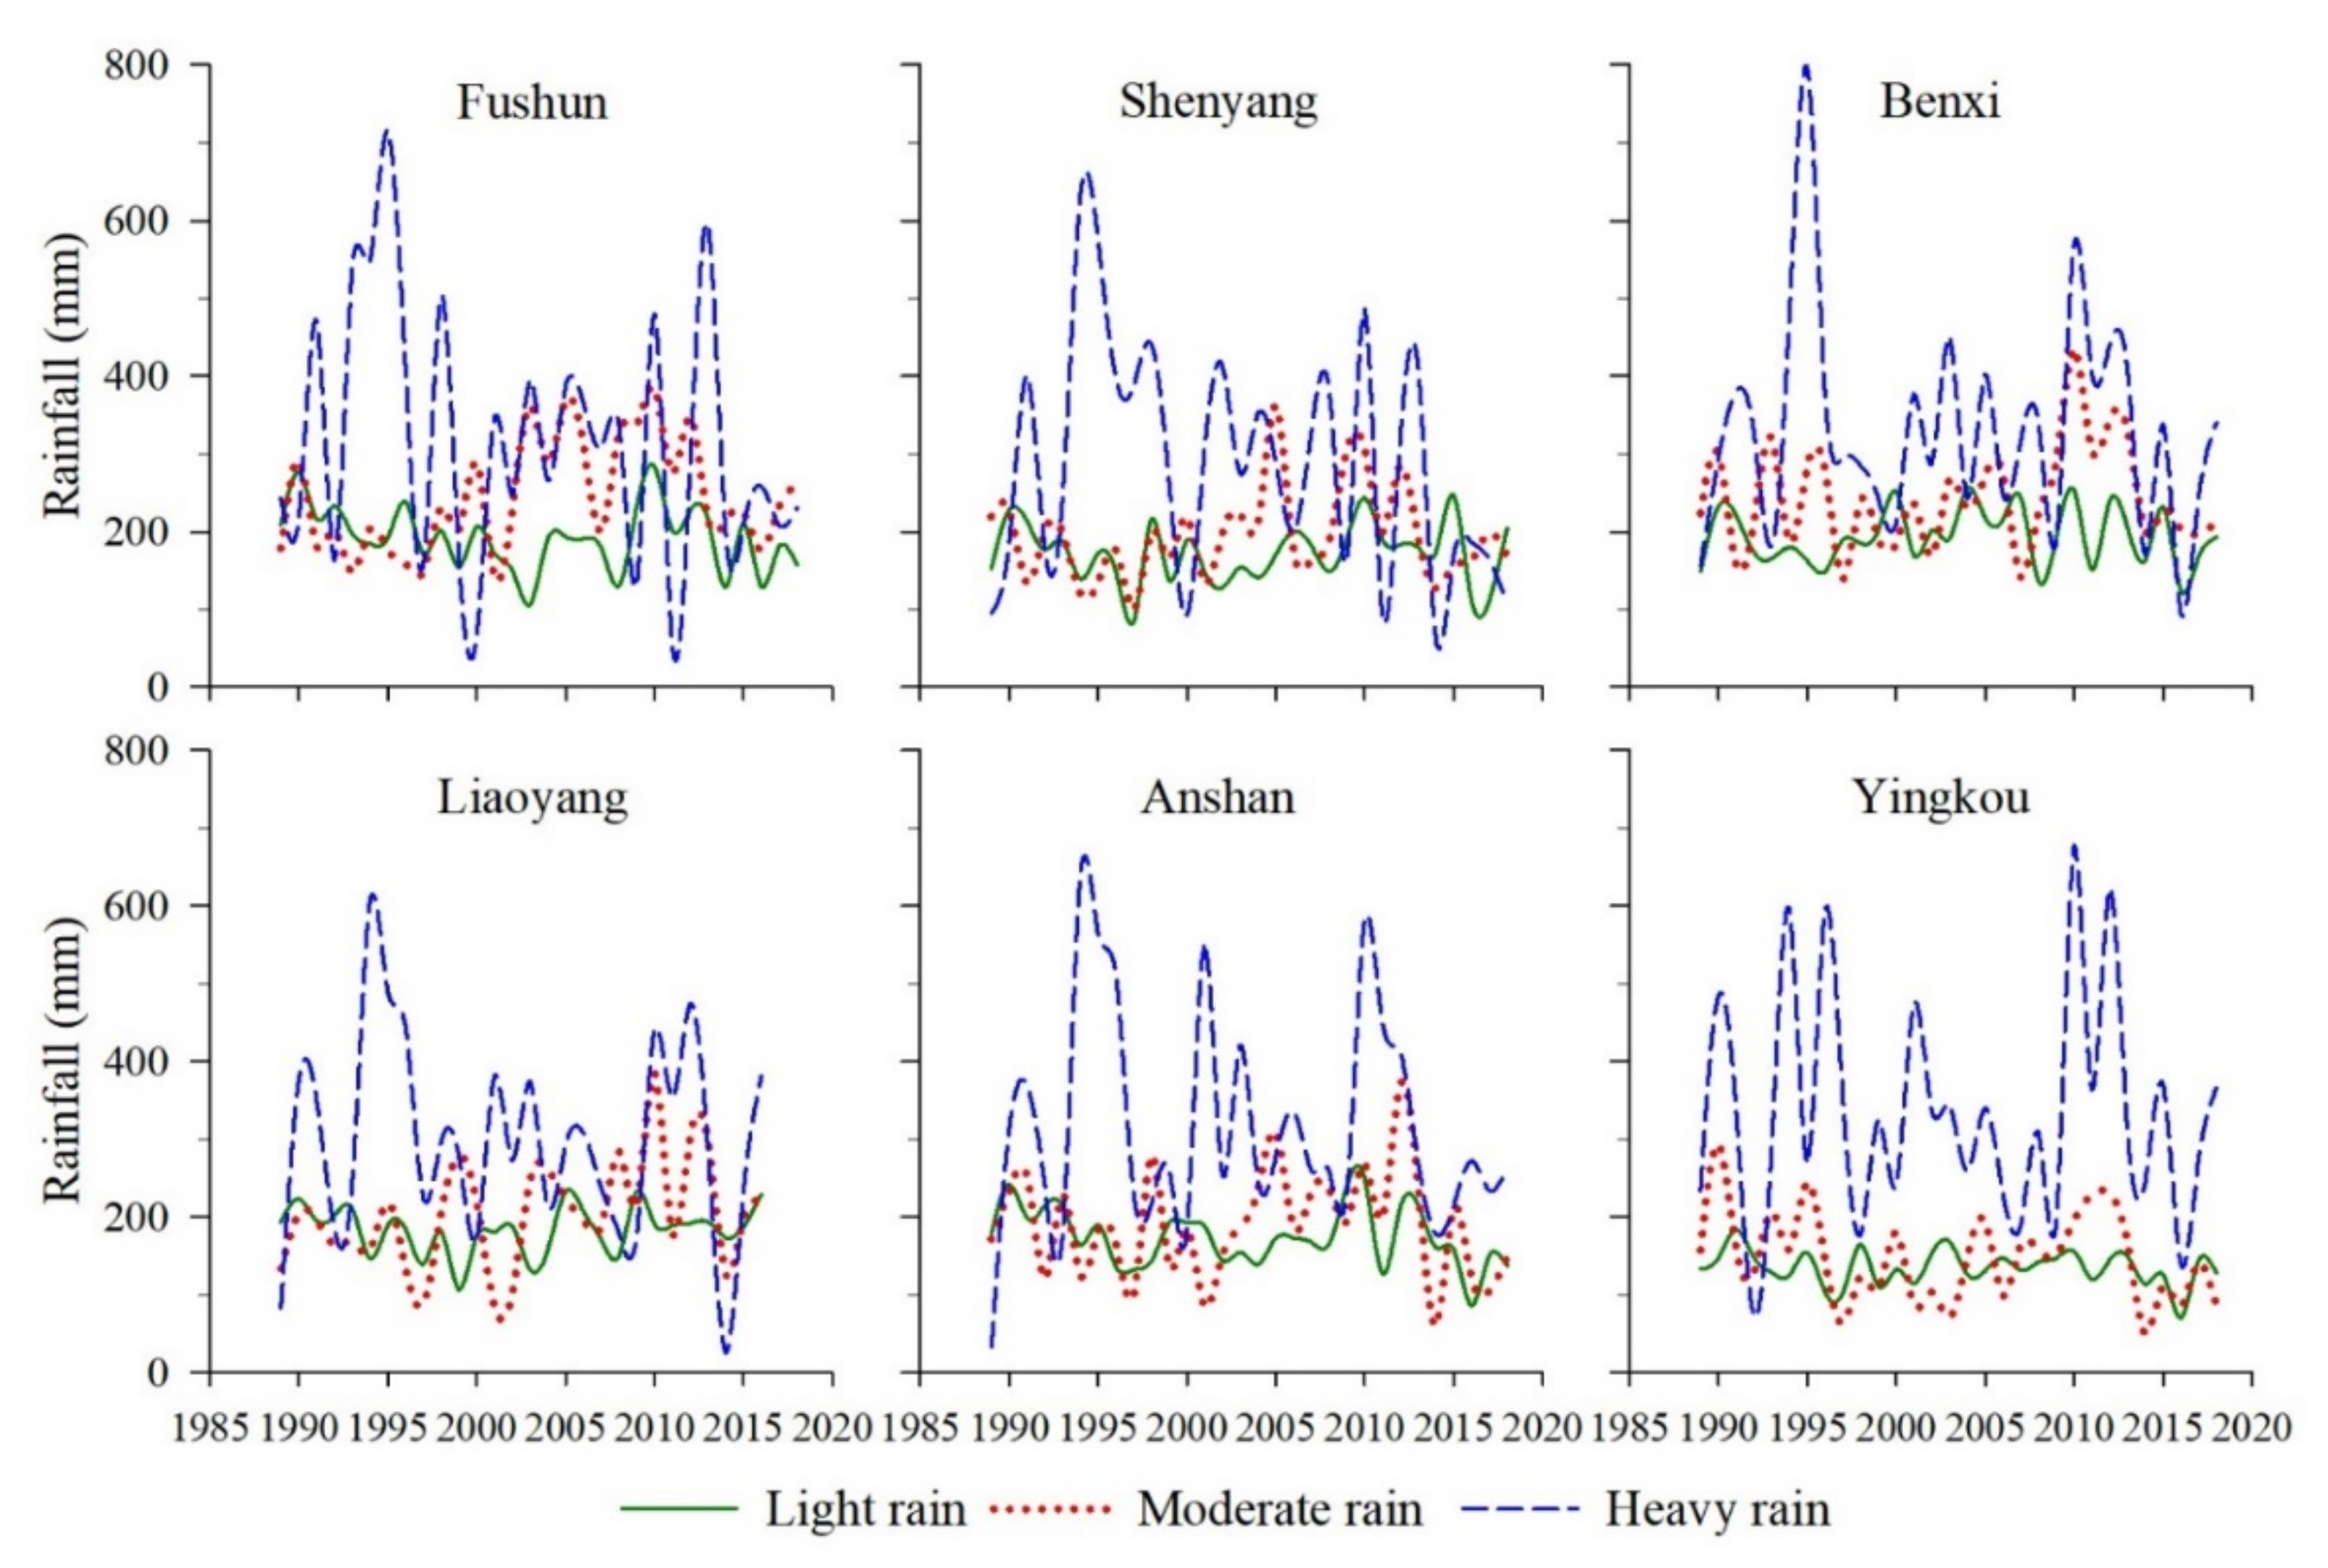
A detailed description of the weather and hydrological dataset used to establish the SWAT is shown in Table S2. The daily climate data used in the SWAT from 2001 to 2017 were collected from the China Meteorological Administration. The monthly hydrological data from 2001 to 2014 and water quality data from 2001 to 2005 were collected from the local government. The average annual precipitation of different rain intensities, which was used to estimate the urban NPS pollution, was calculated by the daily rainfall of the six cities during 1989–2018. The rain intensity was classified into light rain (0.1–9.9 mm), moderate rain (10–24.9 mm) and heavy rain (≥25 mm) based on the Grade of Precipitation (GB/T 28592-2012) (Figure 4).
2.3. Methodology
2.3.1. Agricultural NPS Pollution
2.3.2. Urban NPS Pollution
The average annual urban NPS pollution loads can be calculated as follows [49]:
where (t) is the average annual NPS pollution loading from different underlying surfaces and rain intensity during 1989–2018; (mg/L) is the mean EMC values of different underlying surface and rain intensity; (mm) is the average annual precipitation of different rain intensity during 1989–2018; is the runoff coefficient of roof (0.9), road (0.8) and pervious surfaces (0.15) [45]; (km2) is the area of roof, road and pervious surfaces; the is diverse underlying surfaces of roofs, roads and grassland; and is the different rain intensity of light rain, moderate rain and heavy rain.
The EMC values were used to calculate the average concentration of specific pollutants throughout the 8 rainfall events, including 3 rainfall events collected from different functional zones in 2018 and 5 from the EDZ in 2012. The average EMC values were used to represent the pollutant concentration for different rain intensities and underlying surfaces of the 6 cities. The EMC was computed as follows [33]:
where EMC (mg/L) is the event mean concentration; (mg) is the total mass load of a specific pollutant from different underlying surfaces during a storm event; (L) is the total runoff volume; (mg/L) is the concentration of a specific pollutant at time t; (m3/s) is the flow rate of stormwater runoff at time t; (min) is the total runoff time; and (min) is the time interval.
The SWMM, which was developed by the Environmental Protection Agency (EPA was chosen to simulate the urban NPS pollution loads in the absence of rainfall runoff samples of different rain intensities or underlying surfaces [46]. The SWMM has been extensively used in simulating hydrology and water quality in small urban areas [50]. Detailed descriptions of the SWMM can be found in the related literature [24,47].
2.3.3. Schematic of the Integrated Method Framework
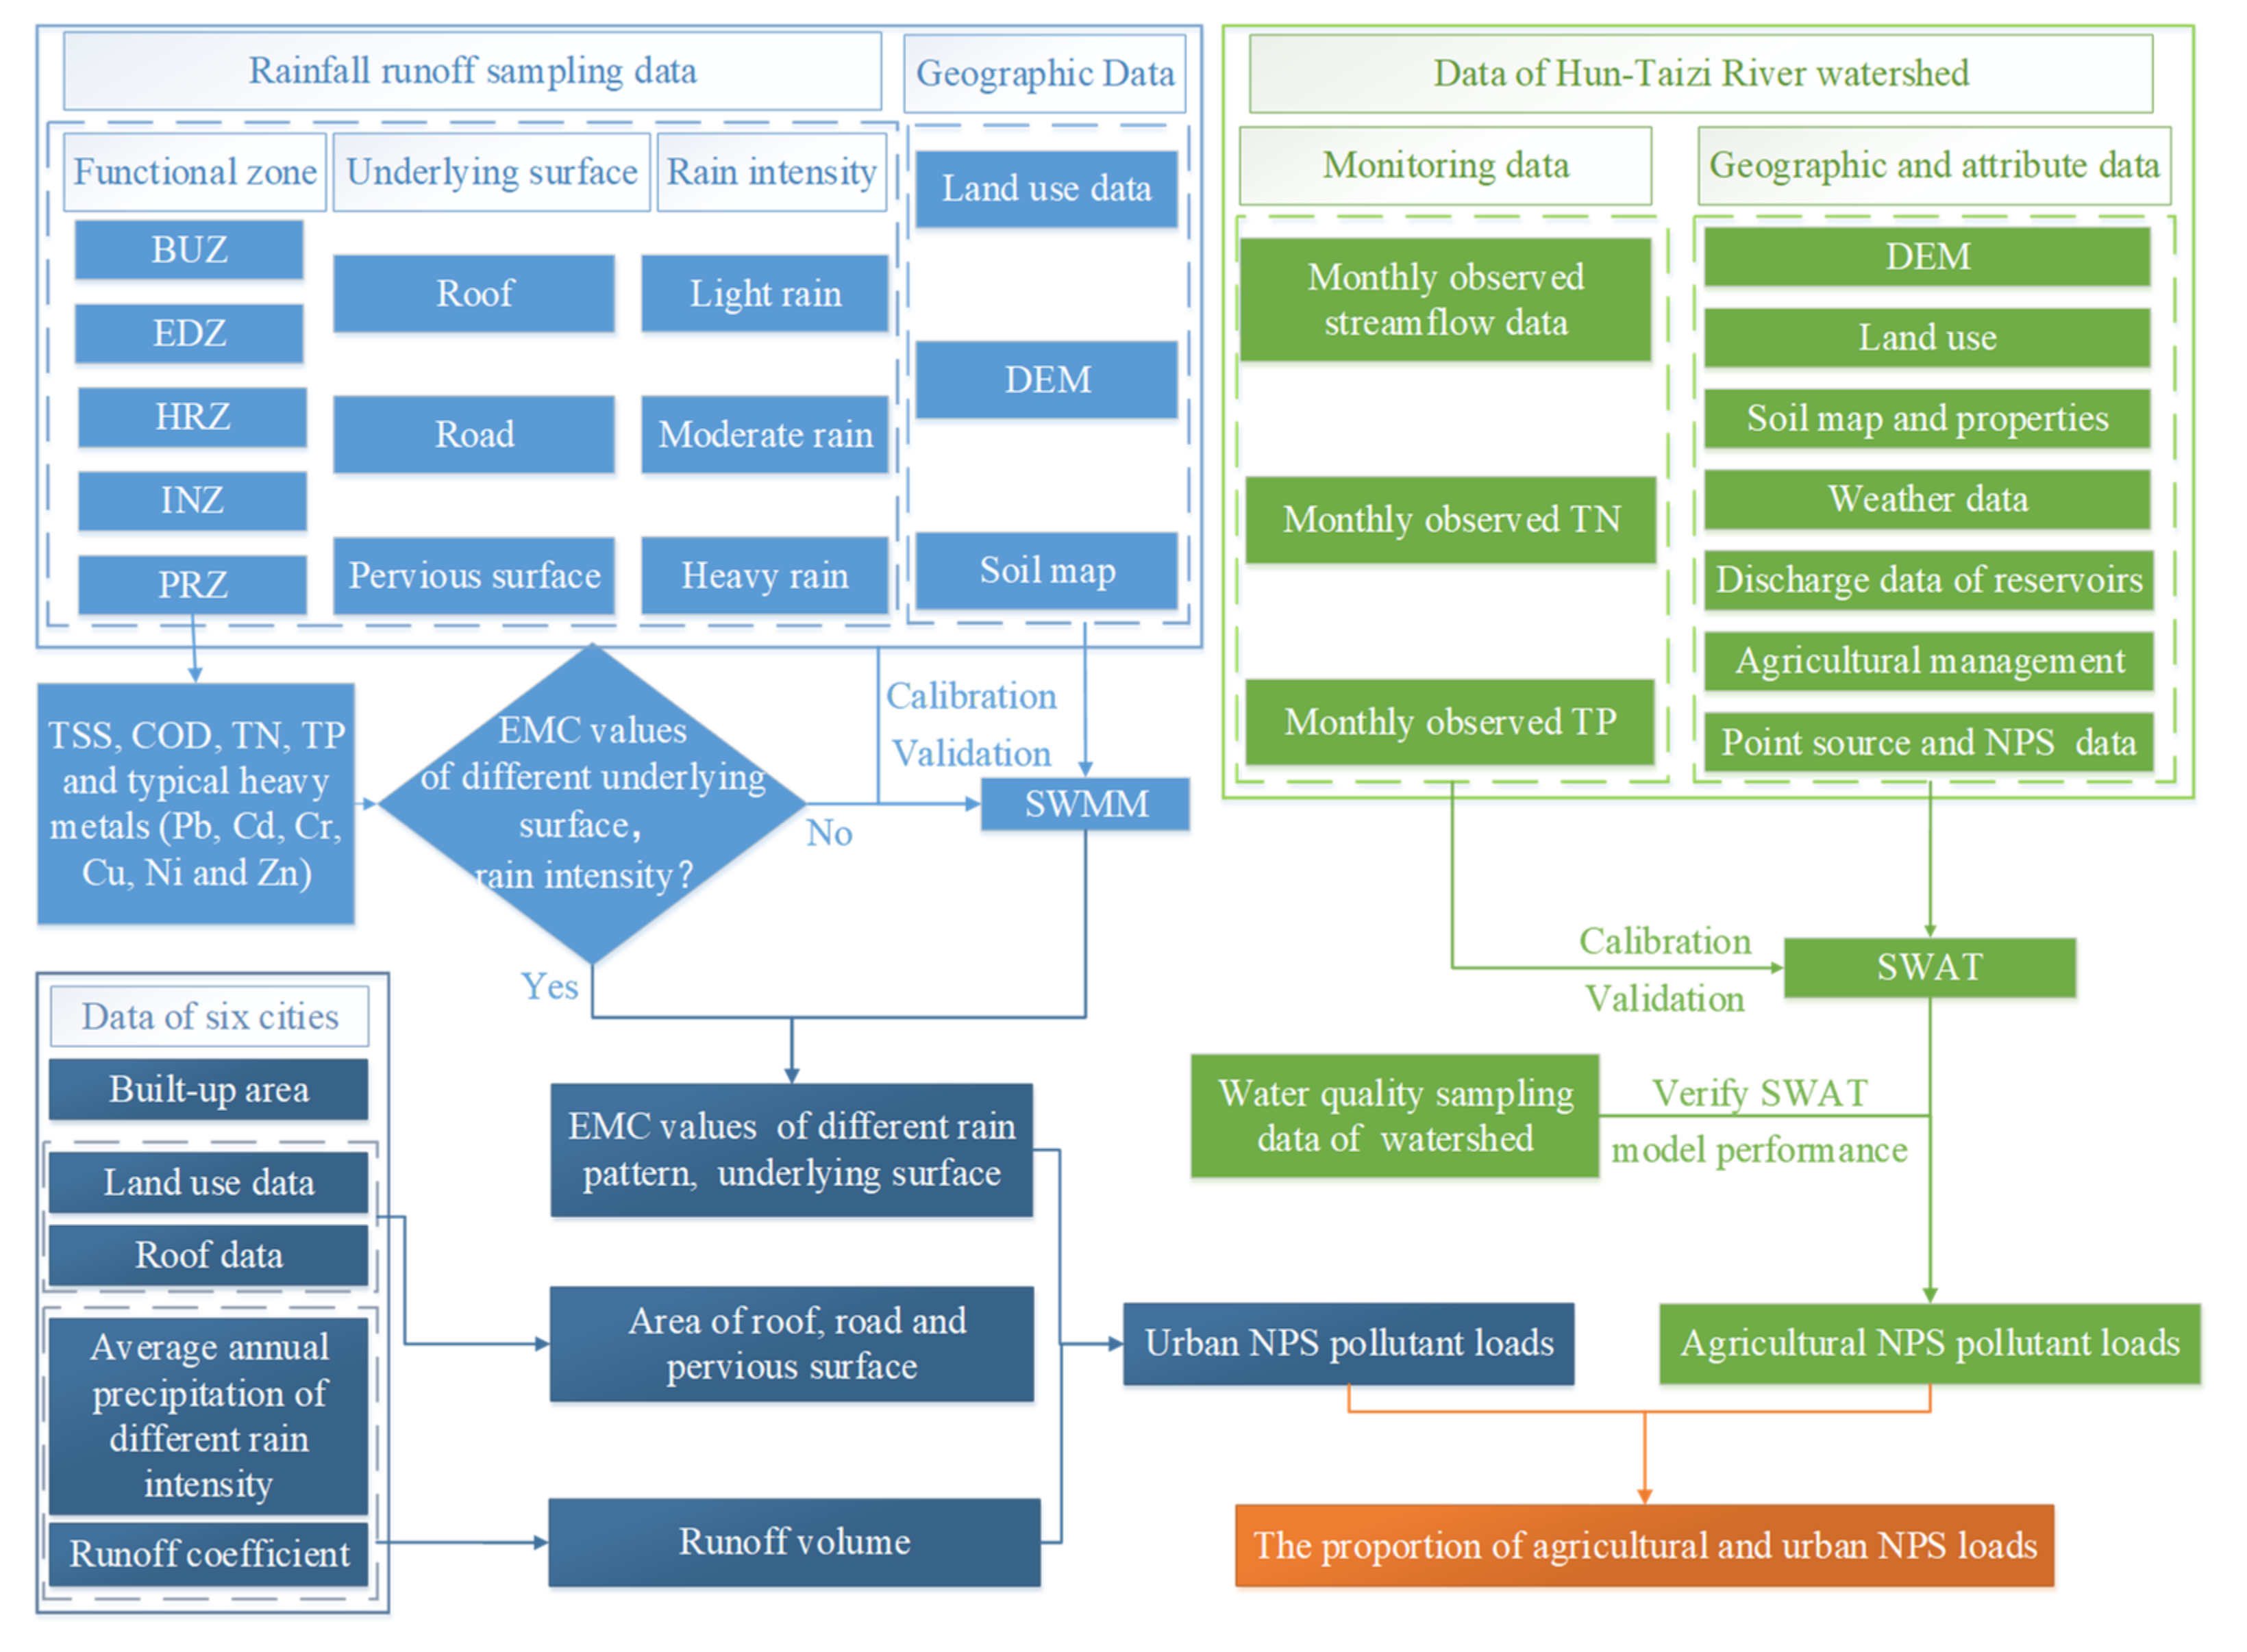
The integrated agricultural and urban NPS study framework was proposed based on the SWAT, the EMC method, and the SWMM (Figure 5). The data collected in the study area were used to quantify the agricultural NPS pollution loads. Geographic data and monthly monitoring data were adopted to establish, calibrate and validate the SWAT. Rainfall runoff sampling data from diverse underlying surfaces of different functional zones and rain intensities were used to calculate the EMC values of TSS, COD, TN, TP and heavy metals. In the absence of rainfall runoff sampling data, the geographic data and the rainfall runoff sampling data of the built-up area were used to establish, calibrate and validate the SWMM, which was adopted to simulate the NPS pollution loads. EMC values were calculated as the total load divided by the runoff volume. The urban NPS pollutant load was calculated using average EMC values of different underlying surfaces and rain intensities; the area of roof, road and pervious surfaces; the average annual precipitation of different rain patterns; and the runoff coefficient.
3. Results
3.1. Agricultural NPS Pollution in the Hun-Taizi River Watershed
It is essential to properly calibrate and validate the SWAT before implementation in the simulation of agricultural NPS pollution. The coefficient of determination (R2) and the Nash–Sutcliffe efficiency coefficient (ENS) were chosen as the criteria to evaluate the model’s performance [48]. The ranges of R2 and ENS for streamflow were 0.64–0.99 and 0.58–0.98, respectively, at the nine hydrological stations (Figure S1 and Table S3). The ranges of R2 and ENS for TN were 0.63–0.95 and 0.36–0.87, respectively, and for TP, these values were 0.66–0.96 and 0.55–0.9, respectively, at the four water quality stations (Figure S2 and Table S3). The calibrated and validated SWAT was able to successfully simulate agricultural NPS pollution loads.
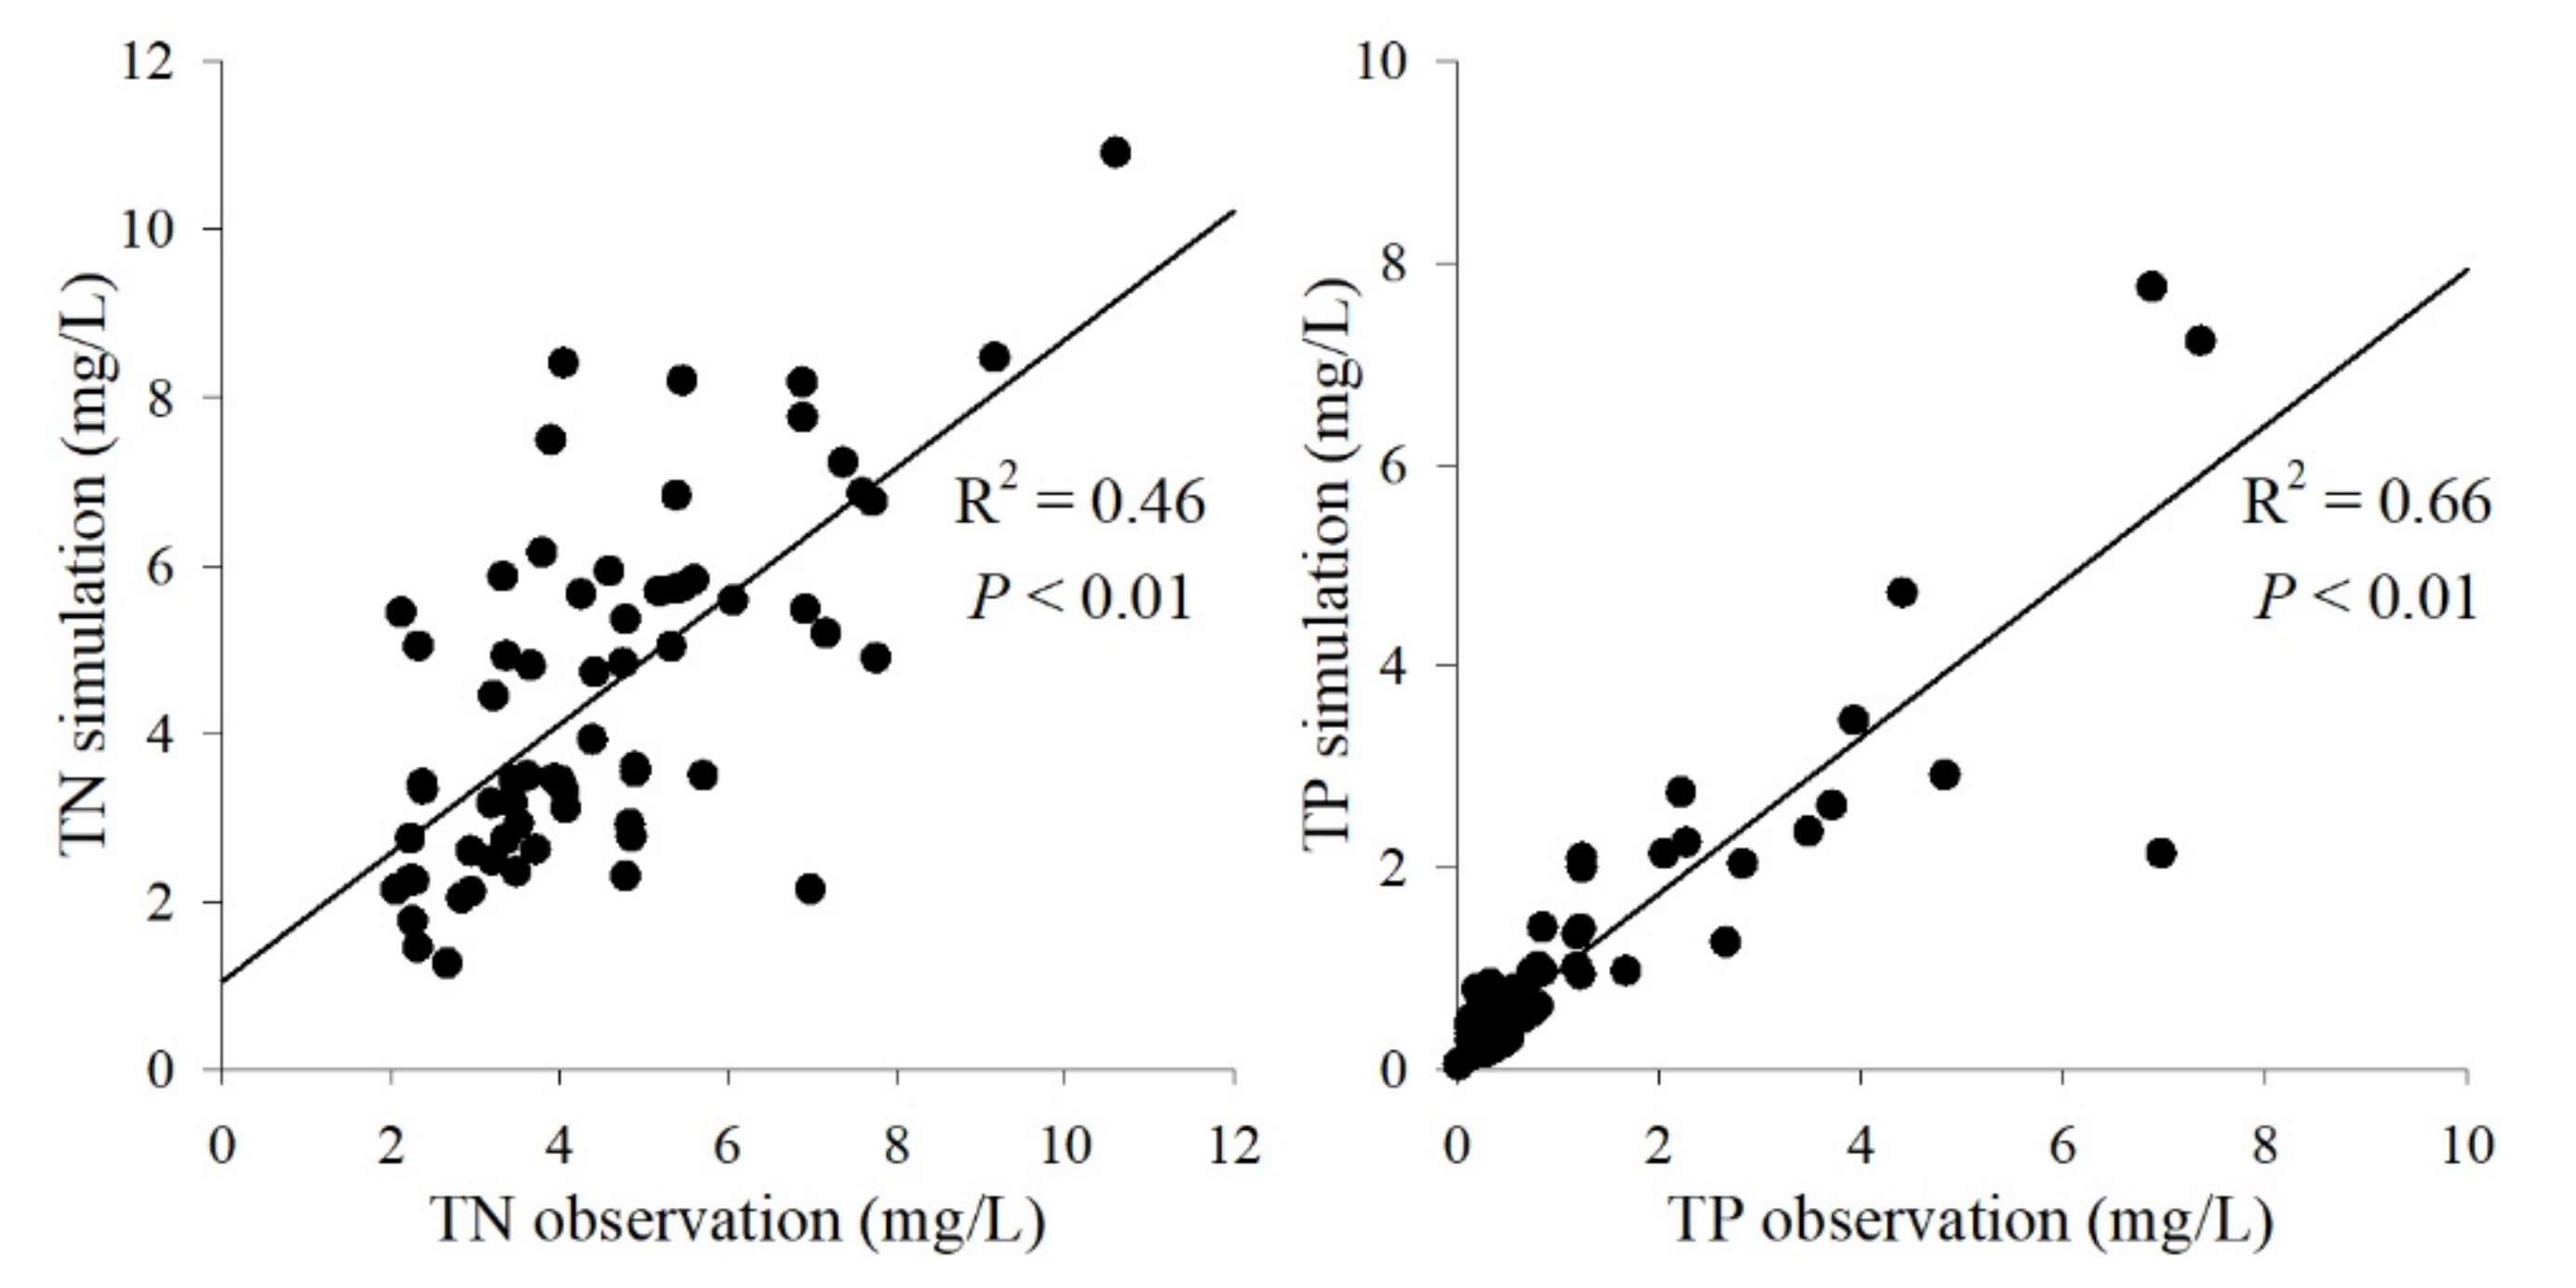
Water quality samples from the Hun-Taizi River watershed and the simulated concentrations of TN and TP were used to further verify the SWAT simulation results. The concentrations of TN and TP were calculated by the simulated TN and TP yield divided by the runoff volume at each monitoring section. The R2 values for TN and TP were 0.46 and 0.66 (p < 0.01), respectively (Figure 6). There was a significant correlation between the NPS pollutant concentration simulated by the SWAT and the observed data.
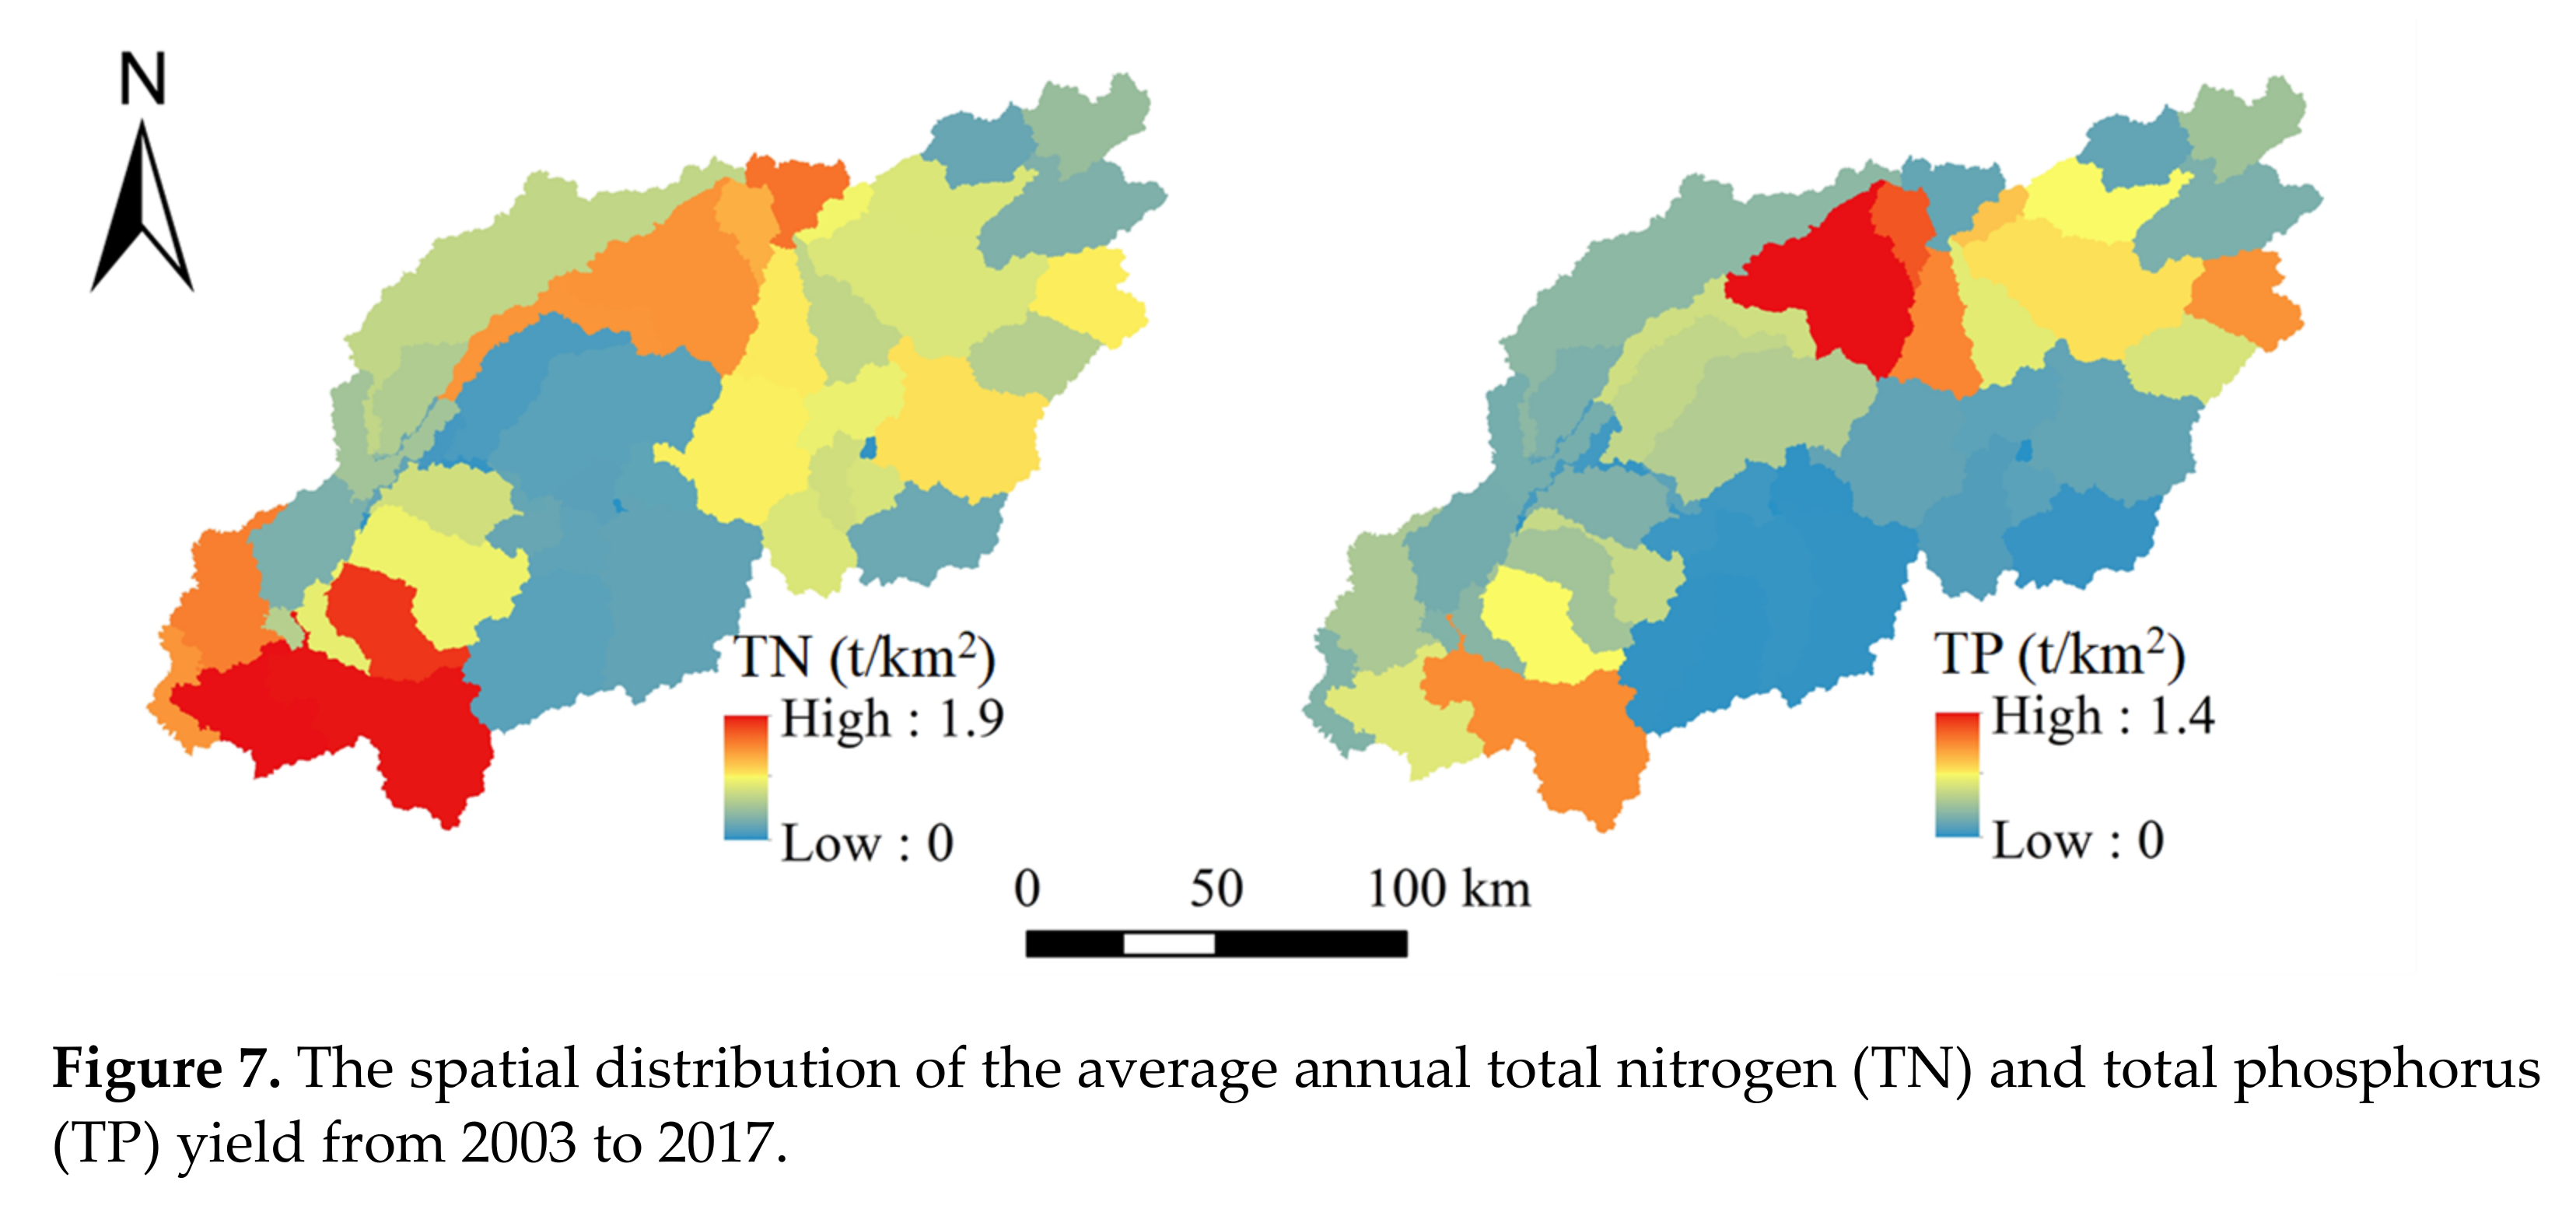
The average annual nutrient yield of TN was 54,200 t/y and that of TP was 6380 t/y during 2003–2017 in the Hun-Taizi River watershed. The per unit areas of agricultural land for TN and TP were 4.43 t/km2 and 0.99 t/km2, respectively. The spatial distributions of TN and TP were similar, while TN was more widely distributed in the upstream of the basin (Figure 7). Agricultural NPS pollution was higher in the midstream and downstream of the watershed. Compared with other studies, the average annual yields of TN and TP were 7315 and 867 t/y, respectively, in the Xin’anjiang catchment [51], which were much lower than those in this study. This may be because the agricultural land area in this study area was 9984.33 km2 and that in the Xin’anjiang catchment was 922.8 km2. The contribution of agricultural land to TN and TP was 5.47 and 0.58 t/km2 in the Xin’anjiang catchment [51] and 3.11 and 0.83 t/km2 in the Three Gorges watershed, respectively [52]. The average annual nutrient yields varied from basin to basin, while the contribution of the agricultural land was similar.
3.2. Characteristics of the EMC in Urban NPS Monitoring
The SWMM model parameters were adopted as shown in Tables S4 and S5. The rainfall runoff samples collected in 2012 and 2018 were used to calibrate and validate the SWMM. The values of R2 and ENS for the SWMM for different underlying surfaces in the 14 August 2018 rainfall event in the PRZ were 0.78–0.86. The ranges of R2 and ENS for the SWMM to simulate roof and road pollutant loads under heavy rain in different functional zones were 0.67–0.95. The R2 and ENS for the SWMM to simulate grassland pollutant loads under different rain intensities and different functional zones were 0.58–0.83. The calibrated and validated SWMM was able to successfully simulate urban NPS pollution loads.
Road runoff had higher EMC values of TP, TN, COD and TSS than roof runoff (Figure 8a–c). The concentrations of TP, TN and TSS in road runoff for light rain were 1.03, 3.50 and 373 mg/L, respectively, and the concentrations for heavy rain were 0.7, 2.25 and 422 mg/L, respectively, which exceeded class V of the Environmental Quality Standard for Surface Water (TP 0.4 mg/L and TN 2.0 mg/L) (GB3838-2002) and the second category of the Integrated Wastewater Discharge Standard (TSS 200 mg/L) (GB8978-1996). The EMC of TSS in road runoff for moderate rain was 1210 mg/L, which was approximately 5 times higher than the second category of the Integrated Wastewater Discharge Standard (GB8978-1996). The concentrations of TP in pervious surfaces for light rain, moderate rain and heavy rain were 0.54, 1.83 and 0.86 mg/L, respectively, which exceeded class V of the Environmental Quality Standard for Surface Water (GB3838-2002). This suggests that greenbelts, parks and residential green spaces in urban areas are other major sources of TP. The concentration of TN was also higher in roof runoff, which implies that nitrogen deposition is a source of TN.
Analyzing the EMC values for heavy metals under different rain intensities and underlying surfaces showed that road runoff had the highest concentration (Figure 8d–f). The concentrations of Pb and Cr in road runoff for light rain were 168 and 155 μg/L, respectively, and for moderate rain, they were 120 and 108 μg/L, respectively, which exceeded class V of the Environmental Quality Standard for Surface Water (100 μg/L) (GB3838-2002). The concentration of heavy metals for different rain intensities in descending order was light rain, moderate rain and heavy rain, which indicated that with increased rainfall, the runoff volume increased and further decreased the concentration of pollutants. This may be due to the first flush effect.
3.3. Urban NPS Pollutant Loads
The built-up areas of the six cities in descending order were Shenyang (455 km2), Anshan (191 km2), Fushun (179 km2), Yingkou (130 km2), Liaoyang (111 km2) and Benxi city (75 km2). The average annual rainfall levels of light rain, moderate rain and heavy rain were 176, 211 and 322 mm, respectively.
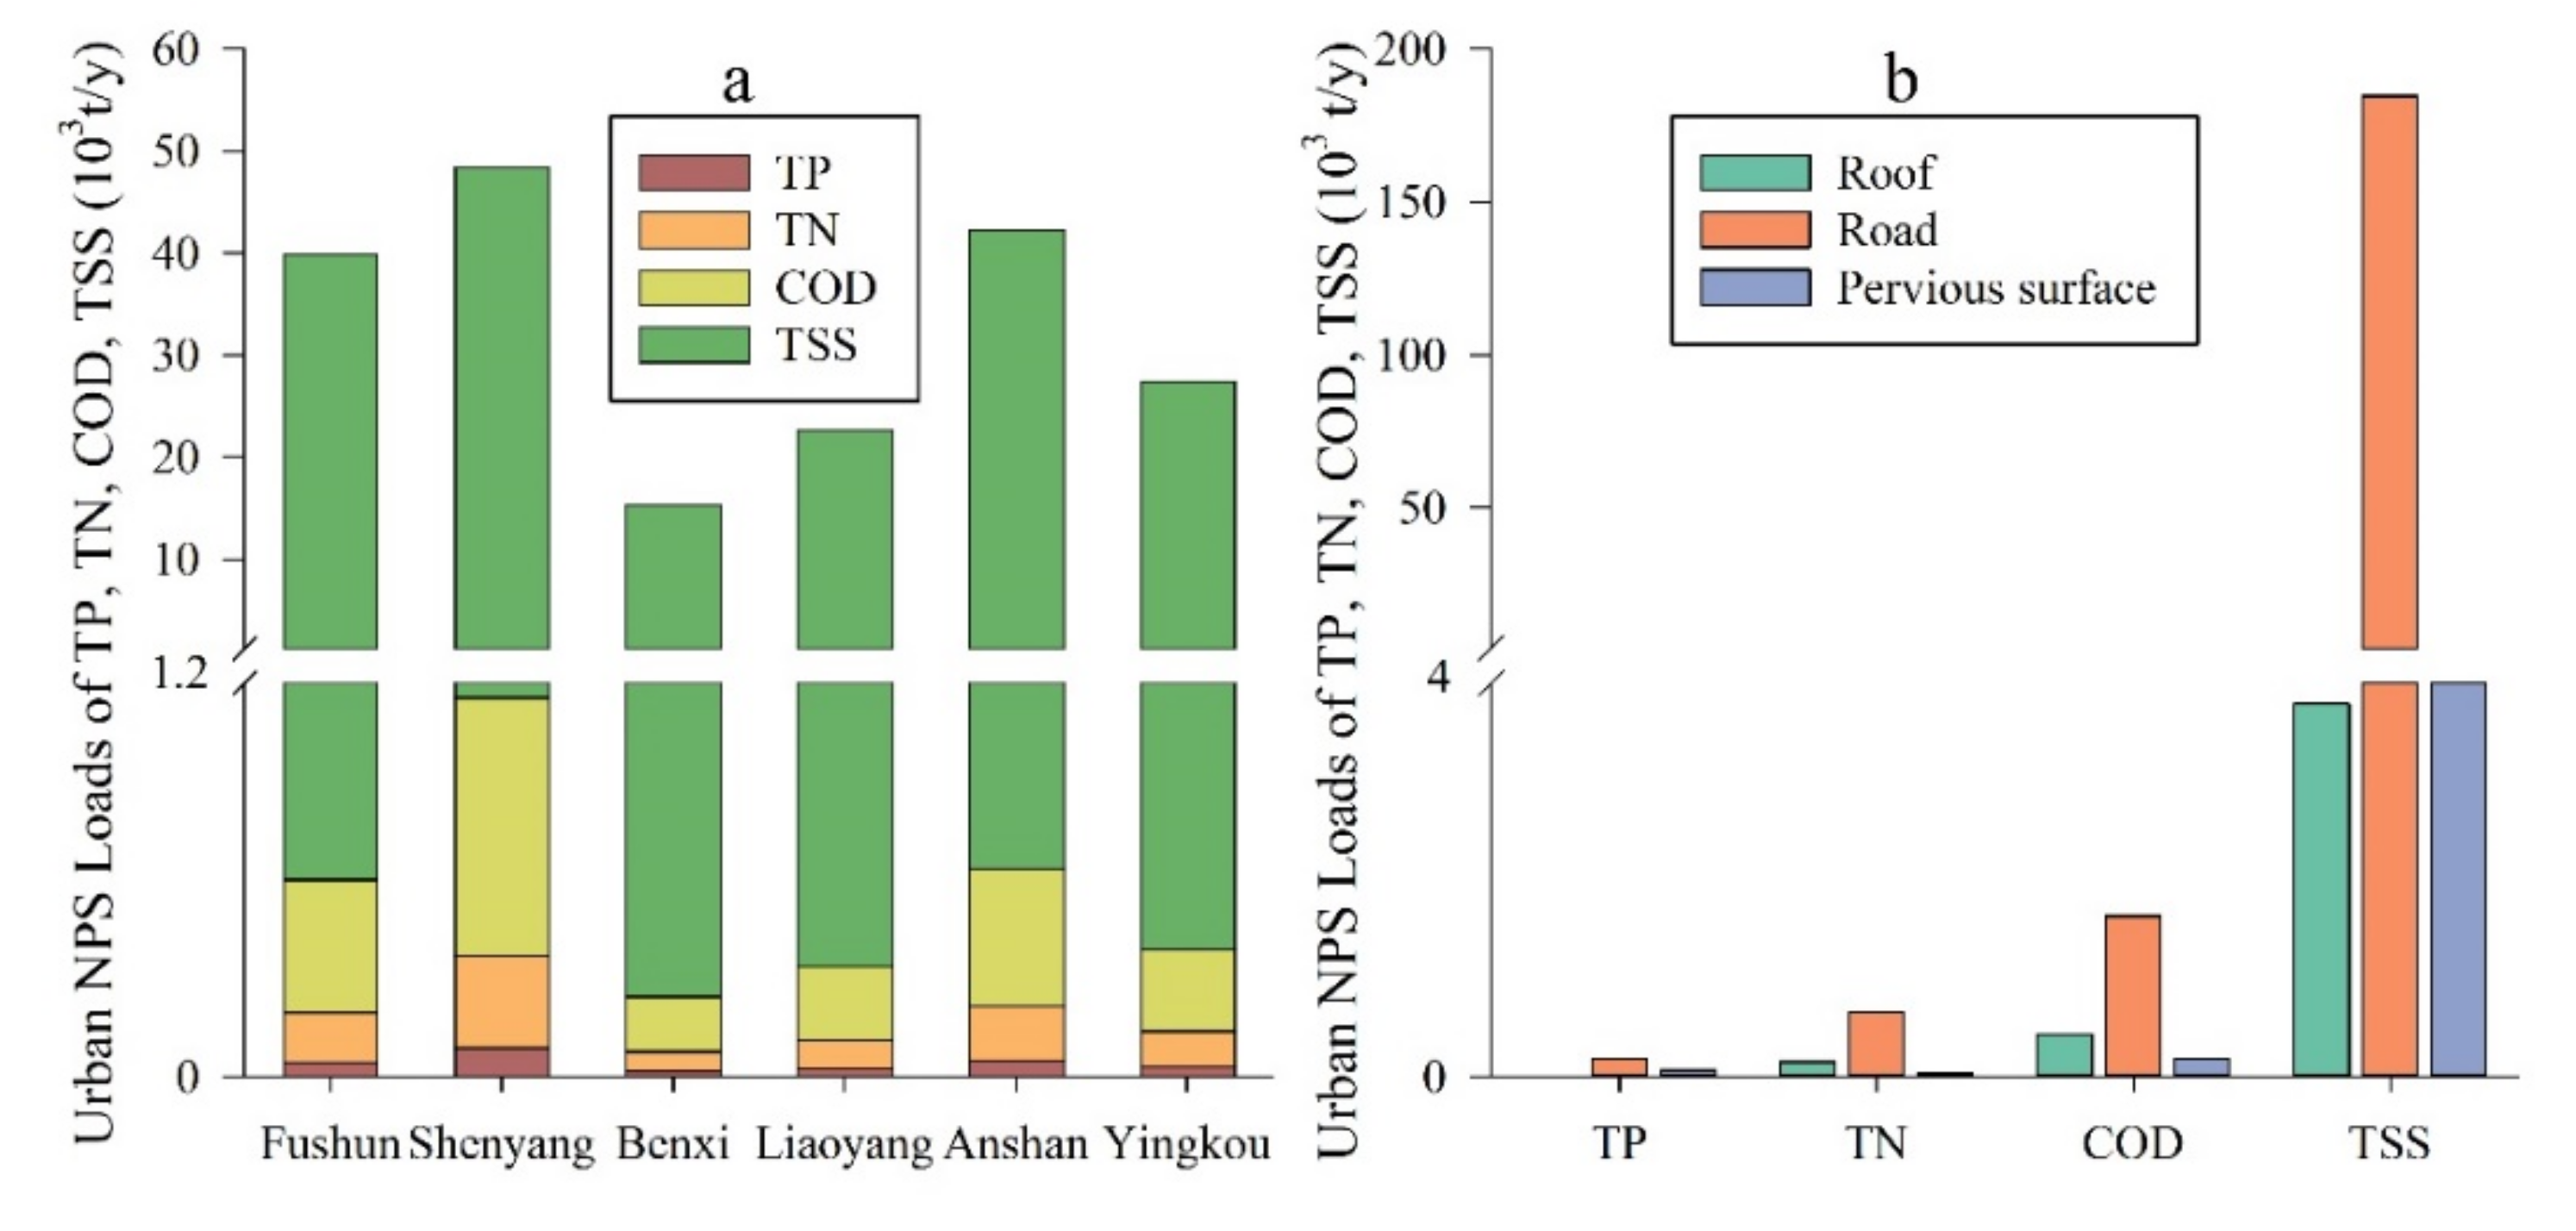
The total urban NPS pollution loads in the six cities for TP, TN, COD and TSS were 266, 853, 2250 and 192,000 t/y, respectively (Figure 9). Shenyang city had the highest urban NPS pollutant loads of TP, TN, COD and TSS, which were 91, 281, 784 and 47,200 t/y, respectively (Figure 9a). The per unit areas of road for TP, TN, COD and TSS were 0.34, 1.22, 3.05 and 345.18 t/km2, of roof for TP, TN, COD and TSS were 0.07, 0.83, 2.35 and 20.41 t/km2, and of pervious area for TP, TN, COD and TSS were 0.16, 0.11, 0.43 and 9.59 t/km2. For the whole study area, roads had the highest urban NPS pollutant loads (Figure 9b). TP, TN, COD and TSS in the road runoff accounted for 69.4%, 76.8%, 75.5% and 95.9%, while in the roof runoff, they accounted for 4.7%, 18%, 19.4% and 2.0% of the total urban NPS pollutant, respectively. The pollutant load of TP in pervious surface runoff was 68.9 t/y, accounting for 25.9% of the total TP load.
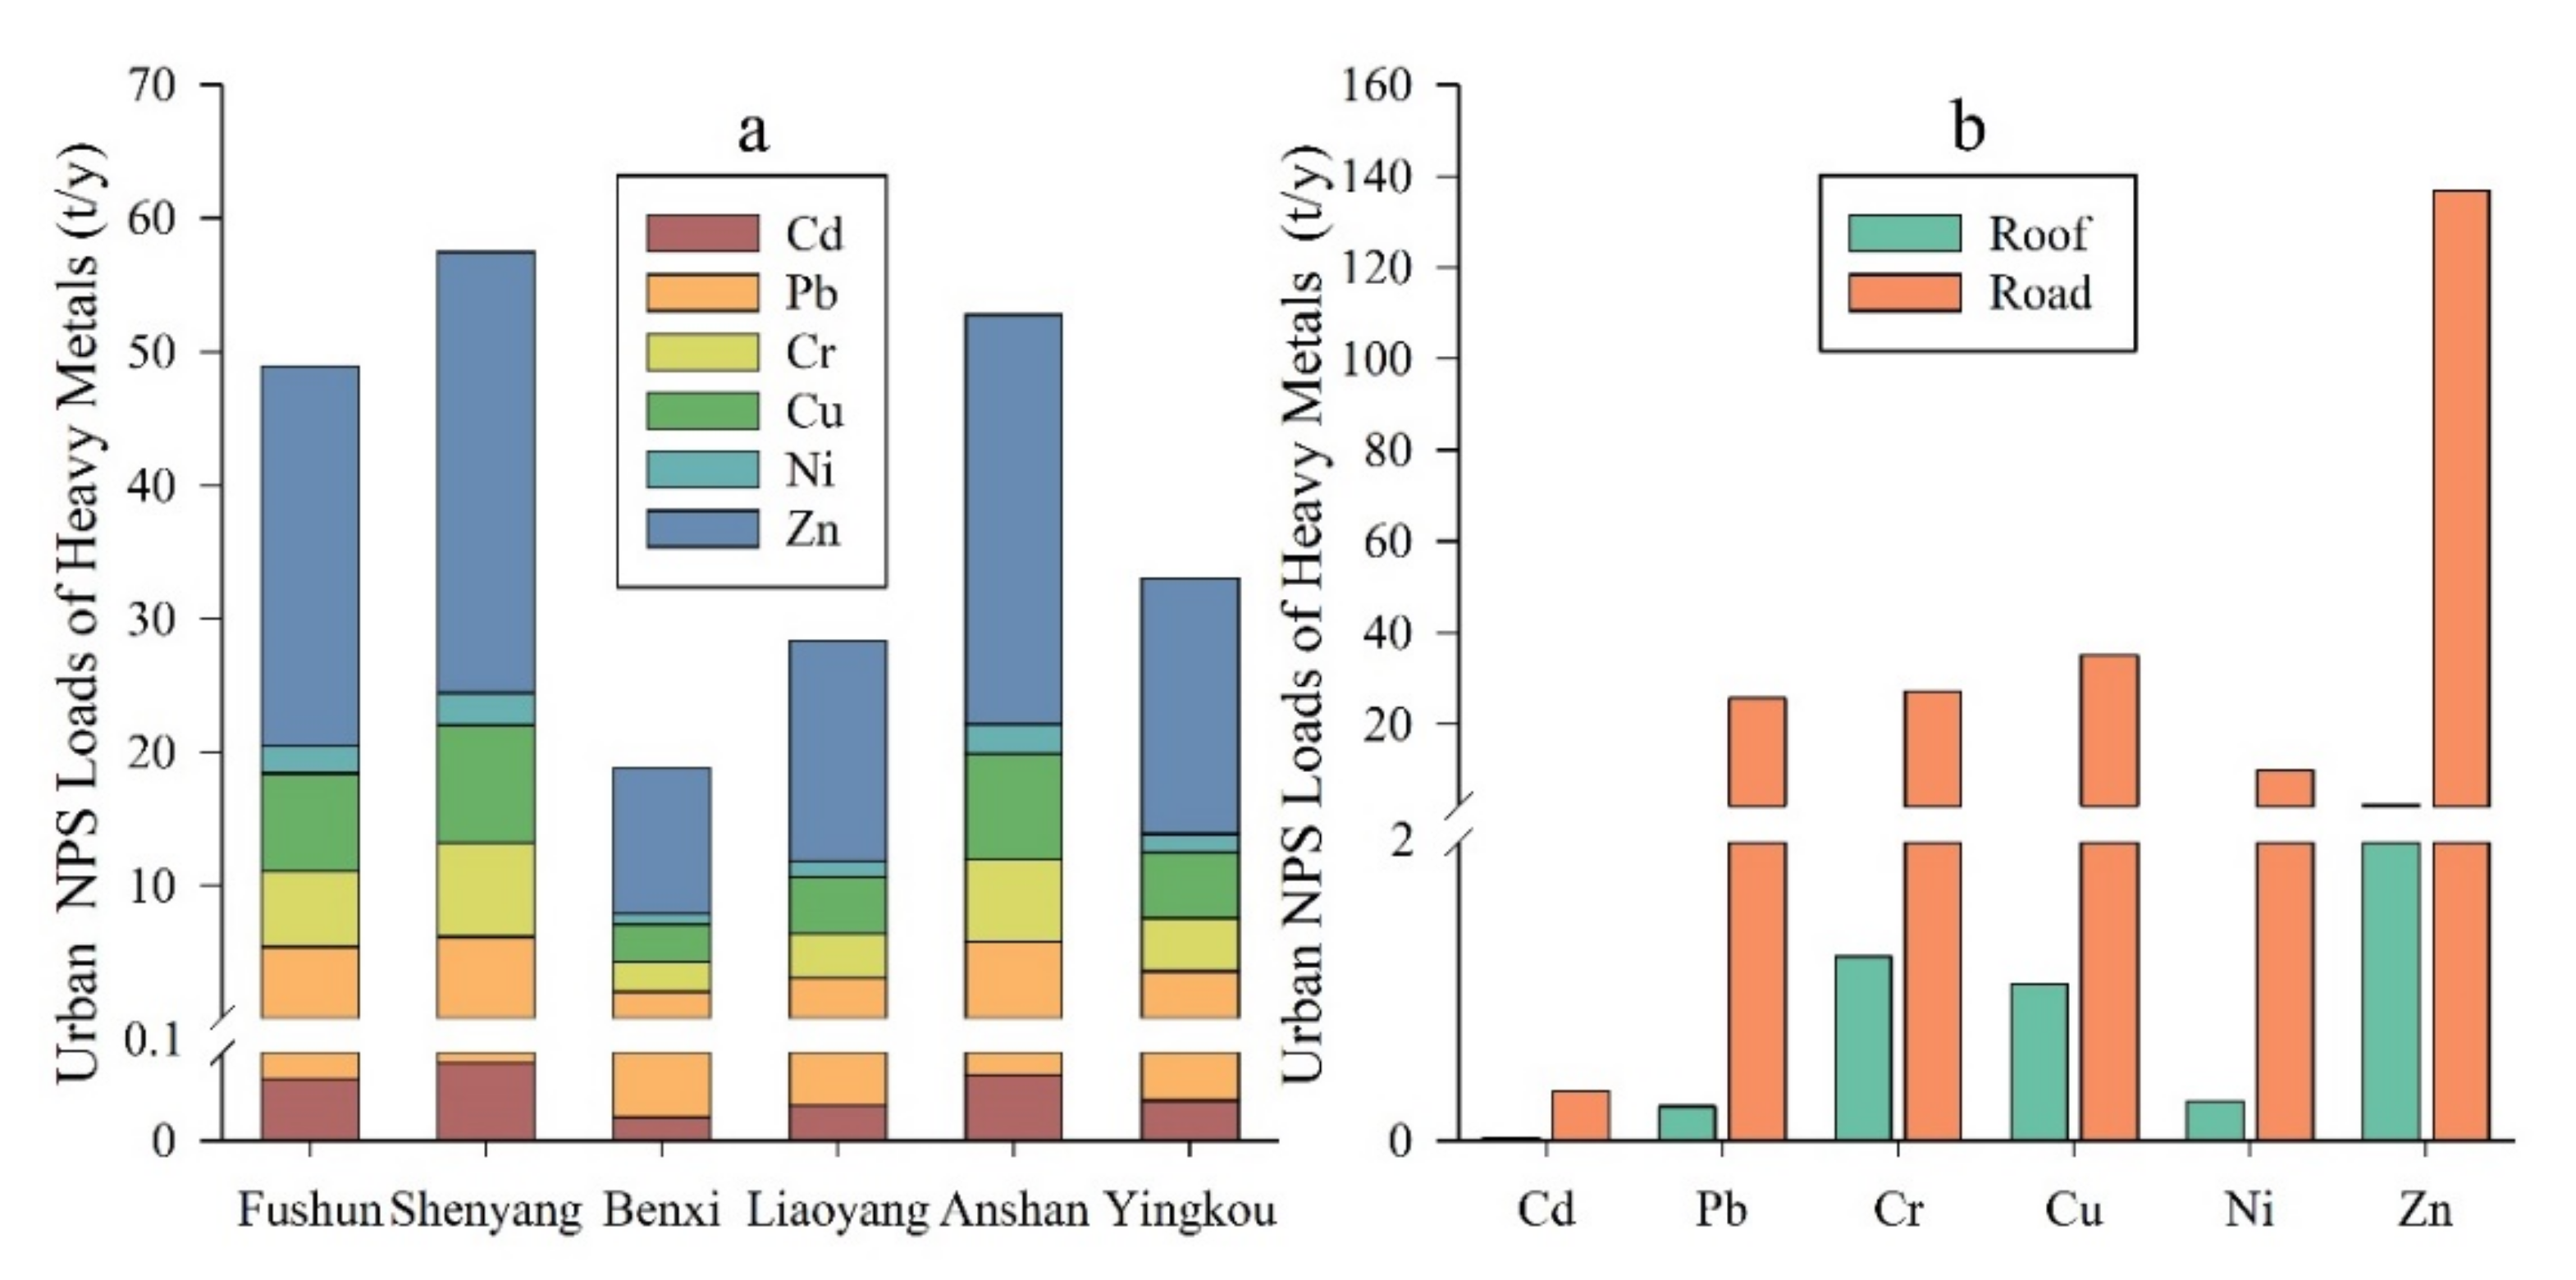
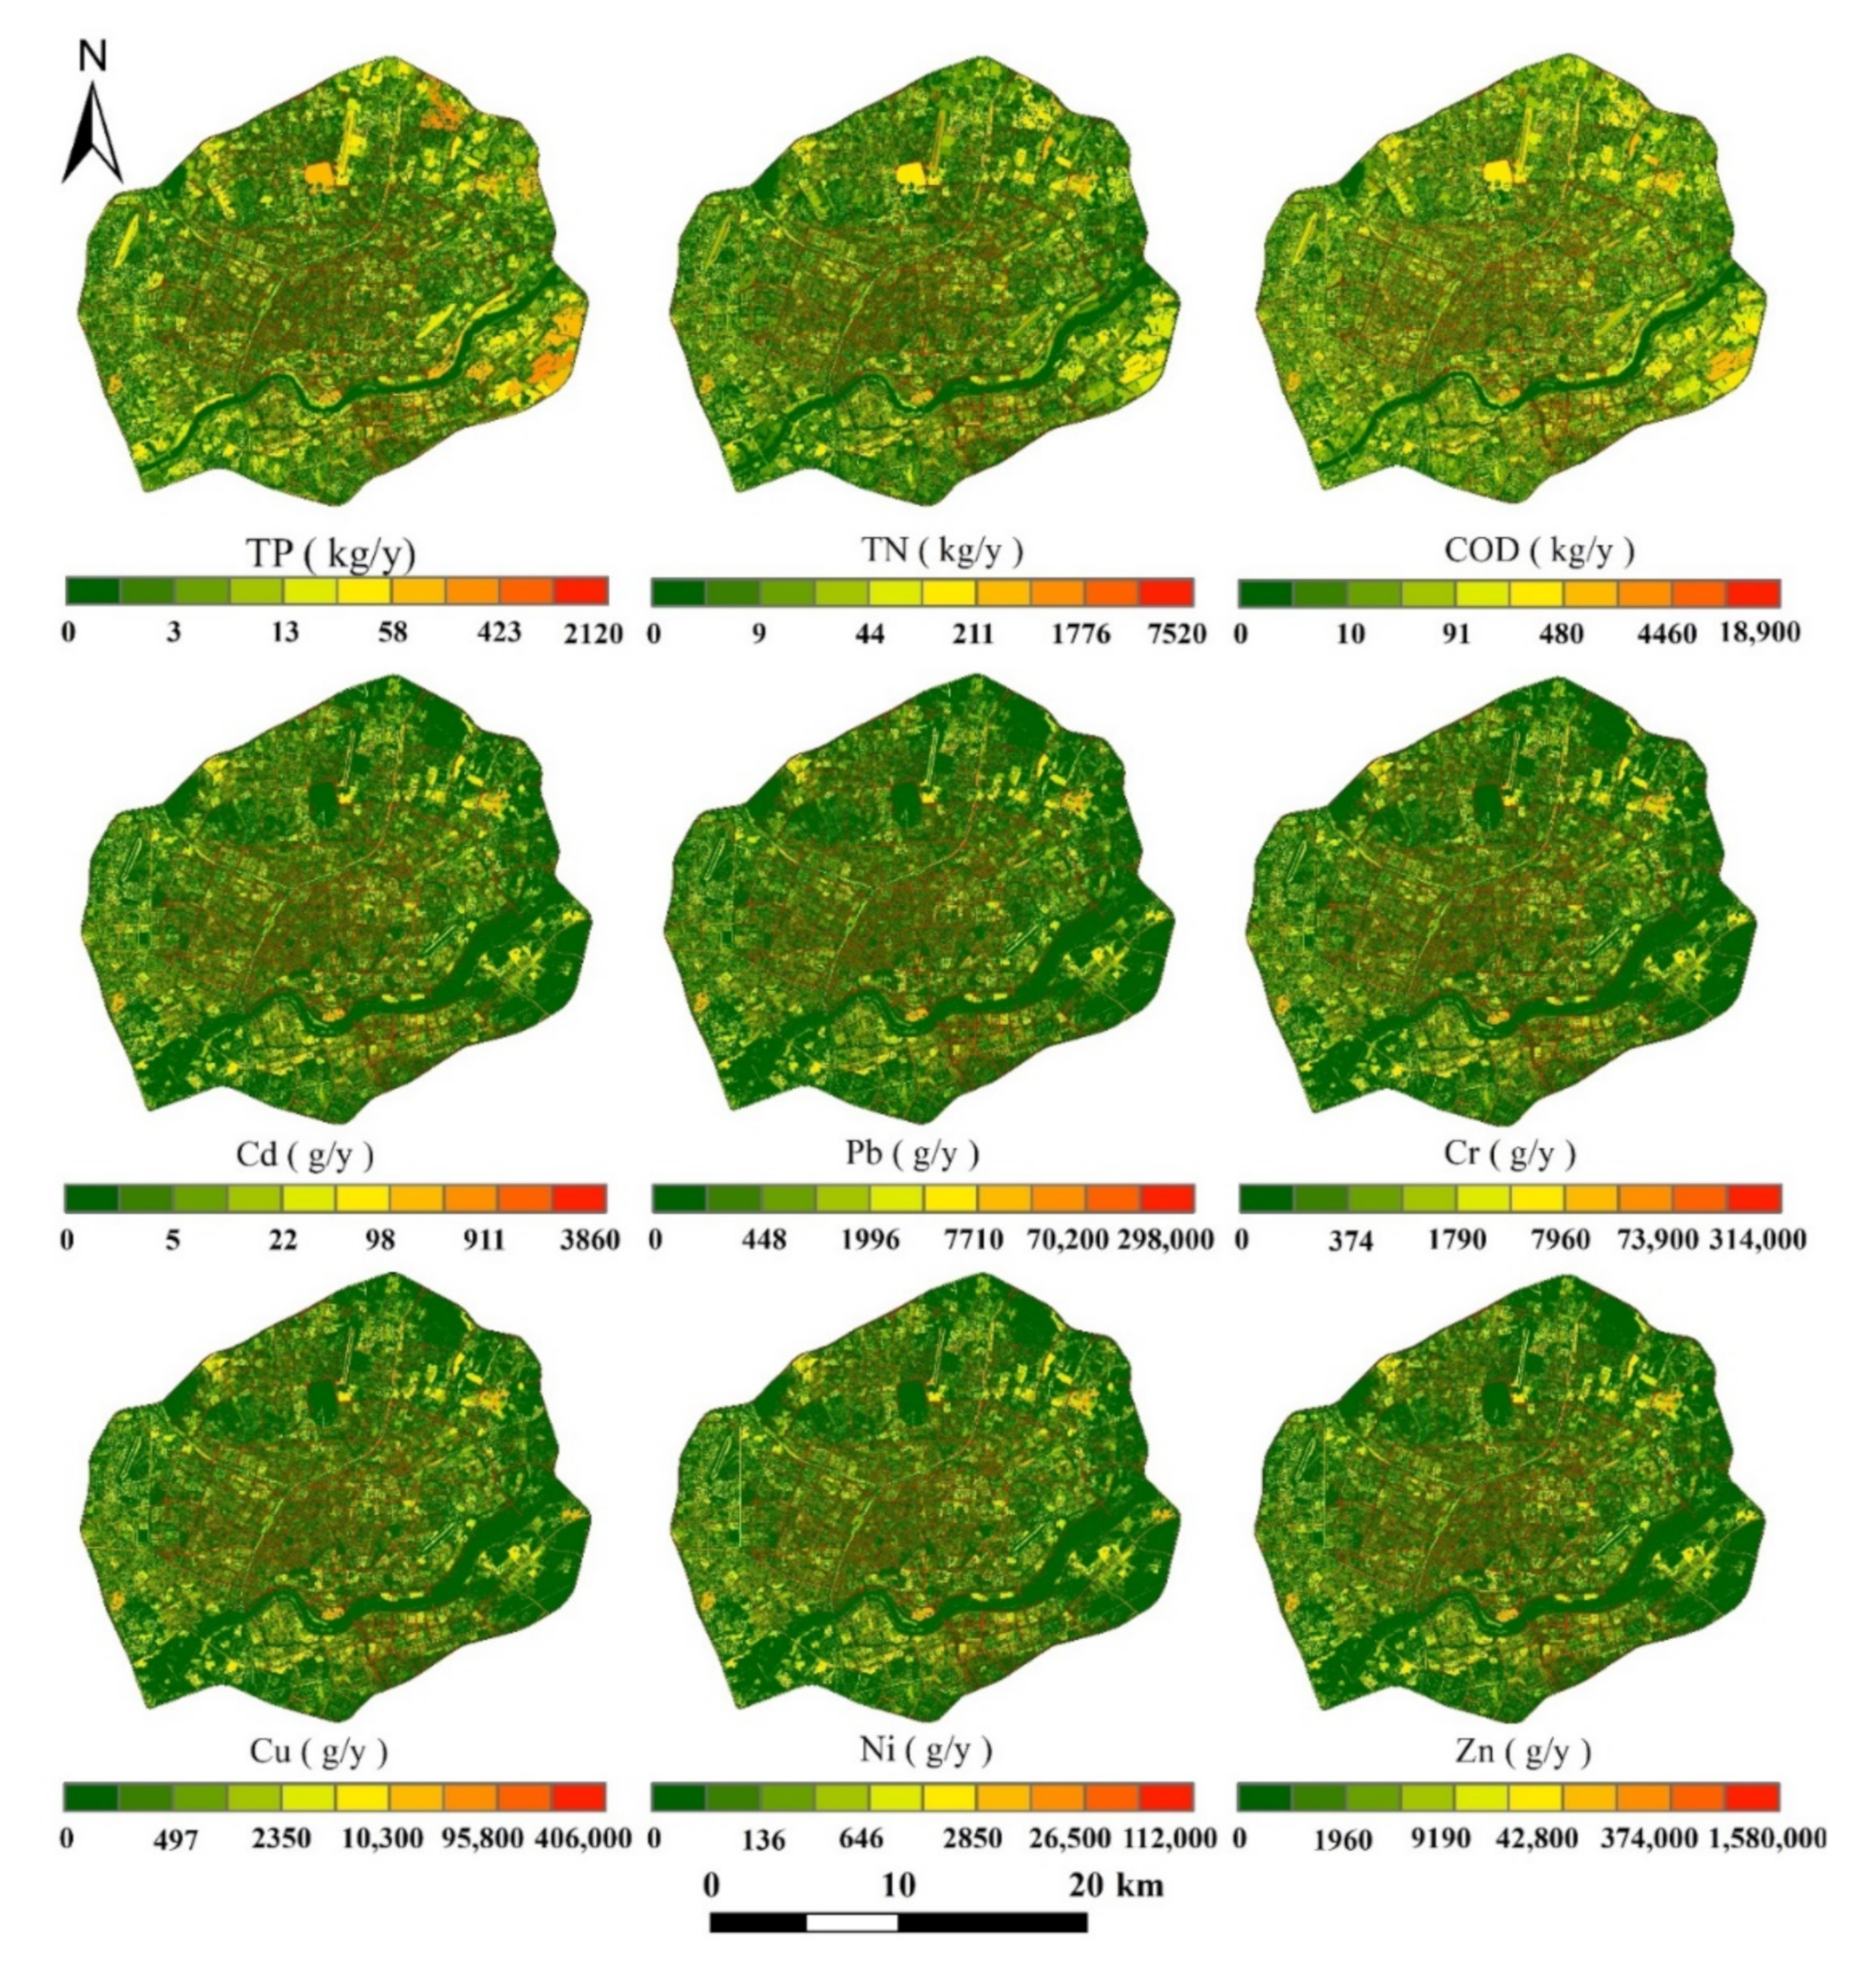
The total average loads of Cd, Ni, Pb, Cr, Cu and Zn in the six cities were 0.35, 9.93, 25.9, 28.4, 36.1 and 139 t/y, respectively (Figure 10). Shenyang city had the highest heavy metal loads of Cd, Ni, Pb, Cr, Cu and Zn, which were 0.09, 2.41, 6.08, 7.07, 8.79 and 33 t/y, respectively (Figure 10a). The contributions of roads to Cd, Ni, Pb, Cr, Cu and Zn in the six cities were 0.62, 18.07, 47.91, 50.7, 65.46 and 255.48 kg/km2, respectively, and those of roofs to Cd, Ni, Pb, Cr, Cu and Zn were 0.09, 1.43, 1.25, 6.64, 5.63 and 11.62 kg/km2. Roads had the highest heavy metal pollution, which accounted for more than 95% of the total amount of pollutants (Figure 10b). The spatial distribution of the annual urban NPS pollutant loads showed that the roads located in the central part of Shenyang city had the highest NPS pollution (Figure 11). This is consistent with the statistical analysis results.
3.4. Contribution of Agricultural and Urban NPS Pollution Loads
The annual agricultural TN and TP pollution loads simulated by the SWAT in this watershed were 44,200 and 9910 t/y, respectively (Table 1). According to the EMC and SWMM, urban NPS pollution contributed 853 t/y TN and 266 t/y TP in this watershed. The proportion of agricultural and urban TN yield was 98.1% and 1.9%, respectively, and the proportion of TP yield was 97.4% and 2.6%, respectively. This indicates that agricultural land was the main source of NPS pollution in the Hun-Taizi River watershed. This may be because the area of agricultural land and the built-up area were 9984.33 km2 and 1141.68 km2, respectively, accounting for 35.99% and 4.21% of the study area.
The agricultural TN and TP yields simulated by the SWAT were 4.43 and 0.99 t/km2, respectively, and the urban TN and TP pollution calculated by the EMC method was 0.75 and 0.23 t/km2, respectively. The urban NPS pollution of TN simulated by the EMC method was 11.9% higher than the value simulated by the SWAT. The contribution of TP from urban areas simulated by the EMC method was 23 times higher than the values simulated by the SWAT. The SWAT greatly underestimated the TP load.
4. Discussion
4.1. Estimating the Characteristic Pollutants of Urban NPS Pollution in an Urban Agglomeration
Most current NPS pollution research mainly studies nitrogen and phosphorus pollution at the watershed scale [46,53,54], while very few researchers focus on evaluating heavy metal pollution. The quantity of heavy metals is estimated by combining the SWAT with sediment geochemistry [55,56] or a heavy metal module incorporated into the SWAT at the watershed scale [57,58]. We found that the average heavy metal loads (Pb 227, Cu 316, Cr 248, Ni 87, Cd 3.05 and Zn 1220 g/ha) were much higher than previous study cases in the agricultural watershed (Table 2) [56,57,58]. This indicates that the characteristic pollutants in the urban NPS pollution were much higher than those in the agricultural watershed. However, heavy metals were not included in the routine water quality monitoring program of each hydrological section. The SWAT cannot simulate heavy metal pollutant loads at the watershed scale due to the lack of long time-series monitoring data. Therefore, in this study, the characteristic pollutants in urban NPS pollution were not compared with these pollutants at the watershed scale. Rapid urbanization and increased impervious surfaces have changed the hydrological cycle and increased the amount of dust deposited with heavy metals [13,19]. With rainfall, heavy metals accumulated in the urban underlying surfaces are washed into receiving waters, which can seriously affect public health and threaten environmental quality. Controlling urban heavy metal pollution is an important aspect of surface water quality improvement, especially in an urban agglomeration watershed. Above all, urban NPS pollution, especially the characteristic pollutants in urban areas, should be considered when calculating the NPS pollution in an urban agglomeration watershed as this can enrich our knowledge of the NPS pollutant constituents at the watershed scale.
Heavy metal pollutant loads in the Muskeg River watershed were the main values in the spatial distribution in the Liuyang River and were the Zn loads in the surface flow.
4.2. Integrated Approach for Estimating Agricultural and Urban NPS Pollutant Loads
In this study, an integrated approach was proposed for estimating the agricultural and urban NPS pollution in an urban agglomeration watershed by coupling the SWAT, EMC method and the SWMM. At the watershed scale, most studies have focused on agricultural NPS pollution, especially TN and TP, neglecting urban NPS pollution. With rapid urbanization, urban NPS pollution loads have increased in recent years [36]. The urban NPS pollutant loads were quantitatively estimated by sampling data from diverse underlying surfaces of different functional zones and rain intensities, which included more observed data and better accuracy than similar research that only sampled in the same underlying surface or functional zone [13,51,59]. A total of 225 water quality samples were used to verify the spatial distribution of agricultural NPS pollution of TN and TP. This provided a more efficient and reasonable method to verify the SWAT simulated results. It was more reliable than studies that calibrated and validated the SWAT only for short periods or did not validate the tool due to data limitations [53,54,60,61]. We found that the TN and TP yields in the built-up area simulated by the EMC method were 11.9% and 23 times higher than the values simulated by the SWAT. This suggests that the SWAT underestimated nutrient yields in the urban area. This may be because the SWAT has a limited capability to simulate the location problem of impervious areas within an urban catchment [62]. Our results indicate that the SWAT coupled with the EMC method and SWMM was an effective tool to estimate the agricultural and urban NPS pollutant loads in an urban agglomeration basin. The framework proposed in this study can help researchers in estimating agricultural and urban NPS pollutant loads in urban agglomeration basins and can also help watershed planners develop effective management strategies to mitigate NPS pollution.
4.3. Uncertainty Analysis and Implication
The simulation uncertainty of the integrated model was a major concern even though an overall good simulation of nutrient yields was obtained in this study [8]. Generally, integrated modeling involves two kinds of uncertainty: (1) uncertainty due to inaccurate input and calibration data; (2) systematic model uncertainty regardless of each correct model [20,63]. In this study, three years (2003–2005) of observed water quality data were used to calibrate and validate the SWAT; water quality stations were not located in watershed outlets as they would have introduced uncertainty to the simulation results [8,57]. The SWMM used to calculate the urban NPS pollutant loads generated by the diverse underlying surfaces might have introduced prediction errors due to lack of drainage system data [50]. Thus, long-term continuous monitoring at the outlet of the watershed, the urban drainage system, and the simulation uncertainty of the integrated models should be considered in future studies.
The urban pollutant loads were estimated by the area of underlying surfaces, EMC values, mean annual rainfall and runoff coefficient. We found that the contribution of urban TN pollution simulated by the SWAT and EMC methods was 0.67 and 0.75 t/km2, respectively, while the total annual pollution loads differed greatly. This may be because the land use map used to estimate urban NPS pollution had a higher resolution than the land use map used to simulate agricultural NPS pollution. In this study, the runoff coefficient we used was obtained from the related literature rather than actual values monitored from the different underlying surfaces of the different functional zones [59]. Rainfall runoff samples were collected in Shenyang city, but they were not obtained in the other five cities. The average values of the EMC and runoff coefficient were used. This neglected the spatial variation in the six cities, which may bring some uncertainties in calculating the urban NPS pollutant loads [29,33]. The NPS pollutant loads of built-up areas in the SWAT were only substituted with urban NPS pollution load in the EMC and SWMM. In the future, complete model coupling should be further developed.
5. Conclusions
In this study, an integrated approach including the SWAT, measured EMC values and the SWMM was used to quantitively estimate the agricultural and urban NPS pollution loads in the Hun-Taizi River watershed located in the Central Liaoning Urban Agglomeration. The proportions of agricultural and urban NPS pollution loads for TN were 98.1% and 1.9%, respectively, and for TP, they were 97.4% and 2.6%, respectively. Estimating urban heavy metal loads is an important aspect of surface water quality improvement and can enrich NPS pollutant constituents at the watershed scale. The TN and TP yields in the built-up area simulated by the EMC method were 11.9% and 23 times higher than the values simulated by the SWAT, respectively. This implies that the SWAT underestimated nutrient yields in the urban area. The SWAT and EMC method coupled with the SWMM was an effective tool for estimating agricultural and urban NPS pollutant loads that could be applied to other urban catchments for water quality management.
Supplementary Materials
The following are available online at https://www.mdpi.com/article/10.3390/w13101385/s1.
Author Contributions
Conceptualization: Y.H., M.L., C.L. and M.Z.; Methodology, M.Z. and C.W.; Software, M.Z. and J.L.; Validation, M.L. and C.L.; Formal analysis, M.L., C.L. and M.Z.; Investigation, M.Z. and C.W.; Resources, M.L., C.L., M.Z. and C.W.; Data curation, M.L., C.L. and M.Z.; Writing—original draft, M.Z.; Writing—review & editing, M.L. and C.L.; Visualization, M.Z.; Supervision, Y.H., M.L. and C.L.; Project administration, Y.H., M.L. and C.L.; Funding acquisition, Y.H., M.L. and C.L. All authors have read and agreed to the published version of the manuscript.
Funding
This research was funded by the National Natural Science Foundation of China (Nos. 32071580, 41871192, 41671184) and the National Key Research and Development Program of China (No. 2016YFC0500401).
Institutional Review Board Statement
Not applicable.
Informed Consent Statement
Not applicable.
Acknowledgments
This work was supported by the National Natural Science Foundation of China (Nos. 32071580, 41871192, 41671184) and the National Key Research and Development Program of China (No. 2016YFC0500401).
Conflicts of Interest
The authors declare no conflict of interest.
References
- Bian, B.; Cheng, X.J.; Li, L. Investigation of urban water quality using simulated rainfall in a medium size city of China. Environ. Monit. Assess. 2011, 183, 217–229. [Google Scholar] [CrossRef]
- Ouyang, W.; Song, K.Y.; Wang, X.L.; Hao, F.H. Non-point source pollution dynamics under long-term agricultural development and relationship with landscape dynamics. Ecol. Indic. 2014, 45, 579–589. [Google Scholar] [CrossRef]
- Hu, H.Y.; Huang, G.R. Monitoring of Non-Point Source Pollutions from an Agriculture Watershed in South China. Water 2014, 6, 3828–3840. [Google Scholar] [CrossRef] [Green Version]
- Zhang, J.; Li, S.Y.; Dong, R.Z.; Jiang, C.S.; Ni, M.F. Influences of land use metrics at multi-spatial scales on seasonal water quality: A case study of river systems in the Three Gorges Reservoir Area, China. J. Clean Prod. 2019, 206, 76–85. [Google Scholar] [CrossRef]
- Ahmad, Z.U.; Sanin, M.; Lian, Q.; Zappi, M.; Gang, D.D. Nonpoint Source Pollution; Water Environment Federation: Virginia Beach, VA, USA, 2017; Volume 89, pp. 1580–1602. [Google Scholar] [CrossRef] [Green Version]
- Ongley, E.D.; Zhang, X.L.; Yu, T. Current status of agricultural and rural non-point source Pollution assessment in China. Environ. Pollut. 2010, 158, 1159–1168. [Google Scholar] [CrossRef]
- Hua, L.L.; Li, W.C.; Zhai, L.M.; Yen, H.; Lei, Q.L.; Liu, H.B.; Ren, T.Z.; Xia, Y.; Zhang, F.L.; Fan, X.P. An innovative approach to identifying agricultural pollution sources and loads by using nutrient export coefficients in watershed modeling. J. Hydrol. 2019, 571, 322–331. [Google Scholar] [CrossRef]
- Chen, L.; Dai, Y.; Zhi, X.S.; Xie, H.; Shen, Z.Y. Quantifying nonpoint source emissions and their water quality responses in a complex catchment: A case study of a typical urban-rural mixed catchment. J. Hydrol. 2018, 559, 110–121. [Google Scholar] [CrossRef]
- Wang, Y.; Bian, J.M.; Lao, W.M.; Zhao, Y.S.; Hou, Z.Y.; Sun, X.Q. Assessing the Impacts of Best Management Practices on Nonpoint Source Pollution Considering Cost-Effectiveness in the Source Area of the Liao River, China. Water 2019, 11, 20. [Google Scholar] [CrossRef] [Green Version]
- UN. World Urbanization Prospects 2018: Highlights; UN: New York, NY, USA, 2019. [Google Scholar]
- Fang, C.L. Important progress and future direction of studies on China’s urban agglomerations. J. Geogr. Sci. 2015, 25, 1003–1024. [Google Scholar] [CrossRef] [Green Version]
- Dong, Y.; Liu, Y.; Chen, J.N. Will urban expansion lead to an increase in future water pollution loads?—A preliminary investigation of the Haihe River Basin in northeastern China. Environ. Sci. Pollut. Res. 2014, 21, 7024–7034. [Google Scholar] [CrossRef]
- Shen, Z.Y.; Liu, J.; Aini, G.; Gong, Y.W. A comparative study of the grain-size distribution of surface dust and stormwater runoff quality on typical urban roads and roofs in Beijing, China. Environ. Sci. Pollut. Res. 2016, 23, 2693–2704. [Google Scholar] [CrossRef]
- Li, C.L.; Liu, M.; Hu, Y.M.; Shi, T.; Zong, M.; Walter, M.T. Assessing the Impact of Urbanization on Direct Runoff Using Improved Composite CN Method in a Large Urban Area. Int. J. Environ. Res. Public Health 2018, 15, 775. [Google Scholar] [CrossRef] [PubMed] [Green Version]
- Angrill, S.; Petit-Boix, A.; Morales-Pinzon, T.; Josa, A.; Rieradevall, J.; Gabarrell, X. Urban rainwater runoff quantity and quality—A potential endogenous resource in cities? J. Environ. Manag. 2017, 189, 14–21. [Google Scholar] [CrossRef] [PubMed] [Green Version]
- Fletcher, T.D.; Andrieu, H.; Hamel, P. Understanding, management and modelling of urban hydrology and its consequences for receiving waters: A state of the art. Adv. Water Resour. 2013, 51, 261–279. [Google Scholar] [CrossRef]
- Li, C.L.; Liu, M.; Hu, Y.M.; Shi, T.; Qu, X.Q.; Walter, M.T. Effects of urbanization on direct runoff characteristics in urban functional zones. Sci. Total Environ. 2018, 643, 301–311. [Google Scholar] [CrossRef] [PubMed]
- Chen, L.; Zhi, X.S.; Shen, Z.Y.; Dai, Y.; Aini, G. Comparison between snowmelt-runoff and rainfall-runoff nonpoint source pollution in a typical urban catchment in Beijing, China. Environ. Sci. Pollut. Res. 2018, 25, 2377–2388. [Google Scholar] [CrossRef]
- Li, C.L.; Liu, M.; Hu, Y.M.; Gong, J.P.; Sun, F.Y.; Xu, Y.Y. Characterization and first flush analysis in road and roof runoff in Shenyang, China. Water Sci. Technol. 2014, 70, 397–406. [Google Scholar] [CrossRef]
- Chen, L.; Wang, G.B.; Zhong, Y.C.; Shen, Z.Y. Evaluating the impacts of soil data on hydrological and nonpoint source pollution prediction. Sci. Total Environ. 2016, 563, 19–28. [Google Scholar] [CrossRef]
- Heathman, G.C.; Flanagan, D.C.; Larose, M.; Zuercher, B.W. Application of the Soil and Water Assessment Tool and Annualized Agricultural Non-Point Source models in the St. Joseph River watershed. J. Soil Water Conserv. 2008, 63, 552–568. [Google Scholar] [CrossRef] [Green Version]
- Tong, S.T.Y.; Chen, W.L. Modeling the relationship between land use and surface water quality. J. Environ. Manag. 2002, 66, 377–393. [Google Scholar] [CrossRef] [PubMed]
- Xie, H.I.; Shen, Z.Y.; Chen, L.; Qiu, J.L.; Dong, J.W. Time-varying sensitivity analysis of hydrologic and sediment parameters at multiple timescales: Implications for conservation practices. Sci. Total Environ. 2017, 598, 353–364. [Google Scholar] [CrossRef]
- Barco, J.; Wong, K.M.; Stenstrom, M.K. Automatic calibration of the US EPA SWMM model for a large urban catchment. J. Hydraul. Eng. 2008, 134, 466–474. [Google Scholar] [CrossRef]
- Arnold, J.G.; Srinivasan, R.; Muttiah, R.S.; Williams, J.R. Large area hydrologic modeling and assessment—Part 1: Model development. J. Am. Water Resour. Assoc. 1998, 34, 73–89. [Google Scholar] [CrossRef]
- Maharjan, B.; Pachel, K.; Loigu, E. Modelling stormwater runoff, quality, and pollutant loads in a large urban catchment. Proc. Est. Acad. Sci. 2017, 66, 225–242. [Google Scholar] [CrossRef]
- Epelde, A.M.; Cerro, I.; Sanchez-Perez, J.M.; Sauvage, S.; Srinivasan, R.; Antiguedad, I. Application of the SWAT model to assess the impact of changes in agricultural management practices on water quality. Hydrol. Sci. J. 2015, 60, 825–843. [Google Scholar] [CrossRef]
- Marin, M.; Clinciu, I.; Tudose, N.C.; Ungurean, C.; Adorjani, A.; Mihalache, A.L.; Davidescu, A.A.; Davidescu, S.O.; Dinca, L.; Cacovean, H. Assessing the vulnerability of water resources in the context of climate changes in a small forested watershed using SWAT: A review. Environ. Res. 2020, 184, 10. [Google Scholar] [CrossRef]
- Yi, Q.T.; Li, H.; Lee, J.W.; Kim, Y. Development of EMC-based empirical model for estimating spatial distribution of pollutant loads and its application in rural areas of Korea. J. Environ. Sci. 2015, 35, 1–11. [Google Scholar] [CrossRef]
- Tong, S.T.Y.; Liu, A.J.; Goodrich, J.A. Assessing the water quality impacts of future land-use changes in an urbanising watershed. Civ. Eng. Environ. Syst. 2009, 26, 3–18. [Google Scholar] [CrossRef]
- Suttles, K.M.; Singh, N.K.; Vose, J.M.; Martin, K.L.; Emanuel, R.E.; Coulston, J.W.; Saia, S.M.; Crump, M.T. Assessment of hydrologic vulnerability to urbanization and climate change in a rapidly changing watershed in the Southeast US. Sci. Total Environ. 2018, 645, 806–816. [Google Scholar] [CrossRef]
- Liu, Y.Z.; Wang, R.Y.; Guo, T.; Engel, B.A.; Flanagan, D.C.; Lee, J.G.; Li, S.Y.; Pijanowski, B.C.; Collingsworth, P.D.; Wallace, C.W. Evaluating efficiencies and cost-effectiveness of best management practices in improving agricultural water quality using integrated SWAT and cost evaluation tool. J. Hydrol. 2019, 577, 16. [Google Scholar] [CrossRef]
- Wang, S.M.; He, Q.; Ai, H.N.; Wang, Z.T.; Zhang, Q.Q. Pollutant concentrations and pollution loads in stormwater runoff from different land uses in Chongqing. J. Environ. Sci. 2013, 25, 502–510. [Google Scholar] [CrossRef]
- Motew, M.; Chen, X.; Carpenter, S.R.; Booth, E.G.; Seifert, J.; Qiu, J.X.; Loheide, S.P.; Turner, M.G.; Zipper, S.C.; Kucharik, C.J. Comparing the effects of climate and land use on surface water quality using future watershed scenarios. Sci. Total Environ. 2019, 693, 14. [Google Scholar] [CrossRef]
- Ouyang, W.; Guo, B.B.; Hao, F.H.; Huang, H.B.; Li, J.Q.; Gong, Y.W. Modeling urban storm rainfall runoff from diverse underlying surfaces and application for control design in Beijing. J. Environ. Manag. 2012, 113, 467–473. [Google Scholar] [CrossRef] [PubMed]
- Lou, H.Z.; Yang, S.T.; Hao, F.H.; Ren, X.Y.; Zhao, C.S.; Wang, Y.; Lei, T.J.; Sun, F. Evolution and Driving Forces of Non-Point Source Pollution in a Developing Megacity: Beijing as a Long-Term Case Study. Pol. J. Environ. Stud. 2020, 29, 763–777. [Google Scholar] [CrossRef]
- Zhao, J.-w.; Shan, B.-q.; Yin, C.-q. Pollutant loads of surface runoff in Wuhan City Zoo, an urban tourist area. J. Environ. Sci. 2007, 19, 464–468. [Google Scholar] [CrossRef]
- APHA; AWWA; WEF. Standard Methods for the Examination of Water and Wastewater; American Water Works Association; Water Environment Federation: Denver, CO, USA, 2005. [Google Scholar]
- Liu, M.; Hu, Y.M.; Li, C.L. Landscape metrics for three-dimensional urban building pattern recognition. Appl. Geogr. 2017, 87, 66–72. [Google Scholar] [CrossRef]
- Bureau, L.S. Liaoning Statistical Yearbook 2020; China Statistics Press: Beijing, China, 2020. [Google Scholar]
- Abbaspour, K.C.; Yang, J.; Maximov, I.; Siber, R.; Bogner, K.; Mieleitner, J.; Zobrist, J.; Srinivasan, R. Modelling hydrology and water quality in the pre-alpine/alpine Thur watershed using SWAT. J. Hydrol. 2007, 333, 413–430. [Google Scholar] [CrossRef]
- CEPA. Analyses Methods for Monitoring Water and Wastewater, 4th ed.; Environmental Science Press: Beijing, China, 2002. [Google Scholar]
- Arnold, J.G.; Moriasi, D.N.; Gassman, P.W.; Abbaspour, K.C.; White, M.J.; Srinivasan, R.; Santhi, C.; Harmel, R.D.; van Griensven, A.; Van Liew, M.W.; et al. SWAT: Model use, calibration, and validation. Trans. Asabe 2012, 55, 1491–1508. [Google Scholar] [CrossRef]
- Busico, G.; Colombani, N.; Fronzi, D.; Pellegrini, M.; Tazioli, A.; Mastrocicco, M. Evaluating SWAT model performance, considering different soils data input, to quantify actual and future runoff susceptibility in a highly urbanized basin. J. Environ. Manage. 2020, 266, 10. [Google Scholar] [CrossRef]
- MHURD. Technical Guide for Sponge Cities—Water System Construction of Low Impact Development; China Building Industry Press: Beijing, China, 2014. [Google Scholar]
- Palla, A.; Gnecco, I. Hydrologic modeling of Low Impact Development systems at the urban catchment scale. J. Hydrol. 2015, 528, 361–368. [Google Scholar] [CrossRef]
- Gironas, J.; Roesner, L.A.; Rossman, L.A.; Davis, J. A new applications manual for the Storm Water Management Model (SWMM). Environ. Model. Softw. 2010, 25, 813–814. [Google Scholar] [CrossRef]
- Nash, J.E.; Sutcliffe, J.V. River flow forecasting through conceptual models part I A discussion of principles. J. Hydrol. 1970, 10, 282–290. [Google Scholar] [CrossRef]
- Zhi, X.S.; Chen, L.; Shen, Z.Y. Impacts of urbanization on regional nonpoint source pollution: Case study for Beijing, China. Environ. Sci. Pollut. Res. 2018, 25, 9849–9860. [Google Scholar] [CrossRef] [PubMed]
- Li, C.L.; Liu, M.; Hu, Y.M.; Gong, J.P.; Xu, Y.Y. Modeling the Quality and Quantity of Runoff in a Highly Urbanized Catchment Using Storm Water Management Model. Pol. J. Environ. Stud. 2016, 25, 1573–1581. [Google Scholar] [CrossRef]
- Zhai, X.Y.; Zhang, Y.Y.; Wang, X.L.; Xia, J.; Liang, T. Non-point source pollution modelling using Soil and Water Assessment Tool and its parameter sensitivity analysis in Xin’anjiang catchment, China. Hydrol. Process. 2014, 28, 1627–1640. [Google Scholar] [CrossRef]
- Chen, Y.; Cheng, S.Y.; Liu, L.; Guo, X.R.; Wang, Z.; Qin, C.H.; Hao, R.X.; Lu, J.; Gao, J.J. Assessing the Effects of Land Use Changes on Non-Point Source Pollution Reduction for the Three Gorges Watershed Using the SWAT Model. J. Environ. Inform. 2013, 22, 13–26. [Google Scholar] [CrossRef]
- Shen, Z.Y.; Qiu, J.L.; Hong, Q.; Chen, L. Simulation of spatial and temporal distributions of non-point source pollution load in the Three Gorges Reservoir Region. Sci. Total Environ. 2014, 493, 138–146. [Google Scholar] [CrossRef] [PubMed]
- Yang, H.C.; Wang, G.Q.; Wang, L.J.; Zheng, B.H. Impact of land use changes on water quality in headwaters of the Three Gorges Reservoir. Environ. Sci. Pollut. Res. 2016, 23, 11448–11460. [Google Scholar] [CrossRef] [PubMed]
- Qiao, P.W.; Lei, M.; Yang, S.C.; Yang, J.; Zhou, X.Y.; Dong, N.; Guo, G.H. Development of a model to simulate soil heavy metals lateral migration quantity based on SWAT in Huanjiang watershed, China. J. Environ. Sci. 2019, 77, 115–129. [Google Scholar] [CrossRef]
- Jiao, W.; Ouyang, W.; Hao, F.H.; Huang, H.B.; Shan, Y.S.; Geng, X.J. Combine the soil water assessment tool (SWAT) with sediment geochemistry to evaluate diffuse heavy metal loadings at watershed scale. J. Hazard. Mater. 2014, 280, 252–259. [Google Scholar] [CrossRef]
- Du, X.Z.; Shrestha, N.K.; Wang, J. Incorporating a non-reactive heavy metal simulation module into SWAT model and its application in the Athabasca oil sands region. Environ. Sci. Pollut. Res. 2019, 26, 20879–20892. [Google Scholar] [CrossRef]
- Meng, Y.B.; Zhou, L.F.; He, S.L.; Lu, C.; Wu, G.L.; Ye, W.; Ji, P.X. A heavy metalmodule coupled with the SWATmodel and its preliminary application in a mine-impacted watershed in China. Sci. Total Environ. 2018, 613, 1207–1219. [Google Scholar] [CrossRef]
- Rodriguez-Blanco, M.L.; Taboada-Castro, M.M.; Taboada-Castro, M.T. Rainfall-runoff response and event-based runoff coefficients in a humid area (northwest Spain). Hydrol. Sci. J. 2012, 57, 445–459. [Google Scholar] [CrossRef] [Green Version]
- Yang, H.C.; Wang, G.Q.; Yang, Y.; Xue, B.L.; Wu, B.B. Assessment of the Impacts of Land Use Changes on Nonpoint Source Pollution Inputs Upstream of the Three Gorges Reservoir. Sci. World J. 2014, 15. [Google Scholar] [CrossRef]
- Baker, T.J.; Miller, S.N. Using the Soil and Water Assessment Tool (SWAT) to assess land use impact on water resources in an East African watershed. J. Hydrol. 2013, 486, 100–111. [Google Scholar] [CrossRef]
- Kim, N.W.; Won, Y.S.; Lee, J.; Lee, J.E.; Jeong, J. Hydrological Impacts of Urban Imperviousness in White Rock Creek Watershed. Trans. Asabe 2011, 54, 1759–1771. [Google Scholar] [CrossRef]
- Kumar, B.; Lakshmi, V.; Patra, K.C. Evaluating the Uncertainties in the SWAT Model Outputs due to DEM Grid Size and Resampling Techniques in a Large Himalayan River Basin. J. Hydrol. Eng. 2017, 22, 12. [Google Scholar] [CrossRef]
Figure 1.
The Hun-Taizi River watershed and the built-up area in Liaoning Province, China. (a) China; (b) The land use map, meteorological, hydrological, water quality stations and sampling sections in the Hun-Taizi River watershed; (c) The distribution of the study area and the Central Liaoning Urban Agglomeration in Liaoning Province; (d) The built-up area of six cities and rainfall runoff sampling sites of different functional zones in Shenyang. Business zone (BUZ), high density residential zone (HRZ), low density residential zone (LRZ), educational zone (EDZ), industrial zone (INZ), agricultural zone (AGZ), green space zone (GSZ), public service zone (PSZ), preservation zone (PRZ), development zone (DEZ), and water (WTR); S1, S2, S3, S4 and S5 were the rainfall sampling sites in BUZ, EDZ, HRZ, INZ and PRZ, respectively.

Figure 2.
The land use map of the built-up area of the six cities.

Figure 3.
The underlying surfaces of the six cities.

Figure 4.
The average annual precipitation of the different rain intensities of the six cities during 1989–2018.
Figure 4.
The average annual precipitation of the different rain intensities of the six cities during 1989–2018.

Figure 5.
Schematic framework of the study. Business zone (BUZ), high density residential zone (HRZ), educational zone (EDZ), industrial zone (INZ), preservation zone (PRZ), digital elevation model (DEM), total suspended solids (TSS), chemical oxygen demand (COD), total nitrogen (TN), total phosphorus (TP), event mean concentration (EMC), Storm Water Management Model (SWMM), Soil and Water Assessment Tool (SWAT), and non-point source (NPS).

Figure 6.
Relationship between the simulated concentration of total nitrogen (TN) and total phosphorus (TP) by the Soil and Water Assessment Tool (SWAT) and the observed values in the Hun-Taizi River watershed.
Figure 6.
Relationship between the simulated concentration of total nitrogen (TN) and total phosphorus (TP) by the Soil and Water Assessment Tool (SWAT) and the observed values in the Hun-Taizi River watershed.

Figure 7.
The spatial distribution of the average annual total nitrogen (TN) and total phosphorus (TP) yield from 2003 to 2017.
Figure 7.
The spatial distribution of the average annual total nitrogen (TN) and total phosphorus (TP) yield from 2003 to 2017.

Figure 8.
The average event mean concentration (EMC) values of total phosphorus (TP), total nitrogen (TN), chemical oxygen demand (COD), total suspended solids (TSS) and six heavy metals (Cd, Pb, Cr, Cu, Ni, and Zn) for different underlying surfaces and rainfall intensities. (a) and (d) EMC values of urban non-point source (NPS) pollutants in light rain; (b) and (e) EMC values of urban NPS pollutants in moderate rain; (c) and (f) EMC values of urban NPS pollutants in heavy rain. * The concentration of the NPS pollutant constituent exceeded the standard.

Figure 9.
The average annual urban non-point source (NPS) pollutant loads of total phosphorus (TP), total nitrogen (TN), chemical oxygen demand (COD) and total suspended solids (TSS) of the six cities and different underlying surfaces. (a) The average annual pollutant loads of TP, TN, COD and TSS of the six cities; (b) The average annual pollutant loads of TP, TN, COD and TSS from roof, road and pervious surfaces.

Figure 10.
The urban non-point source (NPS) pollutant loads of six heavy metals (Cd, Pb, Cr, Cu, Ni, and Zn) in the six cities and different underlying surfaces. (a) The average annual pollutant loads of six heavy metals in the six cities; (b) The average annual pollutant loads of six heavy metals from roofs and roads.

Figure 11.
The spatial distribution of total phosphorus (TP), total nitrogen (TN), chemical oxygen demand (COD) and six heavy metals (Cd, Pb, Cr, Cu, Ni, and Zn) loads in the built-up area of Shenyang city.
Figure 11.
The spatial distribution of total phosphorus (TP), total nitrogen (TN), chemical oxygen demand (COD) and six heavy metals (Cd, Pb, Cr, Cu, Ni, and Zn) loads in the built-up area of Shenyang city.


Table 1.
The average annual and per unit area yield of total nitrogen (TN) and total phosphorus (TP) from different land use types simulated by the Soil and Water Assessment Tool (SWAT) and the event mean concentration (EMC) method.
Table 1.
The average annual and per unit area yield of total nitrogen (TN) and total phosphorus (TP) from different land use types simulated by the Soil and Water Assessment Tool (SWAT) and the event mean concentration (EMC) method.
| Source | TN | TP | ||
|---|---|---|---|---|
| Load (t/y) | Contribution (t/km2) | Load (t/y) | Contribution (t/km2) | |
| Dry farm land NPS by SWAT | 21,600 | 3.38 | 8690 | 1.36 |
| Paddy field NPS by SWAT | 22,600 | 6.28 | 1220 | 0.34 |
| Forestland NPS by SWAT | 3840 | 0.29 | 95.1 | 0.01 |
| Grassland NPS by SWAT | 8.44 | 0.24 | 0.12 | 0.00 |
| Wetland NPS by SWAT | 2.32 | 0.02 | 1.18 | 0.01 |
| Urban NPS by SWAT | 2100 | 0.67 | 27.5 | 0.01 |
| Urban NPS by EMC | 853 | 0.75 | 266 | 0.23 |
Table 2.
Comparison of the contribution of heavy metal pollutant loads obtained in this study and previous publications, units (g/ha·y).
Table 2.
Comparison of the contribution of heavy metal pollutant loads obtained in this study and previous publications, units (g/ha·y).
| Study Area | Pb | Cu | Cr | Ni | Cd | Zn | Reference |
|---|---|---|---|---|---|---|---|
| Central Liaoning Urban Agglomeration | 227 | 346 | 248 | 87 | 3.05 | 1220 | This study |
| Northeast corner of China bordering Russia | 20.21 | 21.75 | 47.35 | 47.35 | - | - | [56] |
| Muskeg River Watershed | 0–0.7 | 0–8.2 | - | - | - | - | [57] |
| Liuyang River | - | - | - | - | - | 0–500 | [58] |
Publisher’s Note: MDPI stays neutral with regard to jurisdictional claims in published maps and institutional affiliations. |
© 2021 by the authors. Licensee MDPI, Basel, Switzerland. This article is an open access article distributed under the terms and conditions of the Creative Commons Attribution (CC BY) license (https://creativecommons.org/licenses/by/4.0/).
Share and Cite
MDPI and ACS Style
Zong, M.; Hu, Y.; Liu, M.; Li, C.; Wang, C.; Liu, J. Quantifying the Contribution of Agricultural and Urban Non-Point Source Pollutant Loads in Watershed with Urban Agglomeration. Water 2021, 13, 1385. https://doi.org/10.3390/w13101385
AMA Style
Zong M, Hu Y, Liu M, Li C, Wang C, Liu J. Quantifying the Contribution of Agricultural and Urban Non-Point Source Pollutant Loads in Watershed with Urban Agglomeration. Water. 2021; 13(10):1385. https://doi.org/10.3390/w13101385
Chicago/Turabian StyleZong, Min, Yuanman Hu, Miao Liu, Chunlin Li, Cong Wang, and Jianxin Liu. 2021. "Quantifying the Contribution of Agricultural and Urban Non-Point Source Pollutant Loads in Watershed with Urban Agglomeration" Water 13, no. 10: 1385. https://doi.org/10.3390/w13101385
Note that from the first issue of 2016, this journal uses article numbers instead of page numbers. See further details here.