Article

Daily Variation of Lipid Regulators and Personal Care Products in a River Impacted by Domestic Effluents in Southern Brazil

by
Franciane de Almeida Brehm Goulart
1,
Gabriela Reichert
2,3,*,
Tais Cristina Felippe
1,
Alinne Mizukawa
3,
Jhonatas Antonelli
3,
Cristóvão Scapulatempo Fernandes
3 and
Júlio César Rodrigues de Azevedo
1
1
Department of Chemistry and Biology, Federal Technology University of Paraná, Curitiba 81280-340, PR, Brazil
2
Karlsruhe Institute of Technology, P.O. Box 6980, 76049 Karlsruhe, Germany
3
Department of Hydraulics and Sanitation, Federal University of Parana, Curitiba 81280-340, PR, Brazil
*
Author to whom correspondence should be addressed.
Water 2021, 13(10), 1393; https://doi.org/10.3390/w13101393
Submission received: 1 April 2021 / Revised: 6 May 2021 / Accepted: 8 May 2021 / Published: 17 May 2021
(This article belongs to the Special Issue Monitoring, Modelling and Management of Water Quality II)

Abstract

:
In urban areas, wastewater treatment plants (WWTPs) play a major role in the water quality of rivers. The removal efficiency of emerging contaminants by WWTPs is strongly correlated with the type of treatment and the hydraulic retention time (HRT) of the process, which can vary according to the volumetric influent flow of wastewater and occasional peak flows. This paper aims, for the first time, to assess the daily variation of lipid regulators and personal care products in an urban river impacted by domestic effluents. Samples were collected upstream and downstream of a WWTP. The concentrations downstream of the effluent discharge were higher than upstream, but they varied significantly during the day. Concentration peaks upstream of the WWTP were detected at 07:00, 15:00 and 21:00, while downstream of the effluent discharge, concentration peaks occurred between 13:00 and 19:00 and between 21:00 and 23:00. The highest downstream concentrations of triclosan and methylparaben (420 ng L−1 and 460 ng L−1) were 6.8 and 5.4 times higher than the lowest concentrations detected, respectively. These results show that in WWTP-impacted rivers, the time of the sampling has a great influence on the final results and conclusions of a monitoring study.

1. Introduction

Wastewater treatment plants (WWTPs) are known to be the source of many pollutants that reach water resources, including emerging contaminants. These substances may include preservatives, antimicrobials, blood pressure regulators, lipid regulators, analgesics, anti-inflammatories, hormones, UV filters, surfactants, flame retardants, artificial sweeteners and others [1]. Many of these substances are components of daily use products, such as hygiene consumables, or pharmaceuticals, and can be easily detected in domestic sewage. Among the many types of pharmaceuticals consumed, lipid regulators, such as gemfibrozil and fenoprofen, are drugs used for the continuous treatment of cholesterol and cardiovascular problems. These substances have previously been detected in several WWTPs [2]. Other types of emerging contaminants frequently detected in the effluent of WWTPs are personal care products [3,4]. These substances, such as parabens and antimicrobial agents, may be found in moisturizers, conditioners, and detergents, and are used to increase the durability of several products [5]. Often, they are topically applied, and only small fractions of the chemicals are absorbed by the body, while most of the product is washed away, reaching the WWTPs.
Emerging contaminants contain complex molecules, and their removal efficiencies in WWTPs are usually low unless advanced treatments are employed [6,7]. In previous studies, high concentrations of emerging contaminants were detected in the effluents of WWTPs, which are discharged in urban rivers [3,4,8,9,10]. In highly urbanized areas, WWTPs may have the capacity to treat wastewater from several thousand inhabitants up to nearly a million, releasing significant concentrations of emerging contaminants into urban rivers. These substances have been detected not only in surface waters, but in many other environmental compartments all over the world in the last few years, and are already considered ubiquitous pollutants [10,11,12,13,14].
Detecting and monitoring emerging contaminants in different locations are very important, mainly in areas where this kind of research is not so frequent, such as some areas in South and Central America, and other countries [15,16]. Although the presence of emerging contaminants in urban rivers has been extensively studied, knowledge gaps clearly prevail. The detection of emerging contaminants is not performed very frequently, due to the complexity and costs of the analyses. The studies often report monitoring frequencies in surface water of a few campaigns per year [17], or even only in dry and rainy seasons [18] to assess the seasonality. In studies analyzing the effluent of WWTPs, the frequency is lower [19,20], with some such studies consisting of only a single sampling campaign [7,21].
What makes sampling results even more complex is that the influent flow in a WWTP fluctuates during the day. Usually, WWTPs have higher volumetric inflow of domestic sewage at the beginning and at the end of the working day, as well as during lunchtime [22]. Due to an increase in the influent flow, effluent peak flows can also occur, depending on the capacity and type of treatment employed by a given WWTP. In addition, peak flows can influence WWTP hydrodynamics, forcing the wastewater to spend less time in each treatment step. The problem is that shorter hydraulic retention times could mean lower treatment efficiencies, and consequently, higher concentrations of emerging contaminants in the final effluent [23,24]. Therefore, the amount of effluent discharged, and the concentration of emerging contaminants and nutrients in urban rivers affected by WWTP, may vary significantly during the day.
Following the above discussion, the goal of this research was to evaluate the concentration of emerging contaminants and nutrients in a WWTP-impacted urban river and their variation throughout the day. We chose two sampling points, one upstream and another downstream of the WWTP, to observe possible effects of effluent discharge and evaluate possible implications on the results of monitoring campaigns. Two lipid regulators (gemfibrozil, fenofibrate), four parabens (methylparaben, ethylparaben, propylparaben, butylparaben), and triclosan were analyzed. Nitrogen, phosphorus, and other physical and chemical parameters were also analyzed.

2. Materials and Methods

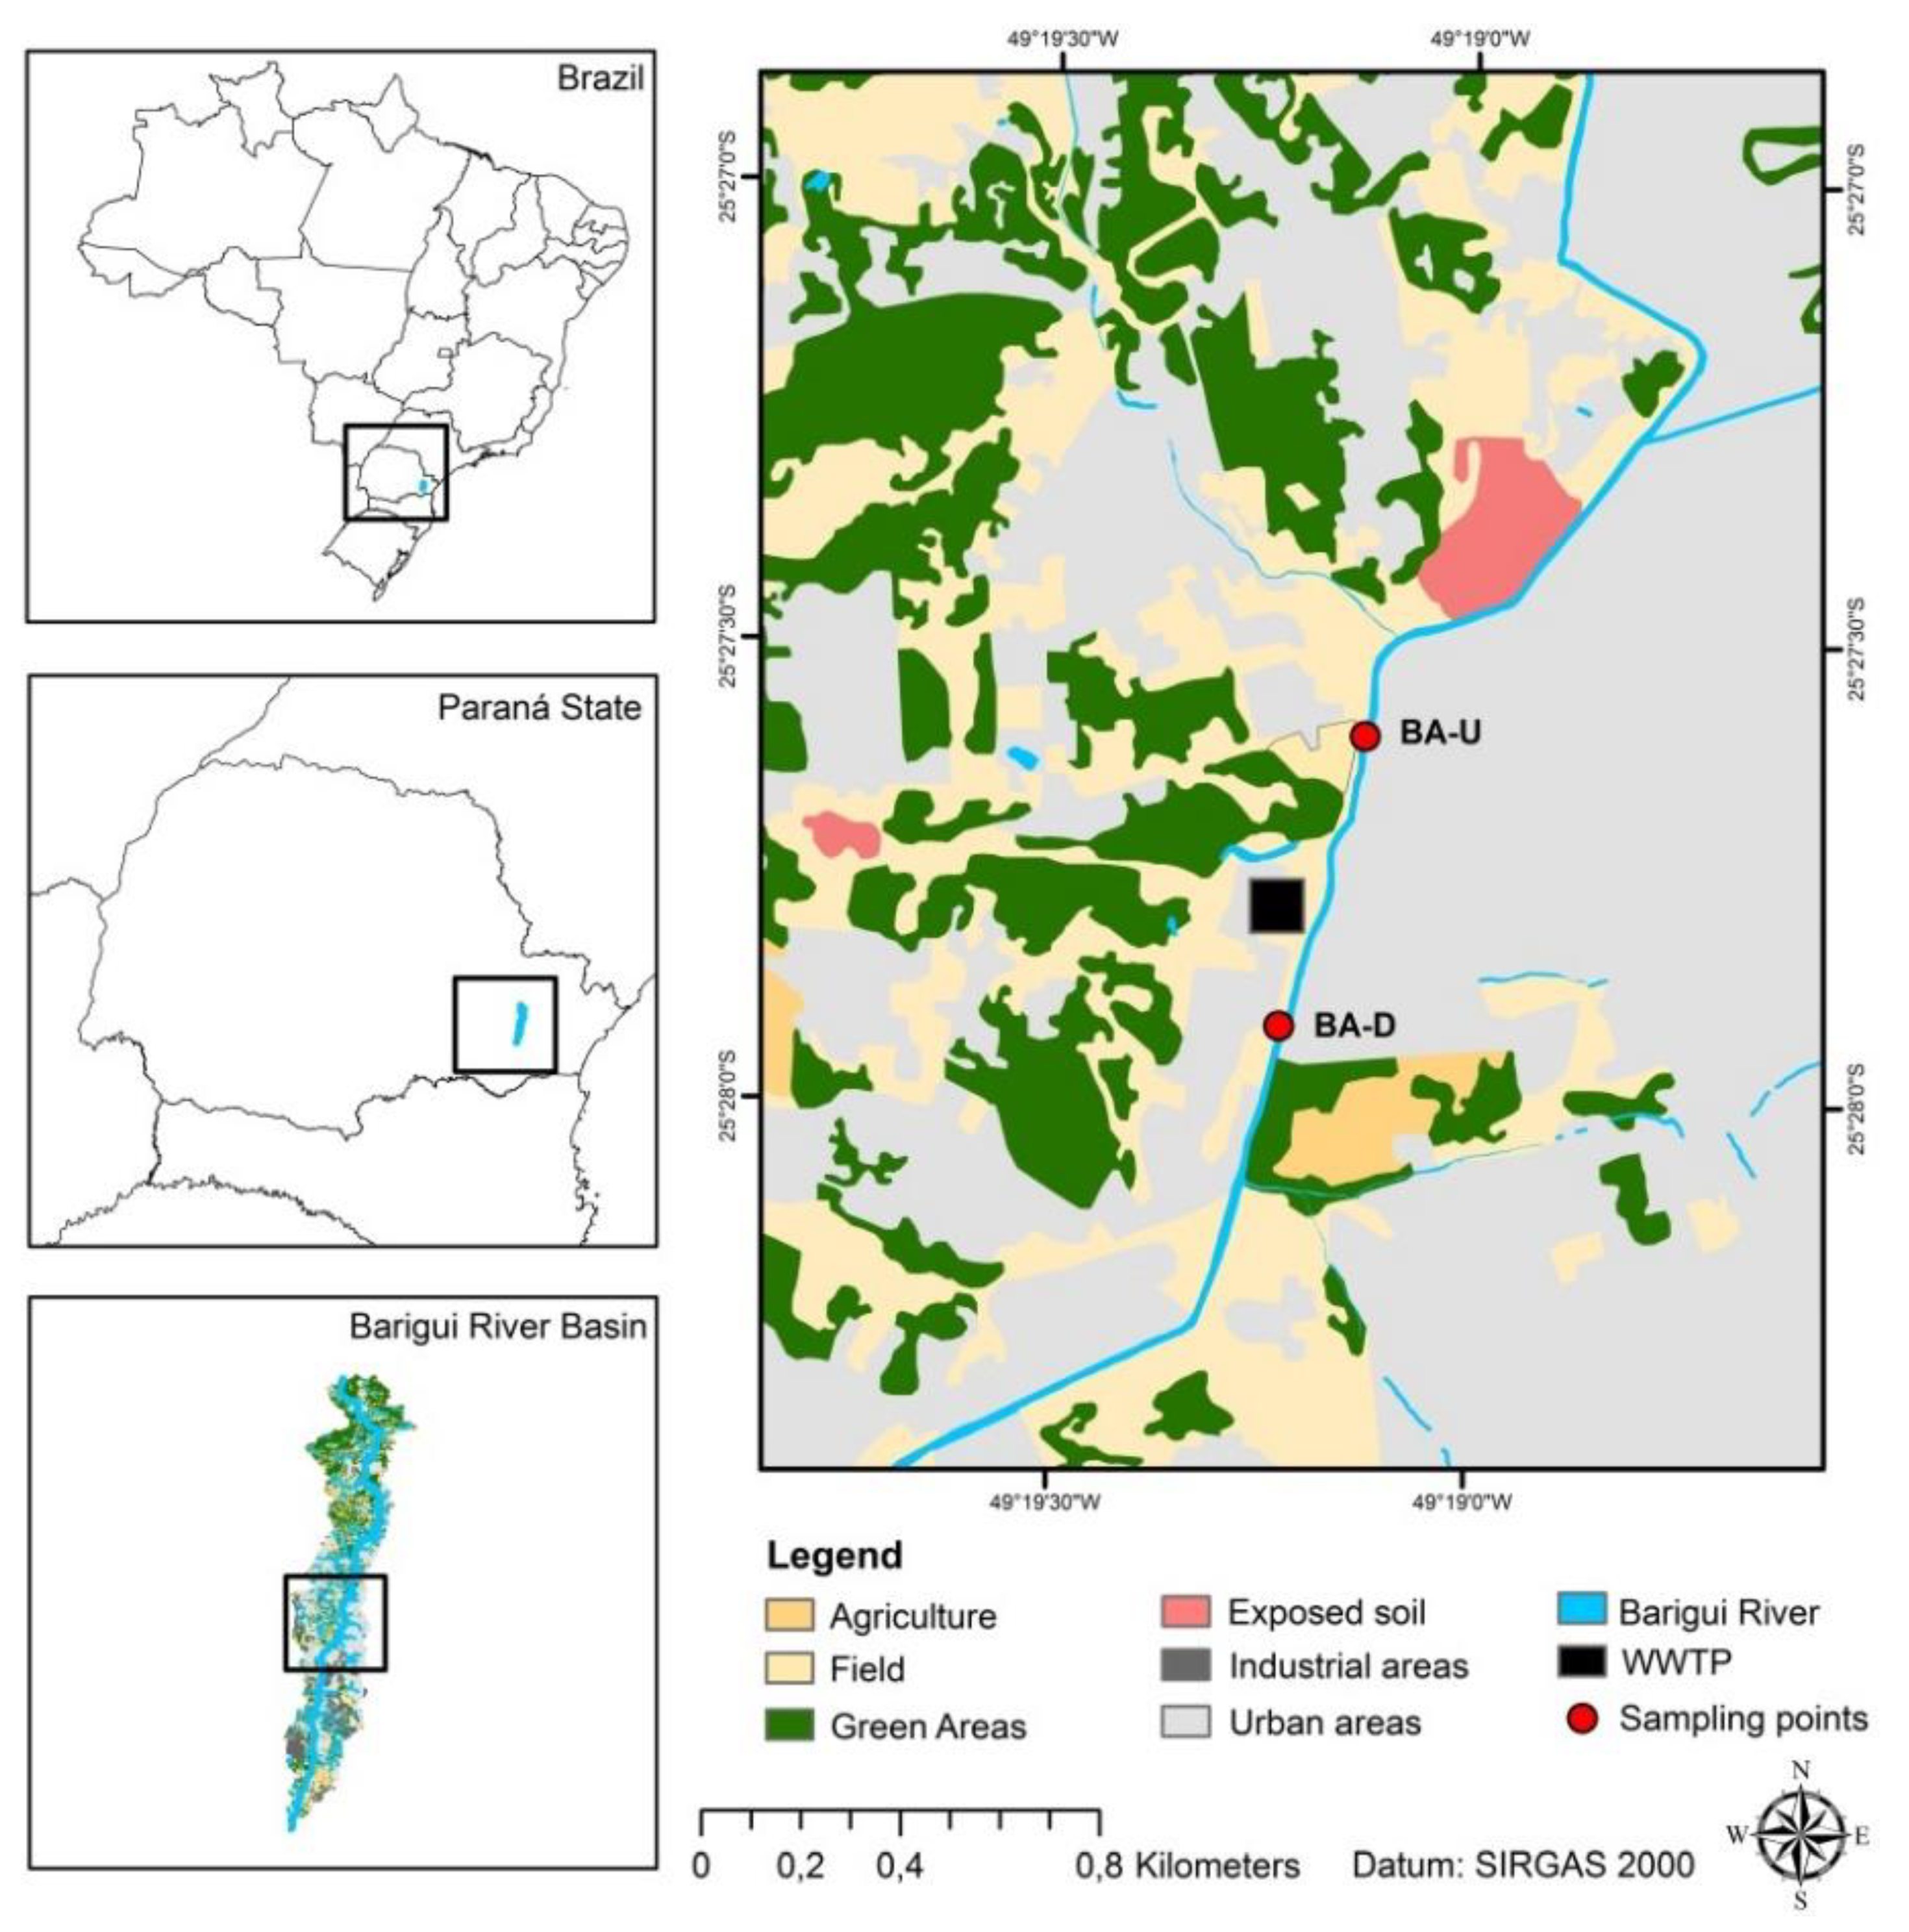
2.1. Site Description, Sampling Campaigns and Water Quality Parameters

The Barigui River crosses the cities of Almirante Tamandaré, Curitiba and Araucária, in southern Brazil. There is a Karst aquifer in the Upper Barigui River Basin, currently used as a potable water source for the local population. The river has a length of 66 km and a 279 km2 catchment area, mainly located inside urban areas. To protect the sources of the river and the aquifer, environmental protection areas were created. However, the presence of urban areas and industries along the river threatens the water quality.
Although most of the area is equipped with separate sewage collection systems, many households are not connected to the sewage pipelines and only 64% of the domestic sewage is treated [25]. The present study focuses on the Santa Quitéria WWTP, located in the city of Curitiba, one of the most populated areas in the basin. This WWTP provides sewage treatment to 190,000 inhabitants and has an average treatment capacity of 0.42 m3 s−1. The treatment consists of a preliminary step designed to remove coarse solids, followed by biological treatment, which includes six upflow anaerobic sludge blanket reactors (UASBs), and subsequent dissolved air flotation. The hydraulic retention time (HRT) of each UASB is approximately 8 h [26]. The map of the Barigui River Basin, land use, and the location of the Santa Quitéria WWTP are depicted in Figure 1.
The sampling campaign was performed in June 2016. According to the institute Águas Paraná (http://www.aguasparana.pr.gov.br/pagina-264.html, accessed on 2 October 2020), the river flow in this section was 7.17 m3 s−1 on the sampling day. Two sampling points were chosen: one upstream (BA-U) and one downstream (BA-D) of the WWTP. The samples were collected every two hours, beginning at 7:00 on 28 June and ending at 5:00 on the next day. The water samples were collected in a Van Dorn sampler and stored in 4 L amber glass bottles that were tightly sealed with lids. The bottles were previously decontaminated with Extran 5% (v/v), rinsed with Mili Q water, dried in an oven (100 °C), rinsed with 20 mL of acetone, and dried again. After sampling, the water samples were immediately taken to the laboratory.
In the field, dissolved oxygen (DO), pH, temperature, conductivity, turbidity, total dissolved solids (TDS), and salinity were measured in each sample with a multiparameter probe (HI9828, Hanna Instruments, Woonsocket, RI, USA) and a turbidimeter (HI98703, Hanna Instruments, Woonsocket, RI, USA). Ammoniacal nitrogen, nitrite, nitrate, and orthophosphate were measured in the final composite samples according to the methods 4500-NH3 F., 4500-NO2-, 4500-NO3-E., and 4500-P E., of the “Standard methods for the examination of water and wastewater” (APHA, 2005).

2.2. Chemicals and Reagents

The target compounds methylparaben (≥99%), ethylparaben (99%), propylparaben (≥99%), butylparaben (≥99%), triclosan (≥97%), gemfibrozil (≥98.5%) and fenofibrate (≥99%) were purchased from Sigma Aldrich (Steinheim, Germany). The HPLC-grade solvents acetone, acetonitrile, methanol, ethyl acetate, and hexane were acquired from J.T. Baker (Philipsburg, PA, USA). The silylation reagent N,O-Bis(trimethylsilyl)trifluoroacetamide (BSTFA) + 1% trimethylchlorosilane (TMCS) (≥98.5%) was purchased from Sigma Aldrich (Steinheim, Germany).

2.3. Solid-Phase Extraction

Prior to the extraction, 1 L of each composite water sample was filtered in glass fiber filters (0.7 µm) and acidified to pH ≤ 3 with hydrochloric acid (HCl), supplied by Merck (Darmstadt, Germany). Subsequently, the samples went through the process of solid-phase extraction. The cartridges (500 mg HLB acquired from Supelco, Bellefonte, AR, USA) were conditioned with 6 mL of hexane, 6 mL of acetone, and 6 mL of acidified (HCl, pH ≤ 3) Mili Q water. The extraction involved volumetric flow of 6 to 8 mL min−1. The cartridges were then vacuum-dried and eluted with 6 mL of acetonitrile and 6 mL of acetone. The samples were evaporated at 40 °C in a TE-211 rotary evaporator from Tecnal (Piracicaba, Brazil), redissolved with 1 mL of acetonitrile, sonicated, and transferred to vials. To analyze the samples by gas chromatography (GC), the samples went through derivatization. An aliquot of 200 µL of each sample was transferred to an insert and evaporated at room temperature. A volume of 50 µL of BSTFA+TMCS was added to the inserts. The samples were heated in an oven (60 °C) for 30 min. After cooling down, 150 µL of ethyl acetate was added to each sample.

2.4. GC-MS/MS

The samples were analyzed in a 7890A gas chromatograph with automated sampling coupled to a triple quadrupole mass spectrometer (7000 Series), purchased from Agilent Technologies (Santa Clara, CA, USA). An HP-5 msi silica capillary column of 30 m × 0.25 mm × 0.25 µm was employed to separate the target compounds. A volume of 1 μL of each sample was injected in the GC-MS/MS in splitless mode. The oven temperature was programmed in ramp mode: 100 °C during the first 2 min and then a constant heating rate of 15 °C min−1 until 180 °C, changing to a heating rate of 6 °C min−1 until 270 °C and 5 °C min−1 until 310 °C, remaining at this temperature for 3 min. The injector, transfer line, and source ion temperatures were 280 °C, 280 °C and 270 °C, respectively. The chosen mobile phase was helium in a constant flow of 1 mL min−1. The mass spectrometry analysis was performed in multiple reaction monitoring (MRM) mode with an ionization of 70 electron volts (eV). The total analysis time was 33.33 min. The methodology was based on this study [27].

2.5. Validation and QA/QC Protocols

We performed the solid-phase extraction process with blank samples, to assess possible contaminations during the procedures. Standard solutions with different concentrations were spiked in water samples, to evaluate recovery efficiencies, reproducibility, and repeatability. The limit of detection (LOD) and the limit of quantification (LOQ) were defined as
LOD = 3 * SDb/S
LOQ = 10 * SDb/S
where SDb is the standard deviation of at least three blank samples and S is the slope of the calibration curve. Table 1 shows LOD and LOQ values, as well as other parameters of the chromatographic method for all compounds: methylparaben (MeP), ethylparaben (EtP), propylparaben (PrP), butylparaben (BuP), triclosan (TCS), fenofibrate (FEN) and gemfibrozil (GEM). Additional information about the chromatographic method can be found in the Supplementary Material (Table S1), including recovery values, repeatability, and reproducibility of the method.

2.6. Statistical Analysis

Pearson’s correlation (r) analysis was performed with Statistica 10.0 software (StatSoft. Inc., Tulsa, OK, USA). Correlation between parameters was considered significant with a p-value < 0.05.

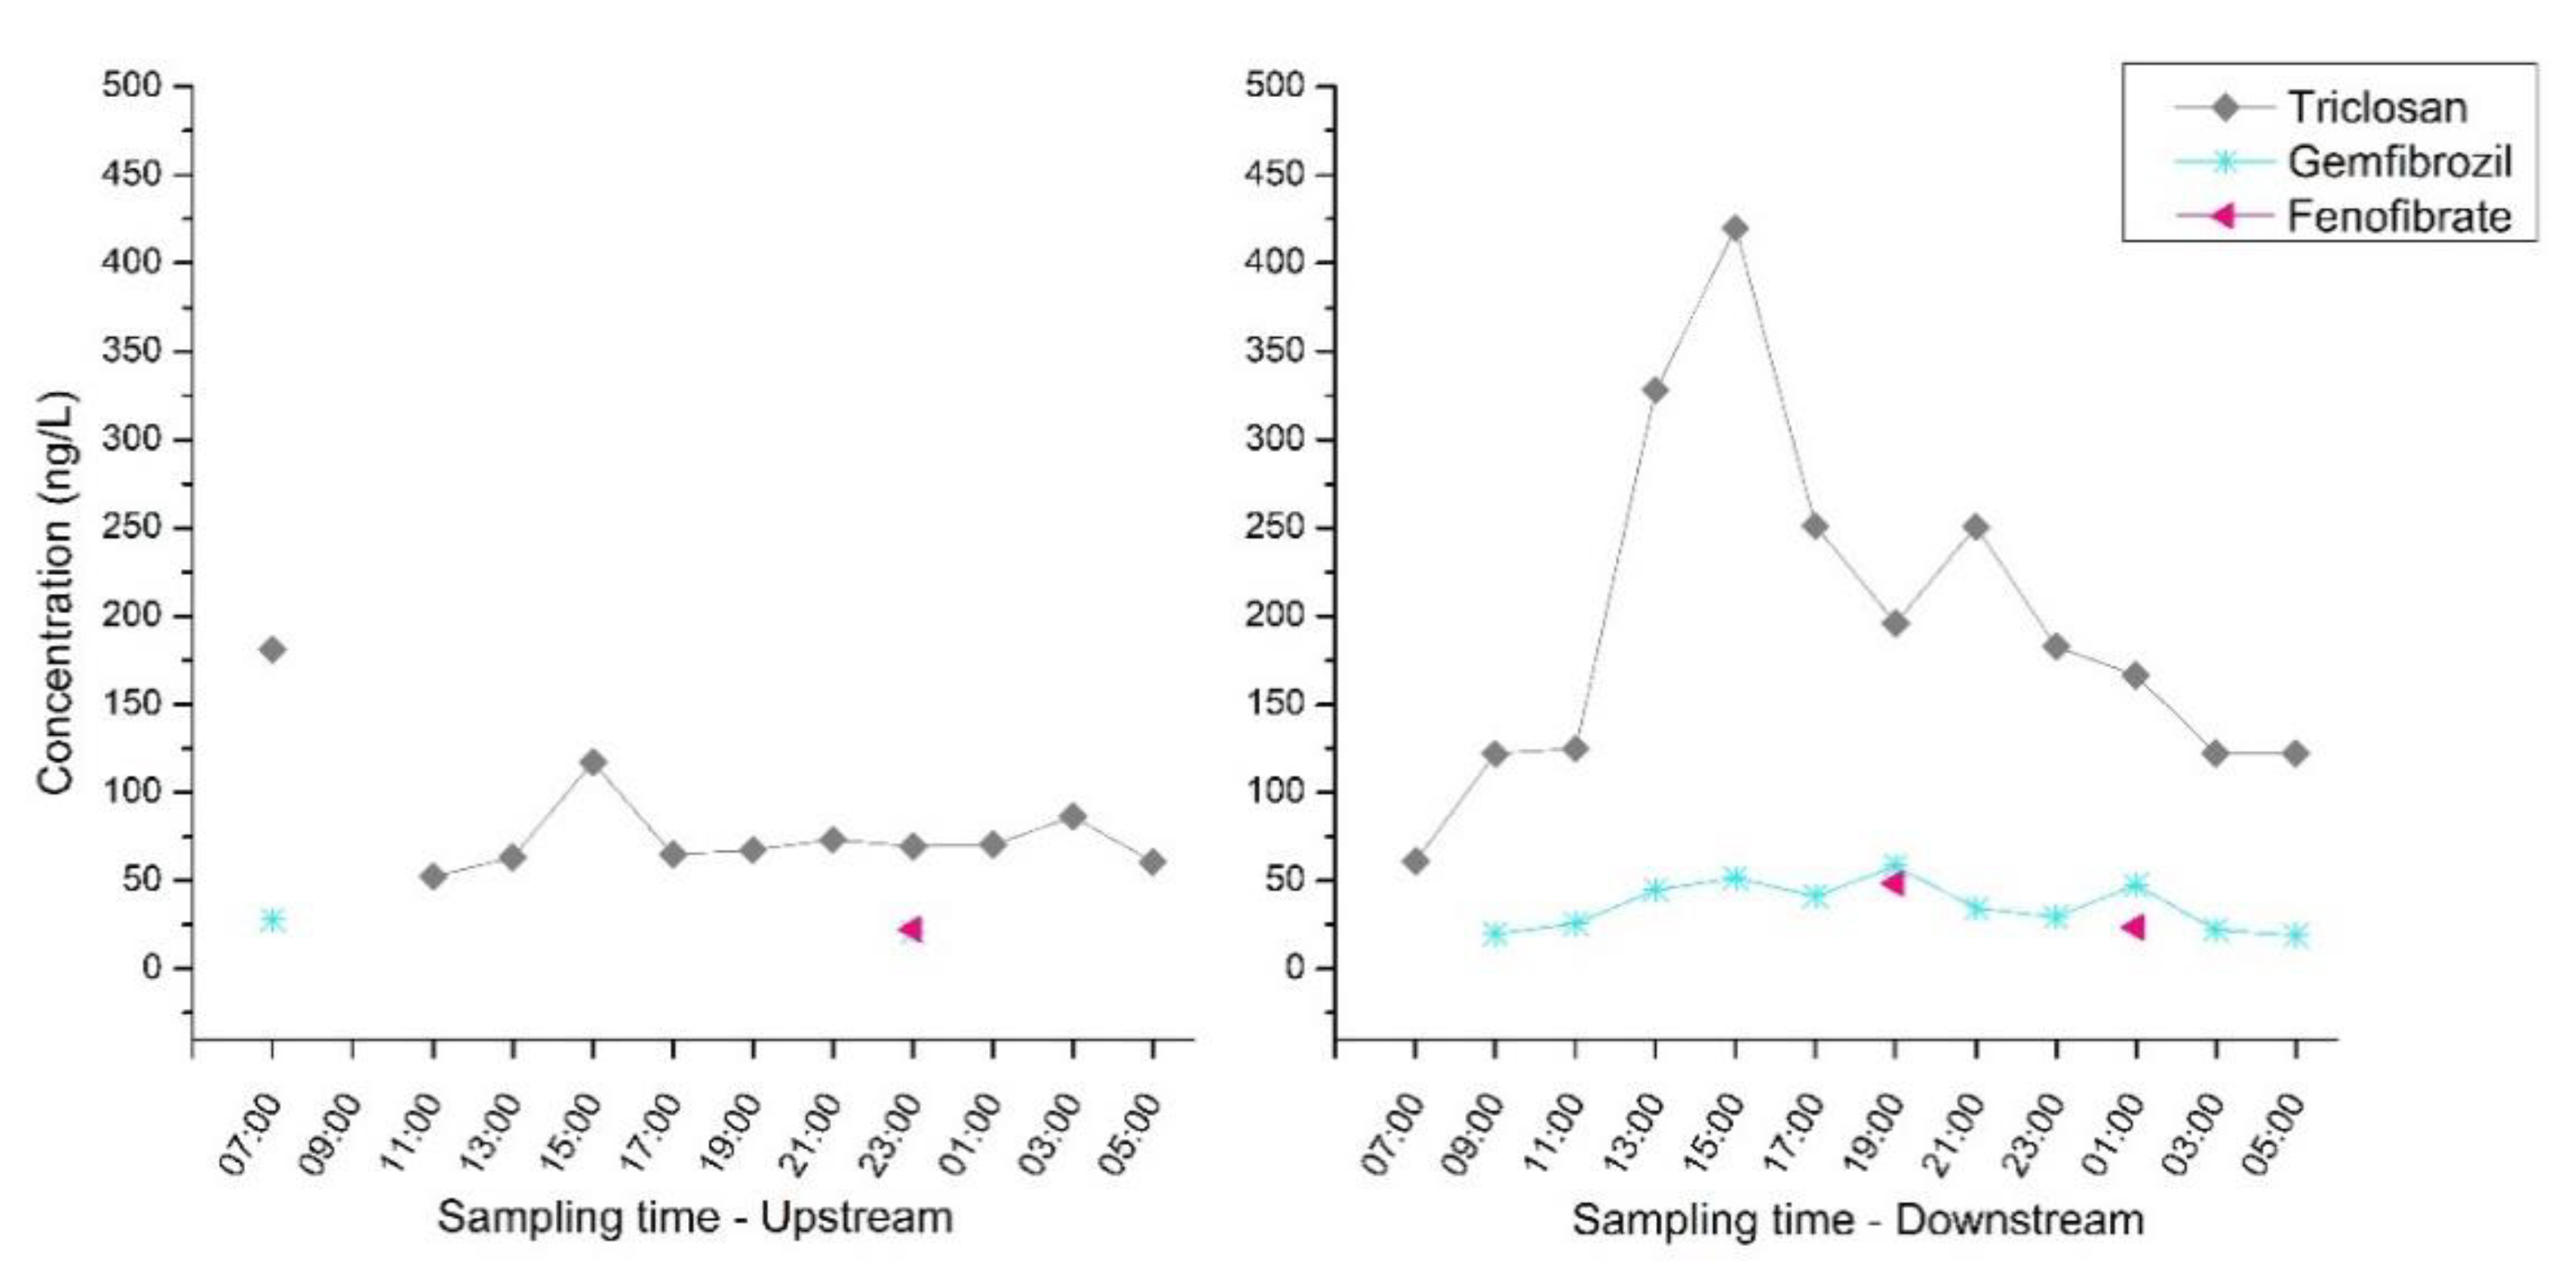
3. Results and Discussion

The concentrations detected during the campaign are depicted in Figure 2 (GEM, FEN and TCS), and Figure 3 (parabens). Sample properties (pH, turbidity, temperature, etc.) and nutrient concentrations can be found in the Supplementary Material (Tables S2 and S3 and Figure S1). The results show that FEN was only detected in one BA-U sample and two BA-D samples, and we could not evaluate its daily variation. Once absorbed by the human organism, FEN is hydrolyzed and transformed into the active metabolite, fenofibric acid. It is very hard to detect unaltered FEN in plasma or urine since the human body mainly excretes the metabolite, but not the parent compound [28]. FEN is also highly lipophilic and almost insoluble in water (0.128 mg L−1). GEM, another lipid regulator, was detected in only one of the BA-U samples, but in almost all BA-D samples, after the discharge of the effluent. Studies have shown that the removal efficiencies of GEM in WWTPs are usually low, and the treated effluent can contain high concentrations of this compound [2]. Besides, GEM can be a very persistent contaminant in river ecosystems [29]. Detected concentrations varied from 19 to 58 ng L−1, with higher concentrations at 15:00 and 19:00 and lower concentrations at 09:00 and 05:00.
TCS was detected in all samples, except at 09:00 in BA-U, and the concentrations and variation of TCS were visibly higher after the discharge of the WWTP. TCS varied from 52 to 180 ng L−1 in BA-U and 61 to 420 ng L−1 in BA-D. In BA-U samples, peak concentrations occurred at 07:00 and 15:00, while for BA-D, peak concentrations occurred between 13:00 and 15:00, and the lowest concentration was detected at 07:00. Previous studies showed that the removal of TCS in WWTP is between 30 and 80%, but the concentrations detected in the effluent are still high and could contaminate the environment [4,19]. The detection of TCS in surface waters in Brazil and in other countries is very frequent, indicating this is a ubiquitous compound. TCS is very toxic to several organisms, and, therefore, it is frequently listed in monitoring priority lists [15,30,31,32].
The detection frequencies of MeP and PrP were high, both in BA-U and BA-D samples. MeP and TCS were strongly correlated (r = 0.925; p < 0.0001), and MeP also had a good correlation with PrP (r = 0.949; p < 0.0001). The concentrations were visibly higher after the discharge of the WWTP effluent. These two parabens are often found together in daily products to enhance their durability, and it is very common to detect MeP and PrP in higher concentrations than those of other parabens, due to their frequent use [10]. Similar to TCS, daily variations were pronounced after the discharge of the WWTP, showing that the effluent and flow variations influence the concentrations of emerging contaminants in the river throughout the day. Of the parabens, MeP showed the most pronounced variation throughout the day. The concentrations ranged from 66 to 132 ng L−1 in BA-U and from 85 to 461 ng L−1 in BA-D, with peak concentration at 15:00. The peak concentration of PrP was 117 ng L−1, also at 15:00, but the variation of this compound throughout the day was not as high as for MeP.
The concentrations of nutrients and other water quality parameters also varied throughout the day. According to the results, there were significant positive correlations between ammoniacal nitrogen and emerging contaminants (r > 0.80, p < 0.002), except for BuP and FEN. Significant correlations were found for orthophosphate and TCS (r = 0.86, p < 0.001), MeP (r = 0.70, p < 0.001), EtP (r = 0.74, p < 0.001), and PrP (r = 0.65, p = 0.001) as well. Salinity, TDS, and conductivity also correlated positively (r > 0.75, p < 0.023) with the concentrations of GEM, TCS, and all the parabens, except for BuP. On the other hand, significant negative correlations were detected for DO with all the compounds, especially for GEM (r = −0.78, p < 0.001), MeP (r = −0.76, p < 0.001), and EtP (r = −0.71, p < 0.001). The parameters pH, turbidity, and nitrite showed neither strong nor significant correlations with the concentration of emerging contaminants. In previous studies, the impact of treated effluents on water quality parameters, such as TDS, salinity, conductivity, and nutrients, together with a depletion in oxygen concentrations due to the presence of labile organic matter in the effluent, had been established [33,34]. According to our results, there are differences in the two sampling points (Tables S2 and S3, and Figure S1 in Supplementary Material), indicating worse water quality parameters downstream of the WWTP. Therefore, all of these correlations may indicate the WWTP as a main contributor to the high concentration of nutrients, salinity, TDS, conductivity, and consequently emerging contaminants.
The concentrations varied in different ways upstream and downstream of the WWTP. Most of the high concentrations in BA-U were detected at 07:00, 15:00 and 21:00. The concentration peaks at BA-U usually coincided with daily periods of people’s hygiene routines or with work breaks, e.g., early in the morning, at night, and in the afternoon. During these periods, sewage production is higher. The Santa Quitéria WWTP discharge does not influence the water quality in BA-U, but the analyses showed the presence of emerging contaminants, mainly TCS, MeP, and PrP. Therefore, the contamination source could be raw sewage, illegally discharged into the river, which still is common practice in Brazil and Latin America, and an important source of emerging contaminants into urban rivers [15,30,35].
On the other hand, the highest concentrations of BA-D were detected between 13:00 and 17:00 (especially at 15:00) and at night, between 21:00 and 23:00. The main source of pharmaceuticals and personal care products in BA-D is probably the WWTP, which can discharge up to 420 L s−1 of effluent in the river. Considering the existence of peak flows in the WWTP and an HRT of approximately 8 h or more due to the UASB treatment [26], the high concentrations in the afternoon are probably related to the sewage produced during the morning, between 06:00 and 09:00, when most people wake up and perform their morning hygiene routine. The night peak, between 21:00 and 23:00, is probably related to the high volume of sewage usually produced between 13:00 and 15:00, during and after the lunch break.
The results show an important variation in the concentrations detected at different periods of the day. The variations were more significant downstream of the WWTP, but they were also observed upstream. For some compounds such as MeP, TCS, and GEM, the highest concentrations were up to six times higher than the lowest concentrations detected in BA-D. Considering that the samples analyzed were composite samples, a mix of three samples collected every 30 min, the concentrations of the individual samples could be even higher. The results also evidence a known problem of grab samples—they reflect the situation at a determined point of time and do not provide a wider perspective [36]. Furthermore, the results demonstrate that in WWTP-impacted rivers, sampling time could significantly influence the results and conclusions of a monitoring study.

4. Conclusions

This studyshowed that the water quality in urban rivers can vary greatly throughout the day, including the concentrations of emerging contaminants. These variations seem to be even more significant downstream of WWTPs. Concentration peaks were detected in the Barigui River during different periods of the day for BA-U (upstream) and BA-D (downstream), mainly for compounds such as TCS, MeP, and PrP. The concentrations downstream of the effluent discharge were also higher, indicating that WWTP plays a major role in the presence of emerging contaminants in the river and the variation of their concentrations. According to our results, possible daily variations in the concentrations of emerging contaminants and other water quality parameters should be taken into consideration when planning monitoring studies, in particular in WWTP-impacted river basins. Results obtained from grab samples and low-frequency monitoring schedules should also be interpreted carefully. Daily and hourly variations should be taken into consideration to avoid misconceptions and erroneous conclusions.

Supplementary Materials

The following are available online at https://www.mdpi.com/article/10.3390/w13101393/s1, Figure S1: Nutrients concentrations, Table S1: Validation parameters and information about the chromatographic method, Table S2: Samples properties—Temperature, pH, and conductivity, Table S3: Samples properties—Turbidity, DO, TDS and salinity.

Author Contributions

Conceptualization: F.d.A.B.G., J.C.R.d.A., C.S.F. Methodology and validation: F.d.A.B.G., T.C.F. Formal analysis: F.d.A.B.G., G.R., T.C.F., A.M., J.A. Resources: J.C.R.d.A., C.S.F. Data curation: F.d.A.B.G., G.R. Writing—original draft preparation: F.d.A.B.G., G.R. Writing—review and editing: F.d.A.B.G., G.R., A.M., C.S.F. Visualization: F.d.A.B.G., G.R. Supervision, Project administration, Funding acquisition: J.C.R.d.A., C.S.F. All authors have read and agreed to the published version of the manuscript.

Funding

This study was supported by Coordenação de Aperfeiçoamento de Pessoal de Nível Superior—Brasil (CAPES)—Finance Code 001 and the Brazilian National Council for Scientific and Technological Development (CNPq) by Bolsa Productividade (proc. 302736/2016-6) and Call MCTIC/CNPq N° 28/2018 (proc. 407157/2018-2).

Informed Consent Statement

Not applicable.

Data Availability Statement

Data is contained within the article or Supplementary Material.

Acknowledgments

Goulart et al. also acknowledge the Federal University of Paraná (UFPR), the Postgraduate Program of Water Resources and Environmental Engineering (PPGERHA), and the Water Quality Research Laboratory (LEAQUA).

Conflicts of Interest

The authors declare no conflict of interest.

References

  1. Agüera, A.; Bueno, M.J.M.; Fernández-Alba, A.R. New trends in the analytical determination of emerging contaminants and their transformation products in environmental waters. Environ. Sci. Pollut. Res. 2013, 20, 3496–3515. [Google Scholar] [CrossRef] [PubMed]
  2. Patrolecco, L.; Capri, S.; Ademollo, N. Occurrence of selected pharmaceuticals in the principal sewage treatment plants in Rome (Italy) and in the receiving surface waters. Environ. Sci. Pollut. Res. 2014, 22, 5864–5876. [Google Scholar] [CrossRef] [PubMed]
  3. Ryu, J.; Yoon, Y.; Oh, J. Occurrence of endocrine disrupting compounds and pharmaceuticals in 11 WWTPs in Seoul, Korea. KSCE J. Civ. Eng. 2010, 15, 57–64. [Google Scholar] [CrossRef]
  4. Lehutso, R.F.; Daso, A.P.; Okonkwo, J.O. Occurrence and environmental levels of triclosan and triclocarban in selected wastewater treatment plants in Gauteng Province, South Africa. Emerg. Contam. 2017, 3, 107–114. [Google Scholar] [CrossRef]
  5. Guo, Y.; Wang, L.; Kannan, K. Phthalates and Parabens in Personal Care Products from China: Concentrations and Human Exposure. Arch. Environ. Contam. Toxicol. 2013, 66, 113–119. [Google Scholar] [CrossRef] [PubMed]
  6. Deblonde, T.; Cossu-Leguille, C.; Hartemann, P. Emerging pollutants in wastewater: A review of the literature. Int. J. Hyg. Environ. Health 2011, 214, 442–448. [Google Scholar] [CrossRef]
  7. Froehner, S.; Piccioni, W.; Machado, K.S.; Aisse, M.M. Removal Capacity of Caffeine, Hormones, and Bisphenol by Aerobic and Anaerobic Sewage Treatment. Water Air Soil Pollut. 2010, 216, 463–471. [Google Scholar] [CrossRef]
  8. Huerta, B.; Rodriguez-Mozaz, S.; Nannou, C.; Nakis, L.; Ruhí, A.; Acuña, V.; Sabater, S.; Barcelo, D. Determination of a broad spectrum of pharmaceuticals and endocrine disruptors in biofilm from a waste water treatment plant-impacted river. Sci. Total. Environ. 2016, 540, 241–249. [Google Scholar] [CrossRef] [Green Version]
  9. Froehner, S.; Machado, K.S.; Falcão, F.; Monnich, C.; Bessa, M. Inputs of Domestic and Industrial Sewage in Upper Iguassu, Brazil Identified by Emerging Compounds. Water Air Soil Pollut. 2011, 215, 251–259. [Google Scholar] [CrossRef]
  10. Haman, C.; Dauchy, X.; Rosin, C.; Munoz, J.-F. Occurrence, fate and behavior of parabens in aquatic environments: A review. Water Res. 2015, 68, 1–11. [Google Scholar] [CrossRef]
  11. Azzouz, A.; Ballesteros, E. Combined microwave-assisted extraction and continuous solid-phase extraction prior to gas chromatography–mass spectrometry determination of pharmaceuticals, personal care products and hormones in soils, sediments and sludge. Sci. Total. Environ. 2012, 419, 208–215. [Google Scholar] [CrossRef] [PubMed]
  12. Durán-Álvarez, J.; Prado, B.; Gonzalez, D.; Sánchez, Y.; Jiménez-Cisneros, B. Environmental fate of naproxen, carbamazepine and triclosan in wastewater, surface water and wastewater irrigated soil—Results of laboratory scale experiments. Sci. Total. Environ. 2015, 538, 350–362. [Google Scholar] [CrossRef] [PubMed]
  13. Rossato, M.; Castro, I.B.; Paganini, C.L.; Colares, E.P.; Fillmann, G.; Pinho, G.L.L. Sex steroid imbalances in the muricid Stramonita haemastoma from TBT contaminated sites. Environ. Sci. Pollut. Res. 2016, 23, 7861–7868. [Google Scholar] [CrossRef]
  14. Pereira, C.D.S.; Maranho, L.A.; Cortez, F.S.; Pusceddu, F.H.; Santos, A.R.; Ribeiro, D.A.; Cesar, A.; Guimarães, L.L. Occurrence of pharmaceuticals and cocaine in a Brazilian coastal zone. Sci. Total. Environ. 2016, 548–549, 148–154. [Google Scholar] [CrossRef] [PubMed]
  15. Reichert, G.; Hilgert, S.; Fuchs, S.; Azevedo, J.C.R. Emerging contaminants and antibiotic resistance in the different environmental matrices of Latin America. Environ. Pollut. 2019, 255, 113140. [Google Scholar] [CrossRef]
  16. Ebele, A.J.; Abdallah, M.A.-E.; Harrad, S. Pharmaceuticals and personal care products (PPCPs) in the freshwater aquatic environment. Emerg. Contam. 2017, 3, 1–16. [Google Scholar] [CrossRef]
  17. Feng, J.; Zhao, J.; Xi, N.; Guo, W.; Sun, J. Parabens and their metabolite in surface water and sediment from the Yellow River and the Huai River in Henan Province: Spatial distribution, seasonal variation and risk assessment. Ecotoxicol. Environ. Saf. 2019, 172, 480–487. [Google Scholar] [CrossRef]
  18. Yao, L.; Wang, Y.; Tong, L.; Li, Y.; Deng, Y.; Guo, W.; Gan, Y. Seasonal variation of antibiotics concentration in the aquatic environment: A case study at Jianghan Plain, central China. Sci. Total. Environ. 2015, 527–528, 56–64. [Google Scholar] [CrossRef] [PubMed]
  19. Kramer, R.D.; Filippe, T.C.; Prado, M.R.; De Azevedo, J.C.R. The influence of solid-liquid coefficient in the fate of pharmaceuticals and personal care products in aerobic wastewater treatment. Environ. Sci. Pollut. Res. 2018, 25, 25515–25525. [Google Scholar] [CrossRef]
  20. Pessoa, G.P.; De Souza, N.C.; Vidal, C.B.; Alves, J.A.; Firmino, P.I.M.; Nascimento, R.F.; Dos Santos, A.B. Occurrence and removal of estrogens in Brazilian wastewater treatment plants. Sci. Total. Environ. 2014, 490, 288–295. [Google Scholar] [CrossRef]
  21. Vidal-Dorsch, D.E.; Bay, S.M.; Maruya, K.; Snyder, S.A.; Trenholm, R.A.; Vanderford, B.J. Contaminants of emerging concern in municipal wastewater effluents and marine receiving water. Environ. Toxicol. Chem. 2012, 31, 2674–2682. [Google Scholar] [CrossRef]
  22. Se Souza, S.F.L.; Júnior, G.B.A.; de Oliveira, J.D.F.; de Andrade, A.E.F.; de Luna, Y.H.D.M. Variação de Vazão de Esgoto Doméstico em Sistema Individual de Tratamento de Esgoto. In: VI Congresso Brasileiro de Gestão Ambiental. Available online: http://www.ibeas.org.br/congresso/Trabalhos2015/IX-005.pdf (accessed on 13 September 2020).
  23. Ejhed, H.; Fång, J.; Hansen, K.; Graae, L.; Rahmberg, M.; Magnér, J.; Dorgeloh, E.; Plaza, G. The effect of hydraulic retention time in onsite wastewater treatment and removal of pharmaceuticals, hormones and phenolic utility substances. Sci. Total. Environ. 2018, 618, 250–261. [Google Scholar] [CrossRef] [PubMed]
  24. Queiroz, F.B.; Brandt, E.M.F.; Aquino, S.F.; Chernicharo, C.A.L.; Afonso, R.J.C.F. Occurrence of pharmaceuticals and endocrine disruptors in raw sewage and their behavior in UASB reactors operated at different hydraulic retention times. Water Sci. Technol. 2012, 66, 2562–2569. [Google Scholar] [CrossRef] [PubMed]
  25. SUDERSHA, Superintendência de Desenvolvimento de Recursos Hídricos e Saneamento Ambiental. Plano Diretor de Drenagem para a Bacia do Rio Iguaçu na Região Metropolitana de Curitiba. Ed. final. Curitiba: SUDERHSA, v. 4 (Capacidades do Sistema Atual e Medidas de Controle de Cheias), tomo 4.9 (Modelagem das Linhas de Inundação da Bacia do Rio Barigui). 2002.
  26. Bilotta, P.; Ross, B.Z.L. Estimativa de geração de energia e emissão evitada de gás de efeito estufa na recuperação de biogás produzido em estação de tratamento de esgotos. Eng. Sanit. Ambient. 2016, 21, 275–282. [Google Scholar] [CrossRef] [Green Version]
  27. Filippe, T.C.; Goulart, F.D.A.B.; Mizukawa, A.; De Azevedo, J.C.R. Validation of analytical methodology for determination of Personal Care Products in environmental matrix by GC-MSMS. Eclética Química J. 2018, 43, 30–36. [Google Scholar] [CrossRef]
  28. Stumpf, M.; Ternes, T.A.; Wilken, R.-D.; Rodrigues, S.V.; Baumann, W. Polar drug residues in sewage and natural waters in the state of Rio de Janeiro, Brazil. Sci. Total. Environ. 1999, 225, 135–141. [Google Scholar] [CrossRef]
  29. Grenni, P.; Patrolecco, L.; Ademollo, N.; Tolomei, A.; Caracciolo, A.B. Degradation of Gemfibrozil and Naproxen in a river water ecosystem. Microchem. J. 2013, 107, 158–164. [Google Scholar] [CrossRef]
  30. Mizukawa, A.; Reichert, G.; Filippe, T.C.; Brehm, F.D.A.; De Azevedo, J.C.R. Occurrence and Risk Assessment of Personal Care Products in Subtropical Urban Rivers. Environ. Eng. Sci. 2018, 35, 1263–1272. [Google Scholar] [CrossRef]
  31. Reichert, G.; Mizukawa, A.; Antonelli, J.; Goulart, F.D.A.B.; Filippe, T.C.; De Azevedo, J.C.R. Determination of Parabens, Triclosan, and Lipid Regulators in a Subtropical Urban River: Effects of Urban Occupation. Water Air Soil Pollut. 2020, 231. [Google Scholar] [CrossRef]
  32. Martinez, M.; Mesa, G.A.P. Analysis of triclosan and 4n-nonylphenol in Colombian reservoir water by gas chromatography-mass spectrometry. Water Environ. J. 2012, 27, 387–395. [Google Scholar] [CrossRef]
  33. Carey, R.O.; Migliaccio, K.W. Contribution of Wastewater Treatment Plant Effluents to Nutrient Dynamics in Aquatic Systems: A Review. Environ. Manag. 2009, 44, 205–217. [Google Scholar] [CrossRef] [PubMed]
  34. Odjadjare, E.E.O.; Okoh, A.I. Physicochemical quality of an urban municipal wastewater effluent and its impact on the receiving environment. Environ. Monit. Assess. 2009, 170, 383–394. [Google Scholar] [CrossRef] [PubMed]
  35. Ide, A.H.; Osawa, R.A.; Marcante, L.O.; Pereira, J.D.C.; De Azevedo, J.C.R. Occurrence of Pharmaceutical Products, Female Sex Hormones and Caffeine in a Subtropical Region in Brazil. CLEAN Soil Air Water 2017, 45, 1700334. [Google Scholar] [CrossRef]
  36. Bernard, M.; Boutry, S.; Lissalde, S.; Guibaud, G.; Saüt, M.; Rebillard, J.-P.; Mazzella, N. Combination of passive and grab sampling strategies improves the assessment of pesticide occurrence and contamination levels in a large-scale watershed. Sci. Total. Environ. 2019, 651, 684–695. [Google Scholar] [CrossRef] [PubMed]
Figure 1. The Barigui River Basin, land use and location of the Santa Quitéria WWTP, and the upstream (BA-U) and downstream (BA-D) sampling points in the Barigui River.
Water 13 01393 g001
Figure 2. Daily variation of triclosan, gemfibrozil and fenofibrate.
Water 13 01393 g002
Figure 3. Daily variation of methylparaben, ethylparaben, propylparaben, and butylparaben.
Water 13 01393 g003
Table 1. Parameters for the chromatographic method.
CompoundsPrecursor Ion (m/z)Product Ion (m/z)Collision Energy (V)t (min)LOD (ng L−1)LOQ (ng L−1)
MeP22420958.001448
EtP23822358.713.210
PrP252195159.750.93.2
BuP266210510.906.923
TCS362347515.597.926
FEN2731391521.252.48.2
GEM1941052012.865.418
RT—retention time; LOD—limit of detection; LOQ—limit of quantification; MeP—methylparaben; EtP—ethylparaben; PrP—propylparaben; BuP—butylparaben; TCS—triclosan; FEN—fenofibrate; GEM—gemfibrozil.
Publisher’s Note: MDPI stays neutral with regard to jurisdictional claims in published maps and institutional affiliations.

