Article

Modeling of 14C Vertical Distribution in Bottom Sediments of the Ignalina Nuclear Power Plant Cooling Reservoir

by
Rūta Barisevičiūtė
*,
Evaldas Maceika
,
Laurynas Juodis
,
Algirdas Pabedinskas
,
Justina Šapolaitė
,
Žilvinas Ežerinskis
,
Laurynas Butkus
and
Vidmantas Remeikis
State Research Institute Center for Physical Sciences and Technology, Savanorių Ave. 231, LT-02300 Vilnius, Lithuania
*
Author to whom correspondence should be addressed.
Water 2021, 13(10), 1397; https://doi.org/10.3390/w13101397
Submission received: 27 April 2021 / Revised: 13 May 2021 / Accepted: 14 May 2021 / Published: 17 May 2021
(This article belongs to the Section Water Quality and Contamination)

Abstract

:
The Ignalina Nuclear Power Plant (INPP) in Lithuania is a rare case when lake water is used instead of river or sea water for cooling. Lake Drūkšiai with water residence time of 3–4 year and undisturbed sediment layers is a unique system to assess the impact of a nuclear facility on the aquatic ecosystem with a sufficiently high temporal resolution. We constructed a model of radiocarbon cycling processes in lake ecosystem which evaluates the 14C specific activity vertical distribution in two organic sediment fractions: alkali-soluble and alkali-insoluble. Model calculations proved that during the first 15 years of operation since 1983, 14C annual aqueous releases from the INPP were in water dissolved inorganic carbon form and varied in the range of 2.4 ÷ 3.7 × 10⁸ Bq/year. The results of the modeling of hypothetic scenarios also showed that there was the only one episode of elevated releases from the INPP in 2000–2001, which changed the interaction between the two organic sediment fractions for the period of 2000–2006. It was caused most probably by released chemicals from INPP but not by 14C contamination. Interaction processes between both sediment fractions recovered to its original state after 2006, indicating that the released additional chemical compounds lake ecosystem have been cleaned-up.

Graphical Abstract

1. Introduction

Radiocarbon is one of the main radionuclides discharged by nuclear industry, which, during the carbon biochemical cycle, incorporates into the tissues of living organisms and contributes to their radiation exposure. 14C produced in reactors is released directly to the environment in a gaseous form or in smaller quantities as liquid effluents [1,2]. The chemical form of released radiocarbon depends on the design features of the nuclear power plant. The boiling water reactors (BWRs) and heavy water reactors (HWRs, CANDU type) as well as gas cooled reactors (HTGR, AGR, Magnox) release 14C mainly as carbon dioxide; whereas discharges from pressurized water reactors (PWRs) are dominated by hydrocarbons such as methane or ethane [1,3,4,5,6,7,8,9,10]. The discharges from light-water-cooled graphite-moderated reactors (RBMK), which operated at the Ignalina Nuclear Power Plant (INPP), are of carbon dioxide form 14C [11,12] and are similar to other BWRs. The INPP located in north-eastern Lithuania operated two RBMK-1500 units (design electric power 1500 MWe). The INPP Unit 1 came online in December 1983 and was shut down on 31 December 2004. Unit 2 was put into operation in August 1987 and shut down on 31 December 2009.
The distinctive feature of the INPP is that Lake Drūkšiai was used as a reservoir of cooling water. Therefore, it is a special case of NPP siting, as normally a site for NPP is selected at the seashore or a bank of a big river. In case of a lake being a cooling water reservoir, the accumulation processes of pollutants are much more pronounced. Therefore, analysis of the distribution of 14C in the bottom sediments might reveal complex processes of radiocarbon fractionation and redistribution.
In this study, we performed analysis of radiocarbon concentration time series in water of Lake Drūkšiai and vertical layers of bottom sediments by considering available measurements and application of the mathematical model for radiocarbon accumulation. The analysis took into account both: airborne and aqueous discharges, and the 14C measured data obtained for two bottom sediment organic fractions: alkali-soluble (AS) and alkali-insoluble (AIS) [13], as well as available water volumetric activity [14] and radiocarbon specific activity measurements in the tree rings collected in the vicinity of the INPP [15,16]. Therefore, it is a complex study which should generalize available knowledge collected over the decades of the INPP operation.
Earlier performed investigation of radiocarbon concentration in AS and AIS fractions of Drūkšiai Lake bottom sediments [13] layers revealed that prior to the commissioning of the INPP and during the first 15 years of its operation, the radiocarbon specific activity in both fractions exhibited a parallel course. As expected, this indicates that the main 14C source was in DIC (dissolved inorganic carbon) form, especially considering that the main sediment organic matter source was of autochthonous origin. However, the analyzed data showed some anomaly in the period 2000–2009: the concentration of 14C in the AS fraction almost doubled, while the radiocarbon increase in the AIS fraction was only by a few percent. This suggested a considerable change of migration parameters which might be related to changes of chemical load from the INPP to Lake Drūkšiai.
The aim of this study was to analyze the processes of the radiocarbon accumulation in the lake bottom sediments, benefiting of using 14C as a tracer, discharged with the liquid routine releases from Ignalina NPP. Modeling disclosed episodic change of radiocarbon redistribution in both organic fractions of the sediments, indicating alteration in the former governing pathway of 14C accumulation in sediments organic fractions: DIC → aquatic primary producers → sediments. The created model enhances understanding of 14C cycling processes in lake ecosystems and can trace amounts of pollution, its type, accumulation pathways, as well as determines exchange rates between bottom sediment organic fractions and lake clean-up rates.

2. Materials and Methods

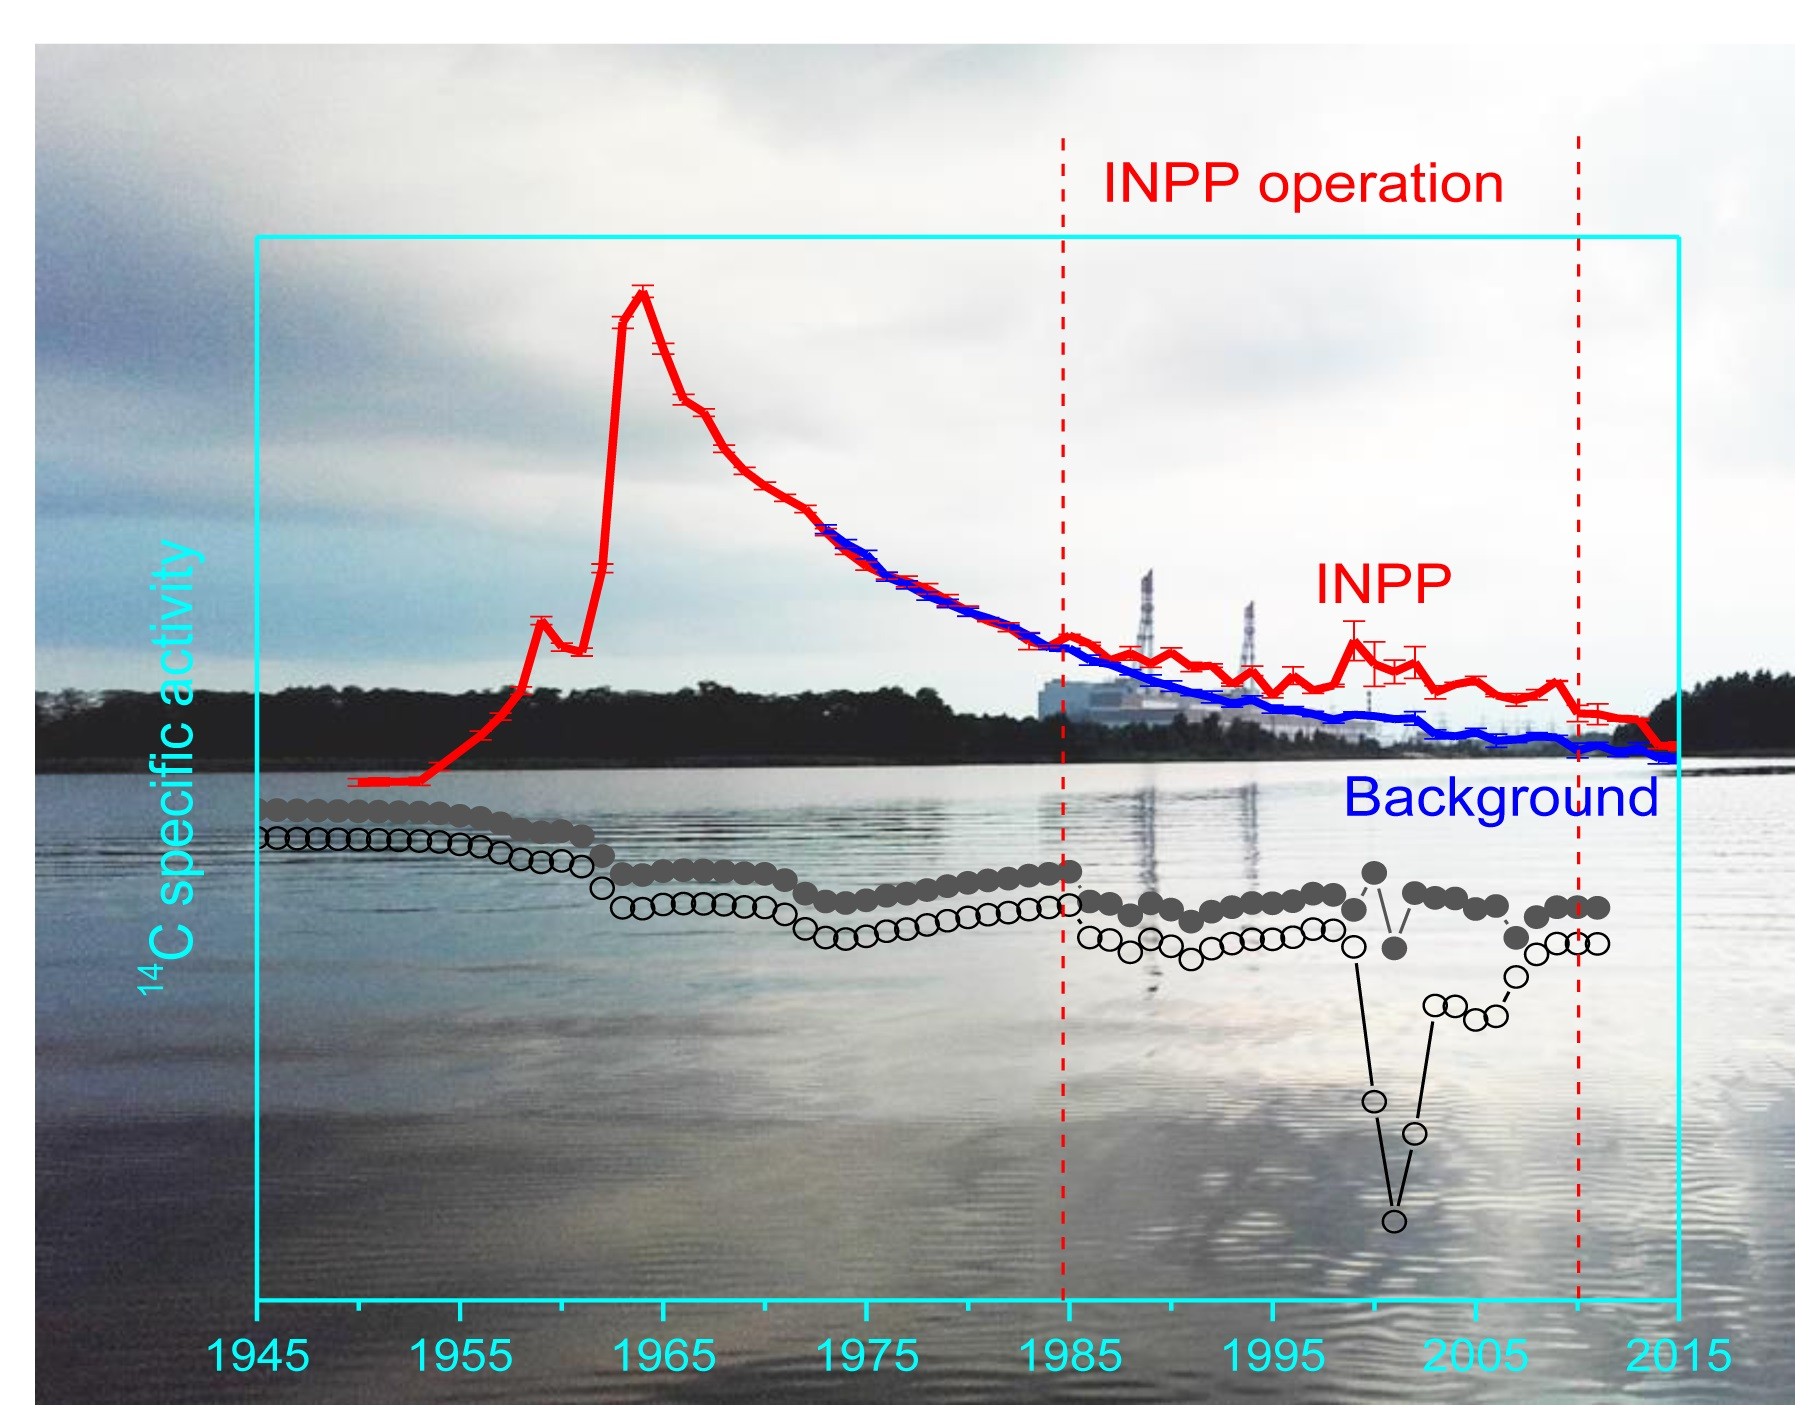
2.1. Sampling Site Description

Situated in north-eastern Lithuania near the borders with Belarus and Latvia, Lake Drūkšiai is the biggest lake in Lithuania (Figure 1) by surface area (~49 km2). The water residence time in the lake is 3–4 years. The lake undergone significant anthropogenic impact during the past century. In 1953, hydroelectric power plant (HEPP) was built on the Prorva river, the only outflow from Lake Drūkšiai. This resulted in an increase of the lake natural water level by 0.3 m. In the same year, the entire Apyvardė river flow was directed to Lake Drūkšiai by damming Drūkša river downstream the Apyvardė river. As a result, Lake Drūkšiai catchment area increased by 24%. In 1982, the HEPP ceased electricity production but it has been used still for maintaining elevated lake water level required for cooling of the INPP [17]. From December 1983 to December 2009 Lake Drūkšiai served as a cooling reservoir for the operating INPP. Nutrient load from Visaginas town (Visaginas was founded in 1975 for workers of the INPP) and the increase in water temperature altered vertical thermal stratification and caused change in the trophic state of the lake from (oligo) mesotrophic to almost eutrophic [18].
One of the sediment cores was sampled in December 2013 using a Kajak gravity corer at the deepest depression of Lake Drūkšiai (sampling station no. 1, 55°38′49″ N; 26°35′07″ E), having the highest recent sedimentation rate (Figure 1). The 62 cm core was separated into layers of 1 cm thickness in situ soon after sampling, transported to the laboratory in plastic beakers and stored frozen until analysis. Sediment chronology for the period of 1947–2013 was determined using the 210Pb technique supported by anthropogenic 137Cs as a chronostratigraphic marker [13]. DIC samples were collected once or twice a year from 1979 to 2009, usually at station no. 6 (55°34′33″ N, 26°37′15″ E, Figure 1) [14] and in some cases close to sampling station no. 1.
P. Sylvestris L. tree ring samples were collected in spring 2016 and 2017 from five sites situated 1.8–6.6 km from the INPP [15,16]. In this work, we used 14C specific activity data of the tree growing 6.6 km away from INPP (55°39′36″ N, 26°35′50″ E). The criteria for the sampling site choice were as follows: selected trees grow close the core sampling site and are in prevailing wind direction from INPP on the other shore beyond the lake.

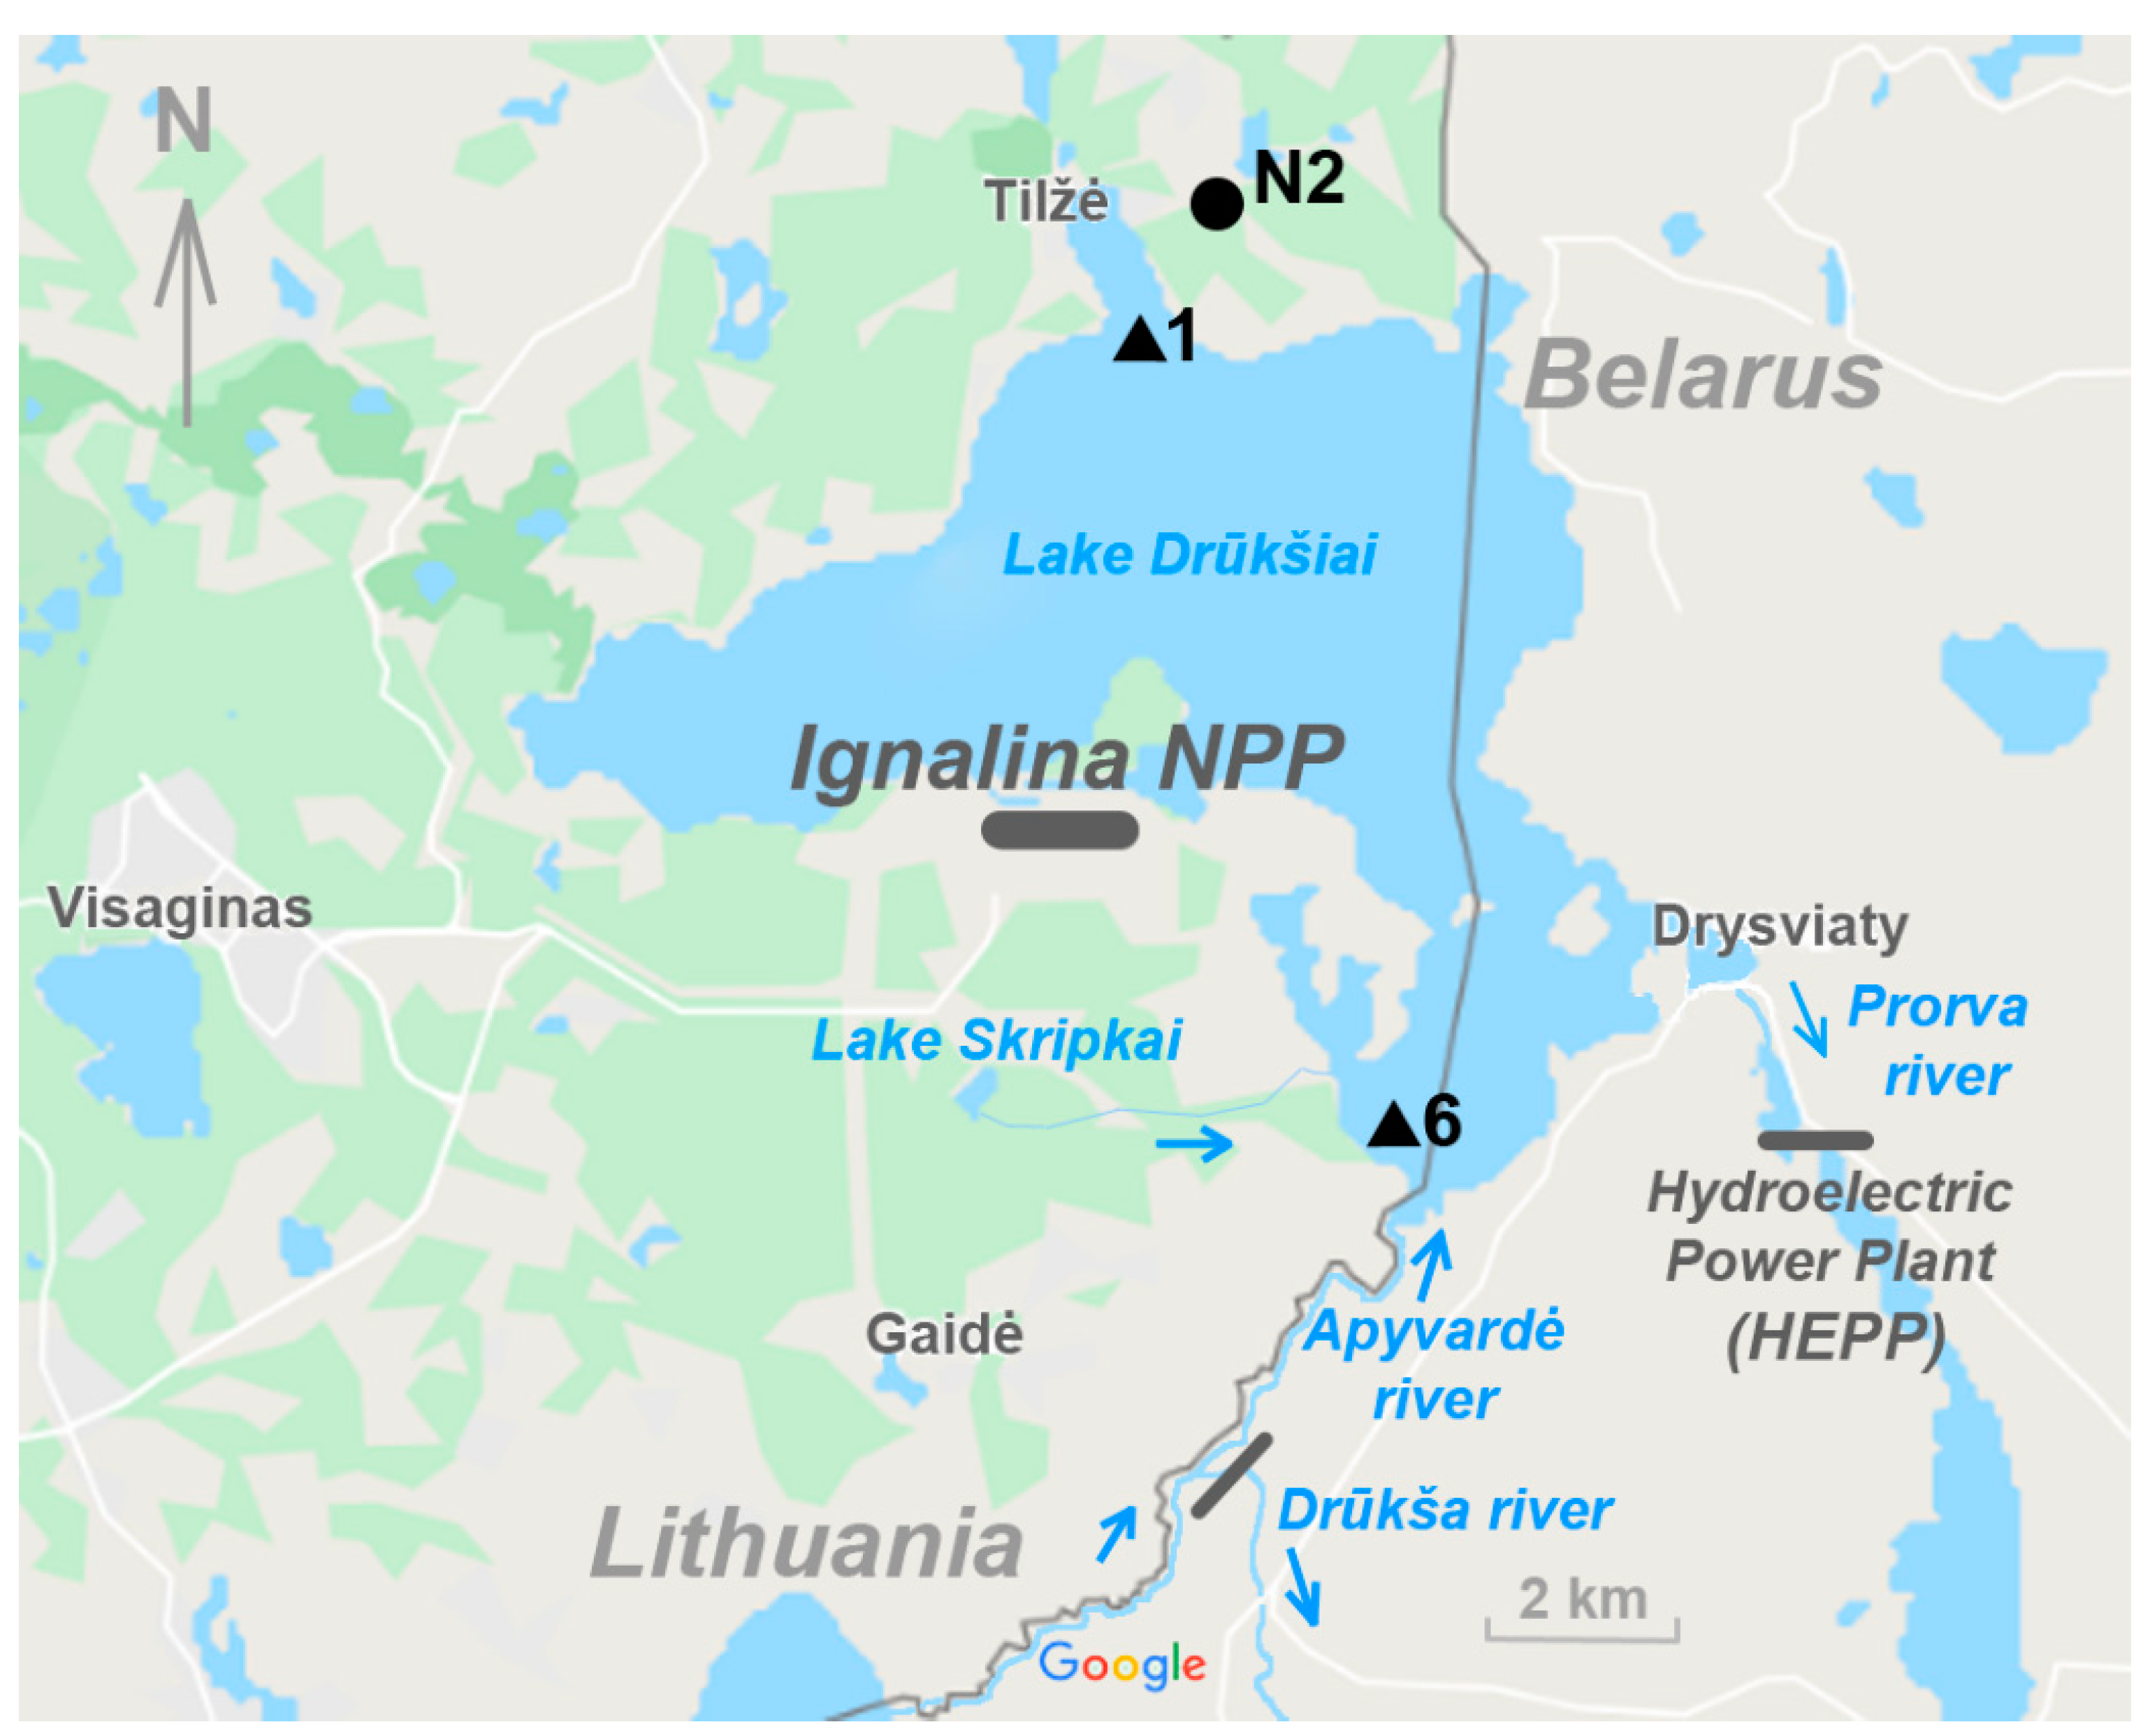
2.2. Model Description

A simple dynamic model based on data of radiocarbon measurements was developed to assess 14C specific activity of two organic fractions based on data of radiocarbon measurements: alkali-soluble (AS) and alkali-insoluble (AIS). According to Kleber and Lehmann’s statement [19] that alkaline extraction cannot separate humic and non-humic substances, we decided to use alkali-soluble and alkali-insoluble sediment organic fraction terms instead of humus, humic acids, and other subcategories of humic substances.
Accumulation of 14C in the lake bottom sediments was modeled for every layer separately by considering processes of deposition of allochthonous and autochthonous origin carbon from lake water onto sediments surface, fractionation (DIC → aquatic plant → AS/AIS; as well as allochthonous origin organic carbon → AS/AIS), long term decomposition of the deposited organics and redistribution of the radiocarbon between AS and AIS fractions within sediments layer. The model scheme is presented in Figure 2. Every modeled layer of sediments represents outcome of radiocarbon accumulation over one year and takes into account further carbon loses due to organic decomposition and redistribution between the fractions until the date of interest, e.g., the date of bottom sediment core sampling.
Radiocarbon exchange processes between the modeled water and sediment layers are represented by arrows in Figure 2. No radiocarbon exchange between layers was assumed (see Figure 2 for model description), i.e., it is assumed that neither mechanical nor diffusional exchange of radiocarbon occurred of relevant degree between the sediment layers, as very steep peaks of 14C concentration was observed. Top layer of the bottom sediments receives settled organic matter with 14C from the lake water compartment (column), which is assumed as perfectly mixed basin. Organic matter in the lake water column is composed of autochthonous (aquatic plant—aqp) and allochthonous (terrestrial—terr) origin organics, having its own typical 14C specific activity values.
Each sediment layer is schematically divided into the parts containing AS and AIS carbon (actually, they coexist in mixed form), and there are exchange processes of carbon between AS and AIS represented by exchange rates λASAIS and λAISAS. Organic matter constantly decomposes in all sediment layers and radiocarbon is removed from the ecosystem via lake water body, therefore the loss of carbon in the fractions is represented by decomposition rates DAS and DAIS. All exchange processes between compartments are modeled by the system of the first order differential equations with the coefficients reflecting exchange rates. It is simplified representation of the real situation; however, it takes into account the most governing processes without need to have large number of specific coefficients and transfer factors which would be difficult to obtain from limited amount of available data.
14C specific activity in alkali-insoluble ( a 14 A I S ) and alkali-soluble ( a 14 A S ) sediment organic fractions at every bottom sediment layer is calculated separately by the following radiocarbon content balance law, described as the first order differential equation system
( C A I S × a 14 A I S ) t = f D I C a q p × f a q p A I S × ( C a q p _ A I S × a 14 D I C ) t + f t e r r A I S × ( C t e r r _ A I S × a 14 t e r r ) t ( D A I S + λ A I S A S   ) × ( C A I S × a 14 A I S ) t + λ A S A I S   × a 14 A S × C A S ;
where C A I S = C a q p _ A I S + C t e r r _ A I S ;
( C A S × a 14 A S ) t = f D I C a q p × f a q p A S × ( C a q p A S × a 14 D I C ) t + f t e r r A S × ( C t e r r A S × a 14 t e r r ) t ( D A S + λ A S A I S   ) × ( C A S × a 14 A S ) t + λ A I S A S   × a 14 A I S × C A I S ; )
where C A S = C a q p _ A S + C t e r r _ A S .
C A S and C A I S are yearly accumulated content of organic carbon in AS and AIS fractions, respectively, at every bottom sediment layer in g cm−2. Measured annual accumulation rates of sediment organic carbon are shown in Figure A1.
The accumulation rate of carbon during the year (within one layer) was assumed to be constant, then it can be taken out of differential, and the equations 1 and 2 can be normalized by yearly accumulated content of organic carbon in AIS and AS fractions ( C A I S and C A S ), correspondingly. It allows to use fractions of the carbon accumulation via aquatic plant (Caqp_AIS/CAIS and Caqp_AS/CAS) or terrestrial (Cterr_AIS/CAIS and Cterr_AS/CAS) pathways and AS to AIS content ratio (CAS/CAIS and CAIS/CAS) in the sediments, which can be derived from the experimental measurements
( a 14 A I S ) t = f D I C a q p × f a q p A I S × C a q p _ A I S C A I S × ( a 14 D I C ) t + f t e r r A I S × C t e r r _ A I S C A I S × ( a 14 t e r r ) t ( D A I S + λ A I S A S   ) × ( a 14 A I S ) t + λ A S A I S   × a 14 A S × C A S C A I S ;
( a 14 A S ) t = f D I C a q p × f a q p A S × C a q p _ A S C A S × ( a 14 D I C ) t + f t e r r A S × C t e r r _ A S C A S × ( a 14 t e r r ) t ( D A S + λ A S A I S   ) × ( a 14 A S ) t + λ A I S A S   × a 14 A I S × C A I S C A S .
Measured and calculated 14C specific activity in AS and AIS sediment organic fractions ( a 14 A S and a 14 A I S , respectively) along with the radiocarbon background activity in atmosphere curve are given in Figure 3A. 14C specific activity measurements ( a 14 ) are reported in units of pMC [20,21]
a 14 = A S N A O N × 100 % ,
where ASN is the specific activity of the sample AS, normalized to δ13C = −25 ‰; AON is the normalized specific activity of the standard.
For the time dependent 14C specific activity in DIC ( a 14 D I C ) until 1979, the linearly interpolated values of weighed sum of 14C specific activity in the atmospheric CO2 (32.6%) and of fixed values of 97.5 pMC (67.4%) were taken, as no DIC measurements where available before 1979. Such values were obtained by using nonlinear least squares fitting (optimization) of the sediment’s activity predictions and measured data for the period of 1945–1979 (see Figure 4). After 1979, the measured linearly interpolated 14C specific activity values of DIC fraction measurements were used. Time dependent 14C specific activity values of terrestrial origin organic matter ( a 14 t e r r ) were obtained as weighed sum of three fractions: radiocarbon specific activity in atmosphere (49.8%) with delay of 13 years (the second bomb peak was observed in sediment radiocarbon measurements in 1976, see Figure 3), and with no delay (19.2%), as well as of fixed values of 85 pMC (31.0%). Such values were obtained using nonlinear least squares fitting of the sediment activity data for the period of 1980–1999.
f D I C a q p , f a q p A I S , f a q p A S , f t e r r A I S , and f t e r r A S are 14C fractionation factors for transformation processes of DIC to aquatic plants, aquatic plants to alkali-insoluble, and aquatic plants to alkali-soluble fractions as well as terrestrial origin organic matter to alkali-insoluble and terrestrial to alkali-soluble fractions, respectively. Fractionation of the 14C isotope during trophic transfer is already included in a 14 by the δ13C correction [21], thus, values of these f factors were taken as 1.
D is decomposition or dissolution constant in year−1 of the AIS and AS fractions; λ A I S A S   and λ A S A I S   are assimilation rates from alkali-insoluble to alkali-soluble fraction and from alkali-soluble to alkali-insoluble fraction, respectively. We decided to include these rate constants, as according to Soil continuum model [22], sedimentary organic matter continuously undergo decomposition/fragmentation of the larger chemical compounds and as well as the incorporation of smaller compounds into larger and less reactive aggregates. Both the AS and AIS fractions are involved in forming each other.
Distribution of autochthonous and allochthonous origin organic matter in both sedimentary organic fractions was calculated according to the equations
C A I S + C A S = C a q p + C t e r r ;
where C a q p = C a q p _ A S + C a q p _ A I S and C t e r r = C t e r r _ A S + C t e r r _ A I S .
C A S = ( 1 x ) × C a q p + x × C t e r r ;
C A I S = x × C a q p + ( 1 x ) × C t e r r ;
where x = C a q p C A S C a q p C t e r r . Thus, C a q p _ A S = ( 1 x ) × C a q p , C a q p _ A I S = x × C a q p , C t e r r _ A S = x × C t e r r , and C t e r r _ A I S = ( 1 x ) × C t e r r .
Experimentally determined C/N ratio values in the organics of the bottom sediment layers are informative to assess terrestrial versus aquatic plants contribution. However, we decided not to use C/N ratios to determine the ratio of organic matter of allochthonous versus autochthonous origin organic matter in sediments throughout the entire studied period, since changes in the temperature regime of lake water after the start of operation of the INPP have caused changes in plant species diversity in the lake [18,23]. The C/N ratio for planktonic and benthic algae and macrophytes varies. It is known that for phytoplankton C/N can have values between 6 and 12. C/N values between 10 and 20 are typical of mixed terrestrial and aquatic sources as well as for submerged and floating aquatic macrophytes, while the values >20 indicate terrestrial plants or emerged macrophytes [24,25]. Since water level of the lake remained practically unchanged after the construction of the dam system for the HEPP in 1953, accumulation rate of allochthonous origin organic matter was considered unchanged and remained constant throughout the period of 1954–2010. Its value of Cterr = 0.000749 g cm−2 year−1 was obtained by assuming 17% fractional contribution of allochthonous origin in total accumulated organic matter ( C A S + C A I S ) in sediments averaged over 1955–1965 (see Figure A1). The fractional contribution of allochthonous origin organic matter in sediments was determined from the averaged C/N ratio values for the 1955–1965 period (see Figure A2) assuming that C/N ratio was 6.6 and 35 in phytoplankton (autochthonous) and vascular plants (allochthonous), respectively [24,25,26,27]. The increase in sediment organic carbon accumulation rate especially after 1985 was driven by an increased contribution of autochthonous organic carbon. Yearly carbon accumulation values of deposited autochthonous origin organic matter Caqp were derived in model calculations as residue after deduction of constant value of allochthonous origin organic matter Cterr in sediments from experimentally determined total (sum of alkali-soluble and -insoluble) annual carbon accumulation rate in the sediments (see Figure A1). The first order differential equation system was solved numerically using Scilab 6.0.2 software for ODE numerical computation. The main values of parameters and variables used in calculations are shown in Table 1. The parameter values were obtained by fitting measured and calculated 14C specific activity profile in the sediments for the established three contamination scenarios (differing in exchange rates variability and additional degree of contamination by INPP). Multi parameter fitting procedure was performed by using the least squares method automatic procedure.

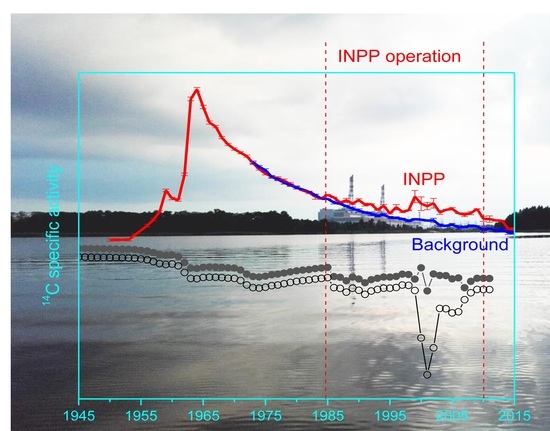
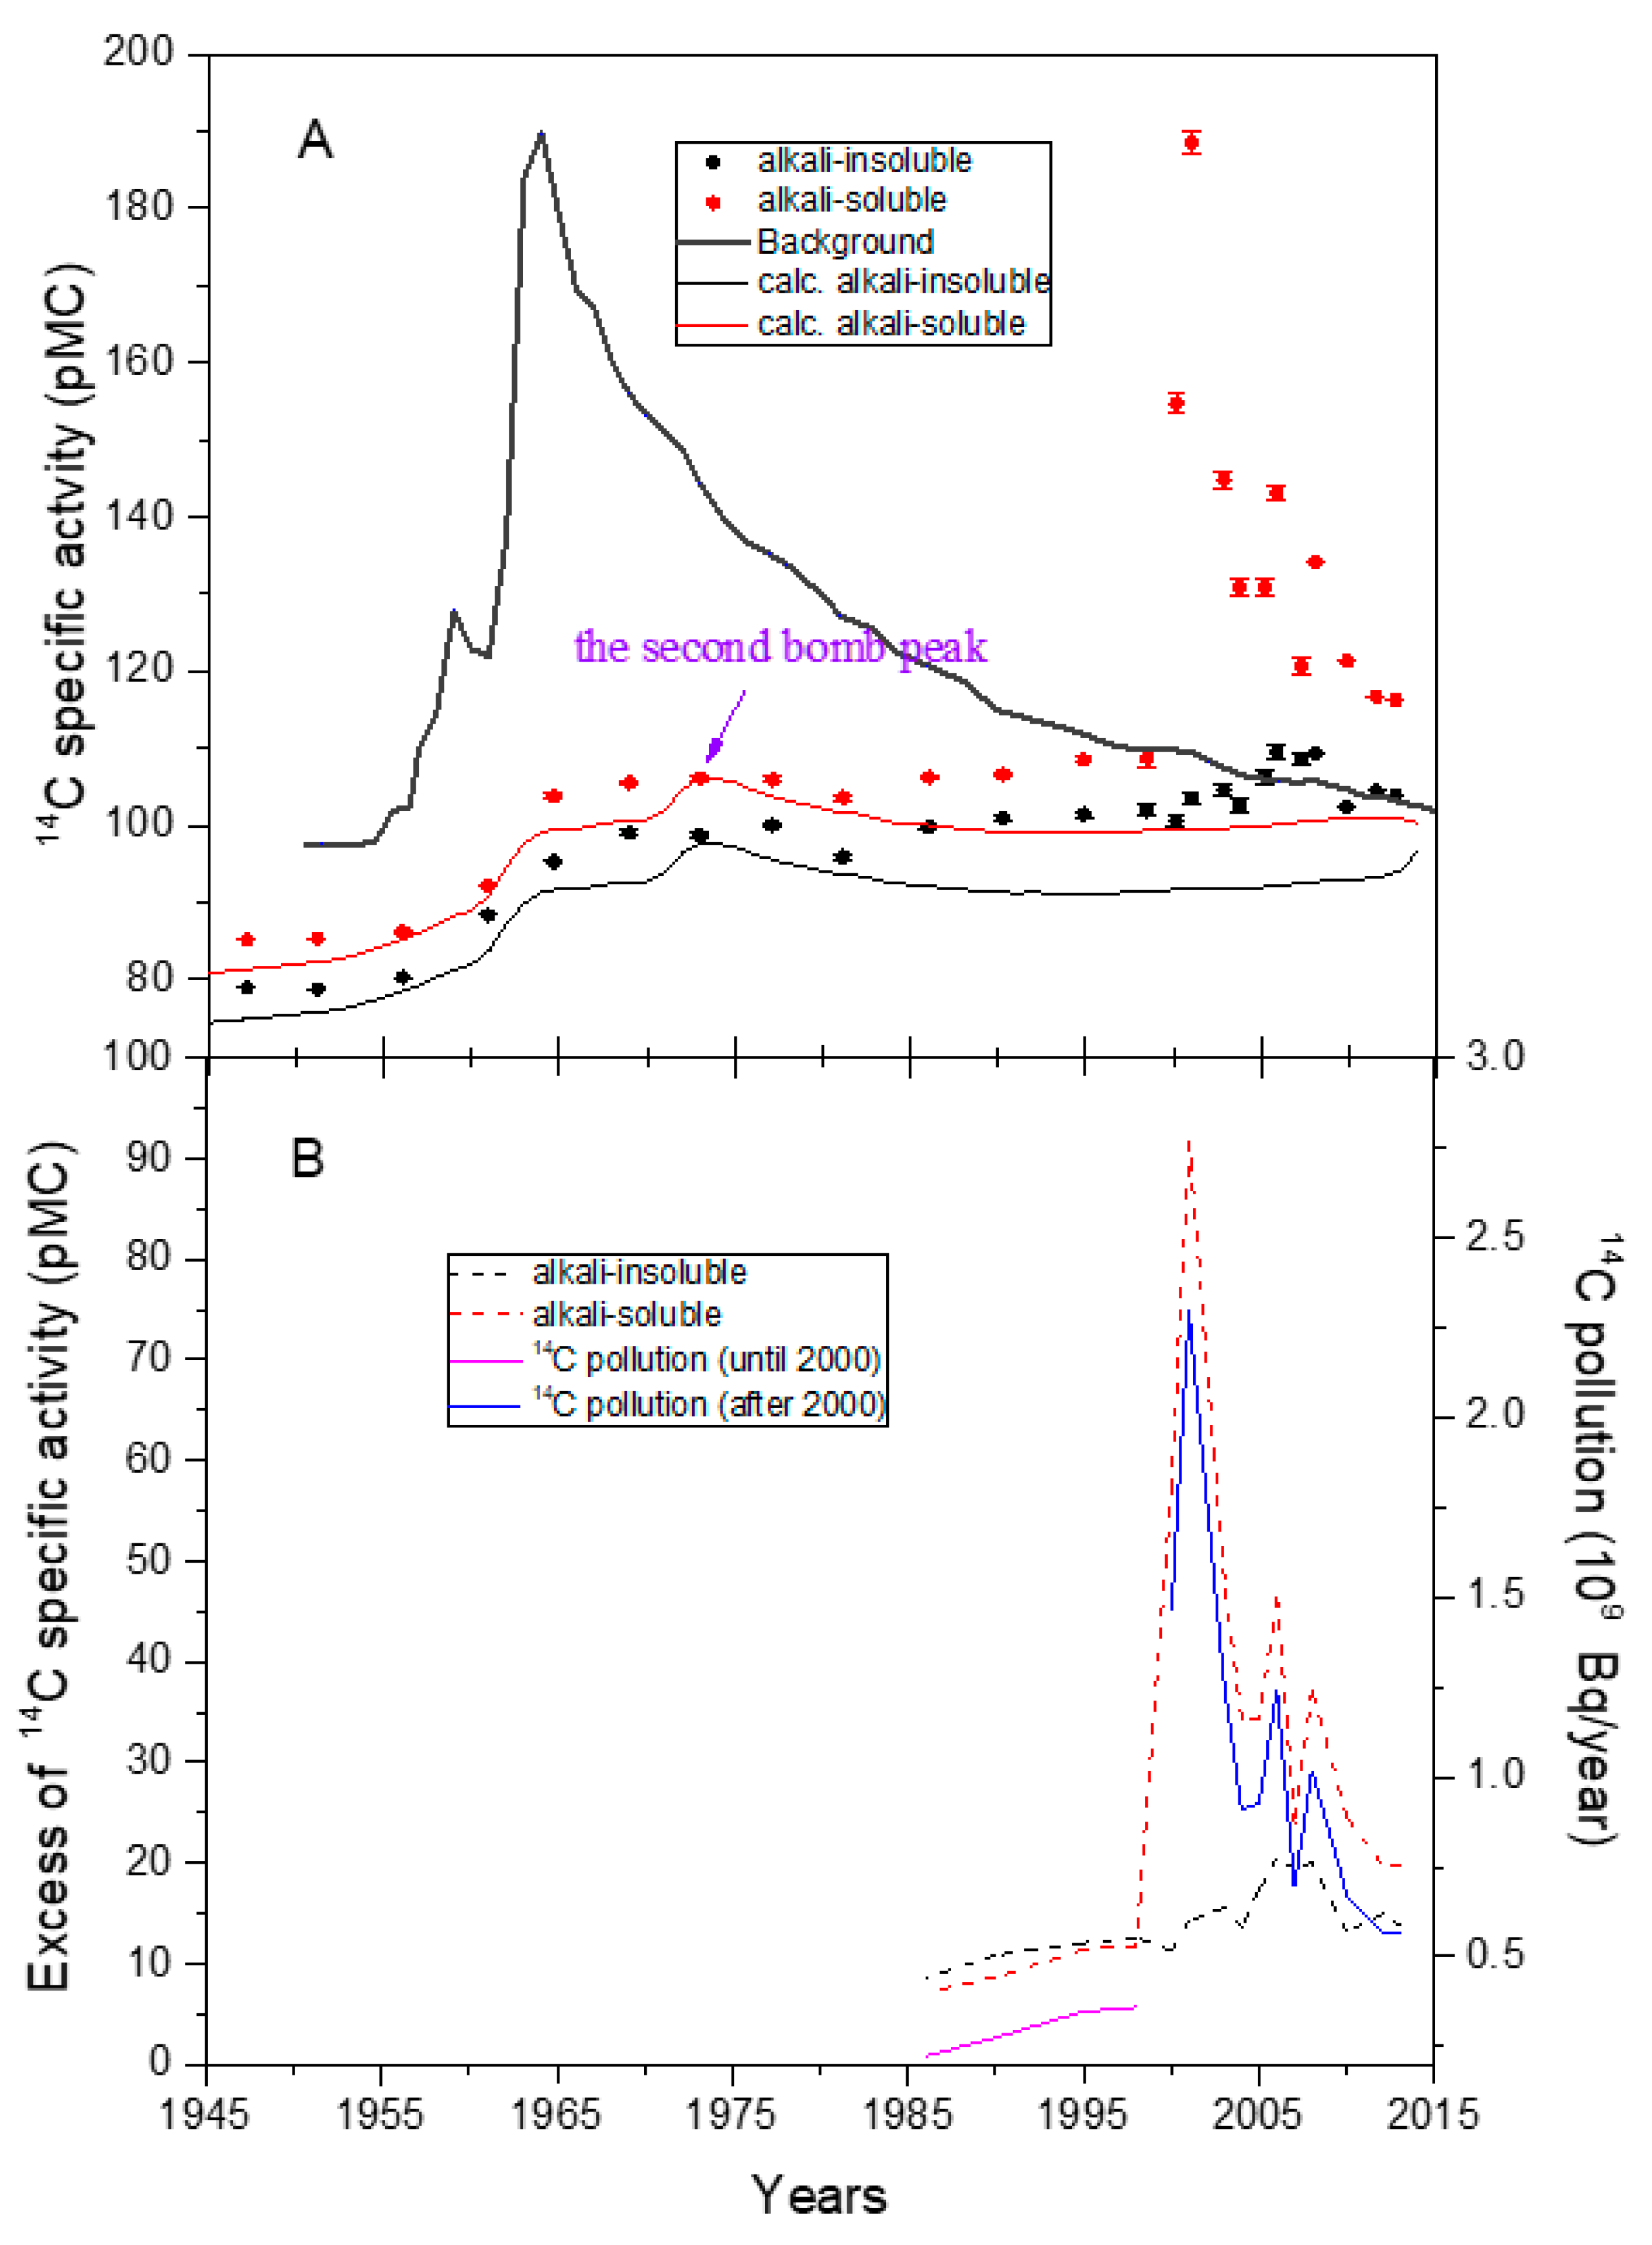
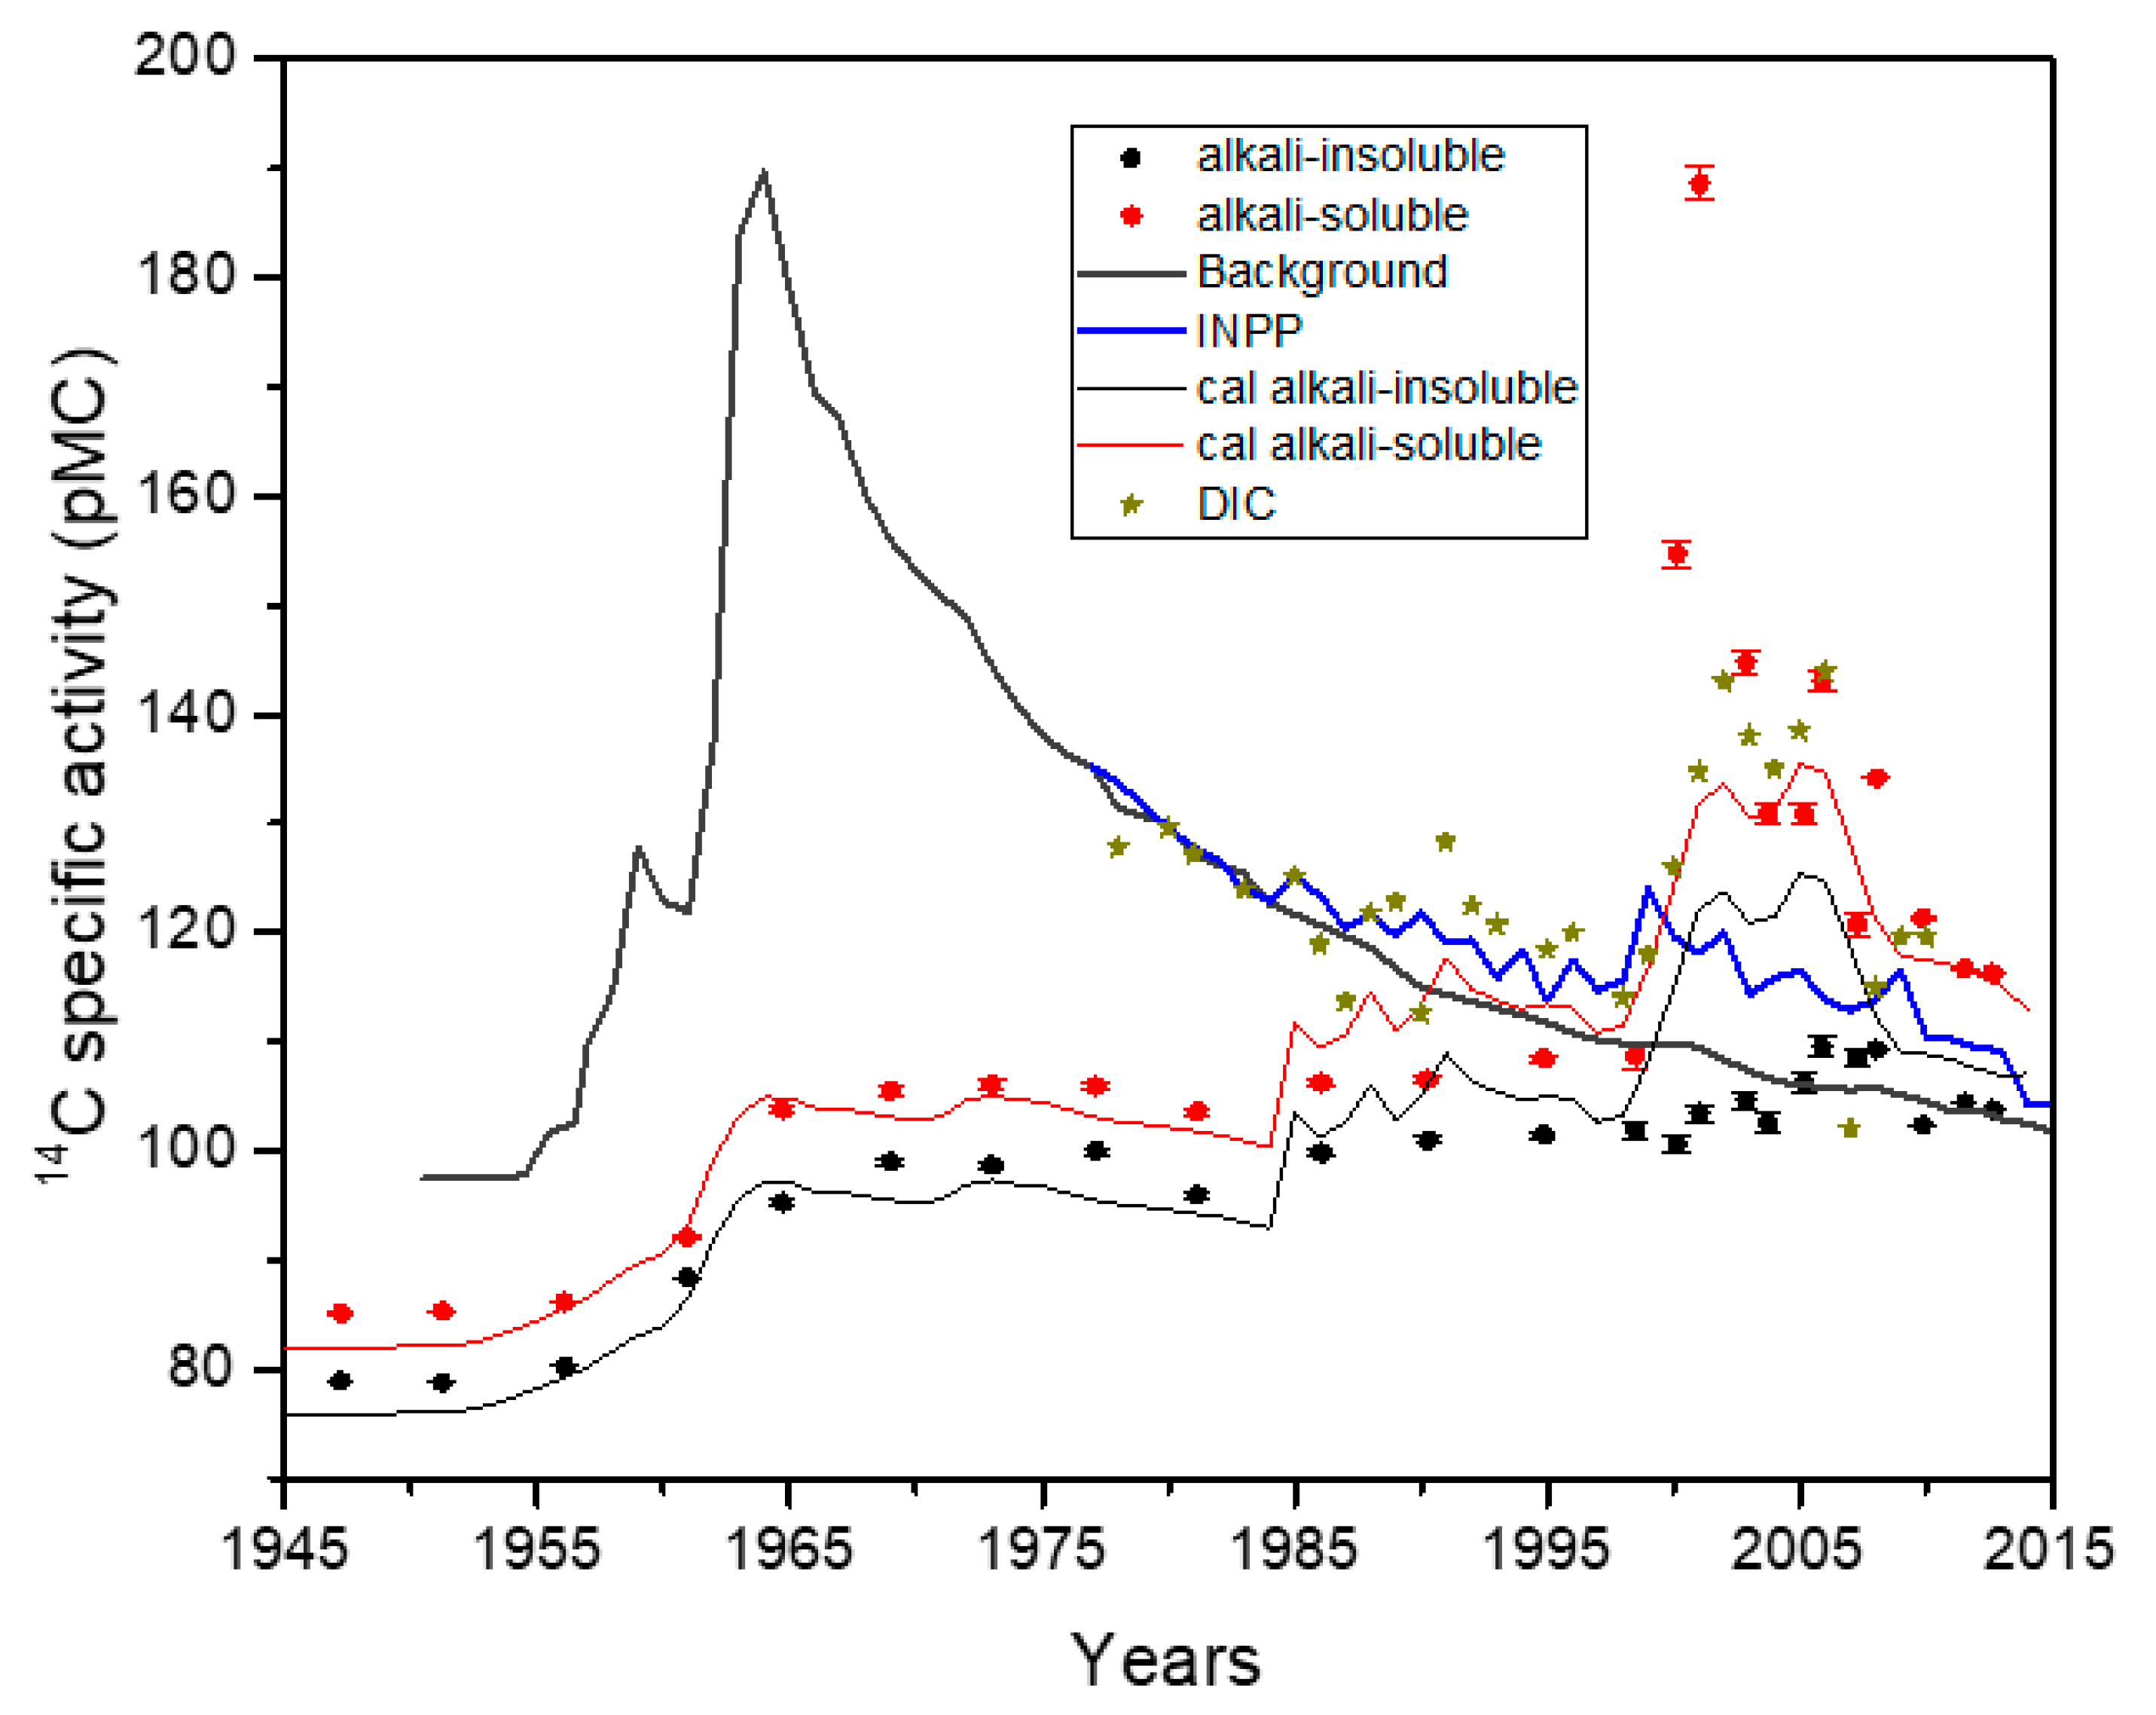
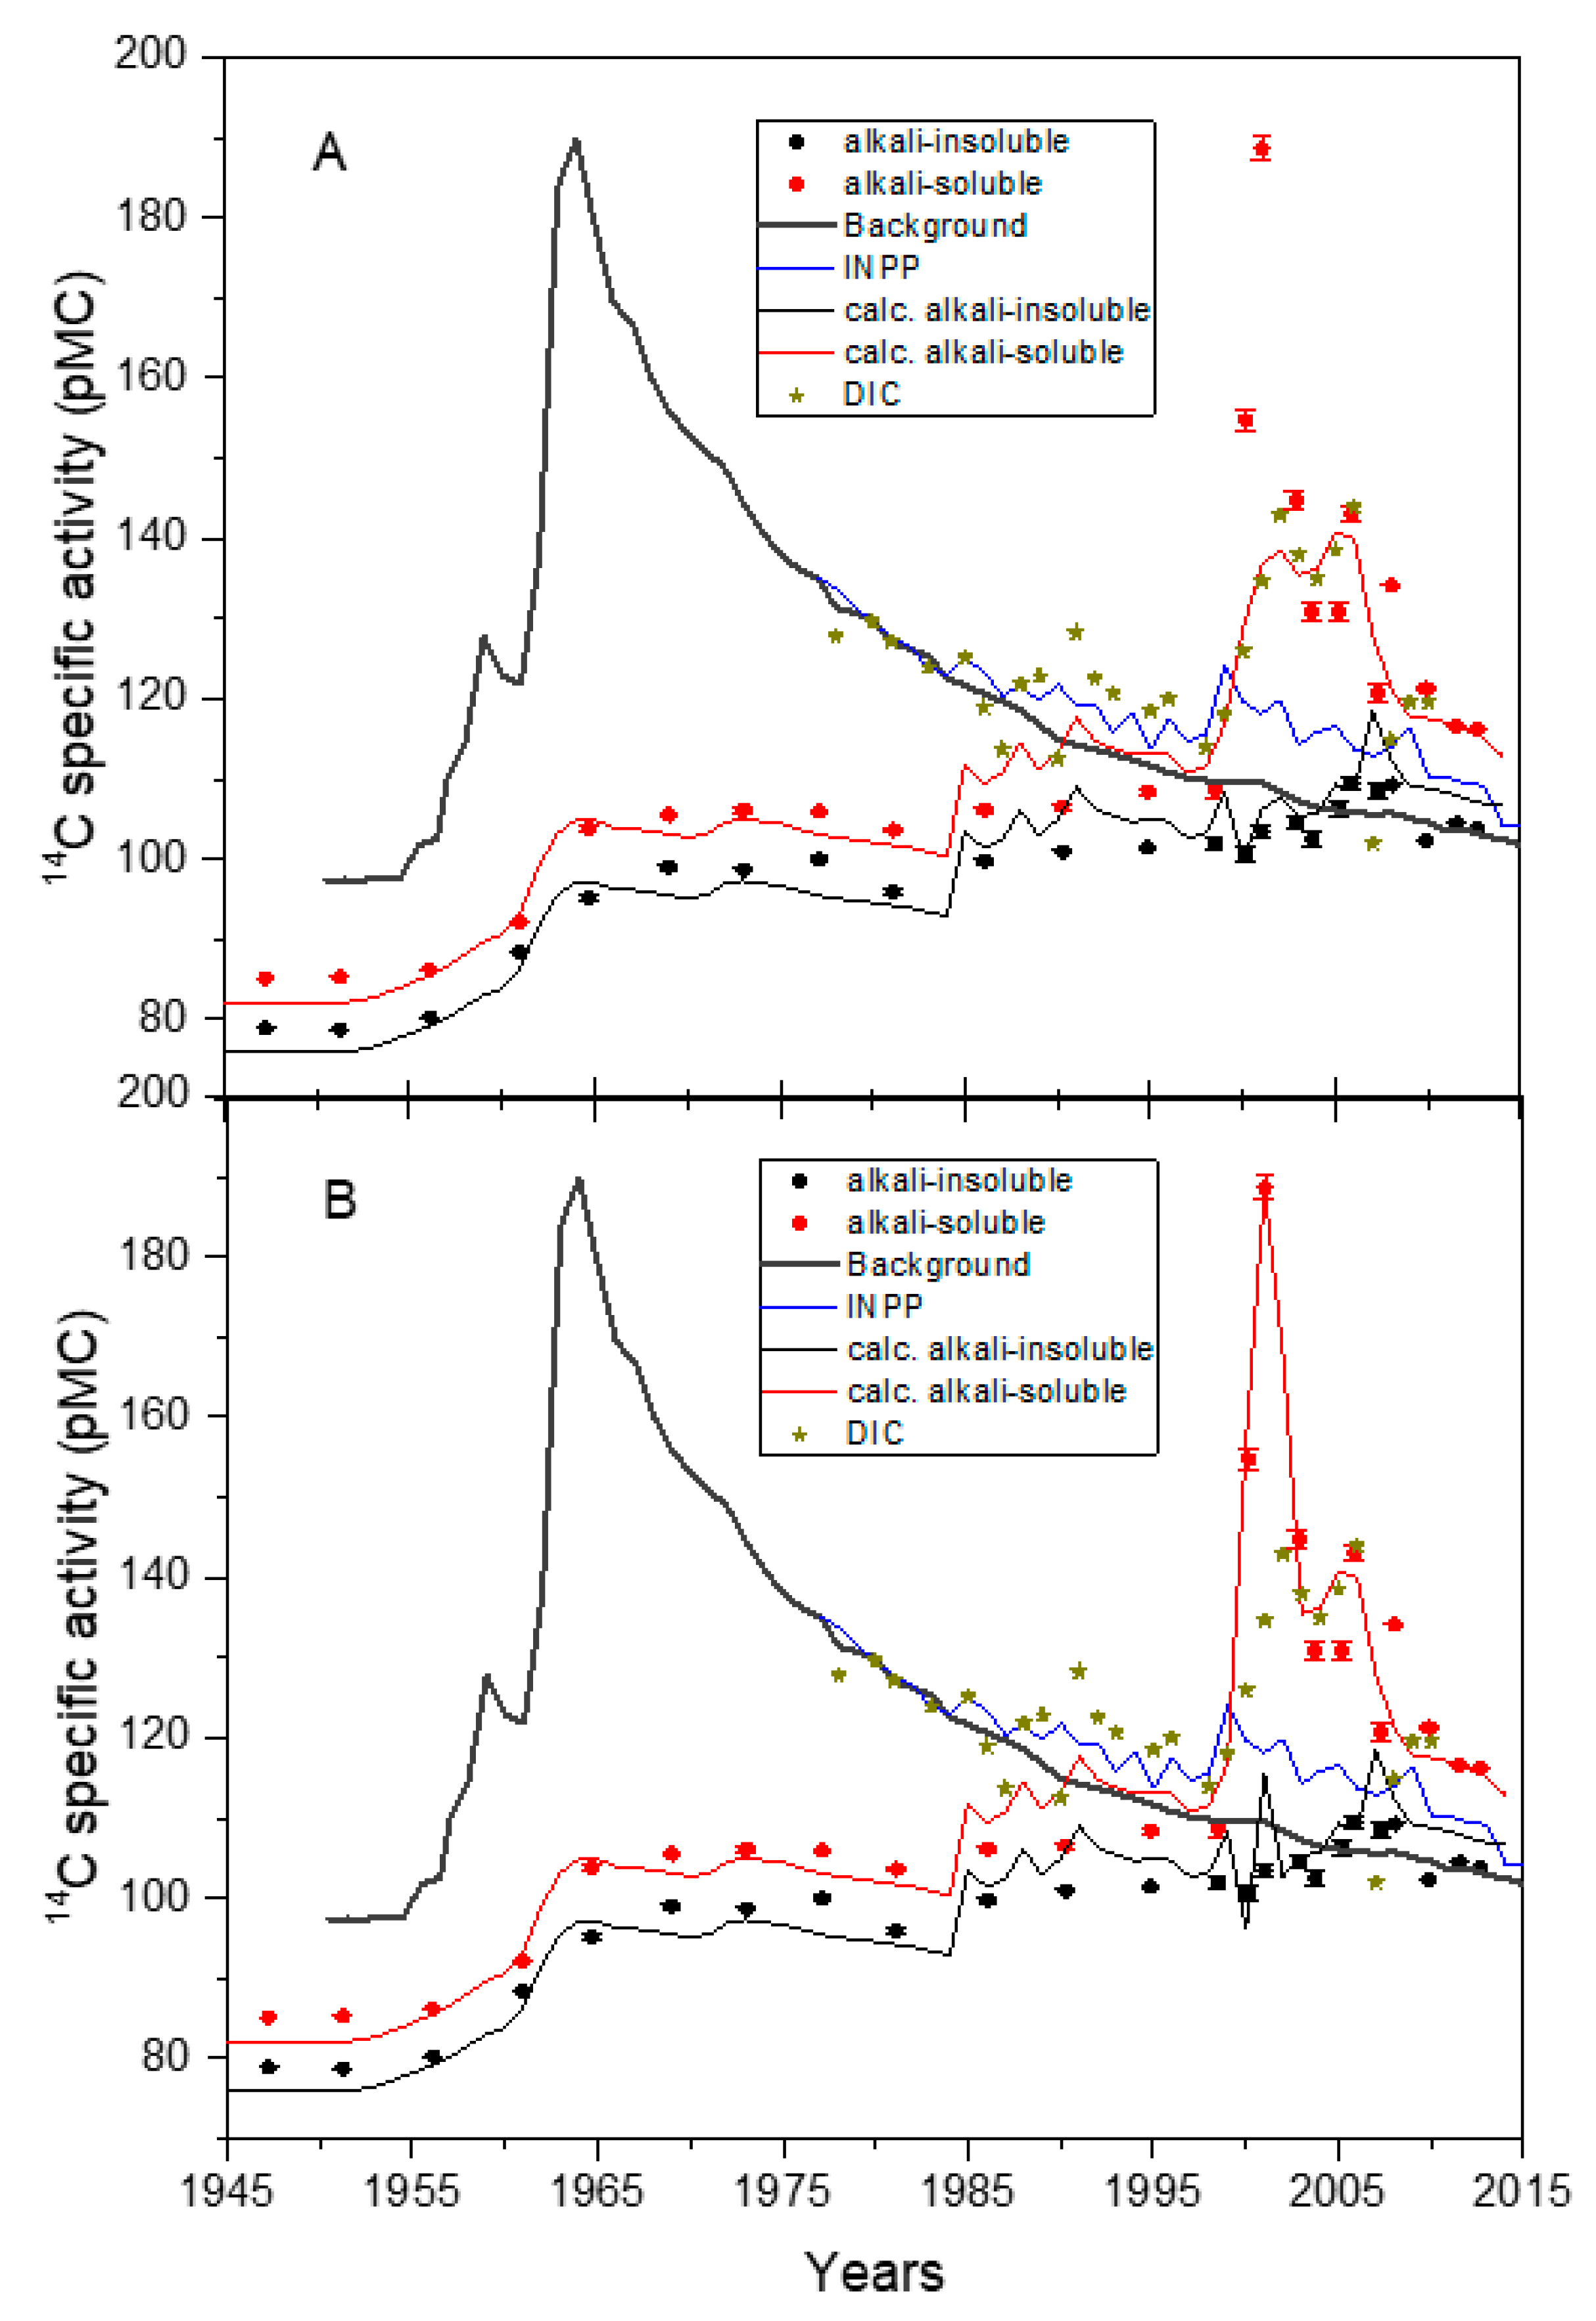
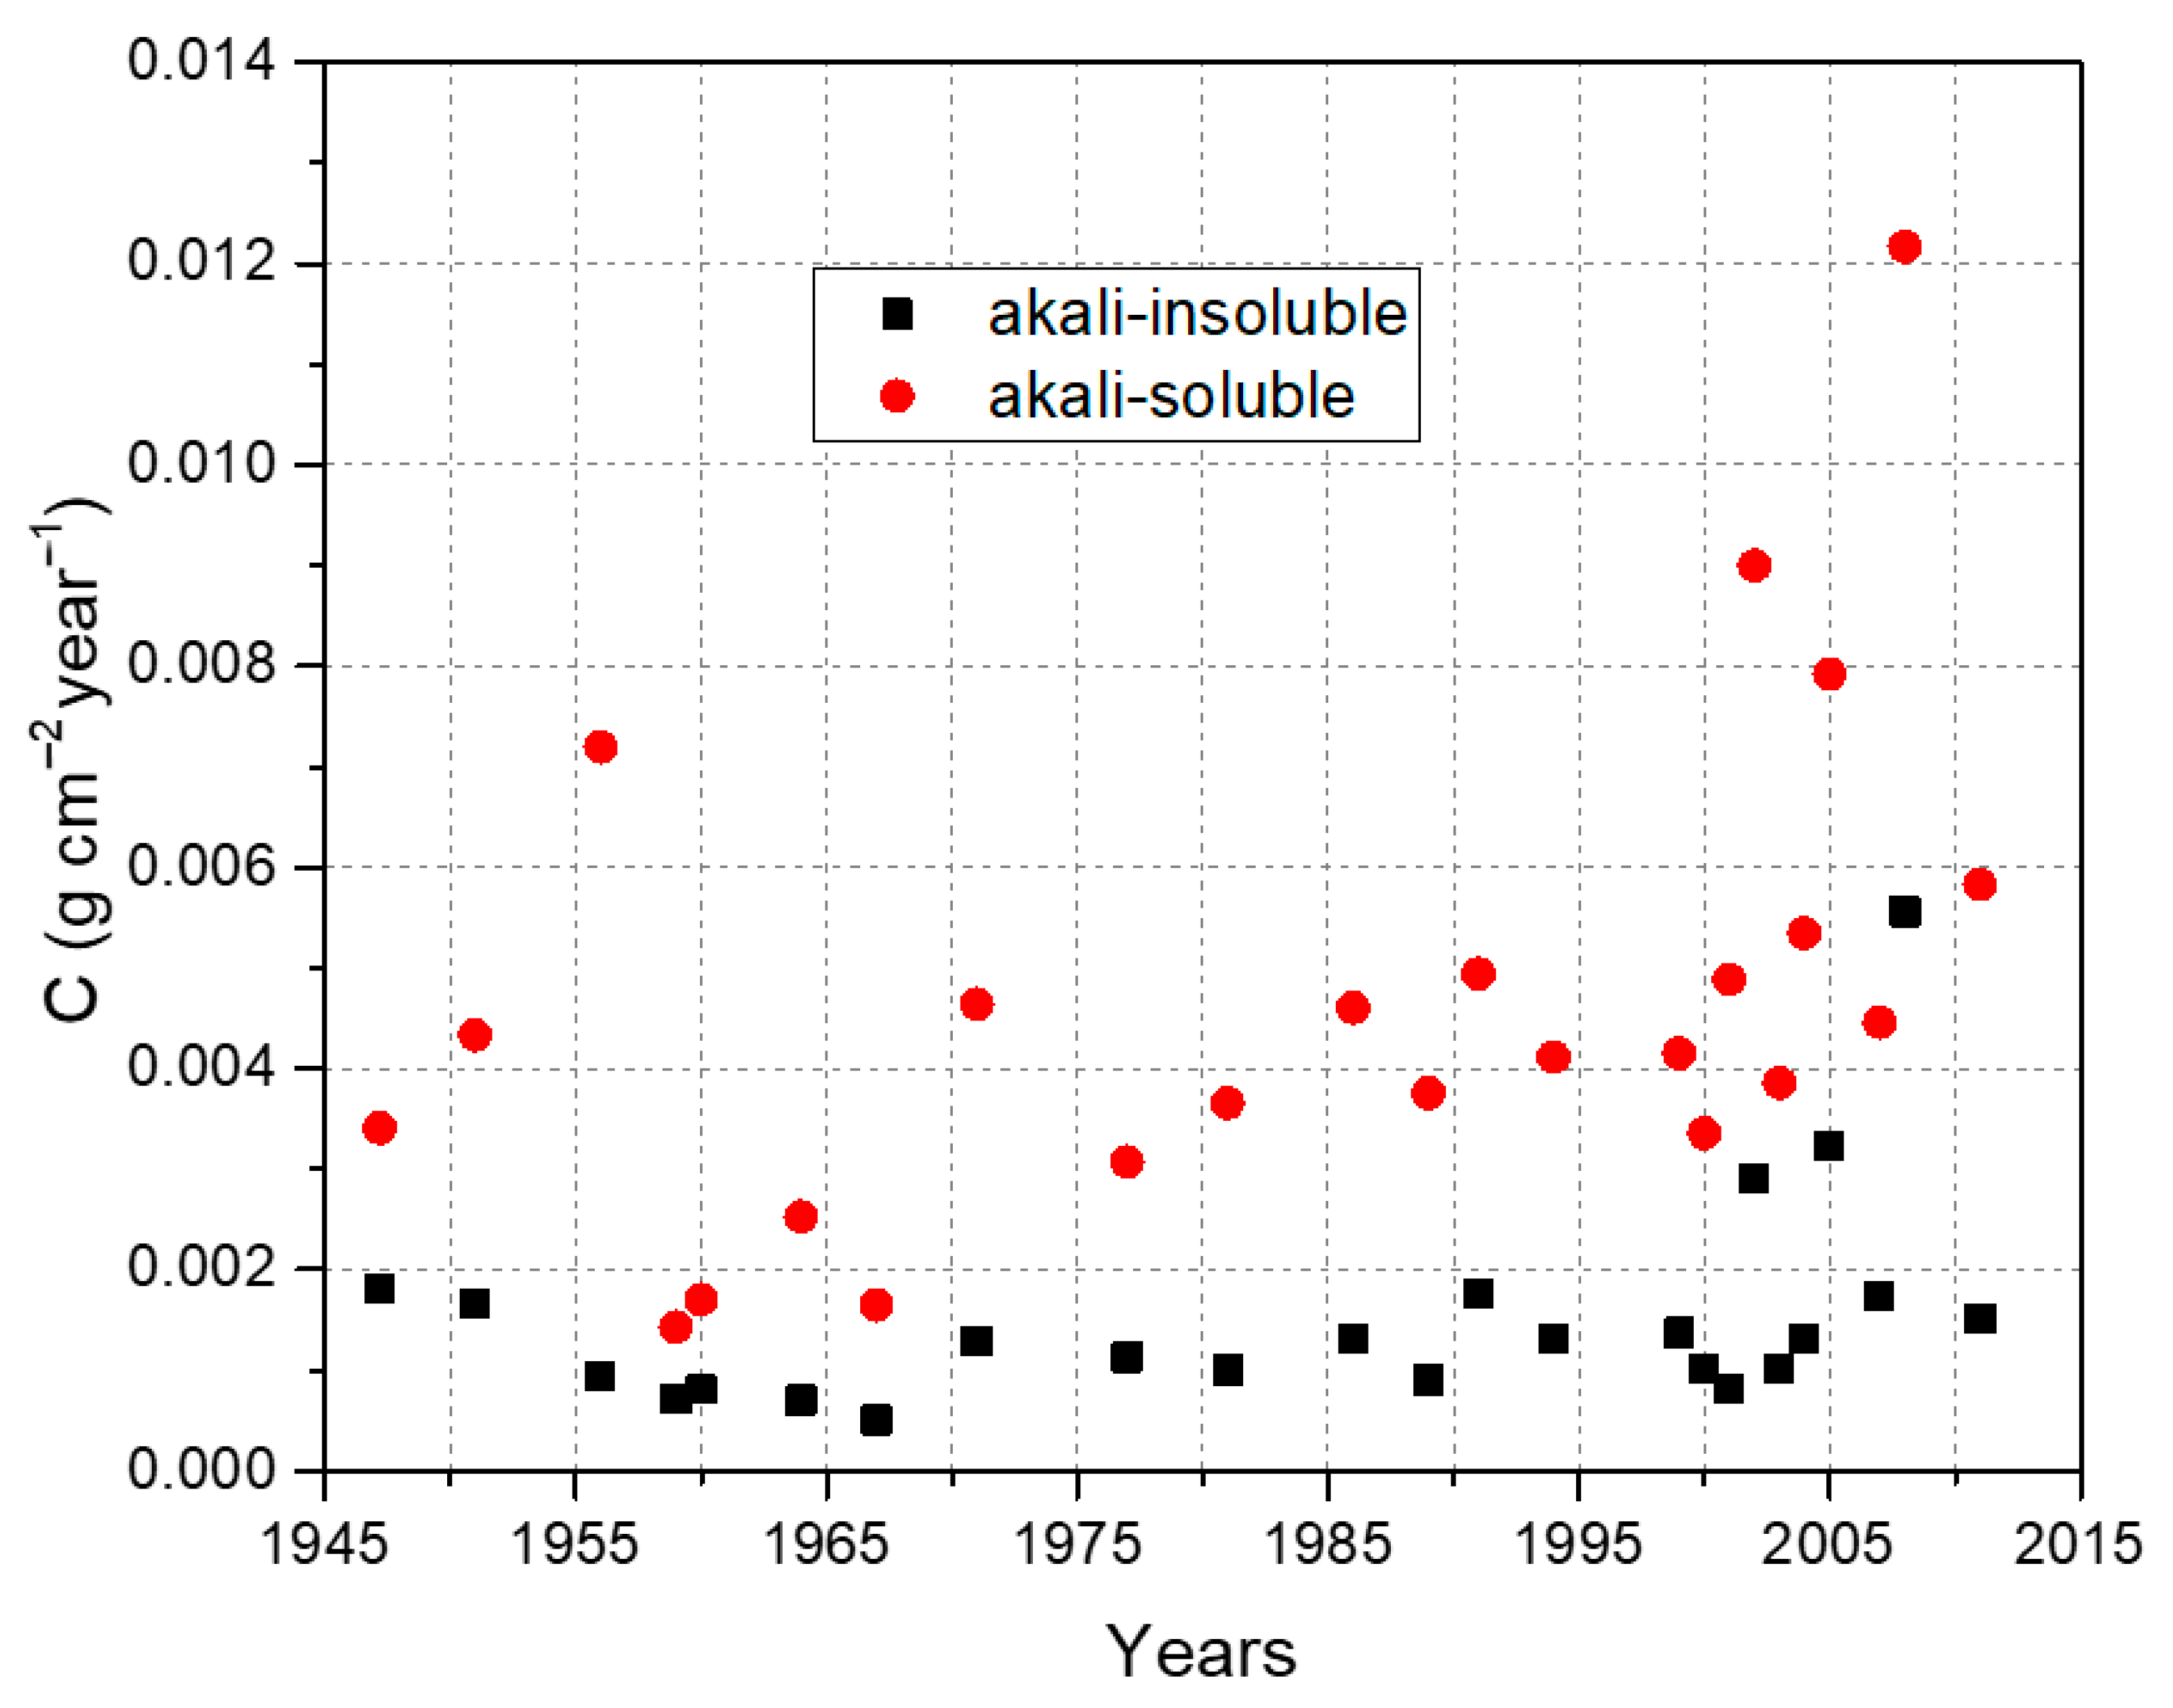
3. Results and Discussion

3.1. Model Assumptions

The model uses radiocarbon streams approach from lake water to the bottom sediments in the calculations by applying DIC data in the lake water as an input parameter. Due to complexity of the processes and lack of data as well as associated uncertainties, we decided not to use the so-called box model to calculate 14C balance in the water column and in the early diagenesis zone, but simplified assumed water column as one well mixed compartment. Even though we can reconstruct water flows into and out of the lake (restored water flow data from 1953 will be fairly accurate) although we do not have any data of DOC (in water dissolved organic carbon) and POC (particulate organic carbon) of the lake and inflowing water during the period of investigation. As it was mentioned before, DIC samples in the lake were collected once or twice a year only from 1979 to 2009. In other temperate lakes, it was observed that during the warm period, when there is a high intensity of photosynthesis, the daily 13C/12C values of DIC as well as DIC concentration itself could be highly variable [28,29,30,31,32]. This means that not only seasonal [33] but also diurnal changes in 14C specific activity values in DIC are also possible. DIC, DOC, and POC and their carbon isotope distribution data of recent years are not suitable for the usage for the entire period 1947–2013. Firstly, altered water levels in 1953 may have increased allochthonous POC and alter DIC and DOC concentrations in lake water. Secondly, the intensive development of agriculture in the Soviet Union began in the 1960s, followed by the leakage of mineral fertilizers into rivers and lakes (peaked in 1989–1990), thus leading to intensification of eutrophication. Since the 1990s, agricultural growth slowed down, nutrient inputs to inland waters declined. Thirdly, Lake Drūkšiai from the (oligo) mesotrophic became almost eutrophic due to the effluents carrying nitrogen and phosphorus compounds not only from mineral fertilizers but also from sewage of the Vi-saginas town, established in 1975. The lake ecosystem was also affected by elevated temperatures caused by INPP operation. During the summer months of 1987–2004 (both reactors in operation), the water surface temperature in some parts of the lake could rise up to 32–35 °C [34]. The second Unit of INPP was finally shut down in late 2009 and the hydrothermal regime of Lake Drūkšiai began to restore. In addition, the concentrations of nitrogen and phosphorus compounds discharged into the lake decreased (data not shown), as new Visaginas wastewater treatment plant has been launched at the end of 2009.
The aforementioned environmental factors could have altered the carbon cycle of the lake ecosystem and the CO2 exchange of the lake water with the atmosphere as well as the distribution of carbon isotopes in Lake Drūkšiai ecosystem, therefore simplified and generalized approach was needed to be applied in the modeling.

3.2. Evaluation of 14C Basic Trend in Bottom Sediments

Measurements during the period 1947–1999 showed that both sediment organic fractions AS and AIS exhibit the parallel 14C specific activity course with the difference of 5 ± 1 pMC being higher in AS fraction (Figure 3A). According to soil continuum model, proposed by Lecmann and Kleber [22], sedimentary organic matter is constantly impacted by two opposite processes that are continuously proceeding: the fragmentation/decomposition of larger molecules of primary plant material to smaller size compounds having more polar and ionizable groups, as well as the incorporation of smaller compounds into larger and less reactive aggregates. The measured C/N ratio values (see Figure A2) showed that the main contributors to sediment organic matter are aquatic plants fixing dissolved CO2. Thus, 14C sedimentation mainly was according to the scheme DIC aquatic primary producers sediments.
An additional amount of 14C entering the lake due to INPP operational activities was also evaluated (Figure 3B). As can be seen in Figure 3B, the first 15 years of the INPP operation (from 1984 to 1999) caused the increase of 14C specific activity by 8 ÷ 12 pMC in both organic fractions. This means that during this period 0.24 ÷ 0.37 × 10⁹ Bq/year of 14C was introduced into Lake Drūkšiai. This includes both pathways: radiocarbon assimilation from atmosphere and liquid discharges in dissolved inorganic carbon form. The value was estimated by assuming that for the period 1975–2009 characteristic DIC concentration value in the lake surface water used to be ~2 mM. The exchange rate of 3 years of the lake water was taken in to account as well. Assimilation rates of alkali-insoluble to alkali-soluble as well alkali-soluble and alkali-insoluble ( λ A I S A S   and λ A S A I S   , respectively) remained constant during this period (Figure 4), as relatively good fitting of measured 14C specific activity by model calculations was obtained until 2000. Pearson correlation coefficients on scatter diagrams between measured and calculated 14C specific activity in AS and AIS fractions were 0.968 (p < 0.001) and 0.972 (p < 0.001), respectively.
During the periods of 2000–2002 and 2004–2009 the 14C specific activity differed between the two fractions by 90 pMC and 20–25 pMC, respectively. Assuming that additional 14C entered Lake Drūkšiai only in the DIC form, it was calculated that in 2000–2001 additional activity of 1.5 to 2.3 × 10⁹ Bq/year of 14C was discharged to the lake. In 2010, this additional activity of 14C decreased to 0.67 × 10⁹ Bq/year (Figure 3B). However, changes in the distribution of 14C concentrations in two interacting sediment organic fractions in 2000–2009 indicated that there might have been discharges of radiocarbon from the INPP to the lake in other form than DIC. This anthropogenic impact, most probably caused by the specific INPP discharges, has changed interaction between two sediment fractions so that earlier used constant values of λ A I S A S   and λ A S A I S   in the model could not reproduce the measured 14C pattern in the sediment fractions (Figure 4). Thus, for this period to fit the measurements of 14C distribution in both sediment fractions calculations were performed using different values of assimilation rates between fractions λ A S A I S   and λ A I S A S   (see Table 1, Figure 5A,B).
Alternative scenario would be to assume additional 14C contamination due to releases of organic compounds by the INPP. It is known that aquatic plants (as well as other aquatic organisms) can accumulate and metabolize organic compounds (at least in the molecular mass range <1.0 kDa) and these compounds or their metabolites incorporate into plants’ tissues/cell walls and vacuoles [35,36,37,38,39]. Thus, these water-soluble organic compounds enriched in 14C could enter the aquatic plants’ metabolic system by sorption. However, this scenario is unlikely, as 14C saturated water-soluble organic compounds normally are not expected to be released during operation processes of RBMK type reactors.

3.3. Change in Assimilation Rates λ and DIC Discharges

The results of calculations with the assumption that the source of pollution are compounds that affect the interaction between AS and AIS sediment organic fractions (i.e., assimilation rates λ A I S A S   and λ A S A I S   ) but not being the source of 14C themselves are shown in the Figure 5A and with corresponding model parameters, presented in Table 1. As can be seen from the Figure 5A, the calculated value of 14C specific activity in the AS organic fraction in 2000–2006 was up to 60 pMC lower than the measured value. The Figure 5A also shows that the 14C specific activity in the alkali-soluble organic fraction in the same period 2000–2006 is up to 46 pMC higher than the 14C specific activity in the DIC fraction (measured lake water DIC is the main source of 14C in this scenario). Such artefacts could appear as water samples for DIC measurements in the period 1979–2009 were mostly taken at sampling station no. 6 (Figure 1). This station is far from the sediment sampling site. It is known that the 14C activity of identical samples from different locations in lakes can differ (e.g., in radiocarbon based dating the age differences within the same type of samples can be up to several thousands of years) [40,41]. There is a tributary from Lake Skripkai near the sampling station no. 6 (Figure 1), where the 14C specific activity (data not shown) of the DIC samples collected in 1989–2000 varied from 67 to 122 pMC. These large variations in the values of 14C specific activity could be determined by the fact that this lake receives also wastewater from the Visaginas town (Visaginas town uses Devonian water [42]) and part of the ordinary wastewater from the nuclear power plant (laundry, canteen). In the calculations, we excluded the too low 14C specific activity value (of 102 pMC) in the 2007 DIC. Water samples for DIC measurement in Lake Drūkšiai were collected only once or twice a year. The measured values of 14C specific activity in DIC show radiocarbon concentration at that particular sampling site only at the time of sampling. Thus, the inflowing water from Lake Skripkai (depending on the prevailing wind direction during sampling) could affect the 14C specific activity values in the DIC samples. For this reason, we performed calculations for the period of 2000–2001 by applying increased radiocarbon concentration in the DIC (as to compare to DIC measurements) by 50 pMC (or 1.5 × 10⁹ Bq/year) in order to compensate for the difference in 14C specific activity between the measured and calculated values. This resulted in the change of λ A I S A S   and λ A S A I S   values from 1.0 and 0.35 year−1 to 1.27 and 0.29 year−1, respectively (Table 1), thus fitting the measurement data by the model well. The obtained results are presented in Figure 5B.

4. Conclusions

Model calculations proved that until 2000s discharges of 14C from INPP RBMK-1500 reactors was as expected in DIC form. After 2000, the anthropogenic impact, caused most probably by some changes of the INPP discharges, changed the interaction between the alkali-soluble and alkali-insoluble organic sediment fractions. Therefore, we introduced more complex modeling scenarios, which took into account the temporal changes in values of assimilation rates of alkali-insoluble to alkali-soluble fractions and alkali-soluble to alkali-insoluble (i.e., λ A I S A S   and λ A S A I S   ). It allowed to obtain satisfactory agreement between modeled and measured 14C specific activity values in the layers of the bottom sediment fractions formed after 2000. For two scenarios (scenario A: no additional 14C pollution assumed; and scenario B: additional 14C pollution in dissolved inorganic carbon (DIC) form was assumed) the calculated Pearson correlation coefficient on scatter diagram between measured and calculated 14C specific activity values in AS sediment fraction for the period 2000–2009 was 0.56 (p ≤ 0.1) and 0.95 (p ≤ 0.001), respectively. During the RBMK reactor routine operation and maintenance activities, contamination of the lake with dissolved organic compounds enriched in 14C is very unlikely. Therefore, we assumed that contamination occurred by compounds not enriched in 14C but the ones altering the interaction between sediment fractions. It is known that organic chemicals are used in nuclear industry for decontamination processes of plant circuits from crud deposits of inner surfaces. Additional analysis (e.g., NMR spectroscopy, Py-GC-MS, FTICR-MS) would help to identify the changes of individual chemical groups in sediment fractions during the period 2000–2009. However, sediment organic matter is impacted by continuously ongoing fragmentation/decomposition of larger molecules to smaller size compounds, as well as the incorporation of smaller compounds into less reactive larger aggregates. Thus, the identified changes in individual chemical groups will not necessarily reveal the primary polluting chemical compounds.
Based on measurement data with two distinct peaks of 14C distribution in the AIS and AS organic sediment fractions, we expected to have two pollution episodes: in 2000–2004 and 2005–2009. However, modeling results showed that there was only one pollution episode in 2000–2001, which changed the interaction between the two sediment fractions during the period of 2000–2006. After 2006, the interaction between the AIS and AS organic sediment fractions returned to its primary state.
The established model generally provides acceptable approximation of 14C distribution in sediment layers and in the alkali-soluble and alkali-insoluble sediment fractions of Lake Drūkšiai. It appears that this additional information can help identifying potential contamination occurrences from industrial objects, in this particular case, the Ignalina NPP. In general, the simple model appeared to be a useful tool which provided a retrospective evaluation of carbon cycling processes in the lake and, basing on the model values and their changes one can draw conclusions about the level of the anthropogenic impact to the lake.

Author Contributions

Conceptualization, R.B.; Methodology, R.B.; Software, E.M.; Writing—original draft preparation, R.B. and L.J.; Writing—review and editing, E.M. and L.J.; Visualization, A.P.; Supervision, V.R.; Funding acquisition, J.Š., Ž.E., and L.B.; Data curation. All authors have read and agreed to the published version of the manuscript.

Funding

This research was funded by the Research Council of Lithuania, grant number S-MIP-19-16.

Institutional Review Board Statement

Not applicable.

Informed Consent Statement

Not applicable.

Data Availability Statement

Not applicable.

Conflicts of Interest

The authors declare no conflict of interest.

Appendix A

Figure A1. Carbon accumulation rate in alkali-soluble and -insoluble fractions. Data were taken from [13].
Water 13 01397 g0a1
Figure A2. Organic carbon (OC) accumulation rate and C/N ratio in sedimentary organic matter. C/N data were taken from [13].
Water 13 01397 g0a2

References

  1. IAEA. Management of waste containing tritium and Carbon-14. In International Atomic Energy Agency Technical Report 421; IAEA: Vienna, Austria, 2004; ISBN 92–0–114303–6. [Google Scholar]
  2. NCRP. Carbon-14 in the environment. In NCRP Report No. 81; NCRP: Bethesda, MD, USA, 1984. [Google Scholar]
  3. Kunz, C. Carbon-14 discharge at three light-water reactors. Health Phys. 1985, 49, 25–35. [Google Scholar] [CrossRef]
  4. Molnár, M.; Bujtás, T.; Svingor, É.; Futó, I.; Světlík, I. Monitoring of atmospheric excess 14C around Paks nuclear power plant, Hungary. Radiocarbon 2007, 49, 1031–1043. [Google Scholar] [CrossRef] [Green Version]
  5. Sohn, W.; Kang, D.W.; Kim, W.S. An estimate of carbon-14 inventory at Wolsong Nuclear Power Plant in the Republic of Korea. J. Nucl. Sci. Technol. 2003, 40, 604–613. [Google Scholar] [CrossRef]
  6. Stenström, K.; Erlandsson, B.; Mattsson, S.; Thornberg, C.; Hellborg, R.; Kiisk, M. 14C emission from Swedish nuclear power plants and its effect on the 14C levels in the environment. In Internal Report LUNDFD6/(NFFR-3079); Lund University: Lund, Sweden, 2000; pp. 1–44. [Google Scholar]
  7. Uchrin, G.; Hertelendi, E.; Volent, G.; Slavik, O.; Morávek, J.; Kobal, I.; Vokal, B. 14C Measurements at PWR-Type Nuclear Power Plants in Three Middle European Countries. Radiocarbon 1997, 40, 439–446. [Google Scholar] [CrossRef] [Green Version]
  8. Veres, M.; Hertelendi, E.; Uchrin, G.; Csaba, E.; Barnabás, I.; Ormai, P.; Volent, G.; Futó, I. Concentration of radiocarbon and its chemical forms in gaseous effluents, environmental air, nuclear waste and primary water of a pressurized water reactor power plant in Hungary. Radiocarbon 1995, 37, 497–504. [Google Scholar] [CrossRef] [Green Version]
  9. Xu, S.; Cook, G.T.; Cresswell, A.J.; Dunbar, E.; Freeman, S.P.H.T.; Hastie, H.; Hou, X.; Jacobsson, P.; Naysmith, P.; Sanderson, D.C.W.; et al. 14C levels in the vicinity of the Fukushima Dai-ichi Nuclear Power Plant prior to the 2011 accident. J. Environ. Radioact. 2016, 157, 90–96. [Google Scholar] [CrossRef]
  10. Yim, M.S.; Caron, F. Life cycle and management of carbon-14 from nuclear power generation. Prog. Nucl. Energy 2006, 48, 2–36. [Google Scholar] [CrossRef]
  11. Gaiko, V.B.; Korablev, N.A.; Solov’ev, E.N.; Trosheva, T.I.; Shamov, V.P.; Umanets, M.P.; Shcherbina, V.G. Discharge of 14C by nuclear power stations with RBMK-1000 reactors. Sov. At. Energy 1986, 59, 703–705. [Google Scholar] [CrossRef]
  12. Konstantinov, E.A.; Korablev, N.A.; Solov’ev, E.N.; Shamov, V.P.; Fedorov, V.L.; Litvinov, A.M. 14C emission from RBMK-1500 reactors and features determining it. Sov. At. Energy 1989, 66, 77–79. [Google Scholar] [CrossRef]
  13. Barisevičiūtė, R.; Maceika, E.; Ežerinskis, Ž.; Šapolaitė, J.; Butkus, L.; Mažeika, J.; Rakauskas, V.; Juodis, L.; Steponėnas, A.; Druteikienė, R.; et al. Distribution of radiocarbon in sediments of the cooling pond of RBMK type Ignalina Nuclear Power Plant in Lithuania. PLoS ONE 2020, 15, e0237605. [Google Scholar] [CrossRef]
  14. Mažeika, J. Carbon-14 in terrestrial and aquatic environment of Ignalina nuclear power plant: Sources of production, releases and dose estimates. In Nuclear Power; Tsvetjov, P.V., Ed.; InTech: Rijeka, Croatia, 2010; pp. 293–310. [Google Scholar]
  15. Ežerinskis, Ž.; Šapolaite, J.; Pabedinskas, A.; Juodis, L.; Garbaras, A.; Maceika, E.; Druteikiene, R.; Lukauskas, D.; Remeikis, V. Annual variations of 14C concentration in the tree rings in the vicinity of Ignalina Nuclear Power Plant. Radiocarbon 2018, 60, 1227–1236. [Google Scholar] [CrossRef]
  16. Pabedinskas, A.; Maceika, E.; Šapolaitė, J.; Ežerinskis, Ž.; Juodis, L.; Butkus, L.; Bučinskas, L.; Remeikis, V. Assessment of the Contamination by 14C Airborne Releases in the Vicinity of the Ignalina Nuclear Power Plant. Radiocarbon 2019, 61, 1185–1197. [Google Scholar] [CrossRef]
  17. Mažeika, J.; Taminskas, J. Evaluation of recent sedimentation rates in the lakes of East Lithuania based on radioisotope dating. Geogr. Metraštis 2005, 38, 167–173. [Google Scholar]
  18. Marčiulioniene, D.; Montvydiene, D.; Kazlauskiene, N.; Kesminas, V. Changes in macrophytes and fish communities in the cooler of Ignalina NuclearPower Plant (1988–2008). J. Environ. Eng. Landsc. Manag. 2011, 19, 21–33. [Google Scholar] [CrossRef]
  19. Kleber, M.; Lehmann, J. Humic substances extracted by alkali are invalid proxies for the dynamics and functions of organic matter in terrestrial and aquatic ecosystems. J. Environ. Qual. 2019, 48, 207–216. [Google Scholar] [CrossRef] [PubMed]
  20. Donahue, D.J.; Linick, T.W.; Jull, A.J.T. Isotope-ratio and background corrections for accelerator mass spectrometry radiocarbon measurements. Radiocarbon 1990, 32, 135–142. [Google Scholar] [CrossRef] [Green Version]
  21. Stuiver, M.; Polach, H.A. Reporting of 14C data. Radiocarbon 1977, 19, 355–363. [Google Scholar] [CrossRef] [Green Version]
  22. Lehmann, J.; Kleber, M. The contentious nature of soil organic matter. Nature 2015, 528, 60–68. [Google Scholar] [CrossRef]
  23. Nedveckaite, T.; Marciulioniene, D.; Mazeika, J.; Paskauskas, R. Radiological and environmental effects in Ignalina nuclear power plant cooling pond—Lake Druksiai: From plant put in operation to shut down period of time. In Nuclear Power—Operation, Safety and Environment; Tsvetkov, P., Ed.; IntechOpen: Rijeka, Croatia, 2011; ISBN 978-953-307-507-5. [Google Scholar]
  24. Lamb, A.L.; Leng, M.J.; Mohammed, M.U.; Lamb, H.F. Holocene climate and vegetation change in the Main Ethiopian Rift Valley, inferred from the composition (C/N and δ13C) of lacustrine organic matter. Quat. Sci. Rev. 2004, 23, 881–891. [Google Scholar] [CrossRef]
  25. Leng, M.J.; Marshall, J.D. Palaeoclimate interpretation of stable isotope data from lake sediment archives. Quat. Sci. Rev. 2004, 23, 811–831. [Google Scholar] [CrossRef] [Green Version]
  26. Cloern, J.E.; Canuel, E.A.; Harris, D. Stable carbon and nitrogen isotope composition of aquatic and terrestrial plants of the San Francisco Bay estuarine system. Limnol. Oceanogr. 2002, 47, 713–729. [Google Scholar] [CrossRef]
  27. Contreras, S.; Werne, J.P.; Araneda, A.; Urrutia, R.; Conejero, C.A. Organic matter geochemical signatures (TOC, TN, C/N ratio, δ13C and δ15N) of surface sediment from lakes distributed along a climatological gradient on the western side of the southern Andes. Sci. Total Environ. 2018, 630, 878–888. [Google Scholar] [CrossRef] [PubMed]
  28. Andersen, M.R.; Kragh, T.; Martinsen, K.T.; Kristensen, E.; Sand-Jensen, K. The carbon pump supports high primary production in a shallow lake. Aquat. Sci. 2019, 81, 1–11. [Google Scholar] [CrossRef]
  29. Orion-Jedrysek, M.; Kurasiewicz, M.; Trojanowska, A.; Lewicka, D.; Omilanowska, A.; Kalżuny, A.; Izydorczyk, K.; Drzewicki, W.; Zalewski, M. Diurnal variations in carbon isotope composition of dissolved inorganic carbon (DIC) in a freshwater dam reservoir. Ecohydrol. Hydrobiol. 2006, 6, 53–59. [Google Scholar] [CrossRef]
  30. Pokrovsky, O.S.; Shirokova, L.S. Diurnal variations of dissolved and colloidal organic carbon and trace metals in a boreal lake during summer bloom. Water Res. 2013, 47, 922–932. [Google Scholar] [CrossRef] [PubMed]
  31. Schindler, D.W.; Fee, E.J. Diurnal variation of dissolved inorganic carbon and its use in estimating primary production and CO2 invasion in Lake 227. J. Fish. Res. Board Canada 1973, 30, 1501–1510. [Google Scholar] [CrossRef]
  32. Waldron, S.; Scott, E.M.; Soulsby, C. Stable isotope analysis reveals lower-order river dissolved inorganic carbon pools are highly dynamic. Environ. Sci. Technol. 2007, 41, 6156–6162. [Google Scholar] [CrossRef] [PubMed]
  33. Li, Y.; Qiang, M.; Jin, Y.; Liu, L.; Zhou, A.; Zhang, J. Influence of aquatic plant photosynthesis on the reservoir effect of genggahai lake, northeastern qinghai-tibetan plateau. Radiocarbon 2018, 60, 561–569. [Google Scholar] [CrossRef]
  34. Šarauskienė, D. Thermal regime database of Ignalina nuclear power plant cooler-Lake Drukšiai. Environ. Monit. Assess. 2002, 79, 1–12. [Google Scholar] [CrossRef]
  35. Steinberg, C.E.W.; Paul, A.; Pflugmacher, S.; Meinelt, T.; Klöcking, R.; Wiegand, C. Pure humic substances have the potential to act as xenobiotic chemicals—A review. Fresenius Environ. Bull. 2003, 12, 391–401. [Google Scholar]
  36. Wang, F.; Yi, X.; Qu, H.; Chen, L.; Liu, D.; Wang, P.; Zhou, Z. Enantioselective accumulation, metabolism and phytoremediation of lactofen by aquatic macrophyte Lemna minor. Ecotoxicol. Environ. Saf. 2017, 143, 186–192. [Google Scholar] [CrossRef] [PubMed]
  37. Kováčik, J.; Antoš, V.; Micalizzi, G.; Dresler, S.; Hrabák, P.; Mondello, L. Accumulation and toxicity of organochlorines in green microalgae. J. Hazard. Mater. 2018, 347, 168–175. [Google Scholar] [CrossRef]
  38. Dhir, B. Chapter 21-Green technologies for the removal of agrochemicals by aquatic plants. In Treatment and Remediation; Prasad, M.N.V., Ed.; Butterworth-Heinemann Ltd: Oxford, UK, 2020; pp. 569–591. ISBN 9780081030172. [Google Scholar]
  39. Bhatia, M.; Goyal, D. Analyzing remediation potential of wastewater through wetland plants: A review. Environ. Prog. Sustain. Energy 2014, 33, 9–27. [Google Scholar] [CrossRef]
  40. Hou, J.; D’Andrea, W.J.; Liu, Z. The influence of 14C reservoir age on interpretation of paleolimnological records from the Tibetan Plateau. Quat. Sci. Rev. 2012, 48, 67–79. [Google Scholar] [CrossRef] [Green Version]
  41. Ascough, P.L.; Cook, G.T.; Hastie, H.; Dunbar, E.; Church, M.J.; Einarsson, A.; McGovern, T.H.; Dugmore, A.J. An Icelandic freshwater radiocarbon reservoir effect: Implications for lacustrine 14C chronologies. Holocene 2011, 21, 1073–1080. [Google Scholar] [CrossRef] [Green Version]
  42. Mažeika, J.; Taminskas, J.; Paškauskas, R.; Bodoyan, A.; Baghdassaryan, H.; Tozalakyan, P.; Davtyan, V.; Grillot, J.-C.; Travi, Y. Ecohydrological evolution in the catchment of Lake Drūkšiai, Lithuania, under anthropogenic pressure. Ekologija 2006, 4, 40–50. [Google Scholar]
Figure 1. Lake Drūkšiai and location of sampling sites. The sediment core site and water sampling site are marked by triangles 1 and 6, respectively; the tree sampling site is marked with a circle (N2).
Water 13 01397 g001
Figure 2. Model of carbon cycling in water and bottom sediments of Lake Drūkšiai.
Water 13 01397 g002
Figure 3. Measured and calculated values of 14C specific activity in the alkali-soluble and alkali-insoluble sediment fractions when (A) the INPP impact was evaluated; (B) Evaluated INPP impact in terms of excess of 14C specific activity in the alkali-soluble and -insoluble sedimentary organic fractions during the period of 1985–2010 as well as extent of 14C pollution during the periods 1984–1999 and 2000–2010 (in case pollution was in DIC form), respectively. 14C specific activity values in atmosphere were taken from [16]. Measured values of radiocarbon activity in alkali-soluble and alkali-insoluble organic sediment fractions (red and black circles, respectively) taken from [13].
Water 13 01397 g003
Figure 4. Measured and calculated values of 14C specific activity in the alkali-soluble and alkali- insoluble organic fractions of sediments assuming that λ A I S A S   and λ A S A I S   remain unchanged throughout the study period. 14C specific activity values in DIC were taken from [14]; and 14Cspecific activity values in atmosphere were taken from [16].
Water 13 01397 g004
Figure 5. Measured and calculated values of 14C specific activity in the alkali-soluble and alkali-insoluble sediment fractions assuming (A) λ A S A I S   was changed during 2000–2006 period; (B) additional 14C pollution in dissolved inorganic carbon (DIC) form was added during 2000–2001. 14C specific activity values in DIC were taken from [14]; and 14C specific activity values in atmosphere was taken from [16].
Water 13 01397 g005
Table 1. Parameters and variables of the model of 14C distribution in sediment fractions. The following is provided: the symbol for each parameter, the value and units of each parameter, a descriptive name for each parameter and the source for each value.
SymbolValue Units Name
D A S 3.31 × 10⁻³year−1Decomposition/dissolution constant of alkali-soluble fraction
D A I S 2.58 × 10³year−1Decomposition/dissolution constant of alkali-insoluble fraction
λ A I S A S   1.00year−1Assimilation rate of alkali-insoluble fraction to alkali-soluble
λ A S A I S   0.35year−1Assimilation rate of alkali- soluble fraction to alkali-insoluble
Pollution event 2000–2009 (A)
λ A I S A S   1.00year−1Assimilation rate of alkali-insoluble fraction to alkali-soluble
λ A S A I S   0.35;
with exception of 0.29 during the period of 2000–2006
year−1Assimilation rate of alkali- soluble fraction to alkali-insoluble
Pollution event 2000–2009 (B)
λ A I S A S   1.00;
with exception of 1.27 during the period 2000–2002 then 14C pollution in DIC form was added
year−1Assimilation rate of alkali-insoluble fraction to alkali-soluble
λ A S A I S   0.35;
with exception of 0.29 during the period of 2000–2006
year−1Assimilation rate of alkali-soluble fraction to alkali-insoluble
The parameters were fitted using nonlinear least squares optimization automatic procedure.
Publisher’s Note: MDPI stays neutral with regard to jurisdictional claims in published maps and institutional affiliations.

