
Effects of Intermittent Water Allocation on Vegetation Dynamics in Lake Baiyangdian, North China


1
School of Life Science, Shanxi University, Taiyuan 030006, China
2
School of Physical Education, Shanxi University, Taiyuan 030006, China
3
Shanxi Provincial Security Center of Ecological Environmental Monitoring and Emergency, Taiyuan 030027, China
4
Shanxi Provincial Academy of Ecological Environmental Science, Taiyuan 030027, China
*
Authors to whom correspondence should be addressed.
Water 2021, 13(10), 1400; https://doi.org/10.3390/w13101400
Submission received: 14 April 2021
/
Revised: 11 May 2021
/
Accepted: 13 May 2021
/
Published: 17 May 2021
(This article belongs to the Section Biodiversity and Functionality of Aquatic Ecosystems)
Abstract
:The ecological effects of intermittent water supplement in Lake Baiyangdian were analyzed with an NDVI time series based on the data from 1 April 1998 to 31 July 2008. Four NDVI categories were extracted, and twelve stages were grouped based on the specific replenishment time of water allocation. STR (a seasonal-trend decomposition procedure based on regression) and its corresponding linear regression and abrupt change detection were used to highlight the temporal variations in vegetation under the effects of water allocation. ANOVA was used to identify the response quality of the vegetation in each stage. The results showed that the significant increasing trend of each NDVI category was detected by linear regression (p < 0.001). The 95% abrupt change intervals showed uncertainty and complexity in the immediate vegetation response to water division times. The most abrupt changes were detected in the growing seasons. The extremely significant differences in NDVI variation before and after water allocations were detected by ANOVA (p < 0.001, t-test). The longer the duration of water allocation was maintained, the higher the detection of vegetation coverage was relatively. The increased vegetation coverage benefited from the constant water supply. Our results provide evidence of vegetation responses to intermittent water divisions. The positive effects of water allocation on regional ecological restoration were confirmed. This study strengthened the water division effects of regional vegetation restoration and provided a practical strategy for an effective implementation of water allocation.
1. Introduction
Hydrological regimes have substantially affected the structure, functions, and dynamics of most ecosystems, especially shallow lake ecosystems in arid and semiarid regions [1]. Vegetation cover around the lakes in those regions has suffered from water scarcity for a long time [2]. The availability of water, especially for its temporal and spatial distribution, dominated the dynamics of vegetation cover to a large extent [3]. Thus, vegetation dynamics were previously considered a major ecological indicator of ecosystem response to water availability. The relationship between vegetation and water availability has been a hot topic of global environmental change and ecological restoration [4,5].
The central role of balancing water loss and vegetation restoration should receive sufficient attention by both researchers and the decision makers in ecosystem sustainable development [6,7,8]. The large scale of water transformation aims to maintain regional economic and ecological sustainable development [6]. However, the imbalance between enlarged water utilities in the midstream region (i.e., irrigated agriculture) and the water crisis of natural ecosystems in the downstream region has become increasingly prominent [9,10], especially in areas with scarcity of original water resources. In an ideal state, the suitable level of water diversion with an emphasis on both human needs and ecological restoration is difficult to determine due to the water loss of evapotranspiration, retention, and leakage [11,12,13,14]. In fact, the responses of regional ecosystems to water resource regulation caused by water diversion include many complicated ecohydrological processes [15,16]. Even so, the vegetation change before and after water diversion could directly reflect the effects of water allocation. Water allocation has become a necessary measure to better reallocate limited water resources for regional ecosystem conservation and restoration in Central Asia [14,17] and Northwest China [18,19]. Due to the development of technology, the Normalized Difference Vegetation Index (NDVI) using remote sensing data has become a key indicator of the current vegetation cover. The long-term time-series data provide important detailed information for evaluating vegetation change to better evaluate the effects of water transformation. Previous research has indicated that regional vegetation cover is sensitive to water fluctuations [11,20,21]. Regional ecoenvironment quality and stability are important for a healthy ecosystem [22,23]. In the restoration of larger-scale vegetation distributions, the effects of regional sustainable ecosystems could be reflected in the scope of the NDVI [24,25]. Omute et al. [26] revealed strong interactions between lake vegetation cover and hydrological conditions, especially in low-precipitation years. Some studies put more emphasis on relatively short-duration statistical models to evaluate ecological services [27,28], to gain public acceptance for larger water projects and policy changes [29], to affect the responses of vegetation dynamics to hydroclimatic factors [14], to fulfil water reclamation management [12], to change operational rules with hydrologic state-dependent multi-reservoirs [6], and to understand the relationships among soil, hydrology, vegetation and climate changes [8,13,30]. The studies also concentrated on the relatively short time duration with water divisions or a specific impact of water division. Evaluations of ecological effects on decadal scales and under intermittent water allocation are not abundant.
In April of 2017, the Xiongan New Area of Hebei Province was constructed by the Central Committee of the Communist Party of China and the State Council. It was a multifunctional area that undertook the significant tasks of reform and opening up the region. The Xiongan New Area was considered as the third state-level new areas that rank behind the Shenzhen Special Economic Zone and the Shanghai Pudong New District. As an important ecological water body of the Xiongan New Area, Lake Baiyangdian was selected as the object of study, considering the constant water replenishment in the future due to the top priorities of ecological restoration. With future population increase and rapid economic development, water consumption is expected to increase dramatically, which in turn would diminish water availability. The intermittent water allocation time periods were specified by extracting twelve stages representing every continuous time interval of water transformation during the recorded ten years.
The specific objectives were: (1) to elaborate the decadal trend and abrupt pattern of vegetation dynamics caused by constant and intermittent water allocations; (2) to identify the response strengths and differences of vegetation to intermittent water allocation in different NDVI categories; and (3) to propose a new regime for future water supplement with an emphasis on the ecological effects. The decade NDVI time series with 10-day synthesis datasets (1 April 1998 to 31 July 2008) from the SPOT-VGT S10 TOC NDVI products in Lake Baiyangdian were used to explore the temporal and spatial responses of the NDVI to water resources. Three groups represent the extracted three time-series NDVI data in the same time period but in different years. It refers to three time periods representing the real water allocation time period, the same time ahead one year, and the same time after the year. The NDVI series data were extracted to every stage in each group based on the NDVI values for 383 grid cells inside the boundary of Lake Baiyangdian. The categories included the minimum of NDVI (NDVImin), the mean value of NDVI (NDVImean), the most frequent pixel value of NDVI, meaning the value appeared in the largest number (NDVImost), and the maximum of NDVI (NDVImax). The data were first analyzed for trends and abrupt changes in each NDVI category and then the vegetation responses to water allocation using ANOVA.
2. Materials and Methods
2.1. Study Area
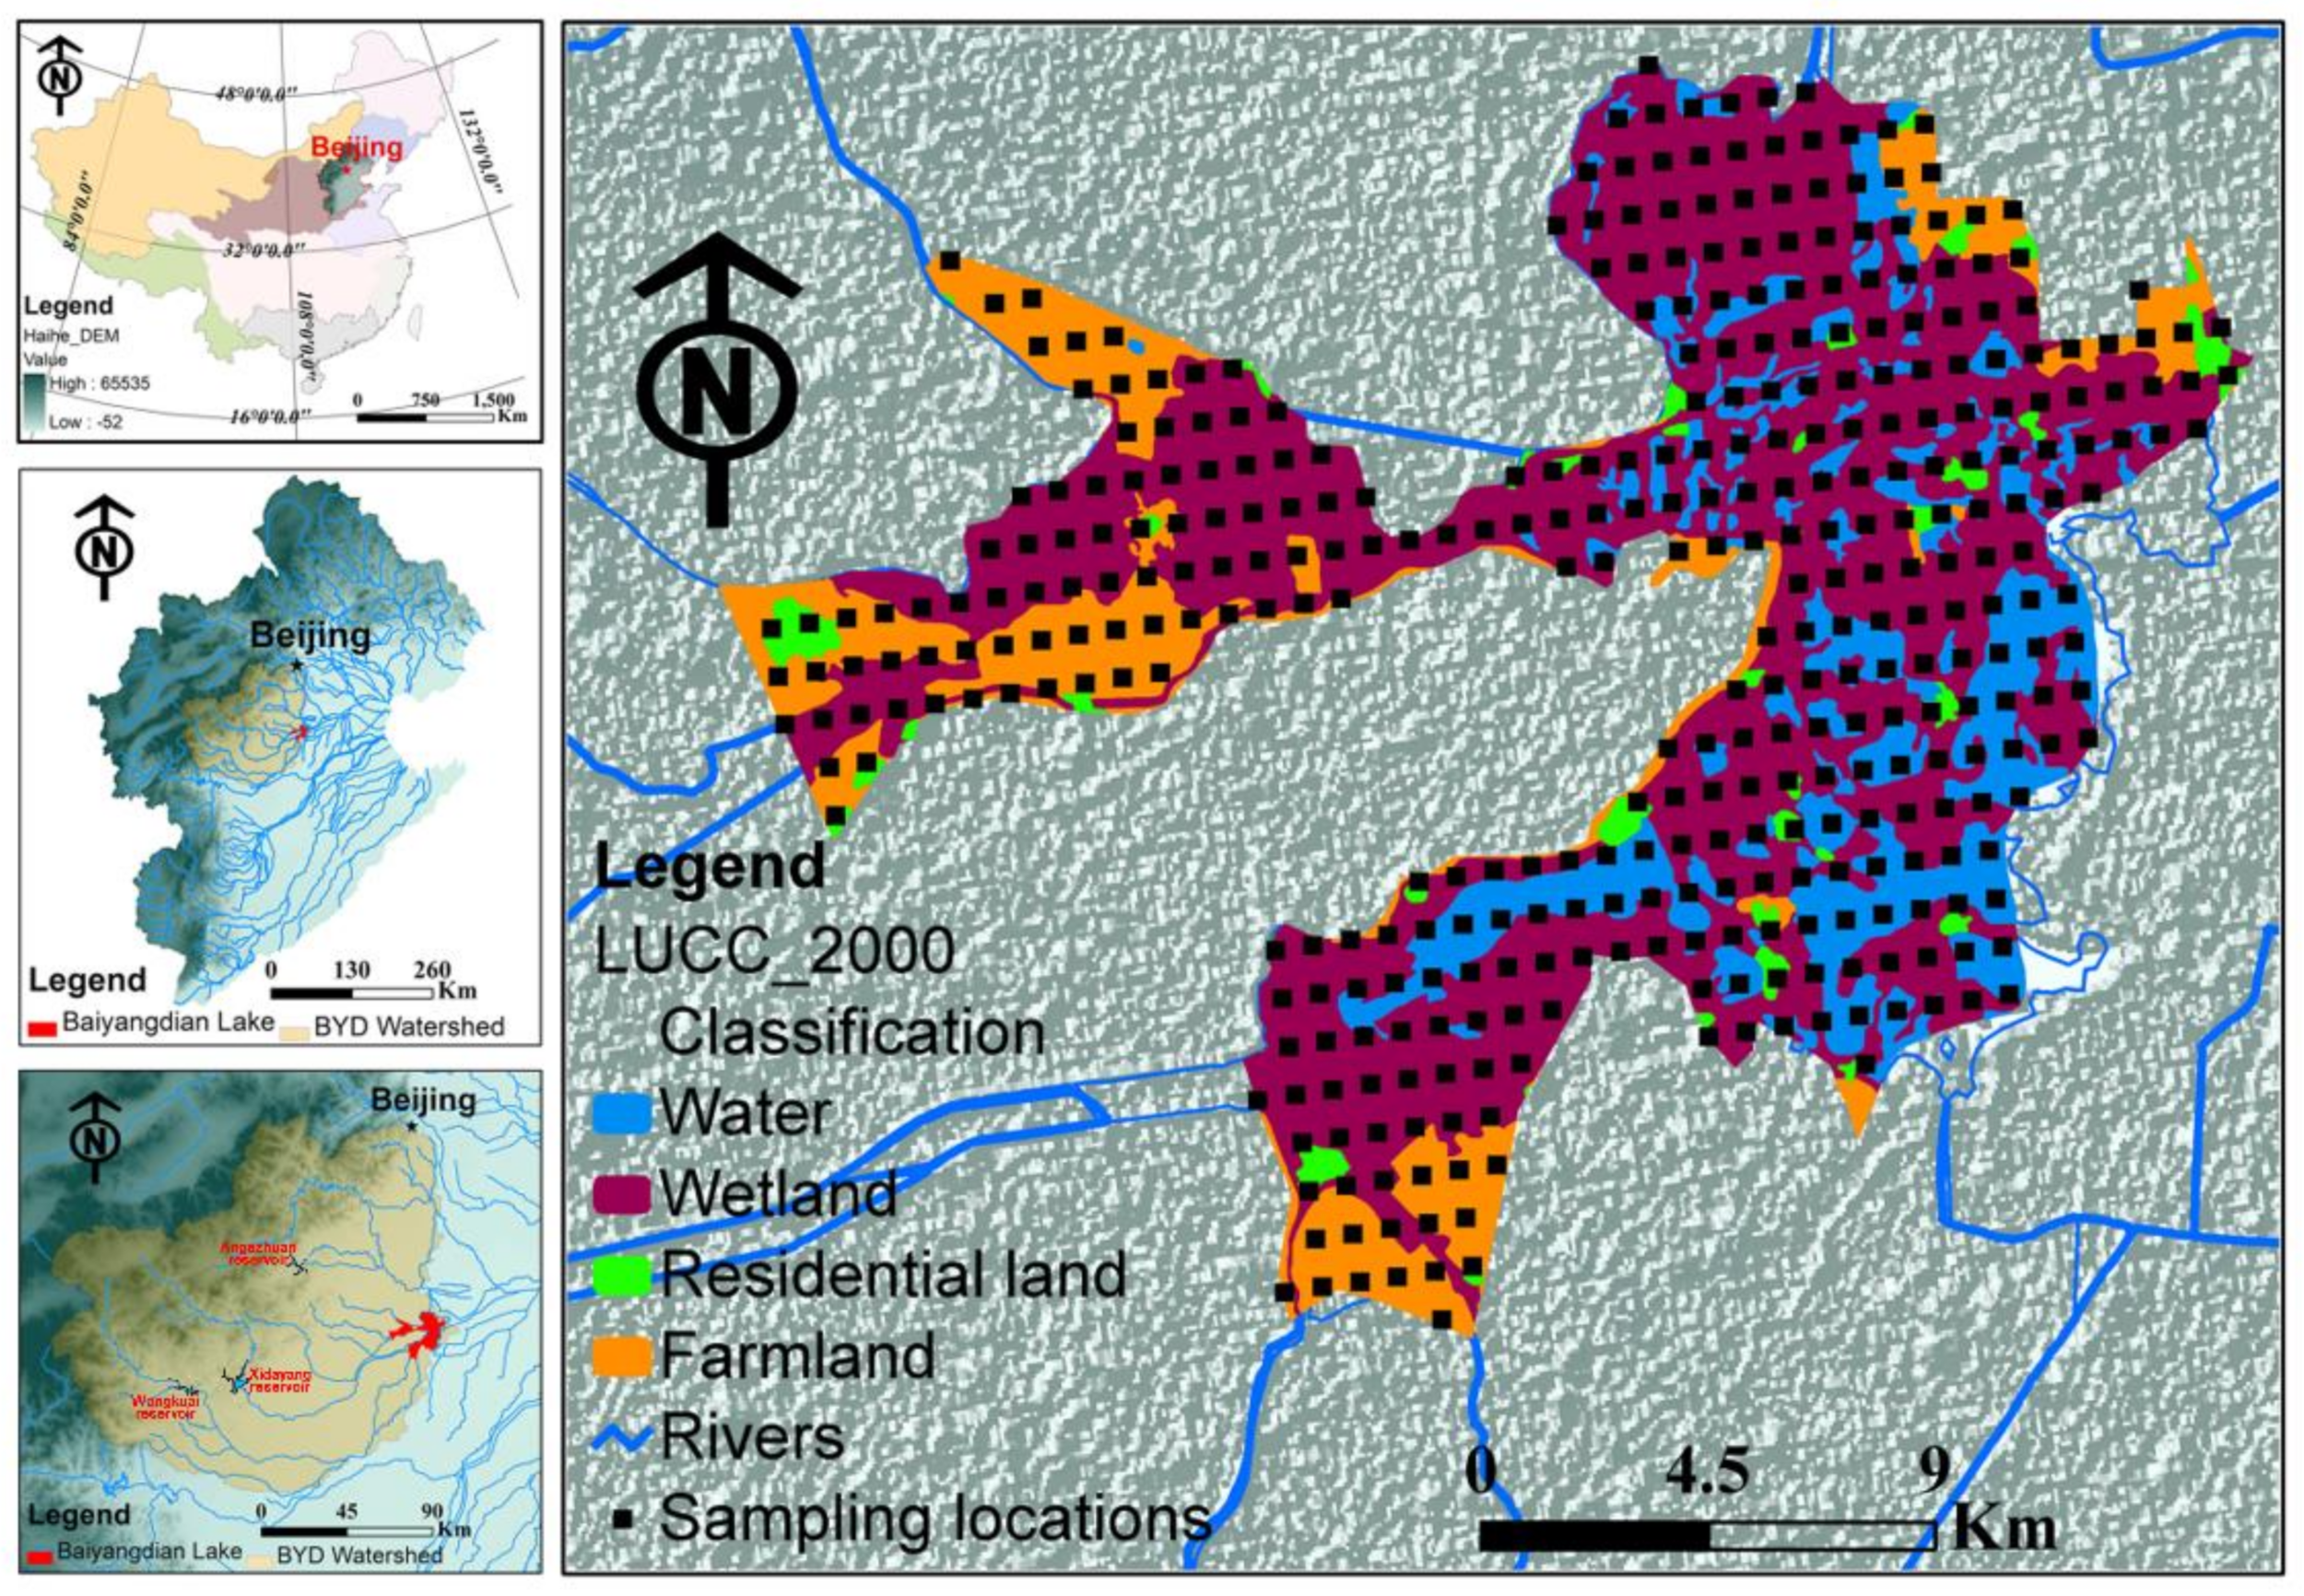
Baiyangdian Lake (38°43′ N to 39°02′ N, 115°45′ E to 116°07′ E) is the largest natural freshwater shallow lake in North China (Figure 1). It consists of hundreds of small and shallow lakes linked by thousands of ditches, with a surface area of 366 km2. In April 2017, the construction of the Xiongan New Area was of profound significance in economic and social development. The restoration of the Lake Baiyangdian is the top priority of new district construction due to its important role in supplying drinking water in the region, sustaining agriculture, as well as controlling floods and regulating the regional climate for the basin. Three reservoirs are located in upstream of the lake, which are named Angezhuan reservoir, Wangkuai reservoir, and Xidayang reservoir. The mean precipitation is 530.4 mm, and the regional climate is dominated by continental monsoons of a humid or subhumid region, as the topography vary little in such a flood plain (altitudinal variation of up to 9 m), and the effect from precipitation on vegetation may be negligible.
In recent years, the lake has become seriously polluted, mostly caused by insufficient water resources. As sources for the economic and social water users, the upstream reservoirs have profoundly changed the hydrologic regime of the lake. Accordingly, the natural outflow of the upstream reservoir is inadequate for the environmental flow requirements of the downstream to maintain and restore ecosystem health. Water scarcity has been a crucial problem that greatly influences the vegetation and agriculture production. In the 1990s, implements of the water supplements from the upstream reservoirs were conducted (Table 1), which resulted in significant variations of the hydroecological region. In this study, 12 stages were identified based on the water allocation time. Each stage represented the continuous time interval of water transformation. Detailed information is shown in Table 2.
2.2. Data Sources
The water allocation data were obtained from the Agency of Environmental Protection of Anxin County. The SPOT-VGT S10 TOC NDVI products, including the 10-year NDVI time-series datasets (from 1 April 1998 to 31 July 2008) with a spatial resolution of 1 by 1 km, were obtained from the European Space Agency (www.vito-eodata.be, accessed on 11 May 2021). The compiled VGT S10 products (10-day syntheses) acquired in a 10-day period. All NDVI images were reprojected in UTM coordinates as the metadata for the study.
The monthly time-series NDVI data were extracted as the following three groups. Three groups represented three time periods indicating the real water allocation time period, the same time one year before, and the same time one year after, respectively. The Current group represents the extracted NDVI data during the water allocation periods, and the Before group represents the extracted NDVI data during the same time of water allocation 1 year earlier, and the After group represents the extracted NDVI data during the same time of water allocation after 1 year.
The total 383 grid cells (Figure 1) with 1 km spatial resolution were extracted inside the boundary of Baiyangdian Lake. The NDVI series data were extracted to each grid cell for the analysis, and the NDVImin, NDVImean, NDVImax, and NDVImost were considered.
2.3. Statistical Methods
2.3.1. STR Trend Component Extraction
STL (seasonal-trend decomposition using loess) is a widely used method because of its availability in R [31] However, only a few of the methods have the clarity, simplicity, and generality that allow them to handle the many problems that occur with seasonal data decomposition [32]. STR can resolve problems with seasonal decomposition by recasting the data in the framework of ordinary least squares or quantile regression. In particular, the robust version of STR could find the specific changes in the trend component.
The simplest STR is an iterative nonparametric procedure using repeated loess fitting [31]. A time series of monthly monitoring data may be considered a sum of three components: high-frequency seasonal; low-frequency, long term (or trend); residual (variation not explained by time).
where Yyear,month is the observed value for a given year and month, Tyear,month is the trend component, Syear,month is the seasonal component, and Ryear,month is the residual term.
Yyear;month = Tyear;month + Syear;month + Ryear;month
In the simplest STR model, the maximum likelihood is applied to estimate the cross-validated residuals of the seasonal components. The cross validation is used to estimate the residuals of minimizing SSE (the sum of squares due to error), while the optimal parameters were obtained on the basis of the R core “stats” package. The robust STR was chosen to extract the trend component. All STR analyses were conducted by the “stR” package in R language (cran.R-project.org/). The detailed methodology can refer to [32].
2.3.2. Linear Regression of the Trend
The continuous time-series variables were treated as the extracted trend components. The linear regression analysis was conducted to explore possible statistical trends of the magnitude of NDVI changes. The sensitivity of the temporal variables was estimated by a partial least squares (PLS) regression. The regression coefficients were applied to estimate the overall goodness-of-fit. The linear regression analyses were performed in R (cran.R-project.org/).
2.3.3. Abrupt Change Detection
As for time-series analysis, structural changes represent shocks impacting the evolution process of the data generation. The intermittent water allocations implied irregular disturbances to normal ecological changes. In the study, the abrupt change analysis was performed by a Bayes information criterion (BIC) method. An optimal number and location of breaks, which evaluate the candidates for structural breaks, was calculated by BIC methods [33]. In addition, the least squares and the minimized residual sums of squares (RSS) were used for slope estimation. The “strucchange” package in R language was applied for the abrupt change analyses. The package could detect several potential breakpoints in a time-series dataset before specifying the optimal breaking number. Based on the minimum BIC and the global minimized RSS, the optimized number of breakpoints can be obtained. In this study, we focused on the abrupt time and concentrated on the abrupt duration at a 95% significance level.
2.3.4. ANOVA
The significant variations in the NDVI categories under different groups were systematically analyzed by one-way ANOVA, and the multiple comparisons were conducted with the current group under the t-test. As the vegetation has the same phenological characteristics in the specific period of one year, the three aforementioned groups represent the extracted three time-series NDVI data in same time period but in different years. The vegetation dynamics may be influenced by water availability, and this could be drawn by pairwise comparison in ANOVA. All analyses were performed in R (cran.R-project.org/, accessed on 11 May 2021).
3. Results
3.1. Statistics Description
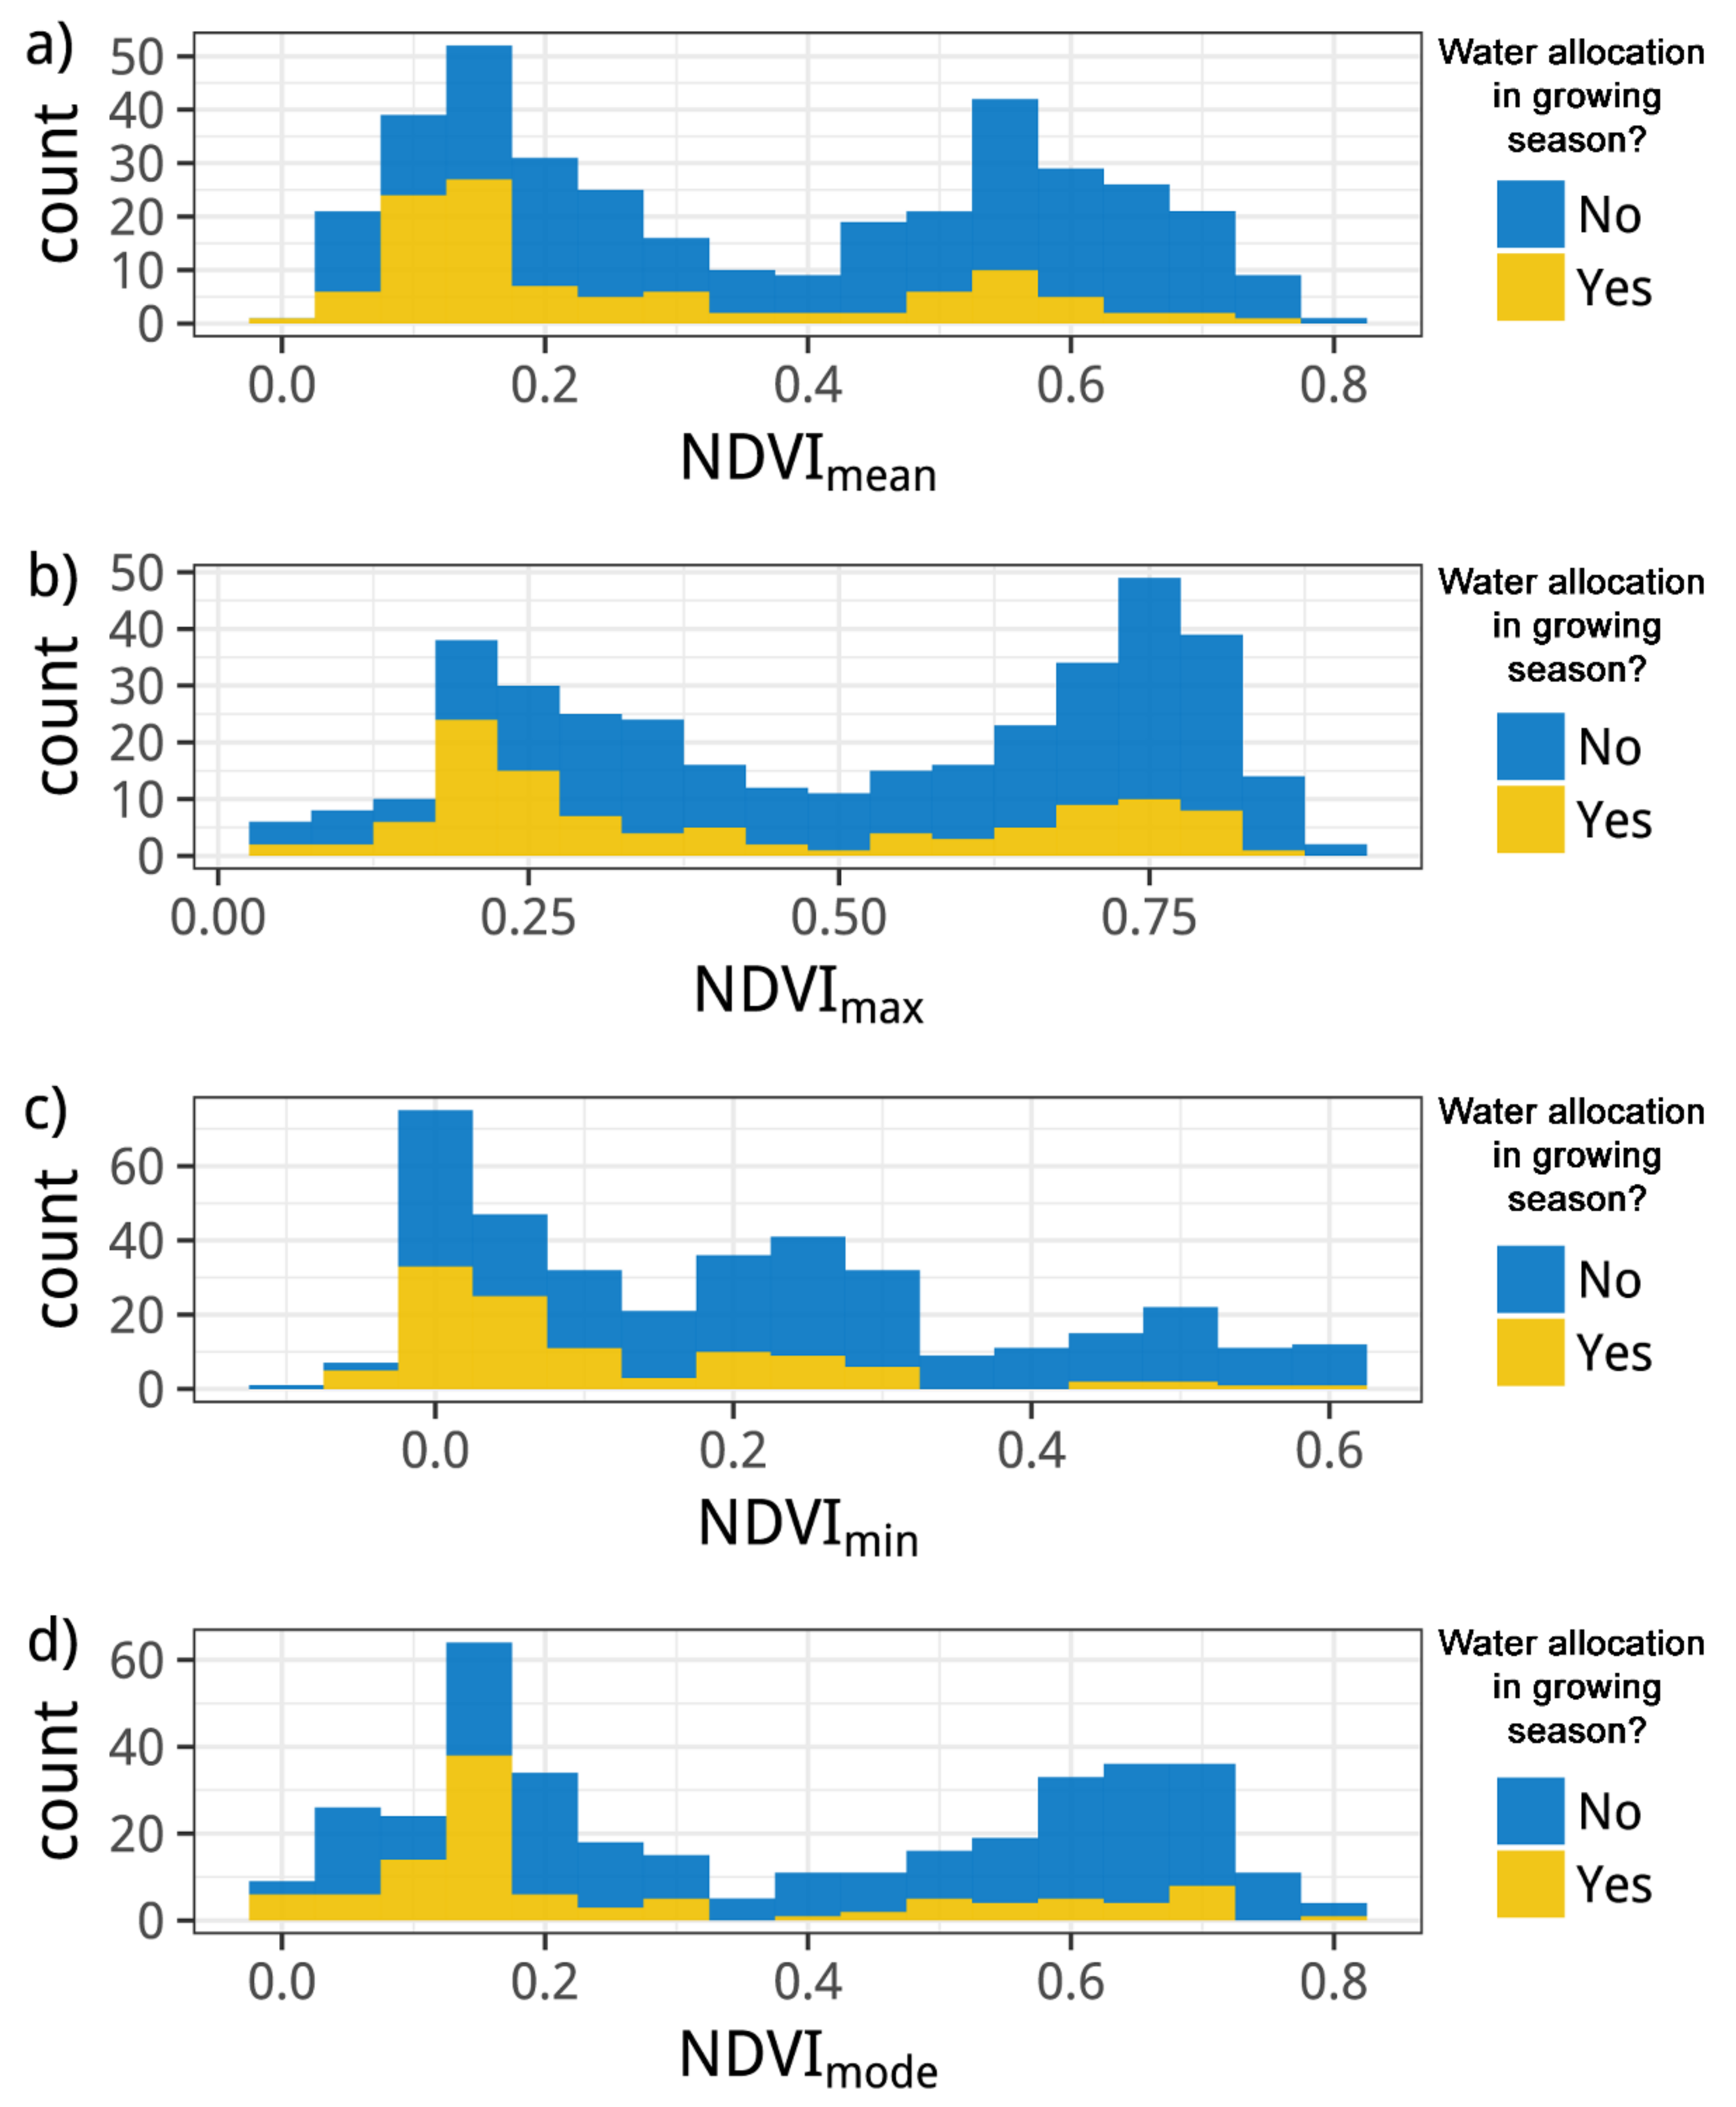
As presented in Figure 2, the two obvious classifications are shown in all NDVI variables, which indicate that water allocation occurs in the growing season and nongrowing seasons of vegetation. Table 2 shows the descriptive summary of the NDVI categories of the three groups in different stages of water allocations. The results show that NDVImean values are higher after water allocation compared with those before water allocation except in stages 1, 5, and 10, but the differences are not large. The NDVImean values are either slightly larger or are similar in the Before group compared with those in the Current group. The NDVImost and NDVImin categories also show similar results. There are also some negative values of NDVImin, which implies that water allocation occurs in the non-growth season of vegetation. The relatively higher NDVI values occur in the growing season. It should be noted that vegetation cover could be reflected by NDVI because each duration in the 12 stages contains vegetation greenness, which could be detected by remote sensing.
3.2. NDVI Trend Analysis
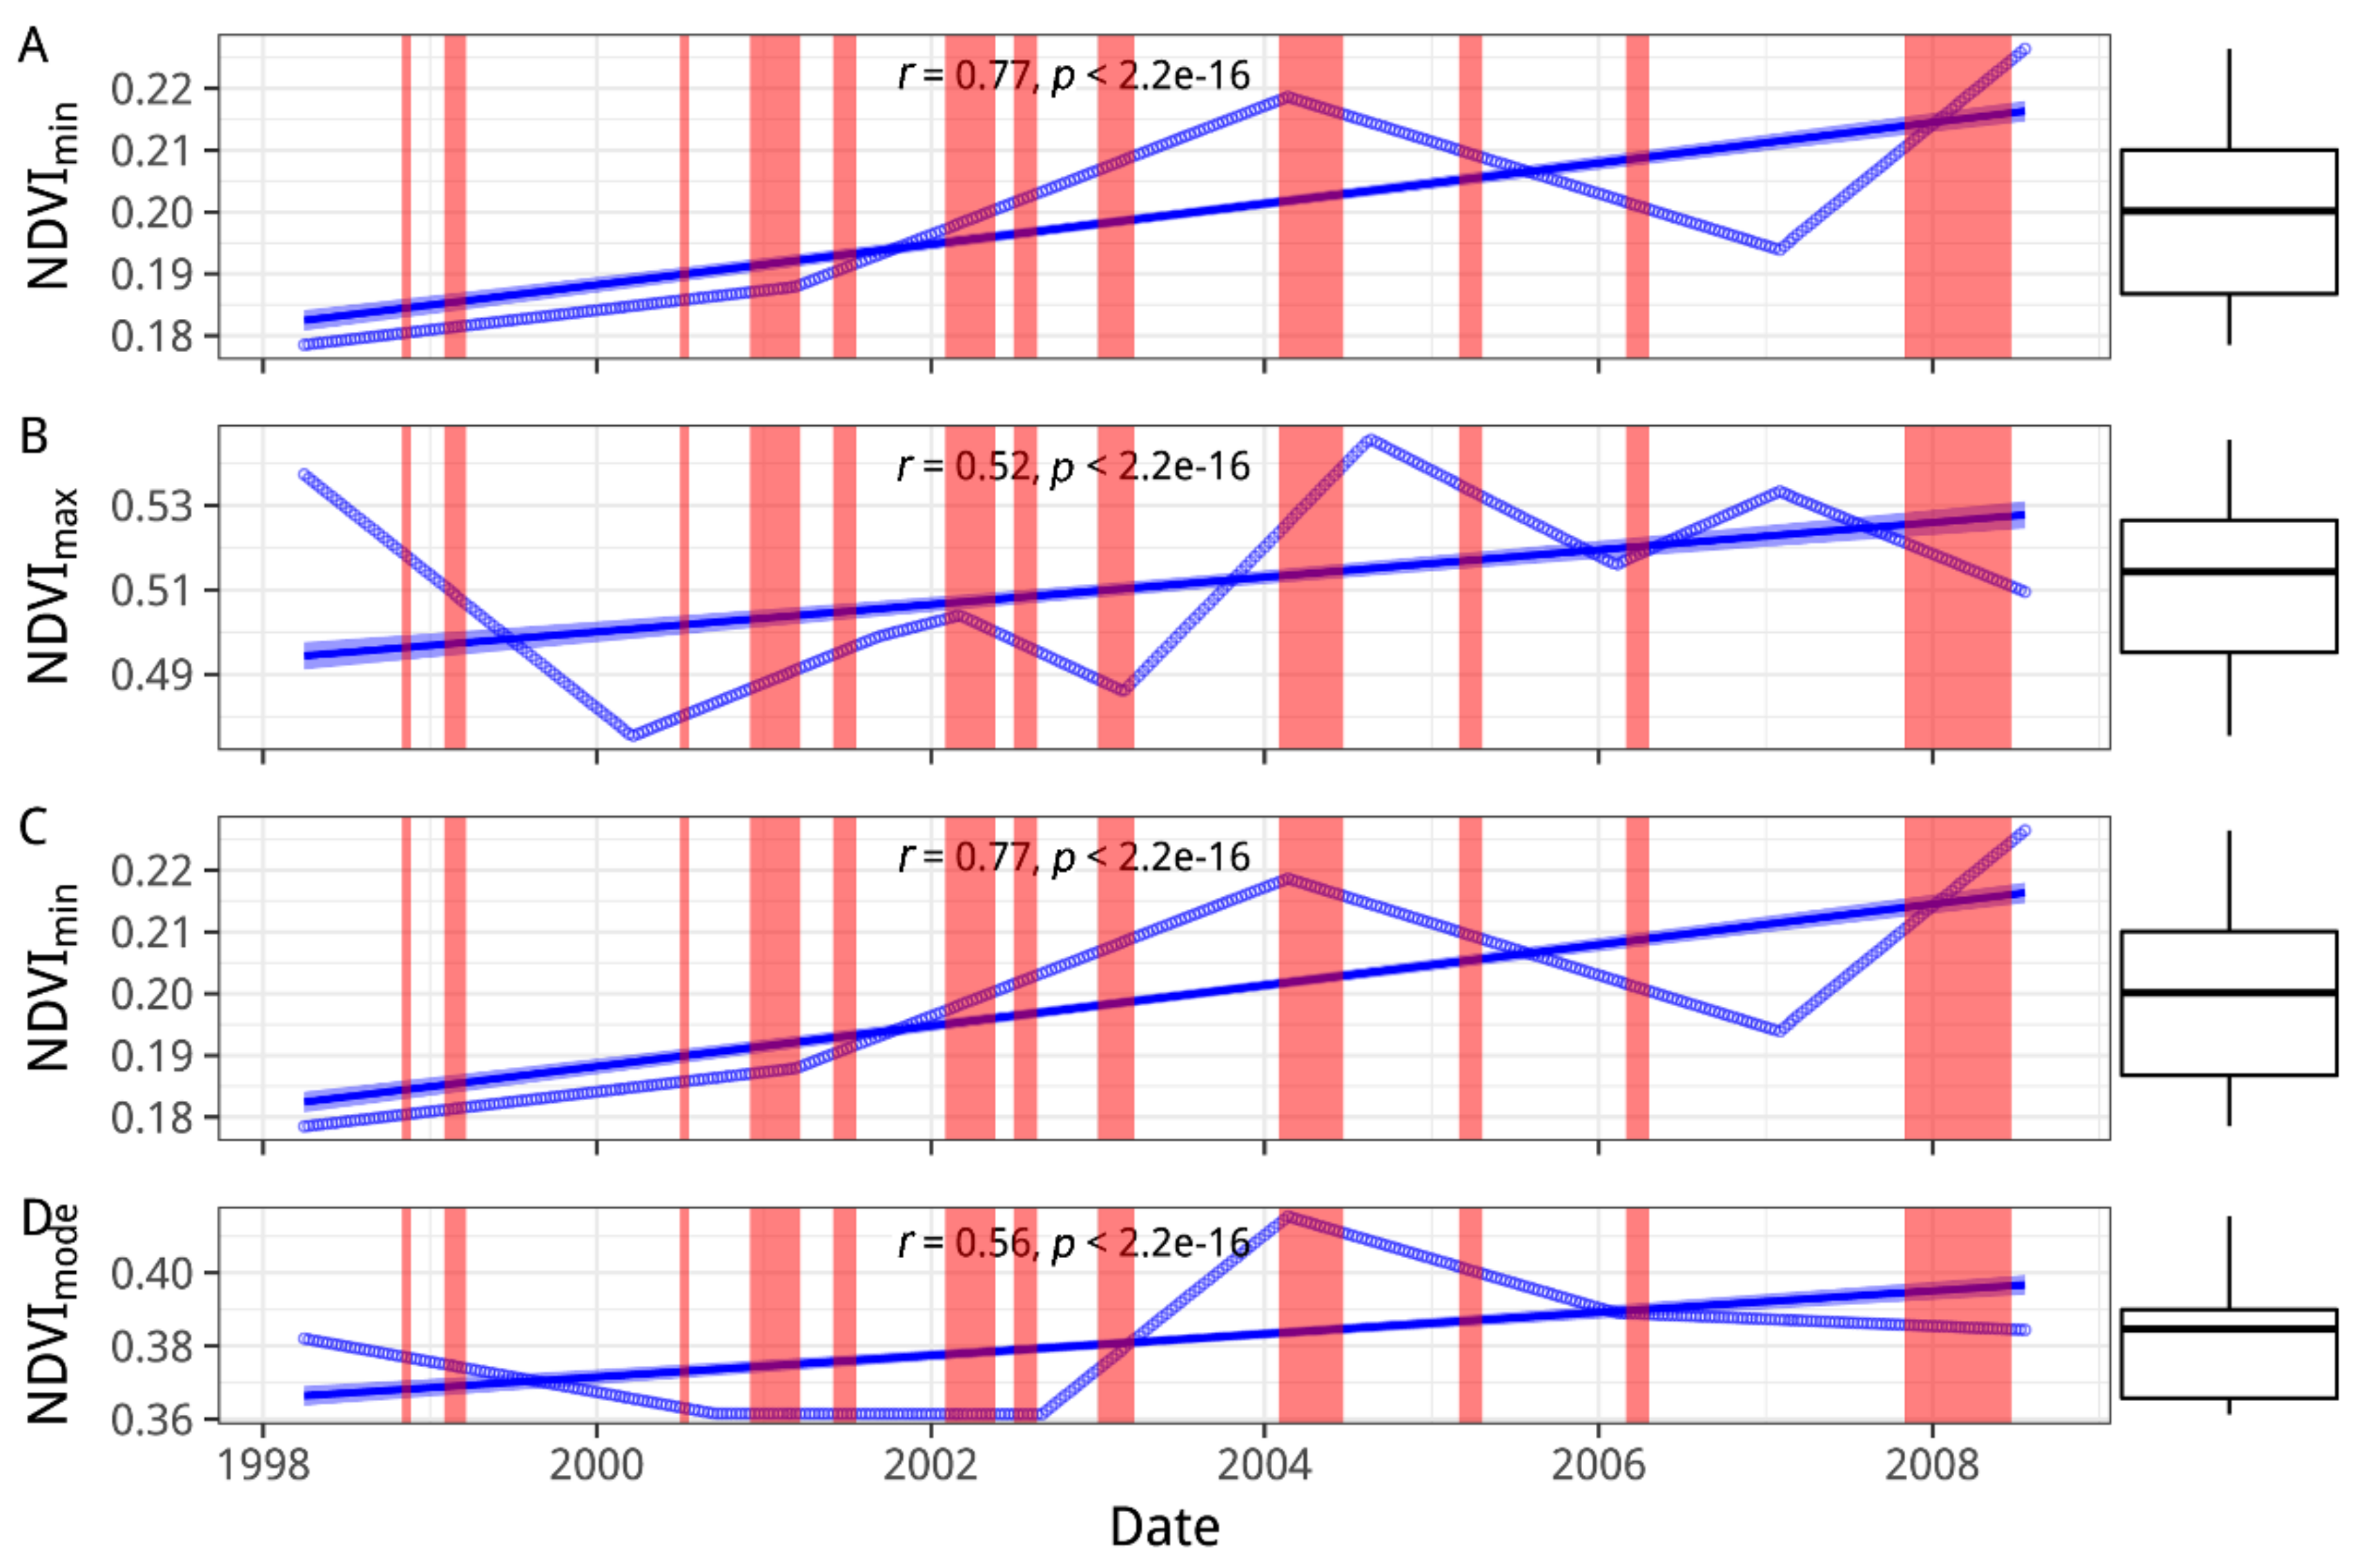
Robust STR can tolerate outliers well and can provide details for the NDVI trend component (marked as blue circles) in Figure 3. Detailed information on the STR results is shown in the Supplementary Materials (Figures S1–S4). As shown in Figure 3, the linear regression of the trend component displays an extremely significant increasing trend for all four NDVI categories (p < 0.001). The marginal box plots show the relative centralized distribution of NDVImost category data (Figure 3). The extremely significant increasing trends of all NDVI categories show the positive effects of water supplement in the lake. The color background representing the duration of the water allocations indicates the heavy dependence of lake ecosystems on water resources in recent years.
3.3. Analysis of Abrupt Change
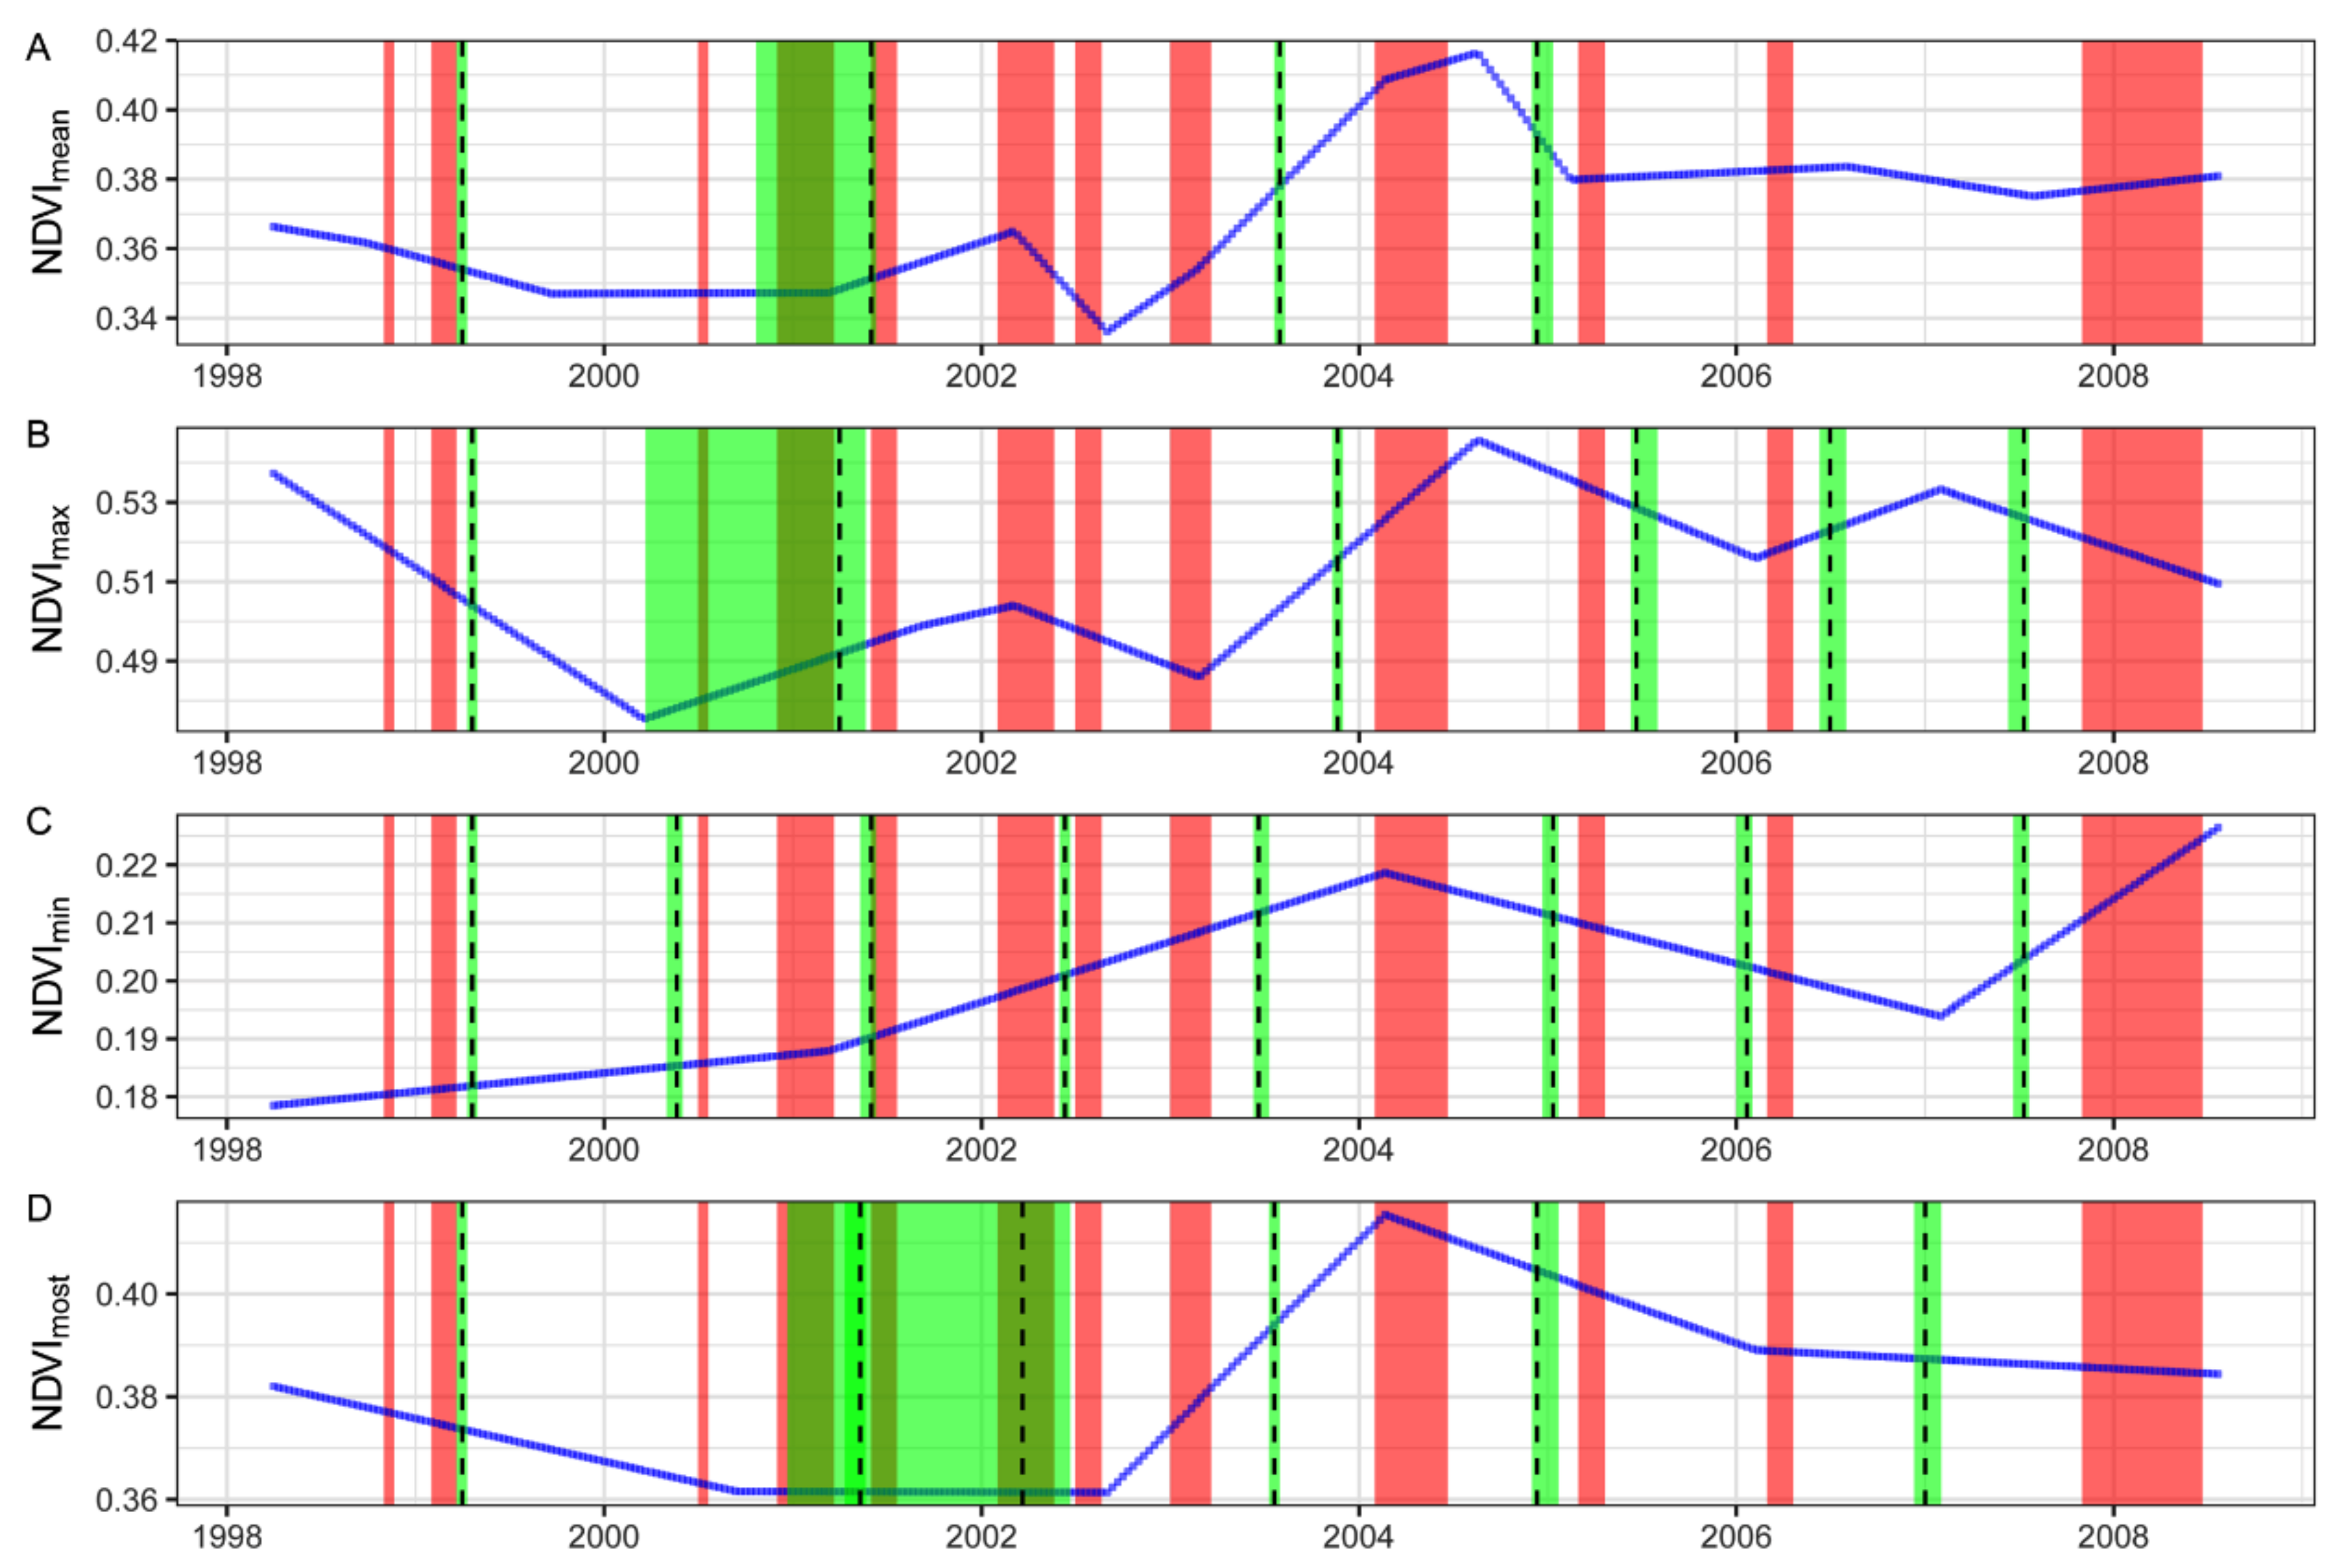
The BIC method was used for change-point detection and the least squares. The minimized RSS was applied for the estimation of slope. The optimized number of breakpoints is obtained by the minimum BIC and the associated RSS (Figure S5 in the Supplementary Materials). In this case, we focused on the abrupt time and concentrated on the abrupt duration at the 95% significance level (green background in Figure 4) based on the minimum BIC, which coincided with the associated smaller RSS criterion. As shown in Figure 4, abrupt changes are detected in the NDVI categories with the optimized number of breakpoints: 4 for NDVImean, 6 for NDVImax, 8 for NDVImin, and 6 for NDVImost. The dashed line represents the exact abrupt change point. Obviously, neither the 95% abrupt change intervals nor the exact abrupt change points show the immediate response of vegetation to water allocation in the entire recorded data. However, NDVImean in stage 4 shows quick response, as well as NDVImax in stages 3 and 4, and NDVImost in stages 4 and 5. Moreover, supporting evidence for those quick responses was captured by the intense frequencies of water allocations after 2001 and the relatively large percentage of the receiving water column with respect to the lake total volume (such as 14.5% in 2001 and 31.9% in 2002, as shown in Table 1). The results indicate that high-frequency and long-term water divisions could increase the significant abrupt intervals. The results also indicate the greater uncertainty and complexity of vegetation response to water allocation on temporal scales. The time-series data of NDVImean show less abrupt change numbers compared with those of the other NDVI categories. Most abrupt changes were detected in the growing seasons except for the 4th change in NDVImean (Figure 4A), the 3rd change in NDVImax (Figure 4B), the 6th and 7th changes in NDVImin (Figure 4C), and the last 2 changes in NDVImost (Figure 4D). In addition, the maximum value of NDVI occurred in the growing season in 2004 (Figure 4). The higher NDVI values imply a relatively high plant cover when water is unavailable. The results reflect the effective implementation of water allocation when plant cover is high and the water resource is urgent. After 2004, NDVImean showed stable fluctuations (Figure 4A), which also implied that the stable vegetation cover of the ecosystem benefited from previous water allocations.
3.4. Ecological Responses of Vegetation
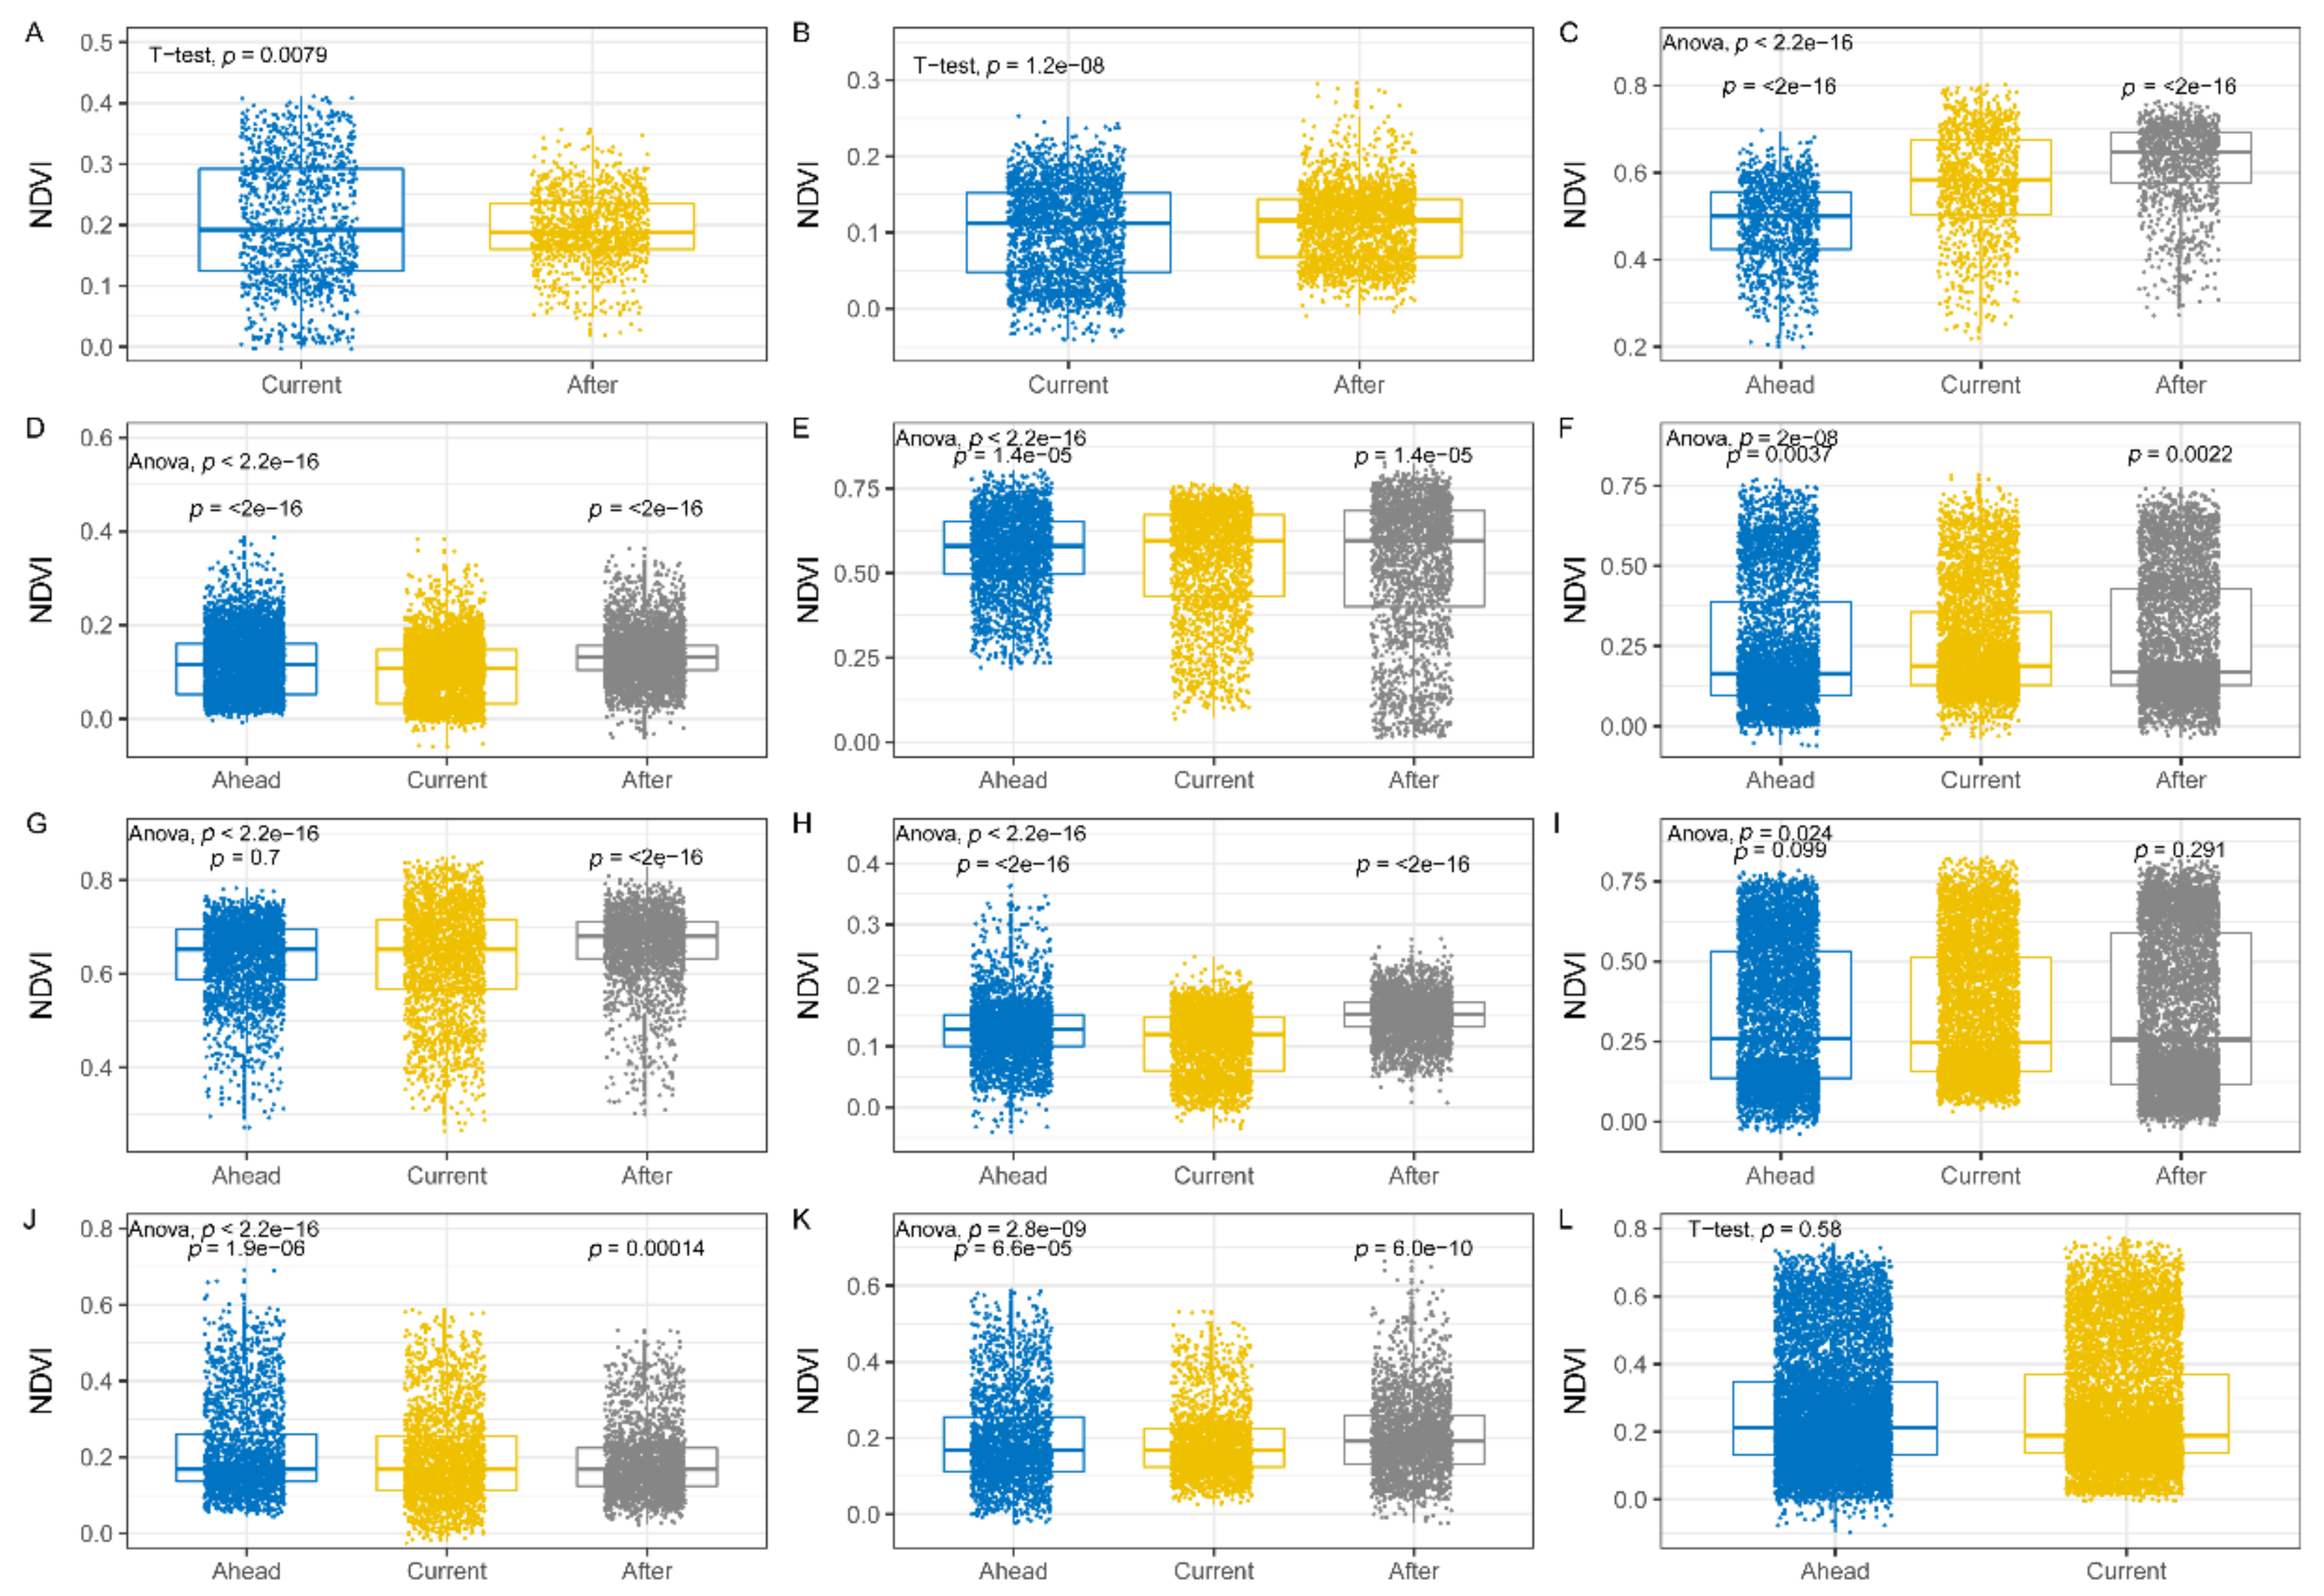
The ecological responses of the plant cover to water supplement at each stage were analyzed using one-way ANOVA as well as comparisons with the respective current group (Figure 5). As shown in Figure 5, the ANOVA results reveal extremely significant differences (p < 0.001, t-test) with the comparisons to the respective current group in all stages except the Before group in stage 7 (Figure 5G), the After group in stage 9 (Figure 5I) and the Before group in stage 12 (Figure 5L). The large extension in vegetation cover (showing the narrow and tight box of the boxplot) occurs in the periods of during and after water allocation in shortened durations of water allocations (Figure 5A–D,G,H,J). The higher vegetation cover could be maintained or even extended further for a long time in the long-term duration of water allocation (Figure 5E,F,I,K,L). The results reflect the positive impacts of water allocation on plant coverage. In addition, the intermittent water allocations provide much larger water resources, and the accumulated water column could maintain a sustained water supply for ecosystem restoration. Thus, the implementation of water transformation is beneficial for vegetation restoration. Moreover, although the water loss due to evapotranspiration, retention, and leakage is not reflected in the research, the water allocation time should be emphasized.
4. Discussion
Although fluctuations in vegetation coverage persist in the decadal trend component, the linear regression reveals a significant increasing variation in the NDVI time-series data. The constant intermittent water allocation played an important role in regional vegetation growth. It was reported around Lake Victoria that NDVI could predict hydrological variations in less rainfall years, and this indicates the strong correlations between NDVI and water availability in a water scarcity area [26]. The maxima of NDVI occurred in the growing season when NDVI was highly correlated with rainfall on a monthly scale [33]. Our results show similar phenomena. In the nongrowing season, when the NDVI values were lower, water supplement was timely conducted. The results also indicate the positive effects of water allocation. After the shortened duration of water allocation, the results imply that the relatively moistened conditions were beneficial for the vegetation threatened by water scarcity.
The NDVI trend displayed stable fluctuations during the recent years of the recorded duration. Similar results were also presented by [33], indicating important effects of water availability on NDVI dynamics. The supporting evidence shows that a relatively larger discharge flowed into the lake in 2008, as well as evidence from the duration of water allocation in stage 12 in 2008. However, the extended duration of water allocation influenced more vegetation by sufficient water availability infiltrating longer distances. Ling et al. [13] reported the significant and positive correlation of the ecological water requirement with the distance from the river on both banks. The ecological water requirement of the riparian vegetation can be met over a stretch between 4.9 km and 10.0 km as long as sufficient infiltration could keep going long enough [13]. In the condition of even a 90% frequency of river inflow, water leakage could only meet roughly less than 40% of the ecological water requirement, and the proper inflow and duration were necessary for vegetation restoration [34]. Our results implied similar conclusions of positive vegetation restoration with high-frequency and long-term water divisions. In fact, ecological water allocation are defined to meet the water requirement of growing vegetation, as well as to realize the effective utilization of ecological water [35,36]. Thus, vegetation growth and its breeding characteristics should be considered when water supplements were implemented in growing seasons [34]. In our study, most water allocations were implemented during the nongrowing season of vegetation. Thus, the proper time should be considered when making a plan of ecological water allocation. Peña-Arancibia [37] emphasized the importance of combining remote sensing and hydrological models in improving water allocation decisions. The adequate spatial and temporal resolution of data according to the operational and planning phases should be stressed to address uncertainty in large regions [38]. Our results only implicitly imply the temporal uncertainty of vegetation response to intermittent water supplement. Furthermore, the exact effects of the accumulation of water resources are difficult to assess when water allocations are implemented frequently.
In addition, this study was somewhat limited by the raw rough hydrological recorded data, as well as the temporal and spatial resolution of the remote sensing data. The former data are discontinuously recorded on an approximately monthly scale. The latter data were representative of 10-day periods, in which the temporal resolution contributes to uncertainty in the estimation of vegetation changes. As an unbiased method was used, the extractions of NDVI should be robust. In terms of spatial resolution, each grid cell generally consisted of several different types of vegetation. It is important to acknowledge that the extracted NDVI values are representative of vegetation types rather than individual species.
5. Conclusions
The ecological effects of intermittent water allocation on the corresponding vegetation were analyzed based on remote sensing data. The temporal variations of vegetation were presented by conducting the extraction of an NDVI trend component and the corresponding linear regression. The ANOVA method was applied to identify the response quality of plants to the constant intermittent water divisions. Our conclusions are as follows:
- 1)
- The significant increasing trend of each NDVI category was detected by linear regression. The decadal increasing NDVI trend implied the positive effects of ecological restoration due to long-term water allocations.
- 2)
- The immediate response of vegetation to water allocation was not detected based on the 95% abrupt change intervals. The high-frequency and long-term water divisions could increase the significant abrupt intervals. There was also more uncertainty and complexity in vegetation response to water allocation on temporal scales, although most abrupt changes were detected in growing seasons.
- 3)
- Extremely significant differences in NDVI variations before and after water allocations were detected by ANOVA (p < 0.001, t-test). The longer the duration of water allocation was maintained, the higher the detection was in relation to the vegetation coverage. The increased vegetation coverage benefited from the constant water supply.
Our results provide evidence of vegetation responses to intermittent water divisions. The positive effects of water allocation on regional ecological restoration were confirmed. However, although the water loss due to evapotranspiration, retention, and leakage was not reflected in the research, the water allocation time should be emphasized. Thus, the results of this study are global to the degree where they can be extended to other similar regions for implementing water allocations. Moreover, they are valuable for further confirming the water division effects of regional vegetation restoration and developing a practical strategy for guiding the implementation of water allocation.
Supplementary Materials
The following are available online at https://www.mdpi.com/article/10.3390/w13101400/s1, Figure S1: The Robust STR decomposition for NDVImean time series data. Figure S2: The Robust STR decomposition for NDVImax time series data. Figure S3: The Robust STR decomposition for NDVImin time series data, Figure S4: The Robust STR decomposition for NDVImost time series data. Figure S5: BIC and Residual sum of Squares (RSS) from abrupt chang detection showing the optimal numbers for breakpoints in NDVI categories data.
Author Contributions
Data curation, F.W.; writing—original draft preparation, F.W. and Y.Z.; writing—review and editing, X.W. and F.W. All authors have read and agreed to the published version of the manuscript.
Funding
This research was funded by the National Natural Sciences Foundation of China (No. 41601202); the Natural Sciences Foundation of Shanxi Province (No. 201801D121261); the Key Research and Development Project of Shanxi Province (No. 201803D221002-4); and the Social Development Foundation of Shanxi, China (No.201903D321069).
Institutional Review Board Statement
Not applicable, the study did not involve humans or animals.
Informed Consent Statement
The authors read and approved the final manuscript.
Data Availability Statement
The data and R codes that support the findings of this study are available on request from the corresponding author, F.W.
Conflicts of Interest
The authors declare no conflict of interest.
References
- Yan, D.; Ludwig, F.; Huang, H.Q.; Werners, S.E. Many-objective robust decision making for water allocation under climate change. Sci. Total Environ. 2017, 607–608, 294–303. [Google Scholar] [CrossRef] [PubMed]
- Feng, X.; Fu, B.; Piao, S.; Wang, S.; Ciais, P.; Zeng, Z.; Lü, Y.; Zeng, Y.; Li, Y.; Jiang, X.; et al. Revegetation in China’s Loess Plateau is approaching sustainable water resource limits. Nat. Clim. Chang. 2016, 6, 1019–1022. [Google Scholar] [CrossRef]
- Chen, X.; Niu, J. Does Vegetation Restoration Change Regional Ecohydrological Condition at the Loess Plateau in China? Environ. Nat. Resour. Res. 2016, 6, 116. [Google Scholar] [CrossRef]
- Catford, J.A.; Jansson, R. Drowned, buried and carried away: Effects of plant traits on the distribution of native and alien species in riparian ecosystems. New Phytol. 2014, 204, 19–36. [Google Scholar] [CrossRef]
- Stella, J.C.; Rodríguez-González, P.M.; Dufour, S.; Bendix, J. Riparian vegetation research in Mediterranean-climate regions: Common patterns, ecological processes, and considerations for management. Hydrobiologia 2013, 719, 291–315. [Google Scholar] [CrossRef]
- Nabinejad, S.; Jamshid Mousavi, S.; Kim, J.H. Sustainable Basin-Scale Water Allocation with Hydrologic State-Dependent Multi-Reservoir Operation Rules. Water Resour. Manag. 2017, 31, 3507–3526. [Google Scholar] [CrossRef]
- Xiao, Y.; Hipel, K.W.; Fang, L. Incorporating Water Demand Management into a Cooperative Water Allocation Framework. Water Resour. Manag. 2016, 30, 2997–3012. [Google Scholar] [CrossRef]
- Xu, J.; Ma, N.; Lv, C. Dynamic equilibrium strategy for drought emergency temporary water transfer and allocation management. J. Hydrol. 2016, 539, 700–722. [Google Scholar] [CrossRef]
- Degefu, D.M.; He, W.; Yuan, L.; Zhao, J.H. Water Allocation in Transboundary River Basins under Water Scarcity: A Cooperative Bargaining Approach. Water Resour. Manag. 2016, 30, 4451–4466. [Google Scholar] [CrossRef]
- Hassan-Esfahani, L.; Torres-Rua, A.; McKee, M. Assessment of optimal irrigation water allocation for pressurized irrigation system using water balance approach, learning machines, and remotely sensed data. Agric. Water Manag. 2015, 153, 42–50. [Google Scholar] [CrossRef]
- Gerten, D.; Schaphoff, S.; Haberlandt, U.; Lucht, W.; Sitch, S. Terrestrial vegetation and water balance—Hydrological evaluation of a dynamic global vegetation model. J. Hydrol. 2004, 286, 249–270. [Google Scholar] [CrossRef]
- Ke, W.; Lei, Y.; Sha, J.; Zhang, G.; Yan, J.; Lin, X.; Pan, X. Dynamic simulation of water resource management focused on water allocation and water reclamation in Chinese mining cities. Water Policy 2016, 18, 844–861. [Google Scholar] [CrossRef]
- Ling, H.; Zhang, P.; Xu, H.; Zhang, G. Determining the ecological water allocation in a hyper-arid catchment with increasing competition for water resources. Glob. Planet. Chang. 2016, 145, 143–152. [Google Scholar] [CrossRef]
- Shen, Q.; Gao, G.; Lü, Y.; Wang, S.; Jiang, X.; Fu, B. River flow is critical for vegetation dynamics: Lessons from multi-scale analysis in a hyper-arid endorheic basin. Sci. Total Environ. 2017, 603–604, 290–298. [Google Scholar] [CrossRef]
- Akram, A.A.; Mendelsohn, R. Agricultural water allocation efficiency in a developing country canal irrigation system. Environ. Dev. Econ. 2017, 22, 571–593. [Google Scholar] [CrossRef] [Green Version]
- Ding, J.; Zhao, W.; Daryanto, S.; Wang, L.; Fan, H.; Feng, Q.; Wang, Y. The spatial distribution and temporal variation of desert riparian forests and their influencing factors in the downstream Heihe River basin, China. Hydrol. Earth Syst. Sci. 2017, 21, 2405. [Google Scholar] [CrossRef] [Green Version]
- Imentai, A.; Thevs, N.; Schmidt, S.; Nurtazin, S.; Salmurzauli, R. Vegetation, fauna, and biodiversity of the Ile Delta and southern Lake Balkhash—A review. J. Great Lakes Res. 2015, 41, 688–696. [Google Scholar] [CrossRef]
- Cheng, G.; Li, X.; Zhao, W.; Xu, Z.; Feng, Q.; Xiao, S.; Xiao, H. Integrated study of the water–ecosystem–economy in the Heihe River Basin. Natl. Sci. Rev. 2014, 1, 413–428. [Google Scholar] [CrossRef] [Green Version]
- Zhu, Y.; Wang, C.; Chen, X.; Guan, G. Identification of gonadal soma-derived factor involvement in Monopterus albus (protogynous rice field eel) sex change. Mol. Biol. Rep. 2016, 43, 629–637. [Google Scholar] [CrossRef]
- López-Moreno, J.; Zabalza, J.; Vicente-Serrano, S.; Revuelto, J.; Gilaberte, M.; Azorin-Molina, C.; Morán-Tejeda, E.; García-Ruiz, J.M.; Tague, C. Impact of climate and land use change on water availability and reservoir management: Scenarios in the Upper Aragón River, Spanish Pyrenees. Sci. Total Environ. 2014, 493, 1222–1231. [Google Scholar] [CrossRef] [Green Version]
- Yahdjian, L.; Sala, O.E. Vegetation structure constrains primary production response to water availability in the Patagonian steppe. Ecology 2006, 87, 952–962. [Google Scholar] [CrossRef]
- Chen, Y.; Wang, K.; Lin, Y.; Shi, W.; Song, Y.; He, X. Balancing green and grain trade. Nat. Geosci. 2015, 8, 739–741. [Google Scholar] [CrossRef]
- Zhang, W.; Ricketts, T.H.; Kremen, C.; Carney, K.; Swinton, S.M. Ecosystem services and dis-services to agriculture. Ecol. Econ. 2007, 64, 253–260. [Google Scholar] [CrossRef] [Green Version]
- Fu, B.; Burgher, I. Riparian vegetation NDVI dynamics and its relationship with climate, surface water and groundwater. J. Arid Environ. 2015, 113, 59–68. [Google Scholar] [CrossRef]
- Sweet, S.K.; Asmus, A.; Rich, M.E.; Wingfield, J.; Gough, L.; Boelman, N.T. NDVI as a predictor of canopy arthropod biomass in the Alaskan arctic tundra. Ecol. Appl. 2015, 25, 779–790. [Google Scholar] [CrossRef]
- Omute, P.; Corner, R.; Awange, J.L. The use of NDVI and its derivatives for monitoring Lake Victoria’s water level and drought conditions. Water Resour. Manag. 2012, 26, 1591–1613. [Google Scholar] [CrossRef] [Green Version]
- Zhang, J.; Zhao, T.; Jiang, C.; Cao, S. Opportunity cost of water allocation to afforestation rather than conservation of natural vegetation in China. Land Use Policy 2016, 50, 67–73. [Google Scholar] [CrossRef]
- Cao, S.; Zhang, J.; Chen, L.; Zhao, T. Ecosystem water imbalances created during ecological restoration by afforestation in China, and lessons for other developing countries. J. Environ. Manag. 2016, 183, 843–849. [Google Scholar] [CrossRef]
- Jacobs, K.; Lebel, L.; Buizer, J.; Addams, L.; Matson, P.; McCullough, E.; Garden, P.; Saliba, G.; Finan, T. Linking knowledge with action in the pursuit of sustainable water-resources management. Proc. Natl. Acad. Sci. USA 2016, 113, 4591–4596. [Google Scholar] [CrossRef] [Green Version]
- Zhang, W.; Hu, G.; Dang, Y.; Weindorf, D.C.; Sheng, J. Afforestation and the impacts on soil and water conservation at decadal and regional scales in Northwest China. J. Arid Environ. 2016, 130, 98–104. [Google Scholar] [CrossRef]
- Wang, F.; Wang, X.; Zhao, Y.; Yang, Z. Long-term periodic structure and seasonal-trend decomposition of water level in Lake Baiyangdian, Northern China. Int. J. Environ. Sci. Technol. 2014, 11, 327–338. [Google Scholar] [CrossRef] [Green Version]
- Dokumentov, A.; Hyndman, R.J. STR: A Seasonal-Trend Decomposition Procedure Based on Regression; Monash University, Department of Econometrics and Business Statistics: Melbourne, Australia, 2015. [Google Scholar]
- Wang, F.; Wang, X.; Zhao, Y.; Yang, Z. Temporal variations of NDVI and correlations between NDVI and hydro-climatological variables at Lake Baiyangdian, China. Int. J. Biometeorol. 2014, 58, 1531–1543. [Google Scholar] [CrossRef]
- Ling, H.; Guo, B.; Xu, H.; Fu, J. Configuration of water resources for a typical river basin in an arid region of China based on the ecological water requirements (EWRs) of desert riparian vegetation. Glob. Planet. Chang. 2014, 122, 292–304. [Google Scholar] [CrossRef]
- Hu, Y.-X.; Huang, J.-L.; Du, Y.; Han, P.-P.; Wang, J.-L.; Huang, W. Monitoring wetland vegetation pattern response to water-level change resulting from the Three Gorges Project in the two largest freshwater lakes of China. Ecol. Eng. 2015, 74, 274–285. [Google Scholar] [CrossRef]
- Xu, H.-L.; Mao, Y.; Li, J.-M. Changes in groundwater levels and the response of natural vegetation to transfer of water to the lower reaches of the Tarim River. J. Environ. Sci. 2007, 19, 1199–1207. [Google Scholar] [CrossRef]
- Peña-Arancibia, J.L.; McVicar, T.R.; Paydar, Z.; Li, L.; Guerschman, J.P.; Donohue, R.J.; Dutta, D.; Podger, G.M.; van Dijk, A.I.; Chiew, F.H. Dynamic identification of summer cropping irrigated areas in a large basin experiencing extreme climatic variability. Remote Sens. Environ. 2014, 154, 139–152. [Google Scholar] [CrossRef]
- Kaune, A.; Werner, M.; Rodríguez, E.; Karimi, P.; de Fraiture, C. A novel tool to assess available hydrological information and the occurrence of sub-optimal water allocation decisions in large irrigation districts. Agric. Water Manag. 2017, 191, 229–238. [Google Scholar] [CrossRef]
Figure 1.
Geographical location of study area and sampling sites.

Figure 2.
Histogram showing the frequency distribution of (a) NDVImean, (b) NDVImax, (c) NDVImin, and (d) NDVImost.
Figure 2.
Histogram showing the frequency distribution of (a) NDVImean, (b) NDVImax, (c) NDVImin, and (d) NDVImost.

Figure 3.
Linear fitness for the trend extracted from STR in (A) NDVImean, (B) NDVImax, (C) NDVImin, and (D) NDVImost; the color background represents the water allocation occupancy time.
Figure 3.
Linear fitness for the trend extracted from STR in (A) NDVImean, (B) NDVImax, (C) NDVImin, and (D) NDVImost; the color background represents the water allocation occupancy time.

Figure 4.
Structure changes for the trend component from STR in (A) NDVImean, (B) NDVImax, (C) NDVImin and (D) NDVImost; the red background represents the water allocation occupancy; the green background represents the 95% confident abrupt changing period; the dashed line represents the breakpoints.

Figure 5.
ANOVA analysis of month-fold NDVI response to water allocations: (A–L) represents stages 1–12, respectively.
Figure 5.
ANOVA analysis of month-fold NDVI response to water allocations: (A–L) represents stages 1–12, respectively.


Table 1.
Implementations of water allocations during 1998–2008.
| Year | Time Period of Water Allocation | Reservoir | Discharge Out of the Reservoir (106 m3) | Discharge Flow into the Lake (106 m3) | Percentage to Lake Volume (%) |
|---|---|---|---|---|---|
| 1998 | Nov | Angezhuang | 33.06 | 21.5 | 1.0% |
| 1999 | Feb–Mar | Angezhuang | 27.43 | 17.8 | 1.3% |
| 2000 | Jul, Dec–Jan | Angezhuang, Wangkuai | 111.1 | 58.6 | 10.1% |
| 2001 | Feb–Mar, Jun–Jul | Angezhuang, Wangkuai | 94.7 | 66.7 | 14.5% |
| 2002 | Feb–May, Jul–Aug | Xidayang, Wangkuai | 150 | 85.7 | 31.9% |
| 2003 | Jan–Mar | Wangkuai | 200 | 116.3 | 21.3% |
| 2004 | Feb–Jun | Yuecheng | 390 | 160 | 14.5% |
| 2005 | Mar–Apr | Angezhuang | 58.6 | 42.5 | 3.2% |
| 2006 | Mar–Apr | Angezhuang, Wangkuai | 122 | 56.7 | 6.5% |
| 2007 | Nov–Mar | Yellow River | 200 | 100.1 | 13.2% |
| 2008 | Jan–Jun | Yellow River | 312 | 156.6 | 13.1% |
Table 2.
Descriptive summary of NDVI categories of three groups in different stages of water allocations.
Table 2.
Descriptive summary of NDVI categories of three groups in different stages of water allocations.
| Levels | Duration Month | N | Before Group | Current Group | After Group | |||||||||||||||
|---|---|---|---|---|---|---|---|---|---|---|---|---|---|---|---|---|---|---|---|---|
| Year | NDVImax | NDVImin | NDVImost | NDVImean | NDVIsd | Year | NDVImax | NDVImin | NDVImost | NDVImean | NDVIsd | Year | NDVImax | NDVImin | NDVImost | NDVImean | NDVIsd | |||
| Stage 1 | Nov | 1149 | - | - | - | - | - | - | 1998 | 0.412 | −0.004 | 0.160 | 0.203 | 0.103 | 1999 | 0.356 | 0.020 | 0.184 | 0.194 | 0.057 |
| Stage 2 | Jan–Feb | 2298 | - | - | - | - | - | - | 1999 | 0.252 | −0.040 | 0.164 | 0.102 | 0.061 | 2000 | 0.296 | −0.008 | 0.132 | 0.111 | 0.048 |
| Stage 3 | Jul | 1149 | 1999 | 0.696 | 0.2 | 0.532 | 0.485 | 0.093 | 2000 | 0.804 | 0.22 | 0.572 | 0.577 | 0.120 | 2001 | 0.764 | 0.272 | 0.688 | 0.621 | 0.095 |
| Stage 4 | Dec–Mar | 4596 | 1999–2000 | 0.388 | −0.008 | 0.048 | 0.116 | 0.067 | 2000–2001 | 0.384 | −0.060 | 0.028 | 0.100 | 0.065 | 2001–2002 | 0.364 | −0.040 | 0.136 | 0.133 | 0.050 |
| Stage 5 | Jun–Jul | 2298 | 2000 | 0.804 | 0.220 | 0.576 | 0.563 | 0.119 | 2001 | 0.764 | 0.072 | 0.688 | 0.541 | 0.162 | 2002 | 0.824 | 0.016 | 0.684 | 0.520 | 0.210 |
| Stage 6 | Feb–May | 4596 | 2001 | 0.768 | −0.060 | 0.036 | 0.243 | 0.204 | 2002 | 0.784 | −0.040 | 0.136 | 0.254 | 0.169 | 2003 | 0.744 | −0.036 | 0.144 | 0.266 | 0.192 |
| Stage 7 | Jul–Aug | 2298 | 2001 | 0.784 | 0.272 | 0.708 | 0.632 | 0.083 | 2002 | 0.848 | 0.264 | 0.660 | 0.631 | 0.115 | 2003 | 0.828 | 0.300 | 0.704 | 0.662 | 0.076 |
| Stage 8 | Jan–Mar | 3447 | 2002 | 0.364 | −0.040 | 0.136 | 0.126 | 0.049 | 2003 | 0.248 | −0.036 | 0.036 | 0.109 | 0.052 | 2004 | 0.276 | 0.008 | 0.148 | 0.150 | 0.035 |
| Stage 9 | Feb–Jun | 5745 | 2003 | 0.784 | −0.036 | 0.144 | 0.327 | 0.219 | 2004 | 0.824 | 0.032 | 0.144 | 0.334 | 0.208 | 2005 | 0.816 | −0.024 | 0.028 | 0.338 | 0.246 |
| Stage 10 | Mar–Apr | 2298 | 2004 | 0.692 | 0.044 | 0.156 | 0.212 | 0.118 | 2005 | 0.588 | −0.024 | 0.148 | 0.197 | 0.120 | 2006 | 0.532 | 0.024 | 0.152 | 0.184 | 0.088 |
| Stage 11 | Mar–Apr | 2298 | 2005 | 0.588 | −0.024 | 0.148 | 0.197 | 0.120 | 2006 | 0.532 | 0.024 | 0.152 | 0.184 | 0.088 | 2007 | 0.664 | −0.024 | 0.136 | 0.204 | 0.103 |
| Stage 12 | Nov–Jun | 9192 | 2006–2007 | 0.752 | −0.096 | 0.192 | 0.260 | 0.176 | 2007–2008 | 0.772 | −0.004 | 0.136 | 0.261 | 0.179 | - | - | - | - | - | - |
Publisher’s Note: MDPI stays neutral with regard to jurisdictional claims in published maps and institutional affiliations. |
© 2021 by the authors. Licensee MDPI, Basel, Switzerland. This article is an open access article distributed under the terms and conditions of the Creative Commons Attribution (CC BY) license (https://creativecommons.org/licenses/by/4.0/).
Share and Cite
MDPI and ACS Style
Wang, F.; Wang, X.; Zhao, Y. Effects of Intermittent Water Allocation on Vegetation Dynamics in Lake Baiyangdian, North China. Water 2021, 13, 1400. https://doi.org/10.3390/w13101400
AMA Style
Wang F, Wang X, Zhao Y. Effects of Intermittent Water Allocation on Vegetation Dynamics in Lake Baiyangdian, North China. Water. 2021; 13(10):1400. https://doi.org/10.3390/w13101400
Chicago/Turabian StyleWang, Fei, Xueke Wang, and Ying Zhao. 2021. "Effects of Intermittent Water Allocation on Vegetation Dynamics in Lake Baiyangdian, North China" Water 13, no. 10: 1400. https://doi.org/10.3390/w13101400
Note that from the first issue of 2016, this journal uses article numbers instead of page numbers. See further details here.