
Performance of a Handheld Chlorophyll-a Fluorometer: Potential Use for Rapid Algae Monitoring


1
School of Natural Resources and the Environment, University of Arizona, Tucson, AZ 85721, USA
2
Department of Aquatic Resources Management, University of Mulawarman, Samarinda 75123, Indonesia
3
Department of Environmental Science, University of Arizona, Tucson, AZ 85721, USA
*
Author to whom correspondence should be addressed.
Water 2021, 13(10), 1409; https://doi.org/10.3390/w13101409
Submission received: 25 March 2021
/
Revised: 13 May 2021
/
Accepted: 14 May 2021
/
Published: 18 May 2021
(This article belongs to the Special Issue Field Methods for Water Quality Surveying)
Abstract
:Chlorophyll-a measurements are an important factor in the water quality monitoring of surface waters, especially for determining the trophic status and ecosystem management. However, a collection of field samples for extractive analysis in a laboratory may not fully represent the field conditions. Handheld fluorometers that can measure chlorophyll-a in situ are available, but their performance in waters with a variety of potential light-interfering substances has not yet been tested. We tested a handheld fluorometer for sensitivity to ambient light and turbidity and compared these findings with EPA Method 445.0 using water samples obtained from two urban lakes in Tucson, Arizona, USA. Our results suggested that the probe was not sensitive to ambient light and performed well at low chlorophyll-a concentrations (<25 µg/L) across a range of turbidity levels (50–70 NTU). However, the performance was lower when the chlorophyll-a concentrations were >25 µg/L and turbidity levels were <50 NTU. To account for this discrepancy, we developed a calibration equation to use for this handheld fluorometer when field monitoring for potential harmful algal blooms in water bodies.
1. Introduction
In many water bodies, excess nutrient loading has contributed to the proliferation of primary producers (e.g., phytoplankton) and resulted in eutrophication, which can directly reduce the aquatic biodiversity [1,2,3,4]. However, harmful algal blooms can be controlled successfully with regular water quality monitoring to help guide the appropriate remediation measures [5]. Algae monitoring programs are necessary for tracking both aquatic and public health risks and should include algal biomass estimations [5,6].
The accurate measurement of chlorophyll-a is an important component of ambient monitoring programs in water bodies. The United States Environmental Protection Agency (EPA) has standards for measuring algae, but they rely upon an extractive analysis of the chlorophyll-a concentration to estimate the algal abundance [7]. This extractive analysis (EPA Method 445.0) is time-consuming and involves collection and the potential preservation of field-collected samples [8]. An in vivo fluorometric method for the measurement of chlorophyll-a was proposed in the mid-1970s [9,10] but, due to the expense of electronic miniaturization, never gained widespread acceptance or use at the time. More recently, handheld probes have been developed and refined for the in vivo fluorometric measurement of chlorophyll-a. This methodology offers real-time measurements of chlorophyll-a without the need to collect samples for an extractive process [11,12,13]. Handheld fluorometers to measure in vivo chlorophyll-a concentrations in the field vary greatly in their sensitivity, points of calibrations, and the number of excitation channels [14]. Some of them are equipped with integrated turbidity sensors and data loggers, while others lack these features. Publications about the efficiency of handheld fluorometers suggest that their measurement methods are instrument-specific and vary greatly among the brands and models due to variations in the measured emission bandwidths [14].
The use of in vivo probes for field measurements also raises a number of questions concerning their precision in different environmental conditions. Many of the handheld fluorometers available are sold without guidelines for their performance, including the potential need to measure other parameters (e.g., turbidity) to improve their accuracy [15]. Previous studies have demonstrated that, in a natural aquatic environment, ambient light and turbidity can interfere with the measurements of handheld fluorometers (e.g., [16,17,18,19,20]. For example, most handheld fluorometers use dedicated light sources to illuminate a small volume of water that is passing through the measuring chamber. This technique may need to be shielded from ambient light to ensure the accuracy of the sensor’s readings [18]. Additionally, the water turbidity can interfere with the transmission of the excitation wavelength and the cells’ responses to the probe. Although, some manufacturers recognize these limitations and recommend correction factors, many handheld fluorometers require frequent validation with more robust methods (i.e., EPA Method 445.0) for better accuracy [15,18].
We evaluated the performance of a newly available and relatively low-cost handheld fluorometer under differing scenarios. Our goals were to: (1) explore its performance under different concentrations and assemblages of algae, (2) test its sensitivity to ambient light, (3) investigate the impact of turbidity on its measurements, and (4) compare its measurements with those produced by EPA method 445.0 [7]. If this handheld fluorometer produces accurate measurements of chlorophyll-a concentrations across a wide range of environmental conditions, it could become a user-friendly and cost-effective tool in the monitoring of chlorophyll-a and harmful algal blooms.
2. Methods
2.1. Apparatus Description
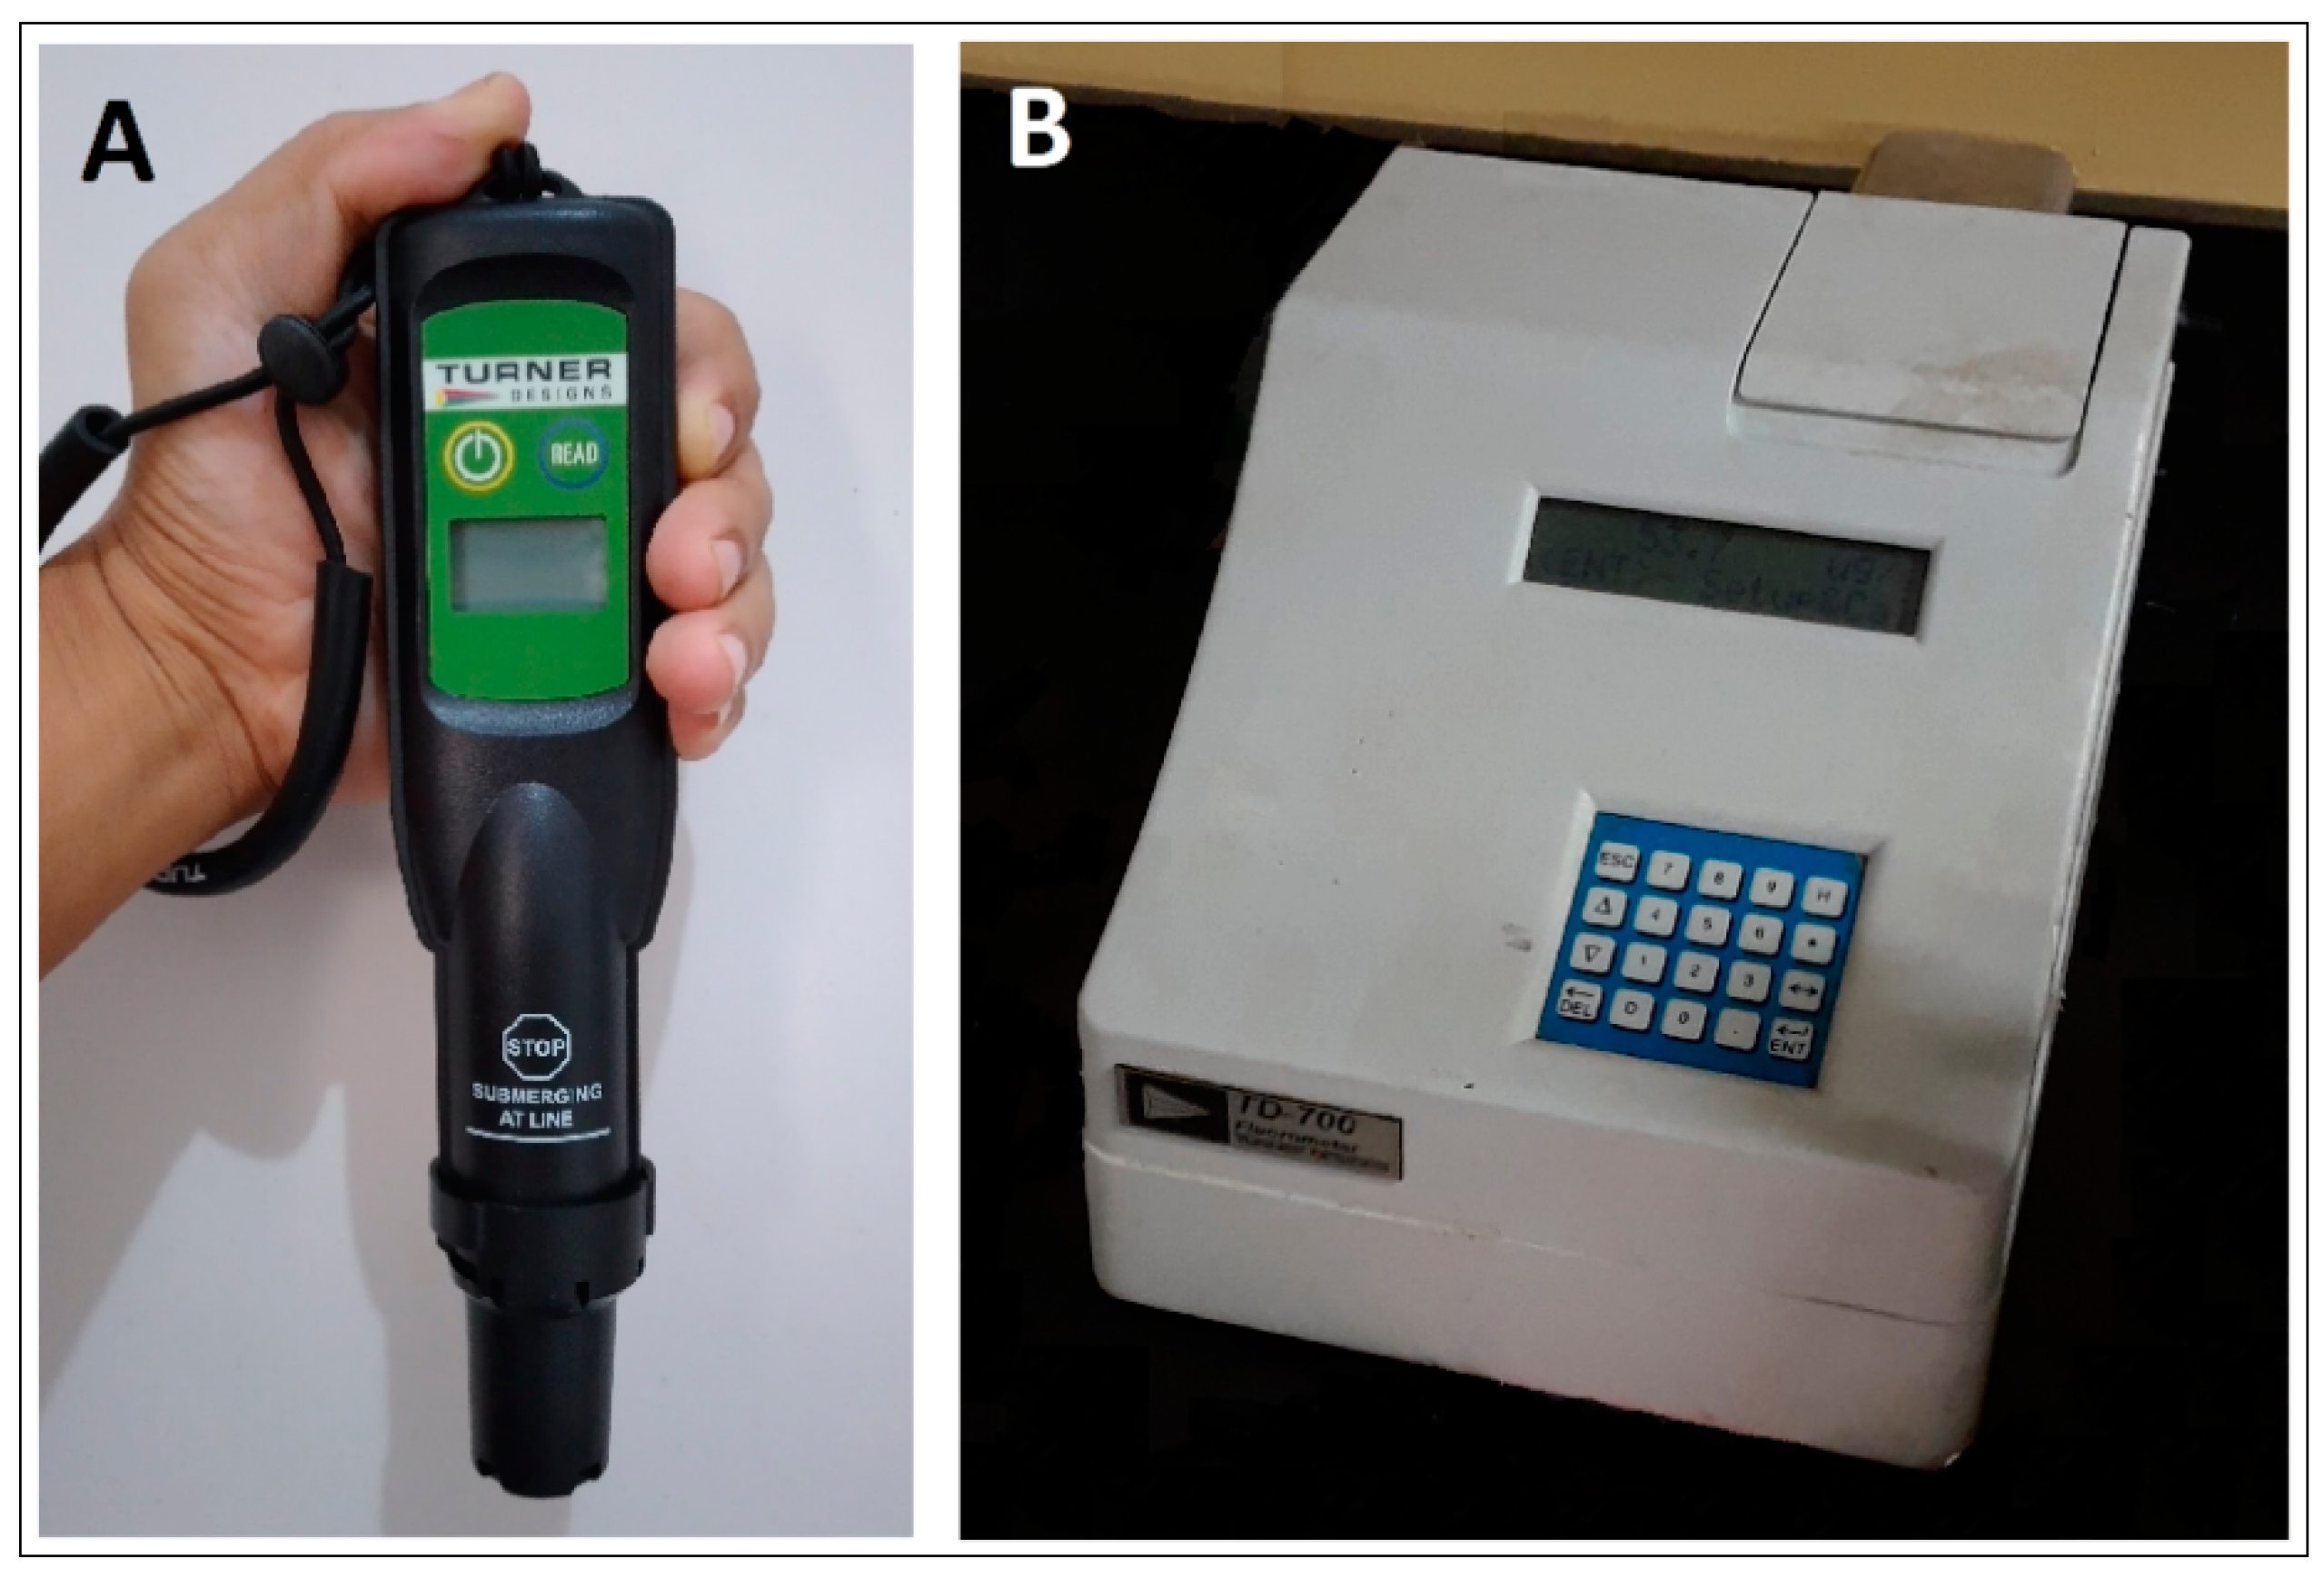
The FluoroSenseTM handheld fluorometer (hereafter referred to as FluoroSense), manufactured by Turner Designs (Sunnyvale, CA, USA), detects the fluorescence of in vivo chlorophyll-a using excitation light from the fluorometer to excite chlorophyll-a within algal cells, causing them to fluoresce. The fluorescence is then detected and converted to a digital value and can then be correlated to a known concentration of chlorophyll-a in μg/L. Use of the FluoroSense probe is simple: submerge the probe in water and press the button for an immediate result. FluoroSense is factory-calibrated and capable of detecting algae concentrations within the range of 0–199 µg/L in vivo chlorophyll-a, with a 1-µg/L resolution. FluoroSense is also equipped with a shade cap intended to prevent ambient light interference during field measurements. The manufacturer claims that this instrument is intended as an early warning device to determine whether additional testing is required in a body of water. Additionally, the FluoroSense is much less expensive than the equipment required by the EPA’s standard protocol ($1000 USD for FluoroSense vs. $15,000 USD for a standard fluorometer).
The TD–700TM fluorometer, also manufactured by Turner Designs, is used in extractive chlorophyll-a quantification. Chlorophyll-a filtering and dissolving in acetone is required in this method before the results can be read, according to EPA Method 445.0 for the in vitro determination of chlorophyll-a in freshwater algae by fluorescence [7]. Chlorophyll-containing phytoplankton in a measured volume of sample water are concentrated by filtering at low vacuum through a glass fiber filter. Chlorophyll-a is water-insoluble but can easily be dissolved in organic solvents such as acetone. In 90% acetone, the pigments can be extracted from the phytoplankton with the aid of a mechanical tissue grinder to ensure a thorough extraction of chlorophyll-a [7].
2.2. Sampling and Laboratory Experiment
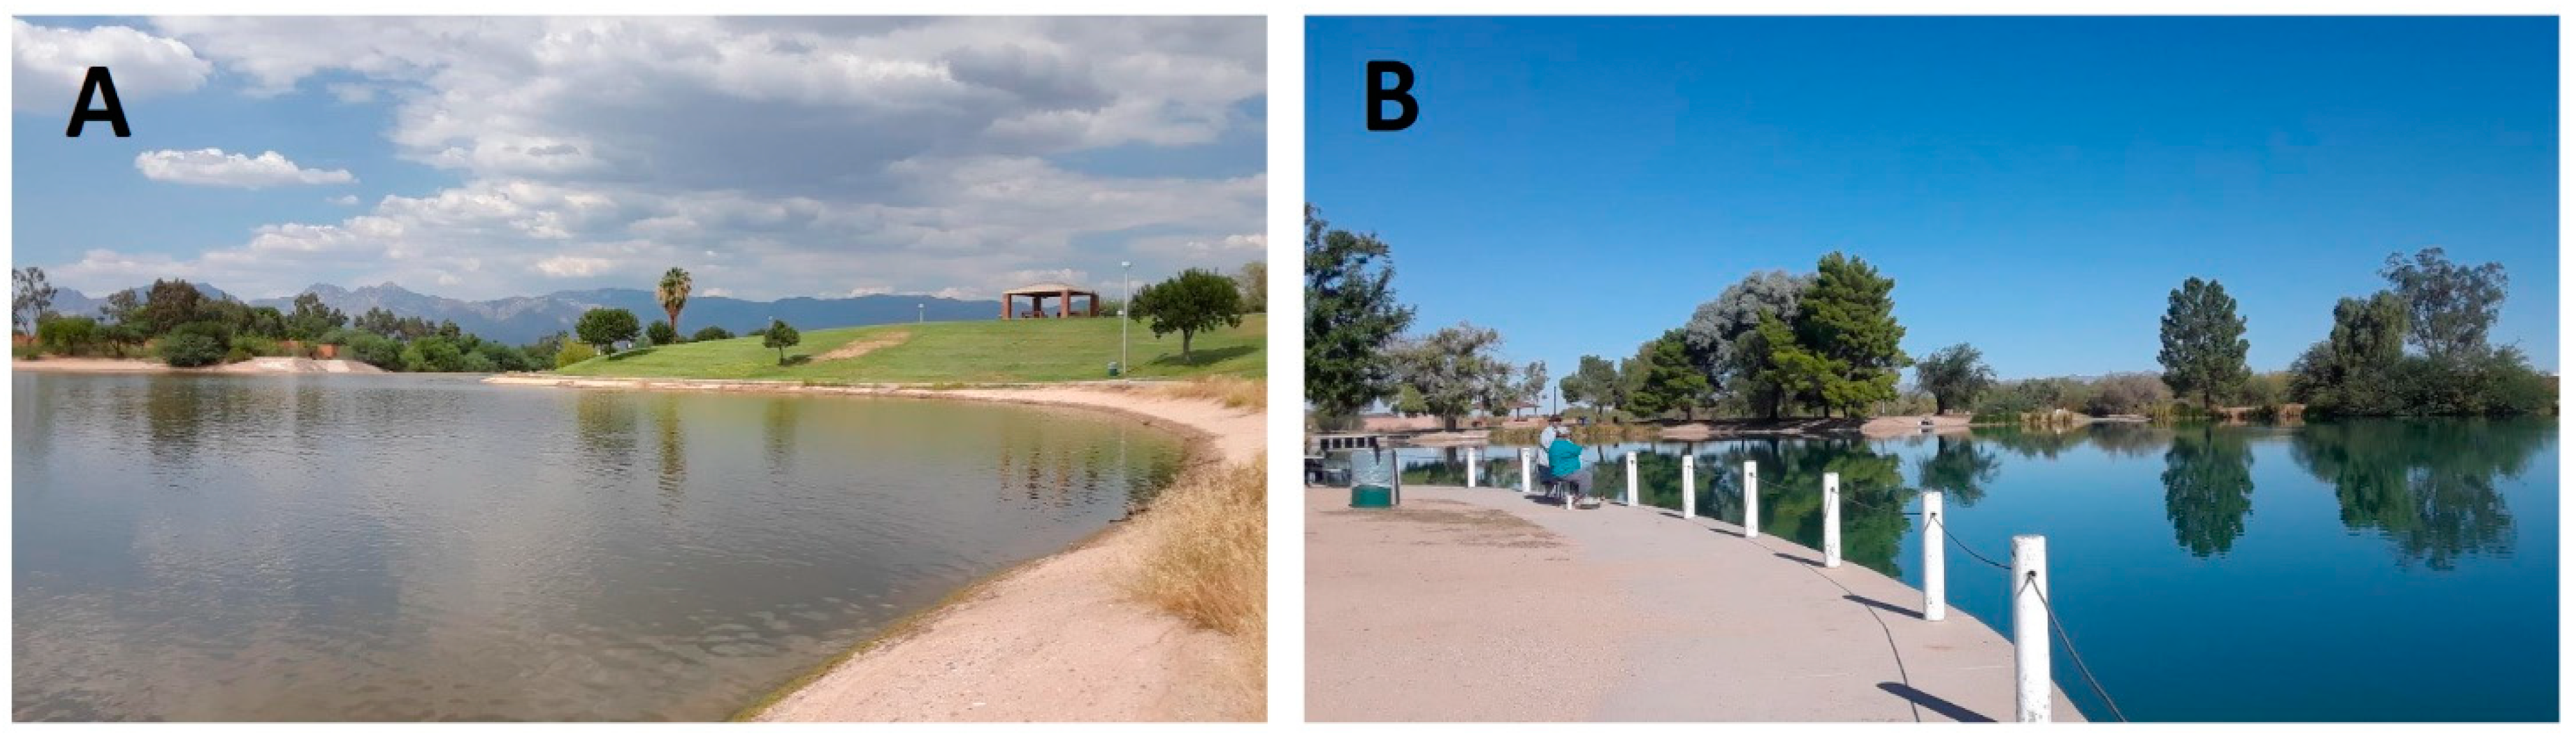
We tested for differences in the measurements between the FluoroSense probe and the TD-700 fluorometer (Figure 1) under different environmental conditions using water samples from two urban, manmade lakes in Tucson, Arizona, USA (Figure 2). Lakeside Lake (5.7-hectare surface area at 32°11′10.1″ N 110°48′58.8″ W) and Silverbell Lake (5.3-hectare surface area at 32°17′05.0″ N 111°01′55.0″ W) both receive moderate recreational and fishing use and are fed by groundwater pumped to the surface via wells. The well that supports Silverbell Lake is influenced by treated wastewater recharge in the nearby effluent-dependent Santa Cruz River [21], and Lakeside Lake also receives episodic runoff from Atterbury Wash, an ephemeral urban stream.
In each lake, we collected a 15-L composite water sample on 5 October 2019. Each composite sample consisted of five 3-L grabs collected from different portions of the lake accessible from the shore. The composite samples were combined into a 5-gallon plastic water container, transported to the laboratory at the University of Arizona, and analyzed within 24 h. In the laboratory, each composite water sample was transferred into, and homogenized using, a mixing bucket. One liter of homogenized water from each lake was used for taxonomic analyses of the algae. This taxonomic subsample was then transferred to a 1-L glass beaker and stirred with a magnetic stir bar for 1 min prior to pipetting out 1 mL of the sample. The phytoplankton samples were read using an Olympus BH2 phase–contrast microscope and Sedgewick-Rafter (S-R) counting chamber [22]. The S-R cell was 10 cm2. Both strip and field counts were performed and units/cm2 calculated [23].
We tested the performance of the FluoroSense probe on water from both lakes at three different algal concentrations, under light and dark conditions, and under four different levels of added turbidity. We obtained 600-mL subsamples from the homogenized samples collected from each lake. These subsamples were subjected to the following treatments. To achieve three algal concentrations, we used (1) the original water collected from each lake, (2) a dilution with one-third distilled water, and (3) a dilution with two-thirds distilled water. Hereafter, these treatments are called high, medium, and low concentrations of algae, respectively. We selected these treatments after testing the undiluted samples to be sure that all the treatment concentrations would be within the detection range (0–199 µg/L) reported by the FluoroSense manufacturer. Next, four turbidity treatments were created from the undiluted subsamples (i.e., ambient algal concentrations) from each lake by adding kaolinite clay mineral powder. We added 0 (ambient turbidity), 0.01, 0.02, and 0.03 g of kaolinite clay [14,24] into the same algal concentration treatment subsamples to create the four added turbidity treatments (none, low, medium, and high, respectively). There were 15 replicates for each treatment. The exact turbidity NTU in each replicate and treatment after the clay powder addition was measured with a Sper Scientific 860040 Turbidity Meter (Sper Scientific, Scottsdale, AZ, USA).
After all the treatment replicates were created, we used FluoroSense to measure the chlorophyll-a under the two different light treatments for all three algal concentration treatments and all four turbidity treatments. The dark treatment measurements were made in a completely dark chamber, while the light treatment measurements were made under a bright light (5500 Lux) generated from two LED lamps positioned at 45° angles, which simulated the intensity of the mid-day outdoor light at the two lakes we sampled. Finally, we examined how well the FluoroSense probe compared to the EPA Method 445.0 approach under these varying algal concentrations and turbidities. For measurements using the TD-700, we filtered 20-mL subsamples from each treatment and then extracted filtered algae in 10 mL of acetone for each subsample, as recommended in the TD-700 user’s manual. Finally, we compared the measurements of chlorophyll-a using the FluoroSense probe and the TD-700 for the same replicate samples from each lake under the three different algal concentrations and the four different added turbidity treatments.
Prior to testing, all instruments were calibrated using the manufacturer-recommended procedures. Rhodamine dye (100 μg/L) was used for the FluoroSense, and chlorophyll-a Solid Secondary Standard (P/N 7000–994) was used for the TD-700. Additionally, the TD-700 was zero-adjusted using acetone. Finally, the turbidity probe was calibrated using two points: the zero point was calibrated with a 0-NTU solution, and the second point was calibrated using a 100-NTU solution provided by the manufacturer.
2.3. Statistical Analyses
The FluoroSense readings under the three different concentrations (with no added turbidity) in the dark and light treatments were compared using paired t-tests using Stata Version 15.1 (StataCorp, College Station, TX, USA) [25]. The histogram analysis indicated that there were no outliers in the dataset, and all the variables were approximately normally distributed (data not shown). We used α = 0.05 as the threshold to identify statistical significance. To investigate the performance of the FluoroSense probe under different turbidity treatments across both lakes, an ANOVA was run in R version 3.5.1 (R Core Team, Vienna, Austria) [26]. The FluoroSense readings and turbidity measurements were included as independent variables for predicting the dependent TD-700 values, including the interactions between them. The light treatments were included in the ANOVA, and the lake identity (Lakeside vs. Silverbell) was also considered a factor to account for the potential differences in the probe performances in waters from differing algal assemblages. Based on the paired t-test and the ANOVA results (see Results), we used a simplified linear regression model (run in R version 3.5.1) to provide the calibration equation. This simplified equation removed the light, because it was not found to affect the probe’s chlorophyll-a measurements. We also removed the lake identity, so this equation could apply to a variety of environments. This approach aimed to determine if the handheld fluorometer could reliably predict the measurements produced by EPA Method 445.0.
3. Results
3.1. Algal Taxa and Concentrations in Lakeside and Silverbell Lakes
Lakeside Lake supports a more diverse algal assemblage, with eight genera in four phyla at relatively low-to-moderate concentrations, including two cyanobacteria taxa (Table 1). In contrast, we only detected a single algal taxon in Silverbell Lake, the cyanobacteria Microcystis, and it was found in relatively high concentrations. The chlorophyll-a readings (µg/L) under both measurement approaches (FluoroSense and TD-700) were roughly twice as high in the subsamples from Silverbell Lake when compared to those from Lakeside Lake (Table 1 and Figure 3). The ANOVA results suggested that these different algal assemblages may have impacted the FluoroSense performance (Table S1). However, a detailed investigation of these impacts was beyond the scope of this study.
3.2. Sensitivity to Ambient Light
The FluoroSense chlorophyll-a measurements generally were not affected by the light across the wide range of dilutions and turbidity treatments that we tested (Table 2 and Table S1). Only two of the 24 treatment combinations resulted in significant differences between the light and dark conditions. Both of these significant results occurred under the low algal concentration treatments of Lakeside and Silverbell Lakes, with one occurring under no added turbidity and the other occurring under the medium turbidity treatment.
3.3. Sensitivity to Turbidity
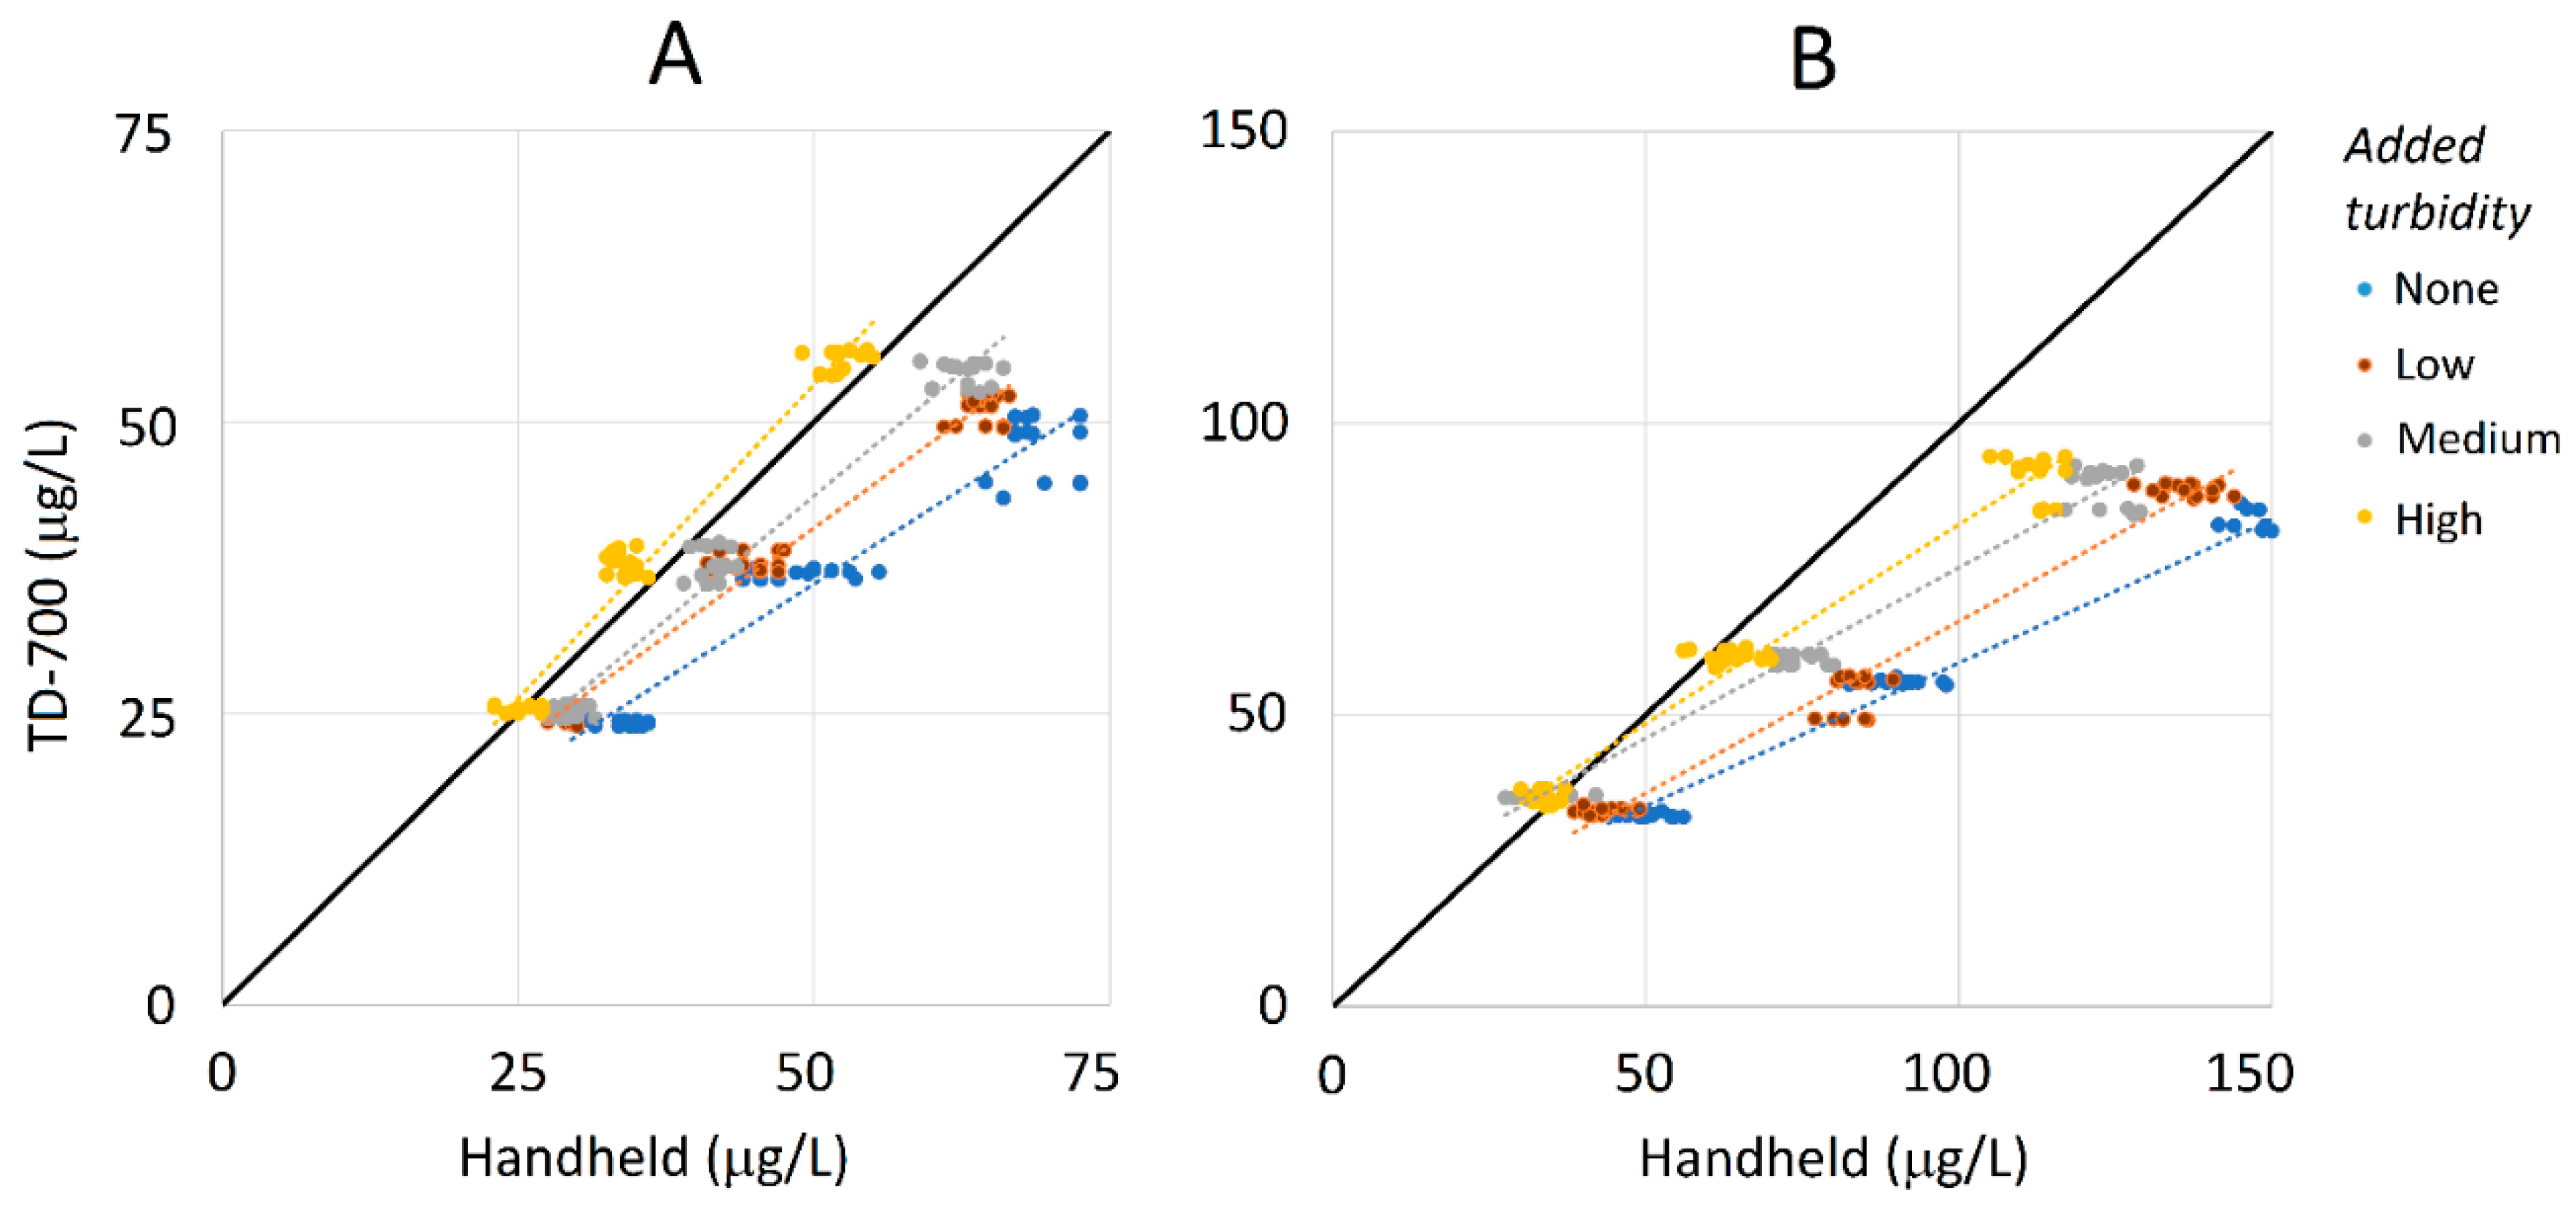
Linear regression illustrated that the chlorophyll-a estimations between the two methods were closest for the high turbidity treatment (i.e., fell closest to the 1:1 line) but grew farther apart with the decreasing turbidity (Figure 3). These results suggest the FluoroSense probe overestimates the chlorophyll-a concentrations in low turbidity situations. Additionally, the measurements between the two methods were closer to the 1:1 line at lower chlorophyll-a concentrations than at higher concentrations. This pattern occurred in the subsamples from both lakes but was especially pronounced in the samples from Silverbell Lake, which had much higher ambient algal densities of Microcystis (see Table 1) and higher concentrations of chlorophyll-a (Figure 3). Both the FluoroSense reading and turbidity level (NTU) were significant, had the largest F values in the ANOVA (Table S1), and were included in the final regression model (Table 3). Overall, our testing within the range of 25–150-μg/L chlorophyll-a across the subsamples from both lakes resulted in a final model with the following, Equation (1):
where TD-700 Chl-a is the predicted chlorophyll-a concentration in µg/L using EPA Method 445.0, FluoroSense Chl-a is the chlorophyll-a reading using FluoroSense in µg/L, and Turbidity is the ambient known turbidity in NTU. This model performed well, explaining 94% of the variations in the TD-700 readings across all the samples from Lakeside and Silverbell Lakes. The observed vs. expected residuals matched closely across the range of tested concentrations (Figure S1).
TD-700 Chl-a = 1.7962 + (0.5897 × FluoroSense reading) + (0.1862 × Turbidity)
4. Discussion
The studies examining the performances of low-cost portable fluorometers suggest that a sensitivity to light during daytime deployment can be a primary limitation, with detectors easily becoming saturated by ambient light [18,27]. As a result, two methods were suggested to reduce the light sensitivity of the probes: (1) modulate the light source and apply a high-frequency filter as part of the detection circuit and (2) create a flowthrough system that excludes ambient light [18]. FluoroSense takes the latter approach, with a cap at the bottom tip of the unit that aims to prevent ambient light penetration. Our results indicate that the FluoroSense cap does block ambient light and that the probe can confidently be used for daytime field measurements, even in bright conditions.
Turbidity can introduce errors into the measurements of fluorescence probes, leading to overestimating (e.g., [14,16,18] or underestimating of the actual fluorescence readings (e.g., [15,28]). These errors likely arise due to light scattering, so the optical configuration of the fluorescence probe may cause different responses to the turbidity [29]. In our study, the added inorganic mineral turbidity treatments most likely reduced the FluoroSense signal, leading to decreased estimations in the chlorophyll-a values. Interestingly, this pattern almost seemed to correct for the probe’s tendency to overestimate chlorophyll-a, such that the high turbidity treatments (~70 NTU) were closest to the 1:1 line, especially at lower ambient concentrations of algae (~25 µg/L of chlorophyll-a) (Figure 3). Whether this tendency to overestimate the values is intentional in the design of FluoroSense is unknown, but it results in a probe that works better under some of the higher turbidity situations that could be encountered in the field. Although we did not test the probe’s performance on samples from lotic ecosystems, the mean chlorophyll-a values in temperate streams tend to be low (~27 µg/L), even during the high-productivity summer period [30]. Our finding of better performances under higher turbidities (50–70 NTU) and lower algal concentrations (<25 µg/L) suggests that the FluoroSense probe could work well in streams where these conditions are frequently encountered. This result also suggests that, in terms of trophic categories, this probe could work well in oligotrophic and mesotrophic water bodies [31].
We tested the effect of the turbidity emanating from inorganic fine kaolinite clay. Different grain sizes of suspended sediment causing turbidity may affect the performance of handheld probes differently than what was quantified in this study. One study revealed that smaller particle sizes result in higher reductions of florescence intensities when compared to measurements made in samples with the same mass of sediment but larger particle sizes [28]. Optical interference in the fluorometer readings may also originate from dissolved organic compounds of different colors. For example, tannins from leaves emit florescence in a wide spectrum of wavelengths [14,32] and can interfere with probe measurements. More research is needed to understand the responses of the FluoroSense probe to colored dissolved organic compounds or sediments of different origins and grain sizes than what we examined in this study.
One concern about handheld fluorometers is how well they perform across a range of sampling locations that vary widely in algae concentrations and taxonomic compositions. Although we only tested the water from two lakes in this study, the algal assemblages and concentrations differed markedly between them, with one supporting a diverse assemblage (eight genera) at lower concentrations (14,800 units/mL) and the other supporting only cyanobacteria at higher concentrations (32,600 units/mL) (Table 1). Although there were differences in the FluoroSense’s performance between these two lakes, our results suggest that its measurements, and its response to different light, turbidity, and algal dilution treatments, were reliable across the two study lakes. The FluoroSense probe may overestimate the chlorophyll in cyanobacteria, and further research is needed to identify the exact relationships between algal assemblages and the readings of handheld fluorometers. Additionally, FluoroSense worked well in Silverbell Lake, which was dominated by the potentially harmful cyanobacteria (Microcystis). This taxon is a management concern due to its wide range of potential adverse health effects (e.g., [33,34]), so it is important that the probe works well to estimate the concentration of cyanobacteria.
5. Conclusions
Our testing of the handheld FluoroSense probe showed that, as an in situ instrument, it is not sensitive to ambient light, but it overestimates the chlorophyll-a concentrations at lower inorganic turbidity levels and higher ambient algal concentrations. However, our regression model was able to adjust for these limitations within the range tested (25–150 μg/L). In these situations, FluoroSense can be used as a fast, simple, and easy method in monitoring the algal biomass for determining the trophic status and ecosystem management. Future studies evaluating FluoroSense or other handheld fluorometers should address how they are affected by organic turbidity and colored dissolved organic matter and, also, test their performances in measuring very low chlorophyll-a concentrations, which were not assessed in our study.
Supplementary Materials
The following are available online at https://www.mdpi.com/article/10.3390/w13101409/s1, Figure S1: Graph comparing expected vs observed residuals for the regression equation: TD-700 Chl-a = 1.7962 + (0.5897 × FluoroSense reading) + (0.1862 × Turbidity). The 1:1 line is red, and residuals appear as separate points along this line., Table S1: Summary of ANOVA results testing differences between TD-700 and FlouroSense probe chl-a concentration readings with algal concentration, turbidity, the interaction between concentration and turbidity (Concentration * Turbidity), lake identity (different algal assemblages), and light vs dark treatment (Lumen) parameters. F values and p values are listed. Bold indicates significant p values with alpha < 0.05.
Author Contributions
Conceptualization, H.H. and D.E.E.; methodology, H.H., D.E.E. and D.W.; software, H.H. and D.E.E.; validation, D.W., and M.T.B.; formal analysis, H.H. and D.E.E.; investigation, H.H. and D.E.E.; resources, H.H., D.E.E., D.W. and M.T.B.; data curation, H.H.; writing—original draft preparation, H.H.; writing—review and editing, H.H., D.E.E., D.W. and M.T.B.; visualization, H.H. and D.E.E.; supervision, M.T.B. All authors have read and agreed to the published version of the manuscript.
Funding
This research was completed as part of Hamdhani’s Ph.D. dissertation at the University of Arizona and was funded by the Indonesia Endowment Fund for Education (LPDP). During the sampling and writing of this study, DE Eppehimer was supported by the Lincoln Institutes Babbitt Dissertation Fellowship Program, and MT Bogan was supported by start-up funding from the University of Arizona.
Institutional Review Board Statement
Not applicable.
Informed Consent Statement
Not applicable.
Data Availability Statement
The data used to support the findings of this study are available from the corresponding author upon request.
Acknowledgments
We thank B. Gill, E. McGee, K. Hollien, S. Wasko, and M. Grageda for providing useful feedback on earlier drafts of this manuscript.
Conflicts of Interest
The authors declare no conflict of interest.
References
- Elliott, J.A.; Jones, I.D.; Thackeray, S.J. Testing the Sensitivity of Phytoplankton Communities to Changes in Water Temperature and Nutrient Load, in a Temperate Lake. Hydrobiologia 2006, 559, 401–411. [Google Scholar] [CrossRef]
- Paerl, H.W.; Huisman, J. Climate change: A catalyst for global expansion of harmful cyanobacterial blooms. Environ. Microbiol. Rep. 2009, 1, 27–37. [Google Scholar] [CrossRef] [PubMed]
- Paerl, H.W.; Otten, T.G. Harmful Cyanobacterial Blooms: Causes, Consequences, and Controls. Microb. Ecol. 2013, 65, 995–1010. [Google Scholar] [CrossRef]
- Zhu, Y.; McCowan, A.; Cook, P.L. Effects of changes in nutrient loading and composition on hypoxia dynamics and internal nutrient cycling of a stratified coastal lagoon. Biogeosciences 2017, 14, 4423–4433. [Google Scholar] [CrossRef]
- Ibelings, B.W.; Backer, L.C.; Kardinaal, W.E.A.; Chorus, I. Current approaches to cyanotoxin risk assessment and risk management around the globe. Harmful Algae 2014, 40, 63–74. [Google Scholar] [CrossRef] [Green Version]
- Hollister, J.W.; Kreakie, B.J. Associations between chlorophyll a and various microcystin health advisory concentrations. F1000Research 2016, 5, 151. [Google Scholar] [PubMed] [Green Version]
- Arar, E.J.; Collins, G.B. Method 445.0 In Vitro Determination of Chlorophyll a and Pheophytin a in Marine and Freshwater Algae by Fluorescence; United States Environmental Protection Agency, Office of Research and Development, National Exposure Research Laboratory: Cincinnati, OH, USA, 1997; p. 22.
- Almomani, F.A.; Örmeci, B. Monitoring and measurement of microalgae using the first derivative of absorbance and comparison with chlorophyll extraction method. Environ. Monit. Assess. 2018, 190, 90. [Google Scholar] [CrossRef]
- Loftus, M.E.; Seliger, H.H. Some Limitations of the In Vivo Fluorescence Technique. Chesap. Sci. 1975, 16, 79–92. [Google Scholar] [CrossRef]
- Porter, G.; Synowiec, J.A.; Tredwell, C.J. Intensity effects on the fluorescence of in vivo chlorophyll. Biochim. Biophys. Acta BBA Bioenerg. 1977, 459, 329–336. [Google Scholar] [CrossRef]
- Ghadouani, A.; Smith, R.E. Phytoplankton distribution in Lake Erie as assessed by a new in situ spectrofluorometric technique. J.Gt. Lakes Res. 2005, 31, 154–167. [Google Scholar] [CrossRef]
- Lu, J.; Yuan, Y.; Duan, Z.; Zhao, G.; Svanberg, S. Short-range remote sensing of water quality by a handheld fluorosensor system. Appl. Opt. 2020, 59, C1–C7. [Google Scholar] [CrossRef] [PubMed]
- Salonen, K.; Sarvala, J.; Järvinen, M.; Langenberg, V.; Nuottajärvi, M.; Vuorio, K.; Chitamwebwa, D.B.R. Phytoplankton in Lake Tanganyika—Vertical and horizontal distribution of in vivo fluorescence. In From Limnology to Fisheries: Lake Tanganyika and Other Large Lakes; Springer: Dordrecht, The Netherlands, 1999; pp. 89–103. [Google Scholar]
- Cremella, B.; Huot, Y.; Bonilla, S. Interpretation of total phytoplankton and cyanobacteria fluorescence from cross-calibrated fluorometers, including sensitivity to turbidity and colored dissolved organic matter. Limnol. Oceanogr. Methods 2018, 16, 881–894. [Google Scholar] [CrossRef]
- Zamyadi, A.; McQuaid, N.; Dorner, S.; Bird, D.F.; Burch, M.; Baker, P.; PRÉvost, M. Cyanobacterial detection using in vivo fluorescence probes: Managing interferences for improved decision–making. J. Am. Water Work. Assoc. 2012, 104, E466–E479. [Google Scholar] [CrossRef]
- Cui, J.S.; Lv, P.Y. Turbidity effect on the fluorescence determination of chlorophyll-a in water. In Applied Mechanics and Materials; Trans Tech Publications Ltd.: Bach, Switzerland, 2014; Volume 522, pp. 62–63. [Google Scholar]
- Laney, S.R. In Situ Measurement of Variable Fluorescence Transients. In Chlorophyll a Fluorescence in Aquatic Sciences: Methods and Applications; Springer: Dordrecht, The Netherlands, 2010; pp. 19–30. [Google Scholar]
- Leeuw, T.; Boss, E.S.; Wright, D.L. In Situ Measurements of Phytoplankton Fluorescence Using Low Cost Electronics. Sensors 2013, 13, 7872–7883. [Google Scholar] [CrossRef] [PubMed] [Green Version]
- Strass, V. On the calibration of large-scale fluorometric chlorophyll measurements from towed undulating vehicles. Deep. Sea Res. Part A Oceanogr. Res. Pap. 1990, 37, 525–540. [Google Scholar] [CrossRef]
- Vincent, W.F. Photosynthetic capacity measured by DCMU-induced chlorophyll fluorescence in an oligotrophic lake. Freshw. Biol. 1981, 11, 61–78. [Google Scholar] [CrossRef]
- Eppehimer, D.E.; Hamdhani, H.; Hollien, K.D.; Bogan, M.T. Evaluating the potential of treated effluent as novel habitats for aquatic invertebrates in arid regions. Hydrobiologia 2020, 847, 3381–3396. [Google Scholar] [CrossRef]
- Wehr, J.D.; Sheath, R.G.; Kociolek, J.P. (Eds.) Freshwater Algae of North America: Ecology and Classification; Elsevier: Amsterdam, The Netherlands, 2015. [Google Scholar]
- Stevenson, R.J.; Bahls, L.L. Periphyton protocols. In Rapid Bioassessment Protocols for Use in Wadeable Streams and Rivers: Periphyton, Benthic Macroinvertebrates, and Fish; US Environmental Protection Agency, Office of Water: Washington, DC, USA, 1999. [Google Scholar]
- Chang, D.-W.; Hobson, P.; Burch, M.; Lin, T.-F. The limitation of measurement in cyanobacteria using in-vivo fluoroscopy. In Proceedings of the 2011 Seventh International Conference on Intelligent Sensors, Adelaide, Australia, 6–9 December 2011; pp. 184–188. [Google Scholar]
- Stata Statistical Software; Release 15; StataCorp LLC: College Station, TX, USA, 2017.
- R Core Team. R: A Language and Environment for Statistical Computing; R Foundation for Statistical Computing: Vienna, Austria, 2019; Available online: https://www.R-project.org/ (accessed on 10 July 2020).
- Rovati, L.; Docchio, F. Low-noise front-end electronics for solid-state fluorometers. Rev. Sci. Instrum. 1999, 70, 3759–3764. [Google Scholar] [CrossRef]
- Brient, L.; Lengronne, M.; Bertrand, E.; Rolland, D.; Sipel, A.; Steinmann, D.; Baudin, I.; Legeas, M.; Le Rouzic, B.; Bormans, M. A phycocyanin probe as a tool for monitoring cyanobacteria in freshwater bodies. J. Environ. Monit. 2008, 10, 248–255. [Google Scholar] [CrossRef]
- Zamyadi, A.; Choo, F.; Newcombe, G.; Stuetz, R.; Henderson, R.K. A review of monitoring technologies for real-time management of cyanobacteria: Recent advances and future direction. TrAC Trends Anal. Chem. 2016, 85, 83–96. [Google Scholar] [CrossRef]
- Van Nieuwenhuyse, E.E.; Jones, J.R. Phosphorus chlorophyll relationship in temperate streams and its variation with stream catchment area. Can. J. Fish. Aquat. Sci. 1996, 53, 99–105. [Google Scholar] [CrossRef]
- Istvánovics, V. Eutrophication of lakes and reservoirs. In Lake Ecosystem Ecology; Elsevier: San Diego, CA, USA, 2010; pp. 47–55. [Google Scholar]
- Hudson, N.; Baker, A.; Reynolds, D. Fluorescence analysis of dissolved organic matter in natural, waste and polluted waters—A review. River Res. Appl. 2007, 23, 631–649. [Google Scholar] [CrossRef]
- Pip, E.; Bowman, L. Microcystin and Algal Chlorophyll in Relation to Nearshore Nutrient Concentrations in Lake Winnipeg, Canada. Environ. Pollut. 2014, 3, 36–47. [Google Scholar] [CrossRef] [Green Version]
- Yuan, L.L.; Pollard, A.I.; Pather, S.; Oliver, J.L.; Anglada, L.D. Managing microcystin: Identifying national–scale thresholds for total nitrogen and chlorophyll a. Freshw. Biol. 2014, 59, 1970–1981. [Google Scholar] [CrossRef]
Figure 1.
(A) FluoroSenseTM handheld fluorometer and (B) TD-700TM fluorometer.

Figure 2.
Water samples for the analyses were collected from Lakeside Lake (A) and Silverbell Lake (B) in Tucson, Arizona (USA).
Figure 2.
Water samples for the analyses were collected from Lakeside Lake (A) and Silverbell Lake (B) in Tucson, Arizona (USA).

Figure 3.
Comparison between the extracted total chlorophyll-a using TD-700 vs. the chlorophyll-a estimated from the in vivo measurements using the FluoroSense probe across the different added turbidity levels (none (blue), low (brown), medium (grey), and high (yellow)) and three different sample dilutions from the Lakeside and Silverbell Lake water samples (panels (A,B), respectively). For all panels, the solid black line illustrates a 1:1 relation between the two measurement techniques.


Table 1.
Algal taxa identified in 1-L samples collected from Lakeside and Silverbell Lakes, including the concentrations of the individual taxa reported in units/mL.
Table 1.
Algal taxa identified in 1-L samples collected from Lakeside and Silverbell Lakes, including the concentrations of the individual taxa reported in units/mL.
| Phylum | Genus | Quantity (Units/mL) |
|---|---|---|
| Lakeside Lake | ||
| Chlorophyta | Dictyosphaerium | 3400 |
| Chlorophyta | Chlamydomonas | 3000 |
| Chlorophyta | Scenedesmus | 2800 |
| Pyrrophyta | Gymnodinium | 2200 |
| Chrysophyta | Fragilaria | 2000 |
| Chrysophyta | Cymbella | 800 |
| Cyanobacteria | Microcystis | 400 |
| Cyanobacteria | Oscillatoria | 200 |
| Silverbell Lake | ||
| Cyanobacteria | Microcystis | 32,600 |
Table 2.
Paired t-test results for the FluoroSense readings under the light and dark conditions at the three levels of algal concentration dilutions and three turbidity treatments. The mean, standard deviation (Std. Dev.), and minimum (min) and maximum (max) FluoroSense chlorophyll-a readings (µg/L) are provided for each dilution series (n = 15 for each series), and the exact turbidity measurements (NTU) are provided for the three turbidity treatments as well. The significant t-test results are highlighted in bold with an asterisk.
| Sample Origin | Algal Concentration | Turbidity Added | Turbidity | Light Treatment | Dark Treatment | t-Test (p-Value) | |||||||
|---|---|---|---|---|---|---|---|---|---|---|---|---|---|
| (NTU) | Std. Dev. | Mean | Std. Dev. | Min | Max | Mean | Std. Dev. | Min | Max | ||||
| Lakeside Lake | High | None | 21.48 | 0.18 | 71.00 | 3.08 | 67 | 74 | 66.20 | 3.27 | 62 | 71 | >0.05 |
| Low | 45.39 | 1.61 | 66.00 | 2.45 | 63 | 69 | 63.60 | 2.97 | 59 | 67 | >0.05 | ||
| Medium | 61.00 | 1.58 | 63.80 | 1.79 | 62 | 66 | 62.40 | 3.65 | 58 | 67 | >0.05 | ||
| High | 82.20 | 2.86 | 51.20 | 1.30 | 49 | 52 | 54.00 | 2.74 | 50 | 57 | >0.05 | ||
| Medium | None | 16.65 | 0.74 | 47.00 | 2.55 | 44 | 50 | 50.60 | 5.86 | 43 | 57 | >0.05 | |
| Low | 42.64 | 0.48 | 44.00 | 3.55 | 40 | 48 | 44.80 | 3.56 | 39 | 48 | >0.05 | ||
| Medium | 72.00 | 1.87 | 42.00 | 2.24 | 39 | 45 | 40.40 | 1.67 | 39 | 43 | >0.05 | ||
| High | 90.80 | 1.30 | 34.60 | 1.52 | 33 | 37 | 33.20 | 1.30 | 32 | 35 | >0.05 | ||
| Low | None | 12.13 | 1.19 | 34.40 | 2.07 | 31 | 36 | 32.60 | 2.70 | 28 | 35 | <0.05 * | |
| Low | 34.00 | 0.38 | 29.20 | 0.84 | 28 | 30 | 28.20 | 1.10 | 27 | 30 | >0.05 | ||
| Medium | 52.80 | 0.84 | 30.20 | 1.64 | 28 | 32 | 28.40 | 1.52 | 27 | 30 | >0.05 | ||
| High | 71.00 | 0.71 | 25.00 | 2.00 | 23 | 27 | 26.20 | 1.10 | 25 | 27 | >0.05 | ||
| Silverbell Lake | High | None | 12.28 | 0.46 | 151.80 | 8.24 | 139 | 170 | 148.60 | 7.24 | 133 | 156 | >0.05 |
| Low | 34.03 | 0.46 | 136.07 | 7.37 | 122 | 150 | 136.67 | 6.86 | 126 | 148 | >0.05 | ||
| Medium | 56.60 | 0.55 | 121.67 | 5.84 | 114 | 134 | 125.13 | 7.38 | 112 | 138 | >0.05 | ||
| High | 89.00 | 1.00 | 112.73 | 3.71 | 105 | 118 | 111.33 | 5.02 | 104 | 124 | >0.05 | ||
| Medium | None | 4.408 | 0.08 | 91.93 | 7.31 | 78 | 102 | 88.80 | 5.28 | 77 | 100 | >0.05 | |
| Low | 35.68 | 1.05 | 83.47 | 3.58 | 78 | 90 | 82.40 | 5.05 | 74 | 89 | >0.05 | ||
| Medium | 61.40 | 0.55 | 75.73 | 4.25 | 71 | 85 | 72.20 | 6.06 | 66 | 85 | >0.05 | ||
| High | 97.80 | 1.48 | 64.67 | 6.22 | 55 | 76 | 62.67 | 4.43 | 55 | 70 | >0.05 | ||
| Low | None | 3.08 | 0.12 | 51.53 | 6.00 | 41 | 63 | 47.33 | 5.42 | 39 | 61 | >0.05 | |
| Low | 46.16 | 0.32 | 43.07 | 2.76 | 39 | 48 | 43.47 | 4.75 | 37 | 50 | >0.05 | ||
| Medium | 95.00 | 1.58 | 33.93 | 4.18 | 29 | 43 | 31.73 | 3.73 | 26 | 41 | <0.05 * | ||
| High | 118.00 | 1.00 | 34.47 | 2.29 | 30 | 38 | 33.27 | 2.60 | 30 | 38 | >0.05 | ||
Table 3.
Multiple linear regression model for predicting the TD-700 readings using FluoroSense readings and turbidity measurements across three algal concentrations and turbidity treatments from Lakeside and Silverbell Lakes (R2 = 0.94).
Table 3.
Multiple linear regression model for predicting the TD-700 readings using FluoroSense readings and turbidity measurements across three algal concentrations and turbidity treatments from Lakeside and Silverbell Lakes (R2 = 0.94).
| Coefficients | Std. Error | T-Value | p-Value | |
|---|---|---|---|---|
| Intercept | 1.796 | 0.563 | 3.189 | 0.0015 |
| FluoroSense reading | 0.590 | 0.005 | 107.204 | <2 × 10⁻¹⁶ |
| Turbidity | 0.186 | 0.006 | 30.565 | <2 × 10⁻¹⁶ |
Publisher’s Note: MDPI stays neutral with regard to jurisdictional claims in published maps and institutional affiliations. |
© 2021 by the authors. Licensee MDPI, Basel, Switzerland. This article is an open access article distributed under the terms and conditions of the Creative Commons Attribution (CC BY) license (https://creativecommons.org/licenses/by/4.0/).
Share and Cite
MDPI and ACS Style
Hamdhani, H.; Eppehimer, D.E.; Walker, D.; Bogan, M.T. Performance of a Handheld Chlorophyll-a Fluorometer: Potential Use for Rapid Algae Monitoring. Water 2021, 13, 1409. https://doi.org/10.3390/w13101409
AMA Style
Hamdhani H, Eppehimer DE, Walker D, Bogan MT. Performance of a Handheld Chlorophyll-a Fluorometer: Potential Use for Rapid Algae Monitoring. Water. 2021; 13(10):1409. https://doi.org/10.3390/w13101409
Chicago/Turabian StyleHamdhani, Hamdhani, Drew E. Eppehimer, David Walker, and Michael T. Bogan. 2021. "Performance of a Handheld Chlorophyll-a Fluorometer: Potential Use for Rapid Algae Monitoring" Water 13, no. 10: 1409. https://doi.org/10.3390/w13101409
Note that from the first issue of 2016, this journal uses article numbers instead of page numbers. See further details here.