Article

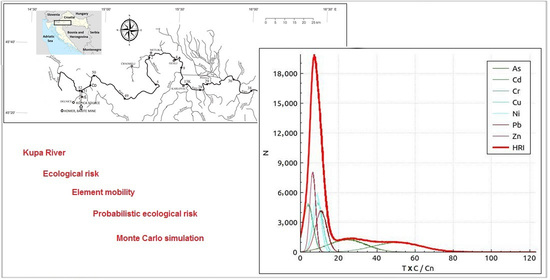
Evaluation of Element Mobility in River Sediment Using Different Single Extraction Procedures and Assessment of Probabilistic Ecological Risk

by
Sanja Sakan
1,*,
Stanislav Frančišković-Bilinski
2,*,
Dragana Đorđević
1,
Aleksandar Popović
3,
Nenad Sakan
4,
Sandra Škrivanj
3 and
Halka Bilinski
2
1
Centre of Excellence in Environmental Chemistry and Engineering–ICTM, University of Belgrade, Njegoševa 12, 11158 Belgrade, Serbia
2
Ruđer Bošković Institute, Division for Marine and Environmental Research, 10000 Zagreb, Croatia
3
Faculty of Chemistry, University of Belgrade, Studentski trg 12–16, 11000 Belgrade, Serbia
4
Institute of Physics, University of Belgrade, Pregrevica 118, 11080 Zemun, Serbia
*
Authors to whom correspondence should be addressed.
Water 2021, 13(10), 1411; https://doi.org/10.3390/w13101411
Submission received: 18 March 2021 / Revised: 4 May 2021 / Accepted: 12 May 2021 / Published: 18 May 2021
(This article belongs to the Special Issue Geochemistry of Water and Sediment Ⅱ)

Abstract

:
In this manuscript, samples of Kupa River sediments were examined using three different extraction agents. The aim of this study was to evaluate the applicability of single extraction procedures to investigate the bioavailability and mobility of major and trace elements (Al, As, Ba, Cd, Co, Cr, Cu, Fe, K, Li, Mg, Mn, Na, Ni, P, Pb, S, Si, Sr, Ti, V, and Zn) from river sediment. Two forms of studied elements were evaluated: mobile, the most toxic element form (extraction with 1 M CH3COONH4 and 0.01 M CaCl2) and potentially mobilized form (2 M HNO3 extraction). The estimation of the ecological risk, with the application of the probability distribution of RI (potential ecological risk index) values, is yielded with the help of the Monte Carlo simulation (MCS). Ammonium acetate is proved to be a better extraction agent than calcium chloride. A positive correlation between the content of all extracted elements with nitric acid and the total element content indicates that 2 M HNO3 efficiently extracts all studied elements. Results showed anthropogenic sources of cadmium and copper and high barium mobility. The MCS suggests that risk of Cr, Cu, Ni, Pb, and Zn was low; As and Cd posed a lower and median ecological risk in the studied areas.

Graphical Abstract

1. Introduction

Sediments play an important role in the transport of nutrients, metals, and other contaminants through river systems to the world’s oceans and seas [1]. River sediments are reservoirs of materials derived from both anthropogenic and natural weathering processes and have been used as an important tool to assess the health status of aquatic ecosystems and are an integral component for the functioning of ecological integrity [2].
Petrographic, mineralogical, and geochemical composition of watercourse sediment samples, if sampled in an uninhabited area, reflects lithology upstream of the sampling site, if the anthropogenic impact is small or absent. However, if a large lithological diversity is present, it causes difficulties in interpreting the origin of the source material, as a result of the large mixing of eroded material and its downstream transport. Some authors, such as [3], also point out the problem of the opposite effect in cases of long and narrow valleys without tributaries, when samples of watercourse sediments taken along the valley are only replicas of the same material from the same source, without new geochemical information. According to the same authors, active watercourse sediments are recent deposits, originating from a limited number of currently active material sources.
The contamination of sediments is widespread and is a potential threat to the environment in the short and long term [4]. It is widely recognized that the availability of contaminants should be considered in environmental risk and life cycle assessments and regulation [5]. In recent years, increasing attention was drawn to the environmental fate of potentially toxic elements (PTEs). PTEs refer to chemical elements including both metals and non-metals that may potentially cause harmful effects on the organisms in the environment if present in high concentrations [6]. Toxic elements include those elements that act exclusively toxic, such as: cadmium, lead, mercury, arsenic, thallium, uranium, etc. [7]. Some elements in low concentrations are essential minerals for normal growth, development, and functioning of the organism, while at high concentrations they cause a toxic effect.
Mobility and availability depend on the reactivity and on the binding behavior of toxic elements with the components of the matrix, and cannot be assessed only from the values of the total concentrations [8]. In order to assess their distribution between residual and non-residual fractions and their environmental availability i.e., their ability to be available to living organisms in case of changes in environmental parameters, many authors use chemical extractions [9]. Extraction is one of the most common methods for isolating chemical elements and compounds. Different extraction agents are recommended for isolation of major and trace elements from soils and sediments, and they have purpose to simulate natural processes, such as acidification or oxidation. Single and sequential extractions are current and useful tools for estimating the availability of metals in soils and sediments [9]. Although the sequential extraction procedure proposed by the European Standard, Measurements and Testing (SM&T) program, formerly the Community Bureau of Reference (BCR) sequential extraction method is standardized, it is not enough to solve all problems and doubts about metals’ availability just by applying this method. In the manuscript [9] is described why it is important to apply different extraction methods (single and sequential), as well as why a comparison between different chemical procedures is necessary to assess the metals’ availability in sediments better. Single extractions may be used for estimating the potentially most mobile element fraction [8]. These extractions offer possibilities to perform a fast screening of the mobilizable pool of elements in sediments. Obtained element concentrations represent bioavailable fraction which is strongly correlated with their leaching potential from soil and sediments [10]. The biggest advantage of these extractions is that the results are obtained quickly, and that they are simple, practical, and cost-effective. Additionally, they also offer possibilities to perform a fast screening of the mobilizable pool of elements in soils and sediments [10]. In manuscript [11], CaCl2 is recommended as suitable single extractions for obtaining the concentrations of Cu and S which could originate from the same source. As a general conclusion, in [12] is shown that the 0.01 M CaCl2 extraction procedure seems to be a suitable method for the determination of Cd, Cu, Pb, and Zn mobility in soils, since this procedure presents an appropriate extraction capacity for this type of studies and also uses the lowest salt concentration. Dilute strong acids are often used to estimate the mobile fractions of soils and sediments [9].
Ecological risk assessment is performed to evaluate the likelihood that adverse ecological effects may occur or are occurring as a result of exposure to one or more stressors [13]. The potential ecological risk of PTEs can be determined using several methods [14]. In recent years, a new method called probabilistic risk assessment is described for ecological risk assessment [13]. The EPA (Environmental Protection Agency) and the National Academy of Sciences recognized Monte Carlo methods of quantifying variability and uncertainty in risk assessments [15]. The Monte Carlo simulation is used in a variety of physical and chemistry problems. As such, it is also widely used as a computational method for generating probability distributions of variables that depend on other variables or parameters represented as probability distributions [15].
Research in this manuscript was performed on sediment samples from the Kupa River, Croatia and its tributaries, which is a unique river system, serving as an ideal “natural laboratory” for studying different chemical processes in rivers. Since an extreme barium anomaly in sediments in the Kupica and Kupa rivers was discovered during work on the Ph.D. thesis of Frančišković-Bilinski and was published in 2006 [16], it is very important to examine the mobility of barium and other trace elements in more detail. Several studies investigated the contamination of the Kupa River [16,17,18,19], but in the current manuscript, it is the first time the use of different types of extractions as a tool to assess the potential element availability in river sediments was evaluated. A single extraction method was carried out to determine mobility and bioavailability of elements from sediments and, for this reason, different single extraction procedures were evaluated. The extraction was performed using three extraction agents: calcium chloride (0.01 M CaCl2), ammonium acetate (1 M CH3COONH4), and nitric acid (2 M HNO3). Obtained results were compared with total element content, after BCR sequential extraction. In addition, for the first time, evaluation of probabilistic ecological risk of PTEs in these river sediments was computed using a Monte Carlo simulation.

2. Materials and Methods
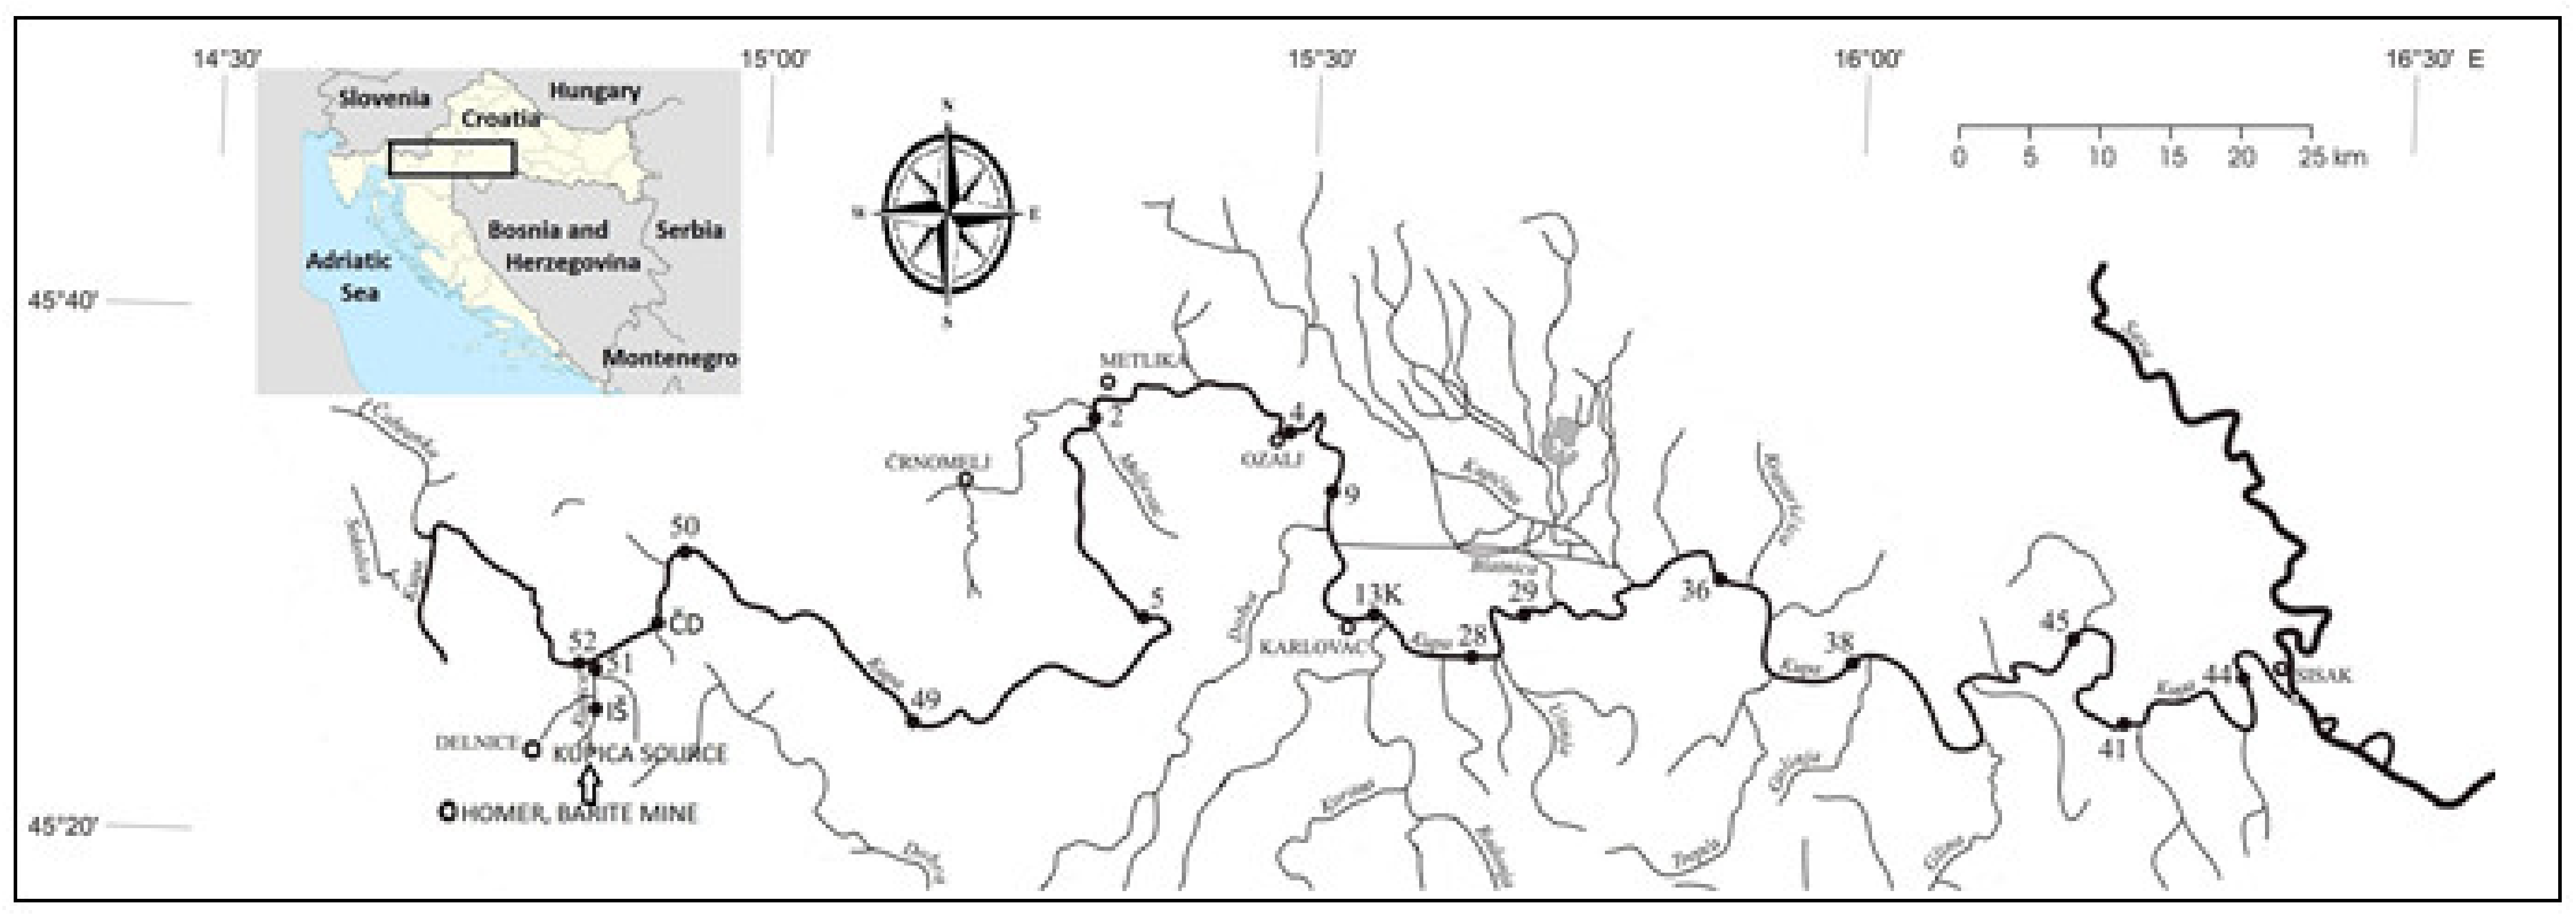
2.1. Study Area

The Kupa River basin occupies the west-central part of Croatia and is shared by two neighboring countries (Slovenia, Bosnia and Herzegovina). Details about the Kupa River can be found in [18], who investigated and described for the first time its geomorphology, tectonic setting, lithological framework, granulometric properties, and pollution status of this transboundary river basin. The Kupa itself is a tributary to the Sava River and meets the latter at Sisak after traversing a distance of 294 km. The Sava River belongs to the Danube River watershed and enters the Danube River at Belgrade (Serbia). The Kupa River drainage basin is situated at the very south of the Danube drainage basin.
The map of Croatia, with a rectangle indicating the position of the Kupa drainage basin, the course of the Kupa River, and its catchment area showing sediment sampling locations are presented in Figure 1. The total area of 10,605 km2 of the Kupa River drainage basin is divisible into several sub-basins as per its countrywide distributions: 79.32% belongs to Croatia, 18.32% to Slovenia, and 2.36% to Bosnia and Herzegovina. The river basin is one of the most significant water resources in Croatia. Although shared by other adjoining countries, about 85% of the river water, being chiefly derived from carbonate karst springs, river springs, precipitation, and run off, discharges on the Croatian side. The karst aquifiers of the Dinarides are highly vulnerable because of the rapid water exchange with the groundwater through numerous shallow holes. The availability of about 3.5 m3/s of very good quality spring water has given a strategic importance to the area based on the fact that the whole Adriatic coast and numerous settlements in the continental area have come into existence [20].

2.2. Sampling and Sample Preparation

Positions of sampling locations are presented in Figure 1 and in Table 1. Two locations (IŠ and 51) are on the Kupica River; one location (52) is on the Kupa River upstream Kupica inflow, while all other locations are in Kupa River downstream from the Kupica River inflow. Sample DN-2 is taken from the upper flow of Dobra River between villages Gornja and Donja Dobra. This location is located very close to the Brod na Kupi and Čedanj locations on the Kupica and Kupa rivers (5–7 km air distance), but it does not have any direct connections with those locations. Therefore, despite its relative vicinity to sampling locations IŠ, 51, 52, ČD, and 50 and similar geological composition of surrounding areas, on sampling point DN-2, there is no influence of waste from the abundant barite mine in Homer.
Locations where fine-grained sediment accumulates along the river bank were chosen. On each sampling site, at least three grab samples of active fine-grained surface sediment (0–5 cm deep) were collected from different places in an area of 5 m2. From this material, a composite sample was taken weighing up to 1.5 kg. This procedure decreased the possible bias caused by local variability.
After sampling, the sediments were dried in air at room temperature and then sieved through 2000 µm and 63 µm sieves (Fritsch, Weimar, Germany) to obtain two sediment fractions: fine fraction containing clay and silt (<63 µm) and coarser fraction containing sand (63–2000 µm). Obtained sediment fractions were used for further analysis.

2.3. Sample Extractions and Measurement Using ICP-OES

Sediment samples were crushed and homogenized and after measuring certain sample masses, extracted with three extraction agents: 0.01 M CaCl2, 1 M CH3COONH4, and 2 M HNO3.
Calcium chloride extractable About 2 g of the sediment sample was weighed into a 50 mL centrifuge tube, and 20 mL 0.01 M CaCl2 was added. The solution thus prepared was shaken for 3 h on a rotary shaker (Heidolph) [21,22,23].
Ammonium acetate extractable About 1 g of the soil sample was weighed into a 50 mL centrifuge tube, and 40 mL of 1 M CH3COONH4 was added into each sediment sample. The solution thus prepared was shaken for 2 h on a rotary shaker (Heidolph) [23].
Extraction with HNO3 About 2 g of sediment sample was weighed into a centrifuge tube. A 20 mL of 2 M HNO3 was added into each sediment sample. The solution thus prepared was shaken for 1 h on a rotary shaker (Heidolph) at room temperature [24,25].
After the extraction process, all samples were centrifuged at 3000 rpm for 10 min. The supernatant was filtered, and the filtrate was filled up to 50 mL with 1 M HNO3 and stored in a polyethylene bottle at 4 °C until needed for analysis.
The total amounts of elements in this manuscript are defined as the sum of extracted elements in the four binding fractions (BCR extractions). A detailed description of this method is shown in [19].

2.4. Measurement Using ICP-OES

The content of elements in the extracts was determined using ICP-OES (inductively coupled plasma optical emission spectrometer) devices (iCAP-6500Duo, ThermoScientific, Paisley, UK). The detector was a RACID86 Charge injector device (CID). This instrument operates sequentially with both radial and axial torch configurations. The analytical performance of the iCAP 6000 Series is demonstrated by its improved detection limits, enhanced linearity, superior long-term stability, and high-resolution images [20].

2.5. Pollution Risk Assessment and Monte Carlo Simulation

As it could be seen from Qu et al. [26] and Wu et al. [27], the Monte Carlo method is very applicable in PTEs’ pollution risk assessment. Based on their work, we developed our software, which is written in Qt, and a proven pseudo random number generator produces a normal distribution with long-term repeatability. The program used was tested on several models, and as a final test, a reproduction of the results from Qu et al. [26] and Wu et al. [27] was conducted in its entirety, based on the input data, and calculated with the help of our software. The first time our software was applied occurred in Sakan et al. 2020 [19].
In the presented research, instead of Håkanson’s RI, the probabilistic distribution of RI was calculated using the Monte Carlo simulation. The potential ecological risk index (RI) in sediments can be calculated using the following equation [28,29]: RI = ∑ Eri, where Eri = Tri Cif, Tri is the toxic-response factor for a given substance (for Hg, Cd, As, Cr, and Zn, they are 40, 30, 10, 2, and 1, respectively; and five for Pb, Cu, and Ni) [29,30], and Cif is the contamination factor [28]. Eri i is the potential ecological risk for single factor, and RI is calculated as the sum of all risk factors for heavy metals in sediments.

2.6. Determination of Magnetic Susceptibility

Magnetic susceptibility was measured using SM30, a small magnetic susceptibility meter, which can assess the high sensitivity measure sediments and rocks with an extremely low level of magnetic susceptibility and, in addition, can distinctly measure diamagnetic materials such as limestone, quartz, and also water. Sensitivity of SM30 is 1 × 10⁻⁷ SI units, what is about ten times better than the sensitivity of most of the competitive instruments. The operating frequency is 8 kHz, measurement time less than 5 s, and operating temperature −20 °C to 50 °C. The SM30 has an 8 kHz LC (inductor-capacitor) oscillator with a large-size pick-up coil as a sensor. The oscillation frequency is measured when the coil is put to the surface of the measured sample and when the coil is removed tens of cm away. Each sample was measured three times, and the mean value was taken as final result of measurement to assure as precise data as possible.

3. Results and Discussion

3.1. Quality Control and Assurance

To check the quality of the element analyses, the certified reference material BCR 483 (Sewage Sludge Amended Soil) was analyzed for extraction with CaCl2. In Table 2 is shown results of comparisons of the obtained calcium chloride extractable content and indicative values for BCR 483. The recoveries for Cd, Cr, Cu, Ni, Pb, and Zn were between 97.6 and 117.1%.

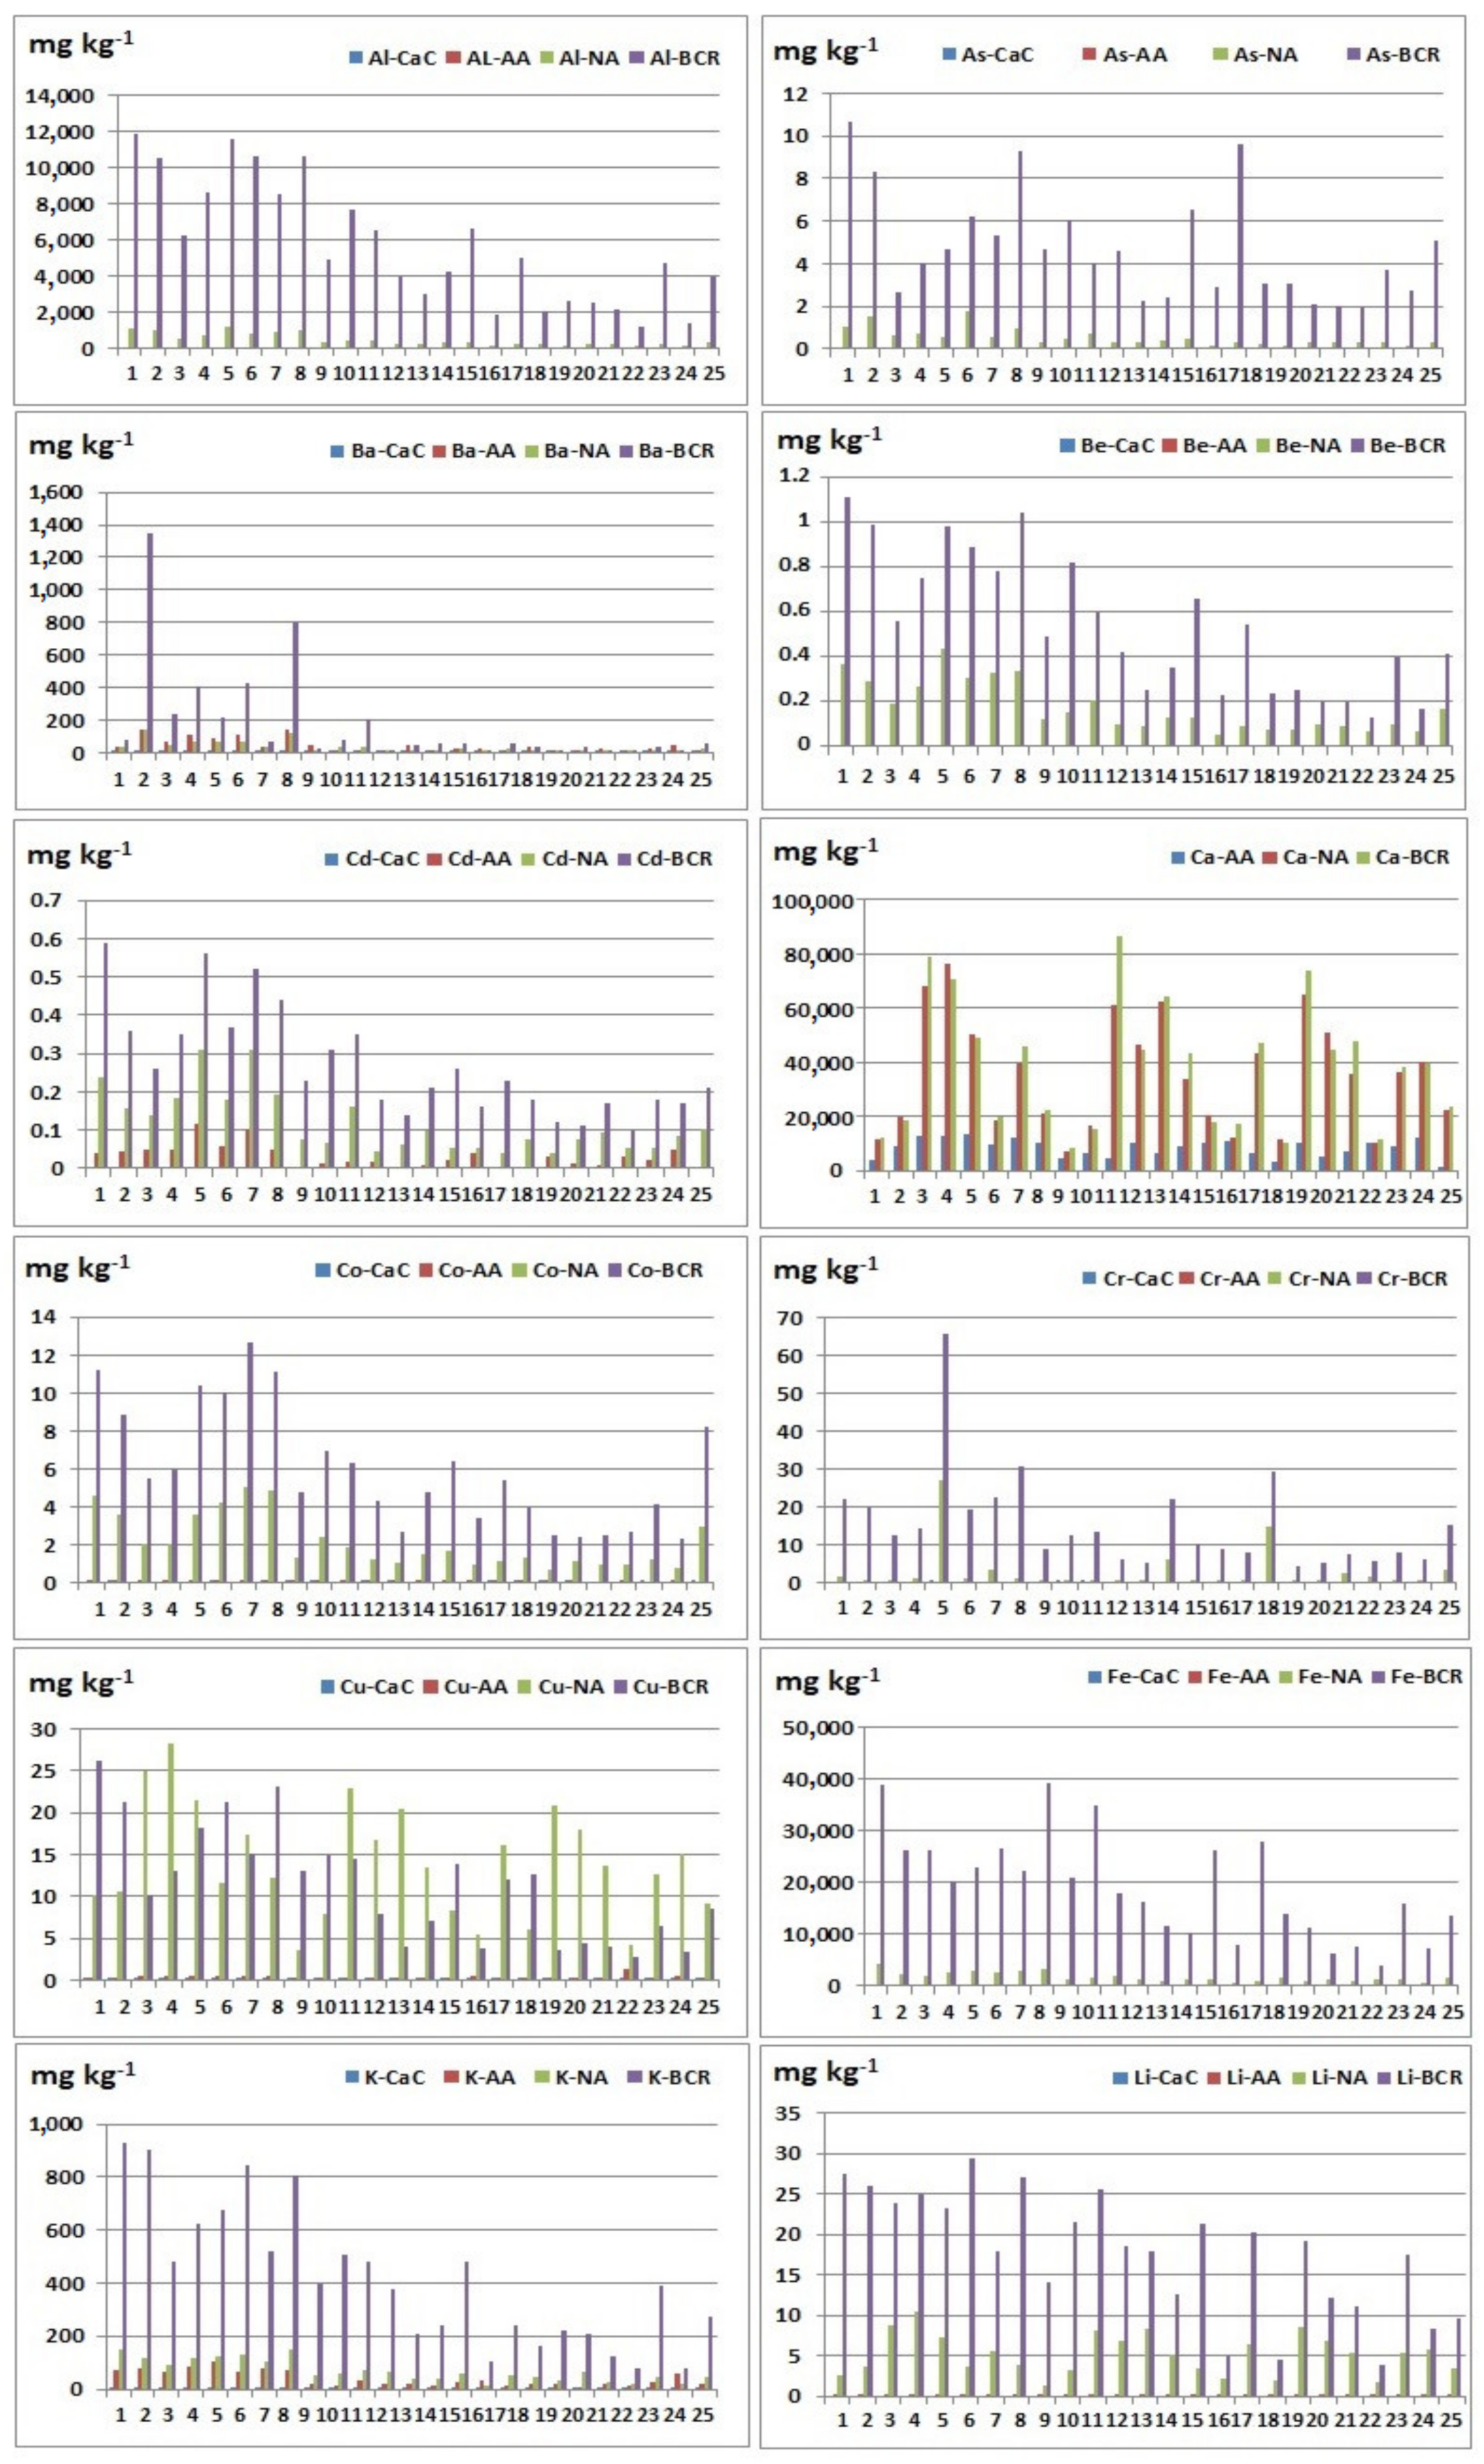
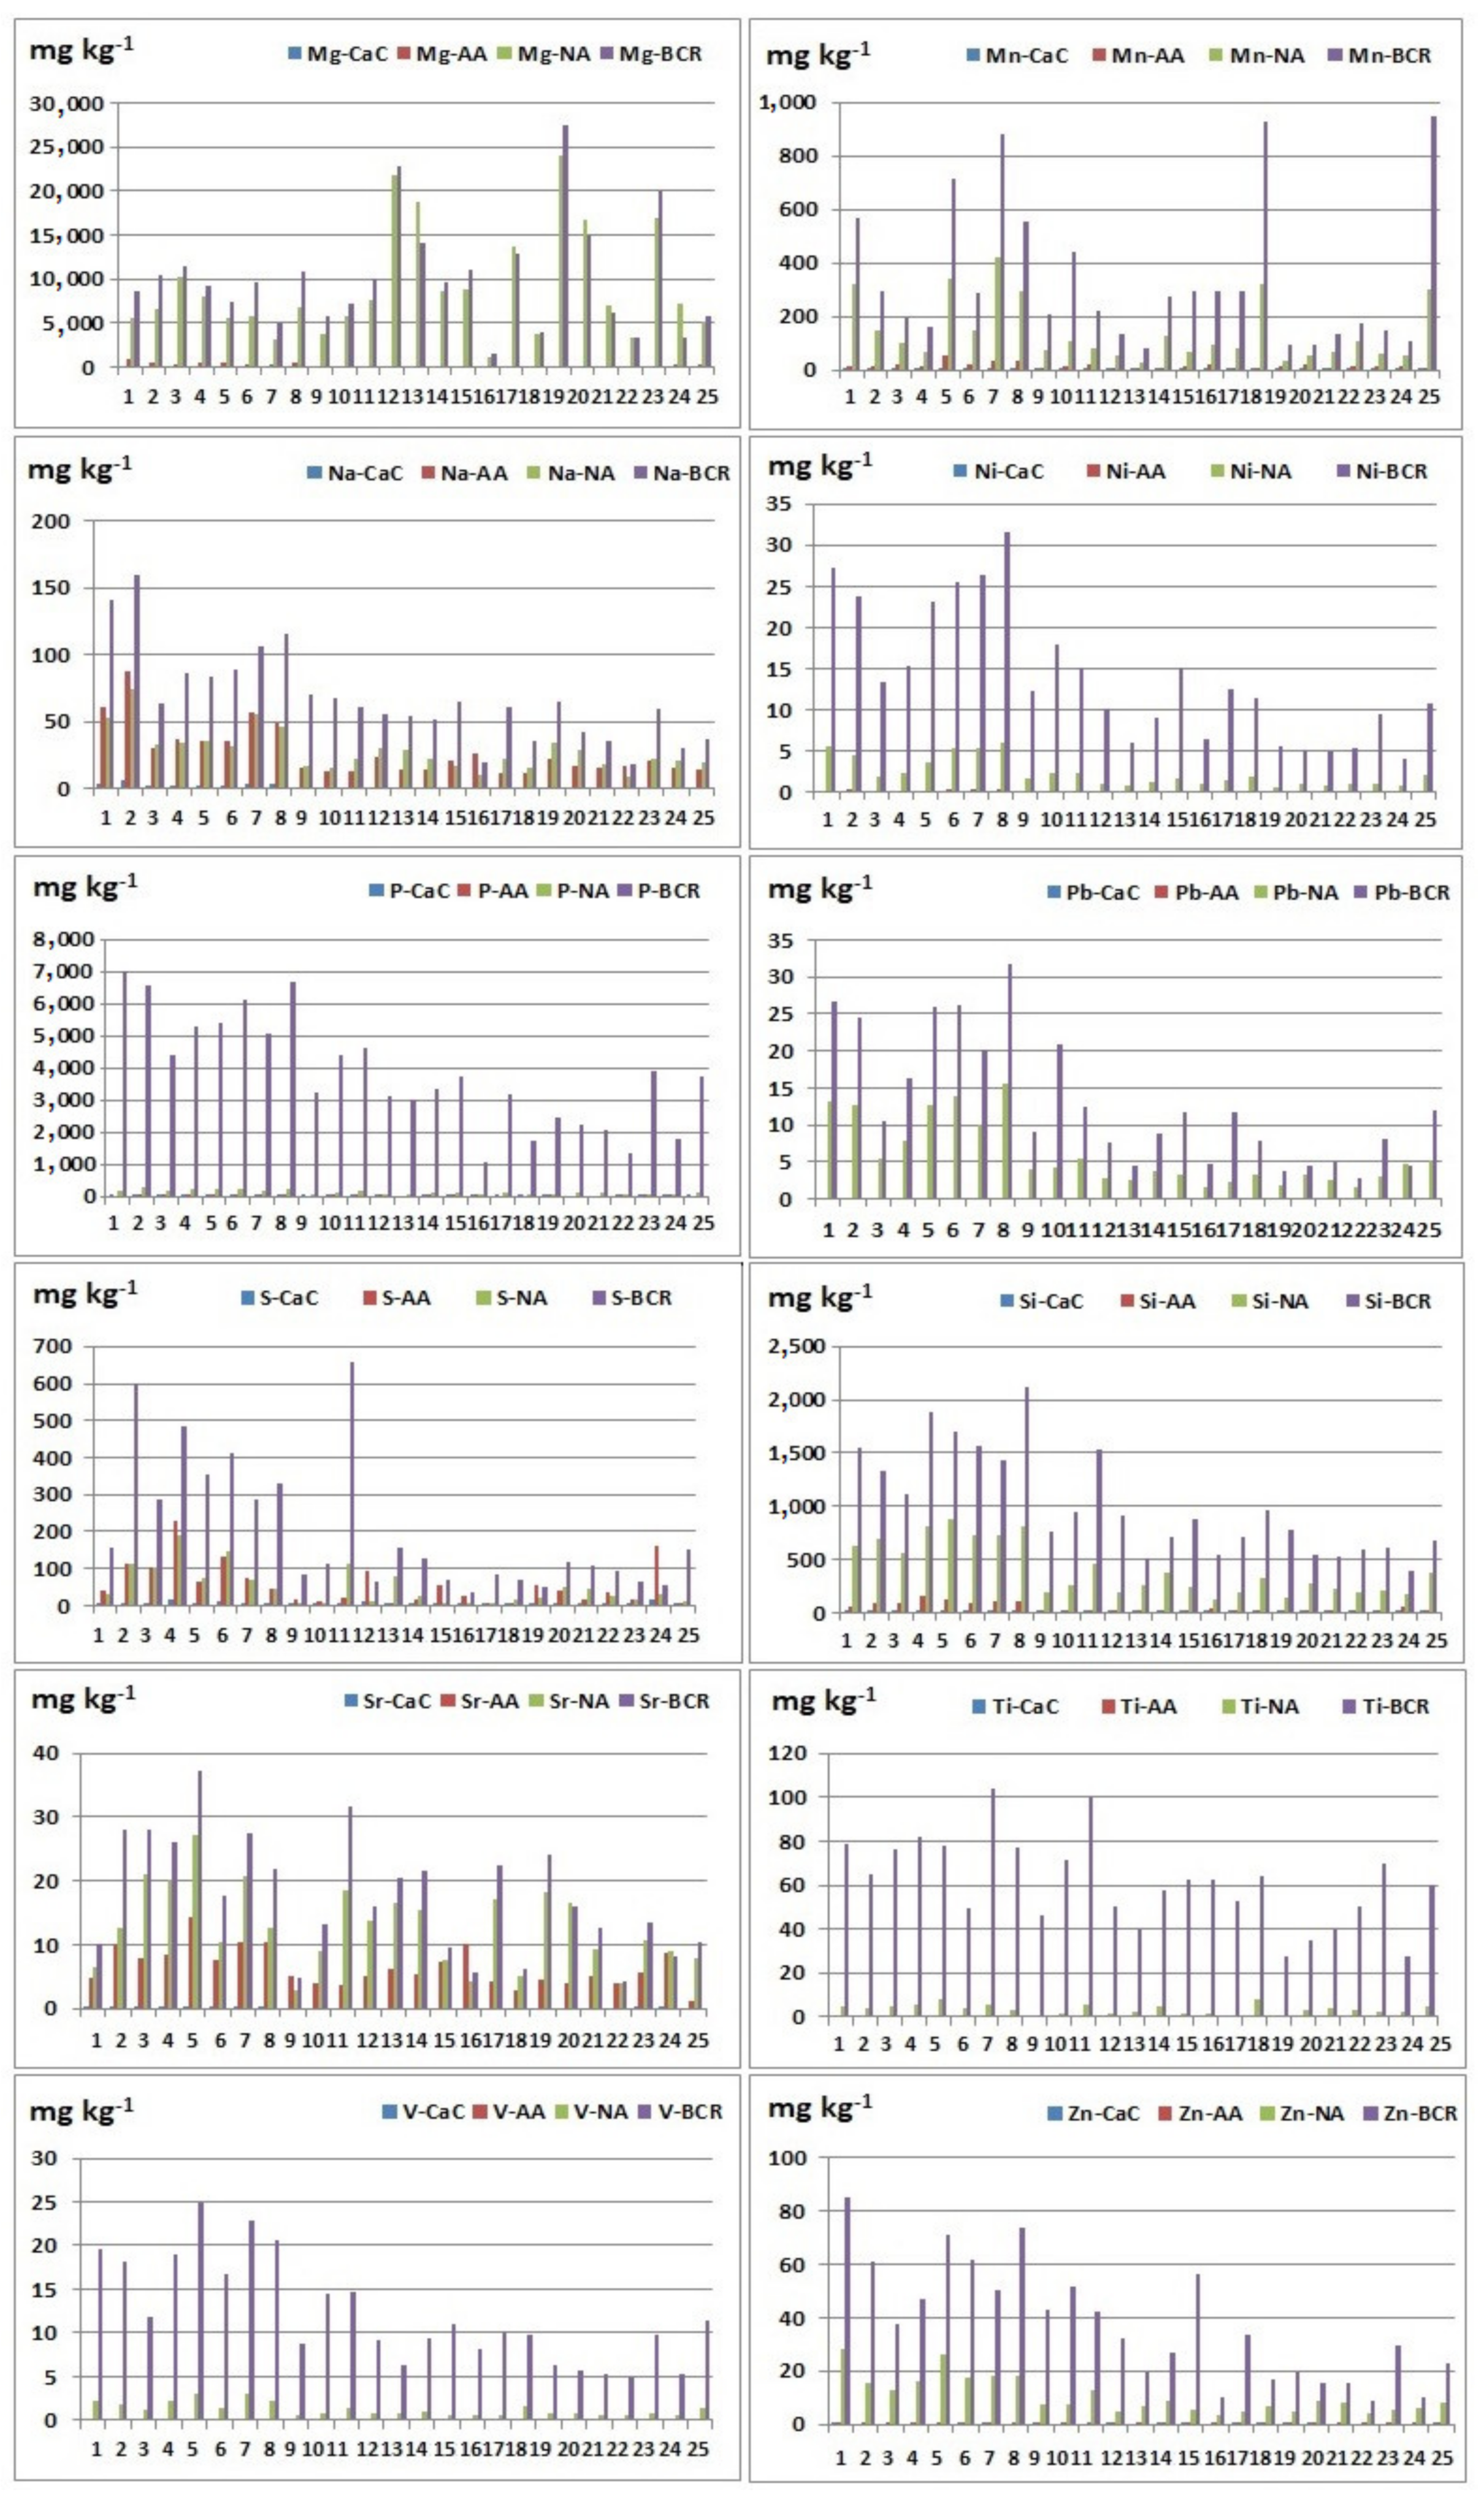
3.2. Discussion about Extracted Elements Contents by Different Extraction Agents

The extraction was performed using three extraction agents: calcium chloride (0.01 M CaCl2), ammonium acetate (1 M CH3COONH4), and nitric acid (2 M HNO3). CaCl2 and CH3COONH4 are classified in groups of unbuffered salts, called “soft” or “mild” extractants. Obtained results are presented in Table 3 and Table 4 and Figure 2 and Figure 3. The relationship between the contents of the elements extracted by different extraction agents is also considered, and the relationship between the extracted contents is shown as a percentage (Supplementary Material, Tables S1–S3). Ratios were calculated only in samples in which element content is greater than the detection limits. From the calculated concentration ratios, it can be concluded which extraction agent is more efficient for the extraction of a certain element, depending on whether the obtained value is less than or greater than one, or calculated as a percentage less than or greater than 100.
Nitric acid extraction in comparison with CaCl2 extraction gave better results during the extraction of the following elements: Al, As, Ba, Cd, Co, Cr, Cu, Fe, K, Mg, Mn, Na, Ni, P, S, Si, Sr, Ti, V, and Zn, where the observed relationship is noticeable for the elements: Al, Ba, Cu, K, Mg, Mn, Na, S, and Si. This result may indicate that Al, Ba, Cu, K, Mg, Mn, Na, S, and Si do not have high mobility in the examined sediments. During the extraction of beryllium, lithium, and lead, values below the detection limit in all samples were obtained, so these ratios could not be calculated. It is possible to conclude that nitric acid is a more efficient extraction agent in relation to calcium chloride. These results are expected given that the extract after extraction with HNO3 contains elements bounded to sulphide and phosphates (released forms) and represents maximum contents of potentially available fraction. The low content of elements extracted using CaCl2 indicates that studied elements in the examined river sediments do not have high mobility, since this solution simulates the natural soil solution, and element contents approximately correspond to their water soluble and exchangeable contents [30].
Nitric acid extraction in comparison with CH3COONH4 gave better results when extracting the following elements: Al, Be, Ca, Cd, Co, Cu, Fe, K, Li, Mg, Mn, Ni, P, S, Sb, Si, Sr, Ti, V, and Zn, where the observed ratio is noticeable for the elements: Al, Co, Cu, Fe, Li, Mg, Mn, P, Ni, Si, V, and Zn (Table S2). During the extraction of arsenic, chromium, and lead, values below the detection limit in all samples were obtained, so these ratios could not be calculated. When determining barium, the observed ratio was calculated in 25 samples, in which in 20 samples, a better result was obtained during extraction with ammonium acetate. When determining sodium, the observed ratio was calculated in 25 samples, in which in 12 samples, a better result was obtained during extraction with ammonium acetate. When determining sulphur, the observed ratio was calculated in 25 samples, in which in 13 samples, a better result was obtained during extraction with ammonium acetate. These results can be explained by the high heterogeneity of the studied sediments with significant differences in the geochemical composition of the substrates. In most samples, better results were obtained after nitric acid extraction, but it should be noted that a significant amount of barium and sodium was extracted using ammonium acetate. This result is consistent with [23] and [31] that extraction with ammonium acetate may be used to assess the amount of available K, Na, Li, Ba, Mg, and Ca.
Extraction with ammonium acetate in comparison with CaCl2 gave better results when extracting the following elements: Al, Ba, Cd, Co, Cu, Fe, K, Mg, Mn, Na, Ni, P, S, Si, Sr, Ti, V, and Zn, where the largest differences were observed in the following elements: Ba, Al, K, Mg, Mn, Na, and Si (Table 3 and Table 4). During the extraction of arsenic, beryllium, chromium, lithium, and lead, values below the detection limit in all samples were obtained, so these ratios could not be calculated for these elements. Since that better results were obtained during extraction with ammonium acetate, the conclusion is that ammonium acetate is a more efficient extraction agent than calcium chloride.

3.3. Discussion of Concentration Ratios of Studied Elements Using Different Extraction Agents with Results of Amounts of Elements Extracted by the BCR Sequential Extraction Procedure (Total Element Content)

Concentration ratios of studied elements are presented separately for each extraction agent (calcium chloride, ammonium acetate, and nitric acid) in Supplementary Materials, Tables S4–S6. Total element contents represent the sum of elements extracted during the BCR extraction [19].
Ratios between concentrations obtained by calcium chloride, which is the mildest of used extraction agents, and concentrations obtained by total extraction showed that values for the majority of elements are extremely low. Only a few elements, which will be mentioned, show slightly higher values. Barium has values >1 on several locations only in the coarser fraction, with the highest value reaching a bit above 6%. This finding has significant implications, as it could be a sign of increased bioavailability of Ba in Kupa River sediments. Concentrations of Ba are extremely high in the upper and middle flow of the river due to the Ba-anomaly originating from uncareful disposal of waste from a barite mine in the Homer mine, Lokve, Gorski Kotar. An especially high Ba-concentration is in the Kupica River spring, to which it penetrated through vulnerable karstic underground, and this spring is used as the main water supply for the Delnice town, which is the central settlement of the whole Gorski Kotar area. Taking in account that Ba is being dissolved with an extraction agent as weak as calcium chloride is, it may imply that its concentration might get elevated, and what could cause problems with tap-water quality. It is known that some forms of Ba are toxic, so it could lead to health problems of local inhabitants. Unfortunately, Ba is not measured in the routine monitoring of water quality in Croatia. Therefore, it would be important to initiate some additional research on this topic in the affected area, as up to now only one preliminary study dealing with Ba’s influence on health was performed [17]. In that study, authors applied geochemical and medical methods to investigate the possible impact of disposal of waste from the barite mine on human health in Lokve. The necessity of such measurements in future studies has been highlighted. Their preliminary study of diseases diagnosed in Lokve shows that about 18% of the total inhabitants have serious medical problems. Diseases of the circulatory system, as well as endocrine, nutritional, and metabolic diseases, neoplasms, and respiratory diseases predominate. They called for further multidisciplinary research on the health effects of barium and trace elements, as well as for bioremediation of contaminated gardens and for watershed management of vulnerable karstic aquifers. From other studied elements, only sulphur has several elevated percentages, with the highest value of about 12.5% in the coarser fraction. This probably could be explained with the fact that the barite (BaSO4) mineral from the abundant mine is being dissolved, so together with Ba itself, S is also being released from this compound. All other elements show very small percentages.
Ratios between concentrations obtained by ammonium acetate, which is a slightly stronger agent, and concentrations obtained by total extraction, showed that ratios for the majority of elements are higher than when using calcium chloride. Similarly, as with the previous extraction agent, the highest values are observed for Ba and S, confirming everything mentioned in the previous paragraph. From other elements, excluding natural lithogenic elements such as Ca, Si, etc. originating from nearby carbonate rocks, the following elements have rather high percentages: Cd, Cu, K, Mn, and Na. This indicates their potential bioavailability.
Ratios between concentrations obtained by nitric acid, which is the strongest of all three used agents within the current research, and total element content showed the highest values among all three of them. This observation can be explained as follows: During the extraction with HNO3, maximum contents of potentially available fraction were released. Fractions obtained during extraction with CaCl2 and ammonium acetate, so-called mobile forms, contain mainly elements in their ion-changing form.
Table 5 shows a statistical analysis of the data about the relationship between content of elements extracted with 2 M HNO3 and total extracted element contents (with BCR extraction). When it comes to the finer fraction (<63 μm), it is possible to notice that Ca and Cu were extracted in a high percentage using 2 M HNO3, which indicates that this extraction agent is very efficient for extraction of these two elements from the fine sediment fraction. These results indicate that calcium is predominantly present as carbonate at the examined localities. When it comes to copper, it is possible to conclude that this element is not significantly bound to silicates, but is probably bounded to manganese and iron oxides, which are very efficiently destroyed by the use of 2 M HNO3. When the maximum values of the extracted elements are observed, it is possible to notice that a high content of magnesium and strontium was extracted at certain localities, which is probably a consequence of the significant carbonate content. Additionally, a high percentage of extracted zinc using 2 M HNO3 (up to 85.30%) was observed at some localities, which indicates high mobility and possible local contamination with this element. Chromium should also be pointed out, since it is a lithophilic and very immobile element in nature, which is confirmed by the results for the average percentage of extracted chromium using 2 M HNO3 (about 11% in both fractions). An increased percentage of the extracted element was observed at some localities (up to 41.22% in the fraction <63 μm, or 49.85% in the fraction 63–2000 μm), which may indicate increased mobility of this element in some localities.
When the fraction 63–2000 μm is observed, 2 M HNO3 proved to be an extremely efficient means for extraction of Ca and Cu, but also Mg and Sr, while in some localities lead was also extracted up to 100%. Considering that the average value of extracted lead in this fraction is 46.10%, the high efficiency of extraction at certain localities can be explained by the existence of anthropogenic sources of lead, as a result of which lead is present in more mobile fractions.
At some sites, it was observed that a higher content of Cu was obtained by extraction with 2 M HNO3 than by destruction using BCR extraction. Given that the measurements were not made in the same time period, as well as that the ICP OES technique is a sensitive technique, and sediment is a complex matrix, it should be noted that this is a problem of a technical nature and can be seen only in a small number of samples. A similar situation was observed with magnesium.
Many elements have similar concentrations when extracted with nitric acid as well as when BCR extraction was performed on them. This means that this type of extraction, which is much easier than total sequential extraction, could be enough to get reasonable results for total content of some elements (Ca, Cu, Mg, and Sr) in sediments. Additionally, it should be noted that this acid can be used for rapid screening of sediment and soil contamination, given that high extraction efficiency was shown for Zn, Pb, and Cd in some localities. In Ref. [30], it is shown that the distribution of Zn is controlled by a similar mechanism as Pb.
In Table 6 is shown results of comparisons of extracted elements’ content in this research with similar investigations.
In general, contents of Pb, Ni, Cu, Cr, Cd, and Zn extracted by CaCl2 from studied river sediments were lower than data for elements extracted from soil samples [11]. Total content of Cu and Cd was higher in soils [11] than in studied sediments in this manuscript. Obtained higher values for Cu and Cd in soils are due to treatment of soils by fertilizer and pesticides. Total content of extracted Zn from river sediments was higher than in soil [11] because of possible different sources of zinc pollution in the river basin. The total content of the other examined elements (Pb, Ni, and Cr) in sediments (this study) and soils [11] is fairly uniform. Higher content of CaCl2 in extractable Pb, Cu, Cd, and Zn content in [12] can be explained by the fact that the investigated soil was largely contaminated (Table 6). The low extractability observed for Pb while using CaCl2 as reagent was observed in our research, but also in [11] and [12]. An explanation for this is that lead concentrations in contaminated soil extracts are controlled by precipitation processes (such as carbonates, hydroxides, sulphates, and phosphates), limiting the use of un-buffered salt solutions for the estimation of lead availability in soils [12]. The higher content of elements extracted using ammonium acetate in the yield of other extraction agents (in our case, it is calcium chloride, Table 6) is a consequence of the fact that 1 M ammonium acetate (pH 7) is perhaps the most preferred reagent for exchangeable metals because of its relatively high concentration and the metal complexing power of the acetate ion, both of which prevent readsorption or precipitation of released metal ions [32]. This reagent released bigger amounts of heavy metals than did ammonium nitrate [33].

3.4. Correlation Analysis

The Pearson correlation coefficients (r) measure the strength and direction of linear relationships between two or more random variables. In the present study, r is used to describe the interrelationships between the analyzed elements, and the results of correlation analysis are shown in Table 7.
It can be observed that there is a positive correlation between the content of all extracted elements with nitric acid (NA) and the total element content (BCR content). This indicates that the use of 2 M HNO3 efficiently extracts all studied elements. The results of the correlation analysis indicate that there is a positive correlation between the total extracted element content and the elements extracted using AA—ammonium acetate (Al, Ba, Cd, K, Li, Na, Ni, S, Si, Sr, Ti, and V) and CaC—calcium chloride (Ba, Cu, K, Mn, Na, Si, and Sr). In the case of more mobile fractions, the content of elements extracted with calcium chloride is positively correlated with the content of Ba, K, Mg, Na, P, S, Si, and Sr, extracted with ammonium acetate. A positive correlation was observed between the content of elements extracted with nitric acid and calcium chloride (Ba, K, Na, P, S, Si, and Sr) and those extracted with ammonium acetate (Al, Ba, Cd, Co, Fe, K, Mn, Na, Ni, S, Si, and Sr). The observed correlations show that ammonium acetate is a more efficient means of extracting the most mobile fraction of elements. Correlations of the mobile contents of the elements with the total content indicate the existence of anthropogenic sources of cadmium and copper at the examined localities. CaCl2 is recommended in [11] and [12] as a suitable reagent for extraction in the mobile form of Cu. In Ref. [30], it is shown that mobilization of Cu is mainly controlled by soil reaction.
A positive correlation between CaCl2-extractable and total content of Cu in this manuscript indicated that in parts of the Kupa basin, there are vineyards that have been treated by fungicide copper (II)-sulphate. Additionally, positive correlations of mobile barium fractions using CaC and AA indicate the high mobility of this element. The positive correlation between the content of mobile contents of macroelements and the total content of elements indicates that the application of weaker extraction agents leads to complete or partial decomposition of carbonates, sulfates, phosphates, and even manganese oxides, and to the release of toxic elements related to them. We recommend extraction with ammonium acetate to assess mobile fraction elements that are equivalent to the “actually available” metal fraction, while nitric acid can be used to assess mobilizable fraction, i.e., the potentially available forms of trace elements in soils and sediments.

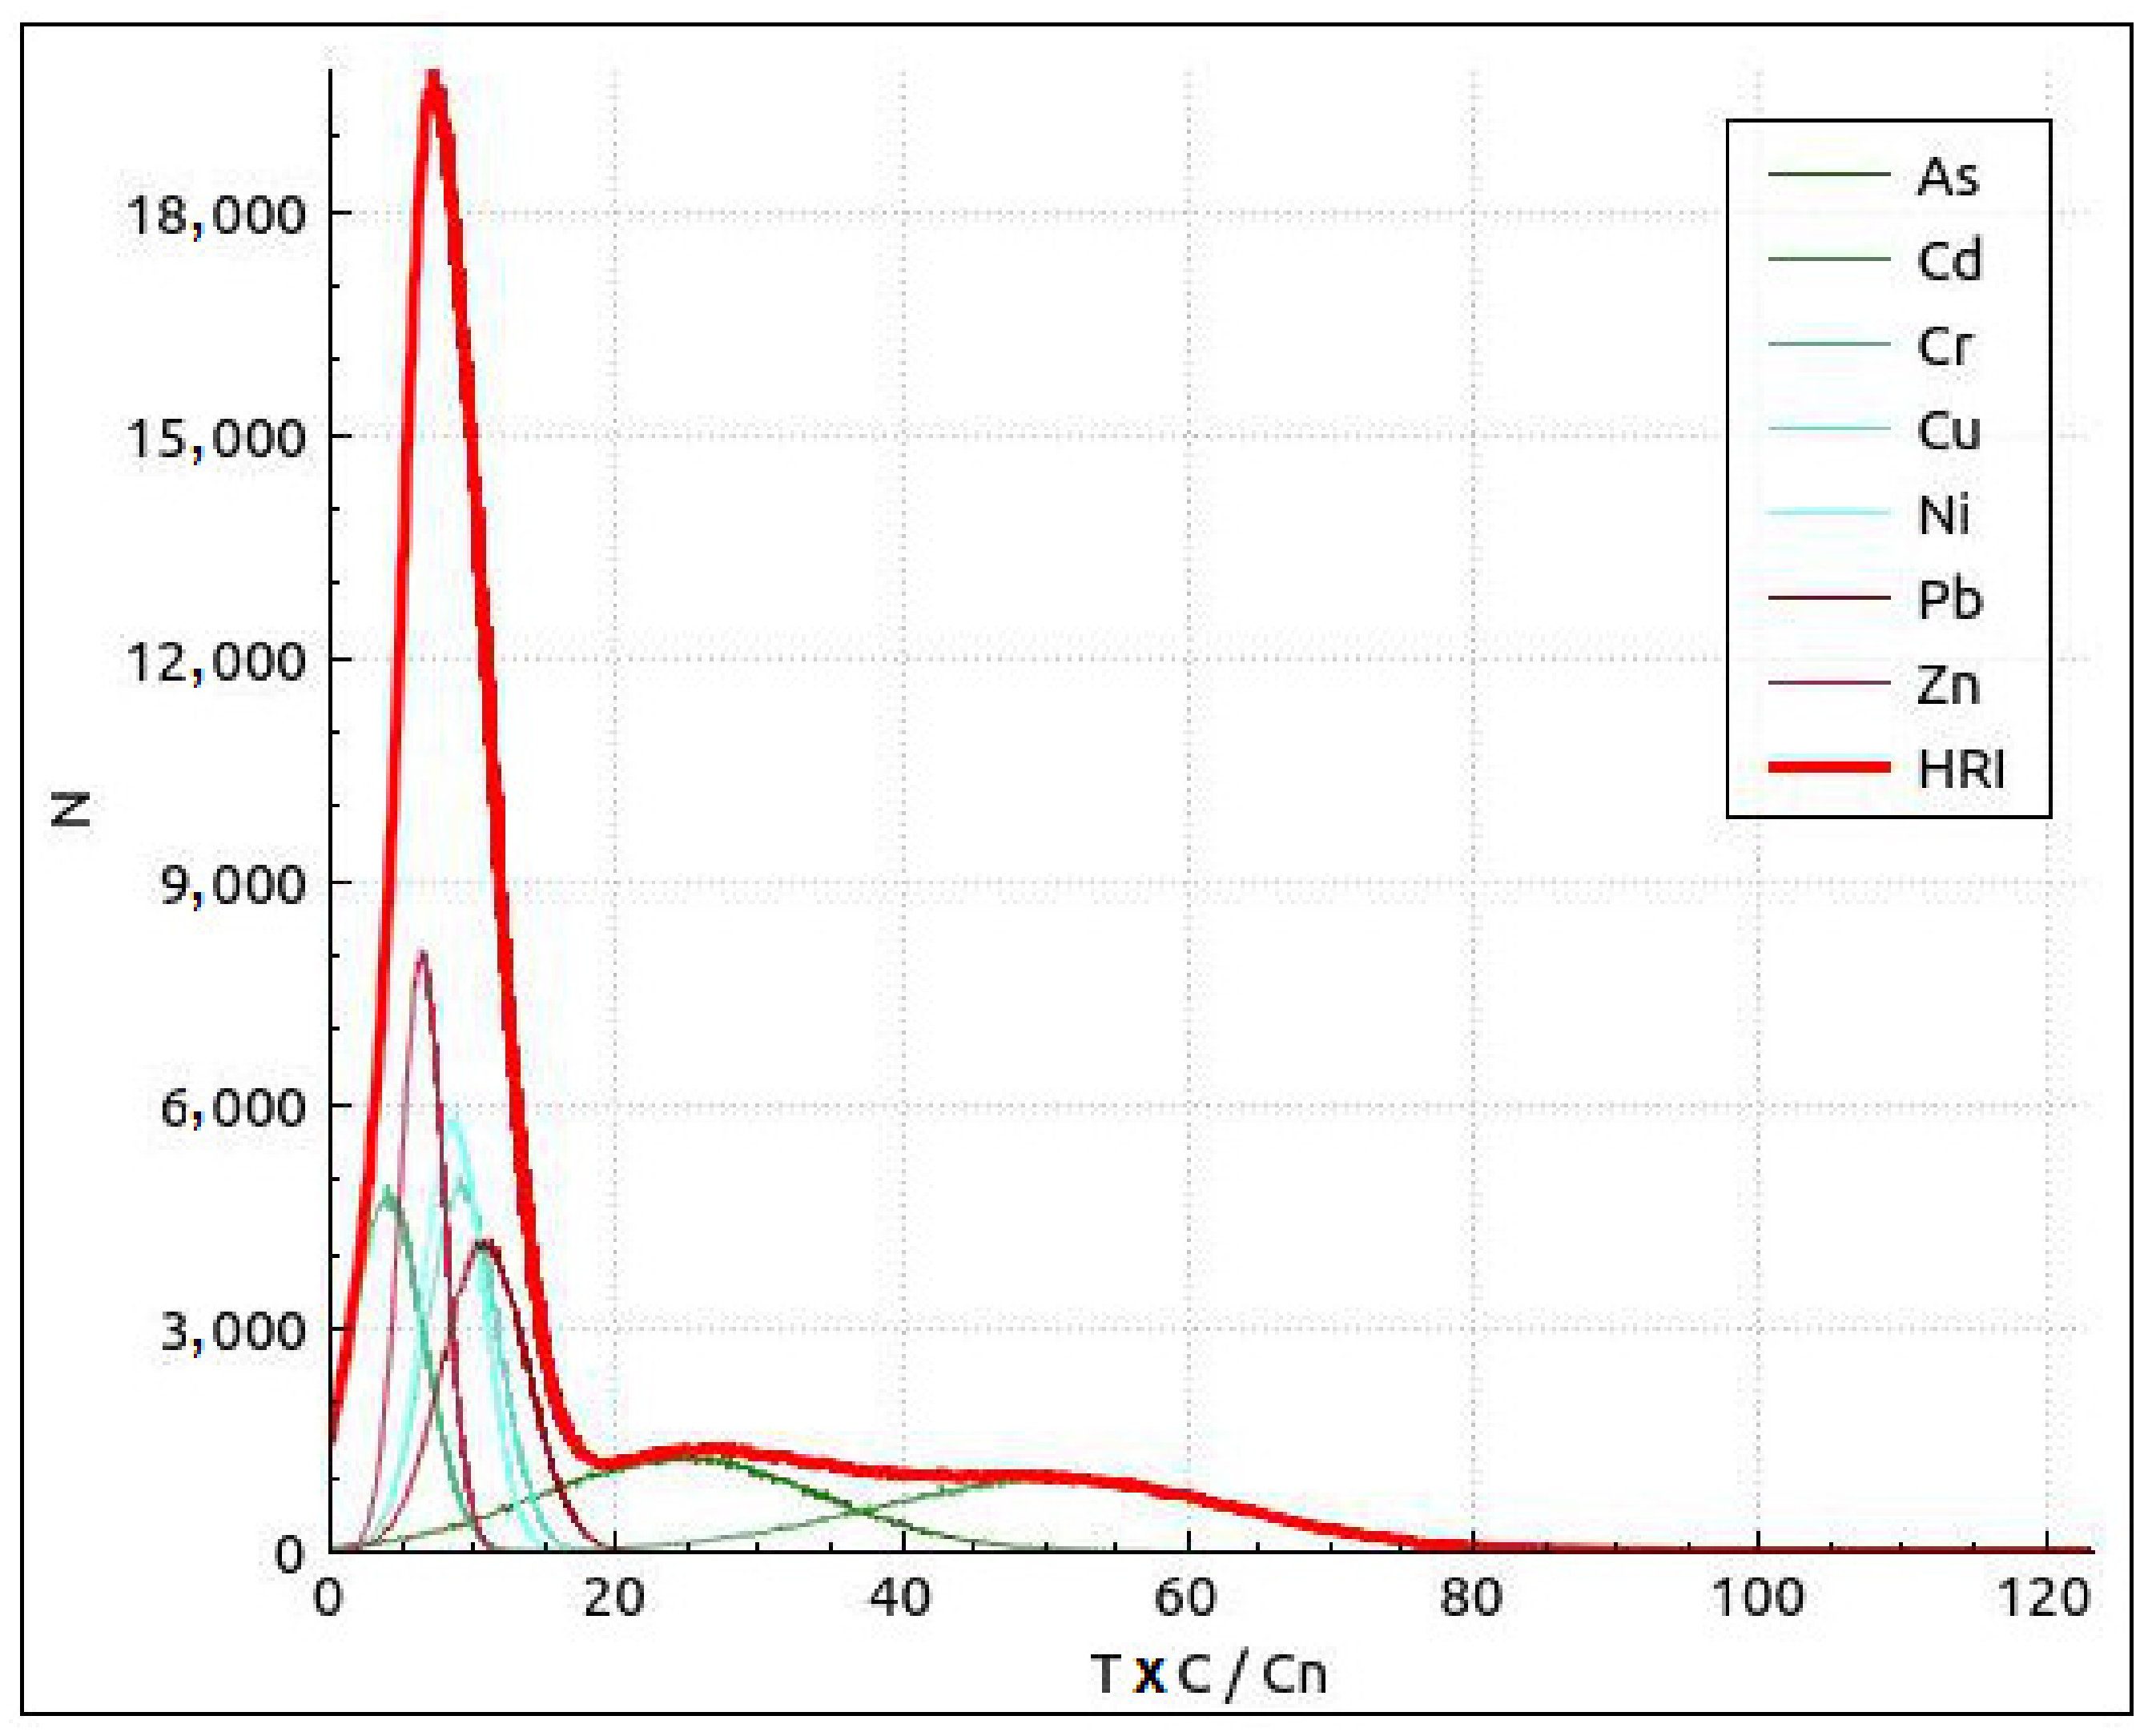
3.5. Ecological Risk Assessment of Potentially Toxic Elements Using Monte Carlo Simulation

A distribution curve on Eir and HRI (Total ecological risk comprehensive index) values is shown in Figure 4. The probability that ecological risk appeared at different risk levels with reference to a risk level classification standard was analyzed, as shown in Table 8. The Monte Carlo simulation suggests that risk of Cr, Cu, Ni, Pb, and Zn was low, and As and Cd posed a lower ecological risk in the studied areas. Cd is the most important factor in the Kupa River basin.
As shown in Table 9, the probability of the HRI values being at a low risk level was 100%, i.e., the total ecological risk level of PTEs pollutants in the sediments of the Kupa river.

3.6. Magnetic Susceptibility (MS) Measurements vs. Element Concentrations in Different Dissolution

Correlations between MS and elements contents obtained using three extraction agents were performed, and only one significant correlation is detected. For dissolution with 2 M HNO3, the only significant correlation was found for Mg (0.50). From all three used agents in this paper, HNO3 is the strongest one, dissolving a significant part of the sediment, including both elements of anthropogenic and natural origin. Mg in Kupa River sediments is an element of natural origin, deriving from carbonate rocks, mostly dolomites.

4. Conclusions

Based on presented results for the Kupa river, it is possible to conclude that differences in amounts of a single element extracted from sediment by different procedures varied from location to location and from element to element, which is the result of high heterogenity of the studied river sediments in the geochemical composition. These results indicated the significance of the application of different extractions reagents on the assessment of mobility of trace elements. Nitric acid is a more efficient extraction agent in relation to calcium chloride and ammonium-acetate, and ammonium acetate is a more efficient extraction agent than calcium chloride. The results of the single extraction methods indicate increased bioavailability of Ba, Cd, Cu, K, Mn, and Na and low bioavailability for chromium, since it is a lithophilic and very immobile element in nature. Numerous elements were extracted in similar contents when sediments were extracted with nitric acid as well as when performing BCR extraction (total element content). Extraction with 2 M HNO3, which is much easier than sequential extraction and total element content determination, could be enough to get reasonable results for the determination of total content of Ca, Cu, Mg, and Sr in sediments. High extraction efficiency was shown also for Zn, Pb, and Cd in some localities. Additionally, it should be noted that 2 M HNO3 can be used for rapid screening of sediment and soil contamination. We recommend extraction with ammonium acetate to assess mobile fraction elements that are equivalent to the “actually available” metal fraction, while nitric acid can be used to assess mobilizable fraction, i.e., the potentially available forms of trace elements in soils and sediments. CaCl2 extraction is recommended for the determination of Cu mobile forms in sediments.
Based on a Monte Carlo simulation, it was found that the lower risk probabilities of Cd were 78.93% and 1.09% for median risk, which indicate that Cd was the most important toxic element in the Kupa River. The probability of ecological risk for all factors indicated that the potential ecological risk of toxic elements in the Kupa River is low at present. However, despite the low risk at present, there are indications that contents of some toxic metals are increasing at some locations, especially in the Kupa River lower flow, which could increase the ecological risk in the future. Therefore, we suggest the need for future systematic monitoring of the Kupa River and its drainage basin with respect to toxic element and ecological risk estimations.

Supplementary Materials

The following are available online: https://www.mdpi.com/article/10.3390/w13101411/s1, Table S1: Relationship between the contents of elements extracted with CaCl2 and HNO3 (%); Table S2: Relationship between the contents of elements extracted with CH3COONH4 and HNO3; Table S3: Relationship between the contents of elements extracted with CaCl2 and CH3COONH4; Table S4: Relationship between the contents of elements extracted with CaCl2 and total element content—BCR extraction (%); Table S5: Relationship between the contents of elements extracted with CH3COONH4 and total element content—BCR extraction (%); Table S6: Relationship between the contents of elements extracted with HNO3 and total element content—BCR extraction (%).

Author Contributions

Conceptualization, S.S. and S.F.-B.; methodology, S.S., S.F.-B., D.Đ. and H.B.; software, N.S.; sampling, S.F.-B. and H.B.; investigations, S.S. and S.F.-B.; formal analysis, S.S., S.F.-B. and S.Š.; writing—original draft preparation, S.S. and S.F.-B.; writing—review and editing, S.S., S.F.-B., D.Đ., A.P., N.S., S.Š. and H.B. All authors have read and agreed to the published version of the manuscript.

Funding

This manuscript was supported by the Centre of Excellence in Environmental Chemistry and Engineering–ICTM, Faculty of Chemistry, and Institute of Physics, Belgrade, University of Belgrade, through the grants by the Ministry of Education, Science and Technological Development of Republic of Serbia. The authors would like to thank the Ministry of Education, Science and Technological Development of Republic of Serbia (Grant No: 451-03-9/2021-14/200026) for financial support. Field trips in the Kupa River basin were funded by Ministry of Science and Education of Republic of Croatia (Grant No: 0411FI18), which is also thanked for financial support.

Acknowledgments

We would like to thank the Krešimir Maldini from Hrvatske vode (Croatian water authorities) who helped us with the drying and sieving of sediment samples collected in 2018.

Conflicts of Interest

The authors declare no conflict of interest.

References

  1. Davutluoglu, O.I.; Seckin, G.; Ersu, C.B.; Yilmaz, T.; Sari, B. Heavy metal content and distribution in surface sediments of the Seyhan River, Turkey. J. Environ. Manag. 2011, 92, 2250–2259. [Google Scholar] [CrossRef]
  2. Zahra, A.; Hashmi, M.Z.; Malik, R.N.; Ahmed, Z. Enrichment and geo-accumulation of heavy metals and risk assessment of sediments of the Kurang Nallah—Feeding tributary of the Rawal Lake Reservoir, Pakistan. Sci. Total Environ. 2014, 470–471, 925–933. [Google Scholar] [CrossRef] [PubMed]
  3. Ottesen, R.T.; Bogen, J.; Bølviken, B.; Volden, T. Overbank sediment: A representative sampling medium for regional geochemical mapping. J. Geochem. Explor. 1989, 32, 257–277. [Google Scholar] [CrossRef]
  4. Cappuyns, V. A critical evaluation of single extractions from the SMT program to determine trace element mobility in sediments. Appl. Environ. Soil Sci. 2012, 672914. [Google Scholar] [CrossRef] [Green Version]
  5. Groenenberg, J.E.; Römkens, P.F.A.M.; Zomeren, A.V.; Rodrigues, S.M.; Comans, R.N.J. Evaluation of the single dilute (0.43 M) nitric acid extraction to determine geochemically reactive elements in Soil. Environ. Sci. Technol. 2017, 51, 2246–2253. [Google Scholar] [CrossRef] [Green Version]
  6. Antoniadis, V.; Shaheen, S.M.; Levizou, E.; Shahid, M.; Niazi, N.K.; Vithanage, M.; Ok, Y.S.; Bolan, N.; Rinklebe, J. A critical prospective analysis of the potential toxicity of trace element regulation limits in soils worldwide: Are they protective concerning health risk assessment?-A review. Environ. Internat. 2019, 127, 819–847. [Google Scholar] [CrossRef]
  7. Kastori, R.R.; Petrović, M.; Petrović, N.M.; Štrbac, D. Effect of heavy metals on water relations in plants. Zb. Matice Srp. Prir. Nauke 1995, 88, 5–17. [Google Scholar]
  8. Abollino, O.; Malandrino, M.; Giacomino, A.; Mentasti, E. The role of chemometrics in single and sequential extraction assays: A review Part I. Extraction procedures, uni- and bivariate techniques and multivariate variable reduction techniques for pattern recognition. Anal. Chim. Acta. 2011, 688, 104–121. [Google Scholar] [CrossRef]
  9. Cuvier, A.; Leleyter, L.; Probst, A.; Probst, J.-L.; Prunier, J.; Poucelot, L.; Le Roux, G.; Lemoine, M.; Reinert, M.; Baraud, F. Why comparison between different chemical extraction procedures is necessary to better assess the metals availability in sediments? J. Geochem. Explor. 2021, 225, 106762. [Google Scholar] [CrossRef]
  10. Pantović Spajić, K.; Sakan, S.; Đorđević, D.; Šoštarić, T.; Lopičić, Z.; Janićijević, A.; Stojanović, K. Comparison of extraction agents for metal determination in sediments from artificial lakes and rivers in Serbia. Acta Period. Technol. 2019, 50, 189–196. [Google Scholar] [CrossRef] [Green Version]
  11. Milićević, T.; Relić, D.; Škrivanj, S.; Tešić, Ž.; Popović, A. Assessment of major and trace element bioavailability in vineyard soil applying different single extraction procedures and pseudo-total digestion. Chemosphere 2017, 171, 284–293. [Google Scholar] [CrossRef] [PubMed]
  12. Pueyo, M.; López-Sánchez, J.F.; Rauret, G. Assessment of CaCl2, NaNO3 and NH4NO3 extraction procedures for the study of Cd, Cu, Pb and Zn extractability in contaminated soils. Anal. Chim. Acta 2004, 504, 217–226. [Google Scholar] [CrossRef]
  13. Zhao, L.; Mi, D.; Wang, L.; Sun, Y. Ecological risk assessment and sources of heavy metals in sediment from Daling River basin. Environ. Sci. Pollut. Res. 2015, 22, 5975–5984. [Google Scholar] [CrossRef] [PubMed]
  14. Yuan, H.; Song, S.; An, S.; Liu, E. Ecological risk assessment of potentially toxic elements (PTEs) in the soil-plant system after reclamation of dredged sediment. Environ. Sci. Poll. Res. 2018, 25, 29181–29191. [Google Scholar] [CrossRef] [PubMed]
  15. Poulter, S.R. Monte Carlo Simulation in Environmental Risk Assessment—Science, Policy and Legal Issues. RISK 1998, 9, 7. [Google Scholar]
  16. Frančišković-Bilinski, S. Barium anomaly in Kupa River drainage basin. J. Geochem. Explor. 2006, 88, 106–109. [Google Scholar] [CrossRef]
  17. Frančišković-Bilinski, S.; Bilinski, H.; Grbac, R.; Žunić, J.; Nečemer, M.; Hanžel, D. Multidisciplinary work on barium contamination of the karstic upper Kupa River drainage basin (Croatia and Slovenia); calling for watershed management. Environ. Geochem. Health 2007, 29, 69–79. [Google Scholar] [CrossRef] [PubMed]
  18. Frančišković-Bilinski, S.; Bhattacharya, A.K.; Bilinski, H.; Bhattacharya, B.D.; Mitra, A.; Sarkar, S.K. Fluvial geomorphology of the Kupa River drainage basin, Croatia: A perspective of its application in river management and pollution studies. Zeitschrift für Geomorphologie 2012, 56, 93–119. [Google Scholar] [CrossRef]
  19. Sakan, S.; Frančišković-Bilinski, S.; Đorđević, D.; Popović, A.; Škrivanj, S.; Bilinski, H. Geochemical fractionation and risk assessment of potentially toxic elements in sediments from Kupa River, Croatia. Water 2020, 12, 2024. [Google Scholar] [CrossRef]
  20. Biondić, B.; Biondić, R.; Kapelj, S. Protection of the Karst aquifers in the river Kupa catchment area and sustainable development. RMZ Mater. Geoenv. 2003, 50, 33–36. [Google Scholar]
  21. Cappuyns, V.; Swennen, R.; Verhulst, A. Assessment of Heavy Metal Mobility in Dredged Sediments: Porewater Analysis, Single and Sequential Extractions. Soil Sedim. Cont. 2006, 15, 1–18. [Google Scholar] [CrossRef]
  22. Sihlahla, M.; Mouri, H.; Nomngongo, P.N. Assessment of bioavailability and mobility of major and trace elements in agricultural soils collected in Port St Johns, Eastern Cape, South Africa using single extraction procedures and pseudo-total digestion. J. Environ. Health Sci. Eng. 2020, 18, 1615–1628. [Google Scholar] [CrossRef]
  23. Sakan, S.; Popović, A.; Škrivanj, S.; Sakan, N.; Đorđević, D. Comparison of single extraction procedures and the application of an index for the assessment of heavy metal bioavailability in river sediments. Environ. Sci. Pollut. Res. 2016, 23, 21485–21500. [Google Scholar] [CrossRef]
  24. Šestinová, O.; Hančuľák, J.; Brehuv, J.; Fedorová, E. The mobility of heavy metals in sediments using the sequential extraction method. In Proceedings of the Conference Materials, 4th European Conference Bioremediation, Chania Crete, Greece, 3–6 September 2008. [Google Scholar]
  25. Šmejkalová, M.; Mikanová, O.; Borůvka, L. Effects of heavy metal concentrations on biological activity of soil micro-organisms. Plant Soil Environ. 2003, 49, 321–326. [Google Scholar] [CrossRef]
  26. Qu, C.; Li, B.; Wu, H.; Wang, S.; Li, F. Probabilistic ecological risk assessment of heavy metals in sediments from China’s major aquatic bodies. Stoch. Environ. Res. Risk Assess. 2016, 30, 271–282. [Google Scholar] [CrossRef]
  27. Wu, H.; Li, B.; Qu, C.; Wang, S.; Wan, W.; Zhou, J. A Method for Determining Ecological Risks of Heavy Metal Pollution in River and Lake Sediments. U.S. Patent 20160110835A1, 21 April 2016. [Google Scholar]
  28. Håkanson, L. An ecological risk index for aquatic pollution control. A sedimentological approach. Water Res. 1980, 14, 975–1001. [Google Scholar] [CrossRef]
  29. Yang, Z.; Wang, Y.; Shen, Z.; Niu, J.; Tang, Z. Distribution and speciation of heavy metals in sediments from the mainstream, tributaries, and lakes of the Yangtze river catchment of Wuhan, China. J. Hazard. Mater. 2009, 166, 1186–1194. [Google Scholar] [CrossRef] [PubMed]
  30. Pavlů, L.; Drábek, O.; Borůvka, L.; Nikodem, A.; Němeček, K. Degradation of forest soils in the vicinity of an industrial zone. Soil Water Res. 2015, 10, 65–73. [Google Scholar] [CrossRef] [Green Version]
  31. Carter, M.R. Soil Sampling and Methods of Analysis; Lewis Publishers: Boca Raton, FL, USA; Canadian Society of Soil Science: Pinawa, MB, Canada, 1993. [Google Scholar]
  32. Podlesáková, E.; Nemecek, J.; Vácha, R. Mobility and Bioavailability of Trace Elements in Soils. In Trace Elements in Soil: Bioavailability, Flux, and Transfer; Iskandar, I.K., Kirkham, M.B., Eds.; Lewis Publishers: Boca Raton, FL, USA, 2001. [Google Scholar]
  33. Sabienë, N.; Brazauskienë, D.M.; Rimmer, D. Determination of heavy metal mobile forms by different extraction methods. Ekologija 2004, 1, 36–41. [Google Scholar]
Figure 1. Sampling locations.
Water 13 01411 g001
Figure 2. Extracted element contents (Al, As, Ba, Be, Cd, Ca, Co, Cr, Cu, Fe, K, and Li) using different reagents: CaC—calcium chloride; AA—ammonium acetate; NA—nitric acid; BCR—total element content (extracted element using BCR extraction procedure).
Water 13 01411 g002
Figure 3. Extracted element contents (Mg, Mn, Na, Ni, P, Pb, S, Si, Sr, Ti, V, and Zn) using different reagents: CaC—calcium chloride; AA—ammonium acetate; NA—nitric acid; BCR—total element content (extracted element using BCR extraction procedure).
Water 13 01411 g003
Figure 4. Distribution curve and exceedance probability curves of the risk index (RI) and total ecological risk comprehensive index HRI based on a Monte Carlo simulation run 100,000 times. Local backgrounds are the reference values for the calculation of Eri.
Water 13 01411 g004
Table 1. Sampling locations.
NumberLabelFraction (μm)Clarification of the Locality
1DN-2<63Dobra River, upper course, only about 5 km downstream from the source, between the villages of Gornja and Donja Dobra
2<63the river Kupica, approximately 1.5 km upstream from its confluence with the Kupa
3K-4<63Kupa River in Ozalj, right bank, just below the dam of the Ozalj hydroelectric power plant
4K-2<63Kupa River in Jurovo, right bank, about 250 m upstream from the mouth of the river Lahinja
538<63Kupa River in the settlement Sunčani brijeg, about 500 m downstream, left bank
6ČD<63Kupa River, right bank, the village of Čedanj, located approximately 5 km downstream from Brod na Kupi
744<63Kupa River, Sisak, right bank, about 2 km before the confluence of the Odra and Kupa
851<63Kupica River in Brod na Kupi, just before the confluence with the Kupa River
963–2000Kupica River, approximately 1.5 km upstream from its confluence with the Kupa River
104463–2000Kupa River, Sisak, Zibel beach, right bank, about 2 km before the confluence of the Odra and Kupa
114563–2000Kupa River, Letovanić, left bank
12K-263–2000Kupa River in Jurovo, right bank, about 250 m upstream from Lahinja River inflow
135163–2000Kupica River in Brod na Kupi, just before the confluence with the Kupa River
14K-563–2000Kupa River, Jakovci Netretićki, in the part where Kupa passes from its upper to middle course, was sampled from the right bank near the waterfall below the village
15K-963–2000Kupa River, between the villages of Levkušje and Zorkovac, right bank, about 3.5 km upstream from the Dobra River inflow
163863–2000Kupa River in the settlement Sunčani breg, about 500 m downstream, left bank
175263–2000Kupa River in Brod na Kupi, right bank, sample taken about 100 m upstream from the mouth of the Kupica River
18ČD63–2000Kupa River, right bank, the village of Čedanj, located approximately 5 km downstream from Brod na Kupi
192863–2000Kupa River, Donja Rečica, left bank, on the location right across from Brođani
204163–2000Kupa River, Petrinja, town beach, 800 m downstream from the bridge on the main road from Petrinja to Zagreb, right bank
214963–2000Kupa River, the upper course of the Kupa in Gorski Kotar, about 1 km upstream from the village of Severin na Kupi
222963–2000Kupa River, Zamršlje, about 7 km downstream from point 28
233663–2000Kupa River, Lijevo Sredičko, left bank, lower course, 12 km upstream from Pokupsko
24K-463–2000Kupa River in Ozalj, right bank, just below the dam of the Ozalj hydroelectric power plant
25DN-263–2000Dobra River, upper course, only about 5 km downstream from the source, between the villages of Gornja and Donja Dobra
Table 2. Comparison of calcium chloride extractable element content-obtained and indicative values of BCR-483 certified reference material.
CdCrCuNiPbZn
Obtained0.48 ± 0.030.41 ± 0.061.4 ± 0.11.6 ± 0.1BDL 18.1 ± 0.5
Indicative0.45 ± 0.050.35 ± 0.091.2 ± 0.41.4 ± 0.2<0.068.3 ± 0.7
Recovery106.7%117.1%116.7%114.3%/97.6%
1 Below detection limit by ICP OES.
Table 3. Statistical analysis of elements’ contents (Al, As, Ba, Be, Ca, Cd, Co, Cr, Cu, Fe, K, and Li).
Fraction: <63 μmFraction: 63–2000 μm
[mg kg−1]CaC 1AANABCRCaCAANABCR
AlAl
Mean0.0921.6091498360.1400.802553791
Max0.1446.55120011,8650.7723.954187659
Min0.0230.3552262520.0050.211191206
AsAs
Mean<BDL 2<BDL0.9696.40<BDL<BDL0.3353.93
Max<BDL<BDL1.74010.700.004<BDL0.7349.60
Min<BDL<BDL0.5682.64<BDL<BDL0.1711.92
BaBa
Mean0.73391.5974.13447.10.39022.3916.9046.7
Max1.430143.00137.431347.00.83347.3039.15210.0
Min0.27037.4031.4163.90.1257.894.449.8
BeBe
Mean<BDL<BDL0.3150.89<BDL<BDL0.1070.37
Max<BDL0.0020.4331.11<BDL0.0040.2020.82
Min<BDL<BDL0.1890.56<BDL<BDL0.0530.13
CaCa
Mean/10,45738,11039,469/749833,83437,257
Max/13,62876,46078,479/12,31364,67286,503
Min/368611,49812,026/107470198604
CdCd
Mean<BDL0.0630.2130.43<BDL0.0170.0730.19
Max0.0010.1180.3100.590.0010.0480.1630.35
Min<BDL0.0420.1390.26<BDL<BDL0.0410.10
CoCo
Mean0.0010.0183.759.470.0020.0061.364.33
Max0.0030.0335.0012.700.0170.0162.988.21
Min<BDL0.0112.085.52<BDL<BDL0.722.28
CrCr
Mean<BDL<BDL4.5825.70<BDL<BDL1.8410.32
Max0.001<BDL27.0065.500.002<BDL14.6129.30
Min<BDL<BDL0.7112.40<BDL<BDL0.014.12
CuCu
Mean0.0110.46617.118.50.0050.36012.68.1
Max0.0150.55228.326.20.0111.42022.914.9
Min0.0060.34710.110.2<BDL0.1883.62.9
FeFe
Mean0.1902.16290327,9030.2751.13126715,019
Max0.3075.99420839,1451.0903.41208234,941
Min0.067<BDL209120,3140.040<BDL6814092
KK
Mean2.2578.8122.2723.50.7621.344.8269.0
Max2.61105.0152.3930.01.8755.770.3510.0
Min1.6665.288.1482.00.279.614.877.9
LiLi
Mean<BDL0.0705.7025.01<BDL0.0274.9114.27
Max<BDL0.09410.4229.40<BDL0.0398.5025.50
Min<BDL0.0412.4718.00<BDL0.0171.373.93
1 CaC—calcium chloride; AA—ammonium acetate; NA—nitric acid; BCR—total element content; 2 BDL—below detection limit.
Table 4. Statistical analysis of elements’ contents (Mg, Mn, Na, Ni, P, Pb, S, Si, Sr, Ti, V, and Zn).
Fraction: <63 μmFraction: 63–2000 μm
[mg kg−1]CaC 1AANABCRCaCAANABCR
MgMg
Mean37.05036468907220.217810,23310,578
Max73.889110,15211,50256.535523,94327,520
Min17.6339324049494.77411231455
MnMn
Mean0.6824.62314570.8511.1101286
Max1.2354.24238812.7222.0321946
Min0.0810.9691640.123.03083
NaNa
Mean2.8748.845.4105.50.6616.720.648.5
Max5.6487.773.5159.01.1626.034.469.6
Min1.4829.831.164.00.4310.98.918.6
NiNi
Mean0.0040.2224.3023.290.0070.0821.329.47
Max0.0100.3306.0031.500.0350.1252.3318.00
Min0.0020.1411.9313.400.0000.0420.594.11
PP
Mean0.0816.64216.258170.0312.1288.82877
Max0.13713.00260.869990.1479.86154.54635
Min0.0150.00180.04414<BDL 20.0045.41058
PbPb
Mean<BDL<BDL11.4522.78<BDL<BDL3.268.21
Max<BDL<BDL15.6531.80<BDL<BDL5.4220.80
Min<BDL<BDL5.4710.60<BDL<BDL1.572.89
SS
Mean8.08100.5195.93643.0234.8228.0123
Max18.40230.00187.860015.60163.00112.5656
Min3.2641.7032.81580.366.215.235
SiSi
Mean6.24101.173015852.1117.7245739
Max7.93165.087421154.3257.94581531
Min4.4354.356611111.005.6128393
SrSr
Mean0.1049.2716.4024.590.0085.1210.9414.16
Max0.25314.4027.1537.200.07310.2018.4931.80
Min0.0114.876.5910.10<BDL1.292.814.35
TiTi
Mean<BDL<BDL5.0676.060.0040.0132.8953.85
Max0.0010.0037.87104.000.0530.2298.36100.00
Min<BDL<BDL3.4249.30<BDL<BDL0.8227.40
VV
Mean0.0010.0412.1319.21<BDL0.0240.838.84
Max0.0030.1043.1325.000.0020.0731.5114.60
Min<BDL0.0181.2011.90<BDL0.0030.484.91
ZnZn
Mean0.0020.55719.0860.960.0070.3586.6826.65
Max0.0080.90428.0785.350.0911.00012.8656.26
Min<BDL0.23813.0237.49<BDL0.0543.268.52
1 CaC—calcium chloride; AA—ammonium acetate; NA—nitric acid; BCR—total element content; 2 BDL—below detection limit.
Table 5. Ratio: content of elements extracted with 2 M HNO3/total extracted element contents (BCR extraction) * 100 (%).
<63 μm63–2000 μm
MeanMaxMinMeanMaxMin
Zn60.9585.3037.5026.6556.308.52
Al9.2511.007.957.5813.904.66
As16.3627.849.919.8918.303.02
Ba26.1349.1510.2042.7158.8718.64
Be35.6344.2129.6632.2952.8717.42
Ca96.84108.7686.8093.41114.4070.37
Cd49.4459.3340.3939.2967.7017.62
Co39.2443.5634.1732.2346.4721.49
Cu111.50244.7938.60142.28278.0028.00
Fe10.6713.507.9210.7430.493.83
K17.2620.1112.7518.7732.5410.99
Li23.7741.849.0037.6068.239.79
Mg70.7988.2659.82100.37219.0866.61
Mn50.1256.7941.8939.6362.4322.70
Na43.2552.8435.2145.1571.4223.13
Ni17.9920.6314.4114.5121.4710.11
Pb50.2853.1547.2546.10108.1920.19
S25.9138.9614.2624.8855.306.09
Si46.7452.2938.3134.7357.1317.86
Sr65.7976.7344.9179.09109.3858.15
Ti6.7410.164.455.4613.131.62
V10.9313.728.589.8015.574.83
P3.764.322.683.264.812.08
Cr11.2241.223.6011.8749.850.07
Table 6. Comparison of extracted elements content in this research with similar investigations [mg kg−1].
PbNiCuCrCdZn
1 CaC<BDL0.0040.011<BDL<BDL0.002
AA<BDL0.2220.466<BDL0.0630.557
NA11.454.3017.14.580.21319.08
BCR22.7823.2918.525.700.4360.96
2 CaC6.830.130.154.4 30.7 3<BDL
2 PTC291710611.04.08.2
4 CaC<BDL-5974 3nd101–5589 3nd27–932 30.22–217
1 This study (fraction of studied sediment: <63 µm); CaC—calcium chloride; AA—ammonium acetate; NA—nitric acid; BCR—total element content; 2 PTC-pseudo total content (aqua regia) [11]. 3 µg kg−1; 4 Pueyo [12]; nd—not detected; BDL—below detection limit.
Table 7. Correlation analysis of extracted element contents.
E_AAE_NAE_BCR
1E_CaCBa **, K **, Mg **, Na **, P **, S **, Si **, Sr **Ba **, K **, Na **, P *, S **, Si **, Sr *Ba **, Cu *, K **, Mn *, Na **, Si **, Sr **
E_AA Al *, Ba **, Cd **, Co *, Fe *, K **, Mn **, Na **, Ni **, S **, Si **, Sr *Al *, Ba **, Cd **, K **, Li **, Na **, Ni **, S **, Si **, Sr *, Ti *, V *
E_NA Al **, As **, Ba **, Be **, Ca **, Cd **, Co **, Cr **, Fe **, K **, Mg **, Mn **, Na **, Ni **, P **, Pb **, S **, Si **, Sr **, Ti **, V **, Zn **
1 E—element; CaC—calcium chloride; AA—ammonium acetate; NA—nitric acid; BCR—total element content; * Correlation is significant at the 0.05 level; ** Correlation is significant at the 0.01 level.
Table 8. Ecological risk analysis results of each PTEs.
Value of EriRisk LevelProbability (%)
AsCdCrCuNiPbZn
Eri < 40
40 ≤ Eri < 80
80 ≤ Eri < 160
160 ≤ Eri < 320
Eri ≥ 320
Low94.0719.98100100100100100
Lower5.9378.9300000
Median01.0900000
High0000000
Extremely high0000000
Table 9. Total ecological risk analysis results of the studied rivers.
HRI ValueRisk LevelProbability (%)
HRI < 150Low100
150 ≤ HRI < 300Lower0
300 ≤ Eri < 600Median0
Eri ≥ 600High0
Publisher’s Note: MDPI stays neutral with regard to jurisdictional claims in published maps and institutional affiliations.

