Article

Identification of Extreme Weather Events Using Meteorological and Hydrological Indicators in the Laborec River Catchment, Slovakia

by
Katarzyna Kubiak-Wójcicka
1,
Patrik Nagy
2,
Martina Zeleňáková
2,*,
Helena Hlavatá
3 and
Hany F. Abd-Elhamid
4,5
1
Department of Hydrology and Water Management, Faculty of Earth Sciences and Spatial Management, Nicolaus Copernicus University, Lwowska 1, 87-100 Toruń, Poland
2
Department of Environmental Engineering, Faculty of Civil Engineering, Technical University of Košice, 04200 Košice, Slovakia
3
Slovak Hydrometeorological Institute, Branch Office Košice, 04117 Košice, Slovakia
4
Department of Water and Water Structures Engineering, Faculty of Engineering, Zagazig University, Zagazig 44519, Egypt
5
Center for Research and Innovation in Construction, Faculty of Civil Engineering, Technical University of Košice, 04200 Košice, Slovakia
*
Author to whom correspondence should be addressed.
Water 2021, 13(10), 1413; https://doi.org/10.3390/w13101413
Submission received: 6 April 2021 / Revised: 27 April 2021 / Accepted: 14 May 2021 / Published: 18 May 2021
(This article belongs to the Special Issue Assessment and Management of Flood Risk in Urban Areas)

Abstract

:
This study used the standardized precipitation index (SPI) and the standardized runoff index (SRI) to analyze dry and humid conditions in the hill-country catchment area of the Laborec River (Slovakia) over a period of 50 years (1970–2019). Analysis of the SPI and SRI over various time scales showed the occurrence of wet periods (index > 1.0) that were associated with precipitation exceeding the long-term norm, and dry periods (index below −1.0), which were the result of small amounts of precipitation. Analysis of the correlation between the SPI and SRI on different time scales revealed that the catchment showed a weaker response to precipitation over short time scales (1 and 3 months) and a stronger response over longer accumulation periods (6, 9, and 12 months). The highest annual correlation coefficient (r = 0.72) was recorded between SRI-6 at the Humenne hydrometric station and SPI-9 at the Medzilaborce meteorological station in the upper part of the catchment area. The strongest annual correlation (r = 0.69) was obtained between the Izkovce and Kamenica stations in the lower part of the catchment area. As shown by the cross-relationships examined over different periods of accumulation of flows and precipitation, hydrological droughts appeared as a result of the occurrence of meteorological droughts with a three-month delay. The conducted analysis showed that in the case of the Laborec river catchment area, there was a strong correlation between the occurrence of meteorological drought and hydrological drought.

1. Introduction

Extreme climatic events and their effects on the natural and social environment have become the most frequently discussed research problem in recent years. This is largely related to the serious impact of these phenomena on the functioning of people and the environment [1,2,3]. Europe has experienced numerous floods and droughts in recent years as a result of excesses and shortages of precipitation, contributing to significant economic losses. Between 1980 and 2019, extreme weather and climate events accounted for around 81% of the total economic loss due to natural hazards in the European Environment Agency member countries, amounting to EUR 446 billion, with the most expensive extreme climatic events being floods and droughts [4]. Moreover, the latest projections related to climate change predicted that the frequency of these events will increase significantly on a global scale [5]. The problem of climate change and its hydrological consequences is characterized by extreme complexity (spatial and temporal) and the use of many different definitions, methodologies, models, and tools, leading to a heterogeneous view of the changes. More and more research is focused on the integration of meteorological and hydrological indicators, which allows for the variability of river runoff to be determined under the influence of climatic variability [6,7,8]. The application of universal indicators, which are used to establish a comprehensive information system on the hydrological regime of rivers in combination with climatic conditions will enable a better understanding of the scale of the changes, taking into account local conditions of the water cycle and comparing them from a regional perspective. These universal indicators include standardized indices for meteorological indicators that have been adapted to assess hydrological conditions. The adopted indicators have been used to identify periods with an excess or shortage of water within specific catchment areas to determine their intensity and forecast changes in the future [9,10]. Studies on the relationship between meteorological and hydrological indicators have been widely used in various areas [11,12,13,14,15,16,17,18,19]. Many comparative analyses have been carried out that focused on linking drought indicators to the types of drought to enable a more comprehensive understanding of the relationship between different types of drought [7,20,21,22,23,24,25,26].
The analysis of meteorological conditions using various standardized meteorological indicators has been performed for Slovakia [27,28]. Research on the relationship between meteorological and hydrological conditions using standardized meteorological and hydrological indicators in selected catchments in Slovakia was conducted by different researchers [29,30,31]. The course and intensity of meteorological phenomena and their impact on hydrological conditions in the catchment areas of Slovak rivers vary in nature. Despite the fact that on the scale of the whole European continent, the changes are invisible, from the point of view of local conditions, they have a decisive impact on the water resources of a given region. A particularly important issue is the identification and course of floods and droughts in both agricultural and urbanized areas. Knowledge of the course of extreme events within a given region contributes to a better understanding of the problem, as well as effective management of water resources and implementation of actions to adapt to the forecasted effects of climate change [32,33].
This research was devoted to the use of standardized indicators—the standardized precipitation index (SPI) and the standardized flow index (SRI)—to calculate the frequency of dry and wet periods in the Laborec river catchment, Slovakia, during the period from 1970 to 2019.

2. Materials and Methods
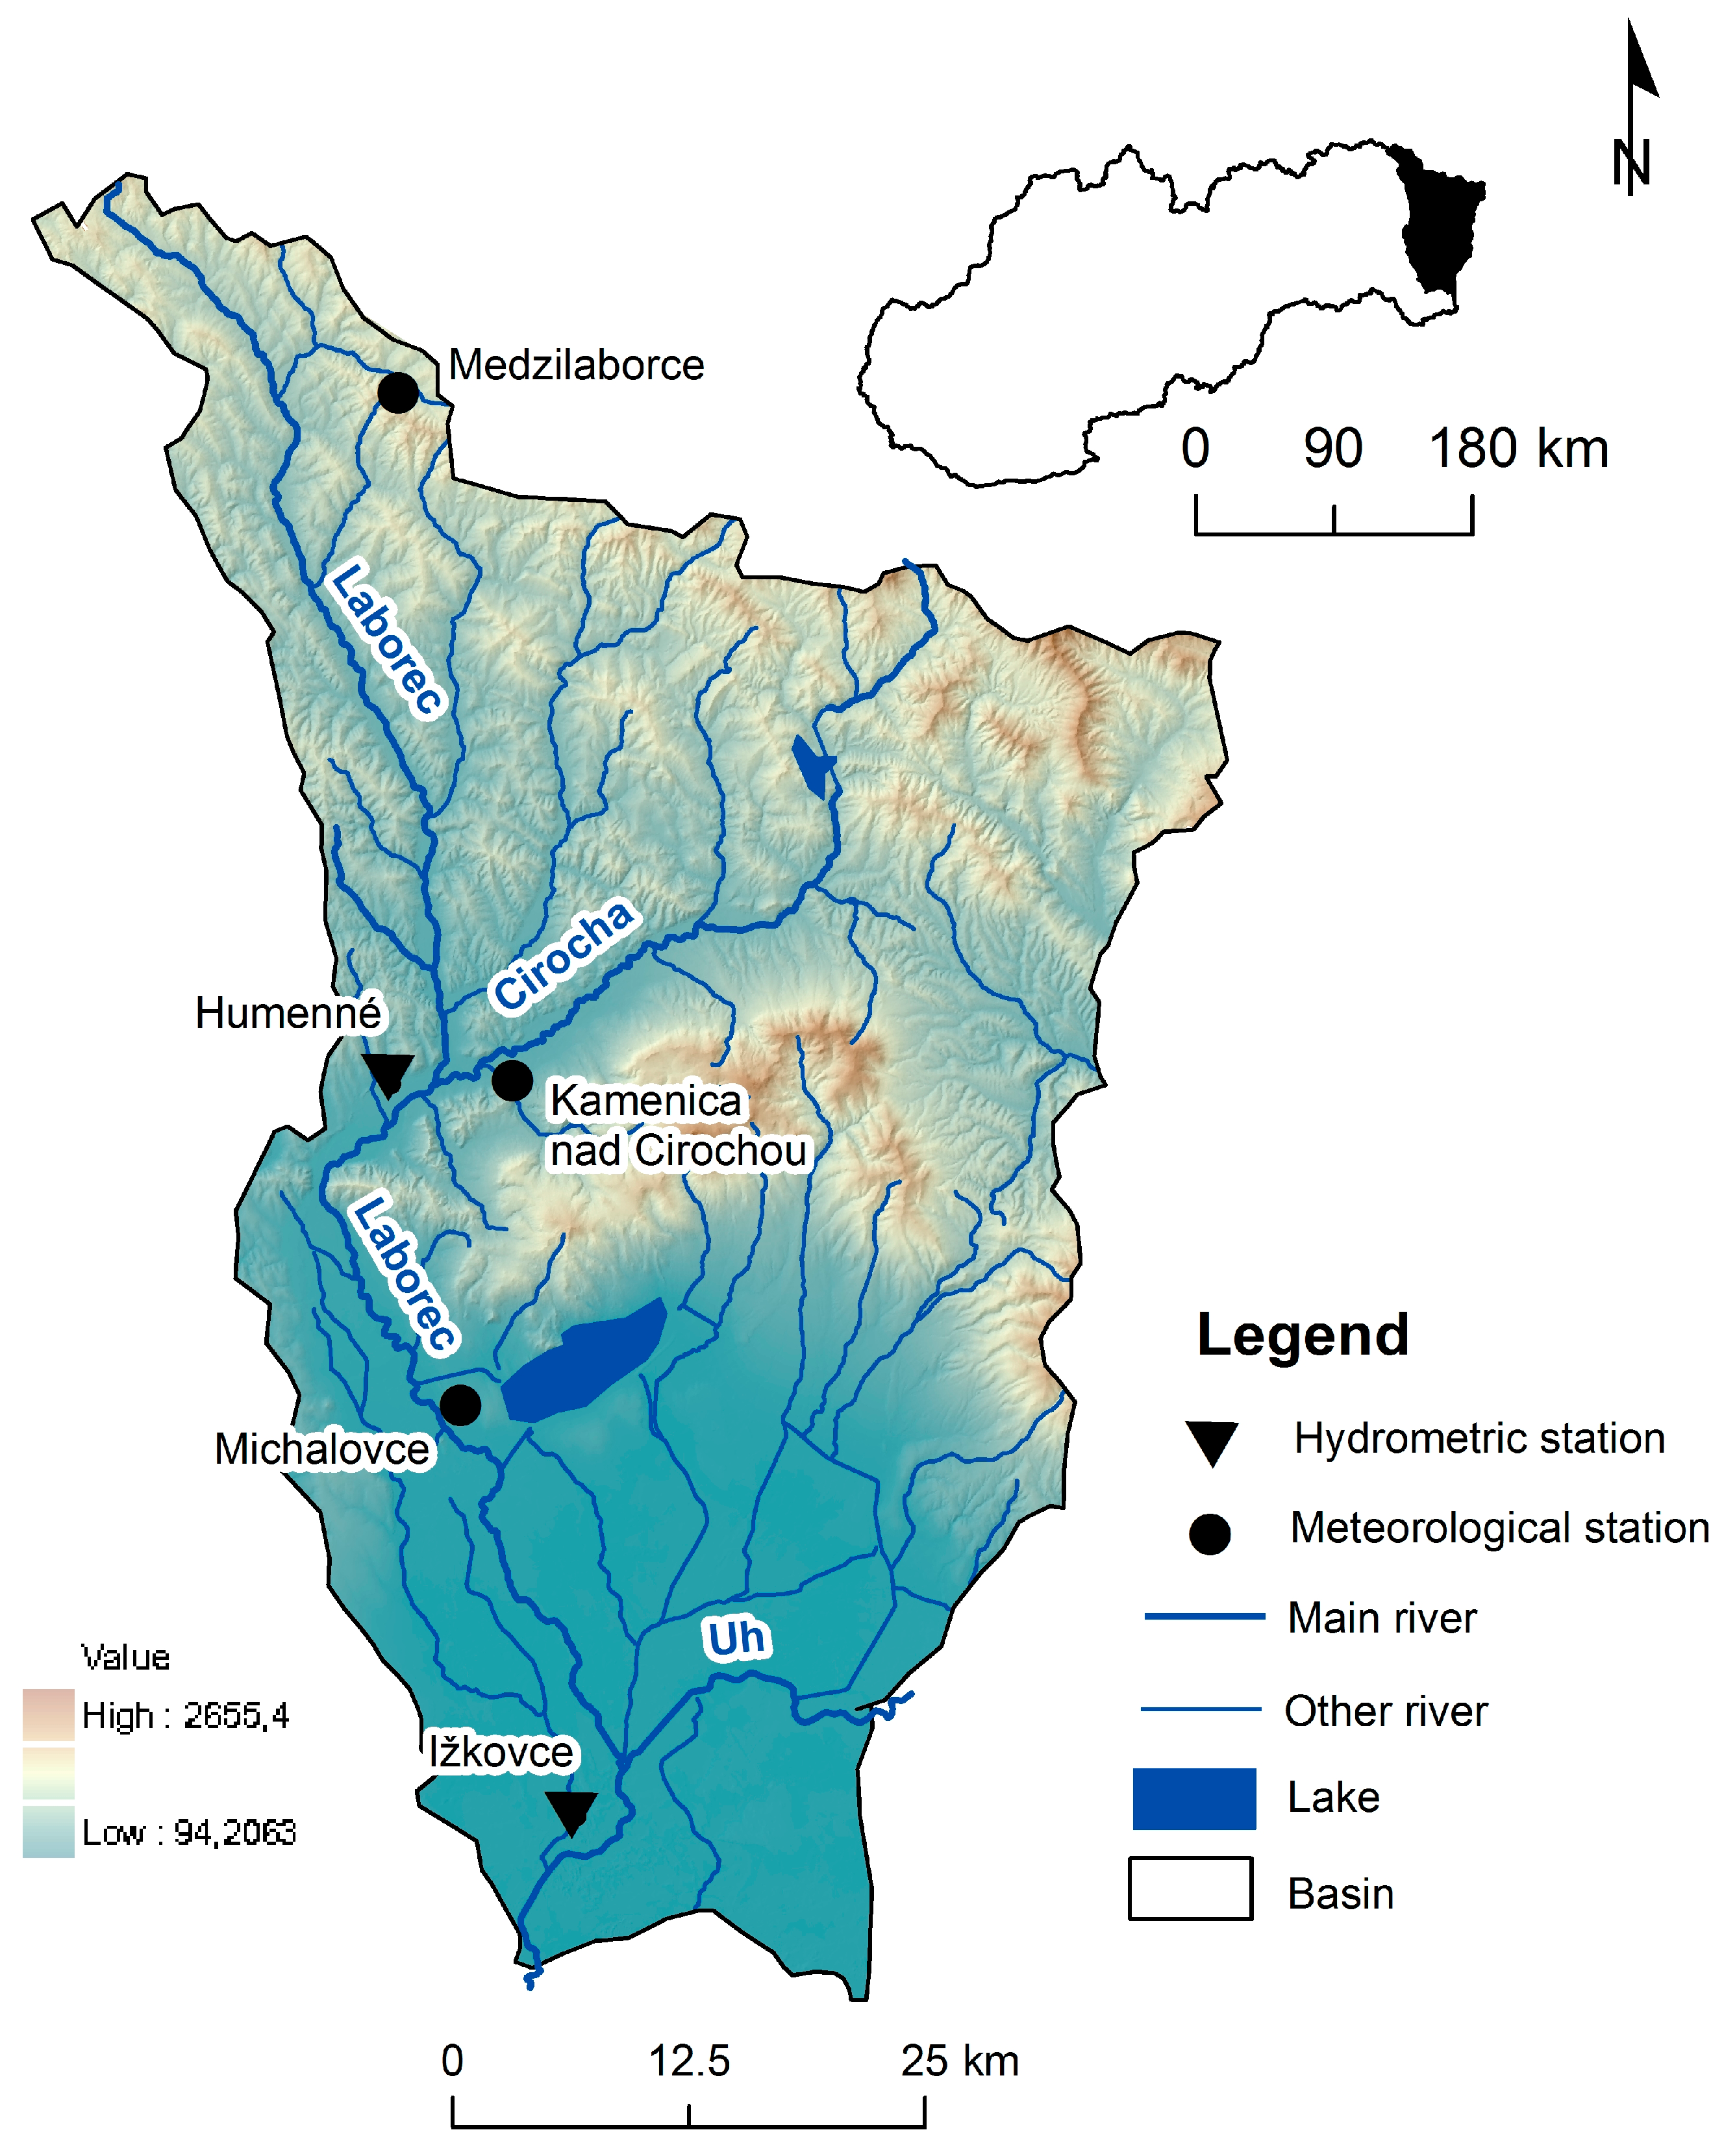
2.1. Study Area

The study focused on the Laborec River catchment area in eastern Slovakia. The Laborec is a tributary of the Bodrog River. It is a hill-country river that is 129 km long. The catchment area is 4522 km2. The terrain elevation is 580 m a.s.l., while the average elevation is at 675.5 m a.s.l. The most important tributaries of the Laborec include the Cirocha and Uh rivers. The Cirocha drains the northeastern part of the catchment area and flows into the Laborec above the Humenne station. The Uh flows into the Laborec in its lower reaches. The length of this river is 126.5 km, 105.3 km of which is in Ukraine and 21.3 km is in Slovakia. About 61% of the Uh catchment area is located in Ukraine and 39% is in Slovakia. Figure 1 shows the location map of the study area.
Over 48% of the Laborec catchment is covered in forests. Urban areas within the catchment constitute only a small share of the area: 4.33% consists of compact and loose urbanized areas, whereas agricultural land accounts for about 33.3% (Corine Land Cover).

2.2. Data and Methods

To characterize the meteorological conditions, precipitation data were used from three meteorological stations: Kamenica nad Cirochou, Medzilaborce, and Michalovce. The hydrological conditions were examined based on the volume of the Laborec river flows at two hydrological stations: Humenne and Izkovce (Figure 1). The data came from the Slovak Hydrometeorological Institute (SHMI) in Bratislava, which is responsible for the quality control, homogenization, and data preparation for the end user according to World Health Organization (WHO) standards. The data analysis was carried out in relation to the hydrological year, which in Slovakia lasts from 1 November to 31 October of the following year. Based on the daily values, monthly and annual mean values for the period 1970–2019 were calculated. The data were statistically analyzed with regard to the determination of data homogeneity and trend detection.
In order to identify extreme events, two indicators were used: standardized precipitation index (SPI) and standardized runoff index (SRI). The SPI was developed by McKee et al. [34] to assess meteorological drought and has been used by many authors [35,36,37]. The SRI was developed on the basis of the SPI concept for the characteristics of hydrological drought [38,39,40,41,42]. The calculations of the indicators were made according to the following formula:
Z = f ( X ) μ ^ δ ^
where Z—chosen index (SPI or SRI, where P—precipitation and R—runoff), f(X)—transformed sums of precipitation (P) and runoff (R), μ ^ —mean of normalized X, and δ ^ —standard deviation of the normalized X.
The values of the SPI and SRI are the standard deviation of precipitation and flows from the median value in the multi-year period. In the study, matching the normal distributions of homogenous series of precipitation P-1 was achieved with the use of the transformation function f(P) = P 3 [43]. In the case of calculating SRI-1, for the purposes of the normalization function, a two-parameter logarithmic function was used [8,21,43]. The detailed calculation method is presented in the study by Bąk and Kubiak-Wójcicka [44]. To calculate the SPI and SRI values for different time scales (n months), it was necessary to obtain values for the accumulation of precipitations or flows for each month and n months. In total, five different time series were analyzed, i.e., 1, 3, 6, 9, and 12 months. The index values defined the deviation from the median expressed in standard deviation units. The proposed approach was based on the assessment of water resources under different hydroclimatic conditions and the determination of different intensity classes. Extreme events were identified when the value of the index was above 1.0 or below −1.0, indicating wet periods and droughts, respectively. Depending on the obtained values, droughts were classified according to the adopted categories given in Table 1. Dry and wet periods were characterized with the following parameters: duration expressed in the number of months (D), size of the drought area (DM), and the intensity (I).
Based on the Pearson correlation coefficient, the SPI and SRI were compared for different periods of accumulation. In cases where the correlation coefficient was above 0.7, it was assumed to be a strong relationship.

2.3. Trend Analysis

The non-parametric Mann–Kendall test [45,46], which is widely applied in hydrological analysis, was used to track changes in the river flow trends. The Mann–Kendall Z statistic and the slope β expressed using the Theil–Sen estimator [47,48] were calculated for periods covering every possible combination of the starting and ending years for the multiannual period studied. The 30-year period used in hydrological calculations was assumed as the minimum length of the calculation period [49,50].
The Mann–Kendall S statistic was calculated using the following formula:
S = k = 1 n 1   j = k + 1 n     sgn ( x j x k )
sgn ( x j x k ) = { = 1   if   ( x j x k ) > 0 0   if   ( x j x k ) = 0 1   if   ( x j x k ) < 0
where xj and xk—values of the variable in individual years j and k, where j > k; n—number of years.
The S statistic shows a tendency to move quickly toward normality, and for n > 10, this statistic has an approximately normal distribution with an average of 0 and a variance described by the following formula:
Var ( S ) = [ n ( n 1 ) ( 2 n + 5 ) ] / 18
The normalized test Z statistic was calculated using the following formula:
Z = { S 1 Var ( S )   if   S > 0     0   if   S = 0   S + 1 Var ( S )   if   S < 0
In the Mann–Kendall test, the null hypothesis is that there is no significant trend in the data series. The trend is significant if the null hypothesis cannot be accepted. The acceptance region at the significance level α = 0.05 defines the range −1.96 ≤ Z ≤ 1.96 (no significant trend), while the rejection region is given by Z < −1.96 (significant downward trend) and Z > 1.96 (significant upward trend), where Z is the normalized test statistic.
The slope β expressed by the Theil–Sen estimator (β) was calculated using the following formula:
β = Median ( ( x j x k ) / ( j k ) )

3. Results

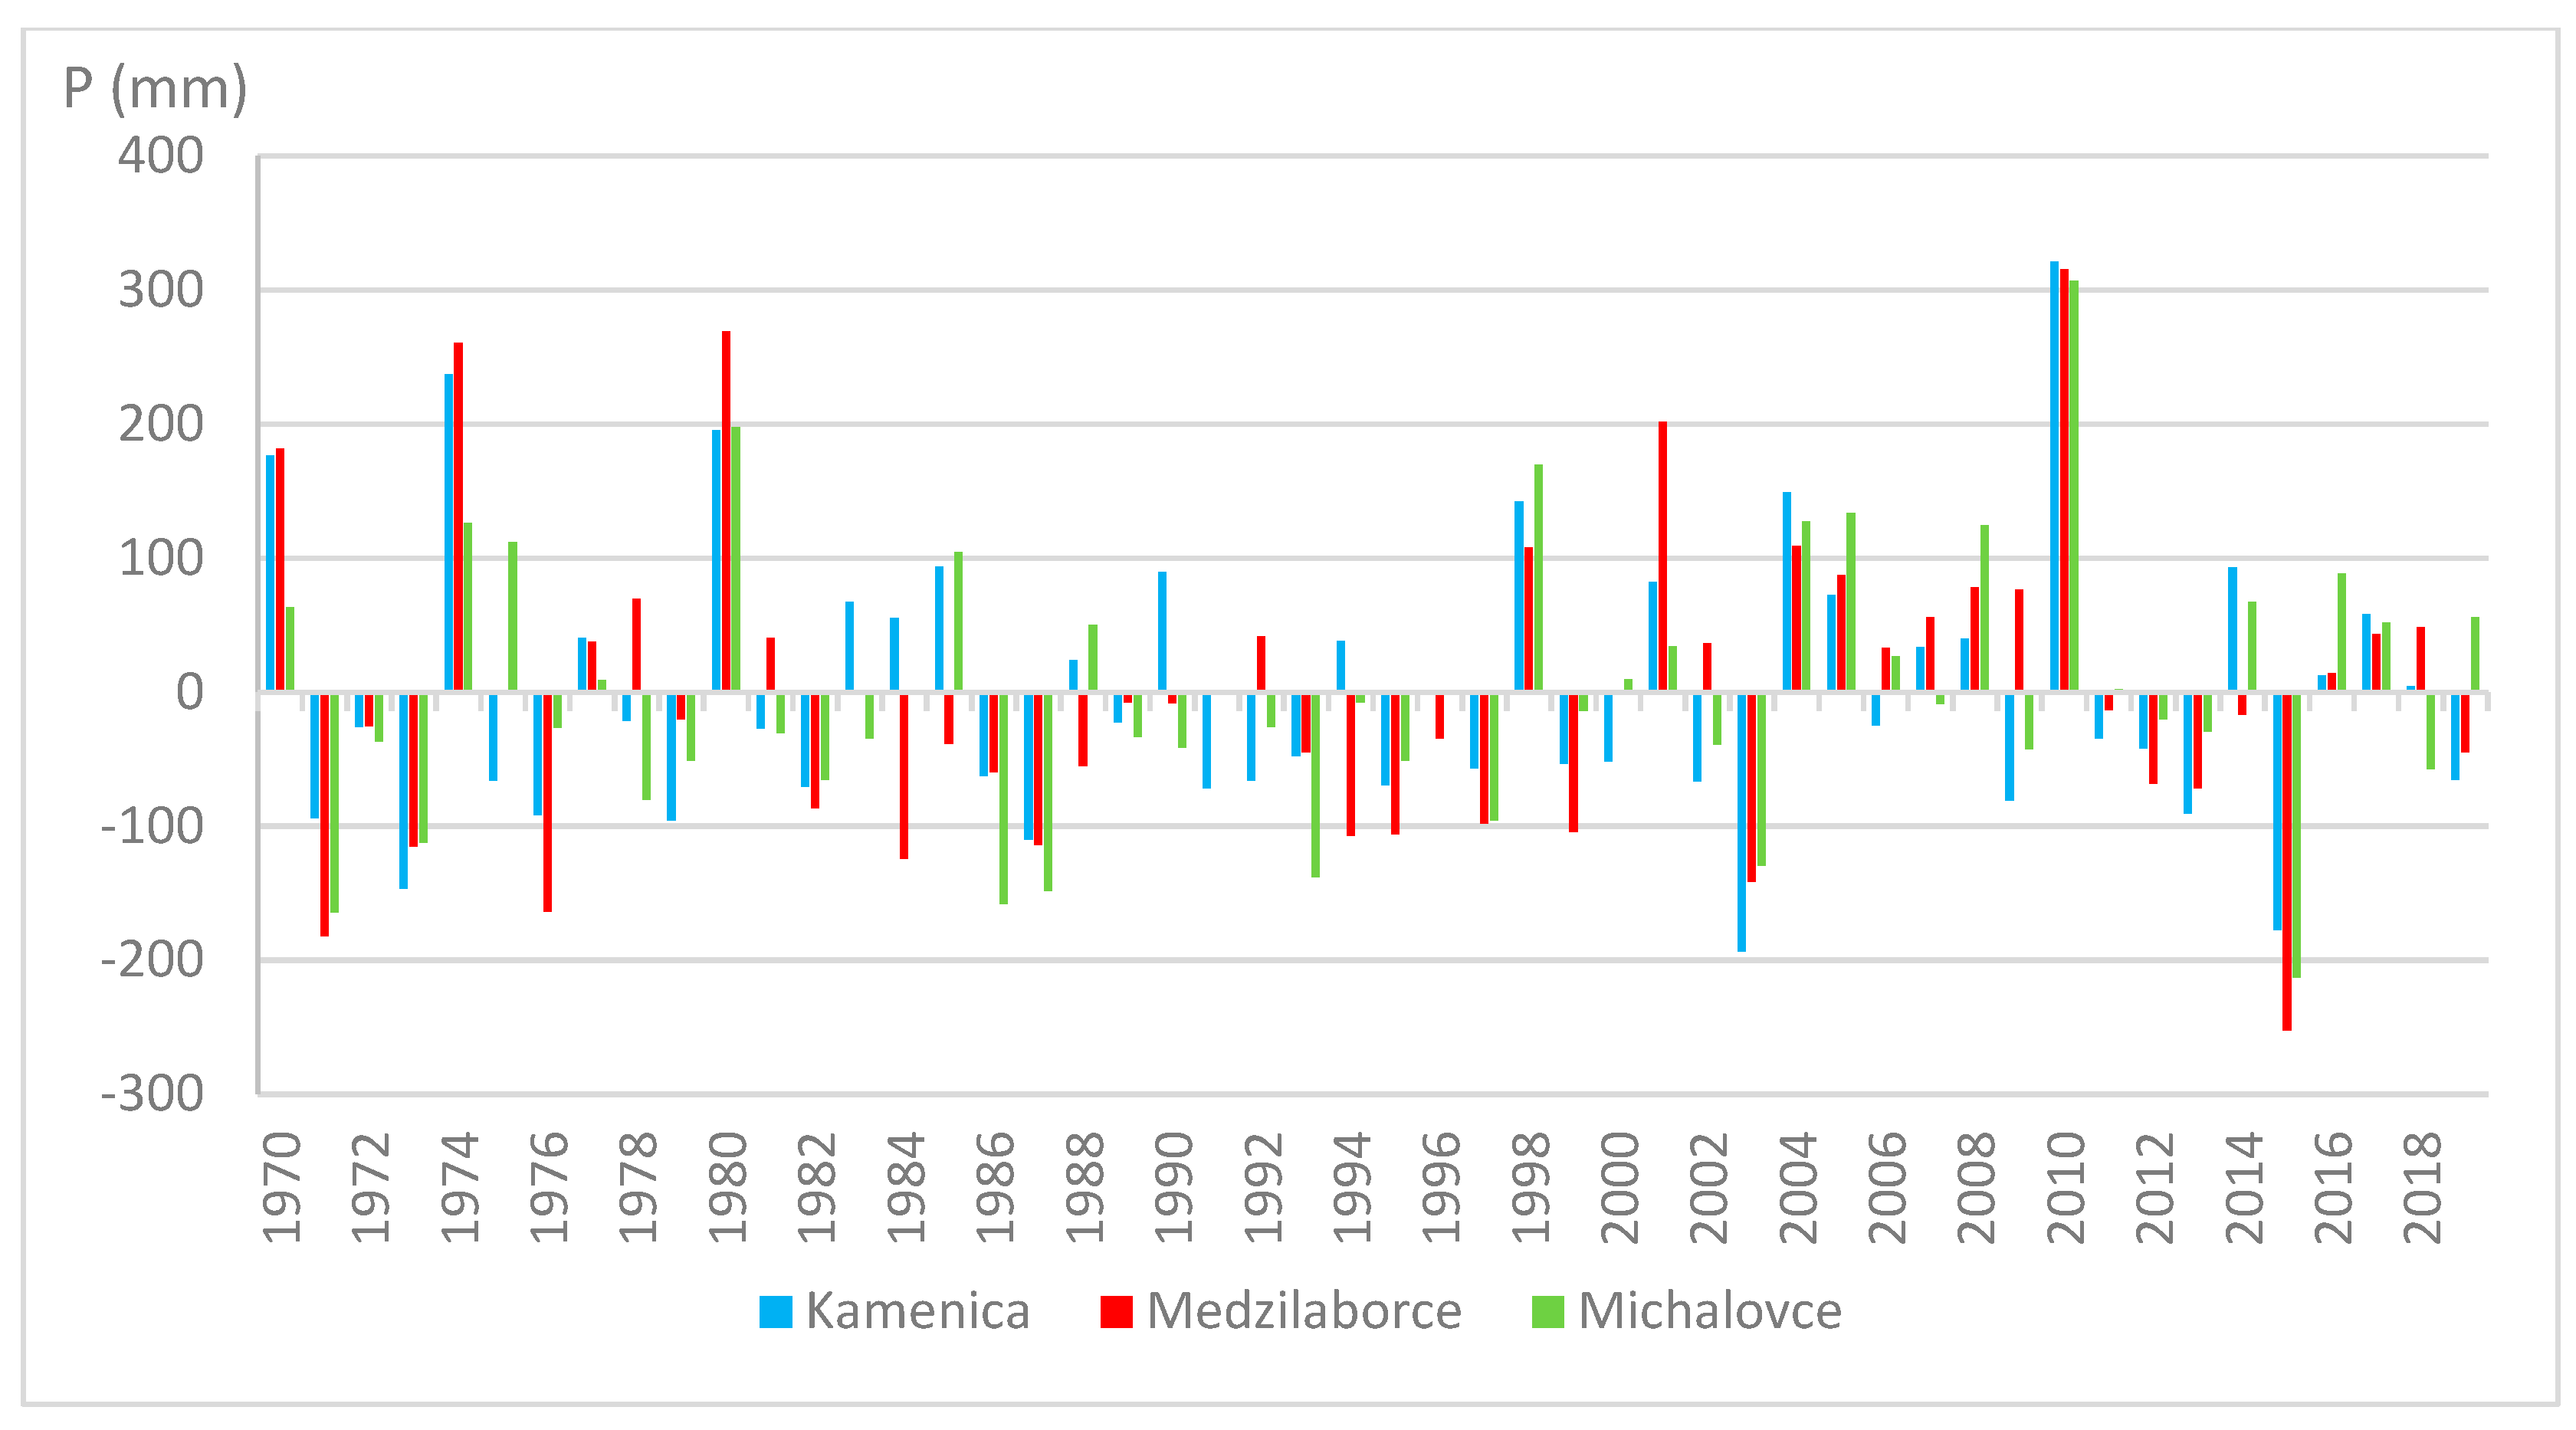
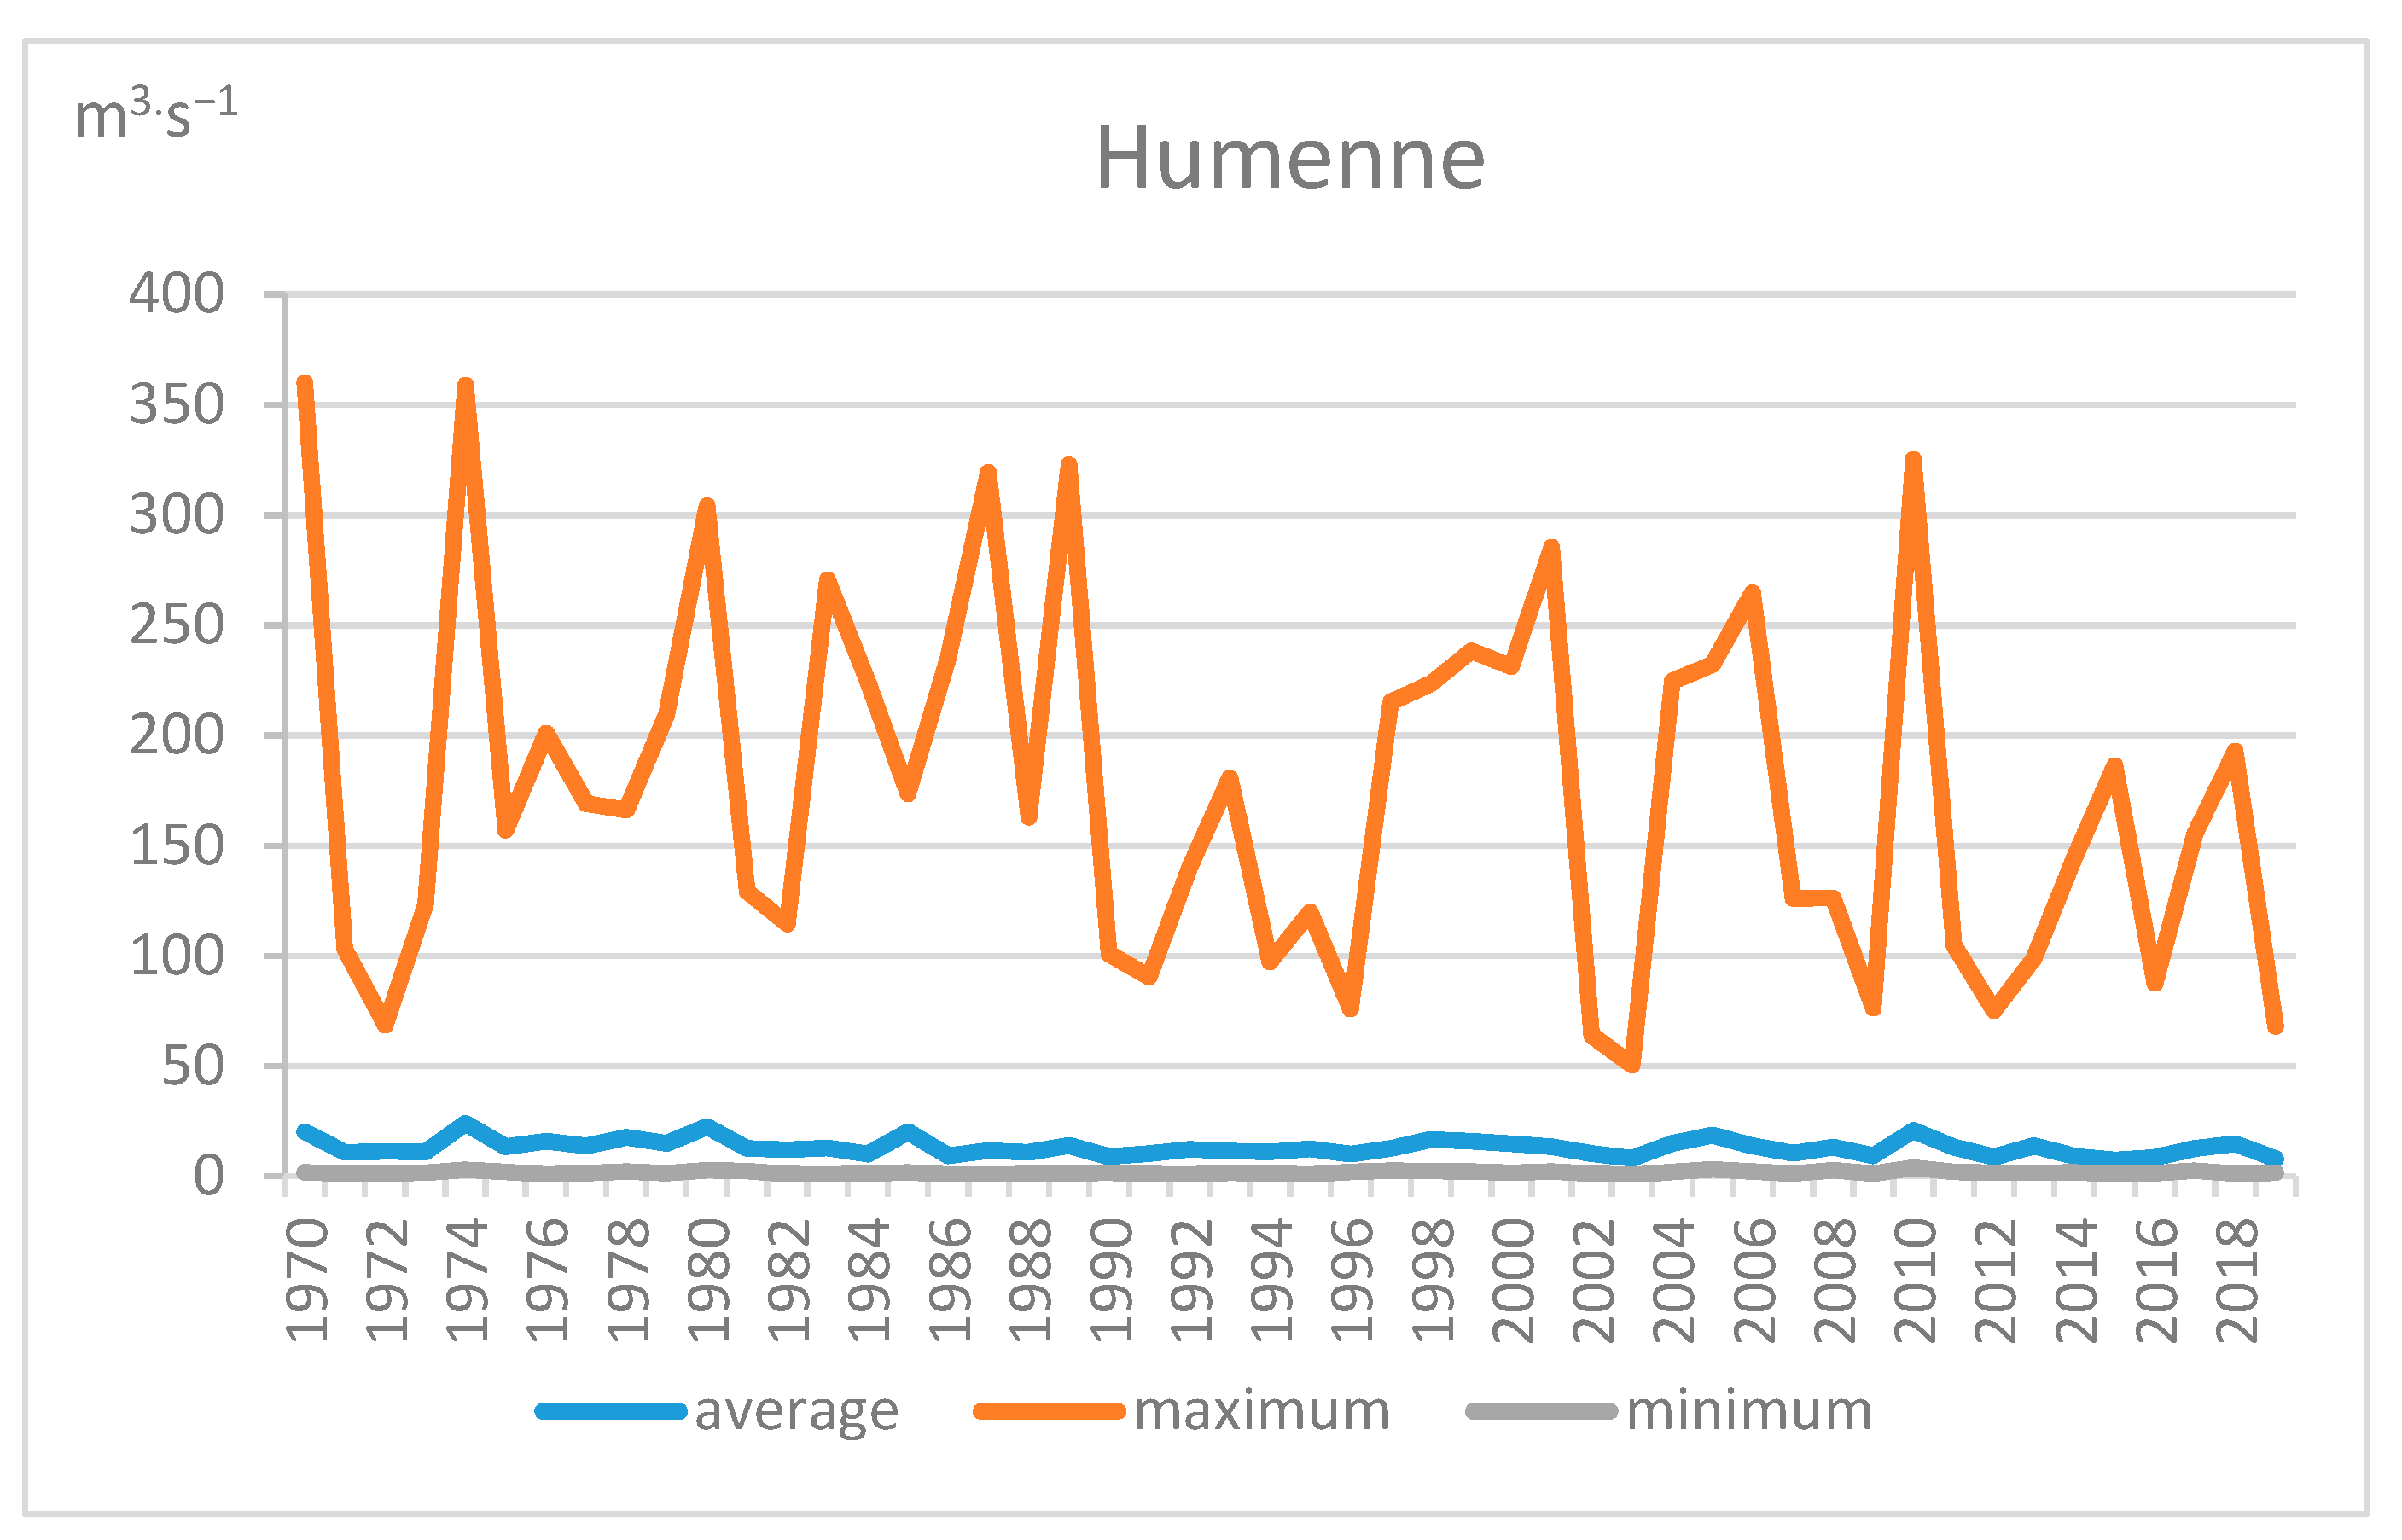
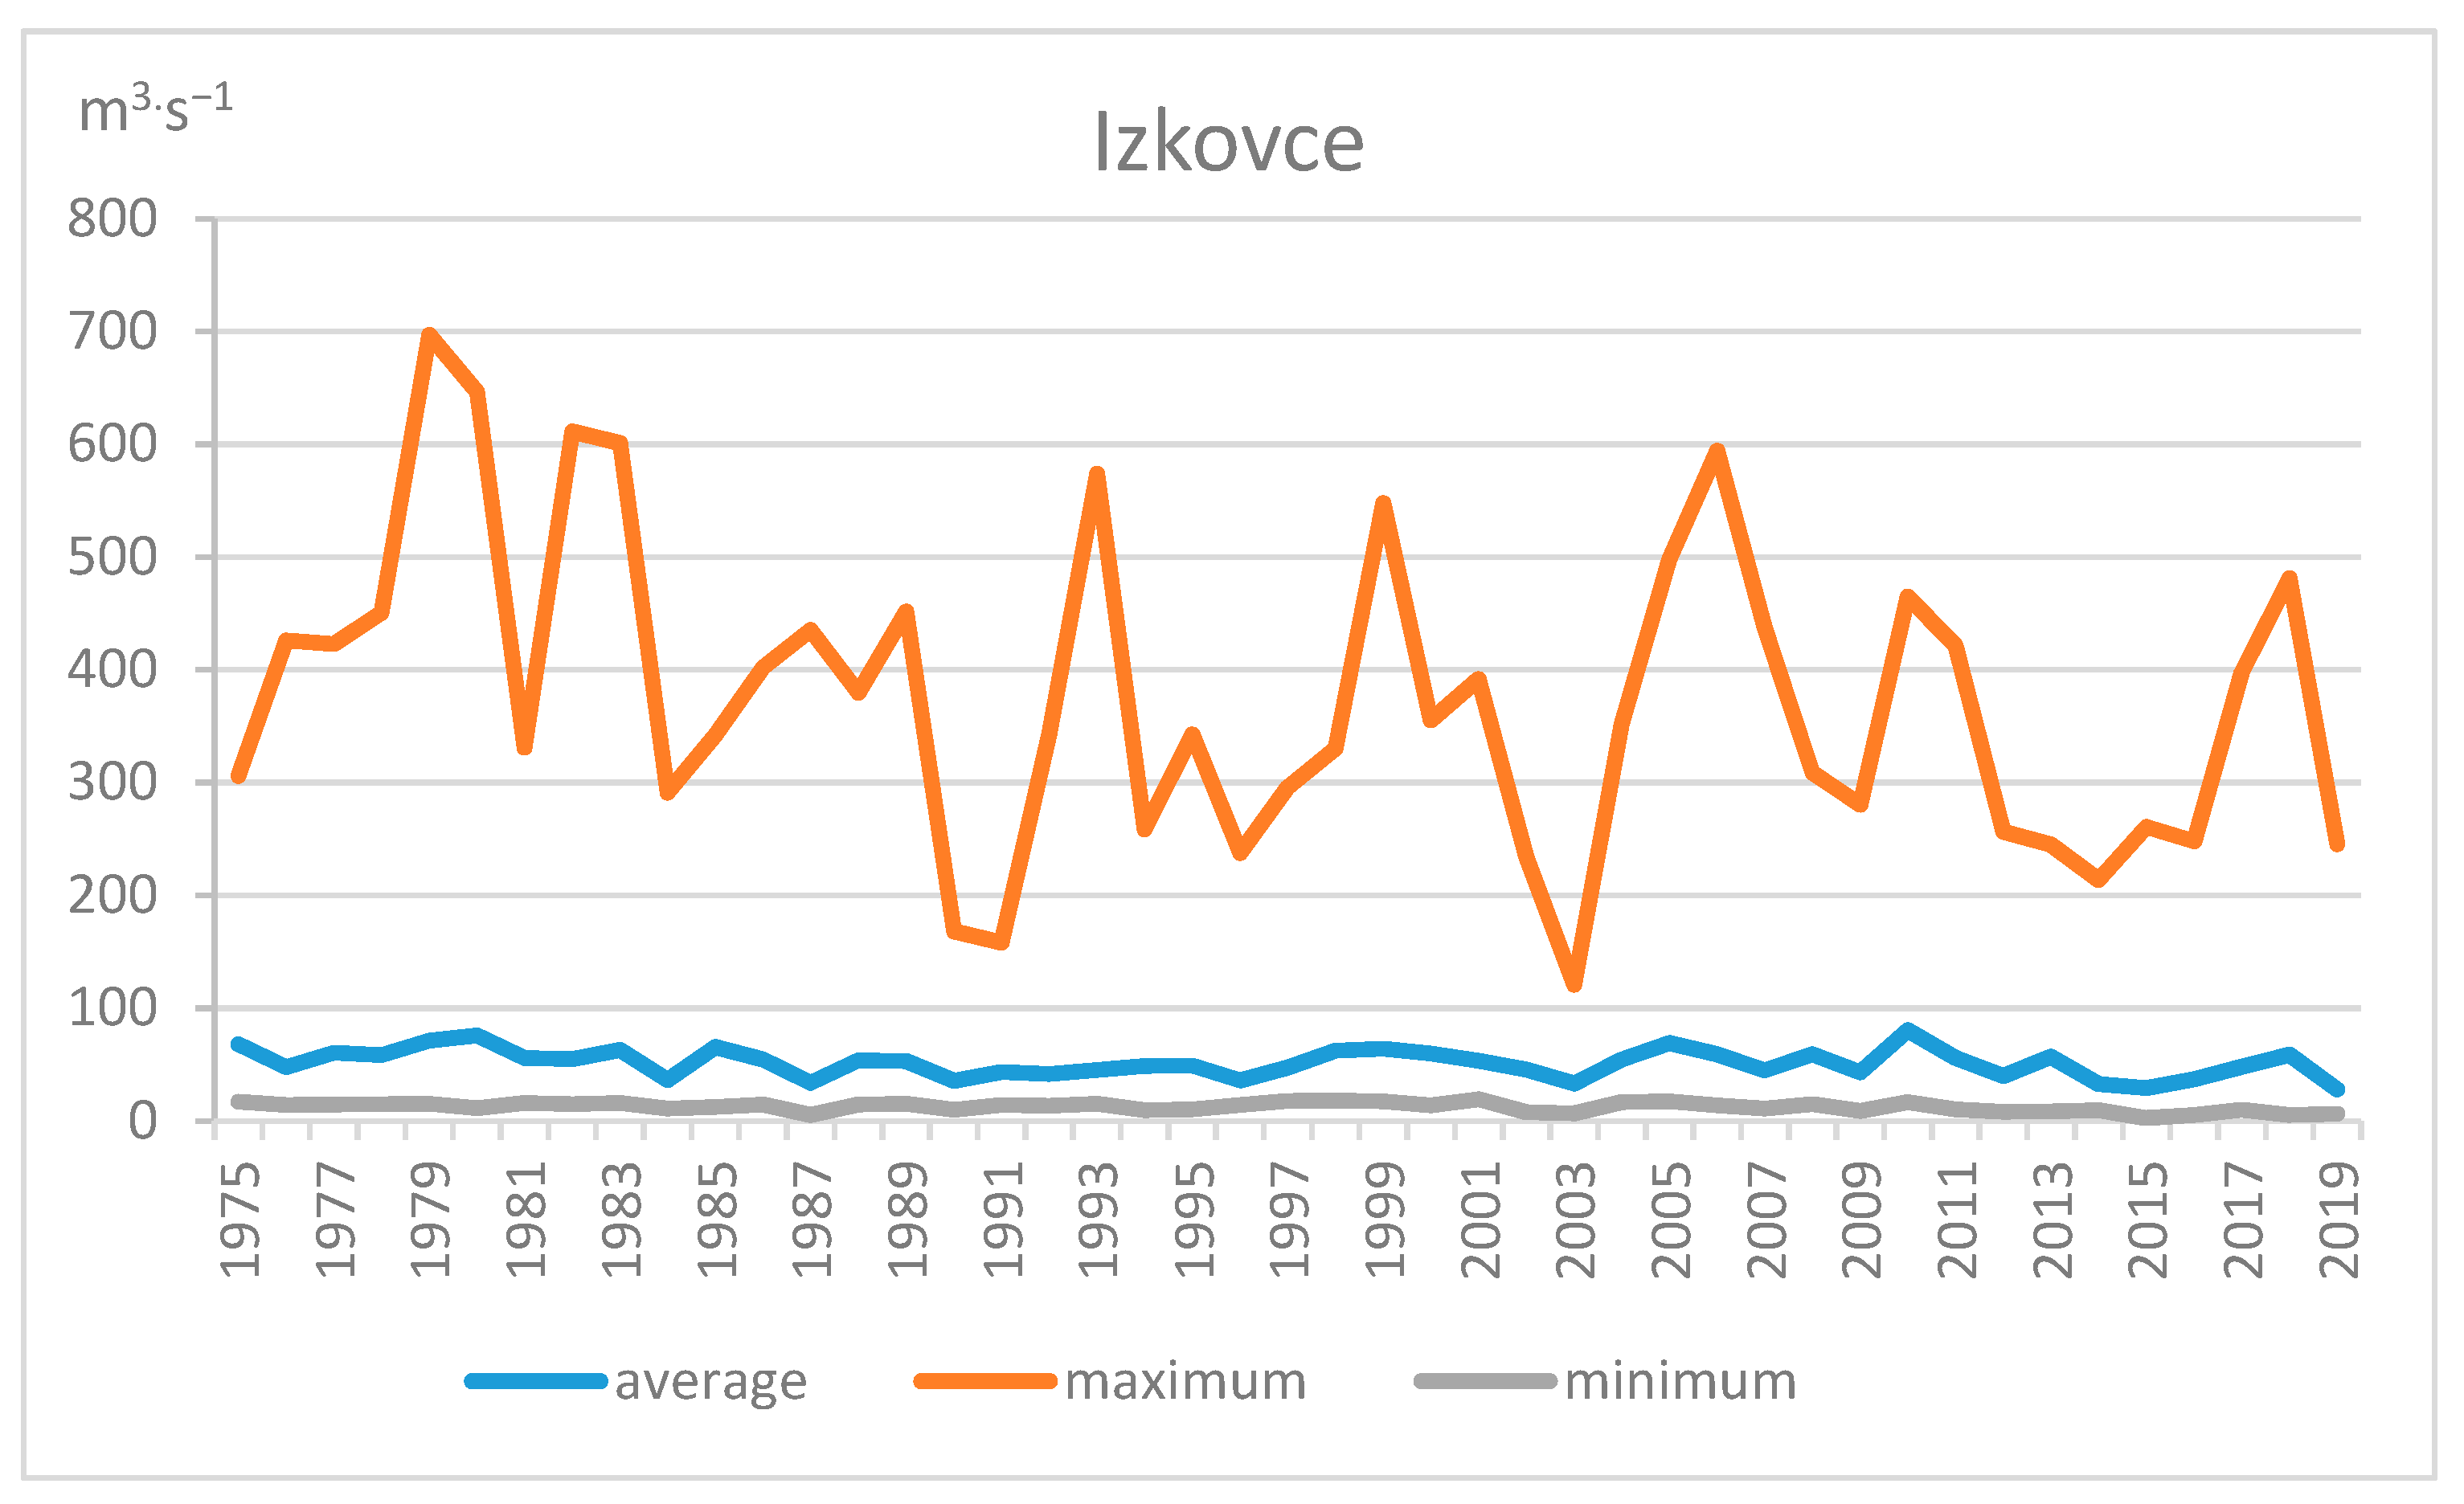
3.1. Precipitations and Flows in 1970–2019

The analyzed multi-year period 1970–2019 was characterized by a diversified distribution of precipitation within the Laborec river catchment area. The lowest amounts of precipitation occurred in 2015 and 2003 (Table 2). The highest amount of precipitation was recorded in 2010, and depending on the station, this year’s precipitation was higher by 36.7–48.1% relative to the long-term value.
High precipitation totals were also recorded in 1970, 1974, 1980, 1998, and 2004. Anomalous annual precipitation totals were as high as 300 mm per year (Figure 2). Annual sums of atmospheric precipitation in the Laborec river catchment area indicated significant spatial differentiation. Higher precipitation was recorded at stations located in the northern and eastern parts of the Laborec river catchment (from 800 to 1000 mm per year), while in the southern part of the catchment, below the Humenne station, the average annual precipitation was lower and ranged from 600 to 700 mm per year [27,30].
The analysis of MK trends showed that at the Medzilaborce and Michalovce stations, a slight upward trend in the annual sums of precipitation was recorded in the analyzed multi-year period, while in the case of the Kamenica station, there was a weak downward trend. The trends were not statistically significant.
In seasonal terms, the amount of precipitation in the summer semester (about 61–65% of the annual precipitation) was larger than the precipitation in the winter half-year (about 35–39% of the annual precipitation). The distribution of monthly precipitation totals showed less precipitation in winter (February) and much higher precipitation in summer (July).
The average annual flows of the Laborec River were checked at two gauging stations: Humenne and Izkovce. The mean annual flow of the Laborec River at the Humene gauging station in the hydrological years 1970–2019 was 13.15 m3·s−1. The highest flow was 325.32 m3·s−1 in 2010. The lowest flow in the analyzed multi-year period was 0.54 m3·s−1 in 2003 (Figure 3).
Hydrological observations at the Izkovce gauging station covered the multi-year period 1975–2019. The average annual flow in this period was 51.28 m3·s−1 (Figure 4). The highest flows were recorded in 1979 (697.1 m3·s−1) and 1980 (646.2 m3·s−1). The lowest flows were recorded in 2015 (2.42 m3·s−1) and 1987 (5.00 m3·s−1). The flow variation between the Humenne station and Izkovce was due to the intake of a large amount of water from the Uh tributary, which flows into the Laborec River below the Humenne station.
In the case of the annual flows of the Laborec River at the Humenne and Izkovce hydrological stations, a downward trend was recorded. The obtained precipitation and flow trends were statistically insignificant (Table 3 and Table 4).

3.2. Analysis of the Dry and Wet Periods Using the SPI and SRI

The SPI and SRI were used to analyze the frequency of occurrence of dry and wet periods, which were calculated for five periods of accumulation, i.e., 1, 3, 6, 9, and 12 months. Table 5 presents the parameters of the wet and dry periods, including the duration (in months), as well as the maximum and minimum values of the SPI.
The highest SPI values represented extremely wet months, while the lowest SPI values represented extremely dry months. The extreme SPI values were different at three stations, depending on the length of the accumulation period. The highest SPI values were recorded in 1974, 1975, and 2010 and were associated with exceptionally high precipitation. SPI values in those years ranged from 2.55 to 3.40. The largest differences among the maximum SPI values were noted at the Michalovce station (0.85). Regarding the one-month period, SPI values at the Michalovce station were the lowest among the maximum values (SPI = 2.55), while the highest was obtained in the nine-month accumulation period (SPI = 3.40). At the Medzilaborce and Kamenica stations, the differences between the maximum SPI values were at a similar level, amounting to 0.42 and 0.39, respectively. The minimum SPI values in the analyzed multi-year period ranged from −2.40 in longer accumulation periods, i.e., 9 and 12 months, to −4.68 in short (one-month) accumulation periods. Compared to wet periods, dry periods occurred in different years, depending on the adopted accumulation period. The lowest SPI values were recorded in 1973, 1974, 1987, 2003, and 2012. The largest difference between the minimum SPI values was recorded at the Medzilaborce station (2.28), while at the Kamenica (1.53) and Michalovce (1.11) stations, the values were much lower (Table 5).
Table 6 presents the characteristics of the wet and dry periods for the SRI. The highest SRI values ranged from 2.30 to 3.16. At the Humenne hydrological station, the highest SRI values occurred in 1974 and 1975, while at the Izkovce station, they were in 1980, 1981, and 2011. The minimum SRI values in the analyzed multiannual period ranged from −2.43 for longer accumulation periods (12 months (SRI-12)) to −3.38 for shorter accumulation periods (SRI-3). The lowest SRI values were recorded in 1984, 1987, 2015, and 2019. SPI and SRI values below −1.0 and above 1.0 were treated as extreme events. Analysis of all months with SPI values >1.0 showed that the total duration of wet months ranged from 86 months (14.3%) to 107 months (17.8%) in the period 1970–2019. The number of months with SPI values ≤ −1.0 ranged from 79 months (13.2%) to 110 months (18.3%) in that period. Wet periods lasted longer in the lower part of the catchment (Michalovce station), whereas dry periods were longer in the upper part (Medzilaborce station). In the case of the SRI, the number of wet months (SRI > 1.0) was comparable to the number of dry months (SRI < −1.0) and constituted 15.7–17.7% of the analyzed period at the Humenne station. On the other hand, at the Izkovce station, the number of wet months ranged from 13.5 to 17.8% of the analyzed period, while the dry months ranged from 14.4 to 16.2%. The difference in the duration of dry and wet periods between the individual stations may have been due to the shorter period of data for the Izkovce station. In the period 1970–2019, there were more months with hydrological droughts (SRI below −1.0) than with meteorological droughts (SPI below −1.0) in the one-month accumulation period. Meteorological droughts in this period showed greater intensity (they reached higher extreme values of the index) than hydrological droughts. In the longer periods of accumulation, the number of wet and dry months at meteorological and hydrological stations was similar.

3.3. Comparison of Drought Classes Based on the SPI and SRI

Using the threshold values presented in Table 1, a detailed division of the SPI and SRI values into individual classes was made (Table 7 and Table 8). The highest number of months was recorded in the normal class, where the total number of months with SPI values between 1.0 and −1.0 accounted for 65.7 to 71.6% of all months in the analyzed period 1970–2019. In the case of the SRI, the number of months in the normal class was lower, accounting for 64.8 to 67.8%. In the moderately dry class, meteorological droughts ranged from 3.8 to 5.7%, while in the case of hydrological drought, the total drought duration was twice as high, ranging from 8.8 to 11% of all months in the analyzed period. The SPI and SRI values in the severely dry class were similar, ranging from 3.8 to 6.3% of the analyzed period. Extremely dry droughts had the lowest percentage share. They constituted from 0.5 to 3.0% of the analyzed period. The number of months with SPI and SRI values in the moderately wet class was similar, accounting for a total of 6.7 to 12.3% of the analyzed period. SPI values in the severely wet class ranged from 2.2 to 5.5% of the analyzed period. The lowest percentages were found for months in the extremely wet and extremely dry classes.
It should be noted that the number of months with meteorological droughts in the extremely wet class was smaller than the number of months with hydrological droughts in the same class in the one-month accumulation period. This means that short-term but heavy precipitation within one month resulted in high flows that lasted more than one month. In the extremely dry class, there was a greater number of months with meteorological drought compared to hydrological drought. This means that the occurrence of extreme meteorological phenomena was mitigated to some extent by the catchment area, leading to fewer months with hydrological droughts.

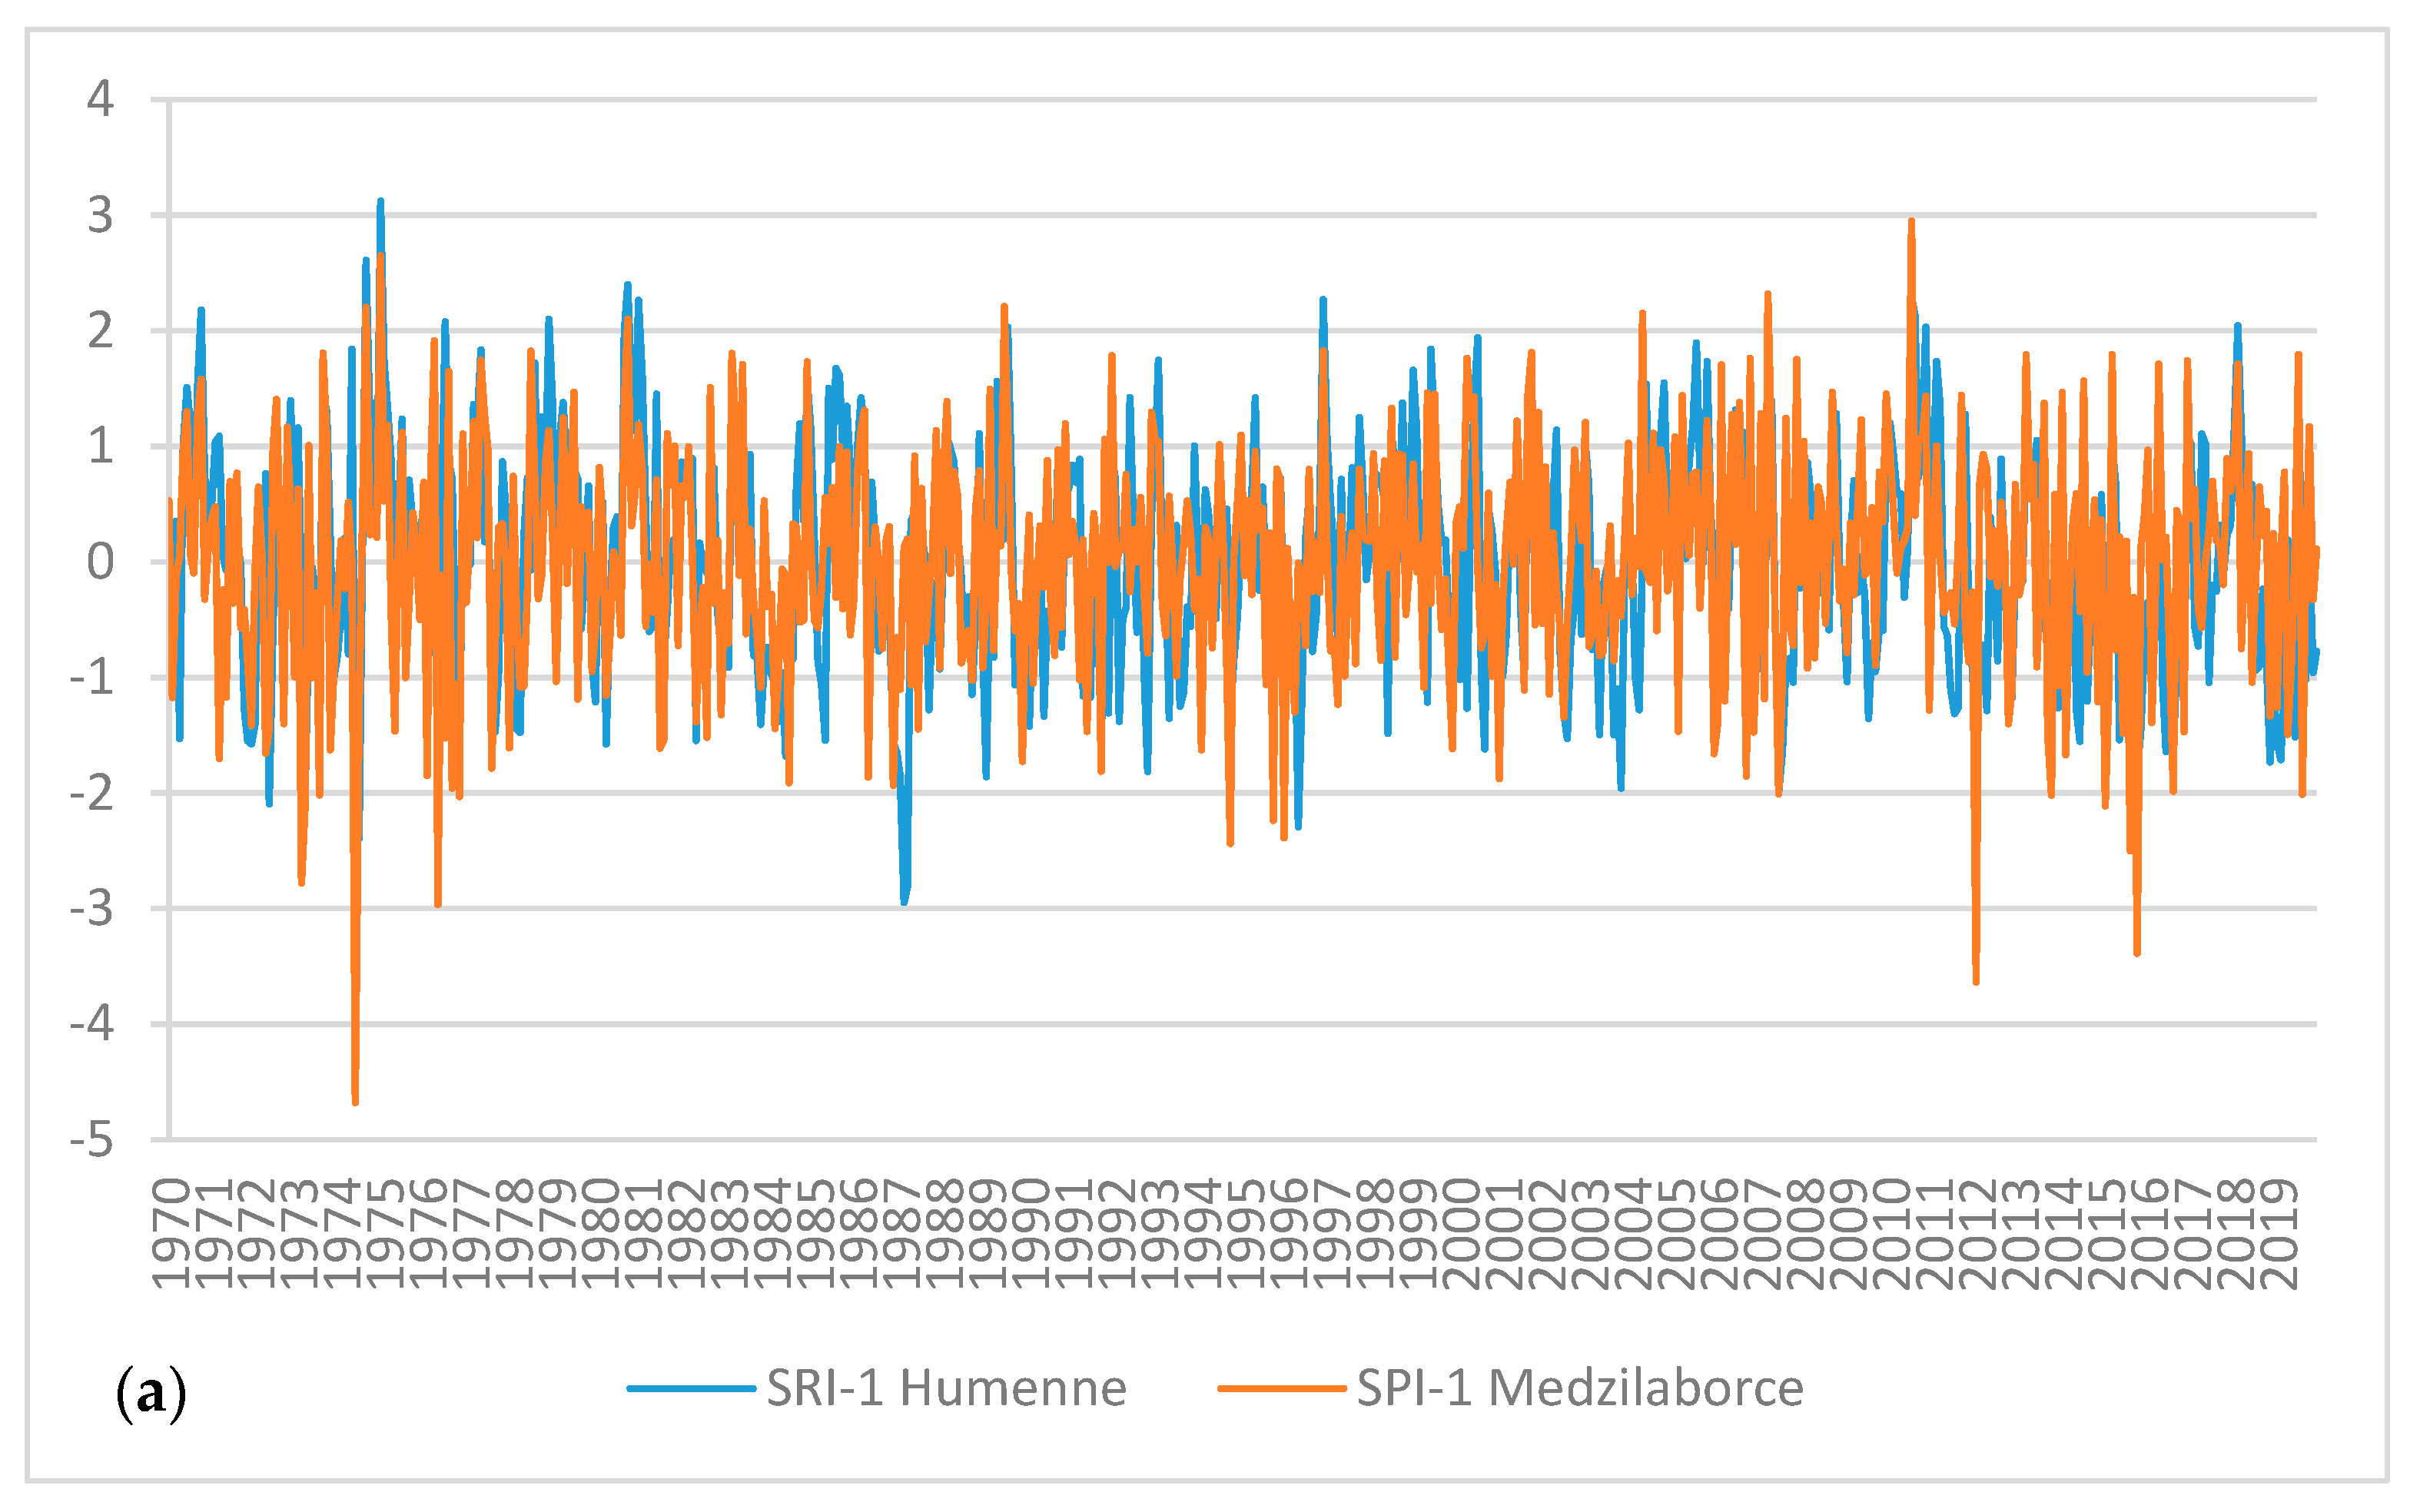
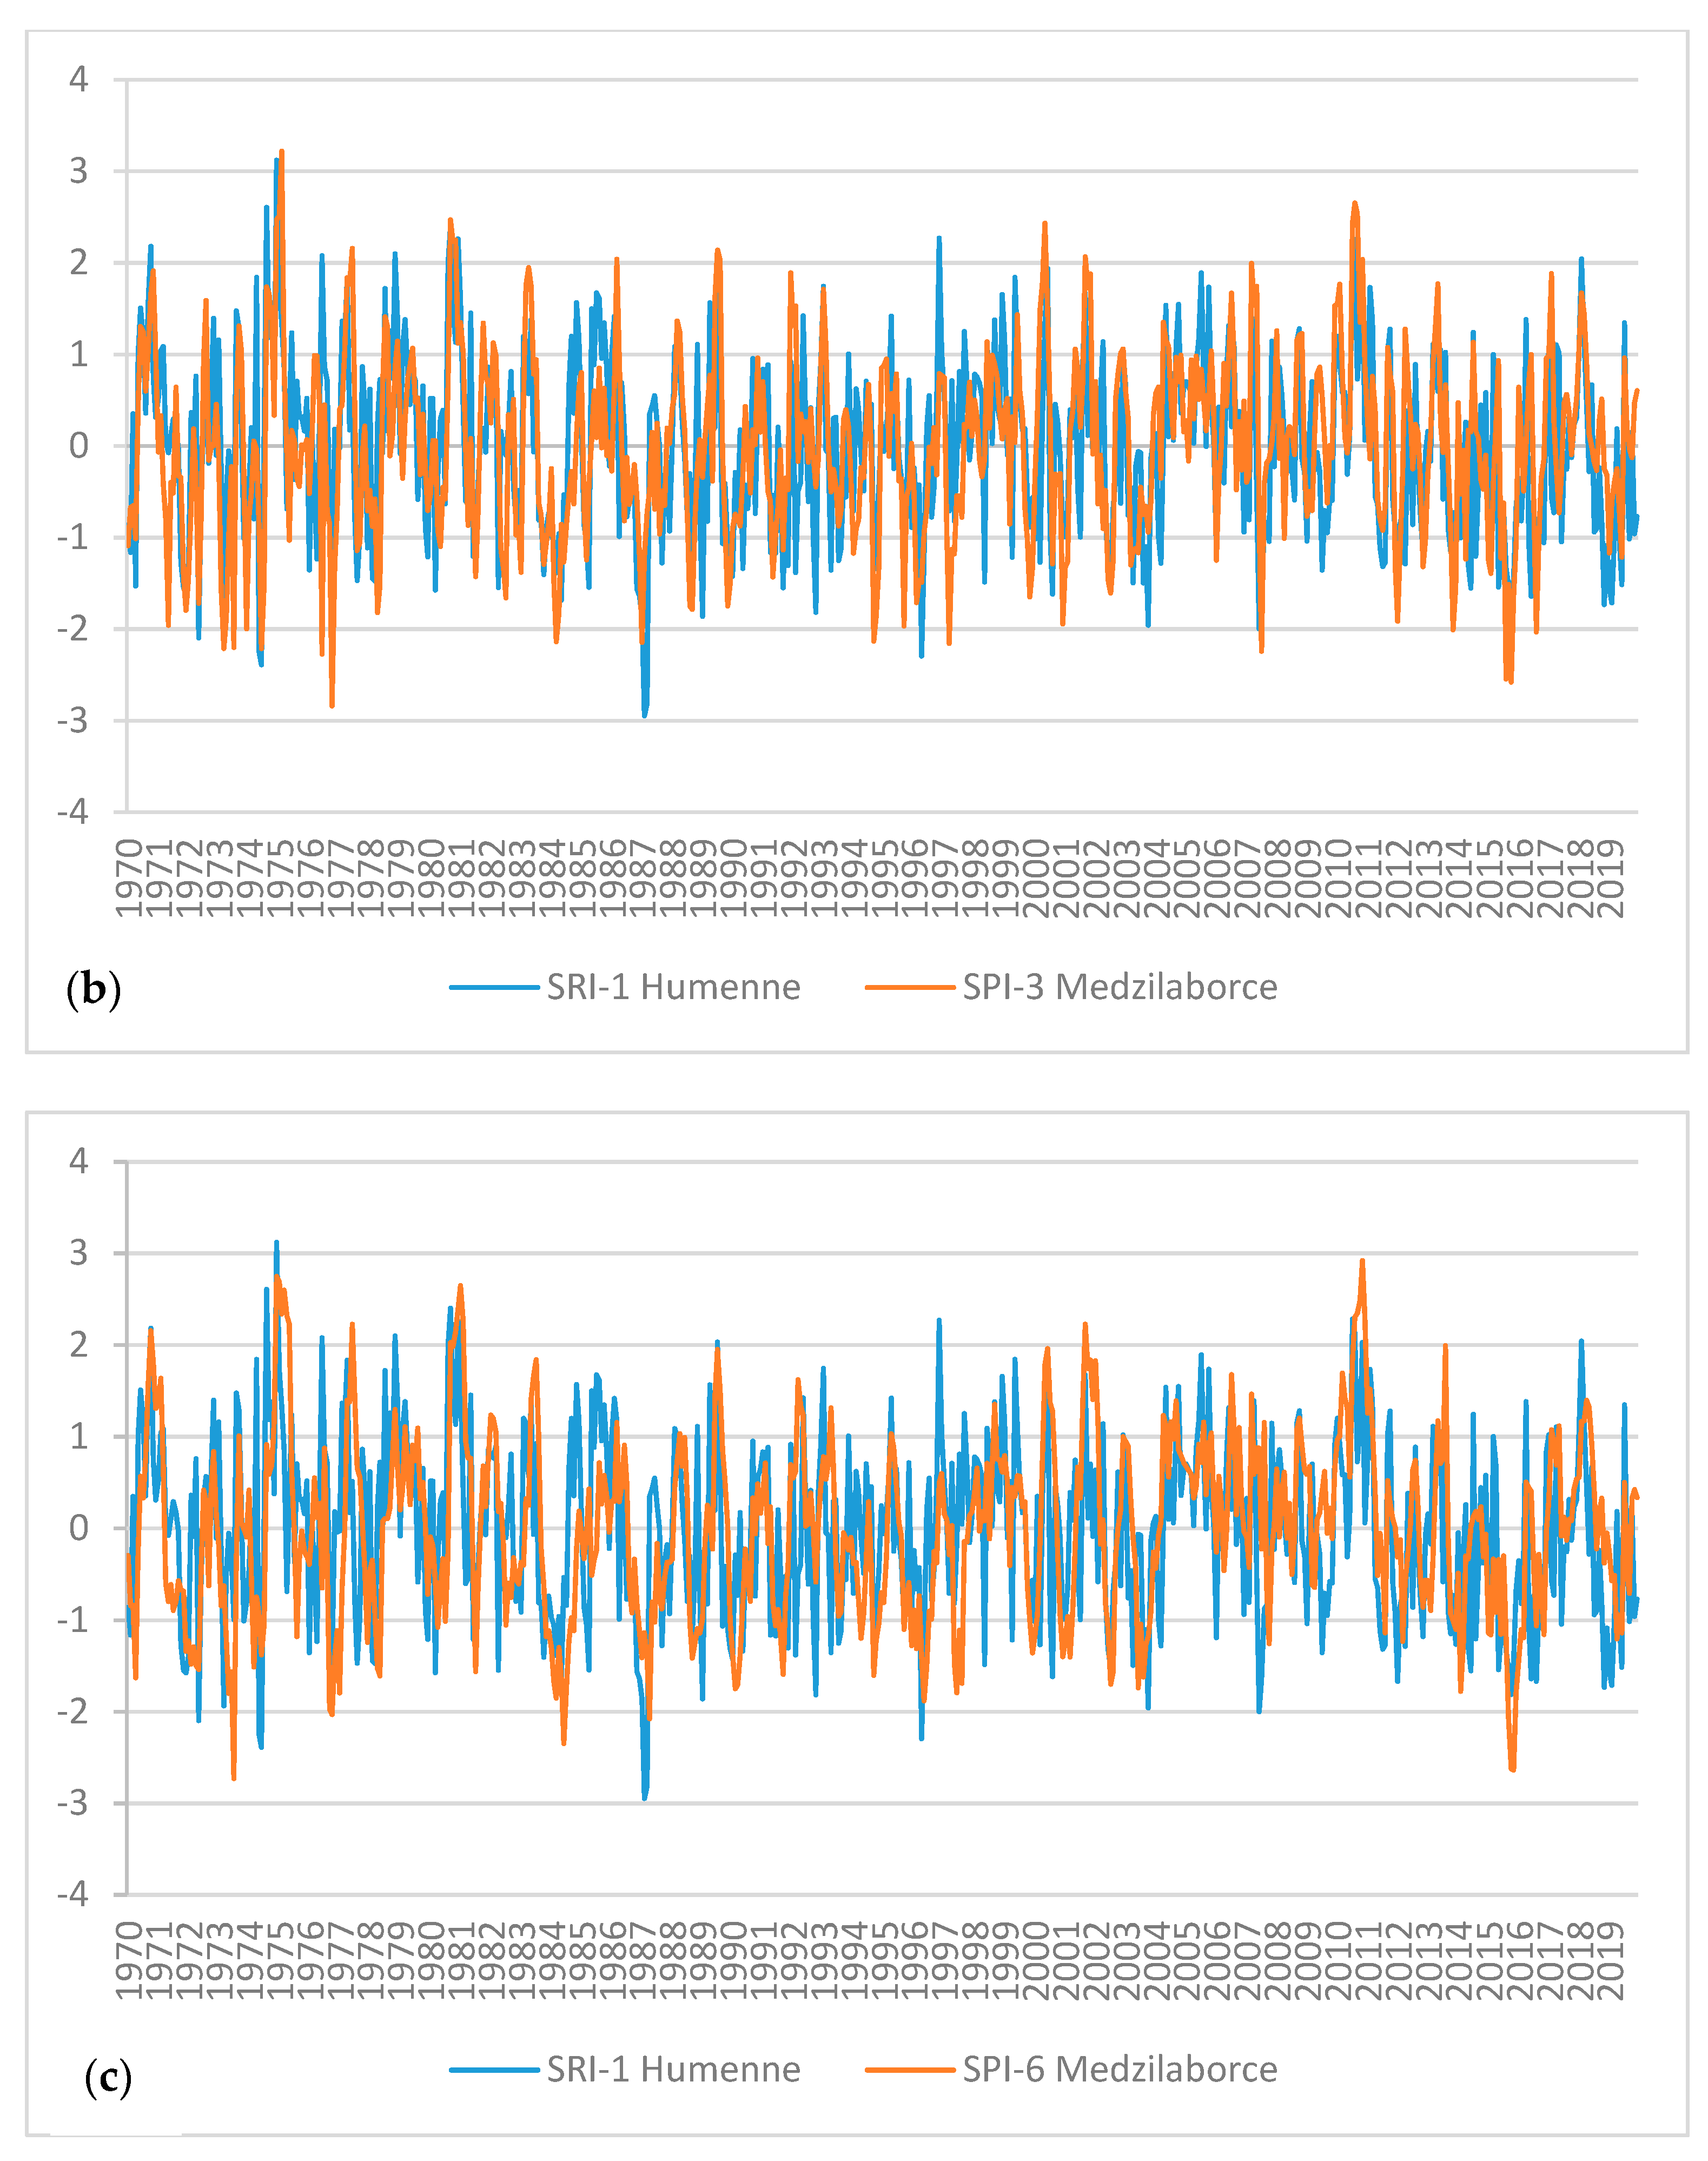
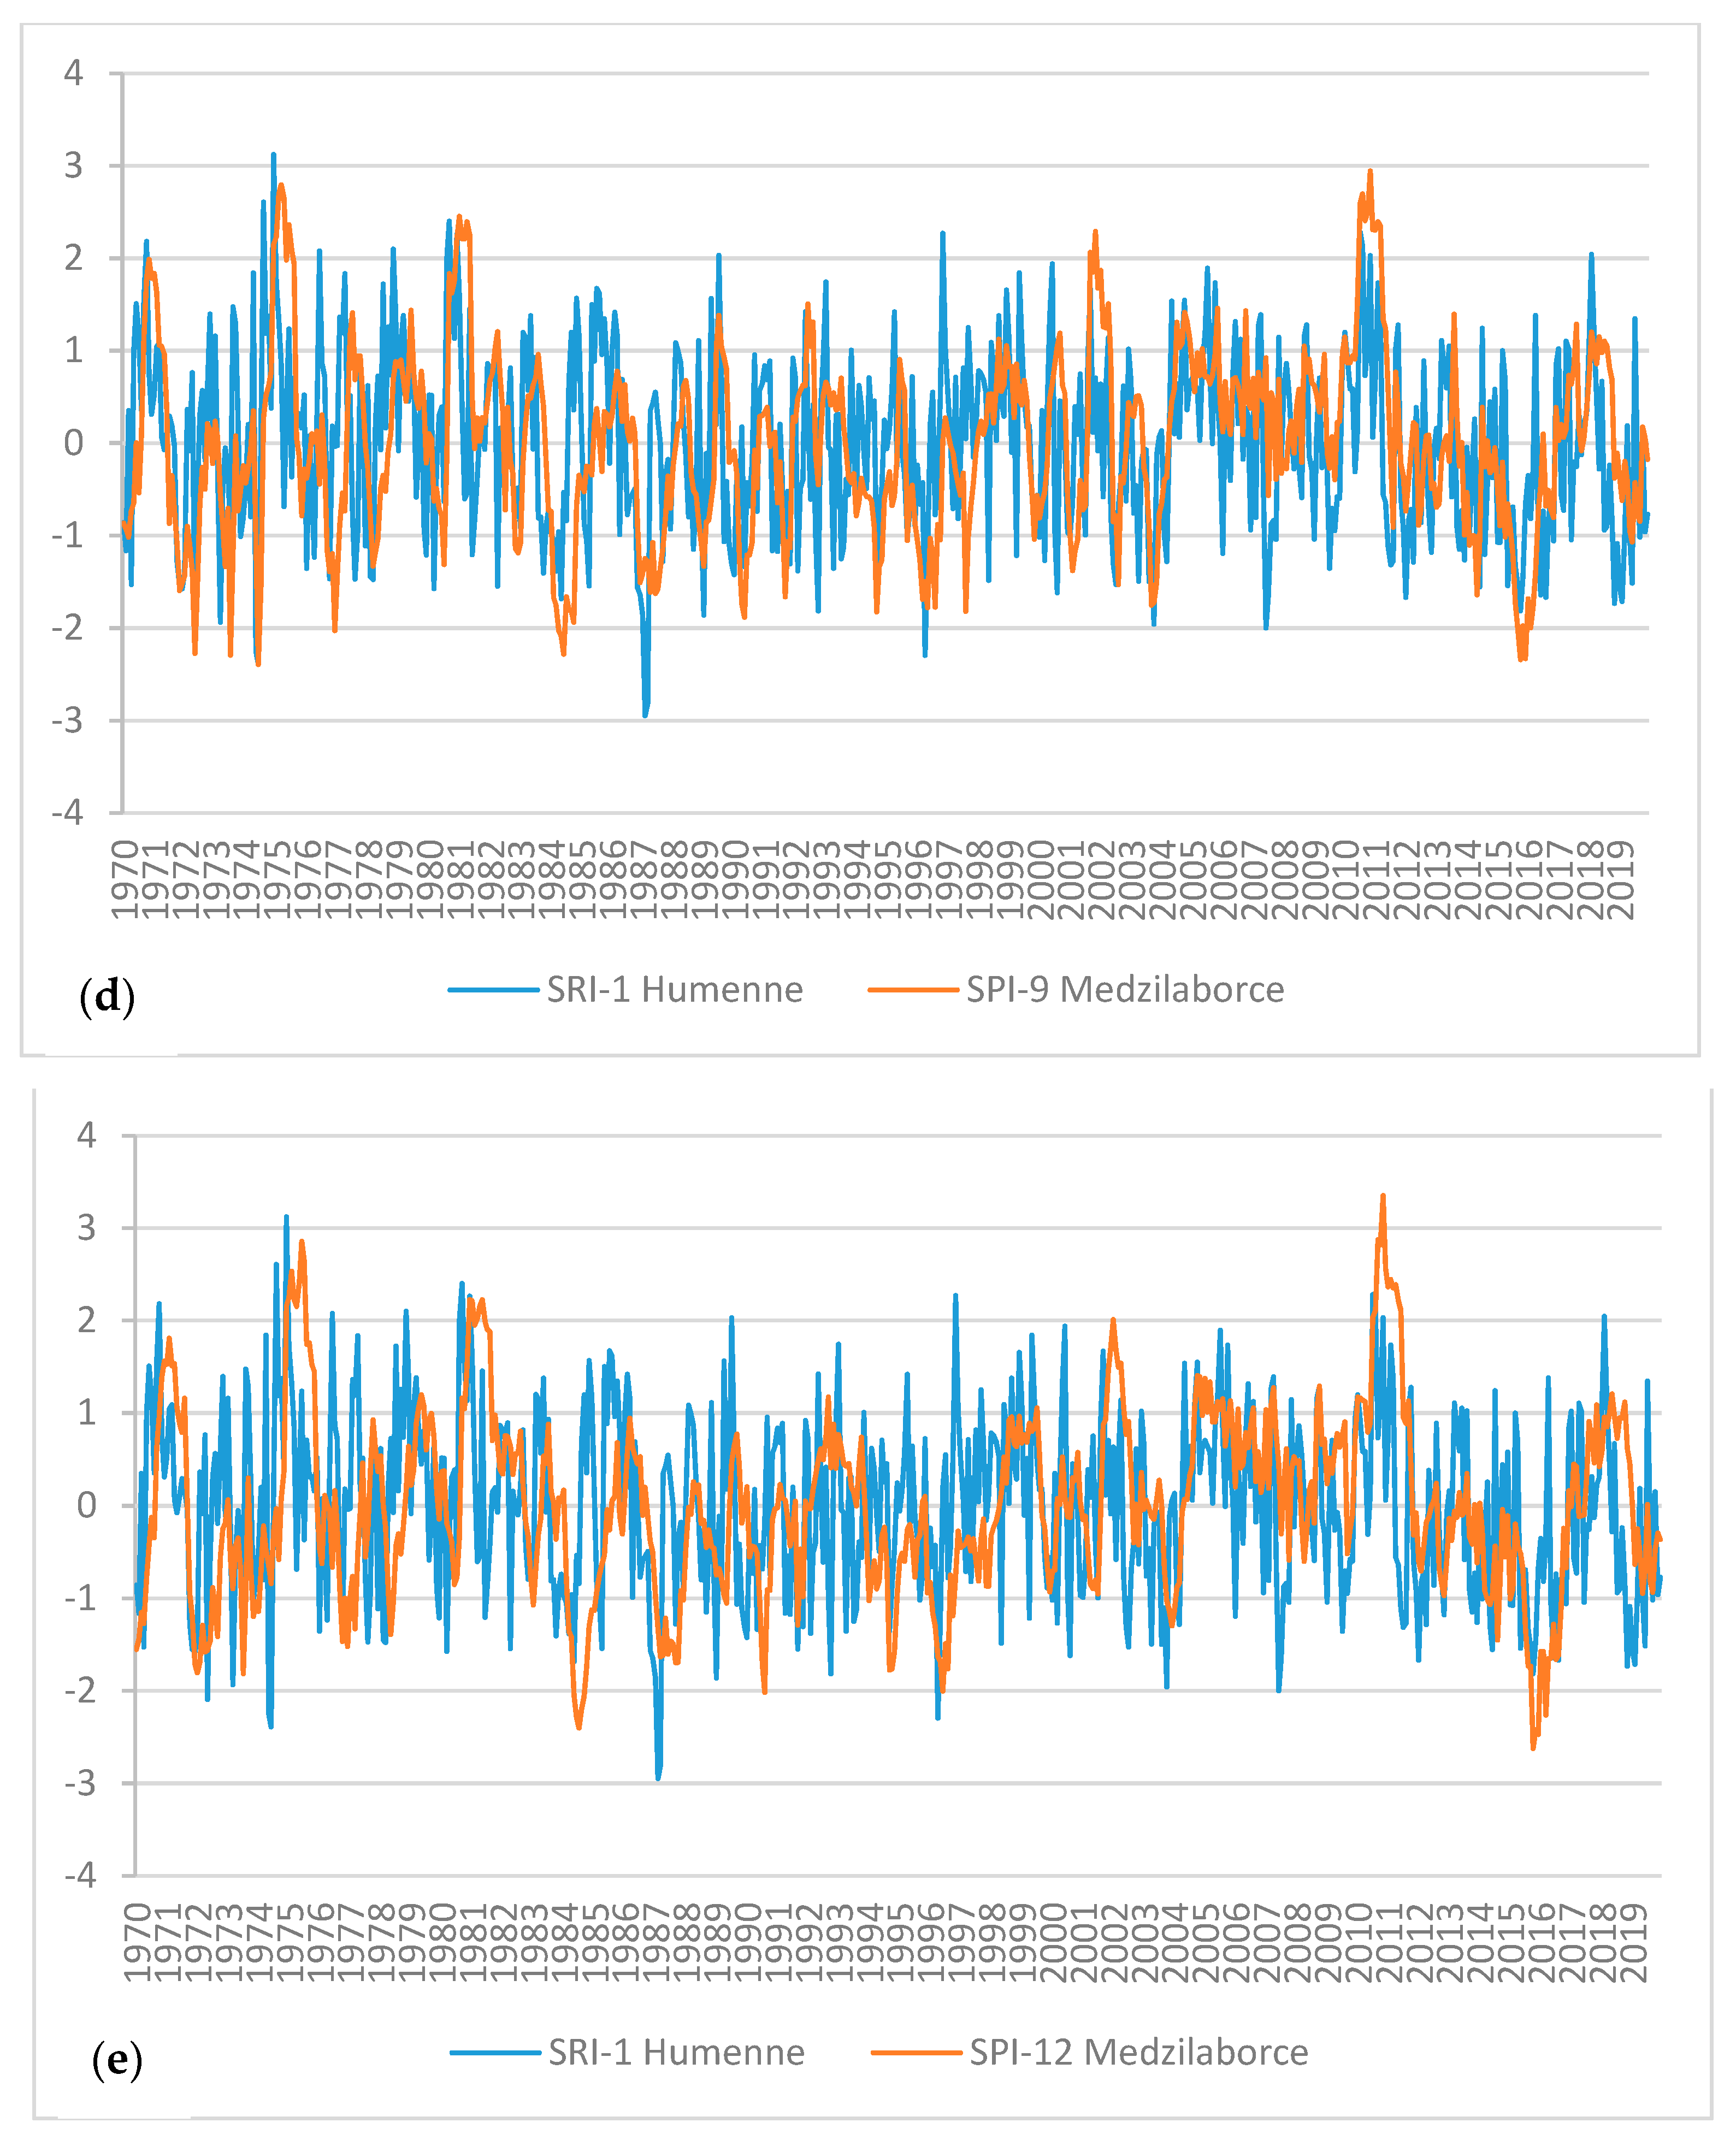
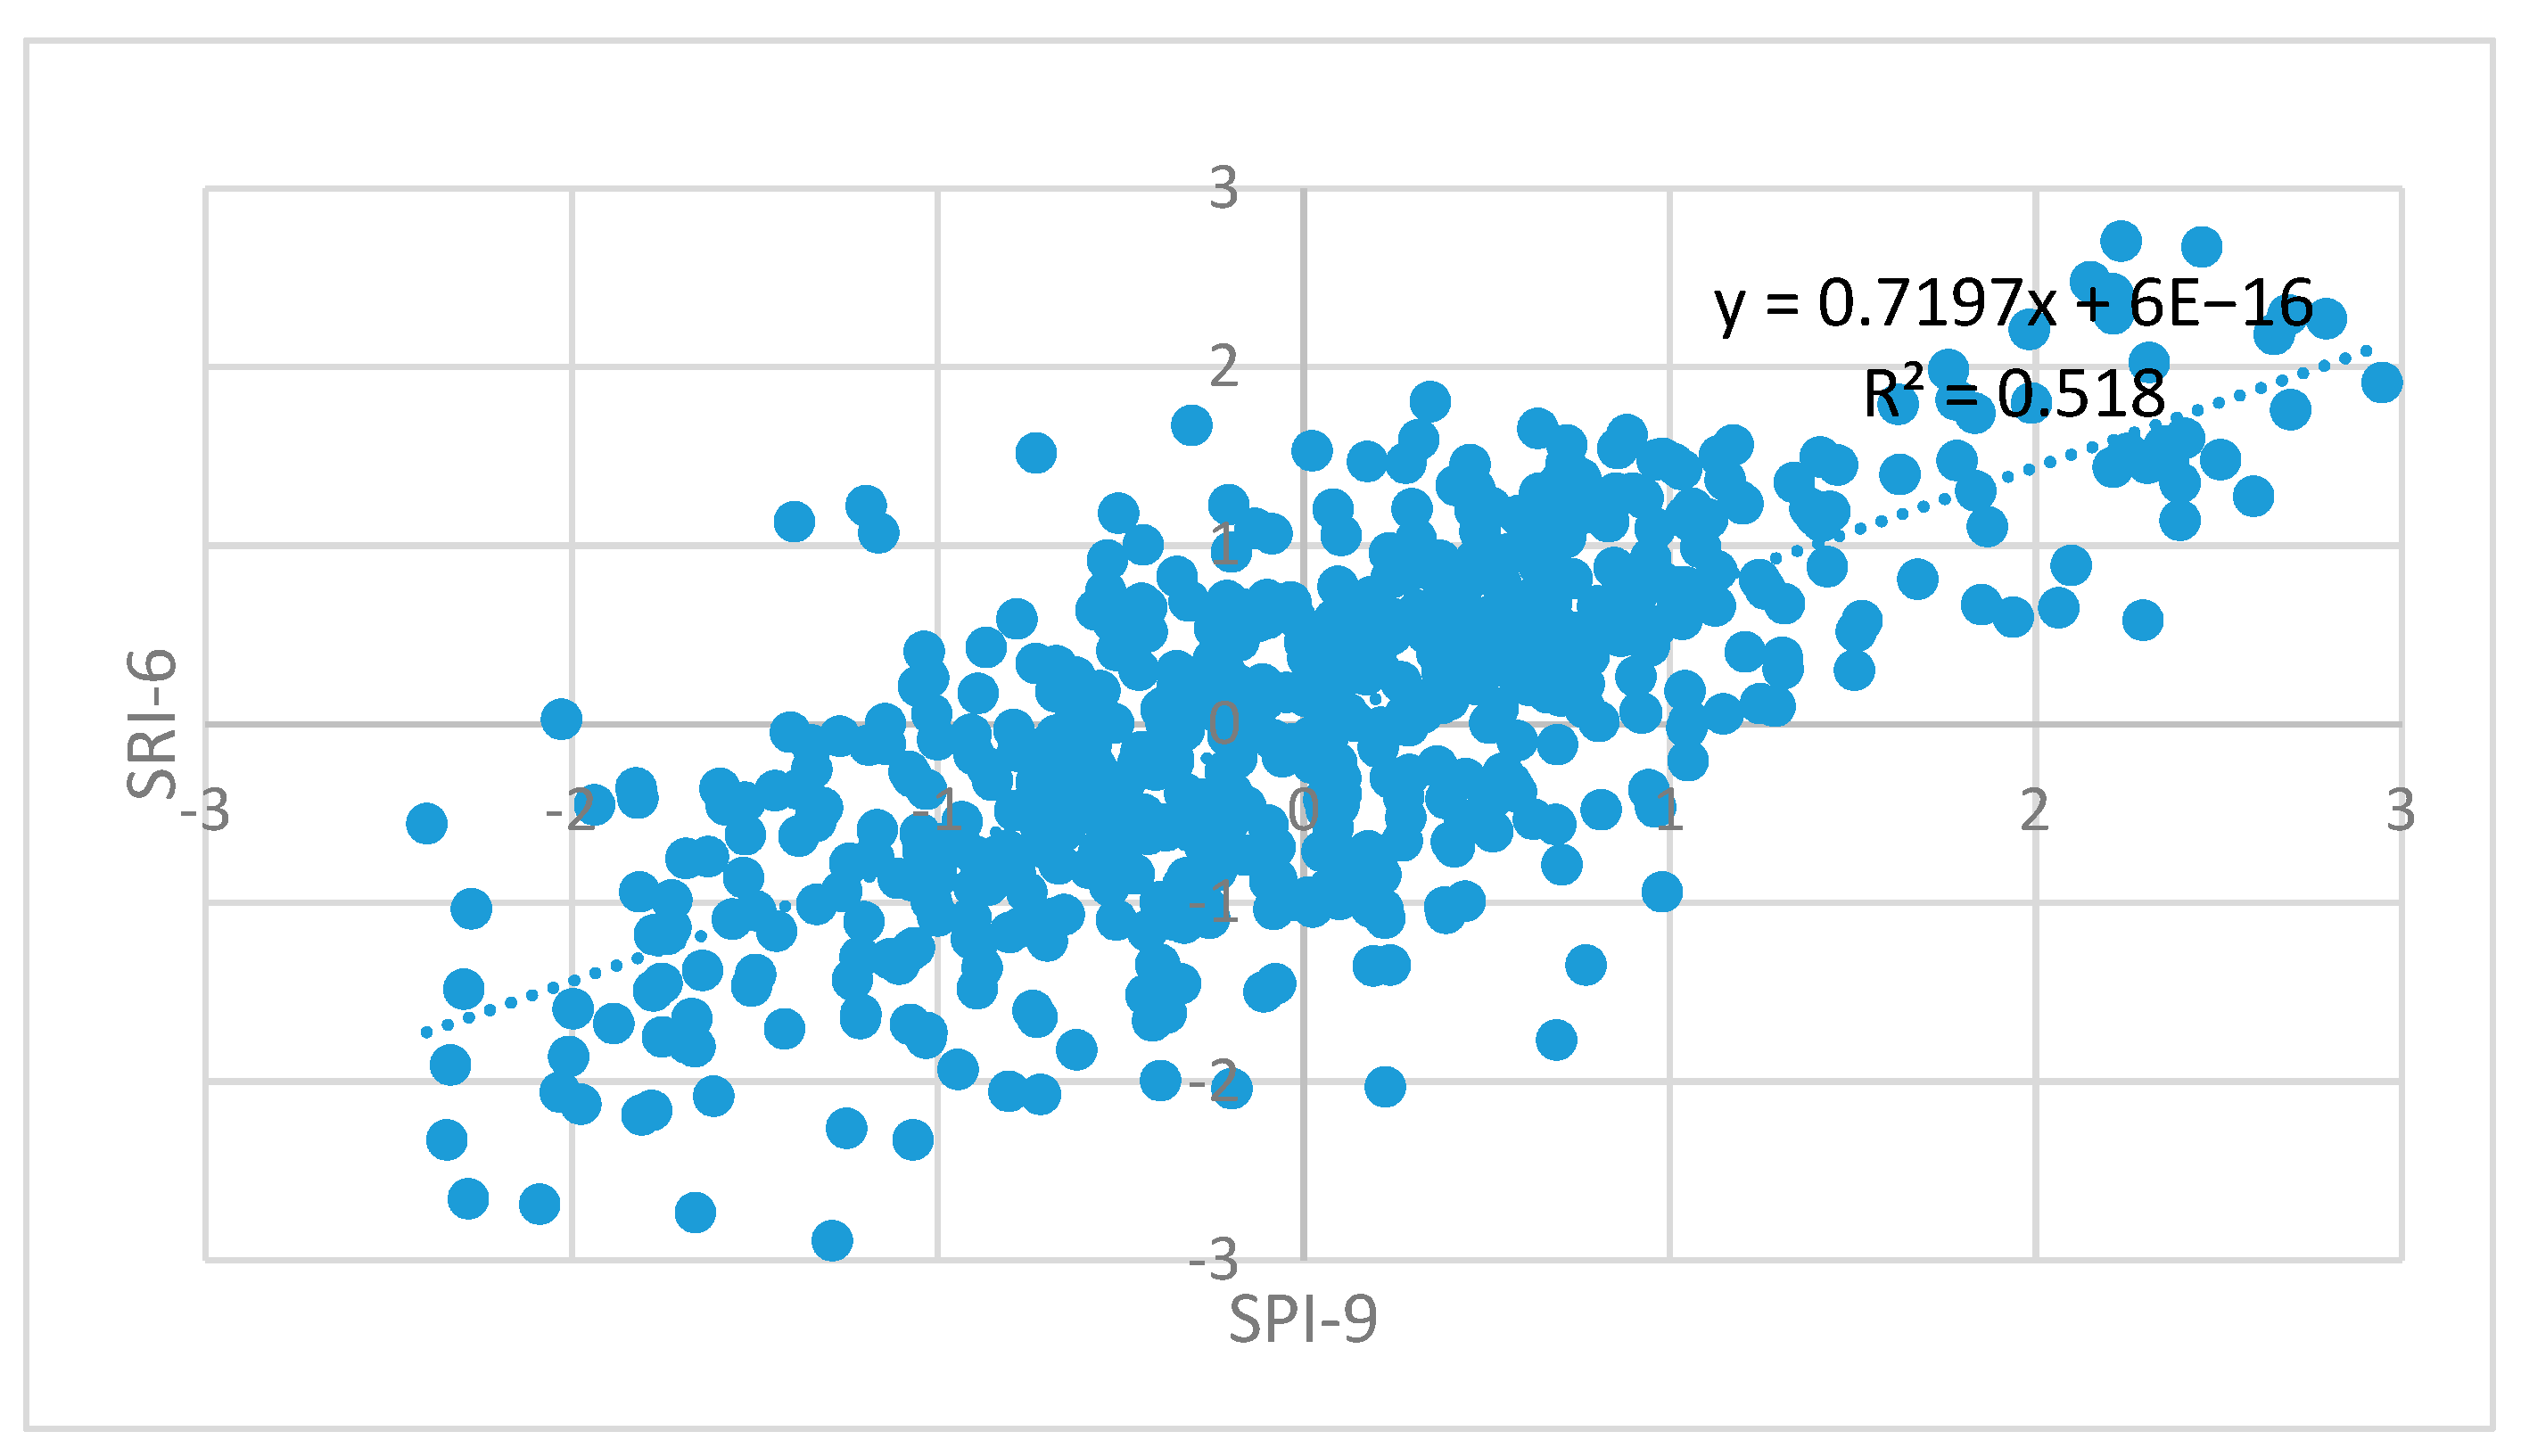
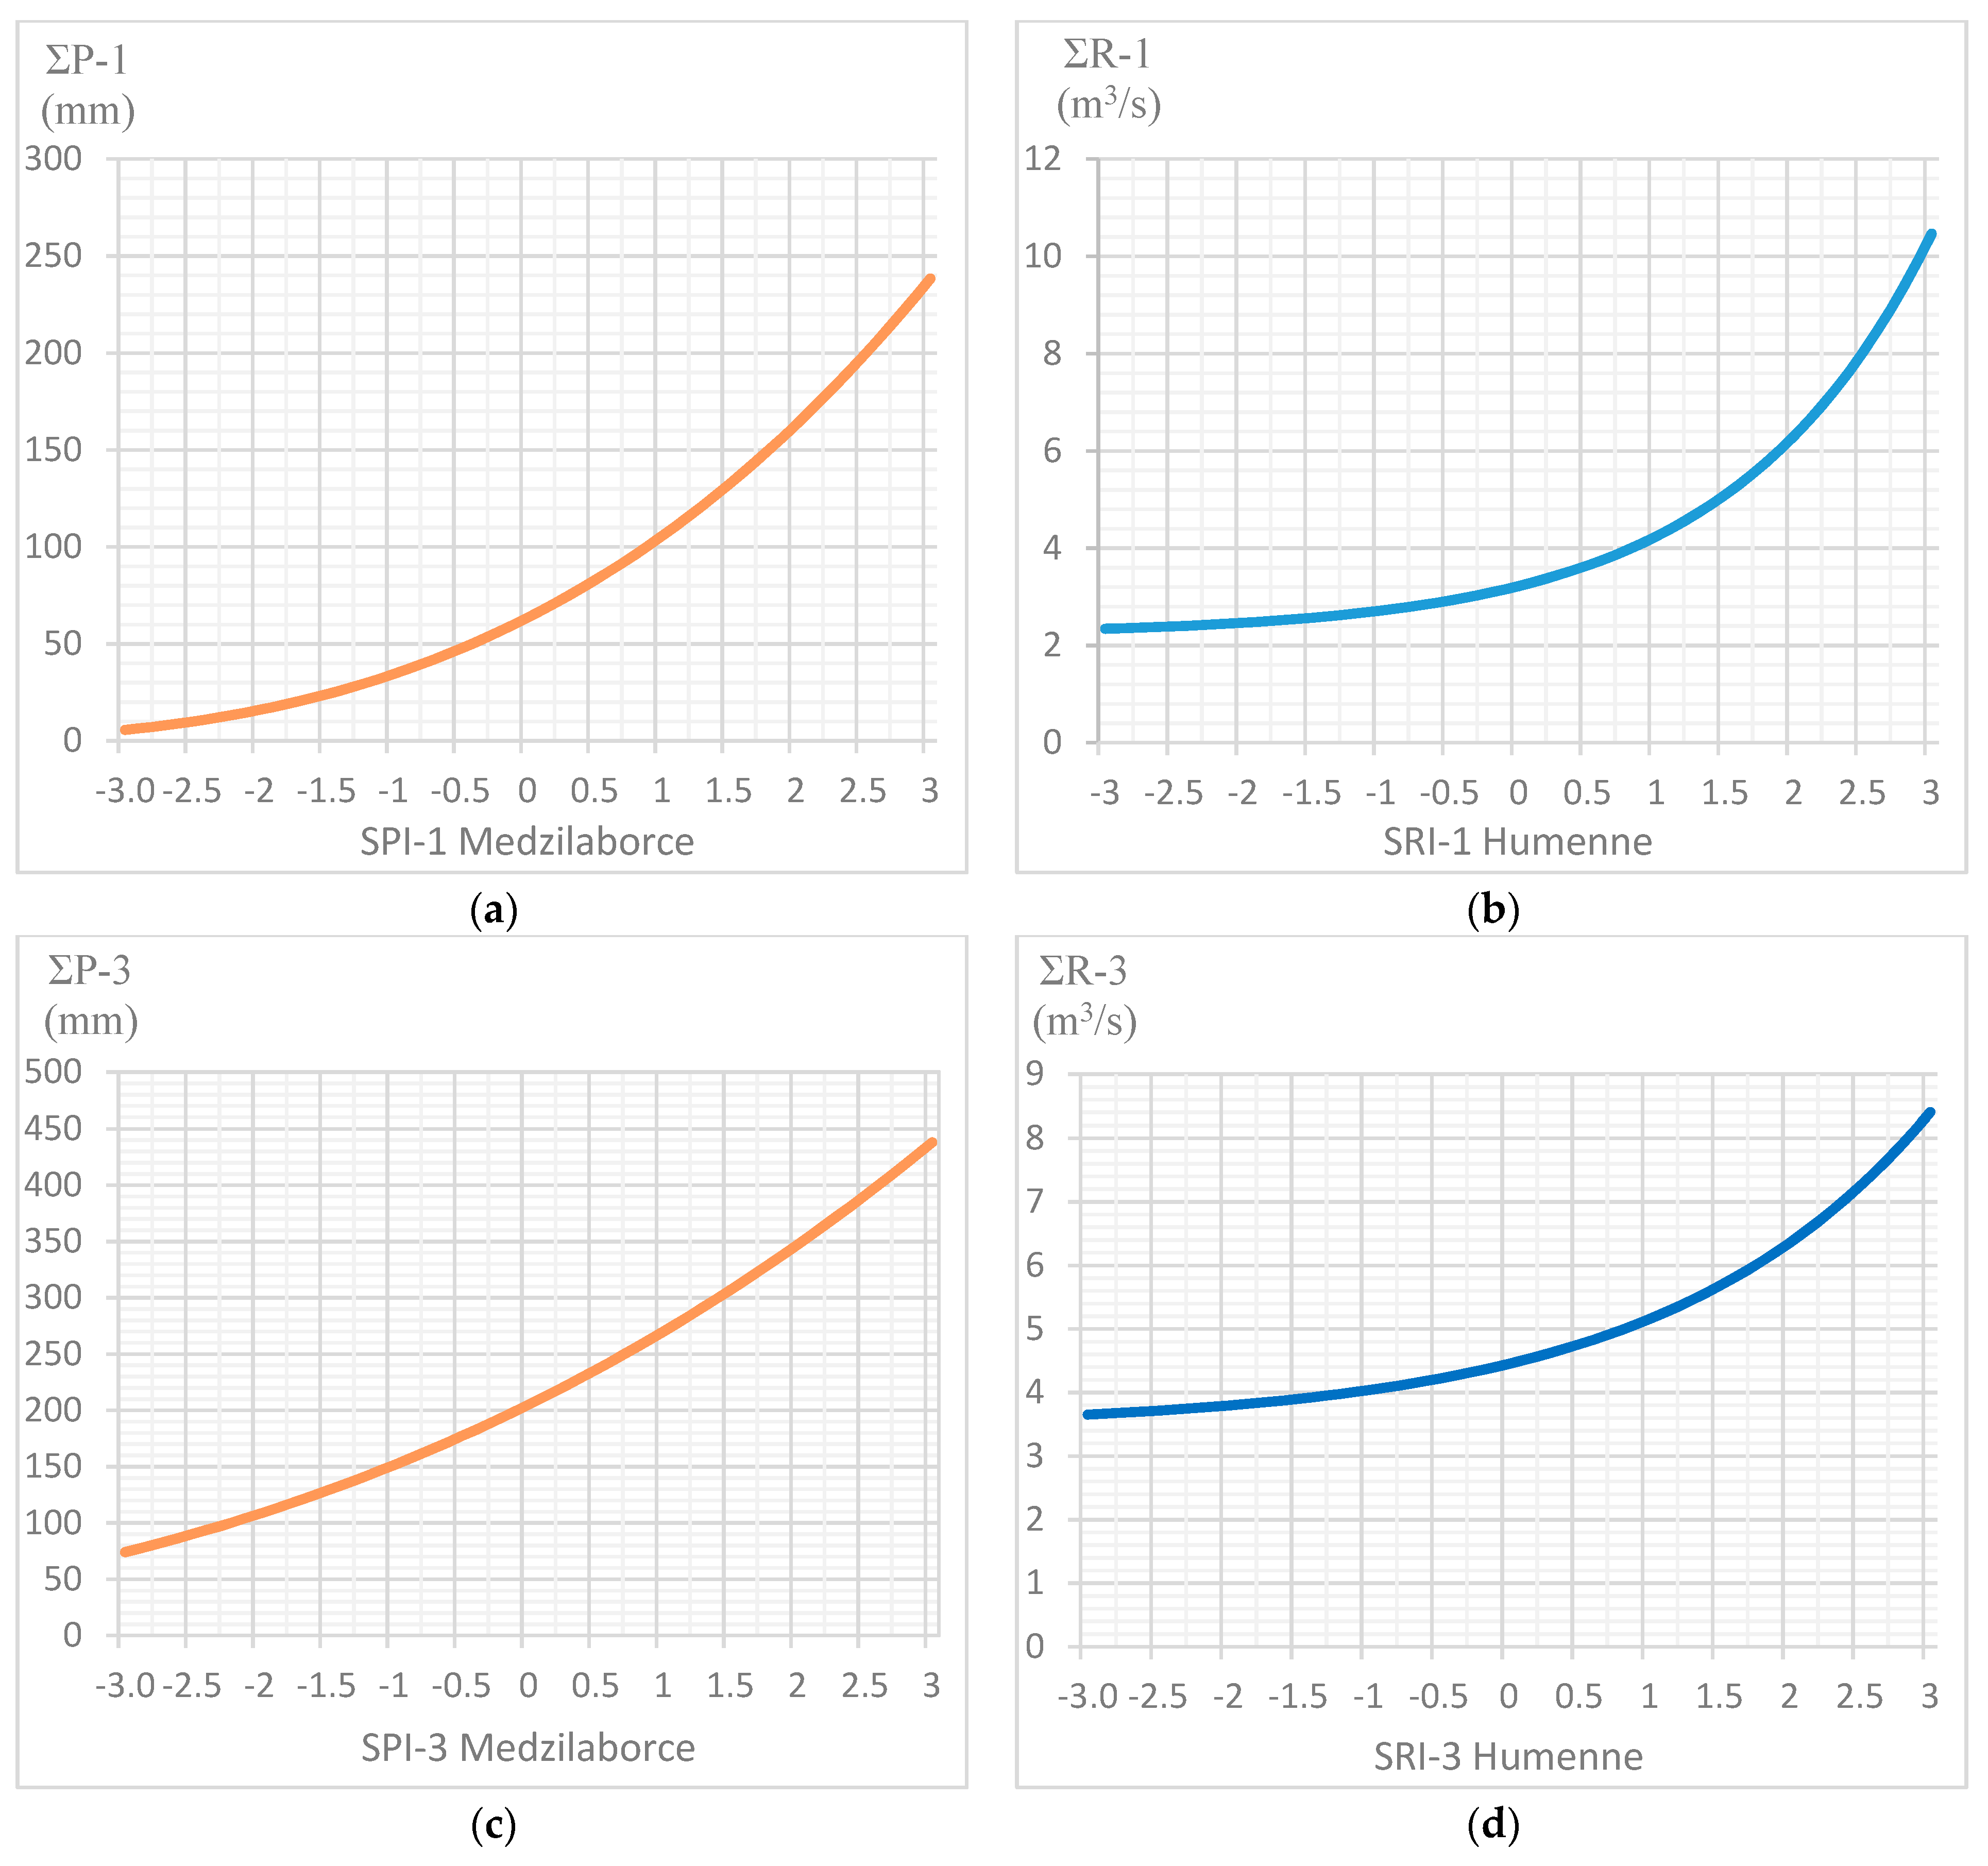
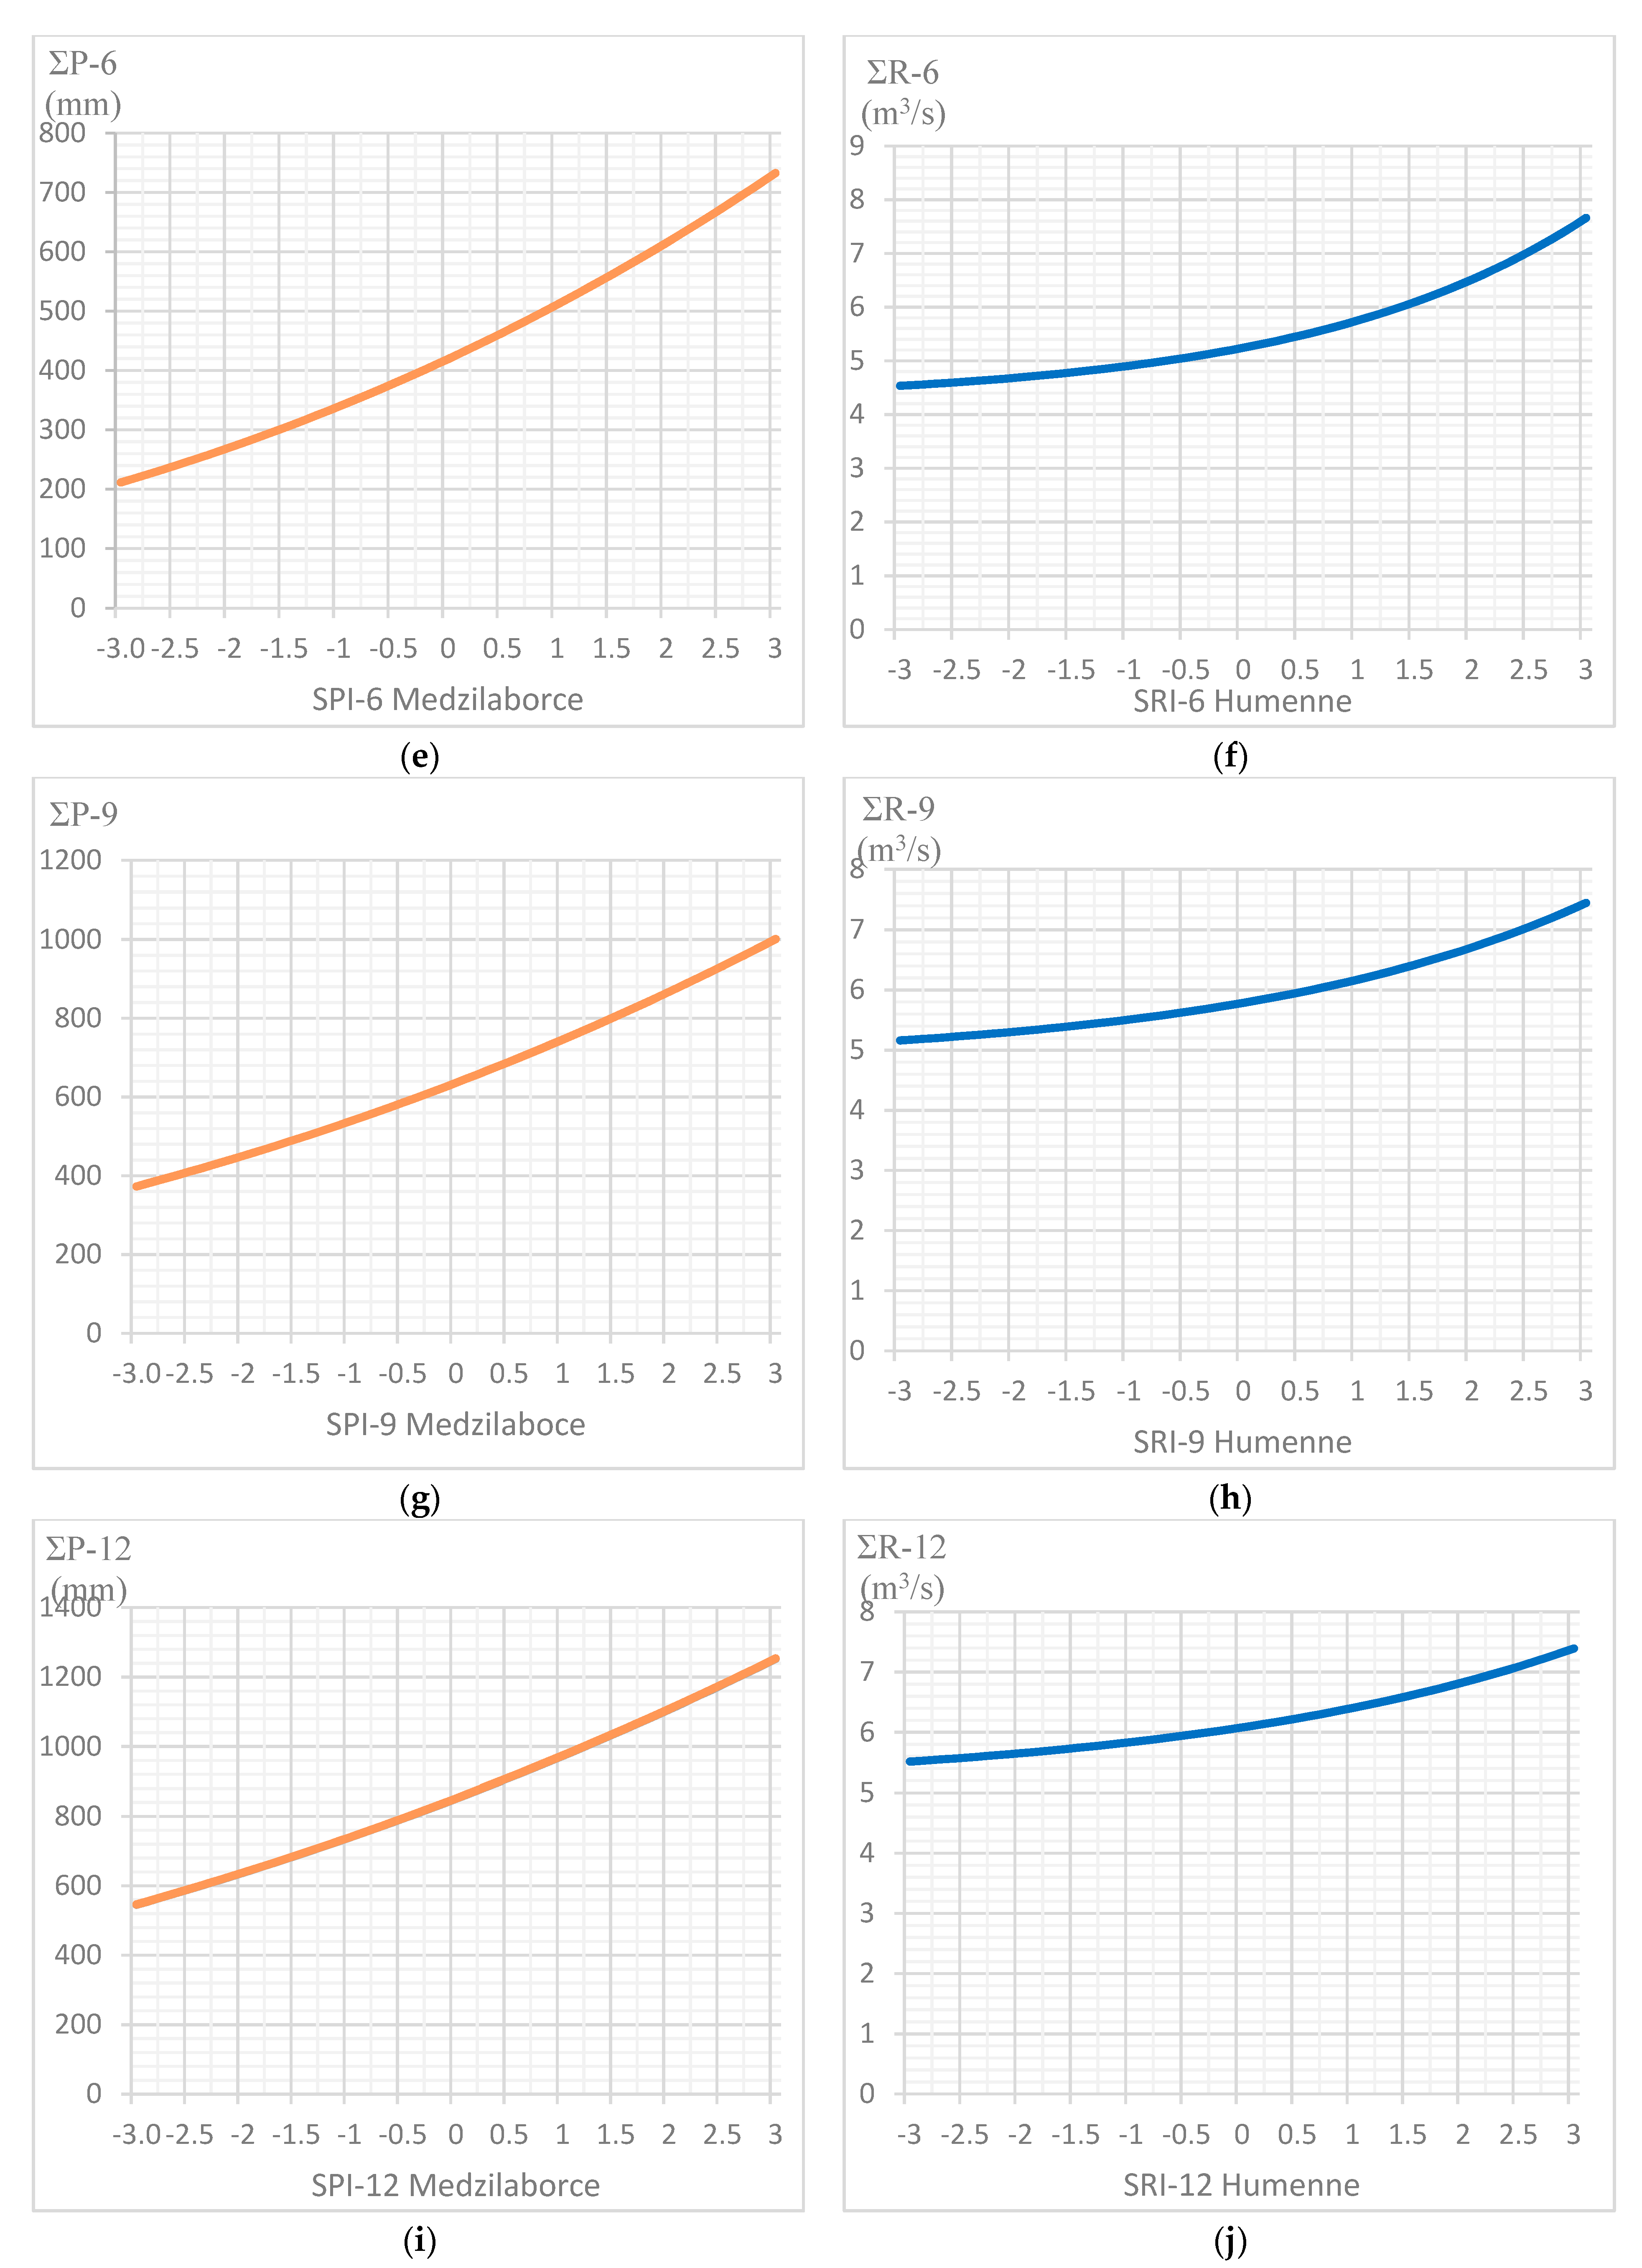
3.4. Relations between Meteorological and Hydrological Droughts

The detailed course of SPI and SRI values over different periods of accumulation is presented using the example of the Humenne hydrological station and Medzilaborce meteorological station (Figure 5). In the analyzed period 1970–2019, the dry years are separated by wet years. The course of hydrological drought expressed by the SRI was similar to those of the SPI. Undoubtedly, the fluctuation and variability of the SPI and SRI series show consistent patterns over the studied period. However, the degree of consistency changed over time (years 1970–2019).
The Pearson correlation coefficient was used to determine the relationship between meteorological droughts and hydrological droughts based on the SPI and SRI values (Table 9).
The highest annual correlation coefficient (r = 0.72) was found between SRI-6 at the Humenne station and SPI-9 at the Medzilaborce station. A similar relationship appeared between SRI-6 at the Humenne station and SPI-9 at the Kamenica station (r = 0.69). As indicated by the cross-relationships established in different periods of accumulation of flows and precipitation, hydrological droughts appeared as a result of meteorological droughts with a three-month delay. The correlation coefficients between the SRI and SPI in individual months reached different values. High correlations between the SPI and SRI were noted in longer accumulation periods (6 to 12 months). The highest correlation (0.86) was recorded between SPI-9 and SRI-6 in December. High correlations (above 0.7) were also recorded in shorter accumulation periods (1 and 3 months) and occurred in the summer (VI–VIII) and autumn (X–XI) months. The lowest correlations or their complete absence were recorded mainly in January and February in the short period of accumulation, which should be associated with the occurrence of snowfall and its deposition in the catchment area. The relationship between meteorological droughts in the nine-month accumulation period (SPI-9) for the Medzilaborce station and hydrological droughts at the Humenne station in the six-month accumulation period (SRI-6) is shown in Figure 6.
The correlations between SRI values at the Izkovce station and SPI values at the Medzilaborce, Kamenica, and Michalovce weather stations showed a relationship with much lower strength. The highest annual correlation coefficient (r = 0.69) was found between SRI-6 in the Izkovce profile and SPI-9 at the remaining meteorological stations. The lower dependency strength may have been due to the supply of significant amounts of water via the Uh River, which flows into the Laborec above the Izkovce station. Most of the Uh catchment area lies outside Slovakia.
Taking advantage of the high strength of the correlation between meteorological and hydrological droughts in the Laborec river catchment area, a simple procedure was used that was proposed by Kubiak-Wójcicka and Bąk [14]. It allowed us to determine the intensity of meteorological drought on the basis of current precipitation totals and the intensity of hydrological drought based on current amounts of flow. The SPI and SRI indicators over different time scales and for different stations may differ in their usefulness in drought and flood monitoring. The prepared nomograms were therefore appropriate for specific stations and emphasized the need for the comprehensive consideration of different time scales for the SPI and SRI, which could be used to monitor meteorological and hydrological droughts (Figure 7).
Figure 7 shows representative nomograms that were prepared for the Medzilaborce meteorological station and the Humenne hydrological station. The presented nomograms made it possible to determine the limit values of the sum of precipitation or the sum of flows at a given station in different periods of accumulation at which wet or dry periods could be expected to occur. In practice, the proposed nomograms can be used to forecast meteorological and hydrological droughts in the coming months.

4. Discussion

The analysis of meteorological phenomena and subsequently hydrological phenomena is an issue under increasing consideration by many researchers. They are devoting the most attention to extreme hydrometeorological events, such as floods and droughts, due to the economic losses they entail. Establishing the relationship between precipitations and river flows within a catchment area can be used for early warnings of extreme events.
The results obtained in this study relate to drought and flood phenomena alike, which were recorded within the analyzed Laborec river catchment area. The selection of standardized indicators for the assessment of extreme weather events made it possible to compare meteorological droughts with hydrological droughts in different parts of the catchment area. As shown by the analysis, the annual correlations between meteorological droughts and hydrological droughts in the Laborec river basin were at a high level (above 0.7). The response of the catchment area to an excess or shortage of precipitation is visible with a three-month delay. To a large extent, the impact of meteorological drought on hydrological drought was conditioned by the physical and geographical conditions of the catchment area (geological structure, land use, catchment size). Strong correlations between meteorological and hydrological droughts were confirmed in short accumulation periods of 1–2 months by Vicente-Serrano and López-Moreno [51] for small rivers in the Mediterranean region, as well as selected regions of China [52]. In the catchments of rivers located in semi-arid and arid zones, the highest correlations between droughts were obtained with a delay of 3–4 months [53]. The greatest correlation strength was most common in small mountain catchments. In the case of the Laborec River, the strongest correlation occurred in the accumulation periods of 6 and 9 months. In small lowland river catchments with a high degree of soil permeability in northern Poland, the highest annual correlation coefficient (r = 0.63) was obtained for a period of 9 and 12 months [54,55]. Research conducted in Turkey showed a one-year delay time correlation between meteorological and hydrological droughts [56]. Smaller correlation coefficients between droughts (annual r above 0.5) were identified by Ljubenkov and Cindrić Kalin [57] for accumulation periods above 6, 9, and 12 months in the Croatian region of Dalmatia.
In the case of large catchments, the strength of the correlation between SPI and SRI was much lower, and the highest correlation coefficients were recorded over longer periods of accumulation. An example is the Vistula river basin, where the greatest strength of the relationship occurred over periods of 18 and 24 months [14]. Relatively low correlation values (below r = 0.5) between droughts were noted by Rimkus et al. [58] in the Neman river basin, which was conditioned by snowfall. Understanding the catchment response time to changing meteorological conditions is an extremely important issue that will allow people to prepare early enough for the possibility of extreme events. As presented, the correlations between precipitations and flows are different in particular regions and climatic zones. Analysis of the correlation between the SPI and SRI over many time scales shows that the catchment area produces a weaker response to precipitation over short time scales, and this changes gradually as the accumulation period increases. The strongest annual correlations were obtained between the periods of 9-month precipitation and 6-month flow accumulation.

5. Conclusions

This work focused on the use of standardized indicators to calculate the frequency of dry and wet periods in the Laborec river catchment in Slovakia. The relationship between precipitation and flow was assessed on the basis of the standardized precipitation index (SPI) and the standardized flow index (SRI). Fluctuations in the SPI and SRI time series over different time scales were to some extent consistent and correlated, and the correlation increased with lengthening time scales (1970–2019). The highest annual correlation coefficient (r = 0.72) was recorded between SRI-6 at the Humenne hydrometric station and SPI-9 at the Medzilaborce meteorological station in the upper part of the Laborec river basin. In the lower part of the catchment, the strongest annual correlation (r = 0.69) was obtained between the Izkovce and Kamenica gauging stations. The conducted analysis showed that in the case of the Laborec river catchment area, there was a strong correlation between the occurrence of meteorological drought and hydrological drought. Using the knowledge of this relationship, the response time of the catchment to changing meteorological conditions can be predicted. The prepared nomograms are a tool for monitoring extreme phenomena based on the current amounts of precipitations and flows. The proposed method may be useful for the early detection and warning of droughts and floods, enabling the implementation of preventive measures and limiting economic losses, which was not done before for the study area.
The analysis of meteorological and hydrological conditions using short-term and long-term data is an important step toward establishing effective and comprehensive monitoring and an early warning system against extreme weather events. Understanding the specific response of the catchment area to an excess or shortage of precipitation will facilitate the possibility of enhancing adaptation to climate change.

Author Contributions

Conceptualization, K.K.-W.; methodology, K.K.-W.; formal analysis, K.K.-W. and M.Z.; resources, M.Z. and H.H.; data curation, H.H. and P.N.; investigation, K.K.-W., H.F.A.-E., and M.Z.; writing—original draft preparation, K.K-W.; writing—review and editing, K.K.-W., P.N., M.Z., H.H., and H.F.A.-E. All authors have read and agreed to the published version of the manuscript.

Funding

This research received no external funding.

Institutional Review Board Statement

Not applicable.

Informed Consent Statement

Not applicable.

Data Availability Statement

The data are not publicly available due to institutional property rights.

Acknowledgments

This article was created thanks to the financing of Katarzyna Kubiak-Wójcicka’s three-month stay in Slovakia as part of the National Scholarship Programme of the Slovak Republic for the Support of Mobility of Students, Ph.D. Students, University Teachers, Researchers, and Artists in the academic year 2020/2021. The program was managed by SAIA, n.o. This work was supported by the Ministry for Education of the Slovak Republic through project VEGA 1/0308/20: “Mitigation of hydrological hazards—floods and droughts—by exploring extreme hydroclimatic phenomena in river basins” and by the Slovak Research and Development Agency through projects SK-PT-18-0008 “Hydrological risk: from excess to scarcity of water” and SK-PL-18-0033 “Environmental risk assessment in the aspect of adaptation to climate change.”

Conflicts of Interest

The authors declare no conflict of interest.

References

  1. Blauhut, V.; Gudmundsson, L.; Stahl, K. Towards pan-European drought risk maps: Quantifying the link between drought indices and reported drought impacts. Environ. Res. Lett. 2015, 10, 1–10. [Google Scholar] [CrossRef]
  2. Kubiak-Wójcicka, K.; Machula, S. Influence of climate changes on the state of water resources in Poland and their usage. Geosciences 2020, 10, 312. [Google Scholar] [CrossRef]
  3. Kubiak-Wójcicka, K.; Chodkowska-Miszczuk, J.; Rogatka, K. Integration or disintegration of the ecological and urban functions of the river in the city? A Polish perspective. Transylv. Rev. Adm. Sci. 2017, 52, 59–76. [Google Scholar] [CrossRef]
  4. EEA. 2021. Available online: https://www.eea.europa.eu/data-and-maps/indicators/direct-losses-from-weather-disasters-4/assessment (accessed on 15 March 2021).
  5. IPCC (Intergovernmental Panel for Climatic Change). Working Group II: Impacts, Adaptation and Vulnerability. Extreme High Temperature and Precipitation Events. 2012. Available online: http://www.ipcc.ch/ipccreports/tar/wg2/index.php?idp=625 (accessed on 15 May 2015).
  6. Dikici, M. Drought analysis with different indices for the Asi Basin (Turkey). Sci. Rep. 2020, 10, 20739. [Google Scholar] [CrossRef]
  7. Kubiak-Wójcicka, K. Variability of air temperature, precipitation and outflows in the Vistula Basin (Poland). Resources 2020, 9, 103. [Google Scholar] [CrossRef]
  8. Bąk, B.; Kubiak-Wójcicka, K. Assessment of meteorological and hydrological drought in Torun (central Poland town) in 1971–2010 based on standardized indicators. In Proceedings of Water Resources and Wetlands, 3rd International Conference, 2016; pp. 164–170. Available online: http://www.limnology.ro/wrw2016/proceedings/22_Bak_Kubiak.pdf (accessed on 10 November 2020).
  9. Zhou, J.; Li, Q.; Wang, L.; Lei, L.; Huang, M.; Xiang, J.; Feng, W.; Zhao, Y.; Xue, D.; Liu, C.; et al. Impact of climate change and land-use on the propagation from meteorological drought to hydrological drought in the Eastern Qilian Mountains. Water 2019, 11, 1602. [Google Scholar] [CrossRef] [Green Version]
  10. Kobrossi, J.; Karam, F.; Mitri, G. Rain pattern analysis using the Standardized Precipitation Index for long-term drought characterization in Lebanon. Arab. J. Geosci. 2021, 14, 44. Available online: https://doi.org/10.1007/s12517-020-06387-3 (accessed on 20 April 2021). [CrossRef]
  11. Zeleňáková, M.; Purcz, P.; Blišťan, P.; Vranayová, Z.; Hlavatá, H.; Diaconu, D.C.; Portela, M.M. Trends in Precipitation and Temperatures in Eastern Slovakia (1962–2014). Water 2018, 10, 727. [Google Scholar] [CrossRef] [Green Version]
  12. Tigkas, D.; Vangelis, H.; Tsakiris, G. Drought and climatic change impact on streamflow in small watersheds. Sci. Total Environ. 2012, 440, 33–41. [Google Scholar] [CrossRef] [PubMed]
  13. Barker, L.J.; Hannaford, J.; Chiverton, A.; Svensson, C. From meteorological to hydrological drought using standardised indicators. HESS 2016, 20, 2483–2505. [Google Scholar] [CrossRef] [Green Version]
  14. Kubiak-Wójcicka, K.; Bąk, B. Monitoring of meteorological and hydrological droughts in the Vistula basin (Poland). Environ. Monit. Assess. 2018, 190, 691. [Google Scholar] [CrossRef] [Green Version]
  15. Sahoo, R.N.; Dutta, D.; Khanna, M.; Kumar, N.; Bandyopadhyay, S.K. Drought assessment in the Dhar and Mewat Districs of India using meteorological and remote-sensing derived indices. Nat. Hazards 2015, 77, 733–751. [Google Scholar] [CrossRef]
  16. Zhao, L.; Wu, J.; Fang, J. Robust response of streamflow drought to different timescales of meteorological drought in Xiangjiang River basin of China. Adv. Meteorol. 2016, 1634787. [Google Scholar] [CrossRef] [Green Version]
  17. Sutanto, S.J.; Wetterhall, F.; Van Lannen, H.A.J. Hydrological drought forecasts outperform meteorological drought Forecasts. Environ. Res. Lett. 2020, 15, 084010. [Google Scholar] [CrossRef]
  18. Koffi, B.; Kouadio, Z.A.; Kouassi, K.H.; Yao, A.B.; Sanchez, M.; Kouassi, K.L. Impact of meteorological drought on streamflows in the Lobo River catchment at Nibéhibé, Côte d’Ivoire. JWARP 2020, 12, 495–511. [Google Scholar] [CrossRef]
  19. Gocic, M.; Trajkovic, S. Drought Characterisation Based on Water Surplus Variability Index. Water Resour. Manage. 2014, 28, 3179–3191. [Google Scholar] [CrossRef]
  20. Vasiliades, L.; Loukas, A. Hydrological response to meteorological drought using the Palmer drought indices in Thessaly, Greece. Desalination 2009, 237, 3–21. [Google Scholar] [CrossRef]
  21. Vicente-Serrano, S.M.; Beguería, V.; Lorenzo-Lacruz, J.; Camarero, J.J.; López-Moreno, J.I.; Azorin-Molina, C.; Revuelto, J.; Morán-Tejeda, E.; Sanchez-Lorenzo, A. Performance of drought indices for ecological, agricultural, and hydrological applications. Earth Interact. 2012, 16, 1–27. [Google Scholar] [CrossRef] [Green Version]
  22. Zeleňáková, M.; Jothiprakash, V.; Arjun, S.; Káposztásová, D.; Hlavatá, H. Dynamic Analysis of Meteorological Parameters in Košice Climatic Station in Slovakia. Water 2018, 10, 702. [Google Scholar] [CrossRef] [Green Version]
  23. Jain, K.V.; Pandey, P.R.; Jain, M.K.; Byun, H.-R. Comparison of drought indices for appraisal of drought characteristics in the Ken River Basin. Weather Clim. Extremes 2015, 8, 1–11. [Google Scholar] [CrossRef] [Green Version]
  24. Bae, H.; Ji, H.; Lim, Y.-L.; Ryu, Y.; Kim, M.-H.; Kim, B.-J. Characteristics of drought propagation in South Korea: Relationship between meteorological, agricultural, and hydrological droughts. Nat. Hazards 2019, 99, 1–16. [Google Scholar] [CrossRef] [Green Version]
  25. Zhu, N.; Xu, J.; Wang, C.; Chen, Z.; Luo, Y. Modeling the multiple time scale response of hydrological drought to climate change in the data-scarce inland river basin of Northwest China. Arab. J. Geosci. 2019, 12, 225. [Google Scholar] [CrossRef]
  26. Croitoru, A.E.; Minea, I. The impact of climate changes on rivers discharge in Eastern Romania. Theor. Appl. Climatol. 2015, 120, 563–573. [Google Scholar] [CrossRef]
  27. Zeleňáková, M.; Vido, J.; Portela, M.C.A.S.; Purcz, P.; Blišt’an, P.; Hlavatá, H.; Hluštík, P. Precipitation trends over Slovakia in the Period 1981–2013. Water 2017, 9, 922. [Google Scholar] [CrossRef] [Green Version]
  28. Vido, J.; Tadesse, T.; Šustek, Z.; Kandrík, R.; Hanzelová, M.; Škvarenina, J.; Škvareninová, J.; Hayes, M. Drought Occurrence in Central European Mountainous Region (Tatra National Park, Slovakia) within the Period 1961–2010. Adv. Meteorol. 2015, 248728. [Google Scholar] [CrossRef] [Green Version]
  29. Fendeková, M.; Gauster, T.; Labudová, L.; Vrablíková, D.; Danáčová, Z.; Fendek, M.; Pekárová, P. Analysing 21st century meteorological and hydrological drought events in Slovakia. J. Hydrol. Hydromech. 2018, 66, 393–403. [Google Scholar] [CrossRef] [Green Version]
  30. Kubiak-Wójcicka, K.; Zeleňáková, M.; Purcz, P.; Simonová, D. The use of a Standardized Runoff Indicator for hydrological characterization of selected rivers of Poland and Slovakia. Middle Pomeranian Sci. Soc. Environ. Prot. 2019, 21, 167–183. Available online: http://ros.edu.pl/images/roczniki/2019/010_ROS_V21_R2019.pdf (accessed on 15 January 2021).
  31. Nagy, P.; Zelenakova, M.; Kapostasova, D.; Hlavata, H.; Simonova, D. Identification of dry and wet years in eastern Slovakia using indicies. IOP Conf. Ser. Earth Environ. Sci. 2020, 444, 012041. [Google Scholar] [CrossRef] [Green Version]
  32. Qi, P.; Xu, Y.J.; Wang, G. Quantifying the individual contributions of climate change, dam construction, and Land Use/Land Cover change to hydrological drought in a Marshy River. Sustainability 2020, 12, 3777. [Google Scholar] [CrossRef]
  33. Kaya, Y.Z.; Zelenakova, M.; Üneş, F.; Demirci, M.; Hlavata, H.; Mesaros, P. Estimation of daily evapotranspiration in Košice City (Slovakia) using several soft computing techniques. Theor. Appl. Climatol. 2021, 144, 287–298. [Google Scholar] [CrossRef]
  34. McKee, T.B.; Doesken, N.J.; Kleist, J. Drought monitoring with multiple time scales. In Proceedings of the 9th Conference of Applied Climatology, Dallas, TX, USA, 15–20 January 1995; pp. 233–236. [Google Scholar]
  35. Ndehedehe, C.E.; Agutu, N.O.; Ferreira, V.G.; Getirana, A. Evolutionary drought patterns over the Sahel and their teleconnections with low frequency climate oscillations. Atmos. Res. 2021, 233, 104700. [Google Scholar] [CrossRef] [Green Version]
  36. Bazrafshan, O.; Zamani, H.; Shekari, M. A copula-based index for drought analysis in arid and semi-arid regions of Iran. Nat. Res. Model. 2020, 33, e12237. [Google Scholar] [CrossRef]
  37. Mohammad, A.H.; Jung, H.C.; Odeh, T.; Bhuiyan, C. Understanding the impact of droughts in the Yarmouk Basin, Jordan: Monitoring droughts through meteorological and hydrological drought indices. Arab. J. Geosci. 2018, 11, 103. [Google Scholar] [CrossRef] [Green Version]
  38. Shukla, S.; Wood, W. Use of a standardised runoff index for characterizing hydrologic drought. Geophys. Res. Lett. 2008, 35, L02405. [Google Scholar] [CrossRef] [Green Version]
  39. Nalbantis, I.; Tsakiris, G. Assessment of Hydrological Drought Revisited. Water Resour. Manage. 2009, 23, 881–897. [Google Scholar] [CrossRef]
  40. Tabari, H.; Nikbathk, J.; Talaee, P.H. Hydrological Drought Assessment in Northwestern Iran Based on Streamflow Drought Index (SDI). Water Resour. Manage. 2013, 27, 137–151. [Google Scholar] [CrossRef]
  41. Konapala, G.; Mishra, A. Quantifying Climate and Catchment Control on Hydrological Drought in the Continental United States. Water Res. Res. 2020, 56, e2018WR024620. [Google Scholar] [CrossRef]
  42. Leščešen, I.; Dolinaj, D.; Pantelić, M.; Telbisz, T.; Varg, G. Hydrological drought assessment of the Tisza river. J. Geogr. Inst. Cvijic. 2020, 70, 89–100. [Google Scholar] [CrossRef]
  43. Kubiak-Wójcicka, K. Dynamics of meteorological and hydrological droughts in the agricultural catchments. Res. Rural Dev. Water Manage. 2019, 1, 111–117. [Google Scholar] [CrossRef]
  44. Bąk, B.; Kubiak-Wójcicka, K. Impact of meteorological drought on hydrological drought in Toruń (central Poland) in the period of 1971–2015. J. Water Land Dev. 2017, 32, 3–12. [Google Scholar] [CrossRef] [Green Version]
  45. Mann, H.B. Non-parametric tests against trend. Econometrica 1945, 13, 245–259. [Google Scholar] [CrossRef]
  46. Kendall, M.G. Rank Correlation Measures; Charles Griffin: London, UK, 1975. [Google Scholar]
  47. Theil, H. A rank-invariant method of linear and poly-nomial regression analysis. Ned. Acad. Wet. Proces. 1950, 53, 386–392, 521–525, 1397–1412. [Google Scholar]
  48. Sen, P.K. Estimates of the regression coefficient based on Kendall’s tau. J. Am. Stat. Assoc. 1968, 63, 1379–1389. [Google Scholar] [CrossRef]
  49. Burn, D.H.; Elnur, M.A.H. Detection of hydrologic trends and variability. J. Hydrol. 2002, 255, 107–122. [Google Scholar] [CrossRef]
  50. Hannaford, J.; Buys, G.; Stahl, K.; Tallaksen, L.M. The influence of decadal-scale variability on trends in long European streamflow records. Hydrol. Earth Syst. Sci. 2013, 17, 2717–2733. [Google Scholar] [CrossRef] [Green Version]
  51. Vicente-Serrano, S.M.; López-Moreno, J.I. Hydrological response to different time scales of climatological drought: An evaluation of the Standardized Precipitation Index in a mountainous Mediterranean basin. Hydrol. Earth Syst. Sci. 2005, 9, 523–533. [Google Scholar] [CrossRef] [Green Version]
  52. Du, J.; Fang, J.; Xu, W.; Shi, P. Analysis of dry/wet conditions using the standardized precipitation index and its potential usefulness for drought/flood monitoring in Hunan Province, China. Stoch. Environ. Res. Risk Assess. 2013, 27, 377–387. [Google Scholar] [CrossRef]
  53. Salimi, H.; Asadi, E.; Darbandi, S. Meteorological and hydrological drought monitoring using several drought indices. Appl. Water Sci. 2021, 11, 11. [Google Scholar] [CrossRef]
  54. Kubiak-Wójcicka, K. The course of hydrological droughts in the river Drawa catchment (northern Poland) as characterized by the Standardized Runoff Index. In AIP Conference Proceedings, Proceedings of the International Conference of Computational Methods in Sciences and Engineering 2019 (ICCMSE-2019), Rhodes, Greece, 1–5 May 2019; AIP Publishing LLC: Melville, NY, USA, 2019; Volume 2186, p. 120004. [Google Scholar] [CrossRef]
  55. Kubiak-Wójcicka, K.; Juśkiewicz, W. Relationships between meteorological and hydrological drought in a young-glacial zone based on Standardised Precipitations Index (SPI) and Standardised Runoff Index (SRI). Acta Montanistica Slovaca 2020, 25, 517–531. [Google Scholar] [CrossRef]
  56. Gumus, V.; Algin, H.M. Meteorological and hydrological drought analysis of the Seyhan-Ceyhan river basins, Turkey. Meteorol. Appl. 2017, 24, 62–73. [Google Scholar] [CrossRef]
  57. Ljubenkov, I.; Cindrić Kalin, K. Evaluation of drought using standardised precipitation and flow indices and their correlations on an example of Sinjsko polje. Gradevinar 2016, 2, 135–143. [Google Scholar] [CrossRef]
  58. Rimkus, E.; Stonevičius, E.; Korneev, V.; Kažys, J.; Valiuškevičius, G.; Pakhomau, A. Dynamics of meteorological and hydrological droughts in the Neman river basin. Environ. Res. Lett. 2013, 8, 045014. [Google Scholar] [CrossRef]
Figure 1. Study area.
Water 13 01413 g001
Figure 2. Anomalies of the annual precipitation (P) totals relative to the average value from the multi-year period 1970–2019 at selected meteorological stations.
Water 13 01413 g002
Figure 3. Average, maximum, and minimum flows of the Laborec River at Humenne gauging station in the hydrological years 1970–2019.
Water 13 01413 g003
Figure 4. Average, maximum, and minimum flows of the Laborec River at Izkovce gauging station in the hydrological years 1975–2019.
Water 13 01413 g004
Figure 5. The course of the SRI values at the Humenne station against the background of the SPI values at the Medzilaborce station in different periods of accumulation (1970–2019). (a) SRI-1 and SPI-1 (b) SRI-1 and SPI-3 (c) SRI-1 and SPI-6 (d) SRI-1 and SPI-9 (e) SRI-1 and SPI-12.
Water 13 01413 g005aWater 13 01413 g005bWater 13 01413 g005c
Figure 6. Correlation between SPI-9 at the Medzilaborce station and SRI-6 at the Humenne station in the period 1970–2019.
Water 13 01413 g006
Figure 7. Example of nomograms for determining meteorological droughts for the Medzilaborce meteorological station and determining hydrological droughts for the Humenne hydrological station. (a) ΣP-1 and SPI-1 (b) ΣR-1 and SRI-1 (c) ΣP-3 and SPI-3 (d) ΣR-3 and SRI-3 (e) ΣP-6 and SPI-6 (f) ΣR-6 and SRI-6 (g) ΣP-9 and SPI-9 (h) ΣR-9 and SRI-9 (i) ΣP-12 and SPI-12 (j) ΣR-12 and SRI-12.
Water 13 01413 g007aWater 13 01413 g007b
Table 1. The classification scale for the SPI and SRI values [14,30,34].
SPI, SRI ValueCategory
SPI, SRI ≥ 2.0Extremely wet
2.0 > SPI, SRI ≥ 1.5Severely wet
1.5 > SPI, SRI ≥ 1.0Moderately wet
1.0 > SPI, SRI > −1.0Normal
−1.0 ≥ SPI, SRI > −1.5Moderately dry
−1.5 ≥ SPI, SRI > −2.0Severely dry
SPI, SRI ≤ −2.0Extremely dry
Table 2. Average annual precipitation totals in 1970–2019.
Meteorological
Station
Altitude,
m a.s.l.
Average Annual Precipitation, mmPrecipitation Max,
mm (year)
Precipitation Min,
mm (year)
Medzilaborce326858.81174.7 (2010)606.2 (2015)
Kamenica 178734.61055.4 (2010)540.9 (2003)
Michalovce115637.1943.9 (2010)424.2 (2015)
Table 3. Statistical characteristics of the meteorological data (1970–2019).
StationTrend,
mm/10 Years
Mann–Kendall S Statistic Normalized Test Z Statistic Probability/Trend
Medzilaborce
Kamenica
Michalovce
2.22
−1.39
10.34
166
91
217
1.380
0.753
1.807
Non-significant
Non-significant
Non-significant
Table 4. Statistical characteristics of the hydrological data in the years 1970–2019.
StationTrend,
m3/s/10 Years
Mann–Kendall S StatisticNormalized Test Z StatisticProbability/Trend
Humenne
Izkovce *
0.79
2.95
287
222
2.392
2.162
Significant
Significant
* Years 1975–2019.
Table 5. SPI parameters over various time scales for the Medzilaborce, Kamenica, and Michalovce meteorological stations in the period 1970–2019.
ParametersSPI-1SPI-3SPI-6SPI-9SPI-12
Medzilaborce
Number of wet
months (SRI > 1.0)
9388907982
Number of dry
months (SRI < −1.0)
93921079886
Index maximum
value (month)
2.95
(V 2010)
3.22
(XII 1975)
2.92
(IX 2010)
2.95
(IX 2010)
3.35
(IX 2010)
Index minimum
value (month)
−4.68
(III 1974)
−2.84
(VIII 1976)
−2.73
(V 1973)
−2.40
(IV 1974)
−2.63
(VIII 2015)
Kamenica
Number of wet
months (SRI > 1.0)
8399949696
Number of dry
months (SRI < −1.0)
9391988693
Index maximum
value (month)
3.33
(V 2010)
3.20
(XII 1975)
3.01
(IX 2010)
3.05
(IX 2010)
3.40
(IX 2010)
Index minimum
value (month)
−3.93
(XI 2012)
−2.71
(XI 1987)
−2.72
(VII 2003)
−2.89
(VII 2003)
−2.40
(VI 2014)
Michalovce
Number of wet
months (SRI > 1.0)
909710197110
Number of dry
months (SRI < −1.0)
89991029694
Index maximum
value (month)
2.55
(X 1974)
2.70
(XII 1975)
2.71
(VI 2010)
3.40
(VI 2010)
3.11
(IX 2010)
Index minimum
value (month)
−3.82
(XI 2012)
−2.74
(XI 1987)
−2.76
(V 1973)
−2.75
(XI 1987)
−2.71
(I, II 1987)
Table 6. SRI parameters over various time scales for Humenne and Izkovce hydrological stations in the period 1970–2019.
ParametersSRI-1SRI-3SRI-6SRI-9SRI-12
Humenne
Number of wet
months (SRI > 1.0)
106991059496
Number of dry
months (SRI < −1.0)
1059995100104
Index maximum
value (month)
3.12
(X 1974)
2.81
(X 1974)
2.70
(XI 1975)
2.43
(II (1975)
2.39
(XII 1975)
Index minimum
value (month)
−2.95
(XII 1987)
−3.38
(I 1987)
−2.89
(I 1987)
−2.66
(III 1984)
−2.43
(VI 1984)
Izkovce *
Number of wet
months (SRI > 1.0)
8787878278
Number of dry
months (SRI < −1.0)
7874748696
Index maximum
value (month)
3.16
(VII 1980)
3.04
(VIII 1980)
3.05
(XI 1981)
2.52
(XII 1981)
2.30
(XII 2011)
Index minimum
value (month)
−3.11
(IX 2015)
−3.10
(X 2015)
−2.93
(I 2019)
−2.78
(IV 2019)
−2.83
(IV 2019)
* Years 1975–2019.
Table 7. SPI parameters over various time scales for Medzilaborce, Kamenica, and Michalovce hydrological stations in the period 1970–2019.
IndexExtremely Wet
SPI > 2.0
Severely Wet
2.0 > SPI > 1.5
Moderately Wet
1.5 > SPI > 1.0
Normal
1.0 > SPI > −1.0
Moderately Dry
−1.0 < SPI < −1.5
Severely Dry
−1.5 > SPI > −2.0
Extremely Dry
SPI < −2.0
Medzilaborce
SPI-11.174.1710.1768.679.174.002.67
SPI-32.834.007.8370.008.834.002.50
SPI-63.173.178.8367.0011.834.831.17
SPI-94.002.177.0070.339.175.501.83
SPI-124.502.676.6771.677.834.831.83
Kamenica
SPI-11.672.839.3370.678.673.833.00
SPI-32.002.8311.6767.838.505.002.17
SPI-62.673.0010.1767.8310.174.002.17
SPI-93.003.179.8369.678.833.831.67
SPI-122.835.507.6768.509.335.670.50
Michalovce
SPI-11.175.008.8370.177.834.332.67
SPI-31.174.8310.1767.3310.334.002.17
SPI-61.834.3310.6765.8310.004.672.67
SPI-91.504.3310.3367.839.173.833.00
SPI-122.005.1711.1765.679.334.172.50
Table 8. SRI parameters over various time scales for the Humenne and Izkovce hydrological stations in the period 1970−2019.
IndexExtremely Wet
SRI > 2.0
Severely Wet
2.0 > SRI > 1.5
Moderately Wet
1.5 > SRI > 1.0
Normal
1.0 > SRI > −1.0
Moderately Dry
−1.0 < SRI < −1.5
Severely Dry
−1.5 > SRI > −2.0
Extremely Dry
SRI < −2.0
Humenne
SRI-12.174.0011.5064.8311.005.331.17
SRI-31.674.5010.3367.008.836.331.33
SRI-61.673.5012.3366.679.173.832.83
SRI-92.334.179.1767.679.675.171.83
SRI-121.835.508.6766.679.836.331.17
Izkovce *
SRI-12.224.269.6369.449.153.702.59
SRI-31.674.2810.2270.076.883.723.16
SRI-60.934.4911.0369.536.363.743.93
SRI-91.694.329.5967.868.655.452.44
SRI-121.524.738.7166.8610.614.732.44
* Years 1975–2019.
Table 9. Correlation coefficients between the meteorological drought and hydrological drought using the SPI for Medzilaborce vs. the SRI for Humenne.
Drought IndexXIXIIIIIIIIIVVVIVIIVIIIIXX
SPI-1 vs. SRI-1
SPI-3 vs. SRI-1
SPI-6 vs. SRI-1
SPI-9 vs. SRI-1
SPI-12 vs. SRI-1
0.62
0.81
0.71
0.68
0.61
0.50
0.47
0.50
0.57
0.52
0.28
0.54
0.50
0.51
0.48
0.25
0.33
0.17
−0.11
−0.05
0.50
0.39
0.52
0.52
0.40
0.38
0.45
0.39
0.42
0.20
0.63
0.69
0.40
0.29
0.17
0.51
0.71
0.38
0.23
0.20
0.69
0.77
0.71
0.54
0.42
0.58
0.73
0.77
0.64
0.57
0.68
0.58
0.57
0.54
0.43
0.72
0.77
0.74
0.64
0.50
SPI-1 vs. SRI-3
SPI-3 vs. SRI-3
SPI-6 vs. SRI-3
SPI-9 vs. SRI-3
SPI-12 vs. SRI-3
0.33
0.80
0.75
0.73
0.62
0.28
0.68
0.76
0.78
0.71
0.00
0.49
0.68
0.69
0.66
0.06
0.50
0.46
0.36
0.42
0.28
0.56
0.69
0.59
0.49
0.29
0.55
0.67
0.56
0.34
0.19
0.60
0.57
0.56
0.44
0.10
0.60
0.51
0.40
0.22
0.31
0.63
0.59
0.42
0.30
0.24
0.69
0.71
0.57
0.46
0.21
0.77
0.80
0.69
0.53
0.34
0.72
0.80
0.78
0.67
SPI-1 vs. SRI-6
SPI-3 vs. SRI-6
SPI-6 vs. SRI-6
SPI-9 vs. SRI-6
SPI-12 vs. SRI-6
0.22
0.50
0.84
0.83
0.67
0.25
0.48
0.82
0.86
0.77
−0.06
0.37
0.74
0.79
0.75
0.06
0.29
0.70
0.66
0.66
0.18
0.25
0.72
0.80
0.77
0.24
0.42
0.71
0.80
0.77
0.01
0.45
0.68
0.72
0.60
0.15
0.43
0.70
0.70
0.53
0.19
0.36
0.58
0.60
0.51
0.19
0.36
0.58
0.60
0.51
0.11
0.37
0.63
0.58
0.48
0.13
0.38
0.70
0.72
0.60
SPI-1 vs. SRI-9
SPI-3 vs. SRI-9
SPI-6 vs. SRI-9
SPI-9 vs. SRI-9
SPI-12 vs. SRI-9
0.24
0.20
0.47
0.64
0.64
0.25
0.32
0.57
0.75
0.71
−0.01
0.33
0.60
0.80
0.78
−0.01
0.26
0.59
0.77
0.78
0.11
0.17
0.57
0.84
0.83
0.24
0.35
0.59
0.77
0.78
−0.08
0.20
0.22
0.28
0.52
0.22
0.32
0.45
0.75
0.75
0.20
0.32
0.52
0.66
0.71
0.20
0.35
0.54
0.70
0.64
0.04
0.28
0.51
0.63
0.64
−0.14
0.14
0.40
0.57
0.59
SPI-1 vs. SRI-12
SPI-3 vs. SRI-12
SPI-6 vs. SRI-12
SPI-9 vs. SRI-12
SPI-12 vs. SRI-12
0.18
0.08
0.41
0.58
0.70
0.25
0.29
0.49
0.67
0.74
−0.01
0.42
0.48
0.63
0.73
−0.04
0.31
0.41
0.57
0.72
0.14
0.19
0.48
0.70
0.81
0.17
0.24
0.49
0.69
0.83
−0.08
0.20
0.22
0.28
0.52
0.29
0.30
0.37
0.63
0.81
0.20
0.28
0.45
0.57
0.73
0.21
0.39
0.49
0.60
0.70
−0.12
0.23
0.41
0.47
0.67
−0.18
0.02
0.31
0.46
0.59
Publisher’s Note: MDPI stays neutral with regard to jurisdictional claims in published maps and institutional affiliations.

