
Vegetation and Residence Time Interact to Influence Metabolism and Net Nutrient Uptake in Experimental Agricultural Drainage Systems


1
USDA-ARS Southeast Watershed Research Laboratory, Tifton, GA 31794, USA 2 USDA-ARS National Sedimentation Laboratory, Oxford, MS 38655, USA
2
USDA-ARS National Sedimentation Laboratory, Oxford, MS 38655, USA
*
Author to whom correspondence should be addressed.
Water 2021, 13(10), 1416; https://doi.org/10.3390/w13101416
Submission received: 13 April 2021
/
Revised: 29 April 2021
/
Accepted: 13 May 2021
/
Published: 19 May 2021
(This article belongs to the Special Issue Water Quality and Ecological Aspects of Aquatic Ecosystems Influenced by Agricultural Activity)
Abstract
:Agricultural drainage networks within the Lower Mississippi River Basin (LMRB) have potential to attenuate nutrient loading to downstream aquatic ecosystems through best management practices. Nutrient uptake (nitrogen, phosphorus), gross primary production (GPP), ecosystem respiration (ER), and denitrification rates were estimated using a combination of sensor measurements and hourly discrete samples for dissolved nutrients and gases at three hydraulic residence times (2, 4, and 6 h) in three vegetated and three unvegetated ditches. We also measured vegetation and soil nutrient content. GPP and ER were significantly higher in vegetated drainages and increasing hydraulic residence time increased respiration rates. Shorter hydraulic residence times were associated with increased uptake rates for both N and P, and vegetation increased N uptake rates in all hydraulic residence time (HRT) treatments. Vegetation and sediment assimilated N and P over the course of the experiment. Overall, our experimental results demonstrate the strong role of emergent vegetation in nutrient retention and removal processes in agricultural drainage ditch networks.
1. Introduction
It is estimated that 70% of the nitrogen (N) and phosphorus (P) loads to the Gulf of Mexico via the Mississippi River originate from agricultural sources within the basin [1]. N and P runoff may result in a higher incidence of harmful algal blooms, hypoxia-induced degraded habitat for freshwater and marine biodiversity and commercial fisheries, and impacts to other economies that rely on the availability of clean water, all phenomena associated with the outflow of the Mississippi River [2,3]. Reducing ecological impacts of nutrient runoff will require improving nutrient use efficiencies on farms but also require land managers to mitigate nutrient loading through best management practices (BMPs).
Agricultural areas within the Lower Mississippi River Basin (LMRB) are drained by networks of low-gradient, open-canopy ditches and streams that serve as important intermediate aquatic ecosystems between agricultural fields and downstream water bodies that support a variety of uses. These drainage networks are dominated by ditches that traditionally have been viewed as simple conduits to route excess moisture away from farm fields [4]. In fact, the productive farmland of the Mississippi Alluvial Plain (MAP) was not utilized until the early 20th century when much of the region was drained via ditches [5]. While this drainage improved production on existing agricultural lands; actions also encouraged further draining, resulting in the encroachment of agriculture into previously undisturbed lands [5]. Increased and sustained profitability of large-scale row-crop agriculture within the MAP has required increasingly intensive fertilizer inputs of N and P, and yields within the region have doubled in response to the four-fold increase in N fertilizer use since 1950 [6]. Approximately 40% of applied N is utilized by plants [7] with the remainder running off agricultural land into adjacent ditches. Today, drainage ditches remain common features within agroecosystems of the MAP and other alluvial plain regions of the world.
Constructed wetlands are a common management practice for remediation of nutrients in agricultural runoff [8,9,10,11]. Plant uptake, microbial nitrification and denitrification, and substrate adsorption facilitate nutrient removal in constructed wetlands [12,13,14]. However, constructed wetlands can be perceived as taking valuable farmland out of production, thus limiting their adoption as a management practice in agricultural watersheds. Alternatively ditches within existing agricultural drainage networks can act as linear constructed wetlands as they have hydric soils, a diverse community of hydrophytes, and a wide range of soil saturation [15]. Furthermore, ditches may provide other ecosystem benefits including provisioning of food resources and habitat within heavily modified landscapes. Within the MAP and other regions of the world, land managers are beginning to recognize the ecological value of ditches and actively manage them for nutrient processing and other ecosystem benefits [13,14,15,16,17,18].
Two factors can be managed to increase the nutrient processing properties of agricultural ditches: hydraulic residence time (HRT) and wetland vegetation. Increased HRT, the time a parcel of water spends in a given reach, has been shown to be an important factor in the efficacy of nutrient mitigation [19] through either biological or physical processes [20]. A variety of management approaches including alteration of channel morphology, weirs, the construction of two-stage ditches, and vegetation have been used to reduce water velocities and increase HRT in ditches [21,22,23]. Residence time has been shown to increase when vegetation is present in wetlands [24], streams [20], and ditches [25], with dominant species morphology influencing both water flow and resulting sediment dynamics [26,27,28]. Furthermore, increasing vegetation density can reduce turbulence intensity while reducing mean flow rates [27]. Establishment of wetland vegetation can also reduce nutrients and pesticides in ditches by enhancing biological processes common in wetlands [29,30,31,32]. Primary N removal mechanisms include plant uptake, sediment sorption, and microbial processing such as nitrification and denitrification [33]. Metabolism can be a determinant of nitrogen processing rates [34]; in turn, vegetation can amplify gross primary production (GPP) and ecosystem respiration (ER) [35]. Moreover, vegetation has been shown to be particularly effective in reducing nitrate prior to transport downstream. Under in situ field conditions, up to 57% reduction in dissolved inorganic nitrogen (DIN) has been observed over the course of a growing season [15], and denitrification from vegetated ditches has been reported to reduce N loads 28–56% [36,37]. In contrast, ditch sediments can act as sources and sinks of P depending on prior land application rates [38,39]. Ditches may mediate downstream P transport via hyporheic exchange [40], and Everglades ditches were reported to retain up to 55% of soluble reactive phosphorus over a 7d period [41].
However, there is a lack of experimental evidence regarding how interactions between increasing HRT and vegetation affect nutrient retention and removal from agricultural runoff in aquatic agroecosystems. Most studies have relied on empirical observations [18,42]. This is in large part due to the substantial difficulty in replicating agricultural ditches under field conditions as well as challenges associated with controlling HRTs across ditches. In the current study, we used six simulated low-gradient agricultural ditches to experimentally test the influence of vegetation and HRT on metabolism, nutrient uptake, and potential water quality improvements. We tested the following hypotheses: (1) the presence of vegetation will increase rates of GPP, ER, and net nutrient uptake within simulated ditches; (2) increasing HRT will also increase rates of N and P fluxes; and (3) HRT and vegetation will positively interact to reduce nutrient export from ditch environments during nutrient loading events.
2. Materials and Methods
2.1. Study Site
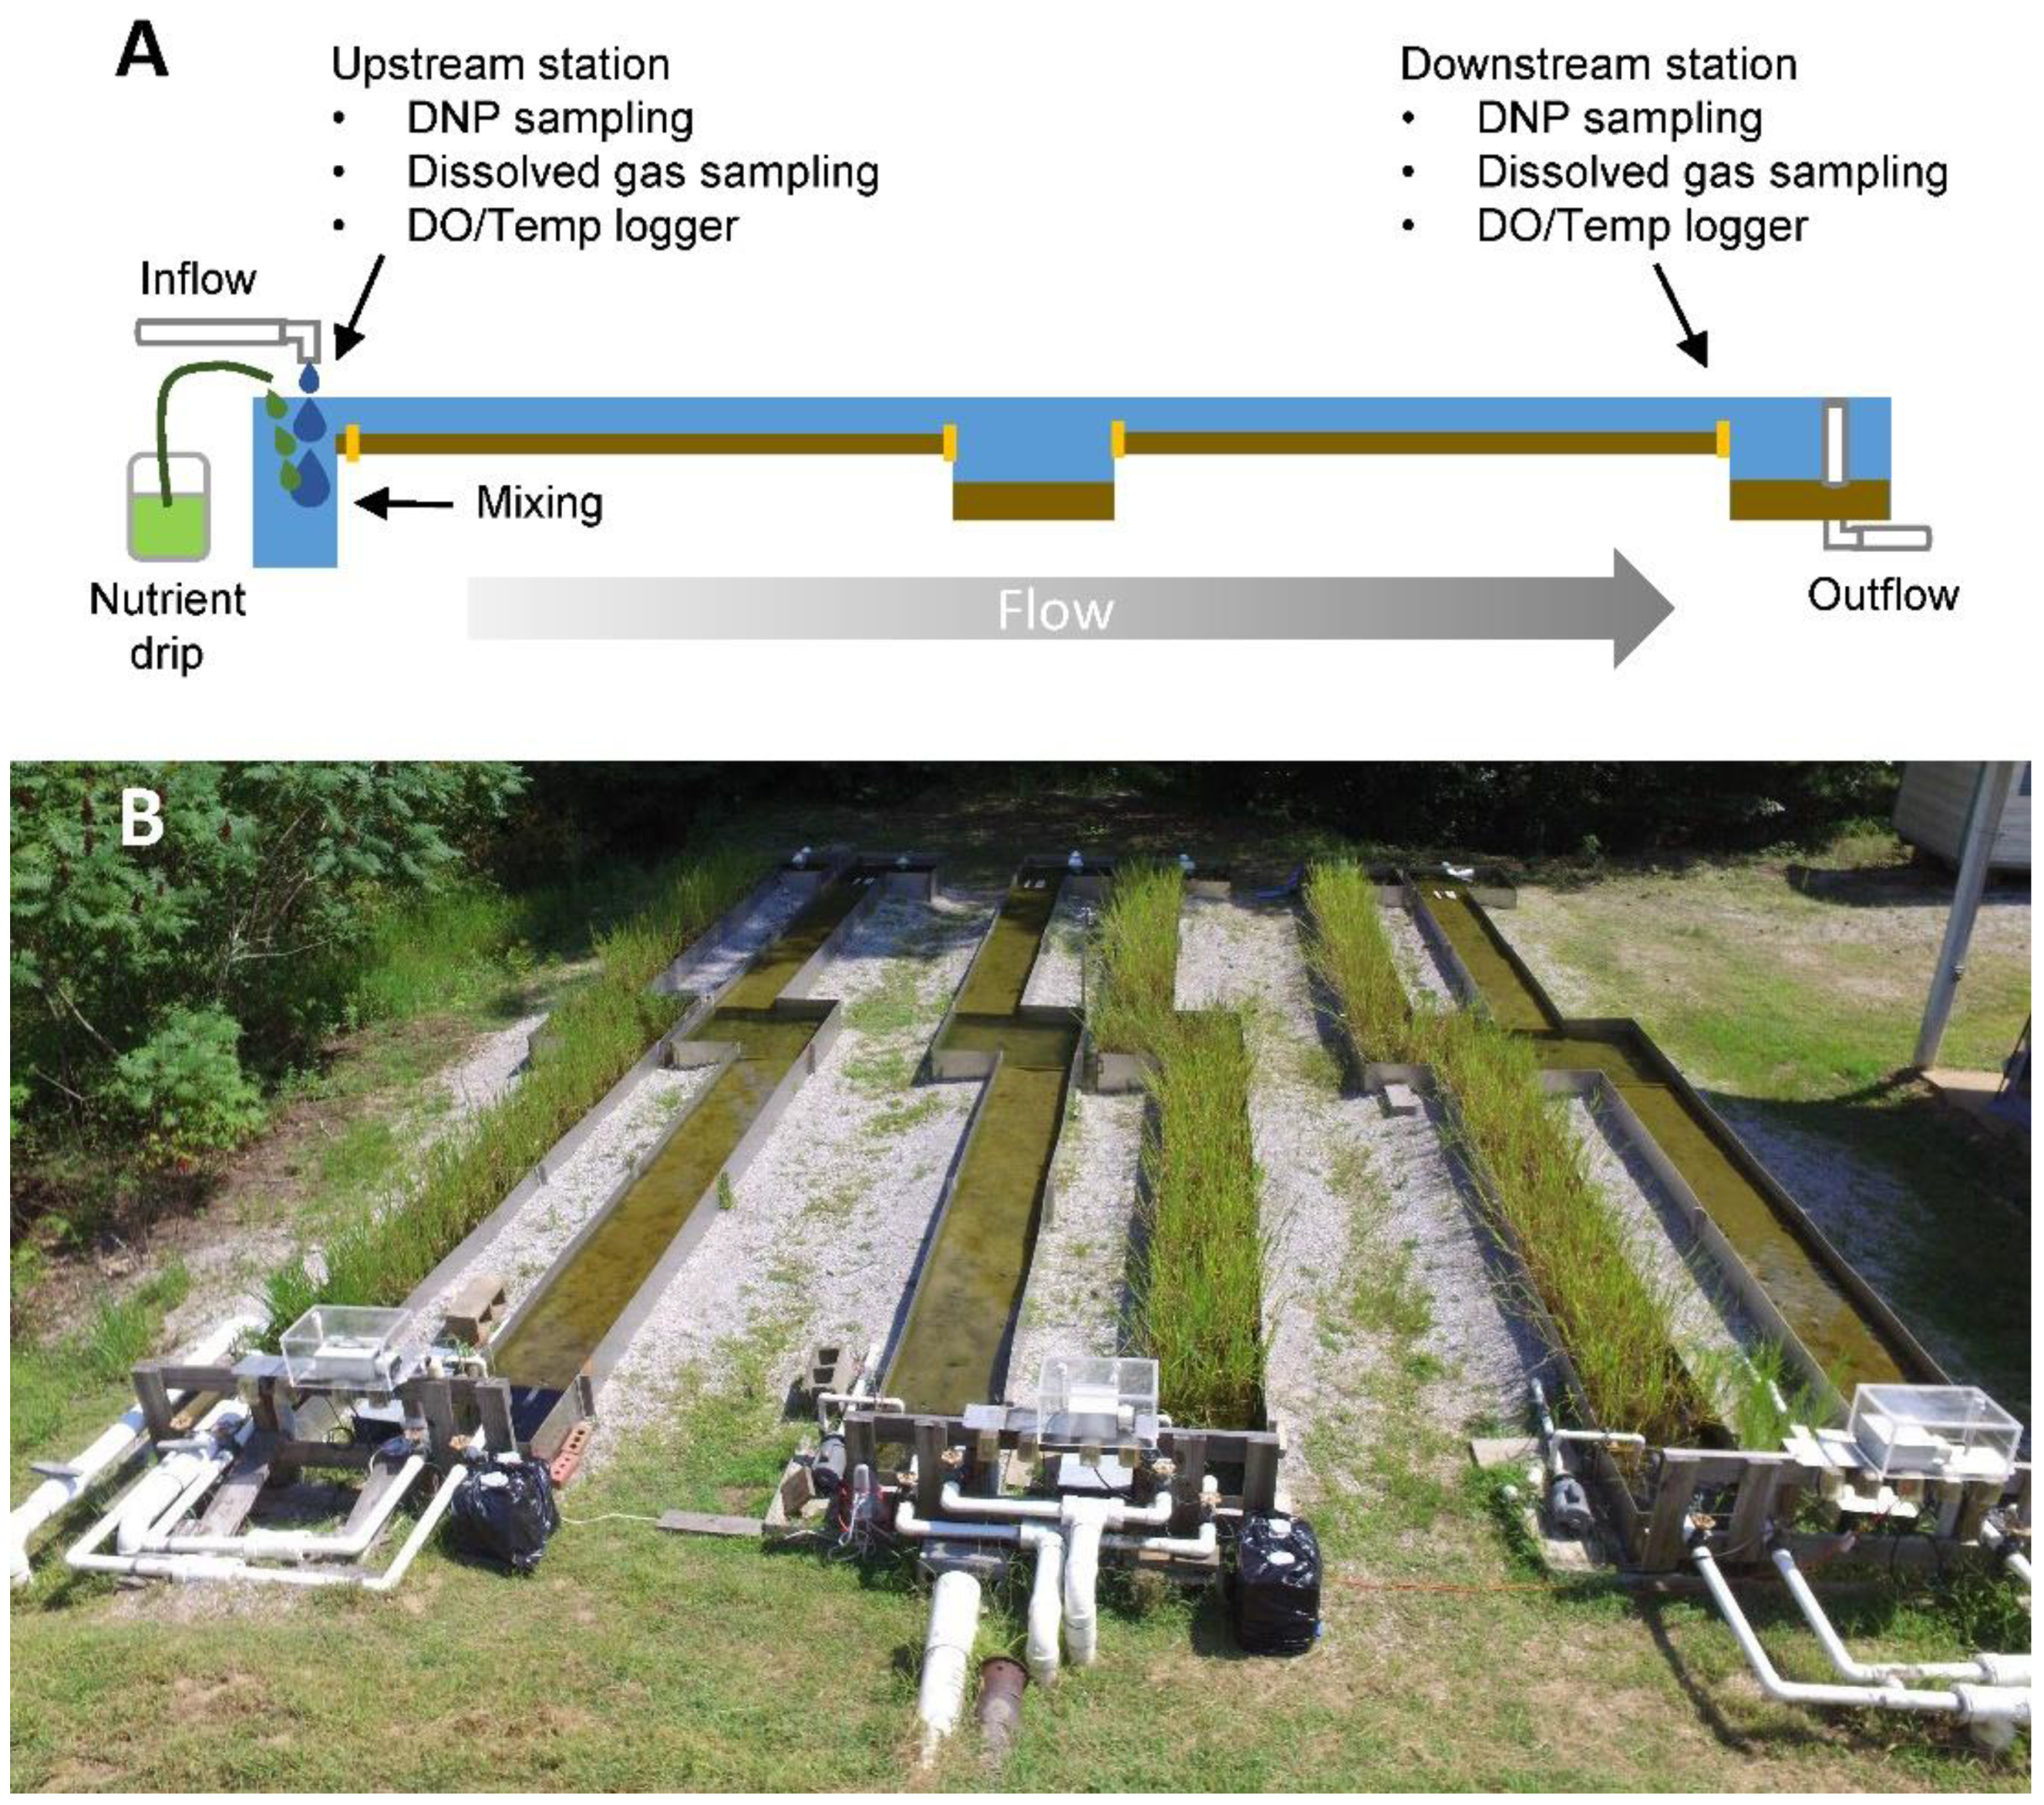
A set of 6 artificial flumes at the University of Mississippi Field Station in Abbeville, MS was employed for this experiment (Figure 1A). Flumes were designed to simulate shallow, low-gradient ditches or streams which drain farmed lands of the lower MAP. Each flume had a 0.34 m3 head pool followed by a sequence of run pool sections, where each section had a volume of 0.91 m3, resulting in a total volume of 3.96 m3 per flume. Flumes were filled with 1.54–1.74 m3 of a mixture of Dundee silty loam and Sharkey clay soil typical of the nearby MAP region to provide a relatively consistent sediment depth of ~5 cm across all sections. Water was supplied by a pond located ~50 m from our experimental setup. This water had stable nutrient concentrations (0.091–0.224 NO3-N mg L−1, 0.004–0.012 PO4−3-P mg L−1) and entered each flume through a PVC pipe at the main headpool and flowed through the run, pool, run, pool sequence before exiting through an outlet standpipe in the final pool. Outlet water flowed into a series of small wooded and vegetated wetlands. Half of the ditches (# 2, 3, and 6) were vegetated with Leersia oryzoides while the other half (# 1, 4, and 5) had bare soil (Figure 1B). Three months prior to the start of the experiment, L. oryzoides was planted at a density of approximately 132 stems m−2 (μ ± SE, 132 ± 27) from a nearby floodplain wetland complex area located on the field station property. We chose L. oryzoides as our experimental plant because our previous small-scale lab and mesocosm studies have demonstrated its potential to enhance nutrient removal [36]. The ditch complex was maintained with flowing water gravity fed by the nearby pond and monocultures in vegetated ditches were maintained by hand weeding.
We conducted three experimental loading events across all ditches on 3 different dates in a 15 d period. Each ditch was randomly assigned to one of 3 HRT so that over the 3 sampling events, each ditch experienced a 2, 4, and 6 h residence time [43]. HRTs were set manually with PVC spigot structures and verified with conductivity tracer tests [43]. During each nutrient loading event we dripped a solution of 17.92 and 8.3 g L−1 of NaNO3 and KPO4 into each ditch at a constant rate with a peristaltic pump. Pumps were calibrated to deliver nutrient stock solution at 5 mL min−1 into the headpool of each drainage, where the solution could mix thoroughly with the inflow water. We purposely loaded all ditches (15.5 ± 0.6 and 9.9 ± 0.4 g of NO3-N and PO4-P, respectively; Table 1) at the same rate regardless of HRT treatment to better separate the effects of HRT on reduction in a specific load. We acknowledge that this creates different nutrient concentrations experienced by experimental ditches under each HRT treatment. The estimated expected nutrient concentrations for each HRT treatment were 1, 2 and 4 mg L−1 NO3-N and 0.5, 1 and 2 mg L−1 PO4−3-P for HRT 2, 4 and 6, respectively.
2.2. Dissolved Nutrient Sampling
We conducted diel dissolved nutrient sampling at upstream and downstream locations within each flume to estimate nutrient uptake rates. At each hour for a 24 h period, dissolved nutrient samples were collected and analyzed for nitrate (NO3−-N), and phosphate (PO4−3-P). Samples were collected in 60 mL plastic syringes followed by pushing water through a 0.45 mm syringe filter into collection vials. All dissolved nutrient samples were frozen after collection until analysis. Dissolved nutrient samples were analyzed using the Cd reduction, and molybdate methods [44] on a Lachat QuickChem 8500 Series auto analyzer (Lachat Instruments) to measure NO3−-N and PO4−3-P concentrations, respectively.
We estimated reach-scale nutrient uptake rates on an hourly basis [45]. Travel time for a given parcel of water between the upstream and downstream sampling stations was accounted for using the following equation:
where Ua,t is uptake at hour (t) (mg N or P m−2 h−1), Q is the flow rate (L h−1), A is benthic area in m2, Nupstream,t is the measured nutrient concentration at hour t, and Ndownstream, t + i is the measured nutrient concentration at the hour plus travel time (mg L−1). Given the timing of sampling, each drainage ditch had between 18 and 22 hourly uptake rate estimates.
2.3. Reach-Scale Metabolism Estimates
Reach-scale metabolism rates were estimated based on changes in dissolved oxygen (O2) through time with a two-station method [46,47]. The two-station method was appropriate due to expected low reaeration coefficients (K) and a short distance to source water which can confound dissolved gas flux estimates if experimental systems are not treated discretely [48,49]. We used 2 HOBO® (U26-001, Onset® Computer Corporation, Bourne, ME, USA) loggers placed in the middle of each ditch at upstream and downstream ends to measure dissolved O2 and temperature at 15 min intervals during each 24 h nutrient loading event. A Bayesian inverse modeling procedure was used to estimate GPP, ER and K from dissolved O2 data using the following equation [50]:
where O2up(t) is the upstream O2 concentration (g O2/m3) and O2down(t + ) is the downstream O2 concentration of that same parcel of water following travel time, . GPP and ER are expressed in g O2 m–2 d–1 and represent positive and negative rates of O2 production and consumption, respectively. z is mean depth (m) calculated as stream volume (m3) divided by surface area (m2), O2,satup and O2,satdown are the saturation concentrations upstream and downstream (g O2 m−3), K (d–1) is the gas exchange rate, and PPFD is the sum of the photosynthetic photon flux density (μmol m–2 s–1) accumulated in the time interval from t to (t + ) divided by the daily total of PPFD (PPFDtotal) for any given parcel of water.
We used the function metrop in the mcmc package [51] in R to sample the posterior probability distribution P (µ|D). Each chain was run for 20,000 iterations following a 1000 iteration burn-in, with no chain thinning, and probability distributions adjusted to achieve an acceptance rate of ~20%. We used minimally informative prior probability distributions for GPP, ER, and K (GPP ~ N [µ = 5, SD = 10]; ER ~ N µ = –5, SD = 10]; K ~ [µ = 5, SD = 5]). The model can have difficulties estimating all three parameters due to equifinality [52], but our previous work on the influence of measured verses modelled K conducted in study flumes demonstrates that the models are robust without measured K estimates in systems with high GPP and ER rates and low K [43].
2.4. Denitrification Estimates
Hourly triplicate dissolved gas samples were collected for dinitrogen (N2) and argon (Ar) [53,54]. Using a polyvinyl chloride sampler, exetainer vials were overfilled 3x, preserved with zinc chloride (ZnCl2), capped, and stored until analysis. We measured dissolved N2:Ar in dissolved gas samples with a Membrane Inlet Mass Spectrometer (MIMS) (Bay Instruments, Easton, MD, USA) [49,55]. Sample N2:Ar for each sample was converted to N2–N concentrations based on the following equation [56]:
where DG/Arsample is the measured dissolved gas sample signal and DG/Arstandard is the measured dissolved gas signal for well-mixed, deionized water open to the atmosphere at the same temperature as the sample. The terms [Ar]expected and [DG]/[Ar]expected are the theoretical saturated concentration and ratio, respectively, calculated for each field sample using gas solubility tables [57]. Diel patterns of dissolved gas data indicated the strong patterns in O2 concentrations throughout the 24 h period which corresponded with diel N2 patterns [43]. We developed and applied a correction factor to eliminate instrument specific O2 interference with N2:Ar measurements which may have contributed to below equilibrium N2:Ar ratios observed during daytime hours [43,58].
N2:Ar values were then used to model daily fluxes in a Bayesian framework [50,53]. Specifically, we used a single-station approach which allows for the possibility of N2 consumption to estimate posterior distributions for denitrification and K using the following model [49]:
where N2(t) is the dissolved N2 at time t (g m−3); DN is the denitrification rate (g m−2 d−1), z is depth of water (m), N2,equil(t) is the equilibrium concentration of N2 at time t (g m−3); and Kt is the gas exchange rate (d−1) for N2 at time t calculated from K600. K600 is utilized to normalize the model daily estimates of K from the metabolism model (Equation (2)) as K600 is comparable across temperatures and gases [59]. Nconsume is the N2 consumption rate (g m−2 d−1) from ebullition or fixation. For any parcel of water, the fraction of light it accumulates is photosynthetic photon flux density (PPFDt, μmol m−2 s−1) at time t divided by the daily total of PPFD (PPFDtotal, μmol m−2 s−1 d−1). DN was transformed from a daily rate to an average hourly rate of daily DN flux in mg m−2 h−1. We acknowledge the application of the single station model may violate minimum reach assumptions [60] and thus the rates should be used with caution; however, the relative magnitude of denitrification and uptake as well as qualitative differences in rates across the vegetation and hydraulic residence times may still be informative to land managers because any effects from the upstream water source would be equal across the treatments.
2.5. Vegetation and Sediment Data Analysis
Vegetation samples were collected from each drainage ditch to analyze differences between pre-experimental conditions and post-experimental conditions (15 d). Triplicate shallow cores were taken from each vegetated drainage. Samples were transported to the lab, where sediment was washed away, and vegetation gently cleaned using deionized water. Each sample was divided into above-and belowground tissues, placed in paper bags, and dried at 60 °C until mass stabilized. We measured the carbon (C) and N content of plant tissues using a Vario Max CNS elemental analyzer (Elementar Analysensysteme GmbH, Hanau, Germany). The phosphorus (P) content of plant material was measured by combusting a 4 ± 1 mg sample at 500 °C for 2 h followed by digestion of material in 1 N hydrochloric acid for 30 min at 85 °C [61]. Samples were diluted with deionized water and analyzed with the molybdate method [44] using a Turner Designs Trilogy laboratory fluorometer (Model # 7200-000) equipped with the phosphate absorbance module (Model # 7200-070; Turner Designs, Sunnyvale, CA, USA).
Sediment samples were collected from each drainage ditch to analyze differences among C and N content between pre-experiment and post-experiment sampling periods. Samples were oven dried at 50 °C to a constant mass, weighed to estimate dry mass (DM), and ground with a Thomas–Wiley Intermediate Mill (Thomas Scientific). We measured C and N content of oven-dried material in a Vario Max CNS elemental analyzer (Elementar) using ground peach leaf standard (National Institute of Standard and Technology [NIST] Standard Reference Material [SRM] 1547) to correct all elemental analyses based on recovery efficiencies.
2.6. Statistical Analyses
Linear mixed-effects models that included random effects (~1|drainage) were used to account for multiple measurements taken across the study from the same drainage. All models were fit with the restricted maximum likelihood criterion. We assessed assumptions of all models visually with normality plots (qqnorm) and standardized residual plots across treatments [62]. When variances in error differed across treatments, variance was modeled separately among treatments with the VarIdent command [62]. The nlme package was used to run linear mixed-effects models [63]. We used emmeans within the emmeans package to assess interactions between vegetation and hydraulic residence time when significant [64]. All analyses were run in R [65].
3. Results
3.1. Agroecosystem Gas Fluxes
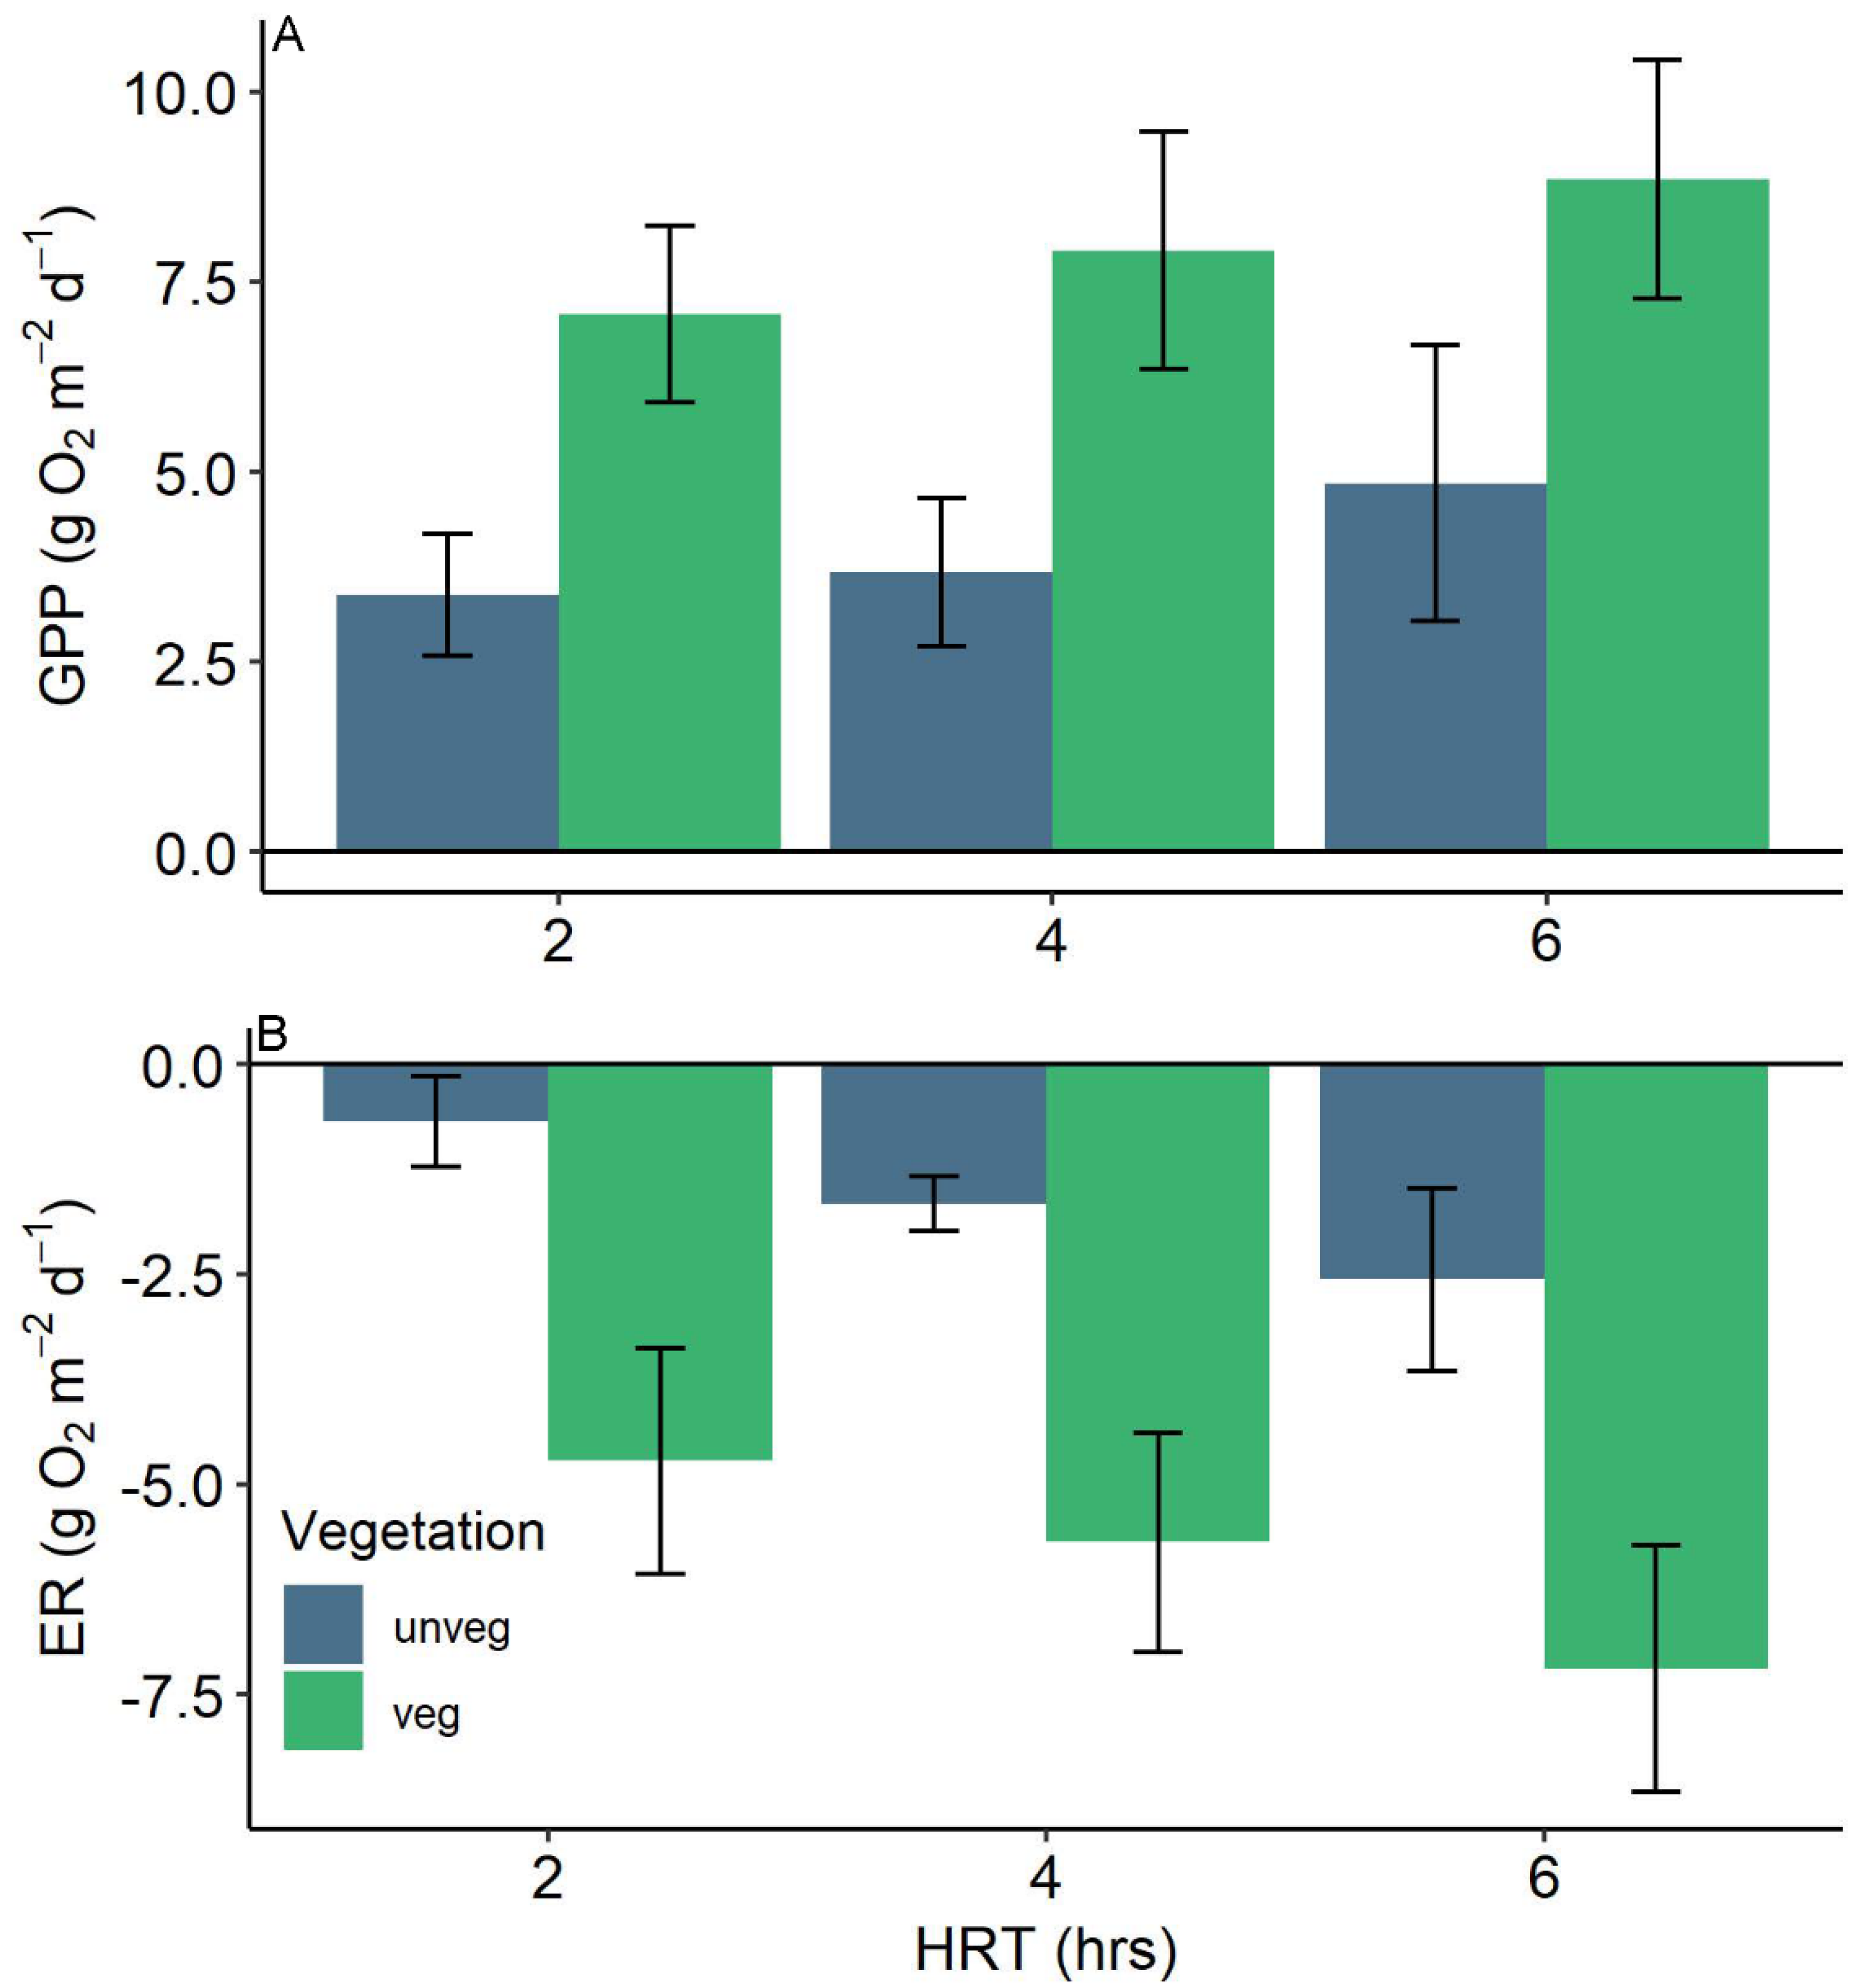
Mean rates of GPP were approximately 2-fold higher and ER rates were more than doubled in vegetated versus unvegetated ditches (Figure 2). Gross primary production was significantly higher in vegetated drainages than unvegetated drainages across all hydraulic residence times (F1,4 = 14.81, p = 0.02; Figure 2A). Vegetated ditch GPP was highest in the 6 h HRT (8.84 ± 1.56 g O2 m−2 d−1, μ ± se), followed by the 4 h (7.91 ± 1.56) and 2 h treatment (7.08 ± 1.16). Gross primary production was not significantly different among HRT treatments (p = 0.23) nor were there significant interactions between vegetation and HRT (p = 0.91).
Vegetation also significantly increased rates of ER (F1,4 = 25.95, p = 0.01) and HRT had a marginally significant influence on ER (p = 0.06). Again, the highest rates of ER were observed in the 6 h HRT treatment within vegetated streams (−7.20 ± 1.47 g O2 m−2 d−1, μ ± se) followed by the 4 h (−5.69 ± 1.30) and 2 h (−4.72 ± 1.34) treatments. A similar pattern was observed for unvegetated drainages, with 6 h HRT treatment exhibiting the highest respiration values (−2.56 ± 1.09 g O2 m−2 d−1) followed by 4 h and 2 h HRT treatments. Though fluxes in unvegetated ditches were smaller than vegetated ditch fluxes, no significant interaction between vegetation and HRT (p = 0.78) was observed (Figure 2B).
Rates of denitrification were higher in vegetated ditches across all HRTs though differences were not statistically significant (F1,4 = 3.17, p = 0.15). The highest values were estimated for vegetated drainages in the intermediate 4 h residence time (9.27 ± 3.95 mg N2-N m−2 h−1) with the lowest rates estimated for unvegetated drainages in the fastest 2 h residence time treatment (3.44 ± 0.20 mg N2-N m−2 h−1). 6 h treatments had similar rates of denitrification between vegetated (4.93 ± 0.85 mg N2-N m−2 h−1) and unvegetated ditches (3.73 ± 0.82 mg N2-N m−2 h−1). The effect of HRT on N2 fluxes was insignificant as the intermediate HRT showed the highest rates for vegetated and unvegetated drainages (F1,10 = 0.01, p = 0.9).
3.2. Nutrient Uptake
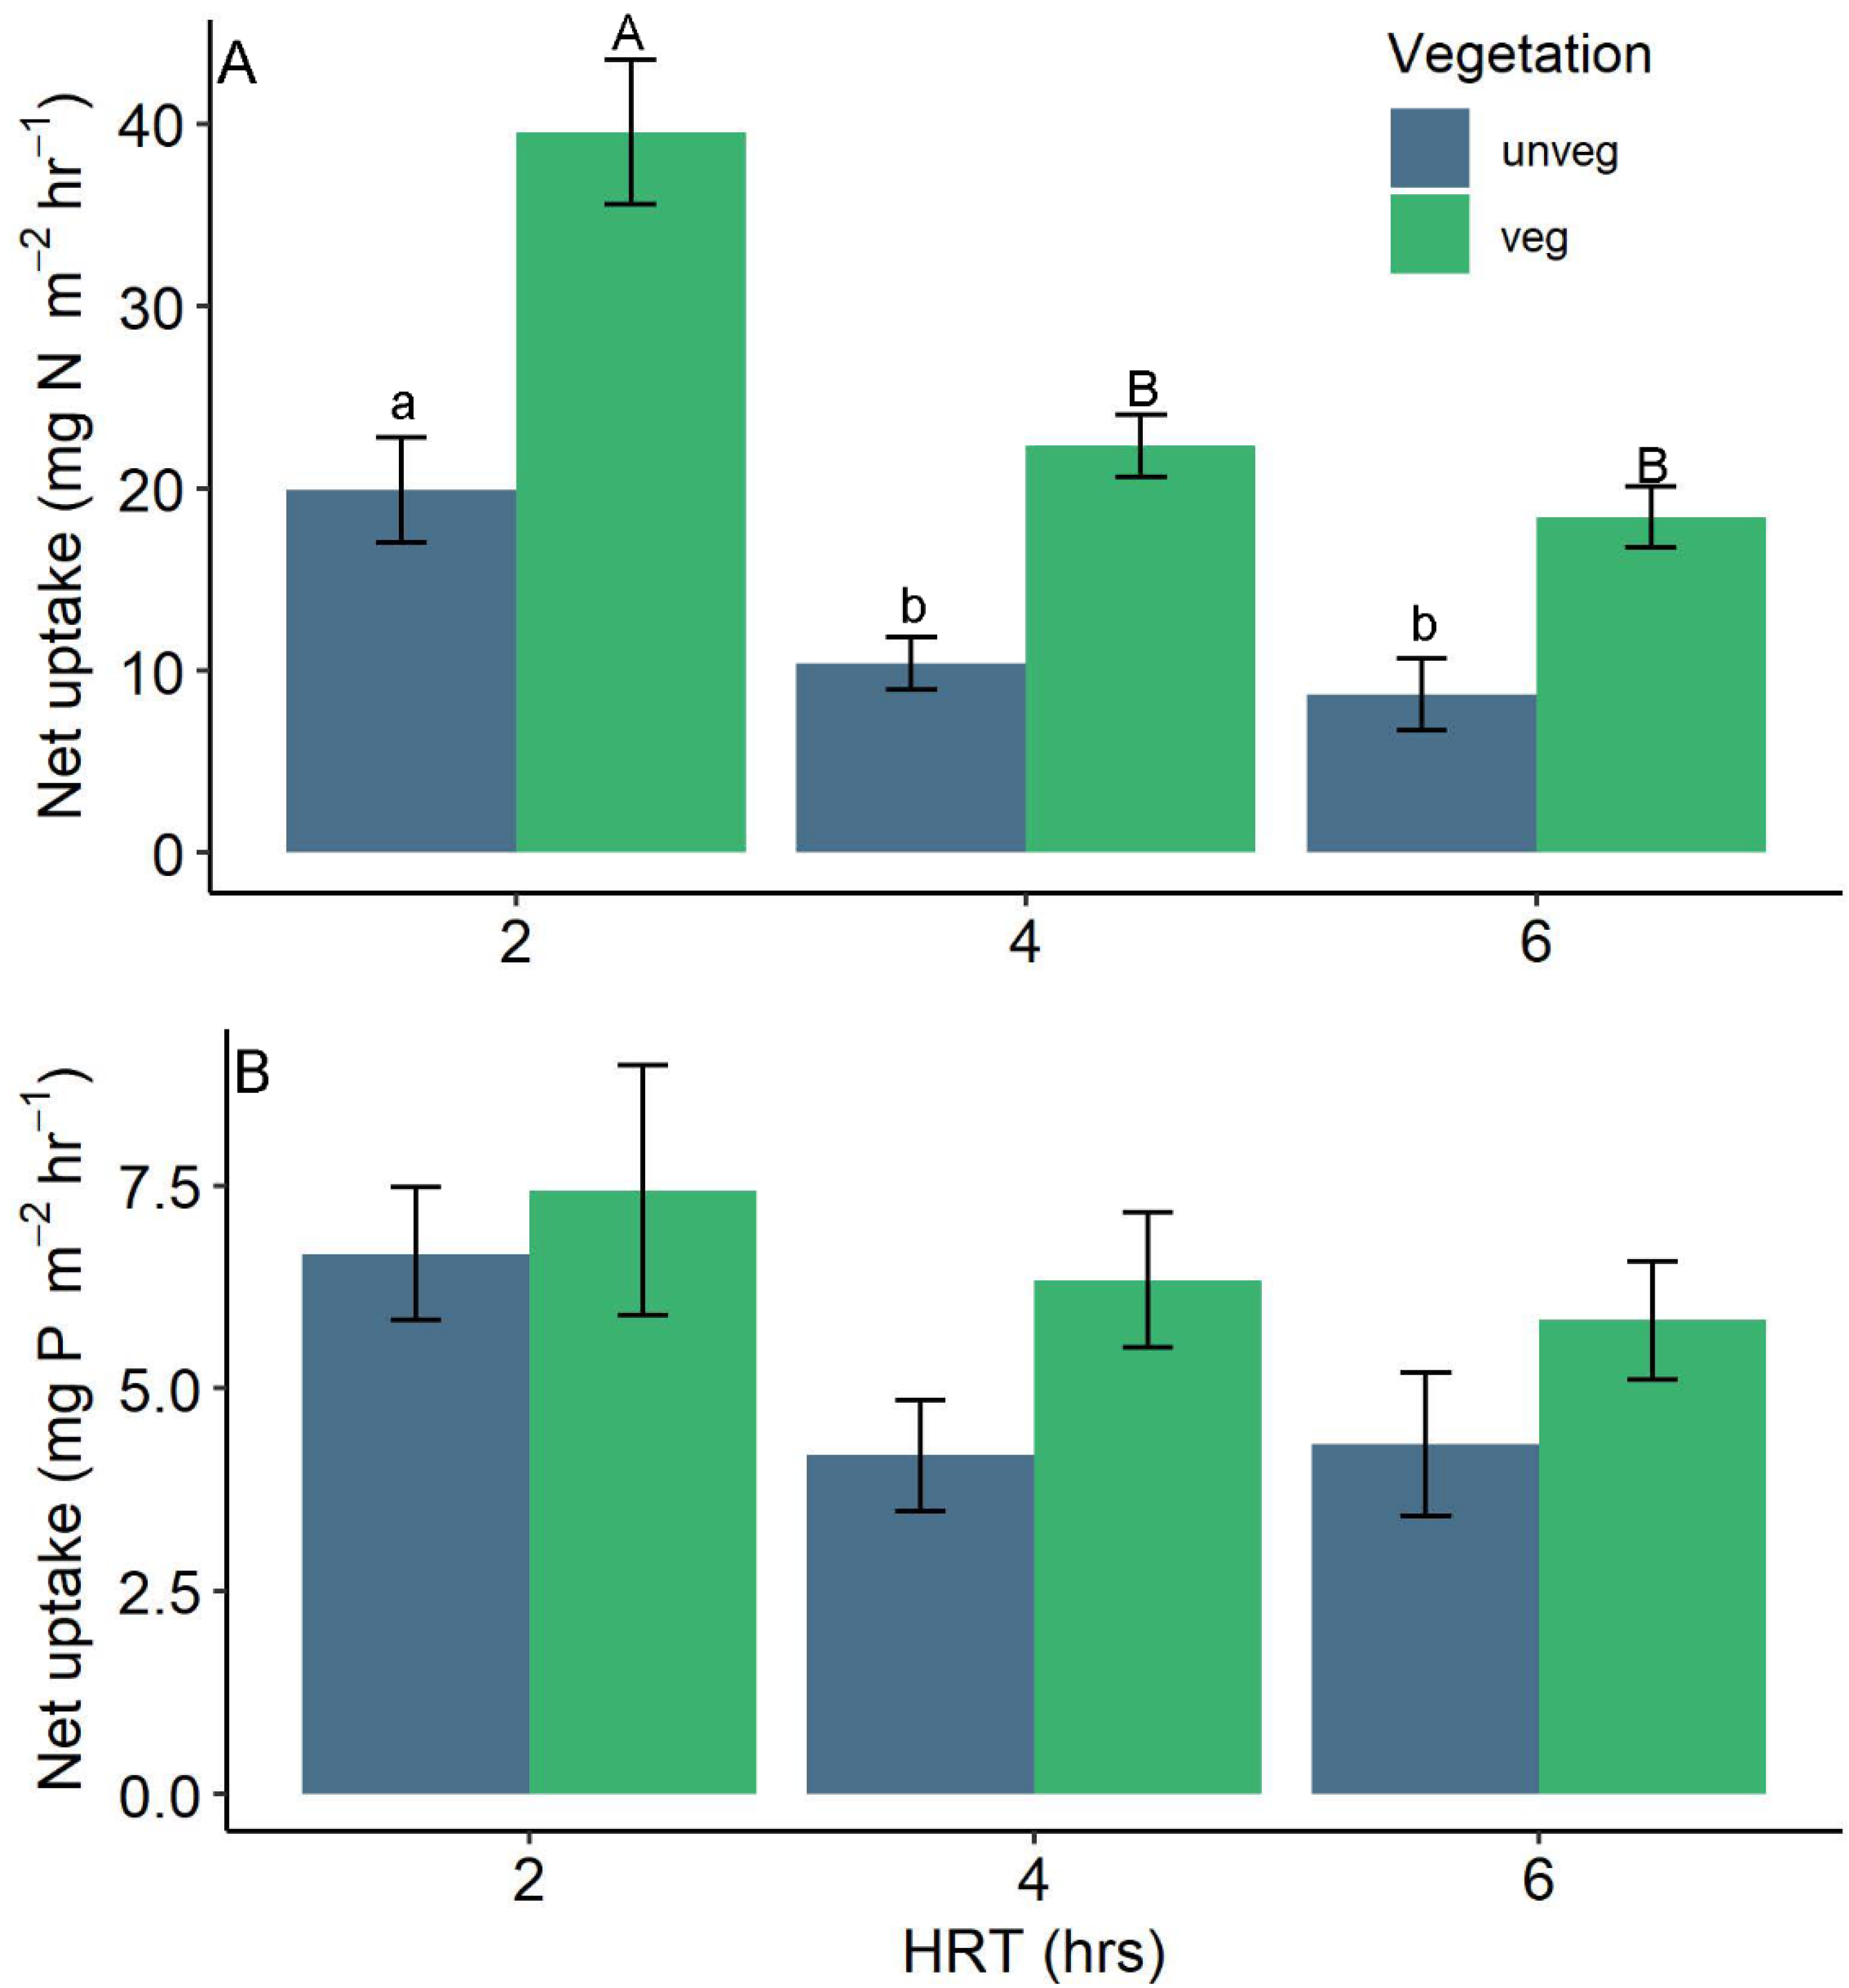
Nitrate uptake rates were more than 2-fold greater in vegetated ditches but decreased with increasing HRT (Figure 3, Table 1). HRT had overall significant effects on nitrate net uptake(F1,351 = 45.35, p < 0.001), but was also influenced by a significant interaction between HRT and vegetation with stronger effects of HRT observed in vegetated compared to unvegetated ditches (F1,351 = 4.29, p= 0.04; Figure 3A). Initially, observed concentrations were similar across HRTs (2 h = 2.43 ± 0.46 mg L−1; 4 h = 2.2 ± 0.47; 6 h = 2.41 ± 0.53). Shorter residence times (2 h) displayed significantly higher uptake rates and removal (32% in unvegetated ditches) than longer residence times (4 h and 6 h, 21% and 17% for unvegetated ditches) with the magnitude of fluxes higher in vegetated drainage ditches (2 h: 63%, 4 h: 44%, 6 h: 32%). For P net uptake, HRT treatment was found to significantly influence rates overall (F1,351 = 4.23, p = 0.04) but differences between 2 h, 4 h, and 6 h were not significant at the p < 0.05 level (Figure 3B). There was no significant overall effect of vegetation as similar patterns between unvegetated and vegetated drainages were observed in the 2 h treatment (14% vs. 16% P removal) and rates exceeded 7 mg P m−2 h−1 (F1,4 = 2.41, p = 0.19; Table 1). The interaction of vegetation and HRT was not significant (F1,351 = 0.17, p = 0.68); rates of P uptake in vegetated drainages remained high while rates in unvegetated drainages declined in the 4 h and 6 h treatments (Figure 3B).
3.3. Vegetation and Sediment
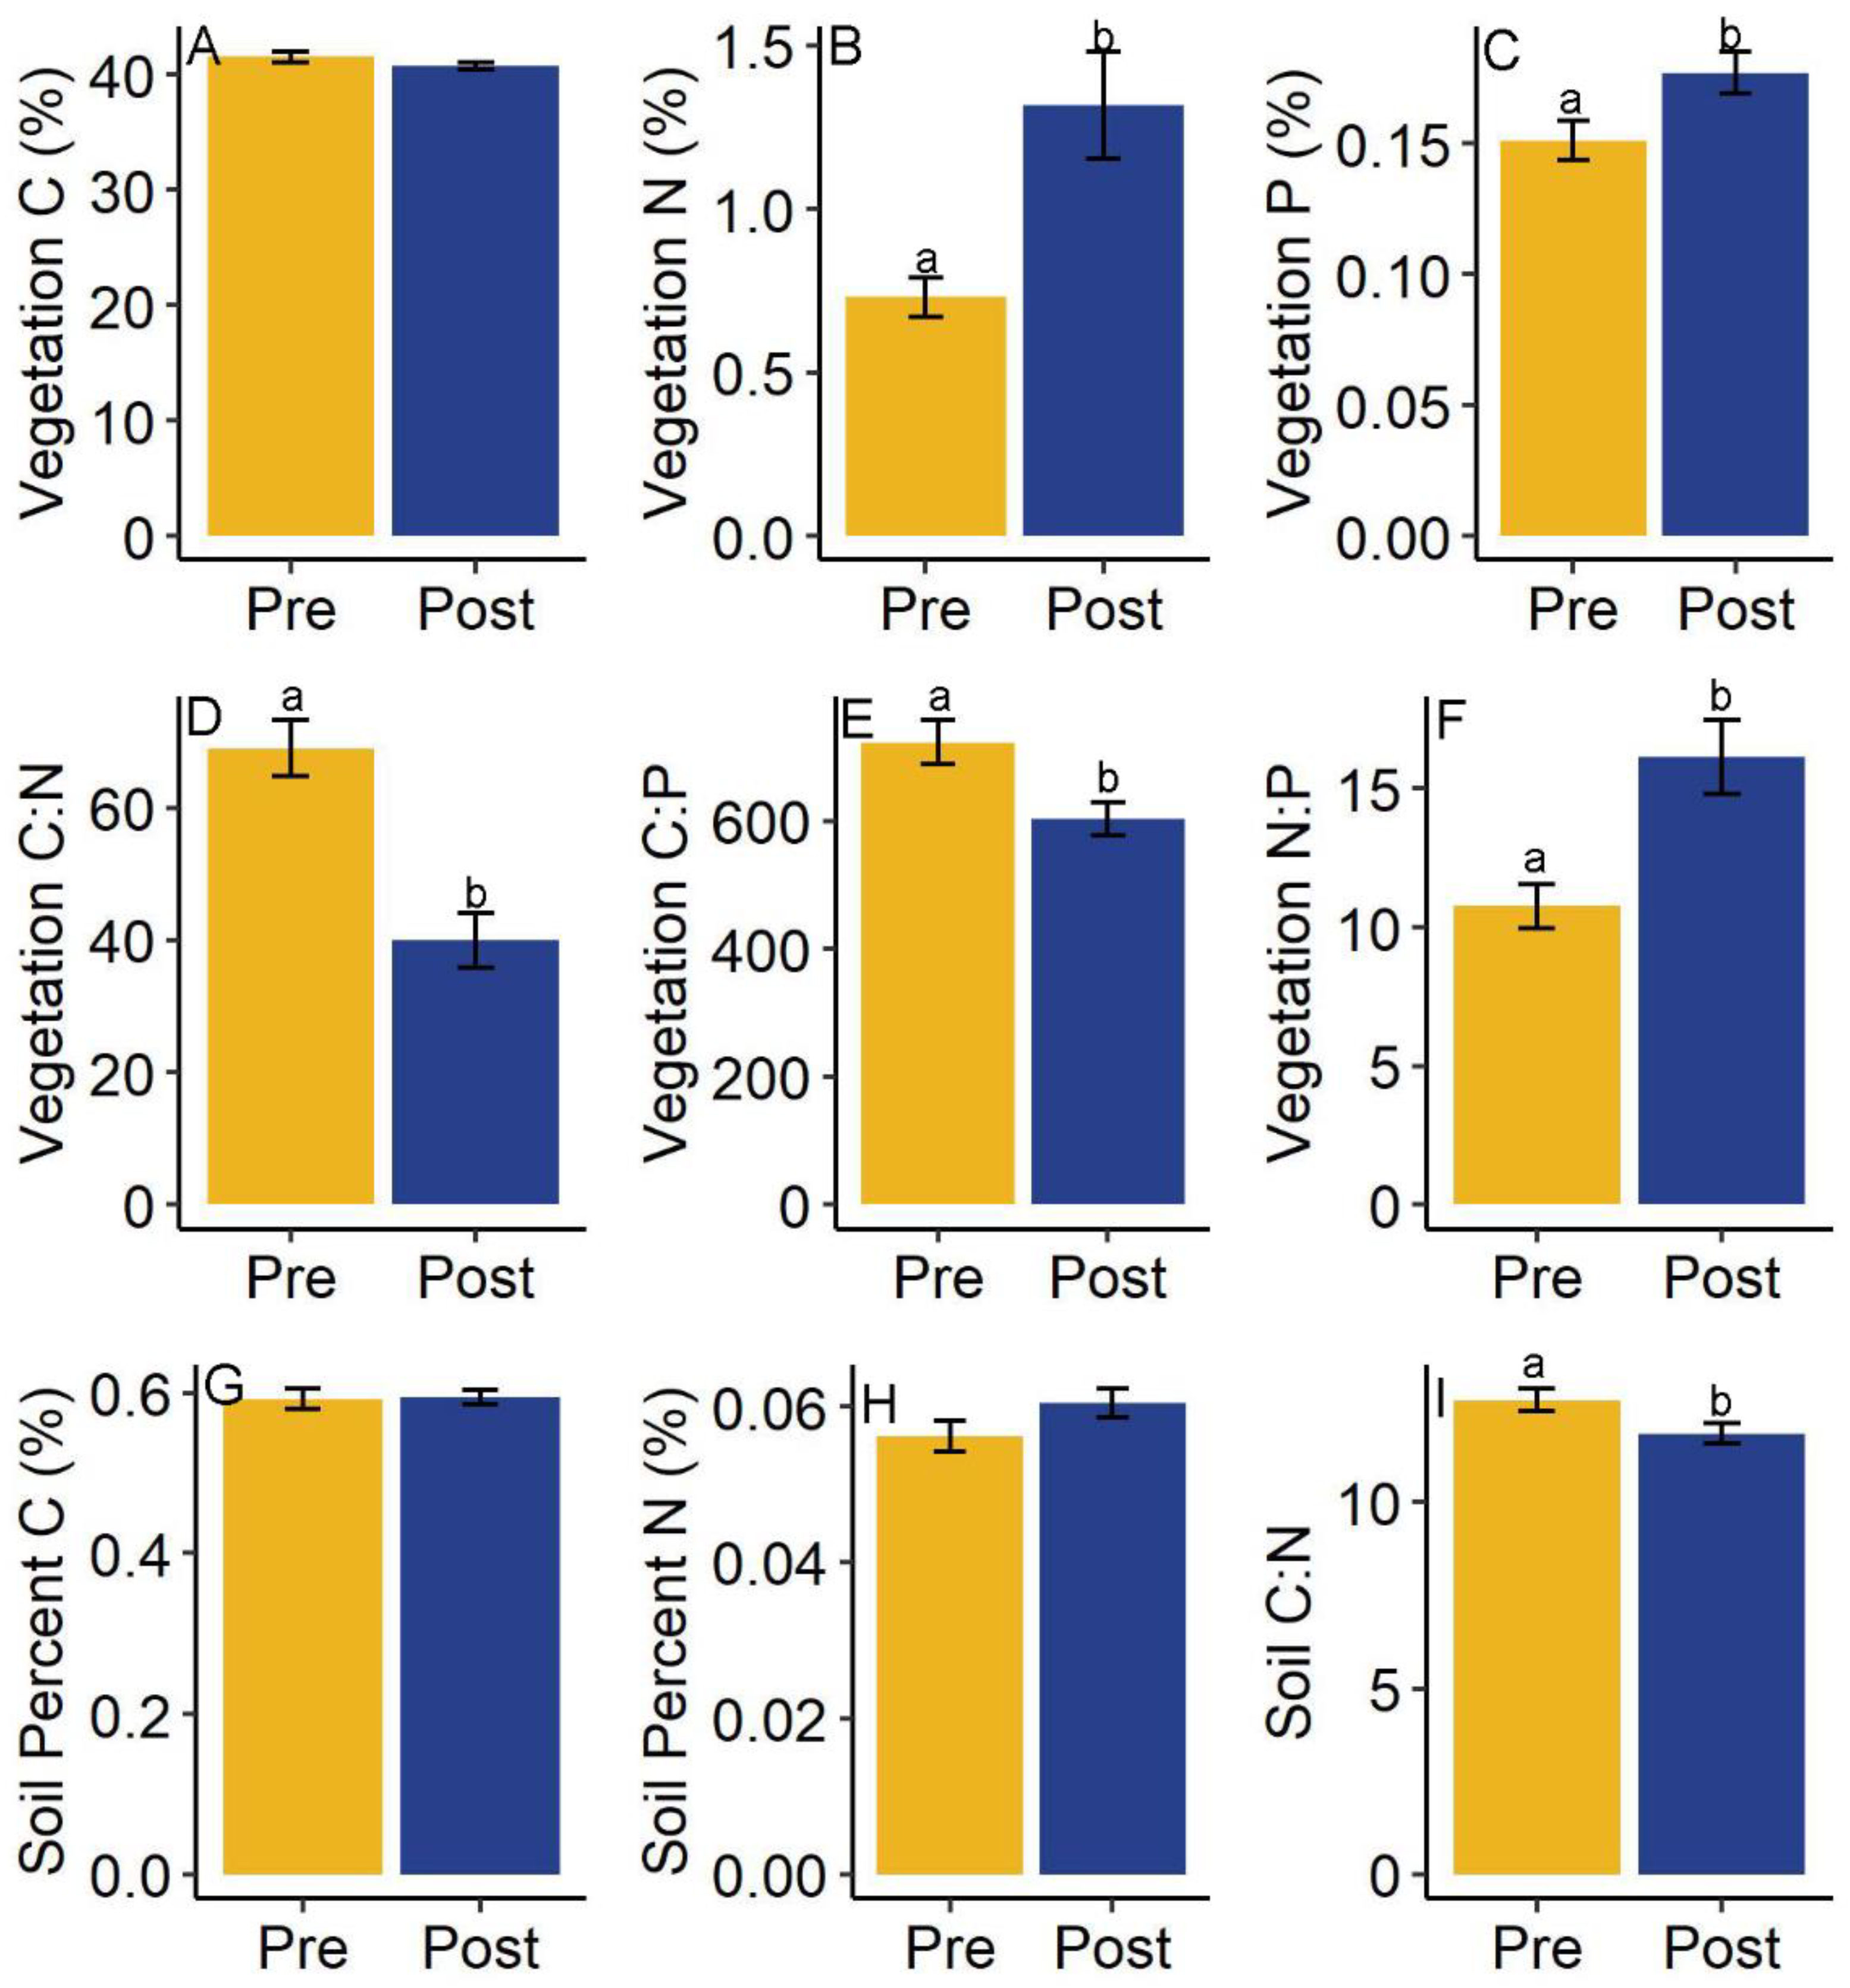
Stem density measured in the post-experiment sampling period (µ = 48) was higher than the pre-experimental sampling period (µ = 29) though differences were marginally significant (t = −2.06, df = 11.13, p = 0.06). However, we observed differences in nutrient content and ratios for aboveground vegetation metrics between pre-experiment and post-experiment sampling periods (Figure 4). Aboveground vegetation percent N, percent P were significantly greater, molar C:N and C:P ratios were lower, and N:P ratios were greater in post-experiment samples (Figure 4B–F), indicating that uptake of N and P in plant tissue occurred during the experiment. Aboveground percent carbon was not significantly different between sampling periods (Figure 4A). No significant differences in belowground tissue metrics was observed including percent C, percent N, percent P, C:N, C:P, nor N:P (Table 2).
There were no significant differences between pre- and post-sampling periods for soil percent C and percent N (Figure 4G,H). However, molar C:N ratios in soils were found to be significantly higher during the pre-experiment sampling period than the post-experiment sampling period (Figure 4I; 12.74 ± 0.29 pre, 11.84 ± 0.27 (µ ± se) post, t = 2.23, df = 105.42, p = 0.03). This was likely driven by accumulation of N in sediments as evidenced by the higher though non-significant %N values during the post-experiment sampling period (0.06 ± 0.0018 post vs. 0.056 ± 0.0019 pre, µ ± se).
4. Discussion
Drainage ditches are a ubiquitous feature within the MAP and other alluvial plain agroecosystems throughout the world. Our results provide much needed experimental but reach-scale support for the hypothesis that the presence of wetland vegetation in drainage networks will increase rates of biogeochemical processing including GPP, ER, and nutrient removal. Surprisingly, we also found that while longer hydraulic residence times did increase metabolism rates, net nutrient uptake rates actually decreased, contrary to our second hypothesis. We also expected that the additive effects of vegetation and increasing HRT would result in higher metabolism and nutrient retention rates in vegetated ditches with longer HRTs. This third hypothesis was also supported for metabolism, but we found that vegetated ditches combined with 2 h HRTs had the highest N retention rates. These confounding results may be due to unique discharge–nutrient concentration relationships created by our experimental design but may also be attributable to more physical mixing at higher flows and are discussed further below. Overall, our results provide experimental evidence that reach-scale biogeochemical processes that govern nutrient uptake are enhanced by managing wetland vegetation within agricultural ditches.
4.1. Vegetation
The presence of vegetation significantly increased gross primary production, ecosystem respiration, as well as rates of N and P uptake across all hydraulic residence times (Table 1). Increasing vegetative nutrient content combined with decreasing C:N and C:P ratios indicates effective short-term nutrient removal occurred within ditches via luxury uptake [66,67,68]. As no significant belowground tissue changes were observed, it appears L. oryzoides roots are able to effectively transfer nutrients to aboveground tissues in this environment [69] Plant nutrient uptake and storage may be underestimated by our data because we rinsed plant material, potentially dislodging epiphytic algae, bacteria, and associated nutrient storage. Unaccounted for uptake and storage may help to explain strong patterns of enhanced GPP and ER coupled with weaker nutrient storage patterns within vegetated systems. However, macrophyte cover has been shown to enhance GPP and ER rates and contribute proportionally more to ecosystem metabolism than other plant forms; moreover, plant biomass and chlorophyll a have been found to explain the majority of variation in daily GPP (80%) and ER (63%) in agricultural streams [70,71]. Additionally, C assimilation and processing via metabolic processes require nutrient inputs; plant and associated microbial uptake can be a significant nutrient removal mechanism in vegetated aquatic systems [42]. In smaller-scale studies, mesocosms planted with L. oryzoides removed >90% of the retained NO3−–N and >70% of PO4−3-P [36,39,72].
Higher GPP observed in systems vegetated with L. oryzoides likely fuels higher ER rates, which may enhance conditions favoring denitrification by reducing O2 and increasing C [43,73]. Previous investigations have found that models that predict rates based on diel N2 patterns were best fit by including terms for both N2 consumption (i.e., N fixation, ebullition) and production (i.e., denitrification), particularly in highly productive, lower flow reaches; estimates of denitrification among reaches of various flows were further improved by using a two-station approach [49]. The use of a single-station approach, which introduces the potential for upstream influence on rates, necessitates denitrification rate values reported herein be used with caution. However, the observation that reach-scale denitrification increased in ditches planted with L. oryzoides is reasonable, as all estimates were equally influenced by the upstream water source, yet rates were higher in vegetated ditches. Additionally, a previous comparison of one and two-station models in larger experimental ditches found minimal differences in estimated denitrification rates, suggesting that biological activity within short reaches can have a larger effect on N metabolism than potential upstream influences, providing some support for our estimates [49]. Further, our previous smaller scale mesocosm studies have demonstrated that a significant proportion of N retention can be attributed to high denitrification efficiencies in L. oryzoides beds [36,37,39].
While the idea that aquatic vegetation increases metabolism and nutrient uptake in streams and ditches is not necessarily novel, this study fills a critical intermediate gap between small-scale experiments and field observations. Our results scale up previous mesocosm studies which are often constrained by the small temporal and spatial scale of the experiments and demonstrate approaches based on diel data collection can be used to make ecosystem estimates of C, N and P cycling processes in agricultural ditch environments. Our experiment demonstrates the benefits of managing L. oryzoides in agricultural drainage networks by quantifying whole system metabolism and nutrient uptake processes in a replicated experimental design conducive to testing hypotheses. Our approach represents a balance between larger scale, unreplicated field studies [13,42] and small-scale, mesocosm studies [36,72] that have all demonstrated enhanced nutrient retention through managing vegetation in agricultural ditches. Furthermore, our results demonstrate that vegetated linear systems can achieve rates of nutrient removal (up to 63%) comparable to or approaching those of constructed wetlands (56–79%) [74,75].
4.2. Residence Time
Our experimental manipulations provided support for our hypothesis that higher rates of gross primary production and ecosystem respiration would be observed in longer HRT treatments. Field studies in streams have found that GPP and ER rates increase at lower discharge, likely because of greater accumulation and development of autotrophic and heterotrophic communities at low flows compared to high flow that may disturb biological controls on metabolism [76,77]. All flow rates were extremely low so it is more likely that higher rates of metabolism would be observed with greater assimilatory capacity at lower flows.
However, the highest rates of net nutrient uptake were observed in the 2 h HRT treatment which was contrary to expectations. In the MAP, storm events often create a combination of high nutrient loads and high flow rates can lower concentrations and allow a significant portion of the load to escape the uptake capacity of different processes in streams [78,79]. In contrast, within this study there were no rainfall events, and we supplied equal nutrient loads to all streams and varied discharge to manipulate HRT but not load. This should have caused a discharge × nutrient concentration relationship where inflow nutrient concentrations were greater in ditches with higher HRTs. However, examination of inflow NO3-N concentrations across HRT treatments revealed this was not the case (2 h = 2.43 ± 0.46 mg L−1; 4 h = 2.2 ± 0.47; 6 h = 2.41 ± 0.53) and highlights the difficulty of managing experimental dosing regimens across extremely low flows which are prone to error. However, all inflow NO3--N concentrations were above values previously reported as associated with maximum NO3--N retention (1 mg L−1) in sediment cores vegetated with L. oryzoides [37], so observed differences in HRT are likely driven by some other factor than potential discharge effects on uptake efficiency. A study of vegetated ditches found lower flows to physically limit N removal [80]; here, the highest flows in the 2 h HRT could experience the highest mixing activity due to increased turbulence associated with slightly higher velocities at the sediment water interface thus enhancing N uptake. Epiphytic algae, while visibly negligible, was not captured in these rates and may account for lower observed uptake rates with higher respiration rates in lower HRT treatments. Longer residence times may also create preferential flow paths and actually decrease contact between reactive sites and nutrients as longitudinal dispersion becomes dominated by inefficient exchange in dense canopies with shallow submergence [81]. Finally, these results are somewhat contrary to the literature suggesting that manipulating for longer HRTs through water control structures in agricultural ditches may enhance nutrient processing and retention [19,20]; our results are more like the result of an unexpected experimental artifact or a potential HRT range that exceeds thresholds for positive impacts on nutrient processing. Unfortunately, facilitating shorter residence times, in order to examine a wider range of HRT, while still maintaining sensitivity in our uptake measurements will likely require longer experimental reaches. More research on nutrient uptake patterns across a wider gradient of residence time in agricultural ditches is needed.
5. Conclusions
Drainage ditches represent a diffuse interface between agricultural fields and downstream freshwater networks that may be manipulated to enhance nutrient processing and retention through management of vegetation and HRT. This study confirms findings from numerous field- and small-scale mesocosm studies by providing evidence at the reach scale that vegetation enhances metabolism and net nutrient uptake under controlled, whole-ditch conditions. Vegetated ditches and increasing hydraulic residence time have been investigated separately, but have not been experimentally tested together. This study attempted to examine the efficacy of combining conservation practices in improving within ditch N and P uptake rates. Unfortunately, our results were complicated by considerable uncertainty in manipulating dosing and HRT at such low flows. Despite our inconclusive results, previous studies have demonstrated that hydrologic management is needed to maximize nutrient retention and removal in vegetated ditches [30,82,83], and we still recommend stacking conservation practices by managing vegetation and HRTs within ditches. Low-grade weirs can increase the depth and duration of wetted areas, time to peak flow during storm events, and nutrient uptake in poorly drained landscapes of the Lower Mississippi River Basin [82,84,85]. Despite this effort, more research needs to be conducted to better understand potential additive benefits of managing both vegetation and HRT in agricultural drainage networks.
Nutrient retention efficiency is likely overwhelmed by high concentrations during stormwater-driven runoff events [82,86], and managing vegetation and hydrology within drainage networks likely only provides nutrient uptake benefits under certain conditions. Therefore, it is also important for watershed managers to couple field-based best management practices such as cover crops, vegetated buffer strips, and increased nutrient use efficiency in agricultural production areas to enhance agroecosystem sustainability through reducing mobilization and runoff of excess nutrients into ditch systems [86,87]. The role of vegetated ditches as important modulators of N export from agricultural watersheds will likely be enhanced through hydrologic and vegetation management practice within ditches, in conjunction with field management practices (e.g., cover crops). More research is needed to understand cumulative benefits of integrated management practices within drainage networks, agricultural areas, and intervening habitats for N and P retention in agroecosystems.
Author Contributions
Conceptualization, R.L.N. and J.M.T.; methodology, R.L.N. and J.M.T.; software, R.L.N. and J.M.T.; validation, R.L.N. and J.M.T.; formal analysis, R.L.N.; investigation, R.L.N. and J.M.T.; resources, J.M.T.; data curation, R.L.N.; writing—original draft preparation, R.L.N.; writing—review and editing, J.M.T.; visualization, R.L.N.; supervision, J.M.T.; project administration, R.L.N. Both authors have read and agreed to the published version of the manuscript.
Funding
This research received no external funding.
Acknowledgments
We would like to thank the University of Mississippi Biological Field Station, particularly Scott Knight, for providing space, maintenance, and logistical support for the simulated ditches. We also thank Lisa Brooks, James Hill, Mark Griffith, Tate Hillhouse, Lindsey Yasarer, and James Gledhill for assisting in data collection and sample processing. Additionally, Terry Welch, Sam Testa, Tim Sullivan, and Matt Moore put forth a significant effort to establish ditch sediments and vegetation. Tim Strickland provided greatly appreciated comments that improved an earlier draft of this manuscript. Mention of trade names or commercial products in this article is solely for the purpose of providing specific information and does not imply recommendation or endorsement by the US Department of Agriculture. The US Department of Agriculture is an equal opportunity employer and provider.
Conflicts of Interest
The authors declare no conflict of interest.
References
- Alexander, R.B.; Smith, R.A.; Schwarz, G.E.; Boyer, E.W.; Nolan, J.V.; Brakebill, J.W. Differences in phosphorus and nitrogen delivery to the Gulf of Mexico from the Mississippi River basin. Environ. Sci. Technol. 2008, 42, 822–830. [Google Scholar] [CrossRef] [Green Version]
- Stoddard, J.L.; Van Sickle, J.; Herlihy, A.T.; Brahney, J.; Paulsen, S.; Peck, D.V.; Mitchell, R.; Pollard, A.I. Continental-scale increase in lake and stream phosphorus: Are oligotrophic systems disappearing in the United States? Environ. Sci. Technol. 2016, 50, 3409–3415. [Google Scholar] [CrossRef] [Green Version]
- Rabalais, N.N.; Turner, R.E. Gulf of Mexico hypoxia: Past, present, and future. Limnol. Oceano. Bull. 2019, 28, 117–124. [Google Scholar] [CrossRef] [Green Version]
- Pierce, S.C.; Kröger, R.; Pezeshki, R. Managing artificially drained low-gradient agricultural headwaters for enhanced ecosystem functions. Biology 2012, 1, 794–856. [Google Scholar] [CrossRef]
- King, S.L.; Keeland, B.D. Evaluation of reforestation in the Lower Mississippi River Alluvial Valley. Restor. Ecol. 1999, 7, 348–359. [Google Scholar] [CrossRef]
- Lassaletta, L.; Billen, G.; Grizzetti, B.; Anglade, J.; Garnier, J. 50 year trends in nitrogen use efficiency of world cropping systems: The relationship between yield and nitrogen input to cropland. Environ. Res. Lett. 2014, 9, 105011. [Google Scholar] [CrossRef]
- Canfield, D.E.; Glazer, A.N.; Falkowski, P.G. The evolution and future of Earth’s N cycle. Science 2010, 330, 192–196. [Google Scholar] [CrossRef] [PubMed] [Green Version]
- Fisher, J.; Acreman, M.C. Wetland nutrient removal: A review of the evidence. Hydrol. Earth Syst. Sci. 2004, 8, 673–685. [Google Scholar] [CrossRef] [Green Version]
- Vymazal, J. Plants used in constructed wetlands with horizontal subsurface flow: A review. Hydrobiologia 2011, 674, 133–156. [Google Scholar] [CrossRef]
- Vymazal, J. The use of constructed wetlands for nitrogen removal from agricultural drainage: A review. Sci. Agric. Bohem. 2017, 48, 82–91. [Google Scholar] [CrossRef] [Green Version]
- Wang, M.; Zhang, D.; Dong, J.; Tan, S.K. Application of constructed wetlands for treating agricultural runoff and agro-industrial wastewater: A review. Hydrobiologia 2018, 805, 1–31. [Google Scholar] [CrossRef]
- Li, J.; Yang, X.; Wang, Z.; Shan, Y.; Zheng, Z. Comparison of four aquatic plant treatment systems for nutrient removal from eutrophied water. Bioresour. Technol. 2015, 179, 1–7. [Google Scholar] [CrossRef]
- Soana, E.; Balestrini, R.; Vincenzi, F.; Bartoli, M.; Castaldelli, G. Mitigation of nitrogen pollution in vegetated ditches fed by nitrate-rich spring waters. Agric. Ecosyst. Environ. 2017, 243, 74–82. [Google Scholar] [CrossRef]
- Lu, B.; Xu, Z.; Li, J.; Chai, X. Removal of water nutrients by different aquatic plant species: An alternative way to remediate polluted rural rivers. Ecol. Eng. 2018, 110, 18–26. [Google Scholar] [CrossRef]
- Kröger, R.; Holland, M.M.; Moore, M.T.; Cooper, C.M. Hydrological variability and agricultural drainage ditch inorganic nitrogen reduction capacity. J. Environ. Qual. 2007, 36, 1646–1652. [Google Scholar] [CrossRef] [Green Version]
- Herzon, I.; Helenius, J. Agricultural drainage ditches, their biological importance and functioning. Biol. Conserv. 2008, 141, 1171–1183. [Google Scholar] [CrossRef]
- Dollinger, J.; Dagès, C.; Bally, J.; Lagacherie, P.; Voltz, M. Managing ditches for agroecological engineering of landscape. A review. Agron. Sustain. Dev. 2015, 35, 999–1020. [Google Scholar] [CrossRef] [Green Version]
- Kroger, R.; Moore, M.T.; Locke, M.A.; Cullum, R.F.; Steinreide, R.W., Jr.; Testa, S., III; Bryant, C.T.; Cooper, C.M. Evaluating the influence of wetland vegetation on chemical residence time in Mississippi Delta drainage ditches. Agric. Water Manag. 2009, 96, 1175–1179. [Google Scholar] [CrossRef]
- Baker, D.W.; Bledsoe, D.P.; Price, J.M. Stream nitrate uptake and transient storage over a gradient of geomorphic complexity, north-central Colorado, USA. Hydrol. Process. 2012, 26, 3241–3252. [Google Scholar] [CrossRef]
- Cunha, D.G.F.; Finkler, N.R.; Calijuri, M.C.; Covino, T.P.; Tromboni, F.; Dodds, W.K. Nutrient uptake in a simplified stream channel: Experimental manipulation of hydraulic residence time and transient storage. Ecohydrology 2018, 11, e2012. [Google Scholar] [CrossRef]
- Davis, R.T.; Tank, J.L.; Mahl, U.H.; Winikoff, S.G.; Roley, S.S. The Influence of two-stage ditches with constructed floodplains on water column nutrients and sediments in agricultural streams. J. Am. Water Resour. Assoc. 2015, 51, 941–955. [Google Scholar] [CrossRef]
- Hodaj, A.; Bowling, L.C.; Frankenberger, J.R.; Chaubey, I. Impact of a two-stage ditch on channel water quality. Agric. Water Manag. 2017, 192, 126–137. [Google Scholar] [CrossRef]
- Kröger, R.; Cooper, C.M.; Moore, M.T. A preliminary study of an alternative controlled drainage strategy in surface drainage ditches: Low-grade weirs. Agric. Water Manag. 2008, 95, 678–684. [Google Scholar] [CrossRef]
- Jadhav, R.S.; Buchberger, S.G. Effects of vegetation on flow through free water surface wetlands. Ecol. Eng. 1995, 5, 481–496. [Google Scholar] [CrossRef]
- Bouldin, J.L.; Farris, J.L.; Moore, M.T.; Smith, S., Jr.; Stephens, W.W.; Cooper, C.M. Evaluated fate and effects of atrazine and lambda-cyhalothrin in vegetated and unvegetated microcosms. Environ. Tox. 2005, 20, 487–498. [Google Scholar] [CrossRef] [PubMed]
- Darby, S.E. Effect of riparian vegetation on flow resistance and flood potential. J. Hydraul. Eng. 1999, 125, 443–454. [Google Scholar] [CrossRef]
- Nepf, H.M. Drag, turbulence, and diffusion in flow through emergent vegetation. J. Water Resour. Res. 1999, 35, 479–489. [Google Scholar] [CrossRef]
- Madsen, J.D.; Chambers, P.A.; James, W.F.; Koch, E.W.; Westlake, D.F. The interaction between water movement, sediment dynamics and submersed macrophytes. Hydrobiologia 2001, 444, 71–84. [Google Scholar] [CrossRef]
- Cooper, C.M.; Moore, M.T.; Bennett, E.R.; Smith, S., Jr.; Farris, J.L.; Milam, C.D.; Shields, F.D., Jr. Innovative uses of vegetated drainage ditches for reducing agricultural runoff. Water Sci. Technol. 2004, 49, 117–123. [Google Scholar] [CrossRef] [PubMed]
- Strock, J.S.; Dell, C.J.; Schmidt, J.P. Managing natural processes in drainage ditches for nonpoint source nitrogen control. J. Soil Water Conserv. 2007, 62, 188–196. [Google Scholar]
- Sharpley, A.N.; Krogstad, T.; Kleinman, P.J.A.; Haggard, B.; Shigaki, F.; Saporito, L.S. Managing natural processes in drainage ditches for nonpoint source phosphorus control. J. Soil Water Conserv. 2007, 62, 197–206. [Google Scholar]
- Moore, M.T.; Kröger, R.; Locke, M.A.; Cullum, R.F.; Steinriede, R.W., Jr.; Testa, S., III; Lizotte, R.E., Jr.; Bryant, C.T.; Cooper, C.M. Nutrient mitigation capacity in Mississippi Delta, USA drainage ditches. Environ. Pollut. 2010, 158, 175–184. [Google Scholar] [CrossRef] [PubMed]
- Durand, P.; Breuer, L.; Johnes, P.J.; Billen, G.; Butturini, A.; Pinay, G.; van Grinsven, H.; Garnier, J.; Rivett, M.; Reay, D.S.; et al. Nitrogen processes in aquatic ecosystems. In European Nitrogen Assessment; Cambridge University Press: Cambridge, UK, 2011; pp. 126–146. [Google Scholar]
- Hall, R.O.; Tank, J.L. Ecosystem metabolism controls nitrogen uptake in streams in Grand Teton National Park, Wyoming. Limnol. Oceanogr. 2003, 48, 1120–1128. [Google Scholar] [CrossRef] [Green Version]
- Kaenel, B.R.; Buehrer, H.; Uehlinger, U. Effects of aquatic plant management on stream metabolism and oxygen balance in streams. Freshw. Biol. 2001, 45, 85–95. [Google Scholar] [CrossRef]
- Taylor, J.M.; Moore, M.T.; Scott, J.T. Contrasting nutrient mitigation and denitrification potential of agricultural drainage environments with different emergent aquatic macrophytes. J. Environ. Qual. 2015, 44, 1304–1314. [Google Scholar] [CrossRef] [Green Version]
- Speir, S.L.; Taylor, J.M.; Scott, J.T. Seasonal differences in relationships between nitrate concentration and denitrification rates in ditch sediments vegetated with rice cutgrass. J. Environ. Qual. 2017, 46, 1500–1509. [Google Scholar] [CrossRef]
- Needelman, B.A.; Kleinman, P.J.A.; Strock, J.S.; Allen, A.L. Improved management of agricultural drainage ditches for water quality protection: An overview. J. Soil Water Conserv. 2007, 62, 171–178. [Google Scholar]
- Taylor, J.M.; Moore, M.T.; Speir, S.L.; Testa, S., III. Vegetated ditch habitats provide net nitrogen sink and phosphorus storage capacity in agricultural drainage networks despite senescent plant leaching. Water 2020, 12, 875. [Google Scholar] [CrossRef] [Green Version]
- Nguyen, L.; Sukias, J. Phosphorus fractions and retention in drainage ditch sediments receiving surface runoff and subsurface drainage from agricultural catchments in the North Island, New Zealand. Agric. Ecosyst. Environ. 2002, 92, 49–69. [Google Scholar] [CrossRef]
- Collins, S.D.; Shukla, S.; Shresta, N.K. Drainage ditches have sufficient adsorption capacity but inadequate residence time for phosphorus retention in the Everglades. Ecol. Eng. 2016, 92, 218–228. [Google Scholar] [CrossRef] [Green Version]
- Vzmazal, J.; Březinová, T.D. Removal of nutrients, organics and suspended solids in vegetated agricultural drainage ditch. Ecol. Eng. 2018, 118, 97–103. [Google Scholar] [CrossRef]
- Nifong, R.L.; Taylor, J.M.; Moore, M.T. To model or measure: Estimating gas exchange to measure metabolism in shallow, low-gradient stream habitats. Freshw. Sci. 2020, 39, 70–85. [Google Scholar] [CrossRef]
- American Public Health Association (APHA). Standard Methods for the Examination of Water and Wastewater, 21st ed.; American Public Health Association; American Water Works Association; Water Environment Federation: Washington, DC, USA, 2005.
- Heffernan, J.B.; Cohen, M.J. Direct and indirect coupling of primary production and diel nitrate dynamics in a subtropical spring-fed river. Limnol. Oceanogr. 2010, 55, 677–688. [Google Scholar] [CrossRef]
- Marzolf, E.R.; Mulholland, P.J.; Steinman, A.D. Improvements to the diurnal upstream–downstream dissolved oxygen change technique for determining whole-stream metabolism in small streams. Can. J. Fish. Aquat. Sci. 1994, 51, 1591–1599. [Google Scholar] [CrossRef]
- Young, R.G.; Huryn, A.D. Comment: Improvements to the diurnal upstream-downstream dissolved oxygen change technique for determing whole-stream metabolism in small streams. Can. J. Fish. Aquat. Sci. 1998, 55, 1784–1785. [Google Scholar] [CrossRef]
- Hall, R.O.; Hotchkiss, E.R. Stream Metabolism. In Methods in Stream Ecology; Academic Press: Cambridge, MA, USA, 2017; pp. 219–233. [Google Scholar]
- Nifong, R.L.; Taylor, J.M.; Adams, G.; Moore, M.T.; Farris, J.L. Recognizing both denitrification and nitrogen consumption improves performance of stream diel N2 flux models. Limno. Oceanogr. Meth. 2020, 18, 169–182. [Google Scholar] [CrossRef]
- Hall, R.O.; Tank, J.L.; Baker, M.A.; Rosi-Marshall, E.J.; Hotchkiss, E.R. Metabolism, gas exchange, and carbon spiraling in rivers. Ecosystems 2016, 19, 73–86. [Google Scholar] [CrossRef] [Green Version]
- Geyer, C.J.; Johnson, L.T. MCMC: Markov Chain Monte Carlo. Package Version 0.9-2. 2019. Available online: CRAN-Package mcmc (r-project.org) (accessed on 30 March 2021).
- Appling, A.P.; Hall, R.O.; Yackulic, C.B.; Arroita, M. Overcoming equifinality: Leveraging long time series for stream metabolism estimation. J. Geophys. Res. Biogeosci. 2018, 123, 624–645. [Google Scholar] [CrossRef] [Green Version]
- Reisinger, A.J.; Tank, J.L.; Hoellein, T.J.; Hall, R.O., Jr. Sediment, water column, and open-channel denitrification in rivers measured using membrane-inlet mass spectrometry. J. Geophys. Res. Biogeosci. 2016, 121, 1258–1274. [Google Scholar] [CrossRef] [Green Version]
- Hall, R.O.; Madinger, H.L. Use of argon to measure gas exchange in turbulent mountain streams. Biogeosciences 2018, 15, 3085–3092. [Google Scholar] [CrossRef] [Green Version]
- Kana, T.M.; Darkangelo, C.; Hunt, M.D.; Oldham, J.B.; Bennett, G.E.; Cornwell, J.C. Membrane inlet mass spectrometer for rapid high-precision determination of N2, O2, and Ar in environmental water samples. Anal. Chem. 1994, 66, 4166–4170. [Google Scholar] [CrossRef]
- Grantz, E.M.; Kogo, A.; Scott, J.T. Partitioning whole-lake denitrification using in situ dinitrogen gas accumulation and intact sediment core experiments. Limnol. Oceanogr. 2012, 57, 925–935. [Google Scholar] [CrossRef]
- Weiss, R.F. The solubility of nitrogen, oxygen and argon in water and seawater. Deep-Sea Res. 1970, 17, 721–735. [Google Scholar] [CrossRef]
- Eyre, B.D.; Rysgaard, S.; Dalsgaard, T.; Christensen, P.B. Comparison of isotope pairing and N2:Ar methods for measuring sediment denitrification: Assumptions, modifications and implications. Estuaries 2002, 25, 1077–1087. [Google Scholar] [CrossRef]
- Jähne, B.; Heinz, G.; Dietrich, W. Measurement of the diffusion coefficients of sparingly soluble gases in water. J. Geophys. Res. 1987, 92, 10767–10776. [Google Scholar] [CrossRef]
- Reichert, P.; Uehlinger, U.; Acuna, V. Estimating stream metabolism from oxygen concentrations: Effect of spatial heterogeneity. J. Geophys. Res. 2009, 114, G03016. [Google Scholar] [CrossRef] [Green Version]
- Halvorson, H.M.; White, G.; Scott, J.T.; Evans-White, M.A. Dietary and taxonomic controls on incorporation of microbial carbon and phosphorus by detritivorous caddisflies. Oecologia 2016, 180, 567–579. [Google Scholar] [CrossRef] [PubMed]
- Zuur, A.F.; Ieno, E.N.; Walker, N.; Saveliev, A.A.; Smith, G.M. Mixed Effects Models and Extensions in Ecology with R; Springer: Berlin/Heidelberg, Germany, 2009. [Google Scholar]
- Pinheiro, J.; Bates, D.; DebRoy, S.; Sarkar, D.; Heisterkamp, S.; Van Willigen, B. Nlme: Linear and Nonlinear Mixed Effects Models. R Project for Statistical Computing: Vienna, Austria. Available online: https://cran.r-project.org/web/packages/nlme (accessed on 27 July 2018).
- Lenth, R.; Singmann, H.; Love, J.; Buerkner, P.; Herve, M. Emmeans: Estimated Marginal Means, Aka Least-Squares Means. 2019. Available online: https://cran.r-project.org/web/packages/emmeans/emmeans.pdf (accessed on 31 March 2021).
- R Development Core Team. R: A Language and Environment for Statistical Computing; R Foundation for Statistical Computing: Vienna, Austria, 2019. [Google Scholar]
- Rogers, K.H.; Breen, P.F.; Chick, A.J. Nitrogen removal in experimental wetland treatment systems: Evidence for the role of aquatic plants. J. Water Pollut. Control Fed. 1991, 63, 934–941. [Google Scholar]
- Kroger, R.; Holland, M.M.; Moore, M.T.; Cooper, C.M. Plant senescence: A mechanism for nutrient release in temperate agricultural wetlands. Environ. Pollut. 2007, 146, 114–119. [Google Scholar] [CrossRef]
- Kadlec, R.H. Pond and wetland treatment. Water Sci. Technol. 2003, 48, 1–8. [Google Scholar] [CrossRef] [PubMed]
- Tester, M.; Leigh, R.A. Partitioning of nutrient transport processes in roots. J. Exp. Bot. 2001, 52, 445–457. [Google Scholar] [CrossRef] [Green Version]
- Alnoee, A.B.; Riis, T.; Baatrrup-Pedersen, A. Comparison of metabolic rates among macrophyte and nonmacrophyte habitats in streams. Freshw. Sci. 2016, 35, 834–844. [Google Scholar] [CrossRef] [Green Version]
- Alnoee, A.B.; Levi, P.S.; Baattrup-Pedersen, A.B.; Riis, T. Macrophytes enhance reach-scale metabolism on a daily, seasonal and annual basis in agricultural lowland streams. Aquat. Sci. 2021, 83, 11. [Google Scholar] [CrossRef]
- Tyler, H.L.; Moore, M.T.; Locke, M.A. Influence of three aquatic macrophytes on mitigation of nitrogen species from agricultural runoff. Water Air Soil Pollut. 2012, 223, 3227–3236. [Google Scholar] [CrossRef]
- Roley, S.S.; Tank, J.L.; Griffiths, N.A.; Hall, R.O., Jr.; Davis, R.T. The influence of floodplain restoration on whole-stream metabolism in an agricultural stream: Insights from a 5-year continuous data set. Freshw. Sci. 2014, 33, 1043–1059. [Google Scholar] [CrossRef]
- Reilly, J.F.; Horne, A.J.; Miller, C.D. Nitrate removal from a drinking water supply with large free-surface constructed wetlands prior to groundwater recharge. Ecol. Eng. 2000, 14, 33–47. [Google Scholar] [CrossRef]
- Chang, J.; Wu, S.; Dai, Y.; Liang, W.; Wu, Z. Nitrogen removal from nitrate-laden wastewater by integrated vertical-flow constructed wetland systems. Ecol. Eng. 2013, 58, 192–201. [Google Scholar] [CrossRef]
- Acuna, V.; Vilches, C.; Giorgi, A. As productive and slow as a stream can be—The metabolism of a Pampean stream. Freshw. Sci. 2011, 30, 71–83. [Google Scholar]
- O’Donnell, B.; Hotchkiss, E.R. Coupling concentration- and process-discharge relationships integrates water chemistry and metabolism in streams. Water Resour. Res. 2019, 55, 10179–10190. [Google Scholar] [CrossRef]
- Poor, C.J.; McDonnell, J.J. The effects of land use on stream nitrate dynamics. J. Hydrol. 2007, 332, 54–68. [Google Scholar] [CrossRef]
- Carey, R.O.; Wollheim, W.M.; Mulukutla, G.K.; Mineau, M.M. Characterizing storm-event nitrate fluxes in a fifth order suburbanizing watershed using in situ sensors. Environ. Sci. Technol. 2014, 48, 7756–7765. [Google Scholar] [CrossRef] [PubMed]
- Castadelli, G.; Aschonitis, V.; Vincenzi, F.; Fano, E.A.; Soana, E. The effect of water velocity on nitrate removal in vegetated waterways. J. Environ. Manag. 2018, 215, 230–238. [Google Scholar] [CrossRef] [PubMed]
- Murphy, E.; Ghisalberti, M.; Nepf, H. Model and laboratory study of dispersion in flows with submerged vegetation. J. Water Resour. Res. 2007, 43, W05438. [Google Scholar] [CrossRef]
- Usborne, E.L.; Kröger, R.; Pierce, S.C.; Brandt, J.; Goetz, D. Preliminary evidence of sediment and phosphorus dynamics behind newly installed low-grade weirs in agricultural drainage ditches. Water Air Soil Pollut. 2013, 224, 1520. [Google Scholar] [CrossRef]
- Sheibley, R.W.; Duff, J.H.; Tesoriero, A.J. Low transient storage and uptake efficiencies in seven agricultural streams. J. Environ. Qual. 2014, 43, 1980–1990. [Google Scholar] [CrossRef] [PubMed]
- Kröger, R.; Moore, M.T.; Farris, J.L.; Gopalan, M. Evidence for the use of flow-grade weirs in drainage ditches to improve nutrient reductions from agriculture. Water Air Soil Pollut. 2011, 221, 223–234. [Google Scholar] [CrossRef]
- Zhao, S.; Cui, Y.; Luo, Y.; Peifeng, L. Experimental study on wetland hydraulic characteristics of vegetated drainage ditches. Water 2017, 9, 311. [Google Scholar] [CrossRef]
- Yasarer, L.M.W.; Bingner, R.L.; Garbrecht, J.D.; Locke, M.A.; Lizotte, R., Jr.; Momm, H.G.; Busteed, P.R. Climate change impacts on runoff, sediment, and nutrient loads in an agricultural watershed in the lower Mississippi River Basin. App. Eng. Agric. 2017, 33, 379–392. [Google Scholar] [CrossRef]
- Lizotte, R.E., Jr.; Yasarer, L.M.W.; Locke, M.A.; Bingner, R.L.; Knight, S.S. Lake nutrient responses to integrated conservation practices in an agricultural watershed. J. Environ. Qual. 2017, 46, 330–338. [Google Scholar] [CrossRef] [PubMed]
Figure 1.
Schematic diagram of (A) experimental ditch setup depicting dosing and sampling method. (B) Picture of simulated drainage ditches at University of Mississippi Field station.
Figure 1.
Schematic diagram of (A) experimental ditch setup depicting dosing and sampling method. (B) Picture of simulated drainage ditches at University of Mississippi Field station.

Figure 2.
Drainage (A) gross primary production (GPP) and (B) ecosystem respiration (ER) rates by hydraulic residence time and vegetation treatment for all runs. Negative rates (B) indicate oxygen consumption whereas positive rates represent oxygen production (A). Bars are the means and error bars represent the standard error of the mean.

Figure 3.
Drainage (A) nitrate and (B) soluble reactive phosphate (SRP) hourly net uptake rates by hydraulic residence time and vegetation treatment for all runs. Letters distinguish significant differences among HRT treatments within vegetation treatments. Bars are the means and error bars represent the standard error of the mean.

Figure 4.
Aboveground vegetation and soil nutrient content by sampling period. Panels (A–F) represent nutrient content and stoichiometry for vegetation. Panels (G–I) show soil nutrient content and stoichiometry differences between sampling periods for all drainages. Significant differences are indicated by lowercase letters, and bars are the means across drainages, with error bars representing the standard error of the mean.


Table 1.
Estimated total 24 h loads, net nutrient uptake for nitrate and soluble reactive phosphorus, and denitrification by vegetation and HRT treatment.
Table 1.
Estimated total 24 h loads, net nutrient uptake for nitrate and soluble reactive phosphorus, and denitrification by vegetation and HRT treatment.
| 2 h HRT | 4 h HRT | 6 h HRT | ||||
|---|---|---|---|---|---|---|
| Stream Fluxes (g) | Veg | UnVeg | Veg | UnVeg | Veg | UnVeg |
| NO3-N load | 15.5 ± 0.6 | 15.5 ± 0.6 | 15.5 ± 0.6 | 15.5 ± 0.6 | 15.5 ± 0.6 | 15.5 ± 0.6 |
| NO3-N net uptake | 8.4 ± 0.9 | 4.2 ± 0.6 | 4.8 ± 0.4 | 2.2 ± 0.3 | 3.9 ± 0.4 | 1.9 ± 0.4 |
| Denitrification | 1.3 ± 0.3 | 0.7 ± 0.0 | 2.0 ± 0.8 | 1.0 ± 0.1 | 1.1 ± 0.2 | 0.8 ± 0.2 |
| % N removal | 63% | 32% | 44% | 21% | 32% | 17% |
| PO4-P load | 9.9 ± 0.4 | 9.9 ± 0.4 | 9.9 ± 0.4 | 9.9 ± 0.4 | 9.9 ± 0.4 | 9.9 ± 0.4 |
| PO4-P net uptake | 1.6 ± 0.3 | 1.4 ± 0.2 | 1.4 ± 0.2 | 0.9 ± 0.3 | 1.3 ± 0.2 | 0.8 ± 0.2 |
| % P removal | 16% | 14% | 14% | 10% | 13% | 8% |
Table 2.
Percent nutrient concentrations and molar ratios (µ ± se) of belowground vegetation for pre- and post-experimental sampling periods.
Table 2.
Percent nutrient concentrations and molar ratios (µ ± se) of belowground vegetation for pre- and post-experimental sampling periods.
| Nutrient | Pre | Post | p |
|---|---|---|---|
| Percent C | 30.23 ± 2.32 | 34.92 ± 1.63 | 0.12 |
| Percent N | 0.75 ± 0.09 | 0.90 ± 0.04 | 0.18 |
| Percent P | 0.17 ± 0.01 | 0.18 ± 0.01 | 0.40 |
| C:N | 51.64 ± 5.49 | 45.98 ± 2.62 | 0.37 |
| C:P | 475.92 ± 34.90 | 506.43 ± 23.70 | 0.48 |
| N:P | 10.02 ± 1.27 | 11.29 ± 0.81 | 0.41 |
Publisher’s Note: MDPI stays neutral with regard to jurisdictional claims in published maps and institutional affiliations. |
© 2021 by the authors. Licensee MDPI, Basel, Switzerland. This article is an open access article distributed under the terms and conditions of the Creative Commons Attribution (CC BY) license (https://creativecommons.org/licenses/by/4.0/).
Share and Cite
MDPI and ACS Style
Nifong, R.L.; Taylor, J.M. Vegetation and Residence Time Interact to Influence Metabolism and Net Nutrient Uptake in Experimental Agricultural Drainage Systems. Water 2021, 13, 1416. https://doi.org/10.3390/w13101416
AMA Style
Nifong RL, Taylor JM. Vegetation and Residence Time Interact to Influence Metabolism and Net Nutrient Uptake in Experimental Agricultural Drainage Systems. Water. 2021; 13(10):1416. https://doi.org/10.3390/w13101416
Chicago/Turabian StyleNifong, Rachel L., and Jason M. Taylor. 2021. "Vegetation and Residence Time Interact to Influence Metabolism and Net Nutrient Uptake in Experimental Agricultural Drainage Systems" Water 13, no. 10: 1416. https://doi.org/10.3390/w13101416
Note that from the first issue of 2016, this journal uses article numbers instead of page numbers. See further details here.