
Interaction of Titanium Dioxide with Formaldehyde in the Presence of Quartz Sand under Static and Dynamic Conditions


School of Environmental Engineering, Technical University of Crete, 73100 Chania, Greece
*
Author to whom correspondence should be addressed.
Water 2021, 13(10), 1420; https://doi.org/10.3390/w13101420
Submission received: 14 April 2021
/
Revised: 17 May 2021
/
Accepted: 18 May 2021
/
Published: 20 May 2021
Abstract
:Formaldehyde (FA) is an extremely active compound that is widely used in numerous applications. Given that FA is a known carcinogen, it is essential to remove it from the environment. Titanium dioxide (TiO2), due to its special physicochemical properties, is a promising adsorbent for the removal of specific organic compounds from aqueous solutions. In this study, the interaction of TiO2 with FA in the presence and absence of quartz sand, the most common mineral on the Earth’s surface, was investigated under static and dynamic (batch) conditions, at 25 °C. The experimental data suggested that the sorption of FA onto TiO2 can be described adequately by a pseudo-second order kinetic model, indicating that the main sorption mechanism was chemisorption. It was observed that the combination of TiO2 and quartz sand could1 lead up to effective removal of FA from aqueous samples.
1. Introduction
Water supplies are increasingly polluted due to human activities, as the Earth’s population grows [1]. Industrial, municipal and domestic waste is often discharged into water canals, rivers, streams and lakes [2]. This waste causes toxic chemical and bacterial contamination, which is responsible for several water-borne diseases. Among the most frequently occurring toxic organic substances in water is formaldehyde (FA), because of its extensive use in numerous applications by various industries including: textile, furniture, aquaculture, agriculture, tannery, petrochemical, and cosmetics [3,4,5,6,7].
FA can be formed from catalytic oxidation of methanol, water disinfection processes as a byproduct, or from combustion of natural organic materials [8,9,10,11,12,13]. The presence of FA in the water, may cause adverse effects to human health (cancer, cardiovascular disease, neurological disease, miscarriage etc.), the environment and the ecosystem. The recommended FA concentrations in drinking-water are less than 100 μg/L [14,15]. Typical FA concentrations in ozonated drinking-water are up to 30 μg/L [16,17]. However, FA concentrations in surface waters have been reported in the range 1.2–9 mg/L [18], and in industrial wastewaters in the range 0.2–10 g/L [19,20,21]. Often, conventional water treatment methods are not sufficient to remove all types of pollutants, so the development of new advanced technologies for FA removal is a burning issue. Current methods for removing FA from water depend mainly on physical adsorption with a removal success rate of 60–65% [22] and chemical catalytic oxidation [23]. Many materials have been shown to be effective in adsorbing FA, such as activated carbon, clays and carbon nanotubes [24,25,26,27].
Nanotechnology research has increased in the recent years and many revolutionary developments have taken place in this field. Nanomaterials have been extensively studied due to their many applications in the fields of energy, electronics, biomedicine and environmental remediation [28,29,30,31,32,33,34]. Titanium dioxide (TiO2) is a nanomaterial, which has been used extensively in various commercial applications and catalytic reactions due to its very good physical, optical, electrical, and stable structural properties [35,36]. It should be noted that TiO2 concentrations in effluents from urban wastewater treatment plants are in the range 10–100 mg/L [37]. TiO2 is the 4th most abundant metal in the world, and can be found in various minerals, mainly in rutile, brocite, and anatase, but also in the human body, ash and plants [38]. It should be noted that TiO2 is present in various widely used products, such as paints, paper, plastics, cosmetics, food and much more [39]. By 2025, TiO2 production in the US alone is expected to increase to 52.5 million tons/year [40]. Additionally, the nanomaterial technology offers an economical and efficient alternative to water purification and disinfection. Adsorption processes have the advantage of effectively removing contaminants from the aqueous phase. TiO2 has been used as an adsorbent for the successful removal of organic compounds from water [41], as well as for the removal of V (V) and Pb (II) from aqueous solutions [42]. In addition, TiO2 nanocomposites are widely used as adsorbents to remove metal ions from industrial waste [43]. Therefore, the use of TiO2 nanoparticles as adsorbent could be a promising solution for environmental remediation [44].
There are only a few studies of FA adsorption onto TiO2 surfaces published in the literature. These studies concluded that FA binds weakly on the rutile TiO2 surface either in a monodentate configuration or in a bidentate fashion [45,46,47], and on the anatase TiO2 surface in a monodentate configuration, with a small repulsive interaction, where co-adsorbed FA molecules can aggregate due to weak attractions [48].
Given that both FA and TiO2 are frequently released into the environment, they can easily infiltrate subsurface formations. It should be noted that the adsorption of FA onto quartz sand was reported to be weak [27]. Consequently, it is worthwhile to study the interaction between FA and TiO2 in the presence of a common rock-forming mineral such as quartz sand. Although the sorption of FA on single crystal rutile, as well as anatase TiO2 surfaces, has been studied from a physical chemistry view point [45,46,47,48], the kinetics of FA sorption onto a mixture of rutile and anatase TiO2 nanoparticles in the presence of quartz sand from an environmental engineering view point, to our knowledge, has not been reported before in the literature. In the present study, kinetic batch experiments were conducted under both static and dynamic conditions in order to investigate the interaction of FA with TiO2 in the presence of quartz sand. The results of this study could lead to the development of a new FA remediation technique based on TiO2 nanoparticles and quartz sand.
2. Materials and Methods
The initial FA stock solution (1000 mg/L) was prepared by placing 124 μL of 37 wt % FA solution (Sigma-Aldrich ≥99%) with a plunger pipette, into a 50 mL volumetric flask, and adding distilled deionized water (ddH2O) to the volumetric mark. From this concentrated stock solution numerous diluted solutions were made by adding ddH2O, in order to obtain the desired FA solution concentration for each individual experiment conducted in this study. Due to the fact that FA reacts with light, all FA solutions were covered with foil and stored in a darkroom at 4 °C [49].
For the detection of FA, the Nash method [50] was used, as outlined by Fountouli et al. [27]. For the preparation of 100 mL of Nash reagent solution, 0.2 mL of acetyl acetone, 0.3 mL of acetic acid, and 15 g of ammonium acetate were dissolved in ddH2O. Equal volumes of Nash reagent and FA solution were mixed in order to form a yellowish product, diacetyl dihydrolutidine (DDL), which was determined spectrophotometrically at 625 nm with a UV-Vis spectrophotometer (UV-1900 Shimadzu, Japan). The necessary calibration curve of the FA peak area versus FA concentration was constructed by linear regression of the experimental data obtained using FA sample solutions (5 mL of Nash reagent with 5 mL of FA), where 1, 2, 4, 6 and 8 mg/L FA solutions were prepared by diluting the concentrated FA stock solution.
To lower the pH of solutions, a 0.1 M solution of hydrogen chloride (HCl) was prepared by diluting with ddH2O, 3.04 mL of a concentrated HCl solution (1.2 g/mL) to a final volume of 1000 mL. To alkalize solutions, a 0.6 M sodium hydroxide (NaOH) solution was prepared by adding 2.4 g NaOH to 100 mL of ddH2O.
The TiO2 nanoparticles used in this study were a mixture of rutile and anatase (99.5%, molecular weight: 79.87, Sigma-Aldrich, St. Louis, MO, USA). Based on the BET laboratory analysis reported by the manufacturer, the size of the TiO2 nanoparticles was less than 25 nm. The initial TiO2 stock solution (100 mg/L) was prepared by placing 100 mg of TiO2 (mixture of rutile and anatase), into a 1000 mL volumetric flask, and adding ddH2O to the volumetric mark.
In this study, quartz sand was used as a sorbent, because it is the most common mineral on the surface of the Earth. The quartz sand (Filcom, Sibelco Co, Wessem, Netherlands) had size range 400 to 800 μm, specific density 2.6 gr/cm3, hardness 7 Mohs, and mass density = 1.6 t/m3. The chemical analysis of quartz sand is: 96.2% SiO2, 0.15% Na2O, 0.02% MgO, 1.75% Al2O3, 0.03% P2O5, 0.06% SO3, 0.78% K2O, 0.11% CaO, 0.46% Fe2O3, 0.02% BaO, 0.01% Mn3O4, and 0.41% loss on ignition. The quartz sand was cleaned with a frequently employed procedure [51,52,53]. Note that the number of attachment sites per unit volume of the quartz sand is increasing with decreasing quartz sand size [54].
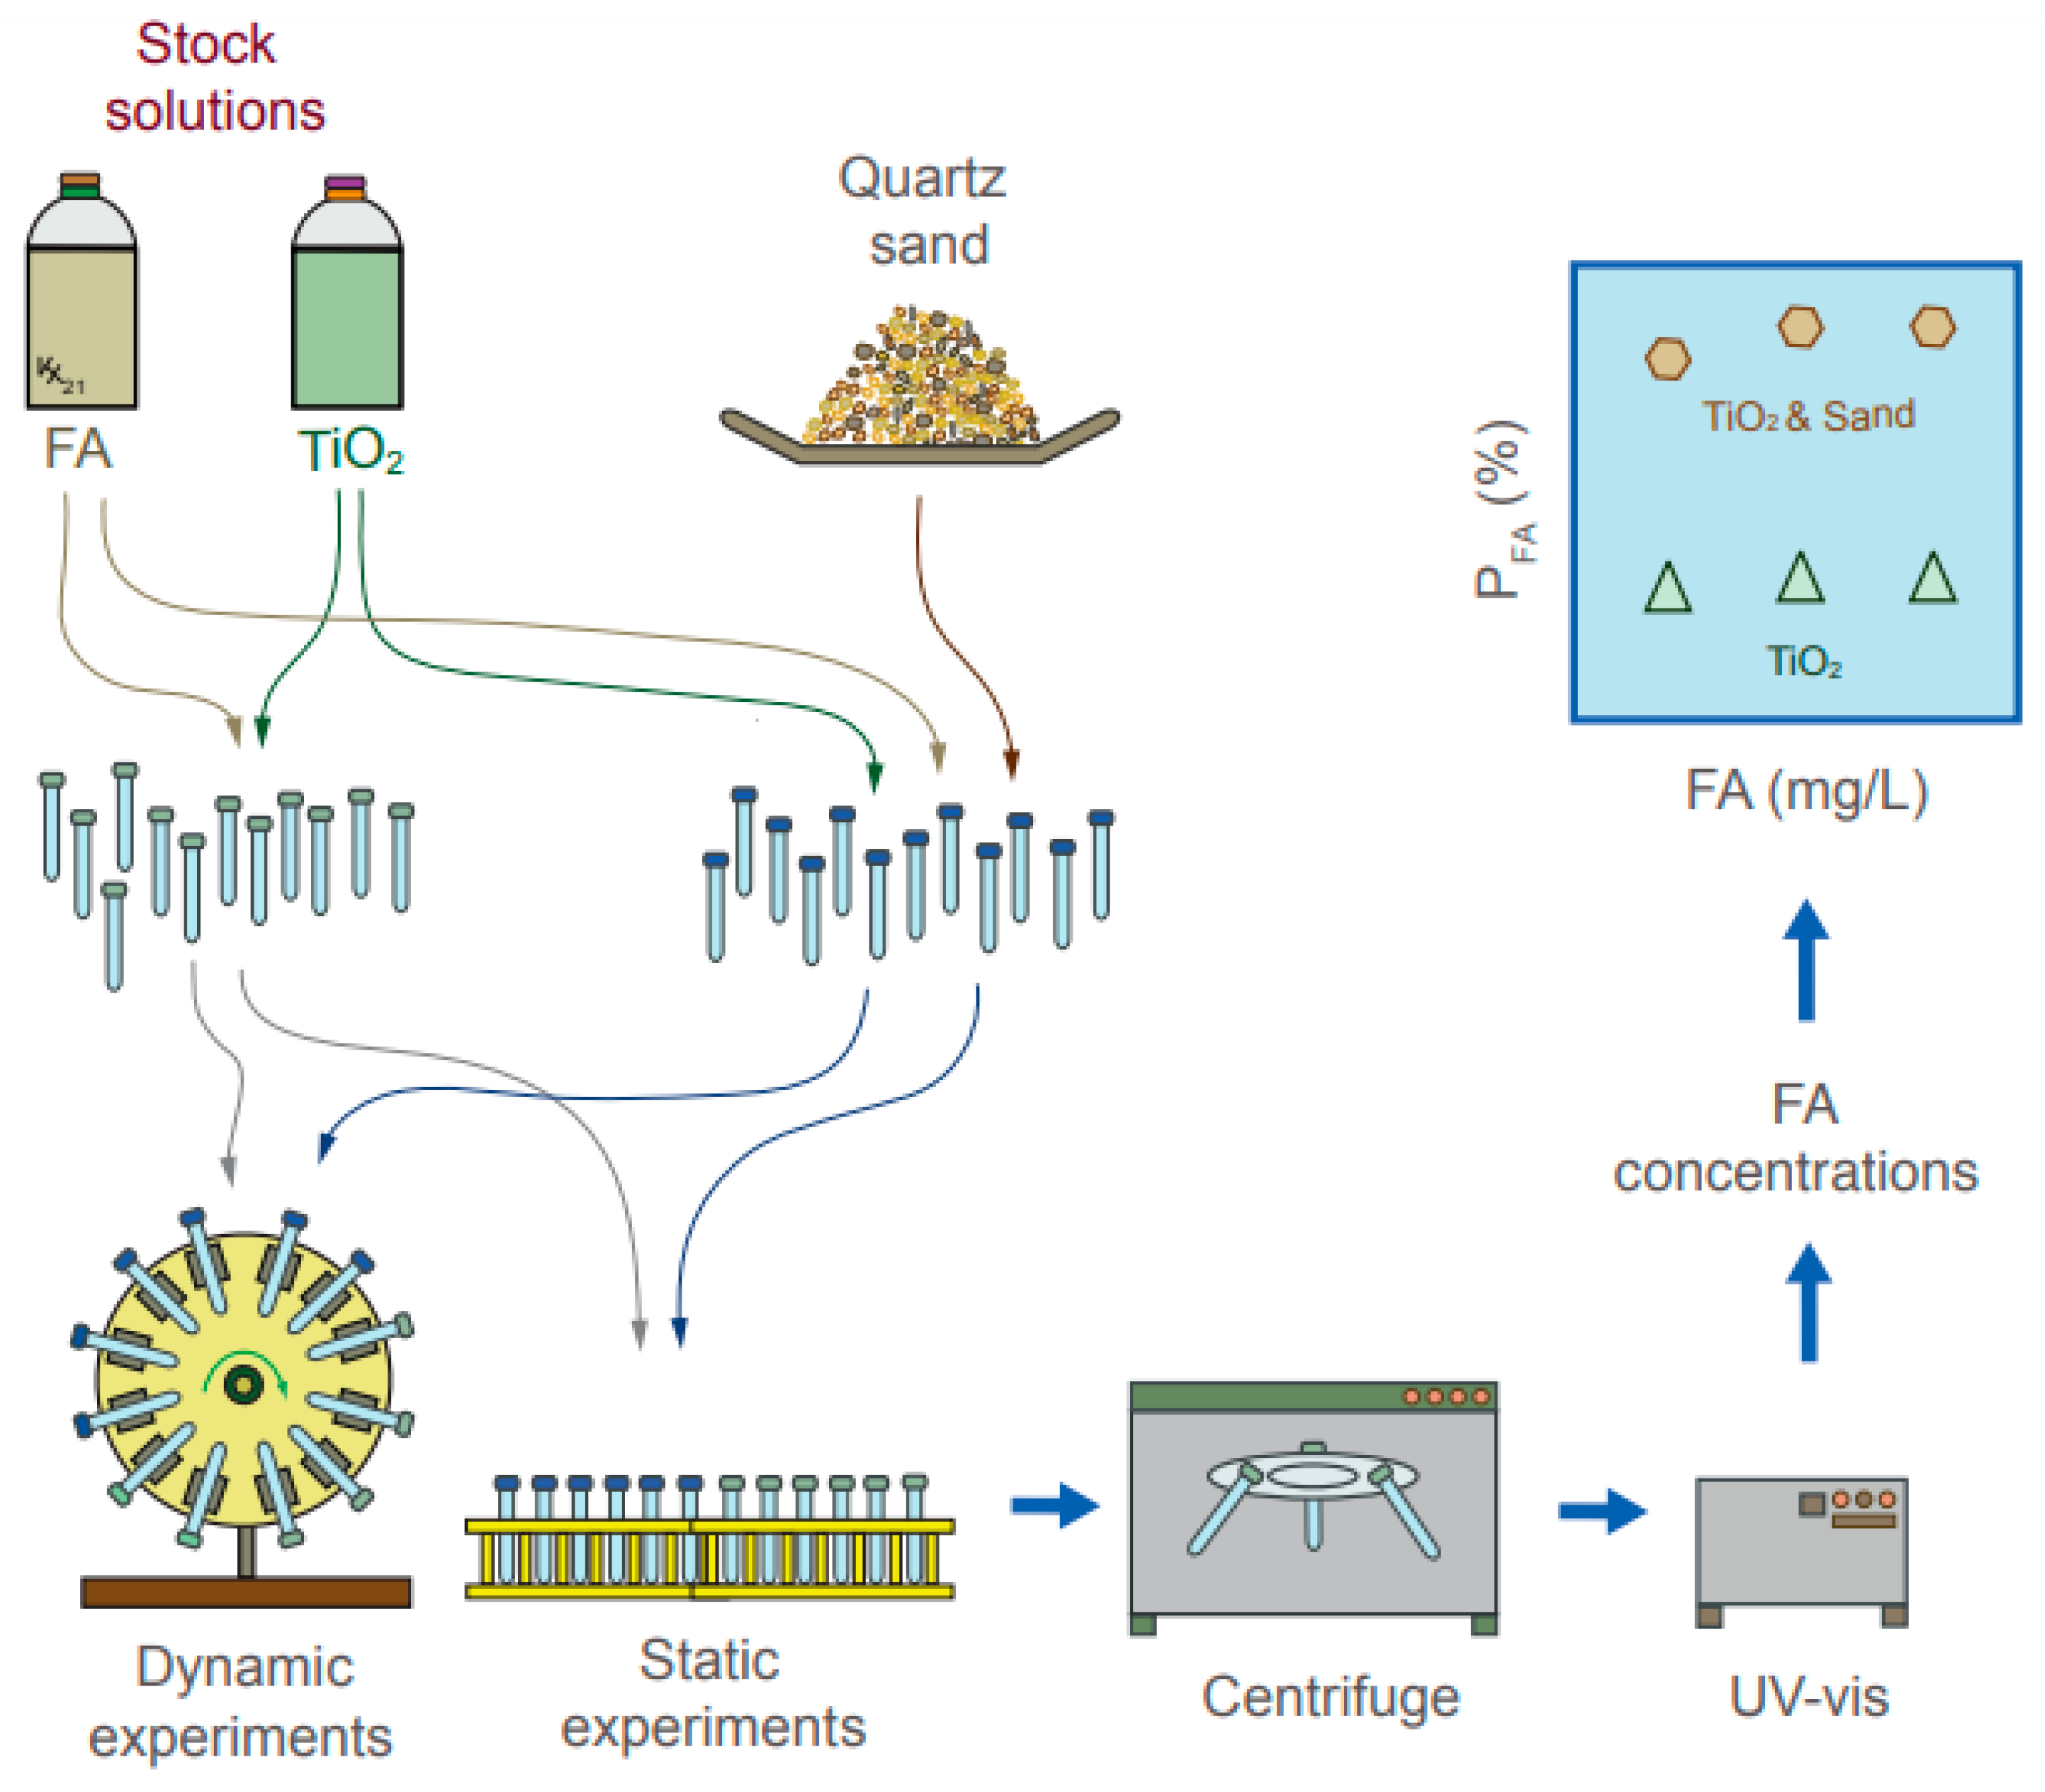
Two different series of batch experiments (with and without quartz sand) were performed at 25 °C. Each series incorporated both static and dynamic experiments. All batch experiments were performed in 20 mL Pyrex glass screw cap tubes (Fisher Scientific), which were thoroughly washed with detergent, and oven dried overnight. For each series of experiments, 20 glass tubes were employed, 10 for the dynamic experiments and 10 for the static experiments. The static experiments were performed with the tubes placed on a simple tube holder, whereas the dynamic experiments were performed with the tubes placed on a tube rotator, operated at 12 rpm for complete mixing of the liquid solution. One glass tube from each group (static and dynamic) was selected at random at a preselected time periods (5, 15, 30, 45, 60, 90, 120, 150, 180, 240 min). The liquid samples collected from each glass tube were centrifuged at 30,000 rpm for 10 min to precipitate the suspended TiO2 nanoparticles and leave only FA in the supernatant. Exactly 5 mL of the supernatant were added to 5 mL of Nash reagent, and the resulting mixture was analyzed by UV–visible spectroscopy. The following parameters were examined in both series of experiments (with and without quartz sand): pH 4, 7.5 and 10, ionic strength (Is) 1, 50, and 100 mM, and FA concentration of 3, 5, and 8 mg/L. The TiO2 concentration in all experiments was equal to 100 mg/L. Additionally, 14 g for quartz sand were added to each of the 20 glass tubes of the second series of batch experiments. A schematic illustration of the experimental procedures is presented in Figure 1.
3. Theoretical Considerations
The FA concentrations sorbed onto either TiO2 or quartz sand at time t, (mg FA/g solids), were determined by the following equation [26]:
where C0 (mg FA/L solution) is the initial liquid phase FA concentration, Ct (mg FA/L solution) is the liquid phase FA concentration at time t, V (L solution) is the volume of the solution, and W (g sorbent) is the dry mass of the sorbent.
If more than one sorbent is used at the same time, the following expression provides the total mass removed from solution by all sorbents used, as opposed to the mass sorbed to each sorbent separately. In order to evaluate the efficiency of the sorption process, to each sorbent individually or combined, the percentage of FA removal, PFA (%), at a given time was determined by [26]:
Preliminary analysis of the experimental data collected in this study showed that the sorption process is best described by a pseudo-second order model expressed by the following differential relation [55]:
where t (d) is time, kp2 (g sorbent/(mg FA)·d) is the rate constant of the pseudo-second-order sorption model, and (mg FA/g sorbent) is the FA concentration sorbed onto the solids at equilibrium. The above equation can be solved by separation of variables followed by integration over time from 0 to t to yield:
In addition, the above equation can be rearranged in the following linear form:
The pseudo-second-order model suggests that the sorption mechanism is governed by chemical sorption (chemosorption), where electron exchange takes place between the sorbed chemical and the sorbent [56]. Certainly, the pseudo-second-order kinetic sorption model has been employed successfully in several sorption studies of environmental interest [27,57,58]. In this study, the pseudo-second order kinetics model was fitted to the experimental data with the public domain nonlinear least squares regression software ColloidFit [59].
4. Results and Discussion
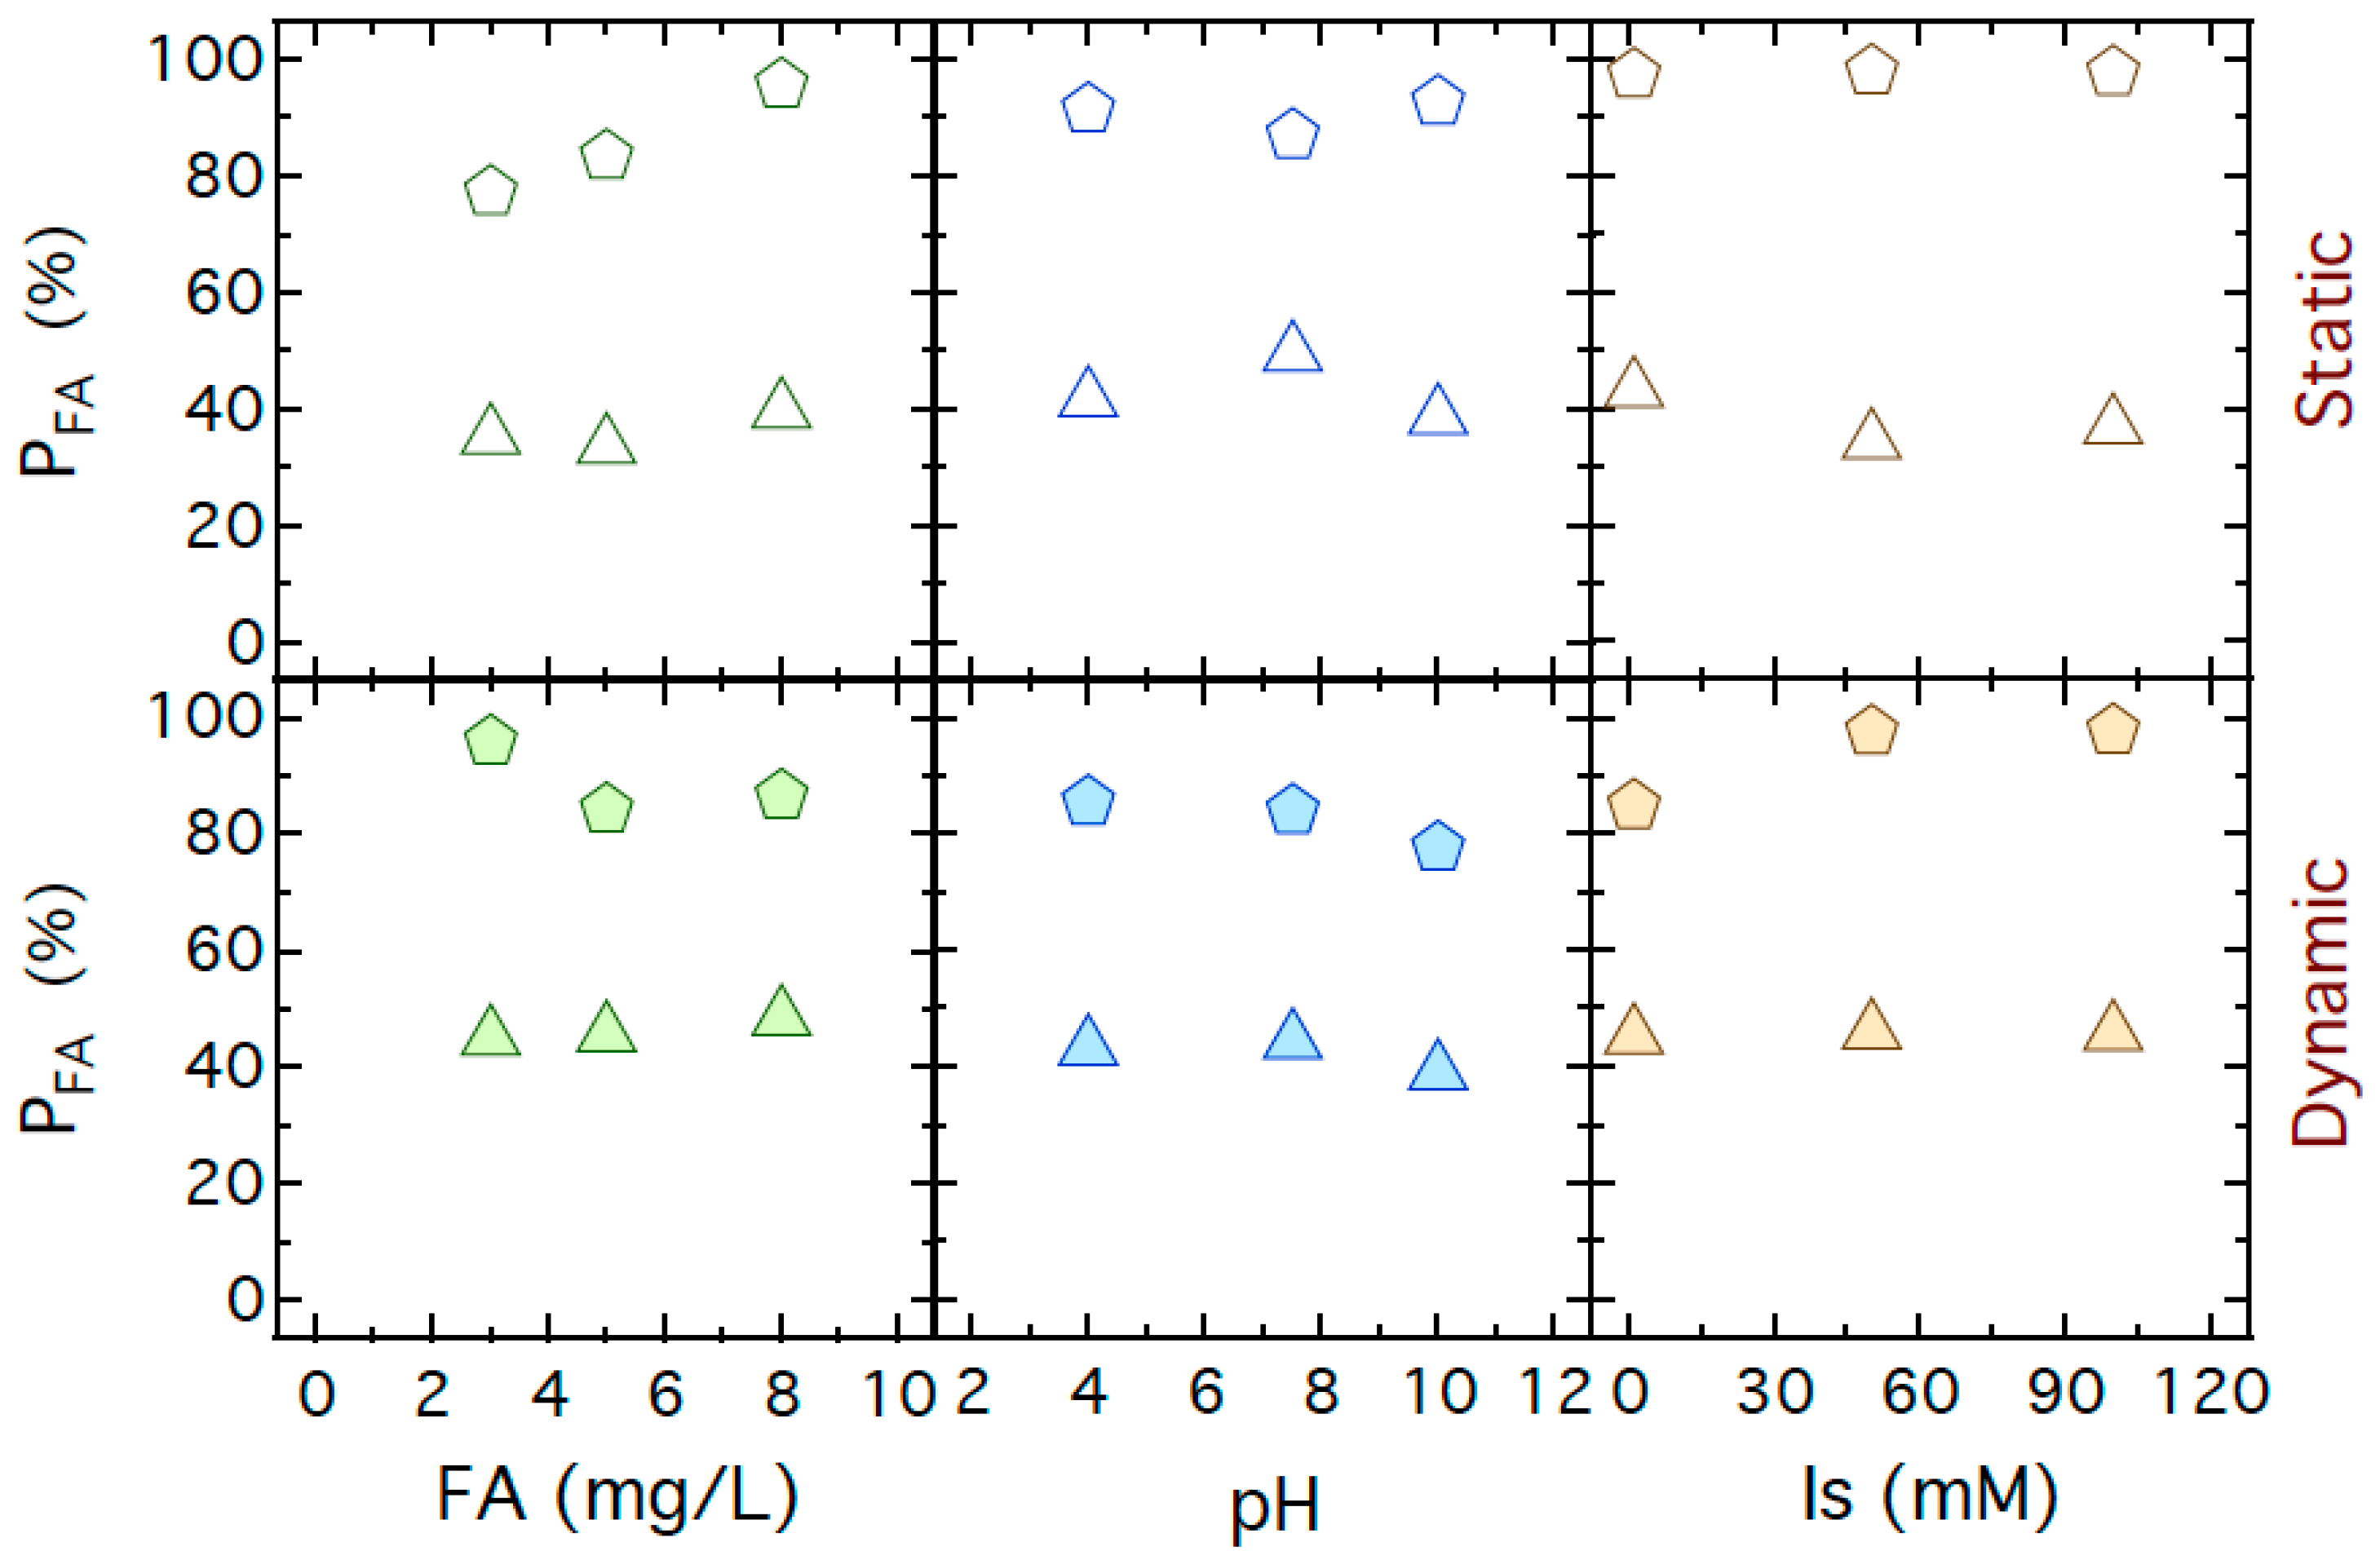
The experimental data collected from each FA sorption experiment conducted in this study, at various conditions, were used to evaluate the corresponding percentage of FA removal, PFA (%), at equilibrium. The results are presented graphically in Figure 2. Clearly, the PFA values were higher in the presence of both TiO2 nanoparticles and quartz sand (PFA > 80%), than only TiO2 nanoparticles (PFA~40%), for both static and dynamic conditions. This is an anticipated result, because generally FA is poorly sorbed onto TiO2 nanoparticles [60] and very weakly onto quartz sand [27], but in the presence of both TiO2 nanoparticles and quartz sand, FA can access more sorption sites on the two different sorbents. No clear effect of FA concentration, pH, and Is on the percentage of FA removal could be detected from these results. Certainly, the experimental data presented in Figure 2 shown that the combined use of sorbents (TiO2 nanoparticles and quartz sand) resulted in higher FA removal than the cases where only TiO2 nanoparticles were used. Certainly, the interactions between TiO2 nanoparticles and quartz sand enhanced FA removal from the liquid phase. Therefore, the presence of quartz sand is expected to be helpful in FA removal from aqueous solutions.
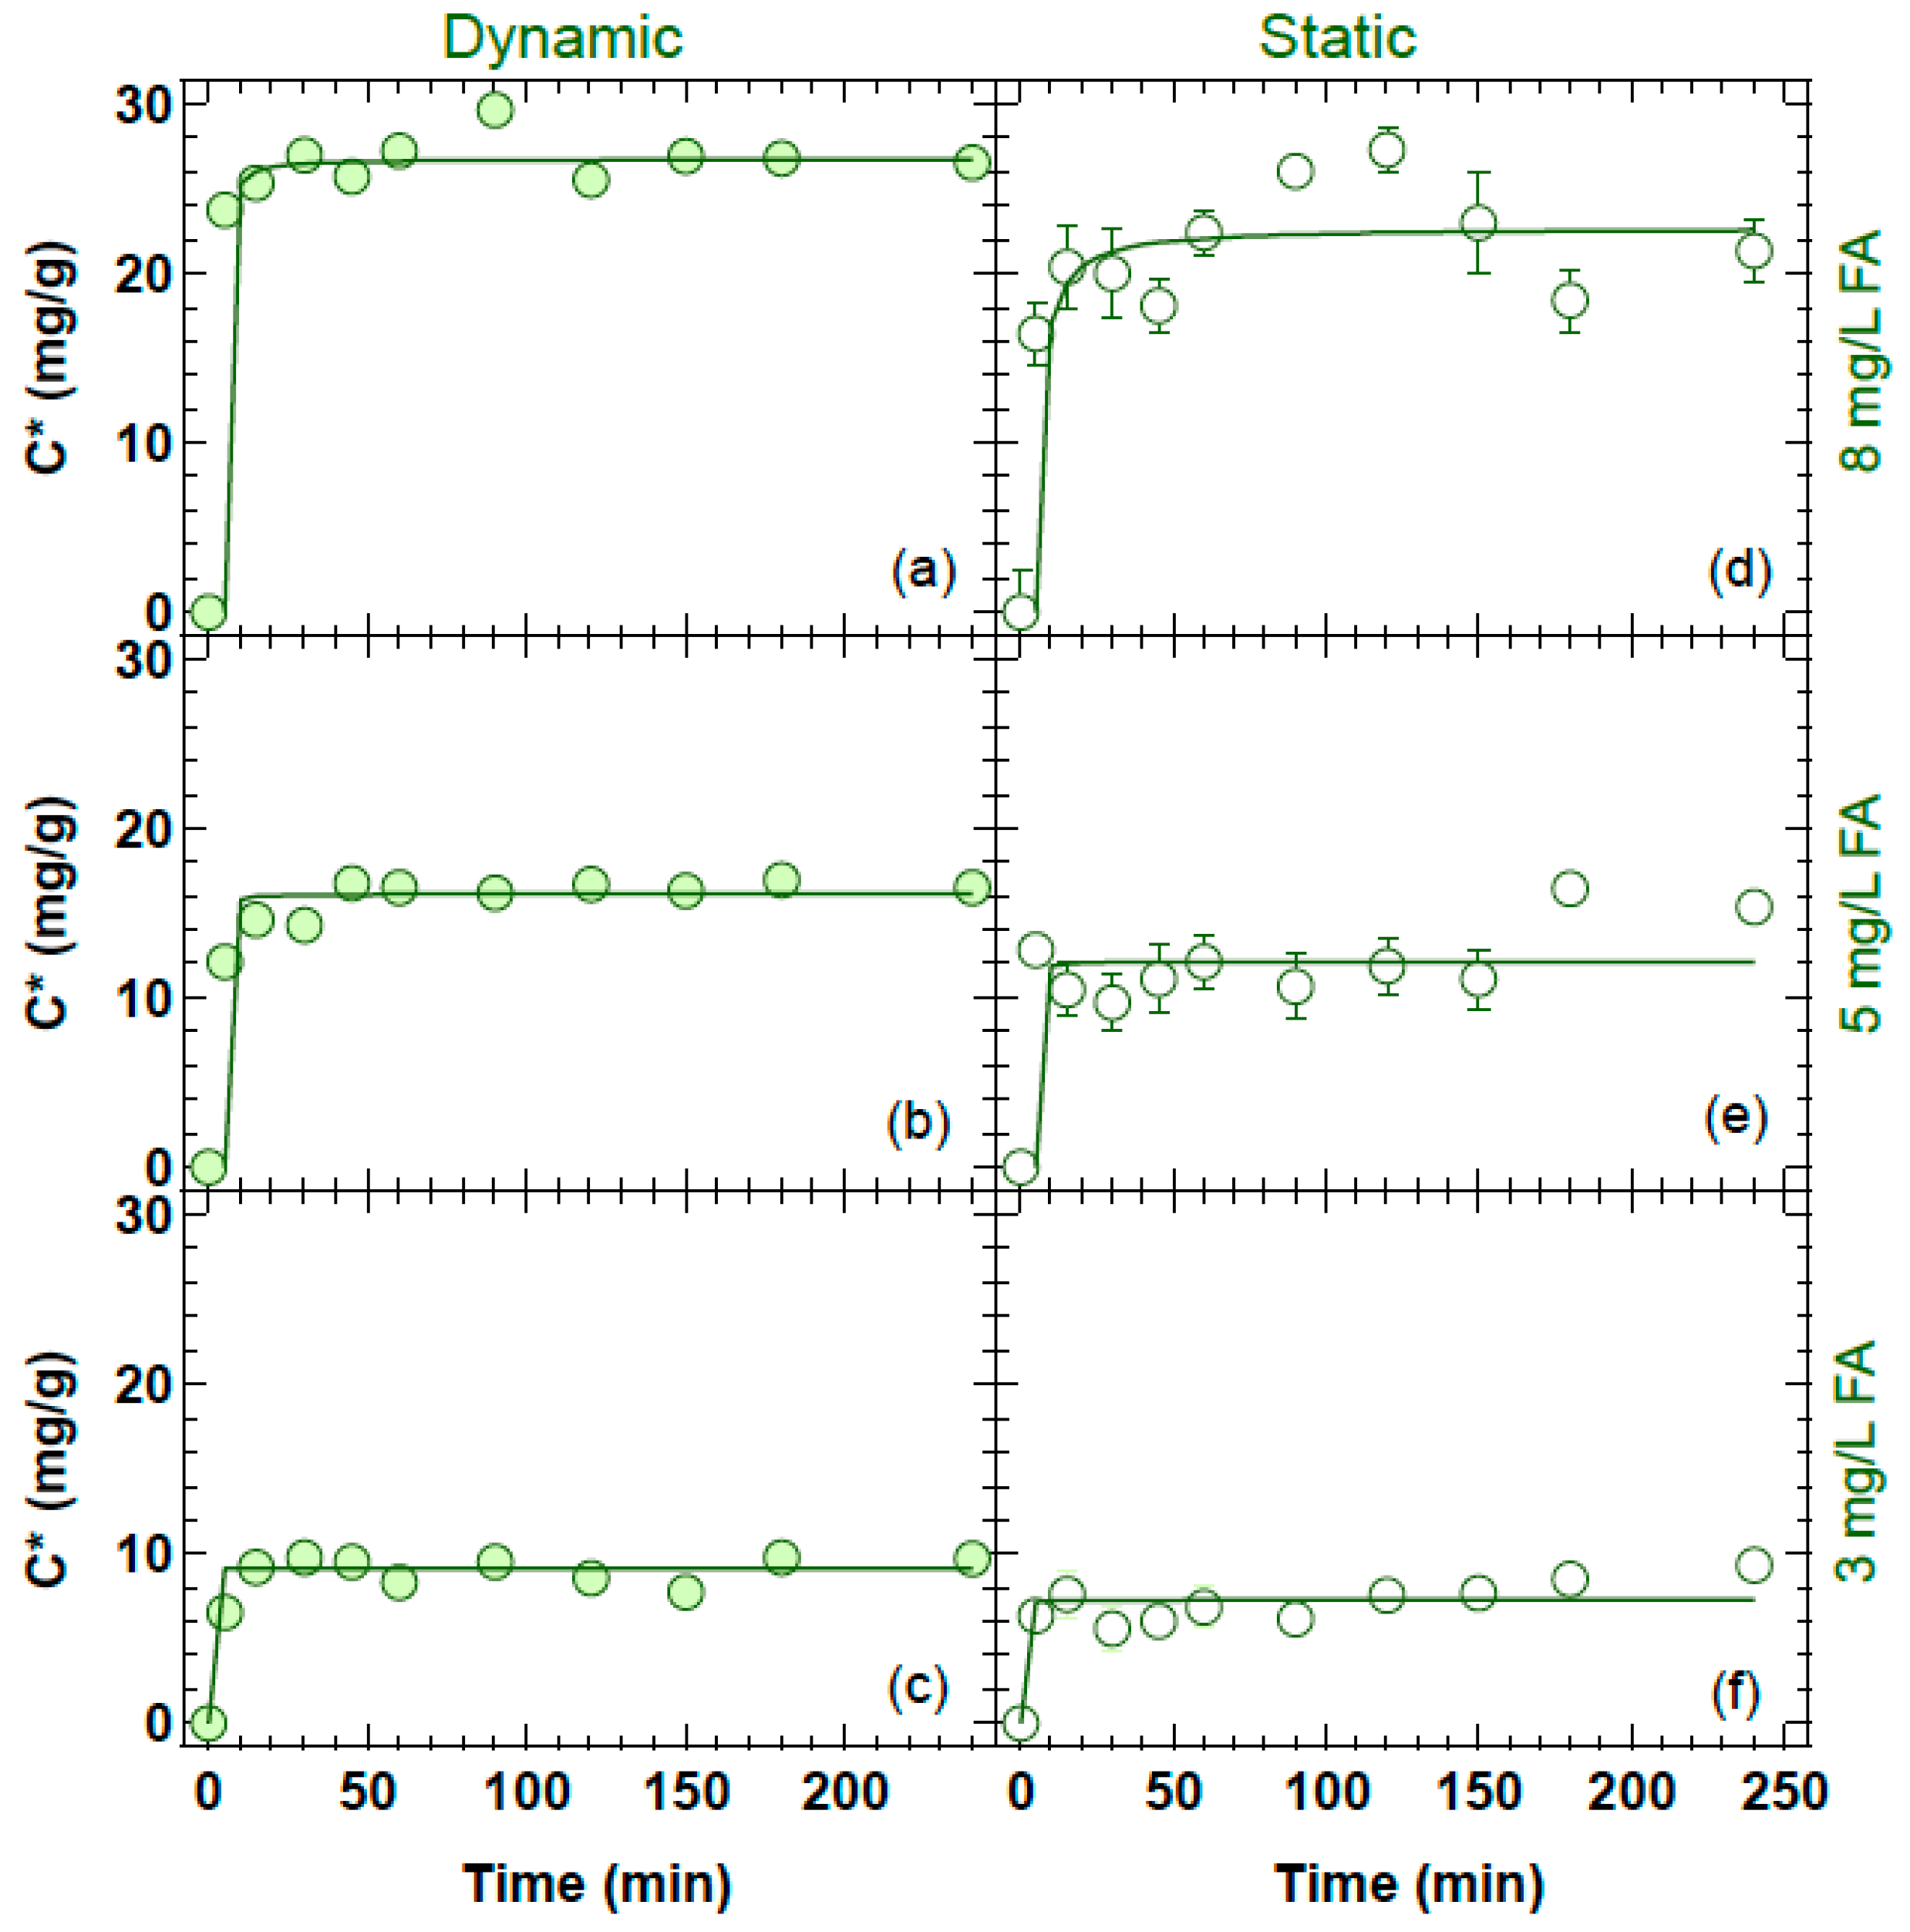
The kinetic experiments of FA sorption onto TiO2 nanoparticles, with FA initial concentrations of 3, 5 and 8 mg/L and TiO2 concentration of 100 mg/L, under dynamic and static conditions are presented in Figure 3. It is evident from the experimental data that equilibrium occurred within the first 15 min of the experimental duration. As expected, the amount of FA sorbed onto TiO2 nanoparticles is higher for the dynamic than static conditions due to agitation. Initially, FA was sorbed quickly onto TiO2 nanoparticles due to the large number of adsorption sites available. As the sorption process continued, the sorption rate decreased due to the reduction of available sorption sites [61]. Fast FA sorption has also been observed in other similar studies [27,62]. In addition, note that FA sorption onto TiO2 nanoparticles was directly proportional to the FA initial concentration. This is an anticipated result, which has also been observed in other similar sorption studies [27].
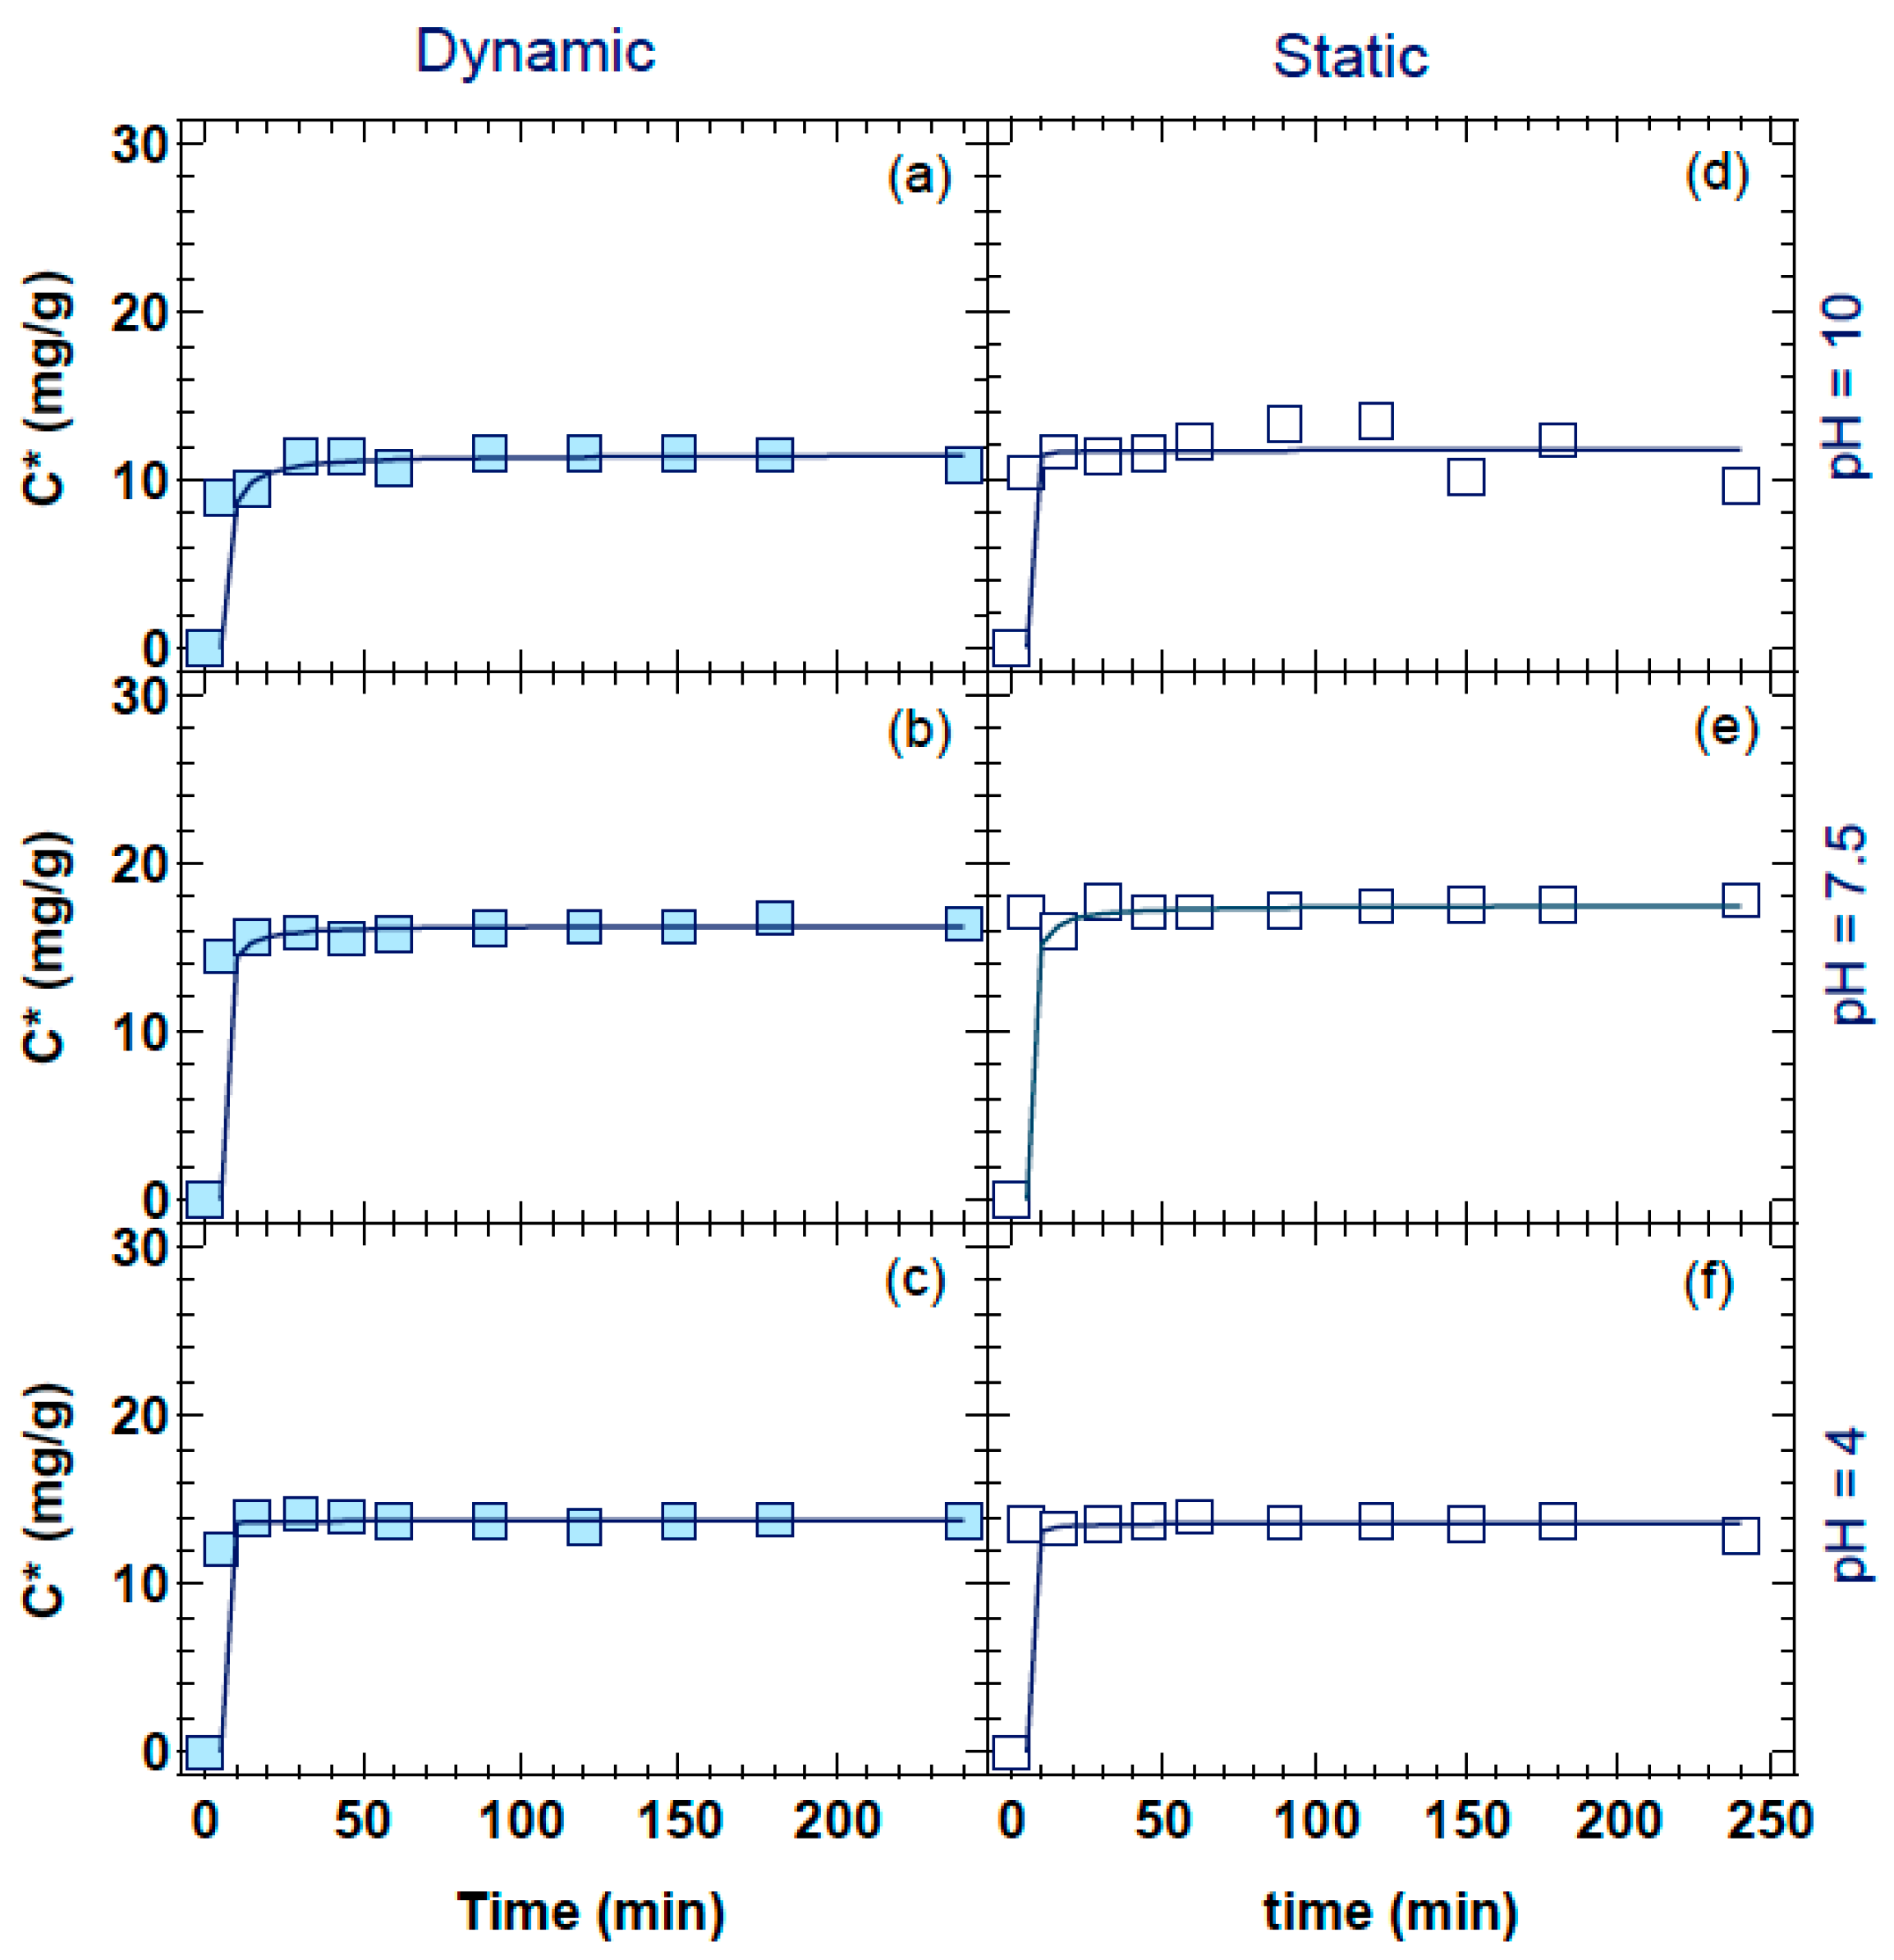
The kinetic experiments of FA sorption onto TiO2 nanoparticles at pH values of 4, 7.5, and 10, with FA initial concentration of 5 mg/L and TiO2 concentration of 100 mg/L, under dynamic and static conditions are shown in Figure 4. The experimental data suggested that FA sorption onto TiO2 nanoparticles was affected weakly by pH. The highest FA sorption was observed at pH 7.5 and the lowest at pH 10. This is consistent with previous studies where at pH < 7, FA removal was reported to increase due to the positively charged hydrogen ion accumulation around the adsorbent surface [63,64,65].
The kinetic experiments of FA sorption onto TiO2 nanoparticles at solution ionic strengths (Is) of 1, 50, and 100 mM, with FA initial concentration of 5 mg/L and TiO2 concentration of 100 mg/L, under dynamic and static conditions are shown in Figure 5. The experimental data suggested that FA sorption onto TiO2 nanoparticles is practically unaffected by the imposed Is changes under dynamic conditions, whereas a slight FA sorption decrease was observed at the higher Is values (compare Figure 5d,e). This is in agreement with an earlier study reported in the literature where Is variations did not yield significant changes in the FA sorption process [27].
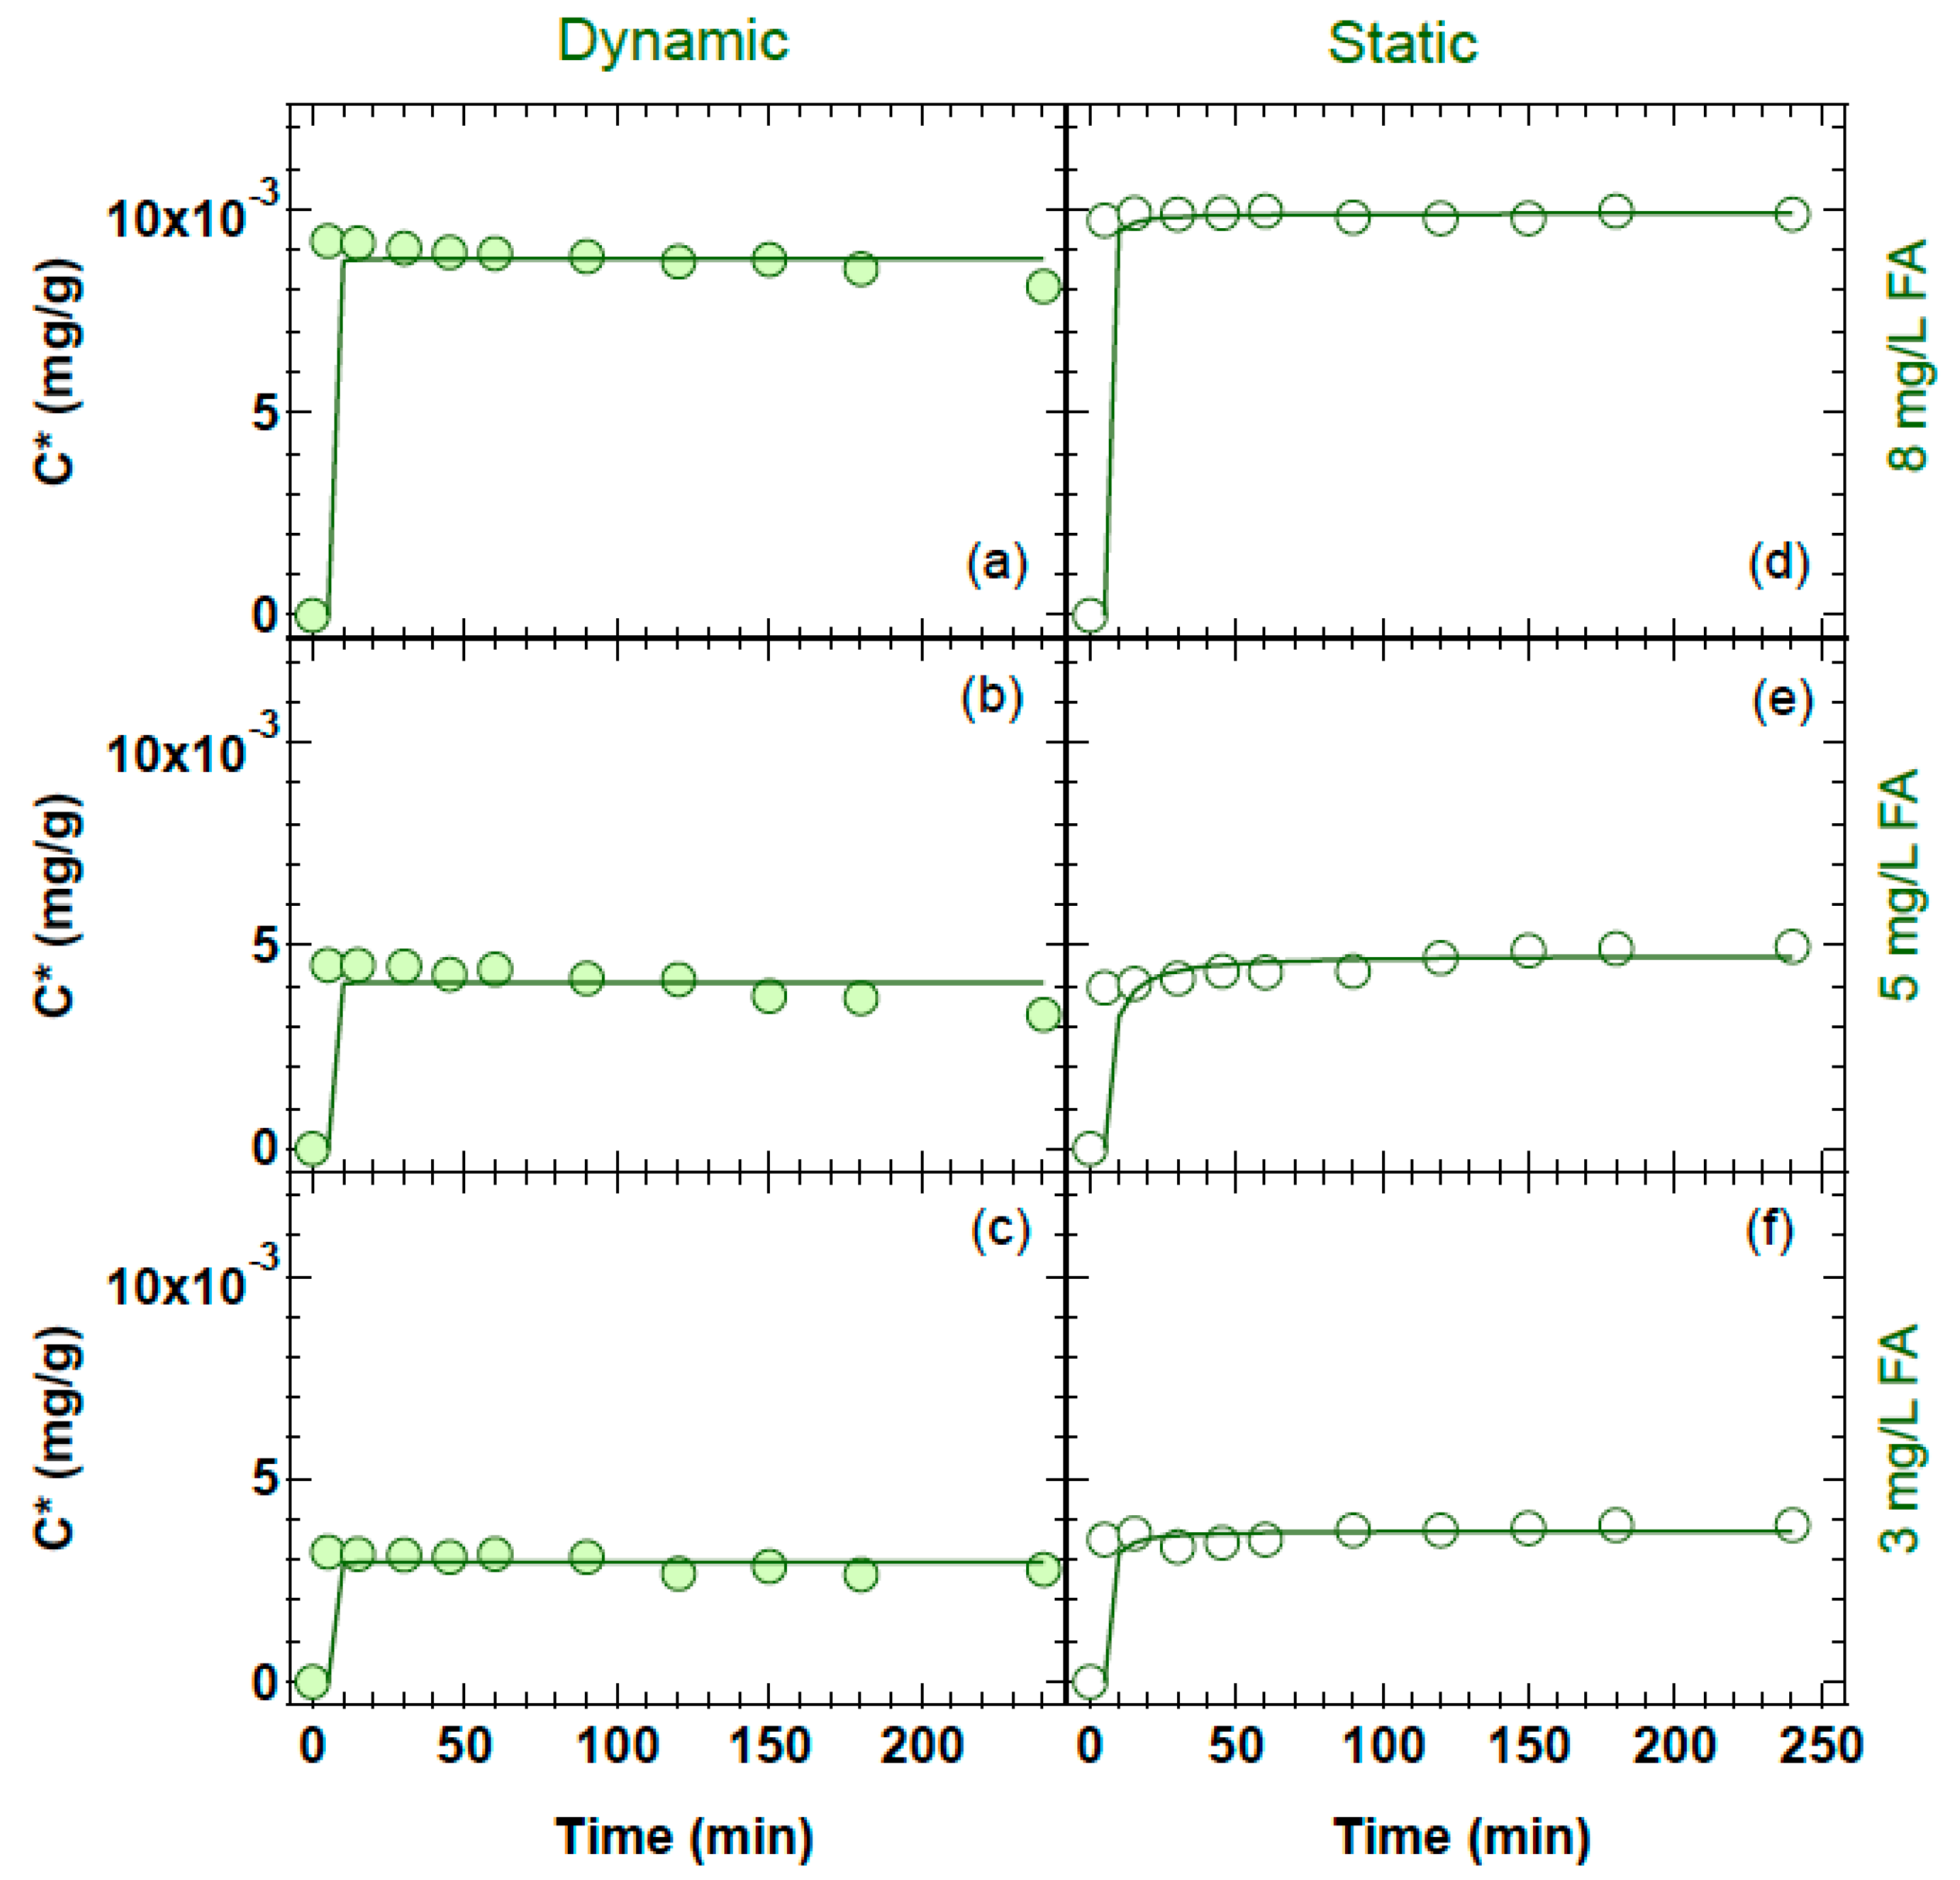
The kinetic experiments of FA sorption onto TiO2 nanoparticles in the presence of 14 g quartz sand, with FA initial concentrations of 3, 5 and 8 mg/L and TiO2 concentration of 100 mg/L, under dynamic and static conditions are shown in Figure 6. The experimental results indicated that equilibrium was achieved faster (within the first 5 min) in the presence of quartz sand compared to the case where the quartz sand was absent. This was attributed to the additional sorption sites on the quartz sand. It is worth noting that the mass of TiO2 nanoparticles (100 mg) used in these experiments was significantly smaller compared to the added mass of quartz sand (14 g). Clearly, the sorption process depended strongly on the concentration of FA, as well as the concentration of the available sorbents. In general, the extent of solute sorption increased with increasing sorbent concentration. Note that by increasing the sorbent concentration led to an augmented number of available sorption sites. However, the total amount of solute sorbed per unit weight of sorbent may decrease after increasing the sorbent concentration due to interference caused by the interaction of the active sites of the sorbent [66,67,68]. In this study, instead of increasing the TiO2 concentration, another sorbent (quartz sand) was added in each Pyrex glass screw cap tube, which did not yield any interference but, as expected, increased the sorption sites. The observed FA sorption increase when the both sorbents (TiO2 nanoparticles and quartz sand) were used simultaneously was similar to the FA sorption increase, reported in the literature, when clay particles and quartz sand were used together as sorbents [69].
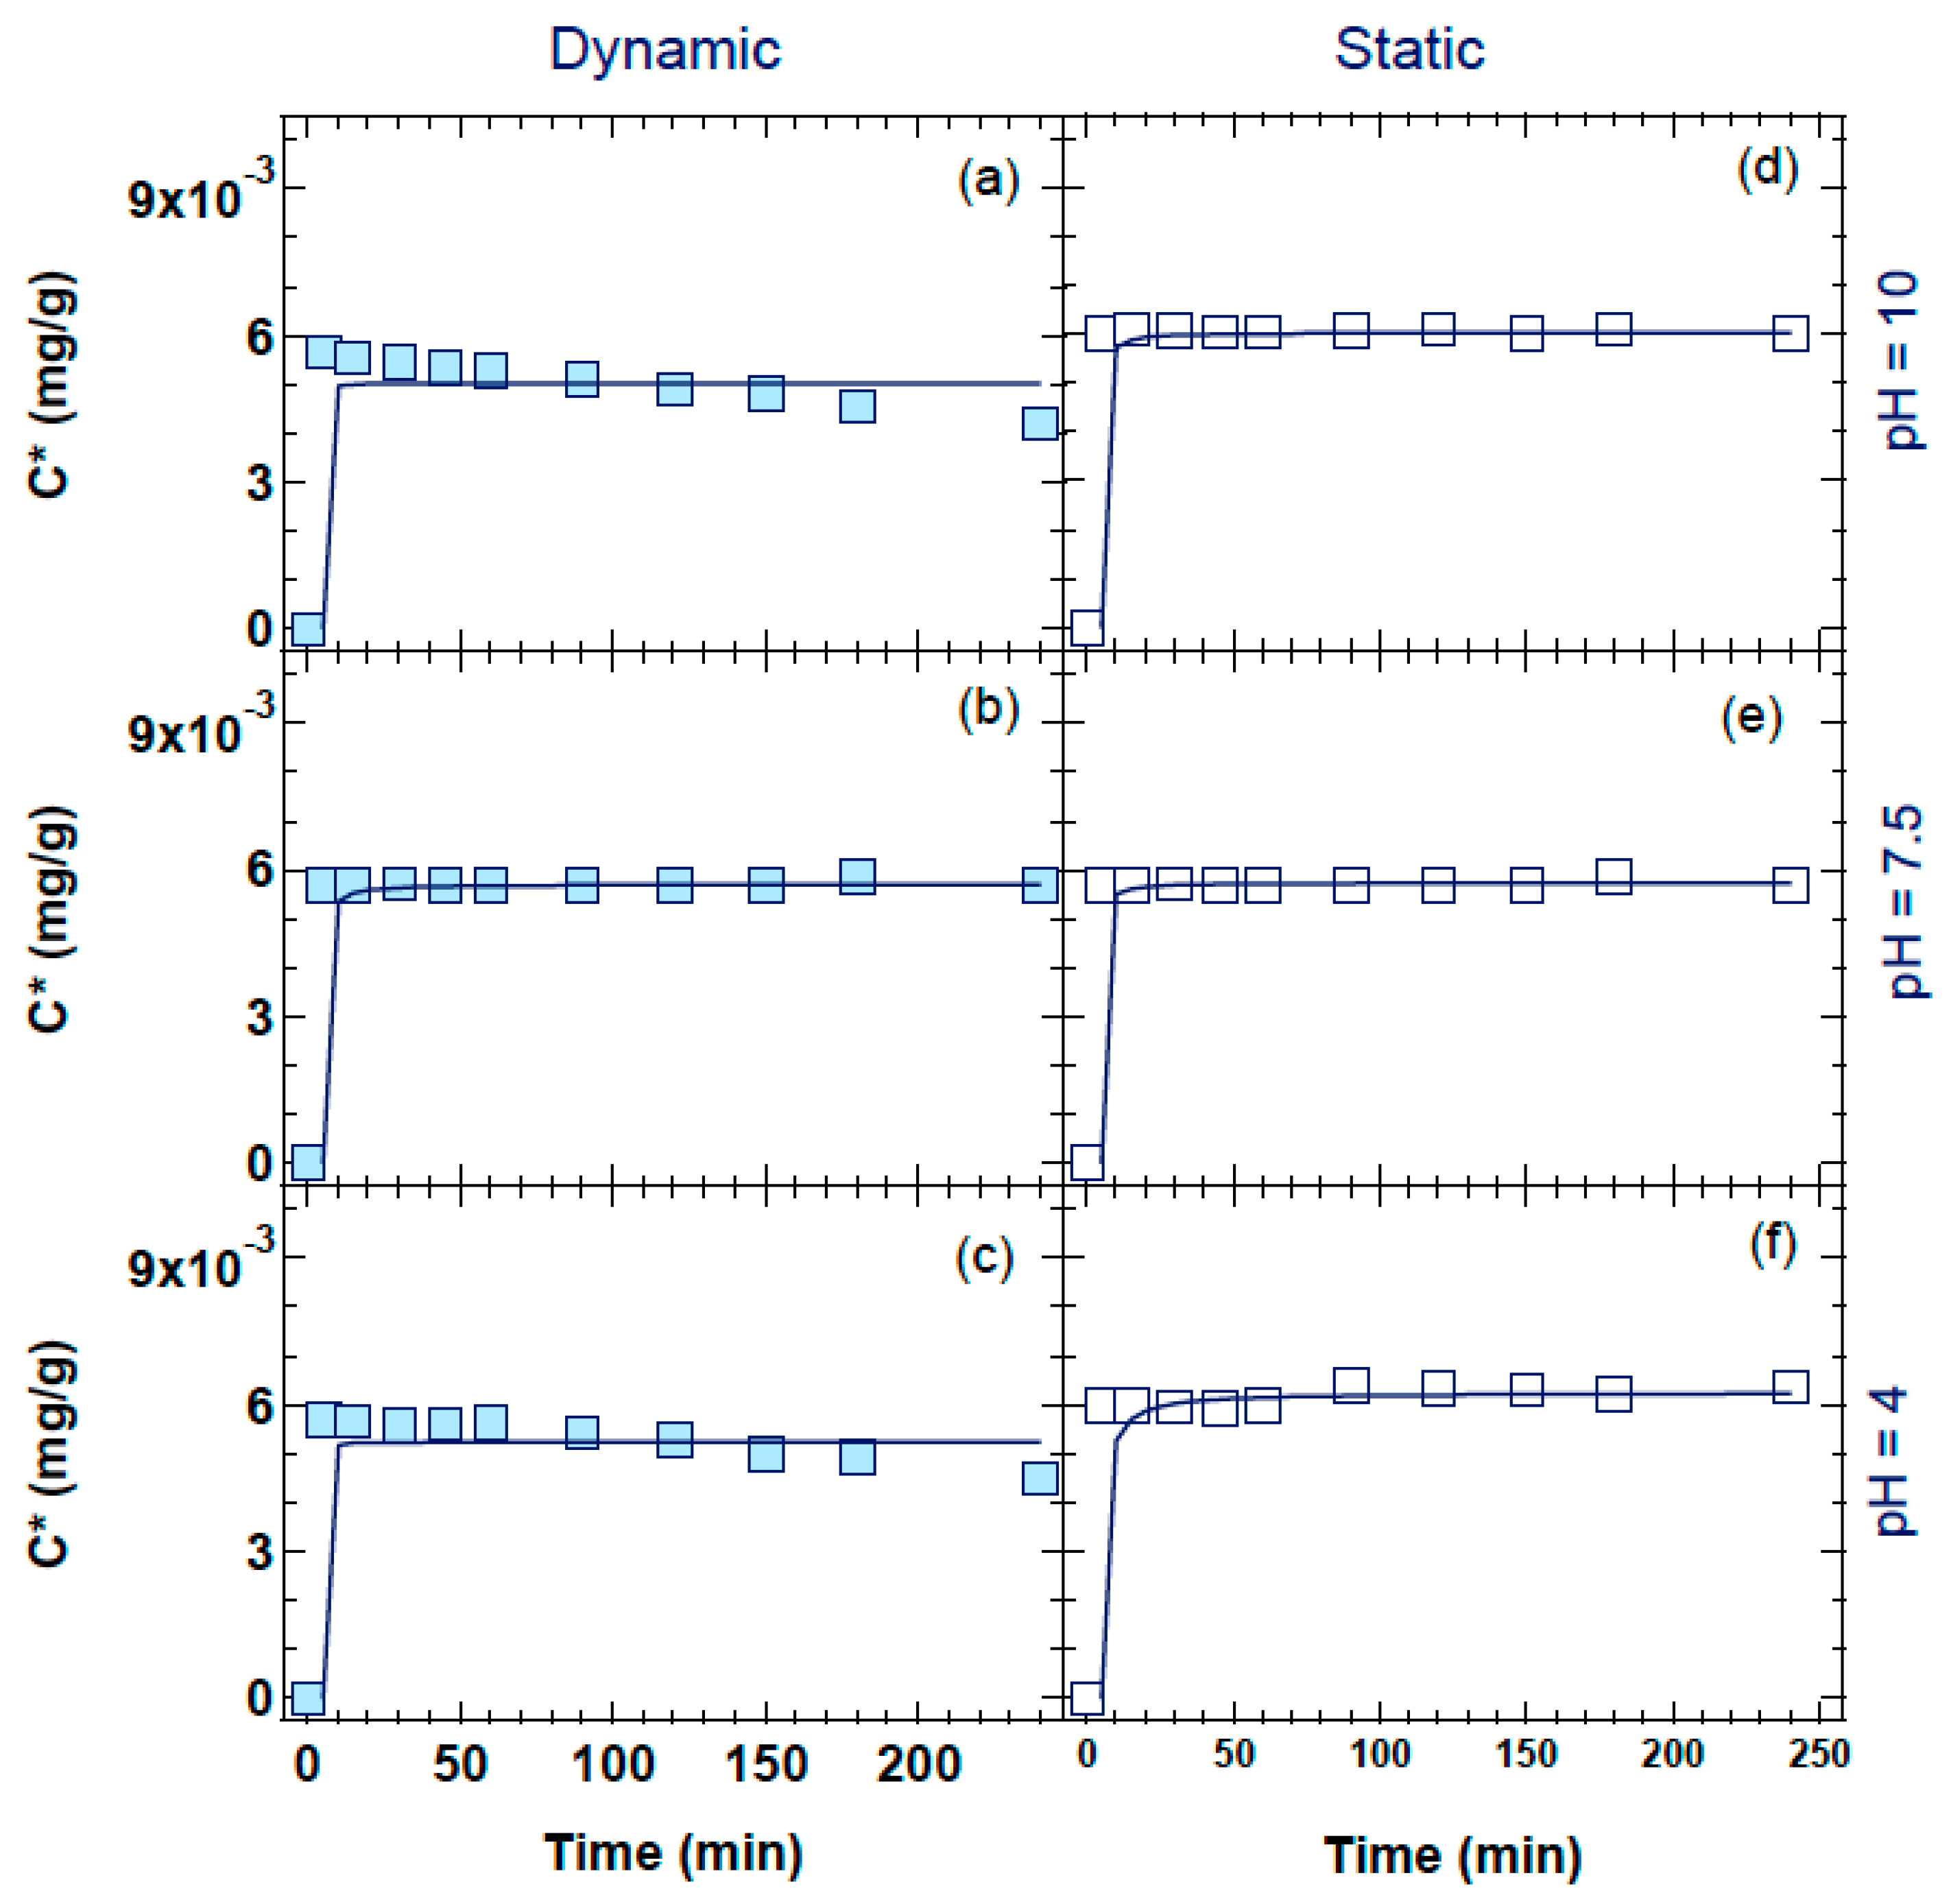
The kinetic experiments of FA sorption onto TiO2 nanoparticles in the presence of 14 g quartz sand at pH values of 4, 7.5, and 10, with FA initial concentration of 5 mg/L and TiO2 concentration of 100 mg/L, under dynamic and static conditions are shown in Figure 7. The experimental data clearly shown that changes in solution pH did not affect the FA sorption process. Clearly, that the sorbed FA concentration was very similar in all three pH cases (4, 7.5 and 10) considered in this study. A possible explanation for this is that all the pH values used in this study were higher than the isoelectric point pHIEP = 3.5 for the mixture of rutile and anatase [31], which is close to other values reported in the literature [70]. Note that pHIEP values for TiO2 nanoparticles may vary significantly depending on the manufacturer [71]. Given that the electrophoretic mobility of the rutile and anatase mixture did not alter direction over the range of the pH values used in this study, the nature of the repulsive forces between the TiO2 nanoparticles remained unchanged.
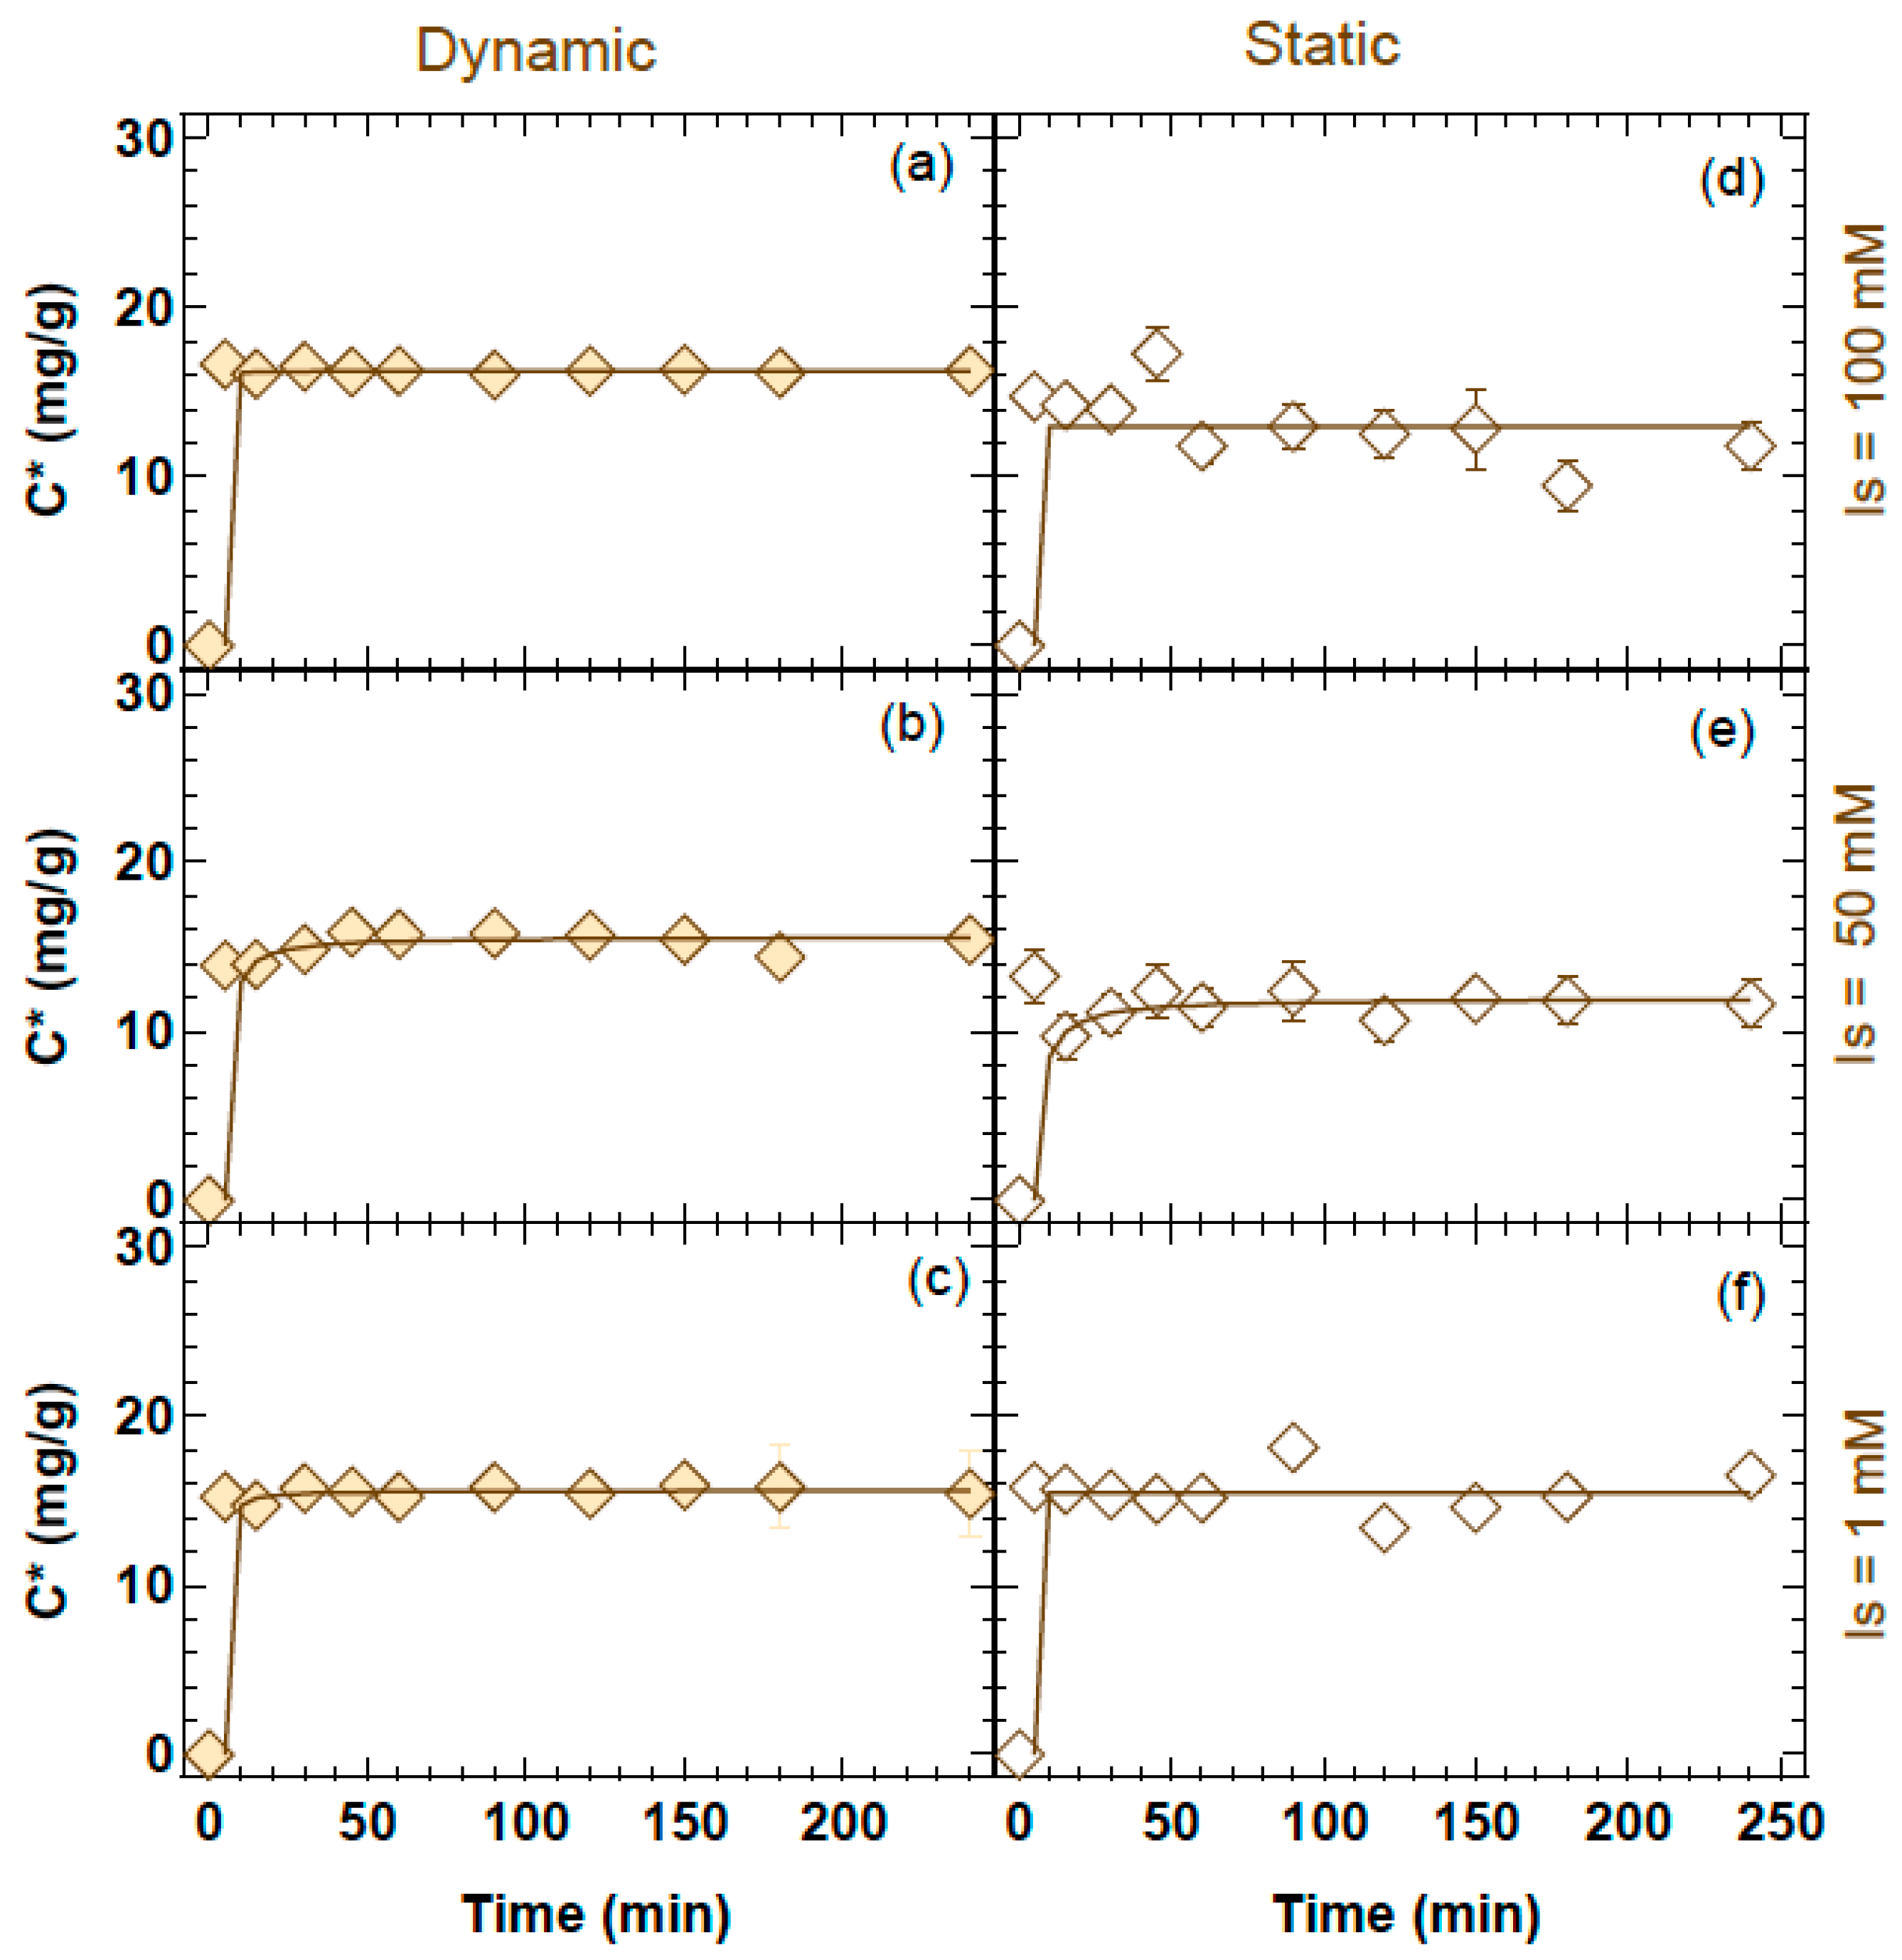
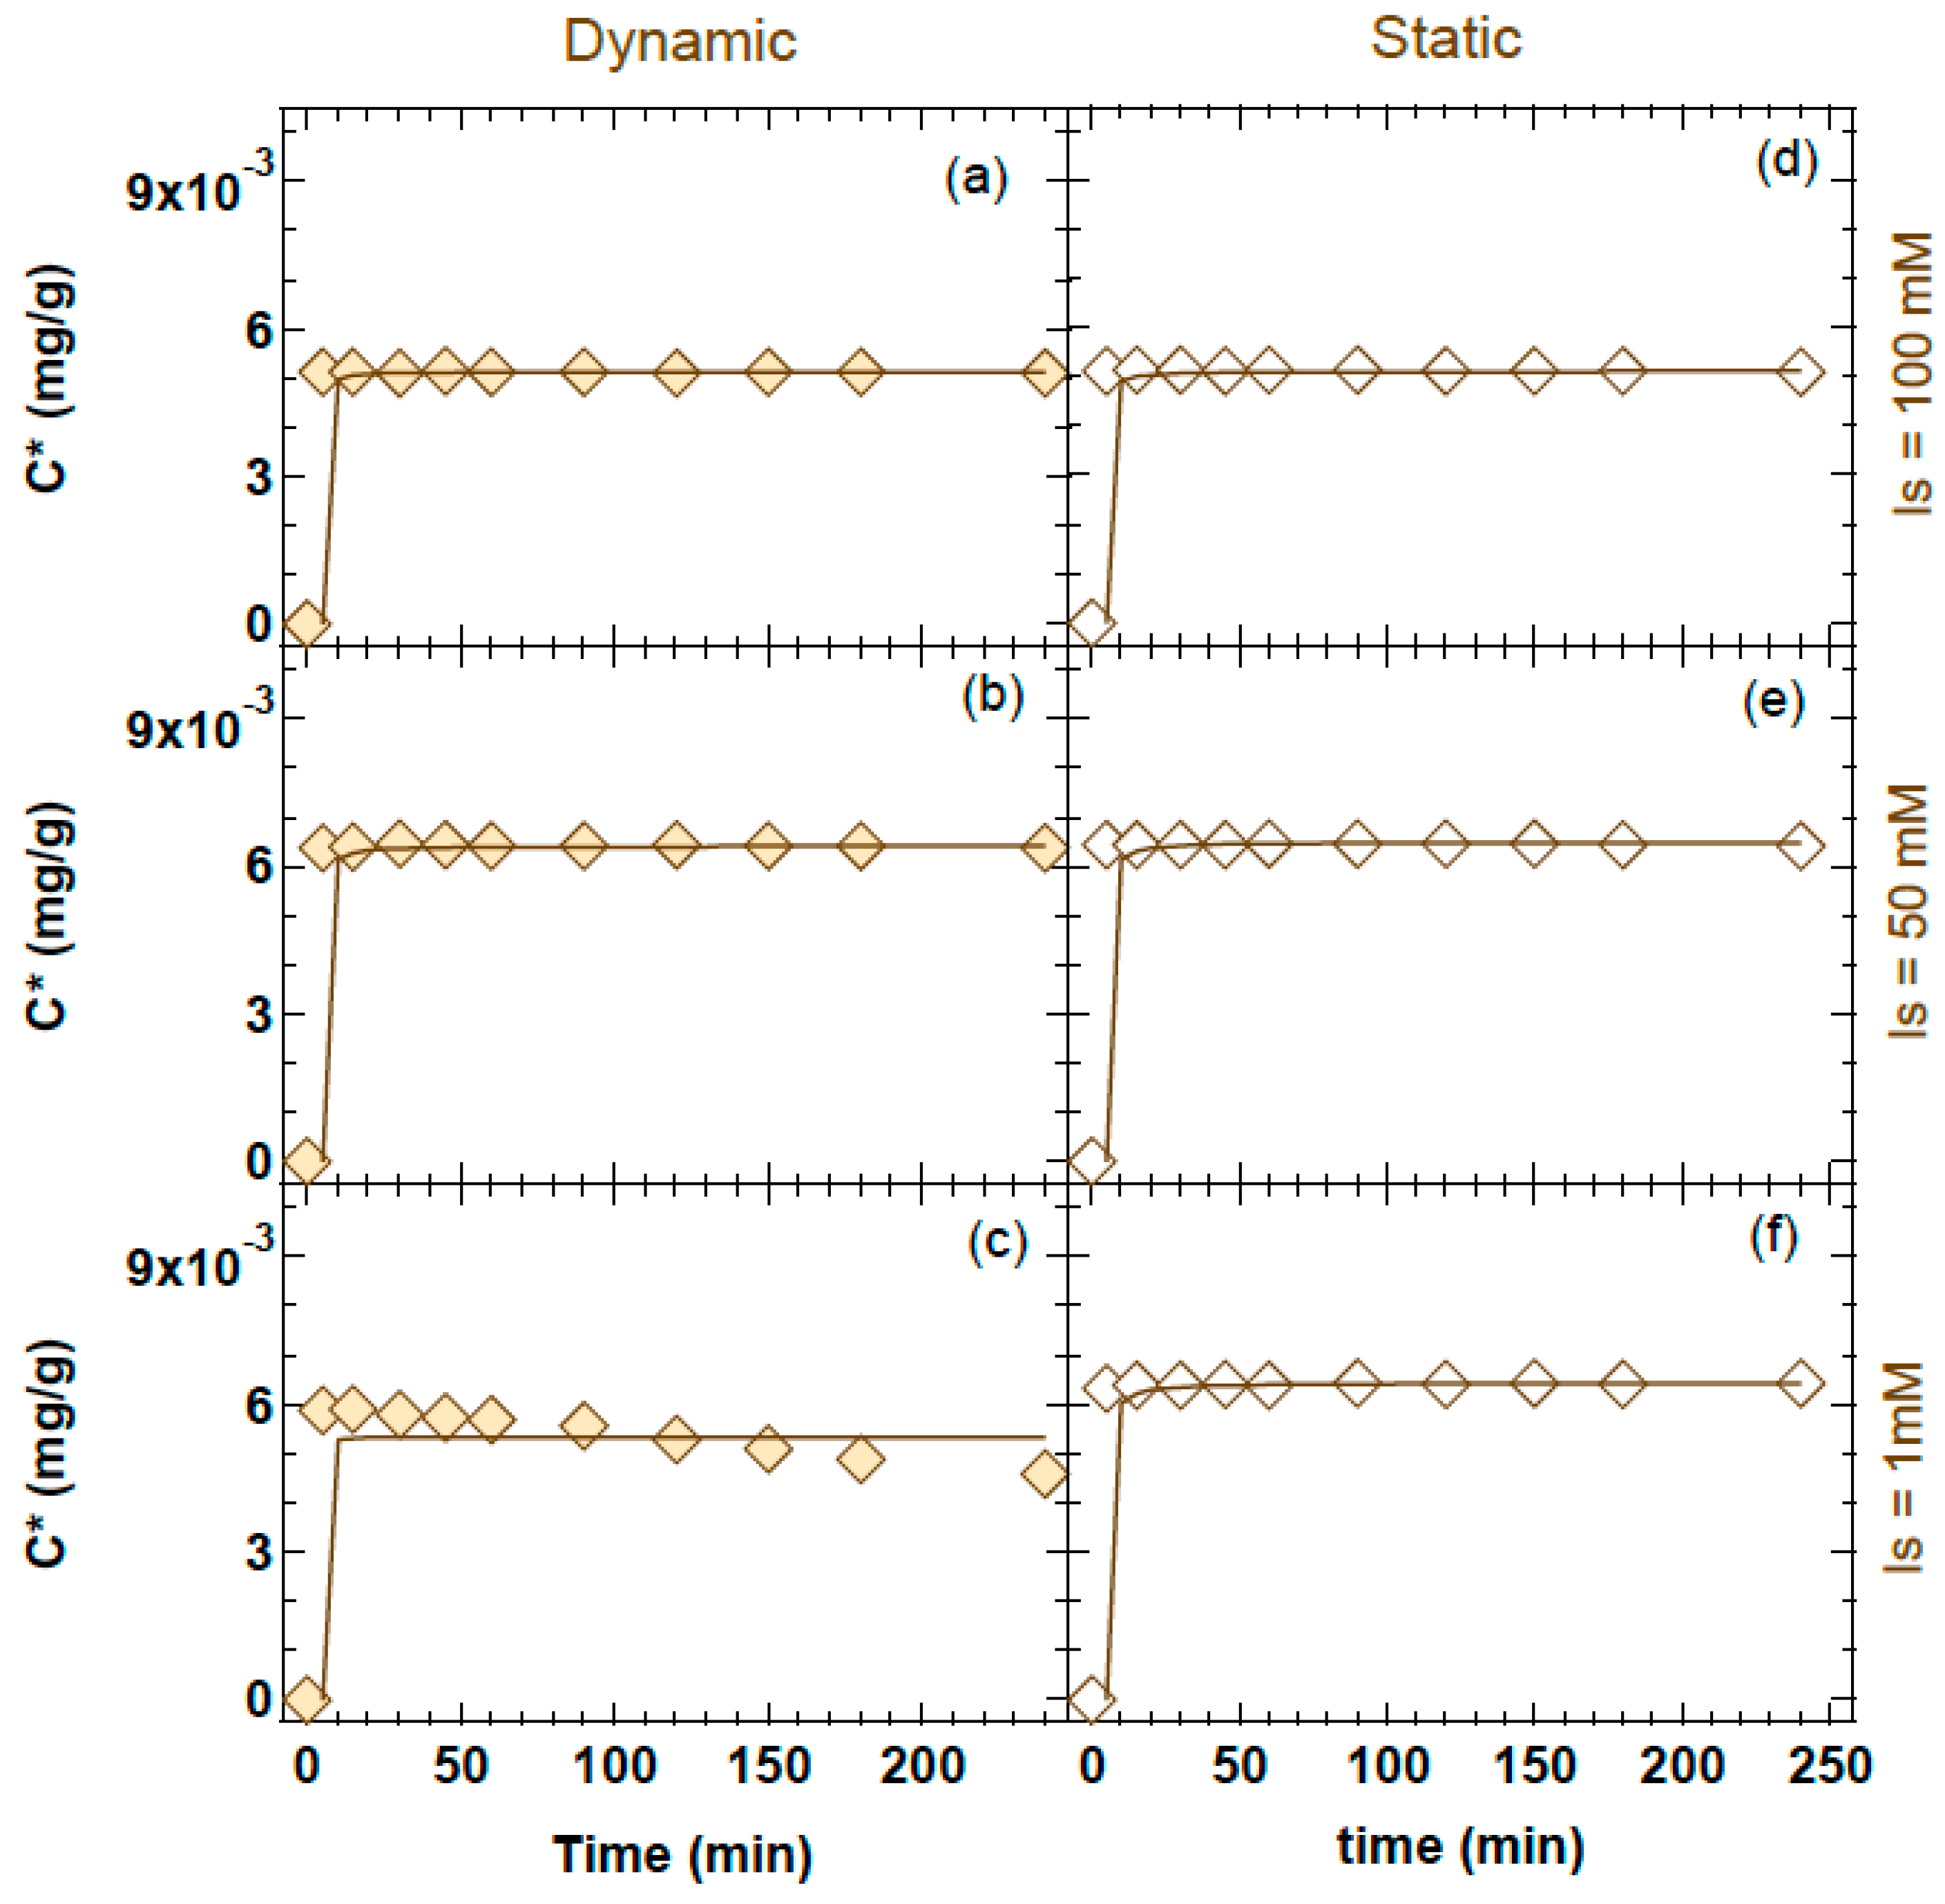
The kinetic experiments of FA sorption onto TiO2 nanoparticles in the presence of 14 g quartz sand at solution ionic strengths (Is) of 1, 50, and 100 mM, with FA initial concentration of 5 mg/L and TiO2 concentration of 100 mg/L, under dynamic and static conditions are shown in Figure 8. The experimental data shown that changes in the solution ionic strength did not affect significantly FA sorption. Only in the experiment for Is = 100 mM, the amount of FA sorbed onto TiO2 nanoparticles and quartz sand decreased slightly with increasing ionic strength. This was most likely due to the increased competition between positively charged FA species and cationic electrolytes for active sorption sites. This observation was consistent with other studies of organic compound uptake by soils [72]. Also, at higher Is values the aggregation of TiO2 nanoparticles was enhanced [73], which in turn led to a reduction of available sites for FA sorption.
The data collected from the dynamic experiments in the presence of quartz sand revealed that after the sorbed FA concentration reached a maximum value, in several cases, there was a small gradual decrease in C* (see Figure 6, Figure 7 and Figure 8). This reduction was attributed to desorption caused by agitation due to the rotation of the Pyrex glass screw cap tubes, or to possible TiO2 nanoparticle interactions with the quartz sand. It should be noted that TiO2 nanoparticles can also attach onto the quartz sand [33].
The data collected from each experiment were very well fitted with the pseudo-second order model (see Figure 3, Figure 4, Figure 5, Figure 6, Figure 7 and Figure 8), suggesting that chemical sorption (chemisorption) was involved in the process [56]. The corresponding fitted values of the reaction rate constant of the pseudo-second order model (kp2) and the FA concentration sorbed onto the solids at equilibrium () are listed in Table 1. Clearly, the fitted kp2 values for the experiments conducted in the presence of quartz sand were much higher than those in the absence of quartz sand. Additionally, kp2 values were consistently higher under dynamic than static conditions due to agitation. In general, FA sorption was faster in the presence, compared to the absence, of quartz sand. In addition, FA sorption was faster under dynamic than static conditions. Furthermore, the fitted values for the experiments conducted in the presence of quartz sand were much lower than those in the absence of quartz sand. Further, the fitted values for the experiments conducted in the absence of quartz sand were higher under dynamic than static conditions. This was an anticipated result because of the enhanced undisturbed mixing during dynamic conditions in the absence of quartz sand. In the presence of quartz sand, the fitted values were higher under static than dynamic conditions. This finding was attributed to possible interactions between TiO2 nanoparticles and quartz sand. Furthermore, the lower fitted values observed in the presence of quartz sand was an expected observation, because the mass of sorbents was increased considerably with the addition of quartz sand. Note that is given in units of (mg/g). However, the percentage of FA removal was consistently higher in the presence than the absence of quartz sand (see Figure 2).
5. Conclusions
The sorption of FA onto TiO2 nanoparticles in the absence and presence of quartz sand under static and dynamic conditions, at 25 °C was investigated. The experimental results from this work suggested that FA sorption was faster and more pronounced in the presence of quartz sand. Typical pH and ionic strength variations did not significantly affect the FA sorption process. The experimental data were satisfactorily fitted by the pseudo-second order model, indicating that the sorption mechanism was chemisorption. The experiments were conducted with clean quartz sand. Of course, the interaction of FA with quartz sand could be somewhat different if the quartz sand was not cleaned or if natural soil had been used. Assuming that FA could be relatively mobile in natural soil and sediments and could potentially contaminate the aquatic environment with numerous adverse effects on living organisms and to human health, its removal is essential. The present study suggested that combination of the sorbents TiO2 and quartz sand can effectively remove FA from aqueous solutions.
Author Contributions
A.S.S. worked on the experimental design, collected, and analyzed the data, and wrote the first draft of the paper. C.V.C. supervised the research and contributed to the writing–reviewing and editing of the manuscript. All authors have read and agreed to the published version of the manuscript.
Funding
This research has received funding from the Partnership for Research and Innovation in the Mediterranean Area (PRIMA), under grant agreement number: 1923-InTheMED.
Institutional Review Board Statement
Not applicable.
Informed Consent Statement
Not applicable.
Data Availability Statement
Data is contained within the article.
Acknowledgments
The authors are thankful to Sosa Fountouli and Rika Sarika for valuable laboratory assistance and Bill Katzourakis for expert help with the nonlinear least squares regression software ColloidFit.
Conflicts of Interest
The authors declare that there are no conflict of interest.
References
- Liyanage, C.P.; Yamada, K. Impact of population growth on the water quality of natural water bodies. Sustainability 2017, 9, 1405. [Google Scholar] [CrossRef] [Green Version]
- Schwarzenbach, R.P.; Escher, B.I.; Fenner, K.; Hofstetter, T.B.; Johnson, C.A.; Von Gunten, U.; Wehrli, B. The challenge of micropollutants in aquatic systems. Science 2006, 313, 1072–1077. [Google Scholar] [CrossRef] [PubMed]
- Oliveira, S.V.; Moraes, E.M.; Adorno, M.A.; Varesche, M.B.; Foresti, E.; Zaiat, M. Formaldehyde degradation in an anaerobic packed-bed bioreactor. Water Res. 2004, 38, 1685–1694. [Google Scholar] [CrossRef] [PubMed]
- Cogliano, V.J.; Grosse, Y.; Baan, R.A.; Straif, K.; Secretan, M.B.; El Ghissassi, F. Summary of IARC monographs on formaldehyde, 2-butoxyethanol, and 1-tert-butoxy-2-propanol. Environ. Health Perspect. 2005, 113, 1205–1208. [Google Scholar] [CrossRef] [Green Version]
- Moussavi, G.; Yazdanbakhsh, A.; Heidarizad, M. The removal of formaldehyde from concentrated synthetic wastewater using O3/MgO/H2O2 process integrated with the biological treatment. J. Hazard. Mater. 2009, 171, 907–913. [Google Scholar] [CrossRef]
- Priya, K.R.; Sandhya, S.; Swaminathan, K. Kinetic analysis of treatment of formaldehyde containing wastewater in UAFB reactor. Chem. Eng. J. 2009, 148, 212–216. [Google Scholar] [CrossRef]
- Paliulis, D. Removal of formaldehyde from synthetic wastewater using natural and modified zeolites. Pol. J. Environ. Stud. 2016, 25, 251–257. [Google Scholar] [CrossRef]
- Glaze, W.H.; Koga, M.; Cancilla, D. Ozonation byproducts. 2. Improvement of an aqueous-phase derivatization method for the detection of formaldehyde and other carbonyl compounds formed by the ozonation of drinking water. Environ. Sci. Technol. 1989, 23, 838–847. [Google Scholar] [CrossRef]
- Mursics, J.; Urbancl, D.; Goricanec, D. Process of formaldehyde and volatile organic compounds’ removal from waste gases. Appl. Sci. 2020, 10, 4702. [Google Scholar] [CrossRef]
- Becher, G.; Ovrum, N.M.; Christman, R.F. Novel chlorination by-products of aquatic humic substances. Sci. Total Environ. 1992, 117, 509–520. [Google Scholar] [CrossRef]
- Weinberg, H.S.; Glaze, W.H.; Krasner, S.W.; Sclimenti, M.J. Formation and removal of aldehydes in plants that use ozonation. Am. Water Work. Assoc. 1993, 85, 72–85. [Google Scholar] [CrossRef]
- Mitch, W.A.; Schreiber, I.M. Degradation of tertiary alkylamines during chlorination/chloramination: Implications for formation of aldehydes, nitriles, halonitroalkanes, and nitrosamines. Environ. Sci. Technol. 2008, 42, 4811–4817. [Google Scholar] [CrossRef] [PubMed]
- Kobayashi, Ν.; Sugimoto, Ν.; Kubota, R.; Nomoto, M.; Ikarashi, Y. Identification of the cause of formaldehyde water pollution and the future issues on the management of unregulated chemicals in drinking water. J. Jpn. Risk Anal. 2013, 23, 65–70. [Google Scholar]
- IPCS International Programme on Chemical Safety. Formaldehyde. In Environmental Health Criteria 89; World Health Organization: Geneva, Switzerland, 1989; p. 219. [Google Scholar]
- IARC International Agency for Research on Cancer. Wood dust and formaldehyde. In IARC Monographs on the Evaluation of Carcinogenic Risks to Humans; IARC: Lyon, France, 1995; Volume 62, pp. 217–375. [Google Scholar]
- Krasner, S.W.; McGuire, M.J.; Jacangelo, J.G.; Patania, N.L.; Regan, K.M.; Aieta, E.M. The occurrence of disinfection by-products in US drinking water. J. Am. Water Work. Assoc. 1989, 81, 41–53. [Google Scholar] [CrossRef]
- Tomkins, B.A.; Mcmahon, J.M.; Caldwell, W.M.; Wilson, D.L. Liquid chromatographic determination of total formaldehyde in drinking water. J. Assoc. Off. Anal. Chem. 1989, 72, 835–839. [Google Scholar] [CrossRef] [PubMed]
- Huck, P.M.; Anderson, W.B.; Rowley, S.M.; Daignault, S.A. Formation and removal of selected aldehydes in a biological drinking-water treatment process. J. Water Supply Res. Technol. Aqua 1990, 39, 321–333. [Google Scholar]
- Zoutberg, G.R.; de Been, P. The Biobed EGSB (expanded granular sludge bed) system covers shortcomings of the upflow anaerobic sludge blanket reactor in the chemical industry. Water Sci. Technol. 1997, 35, 183–188. [Google Scholar] [CrossRef]
- Kumar, A. Biodegradation kinetics of phenol and catechol using Pseudomonas putida MTCC 1194. Biochem. Eng. J. 2005, 22, 151–163. [Google Scholar] [CrossRef]
- Cvetkovic, Z.; Suhadolnik, Z.; Grilc, V. Biological treatment of wastewater from a phenol–formaldehyde resins production. Chem. Eng. J. 1998, 2, 262–273. [Google Scholar]
- Wang, M.; Wen, B.; Fan, B.; Zhang, H. Study on adsorption mechanism of silicate adsorbents with different morphologies and pore structures towards formaldehyde in water. Colloids Surf. A Physicochem. Eng. Asp. 2020, 599, 124887. [Google Scholar] [CrossRef]
- Fam, Y.; Imae, T. Catalytic oxidation of formaldehyde in water by calcium phosphate-based Pt composites. R. Soc. Chem. Adv. 2015, 5, 15944–15953. [Google Scholar] [CrossRef]
- Parmar, S.S.; Grosjean, D. Sorbent removal of air pollutants from museum display cases. Environ. Int. 1991, 17, 39–50. [Google Scholar] [CrossRef]
- Sekine, Y.; Nishimura, A. Removal of formaldehyde from indoor air by passive type air-cleaning materials. Atmos. Environ. 2001, 35, 2001–2007. [Google Scholar] [CrossRef]
- Georgopoulou, M.P.; Chrysikopoulos, C.V. Evaluation of carbon nanotubes and quartz sand for the removal of formaldehyde–(2,4-dinitrophenylhydrazine) from aqueous solutions. Ind. Eng. Chem. Res. 2018, 57, 17003–17012. [Google Scholar] [CrossRef]
- Fountouli, T.V.; Chrysikopoulos, C.V.; Tsanis, I.K. Effect of salinity on formaldehyde interaction with quartz sand and kaolinite colloid particles: Batch and column experiments. Environ. Earth Sci. 2019, 78, 152. [Google Scholar] [CrossRef]
- Mueller, N.; Nowack, B. Exposure modeling of engineered nanoparticles in the environment. Environ. Sci. Technol. 2008, 42, 4447–4453. [Google Scholar] [CrossRef] [PubMed]
- Jeevanandam, J.; Barhoum, A.; Chan, Y.S.; Dufresne, A.; Danquah, M.K. Review on nanoparticles and nanostructured materials: History, sources, toxicity and regulations. Beilstein J. Nanotechnol. 2018, 9, 1050–1074. [Google Scholar] [CrossRef] [Green Version]
- Batley, G.; Kirby, J.; McLaughlin, M. Fate and risks of nanomaterials in aquatic and terrestrial environments. Acc. Chem. Res. 2013, 46, 854–862. [Google Scholar] [CrossRef]
- Sygouni, V.; Chrysikopoulos, C.V. Characterization of TiO2 nanoparticle suspensions in aqueous solutions and TiO2 nanoparticle retention in water-saturated columns packed with glass beads. Chem. Eng. J. 2015, 262, 823–830. [Google Scholar] [CrossRef]
- Syngouna, V.I.; Chrysikopoulos, C.V. Inactivation of MS2 bacteriophage by titanium dioxide nanoparticles in the presence of quartz sand with and without ambient light. J. Colloid Interface Sci. 2017, 497, 117–125. [Google Scholar] [CrossRef]
- Syngouna, V.I.; Chrysikopoulos, C.V. Bacteriophage MS2 and titanium dioxide heteroaggregation: Effects of ambient light and the presence of quartz sand. Colloids Surf. B Biointerfaces 2019, 180, 281–288. [Google Scholar] [CrossRef] [PubMed]
- Molla, M.A.I.; Furukawa, M.; Tateishi, I.; Katsumata, H.; Kaneco, S. Optimization of alachlor photocatalytic degradation with nano-TiO2 in water under solar illumination: Reaction pathway and mineralization. Clean Technol. 2018, 1, 141–153. [Google Scholar] [CrossRef] [Green Version]
- Hadjiivanov, K.J.; Kissurski, D.G. Surface chemistry of titania (anatase) and titania supported catalysts. Chem. Soc. Rev. 1996, 25, 61–69. [Google Scholar] [CrossRef]
- Haider, A.J.; Jameel, Z.N.; Al-Hussaini, I.H.M. Review on: Titanium dioxide applications. Energy Procedia 2019, 157, 17–29. [Google Scholar] [CrossRef]
- Kiser, M.A.; Westerhoff, P.; Benn, T.; Wang, Y.; Perez-Rivera, J.; Hristovski, K. Titanium nanomaterial removal and release from wastewater treatment plants. Environ. Sci. Technol. 2009, 43, 6757–6763. [Google Scholar] [CrossRef]
- Carp, O.; Huisman, C.L.; Reller, A. Photoinduced reactivity of titanium dioxide. Prog. Solid State Chem. 2004, 32, 33–177. [Google Scholar] [CrossRef]
- Zainab, N.J. Synthesis of TiO2 Nanoparticles by Sol-Gel Method using Laser Ablation for Nano Paint Application. Ph.D. Thesis, University of Baghdad, Physics Department, Baghdad, Iraq, 2015. [Google Scholar]
- Robichaud, C.O.; Uyar, A.E.; Darby, M.R.; Zucker, L.G.; Wiesner, M.R. Estimates of upper bounds and trends in nano-TiO2 production as a basis for exposure assessment. Environ. Sci. Technol. 2009, 43, 4227–4233. [Google Scholar] [CrossRef] [Green Version]
- Abbas, M. Experimental investigation of titanium dioxide as an adsorbent for removal of Congo red from aqueous solution, equilibrium and kinetics modeling. J. Water Reuse Desalination 2020, 10, 251–266. [Google Scholar] [CrossRef]
- Yin, X.; Meng, X.; Zhang, Y.; Zhang, W.; Sun, H.; Lessl, J.T.; Wang, N. Removal of V (V) and Pb (II) by nanosized TiO2 and ZnO from aqueous solution. Ecotoxicol. Environ. Saf. 2018, 164, 510–519. [Google Scholar] [CrossRef]
- Awwad, A.; Amer, M. Al-aqarbeh, M. TiO2-kaolinite nanocomposite prepared from the Jordanian Kaolin clay: Adsorption and thermodynamics of Pb (II) and Cd (II) ions in aqueous solution. Chem. Int. 2020, 6, 168–178. [Google Scholar]
- Saleem, H.; Zaidi, S.J. Developments in the application of nanomaterials for water treatment and their impact on the environment. Nanomaterials 2020, 10, 1764. [Google Scholar] [CrossRef] [PubMed]
- Yuan, Q.; Wu, Z.; Jin, Y.; Xiong, F.; Huang, W. Surface chemistry of formaldehyde on rutile TiO2(110) surface: Photocatalysis vs thermal-catalysis. J. Phys. Chem. C 2014, 118, 20420–20428. [Google Scholar] [CrossRef]
- Zhu, K.; Xia, Y.; Tang, M.; Wang, Z.-T.; Jan, B.; Lyubinetsky, I.; Ge, Q.; Dohnálek, Z.; Park, K.T.; Zhang, Z. Tracking site-specific C–C coupling of formaldehyde molecules on rutile TiO2(110). J. Phys. Chem. C 2015, 119, 14267–14272. [Google Scholar] [CrossRef]
- Feng, H.; Liu, L.; Dong, S.; Cui, X.; Zhao, J.; Wang, B. Dynamic processes of formaldehyde at terminal Ti sites on the rutile TiO2(110) surface. J. Phys. Chem. C 2016, 120, 24287–24293. [Google Scholar] [CrossRef]
- Setvin, M.; Hulva, J.; Wang, H.; Simschitz, T.; Schmid, M.; Parkinson, G.S.; Di Valentin, C.; Selloni, A.; Diebold, U. Formaldehyde adsorption on the anatase TiO2(101) surface: Experimental and theoretical investigation. J. Phys. Chem. C 2017, 121, 8914–8922. [Google Scholar] [CrossRef]
- US EPA. Revision 1, Determination of Carbonyl Compounds by High Performance Liquid Chromatography (HPLC); Method 8315A; US EPA: Washington, DC, USA, 1996.
- Nash, T. The colorimetric estimation of formaldehyde by means of the Hantzsch reaction. Biochem. J. 1953, 55, 416–421. [Google Scholar] [CrossRef] [Green Version]
- Loveland, J.P.; Ryan, J.N.; Amy, G.L.; Harvey, R.W. The reversibility of virus attachment to mineral surfaces. Colloids Surf. A Phys. Eng. Asp. 1996, 107, 205–221. [Google Scholar] [CrossRef]
- Chrysikopoulos, C.V.; Aravantinou, A.F. Virus inactivation in the presence of quartz sand under static and dynamic batch conditions at different temperatures. J. Hazard. Mater. 2012, 233–234, 148–157. [Google Scholar] [CrossRef] [PubMed]
- Chrysikopoulos, C.V.; Syngouna, V.I.; Vasiliadou, I.A.; Katzourakis, V.E. Transport of Pseudomonas putida in a three-dimensional bench scale experimental aquifer. Transp. Porous Media 2012, 94, 617–642. [Google Scholar] [CrossRef]
- Chrysikopoulos, C.V.; Aravantinou, A.F. Virus attachment onto quartz sand: Role of grain size and temperature. J. Environ. Chem. Eng. 2014, 2, 796–801. [Google Scholar] [CrossRef]
- Ho, Y.-S.; McKay, G. Pseudo-second order model for sorption processes. Process Biochem. 1999, 34, 451–465. [Google Scholar] [CrossRef]
- Qiu, H.; Lv, L.; Pan, B.; Zhang, Q.; Zhang, W.; Zhang, Q. Critical review in adsorption kinetic models. J. Zhejiang Univ. Sci. A 2009, 10, 716–724. [Google Scholar] [CrossRef]
- Sotirelis, N.P.; Chrysikopoulos, C.V. Heteroaggregation of graphene oxide nanoparticles and kaolinite colloids. Sci. Total Environ. 2017, 579, 736–744. [Google Scholar] [CrossRef]
- Syngouna, V.I.; Giannadakis, G.I.; Chrysikopoulos, C.V. Interaction of graphene oxide nanoparticles with quartz sand and montmorillonite colloids. Environ. Technol. 2020, 41, 1127–1138. [Google Scholar] [CrossRef] [PubMed]
- Katzourakis, V.E.; Chrysikopoulos, C.V. Fitting the transport and attachment of dense biocolloids in one dimensional porous media: ColloidFit. Groundwater 2017, 55, 156. [Google Scholar] [CrossRef]
- Kieu, L.; Boyd, L.; Idriss, H. Modelling of the adsorption of formic acid and formaldehyde over rutile TiO2(110) and TiO2(011) clusters. J. Mol. Catal. A Chem. 2001, 176, 117–125. [Google Scholar] [CrossRef]
- Zhao, D.; Sheng, G.; Hu, J.; Chen, C.; Wang, X. The adsorption of Pb (II) on Mg2Al layered double hydroxide. Chem. Eng. J. 2011, 171, 167–174. [Google Scholar] [CrossRef]
- Yang, H.; Sun, X.; Liu, S.X.; Liu, J.L.; Ren, X.M. Low-cost and environmental-friendly kaolinite-intercalated hybrid material showing fast formaldehyde adsorbing behavior. Chem. Sel. 2016, 1, 2181–2187. [Google Scholar] [CrossRef]
- Lloyd, Μ.; Maurice, O.S.; Aoyi, O.; Leswifi, Τ.Υ. Sorption characteristics of mixed molecules of glutaraldehyde from water on mesoporous acid-amine modified low-cost activated carbon: Mechanism, isotherm, and kinetics. J. Chem. 2015, 2015, 757256. [Google Scholar] [CrossRef]
- Salman, M.; Athar, M.; Shafique, U.; Rehman, R.; Ameer, S.; Ali, M.Z.; Azeem, M. Removal of formaldehyde from aqueous solution by adsorption on kaolin and bentonite: A comparative study. Turk. J. Eng. Environ. Sci. 2012, 36, 263–270. [Google Scholar]
- Kulikauskaite, D.; Paliulis, D. Formaldehyde removal from wastewater applying natural zeolite. Environ. Prot. Eng. 2015, 7, 443–448. [Google Scholar]
- Esposito, A.; Pagnanelli, F.; Lodi, A.; Solisio, C.; Veglio, F. Biosorption of heavy metals by Sphaerotilus natans: An equilibrium study at different pH and biomass concentrations. Hydrometallurgy 2001, 60, 129–141. [Google Scholar] [CrossRef]
- Das, N.; Das, D. Recovery of rare earth metals through biosorption: An overview. Rare Earths 2013, 31, 933–943. [Google Scholar] [CrossRef]
- Xie, J.; Lin, Y.; Li, C.; Wu, D.; Kong, H. Removal and recovery of phosphate from water by activated aluminum oxide and lanthanum oxide. Powder Technol. 2015, 269, 351–357. [Google Scholar] [CrossRef]
- Fountouli, T.V.; Chrysikopoulos, C.V. Effect of clay colloid particles on formaldehyde transport in unsaturated porous media. Water 2020, 12, 3541. [Google Scholar] [CrossRef]
- Mandzy, N.; Grulke, E.; Druffel, T. Breakage of TiO2 agglomerates in electrostatically stabilized aqueous dispersion. Powder Technol. 2005, 160, 121–126. [Google Scholar] [CrossRef]
- Boncagni, N.T.; Otaegui, J.M.; Warner, E.; Curran, T.; Ren, J.; DeCortalezzi, M.M. Exchange of TiO2 nanoparticles between streams and streambeds. Environ. Sci. Technol. 2009, 43, 7699–7705. [Google Scholar] [CrossRef]
- Laak, T.L.; Gebbink, W.A.; Tolls, J. The effect of pH and ionic strength on the sorption of sulfachloropyridazine, tylosin, and oxytetracycline to soil. Environ. Toxicololy Chem. 2006, 24, 904–911. [Google Scholar] [CrossRef]
- Jiang, J.K.; Oberdorster, G.; Biswas, P. Characterization of size, surface charge, and agglomeration state of nanoparticle dispersions for toxicological studies. J. Nanoparticle Res. 2009, 11, 77–89. [Google Scholar] [CrossRef]
Figure 1.
Experimental setup, showing how the glass screw cap tubes were filled for the dynamic and static experiments and the subsequent FA detection analysis.
Figure 1.
Experimental setup, showing how the glass screw cap tubes were filled for the dynamic and static experiments and the subsequent FA detection analysis.

Figure 2.
Percentage of FA removal, PFA (%), at equilibrium onto TiO2 (triangles) and both TiO2 and quartz sand (pentagons), under static (open symbols) and dynamic (filled symbols) conditions, for three different values of initial FA concentration (3, 5, 8 mg/L), pH (4, 7.5, 10), and Is (1, 50, 100 mM).

Figure 3.
FA sorbed concentrations onto TiO2 nanoparticles as a function of time, under dynamic (a–c: filled circles) and static (d–f: open circles) conditions, for three different initial FA concentrations. The TiO2 concentration was 100 mg/L and the temperature 25 °C. The curves represent the fitted pseudo-second order model. Error bars not shown are smaller than the size of the symbol.

Figure 4.
FA sorbed concentrations onto TiO2 nanoparticles as a function of time, under dynamic (a–c: filled squares) and static (d–f: open squares) conditions, for three different pH values. The initial FA concentration was 5 mg/L, TiO2 concentration 100 mg/L and the temperature 25 °C. The curves represent the fitted pseudo-second order model.

Figure 5.
FA sorbed concentrations onto TiO2 nanoparticles as a function of time, under dynamic (a–c: filled diamonds) and static (d–f: open diamonds) conditions, for three different ionic strength (Is) values. The initial FA concentration was 5 mg/L, TiO2 concentration 100 mg/L and the temperature 25 °C. The curves represent the fitted pseudo-second order model. Error bars not shown are smaller than the size of the symbol.

Figure 6.
FA sorbed concentrations onto TiO2 nanoparticles and quartz sand as a function of time, under dynamic (a–c: filled circles) and static (d–f: open circles) conditions, for three different initial FA concentrations. The TiO2 concentration was 100 mg/L, the mass of quartz sand added in each Pyrex glass screw cap tube was 14 g, and the temperature 25 °C. The curves represent the fitted pseudo-second order model.

Figure 7.
FA sorbed concentrations onto TiO2 nanoparticles and quartz sand as a function of time, under dynamic (a–c: filled squares) and static (d–f: open squares) conditions, for three different pH values. The initial FA concentration was 5 mg/L, TiO2 concentration 100 mg/L, the mass of quartz sand added in each Pyrex glass screw cap tube was 14 g, and the temperature 25 °C. The curves represent the fitted pseudo-second order model.

Figure 8.
FA sorbed concentrations onto TiO2 nanoparticles and quartz sand as a function of time, under dynamic (a–c: filled diamonds) and static (d–f: open diamonds) conditions, for three different ionic strength (Is) values. The initial FA concentration was 5 mg/L, TiO2 concentration 100 mg/L, the mass of quartz sand added in Pyrex glass screw cap tube was 14 g, and the temperature 25 °C. The curves represent the fitted pseudo-second order model.


Table 1.
Fitted sorption parameter values.
| Experimental Conditions | kp2 (g/mg·d) | (mg/g) | |||||||
|---|---|---|---|---|---|---|---|---|---|
| No | CFA (mg/L) | CTiO2 (mg/L) | Quartz Sand (g/vial) | pH | Is (mM) | Static | Dynamic | Static | Dynamic |
| 1 | 3 | 100 | − | − | − | 0.073 | 0.076 | 8.37 | 9.18 |
| 2 | 5 | 100 | − | − | − | 0.012 | 0.030 | 12.16 | 16.15 |
| 3 | 8 | 100 | − | − | − | 0.031 | 0.056 | 22.76 | 26.79 |
| 4 | 5 | 100 | − | 4 | − | 0.154 | 0.155 | 13.63 | 13.77 |
| 5 | 5 | 100 | − | 7.5 | − | 0.075 | 0.091 | 17.54 | 16.35 |
| 6 | 5 | 100 | − | 10 | − | 0.029 | 0.059 | 12.27 | 11.66 |
| 7 | 5 | 100 | − | − | 1 | 0.032 | 0.070 | 15.37 | 15.64 |
| 8 | 5 | 100 | − | − | 50 | 0.041 | 0.063 | 12.00 | 15.63 |
| 9 | 5 | 100 | − | − | 100 | 13.74 | 54.66 | 13.22 | 16.26 |
| 10 | 3 | 100 | 14 | − | − | 313.4 | 8000.9 | 0.0037 | 0.0030 |
| 11 | 5 | 100 | 14 | − | − | 89.2 | 10,000.0 | 0.0048 | 0.0041 |
| 12 | 8 | 100 | 14 | − | − | 417.7 | 3275.2 | 0.0092 | 0.0068 |
| 13 | 5 | 100 | 14 | 4 | − | 168.0 | 3444.3 | 0.0063 | 0.0053 |
| 14 | 5 | 100 | 14 | 7.5 | − | 779.2 | 4011.9 | 0.0057 | 0.0057 |
| 15 | 5 | 100 | 14 | 10 | − | 630.1 | 10,000.0 | 0.0061 | 0.0050 |
| 16 | 5 | 100 | 14 | − | 1 | 443.0 | 3932.5 | 0.0065 | 0.0053 |
| 17 | 5 | 100 | 14 | − | 50 | 545.2 | 701.7 | 0.0064 | 0.0051 |
| 18 | 5 | 100 | 14 | − | 100 | 898.1 | 1327.9 | 0.0051 | 0.0051 |
Publisher’s Note: MDPI stays neutral with regard to jurisdictional claims in published maps and institutional affiliations. |
© 2021 by the authors. Licensee MDPI, Basel, Switzerland. This article is an open access article distributed under the terms and conditions of the Creative Commons Attribution (CC BY) license (https://creativecommons.org/licenses/by/4.0/).
Share and Cite
MDPI and ACS Style
Stefanarou, A.S.; Chrysikopoulos, C.V. Interaction of Titanium Dioxide with Formaldehyde in the Presence of Quartz Sand under Static and Dynamic Conditions. Water 2021, 13, 1420. https://doi.org/10.3390/w13101420
AMA Style
Stefanarou AS, Chrysikopoulos CV. Interaction of Titanium Dioxide with Formaldehyde in the Presence of Quartz Sand under Static and Dynamic Conditions. Water. 2021; 13(10):1420. https://doi.org/10.3390/w13101420
Chicago/Turabian StyleStefanarou, Anthi S., and Constantinos V. Chrysikopoulos. 2021. "Interaction of Titanium Dioxide with Formaldehyde in the Presence of Quartz Sand under Static and Dynamic Conditions" Water 13, no. 10: 1420. https://doi.org/10.3390/w13101420
Note that from the first issue of 2016, this journal uses article numbers instead of page numbers. See further details here.