Article

Application of a New Improved Weighting Method, ESO Method Combined with Fuzzy Synthetic Method, in Water Quality Evaluation of Chagan Lake

1
Key Laboratory of Groundwater Resources and Environment, Ministry of Education, No. 2519, Jiefang Road, Changchun 130021, China
2
National-Local Joint Engineering Laboratory of In-Situ Conversion, Drilling and Exploitation Technology for Oil Shale, No. 2519, Jiefang Road, Changchun 130021, China
3
College of New Energy and Environment, Jilin University, No. 2519, Jiefang Road, Changchun 130021, China
4
Jilin Provincial Key Laboratory of Water Resources and Environment, Jilin University, No. 2519, Jiefang Road, Changchun 130021, China
*
Authors to whom correspondence should be addressed.
Water 2021, 13(10), 1424; https://doi.org/10.3390/w13101424
Submission received: 28 March 2021 / Revised: 17 May 2021 / Accepted: 19 May 2021 / Published: 20 May 2021

Abstract

:
The existing weighting methods mainly comprise subjective and objective weighting and have a certain degree of subjectivity, with certain requirements for the professional ability of the users and unstable results. Therefore, an improved weighting method based on the entropy weight, over-standard multiple, and single-factor evaluation methods, referred to as the ESO method, is proposed. The advantages and advancements of the ESO method are demonstrated in this study by combining it with the fuzzy synthetic evaluation method to evaluate the water quality of Chagan Lake wetland from 2007 to 2016. The main conclusions of this study are as follows: 1. The ESO method has more comprehensive consideration factors, lower requirements for the professional ability of users, and more stable weighting results than the traditional weighting method. Therefore, it is highly suitable for beginners and frontline staff who are not professionally qualified and cannot accurately conduct subjective weighting. Meanwhile, owing to the amendment rule and emphasis on the local weight of the sample in the ESO method, it is applicable to time-series samples. 2. The ESO method better allocates the amendment weights to indicators with a higher degree of pollution; thus, the final comprehensive evaluation results are relatively conservative. However, in contrast to the single-factor evaluation, the conservatism of ESO method is the result of the comprehensive effect of all samples; thus, the conservative result of the ESO method is more reasonable. 3. The water quality of Chagan Lake in 2009 and 2015 was class IV, which did not meet the standard, while that in remaining the eight years was class III, which met the requirements of the national 13th Five-Year Plan. The results of this study can provide a new approach to weighting calculation methods and a basis for the protection and treatment of the ecological environment of the Chagan Lake wetland.

1. Introduction

As the premise of water resource planning and protection, water quality evaluation is particularly important in the era of rapid societal development and water resource shortages. Single-factor assessment and comprehensive evaluation methods are commonly used for water quality evaluation. The Chinese government uses the single-factor assessment method for water quality evaluation in its monitoring report; however, it only uses one of the most polluted indicators as the evaluation factor and ignores the impact of other evaluation indicators, resulting in conservative evaluation results and wasting large amounts of water resources that could have been used [1]. The comprehensive evaluation method gives a certain weight value to each indicator through a weighting method; thus, the final evaluation results comprehensively reflect the impact of each indicator, and the influence of indicators can be indicated by weight values, resulting in a good practicability and evaluation effect than single-factor assessment. Therefore, the selection of the weighting method is of great significance.
Commonly used weight assignment methods can be divided into subjective, objective, and combinatorial weighting methods. The most typical and commonly used subjective weighting method is the analytic hierarchy process (AHP) method [2,3]; however, it has high requirements for the professional ability of the users, causing the weight calculation result to be unstable, which should be verified through a consistency test. These shortcomings are all due to the method’s subjectivity [4]. However, objective weighting methods, such as the entropy weight method (EWM) [5,6,7,8] and over-standard multiple (OSM) method [9], avoid this problem due to their specific calculation rules. As a commonly used objective weighting method, EWM has stable weight calculation results, and its weight value can reflect the amount of useful information represented by the data of each indicator; however, it cannot reflect the degree of pollution of each indicator [10,11]. Additionally, the EWM is also highly suitable for multi-sample evaluation, which can avoid repeated calculations and conserve workload. In 2006, Zou et al. used the EWM and a fuzzy evaluation method to calculate the water quality in the Three Gorges Reservoir area, and their results showed that the method greatly predigested the fuzzy synthetic evaluation process [12]. However, the method cannot provide the weight value of each indicator to a single sample; rather, it can only provide the comprehensive weight of each indicator to multiple samples. The weight calculation result of the OSM method can reflect the pollution degree of each indicator, calculate the single weight value of each indicator for each sample, and fully represent the respective data characteristics of each sample. However, separately calculating the weights of each indicator within each sample may cause notable differences in the weights of each indicator in different samples, which cannot accurately reflect the overall characteristics of the data [13]. According to the above analysis results, both subjective and objective weighting methods have some shortcomings. Researchers have made many improvements to resolve these issues. In 2012, Yang considered the dual effects of toxicology and excessive concentration to improve the traditional entropy method [14]. In 2018, Yang improved the traditional EWM based on the relative entropy theory, allowing a more comprehensive understanding of the response indicators’ dipartite degrees and pollution conditions [15]. In 2019, the projection pursuit classification (PP) was adopted by Wang to calculate the objective weight, reduce human factors, and balance the subjective uncertainty and randomness of the AHP [16]. However, the combinatorial weighting method is the most commonly used improved method, which combines various weighting methods for calculation. This combinatorial weighting method, which is constructed from various weighting methods, is more comprehensive and compensates for the shortcomings of each method as much as possible. To effectively utilize the advantages of the combinatorial weighting method, researchers have attempted to develop combinatorial methods and forms. For example, in 2014, Jun et al. evaluated the water quality at monitoring sections in four dry seasons based on the application of the AHP and entropy weight methods and used fuzzy comprehensive evaluation to obtain the quadratic combination weight of each index method. The results showed that this method avoided the subjective differences observed in the expert score method, meeting the target weight and the effective degree of credibility [17]. In 2016, considering the disadvantages of the subjective and objective weighted methods, a combined weighted index method was proposed by Yan et al., called the geometric mean weighted method, to assign weights to drinking water indices in order to make the weight distribution more scientific, reasonable, and robust [18]. In 2018, Hu et al. combined AHP and entropy methods and used the dynamic adjustment of the S-type function to increase the influence of standard exceeded pollutants, which resolved the issues of looseness and strictness of the average pollution index and single-factor evaluation methods, respectively [1]. In 2020, Wu et al. used the Shannon entropy theory, a fuzzy comprehensive method, and the AHP to provide reasonable weights for ECC evaluation modeling by combining subjective and objective weights [19]. Most existing combination weighting methods use a combination of subjective (AHP) and objective (EWM) weighting methods. Although this method has the advantages of both subjective and objective weighting methods, the evaluation results are still unstable due to the subjectivity of the subjective weighting method adopted. To avoid this problem, an amendment rule is introduced to replace the function of the subjective weighting method in this study. Amendment rules are expressed as formulas and affect the objective evaluation results based on the amendment data used, which were the single-factor evaluation results that reflect the pollution degree of each indicator in each sample in this study; thus, the influence of this method on the weight value can be determined by the pollution degree of each indicator. The higher the pollution degree of the indicator, the greater the magnifying effect of the amendment rule on its objective weight. If the users have their own views on the influencing factors of the combined weights, the influencing factors of the objective weights can be changed by altering the amendment data. The “amendment rule” affects the result of the combinatorial weighting method from “artificially given” to “formula calculation” in the subjective weighting method, greatly reducing the subjectivity. Additionally, for time-series samples, if the pollution degree is selected as the factor affecting the combination weight, the weight value should not be constant but change with changes in the pollution degree of the sample. Therefore, the OSM method is introduced to calculate the local weight of each indicator in each sample in this study. The comprehensive weight obtained by EWM and the amendment rule, and the local weight of each sample obtained by the OSM method are weighted, and global and local weight values (hereinafter referred to as the ESO weight) are obtained, which can reflect the degree by which the standard is exceeded and dispersion of the sample. The weight value obtained by this method (hereinafter referred to as the ESO method) is highly comprehensive and robust; thus, it is high-quality. The main objectives of this study were as follows: 1. To introduce the improved weight assignment method, i.e., the ESO method, and combine it with the fuzzy synthetic evaluation method (FSEM) to evaluate the water quality of Chagan Lake and determine whether it meets the water quality standards of the 13th Five-Year Plan; 2. To compare the ESO method to traditional weighting methods, such as the EWM, OSM, and single-factor evaluation method, thereby demonstrating its advantages and progressiveness.
Chagan Lake, the largest natural lake in Jilin Province, plays an important role in the ecological environment of the area and was approved as a nature reserve by the State Council in 2007. However, the retreat of farmland threatens the water quality of Chagan Lake. To elucidate whether Chagan Lake meets the class III provincial water quality target of the “13th Five-Year Plan”, ten years of water quality monitoring data were collected from the center of Chagan Lake between 2007 and 2016, and the combination weighting method proposed in this study was used to evaluate the water quality of Chagan Lake.

2. Materials and Methods
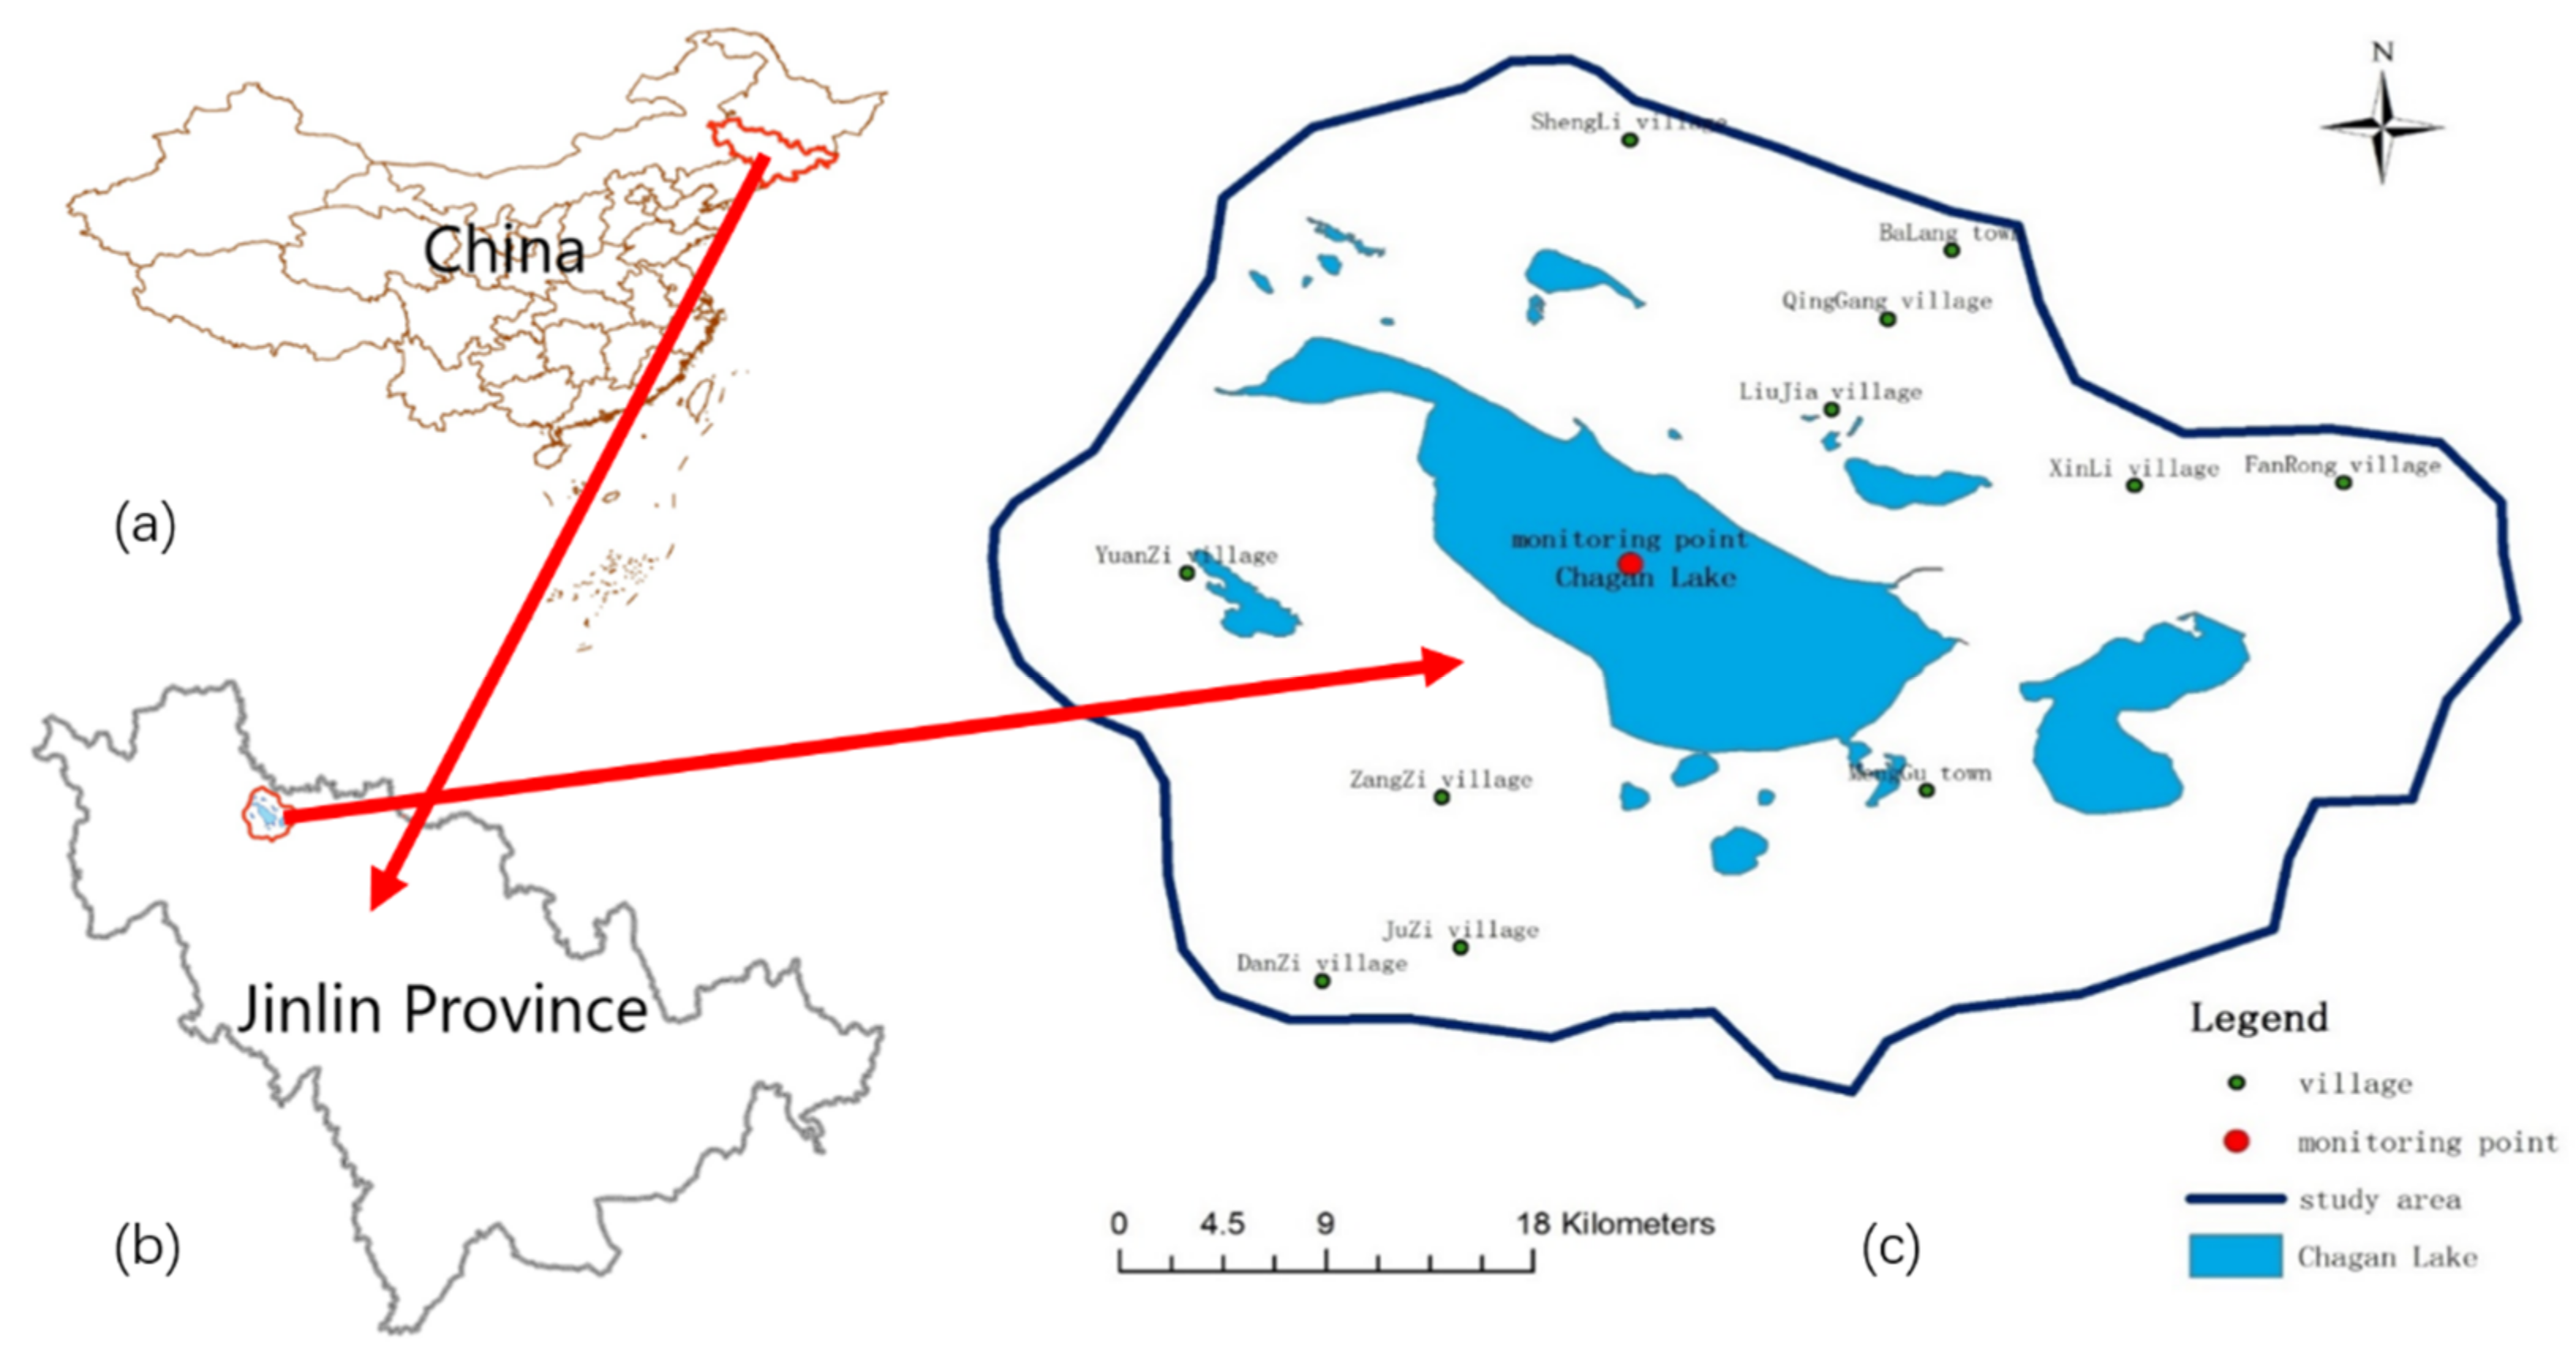
2.1. Study Area

Chagan Lake is located in the western part of Jilin Province, which is the drainage area for the commodity grain production base. Drainage from the surrounding irrigation fields is the major water source of the lake, accounting for 63.4% of all water sources [20]. According to the Special Plan for Ecological and Environmental Protection of the Chagan Lake Basin, the area of irrigated high-standard farmland in Jilin Province has continued to grow since 2006, and the intensity of water supply and drainage in the irrigation area has been continuously increasing. The drainage of farmland irrigation from the Qianguo irrigation and deep waterlogging areas and the surface runoff formed in the surrounding agricultural source, carrying large amounts of residual chemical fertilizers, pesticides, and organic matter, enters Chagan Lake through the Xinmiao bubble, deep waterlogging area, and Daan irrigation area. The BaiCheng Branch of the Jilin Water Environment Center regularly monitored the water quality of Chagan Lake from 2007 to 2016 to evaluate the lake’s pollution level, and the monitoring indices mainly included the pH and dissolved oxygen (DO), permanganate index (CODMn), biochemical oxygen demand (BOD5), ammo-nia nitrogen (NH3-N), chemical oxygen demand (CODCr), and the total phosphorus (TP), total nitrogen (TN), and fluoride (F) contents. The location of Chagan lake is as shown in Figure 1.
According to the regular monitoring water quality data of Chagan Lake obtained by the BaiCheng Branch of Jilin Water Environment Center, the DO, F, CODCr, CODMn, BOD5, TP, and TN contents are the main indicators affecting the aquatic environment of the lake. After selecting the evaluation indicators, it was necessary to select their standard values for all levels. As Chagan Lake is located in China, the Environmental Quality Standard of Surface Water (GB3838-2002) issued by the Ministry of Ecology and Environment of the People’s Republic of China in 2002 was selected as the evaluation criterion.

2.2. Method and Improvement

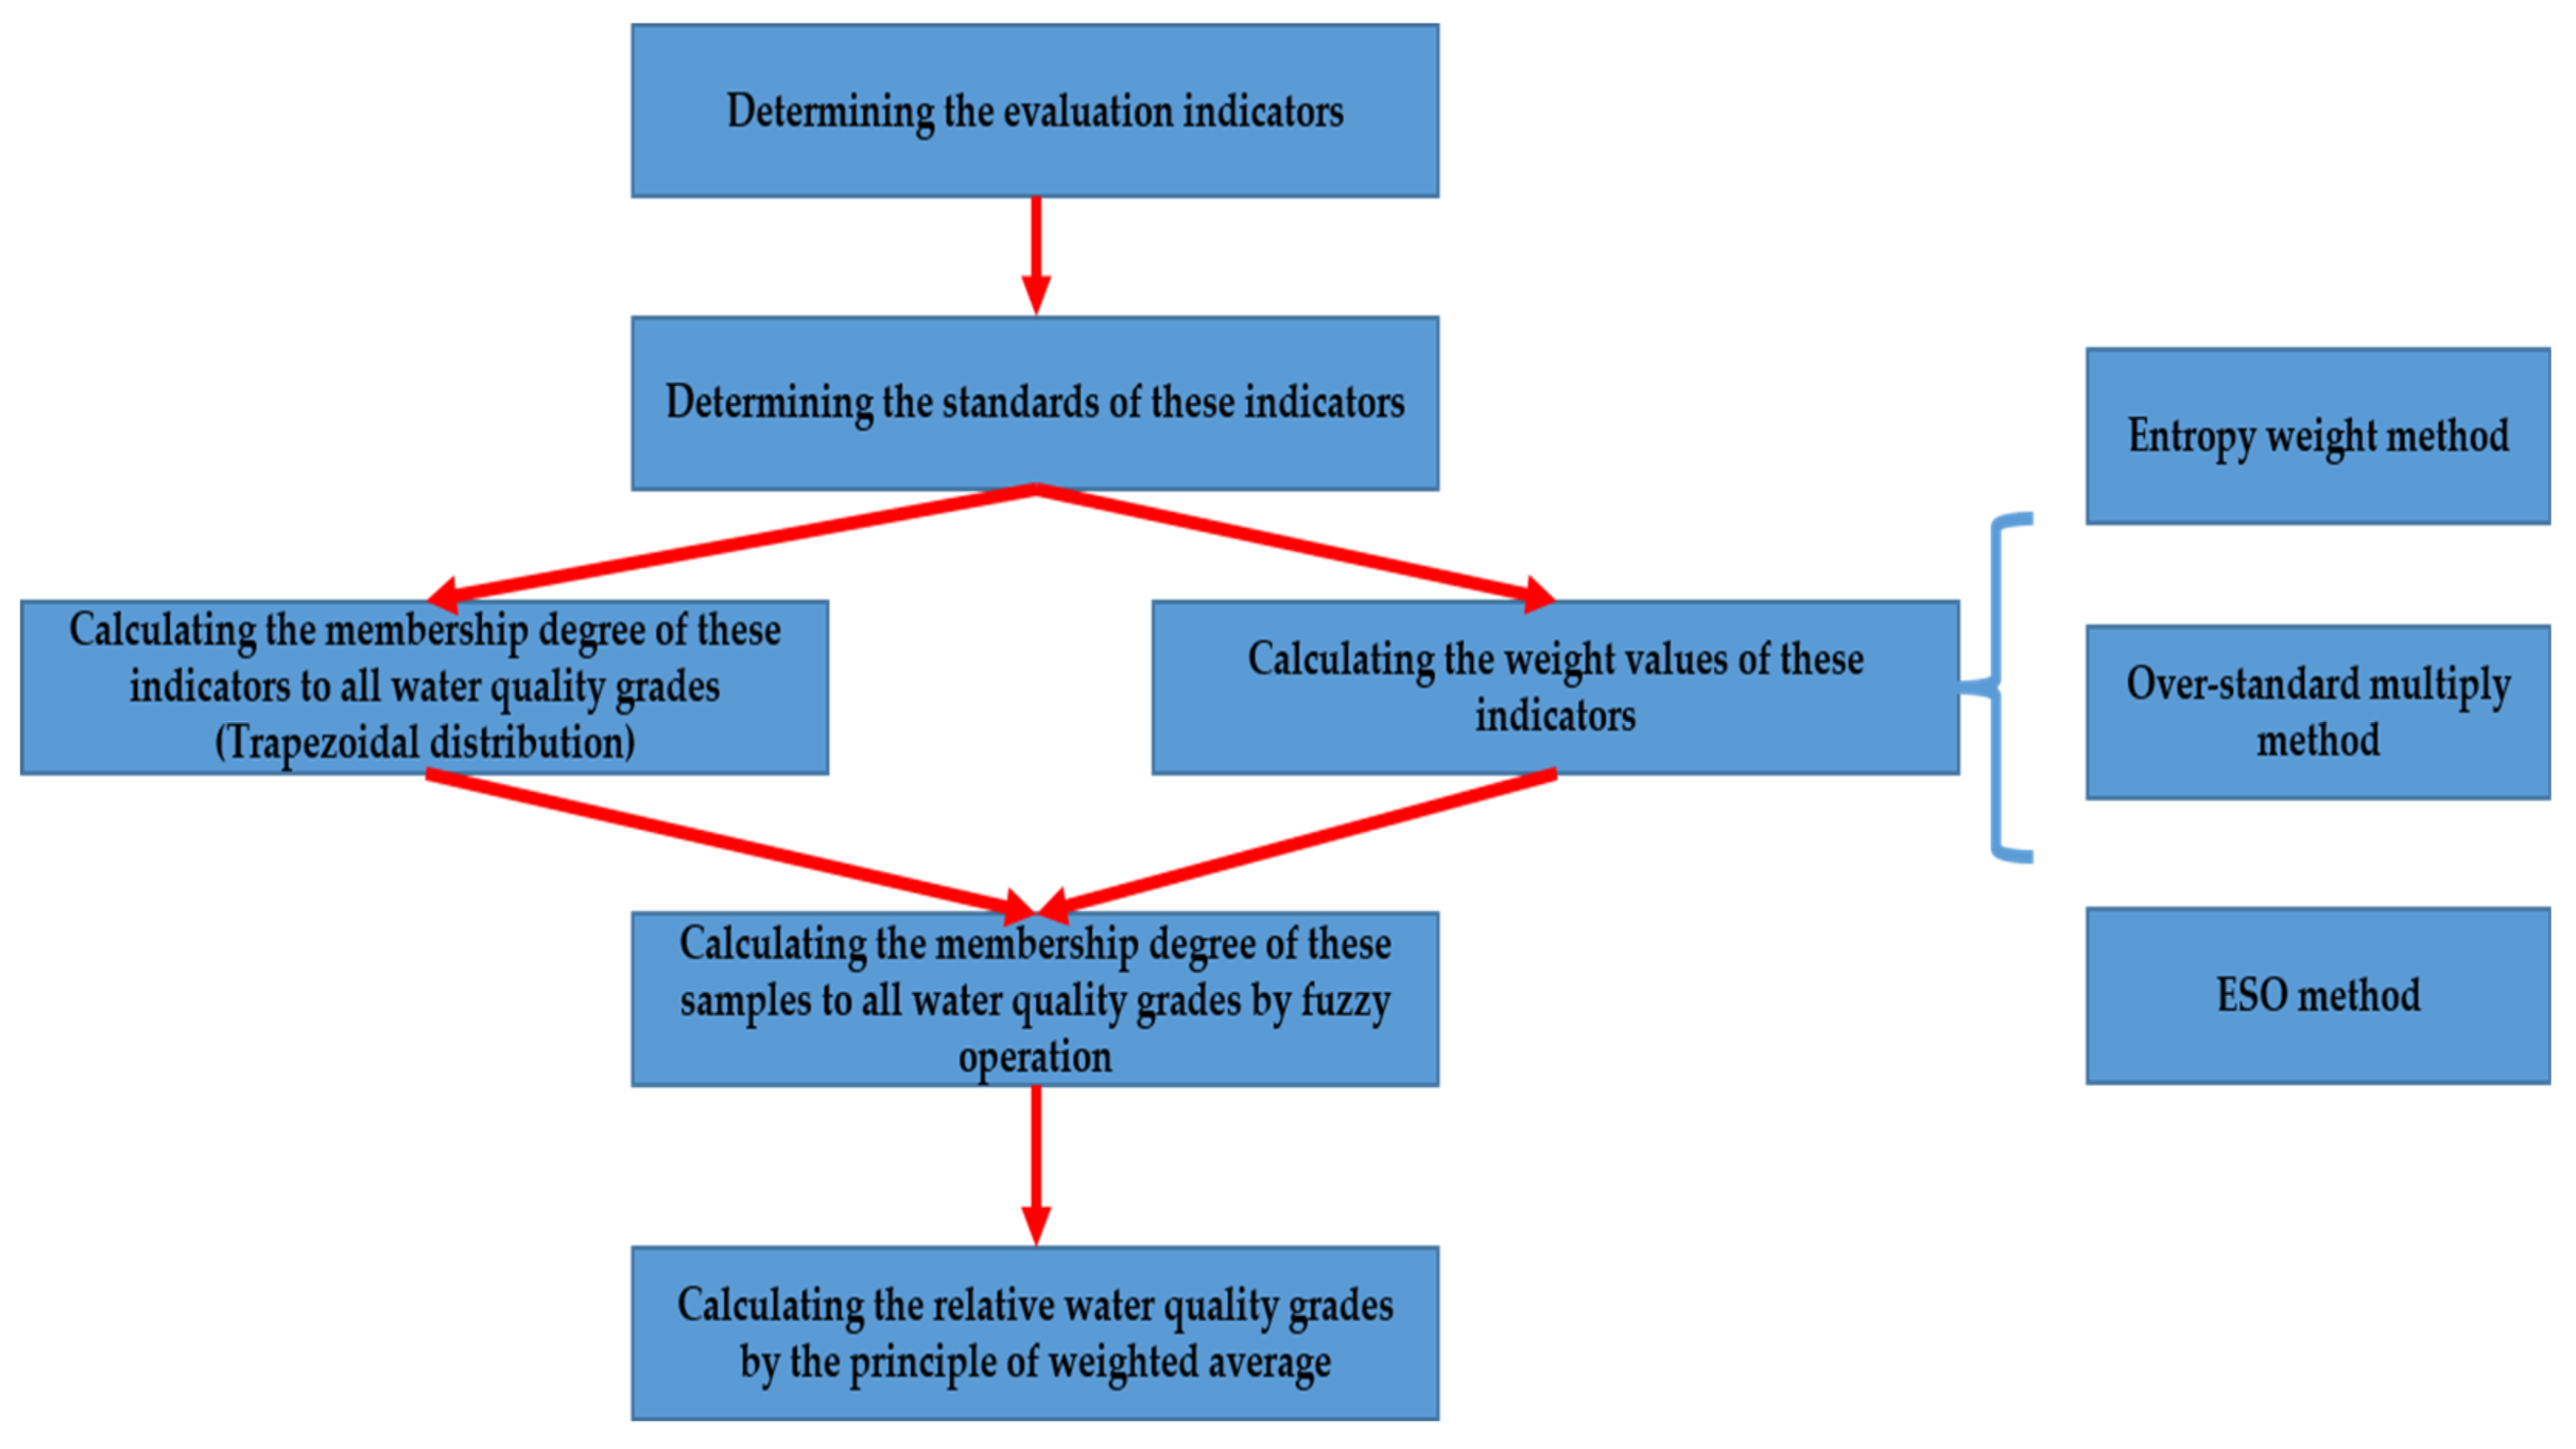
2.2.1. Fuzzy Synthetic Evaluation Method

The fuzzy comprehensive evaluation method conducts classification based on membership grade. The FSEM makes conducts comprehensive evaluation by quantifying the factors whose borderlines are not easily quantified based on fuzzy mathematics and the composition of fuzzy relationships. Specifically, a membership grade matrix was established by building constructing a membership grade collection that indicates the relationship of each level of factor to each standard. The fuzzy product can then be obtained by multiplying the weight sets of the factors by the membership grade matrix, thereby generating a comprehensive evaluation collection that indicates the membership grade of the evaluated water quality to the standard water quality of each grade and reflects the fuzziness of the comprehensive water grades [21]. The steps and technology roadmap of the FSEM are as shown in Figure 2.
  • Determination of the evaluation indicator, A = {DO, F, CODCR, CODEMN, TP, TN}
  • Determination of the standard value of each grade of the evaluation indicator, V = {v1, v2, , vm}.
  • Determination of the distribution function and calculation of the membership degree to construct the fuzzy matrix R [22].
As the calculation method is simple, its meaning is clear and it is easy to understand; thus, a trapezoidal distribution was adopted in this study. The calculation formula is as follows:
r i j x = 0 v j + 1 x v j + 1 v j 1     x > v j + 1 v j x v j + 1           x < v j i = 1 ~ n j = 1 ~ m 1
R = r i j = r 11 r 12 r 1 m r 21 r 22 r 2 m r n 1 r n 2 r n m
where vj and vj+1 are the standard values of indicator i, x is the monitoring value of indicator i, and rij represents the membership degree of a certain evaluation indicator Ai in a sample to the water quality vj.
4.
Calculation of the weight vector of all indicators, W = {w1, w2, …, wn}.
5.
In the fuzzy operation, matrix multiplication is used to calculate the weight W and membership R matrices, and the fuzzy synthetic operation result B is obtained.
B = W × R = w 1 , w 2 , , w n r 11 r 12 r 1 m r 21 r 22 r 2 m r n 1 r n 2 r n m = b 1 , b 2 , , b m
6.
Comprehensive evaluation. The results of the fuzzy operation are calculated and evaluated according to the principle of weighted average comprehensive evaluation in this study, which regards the water quality grade as a continuous relative position, and values {1, 2, 3, 4, 5} represent water quality grades {I, II, III, IV, V}, and these values are the Z-rank of each water quality grade. The relative position BT, which expresses the grade of water quality by rational numbers rather than integers, of the water quality grade of the indicator can then be obtained by weighting the Z-rank of each water quality grade for each indicator [23]. Additionally, compared to the maximum membership principle, this principle can preserve as much information in the assessment coefficients as possible [24].
B T = j = 1 5 b j β × j j = 1 5 b j β
where BT is relative water quality grade for a sample, bj is the weighted membership degree of the sample to the j-grade water quality, and β is the weighted coefficient with a value of 2.
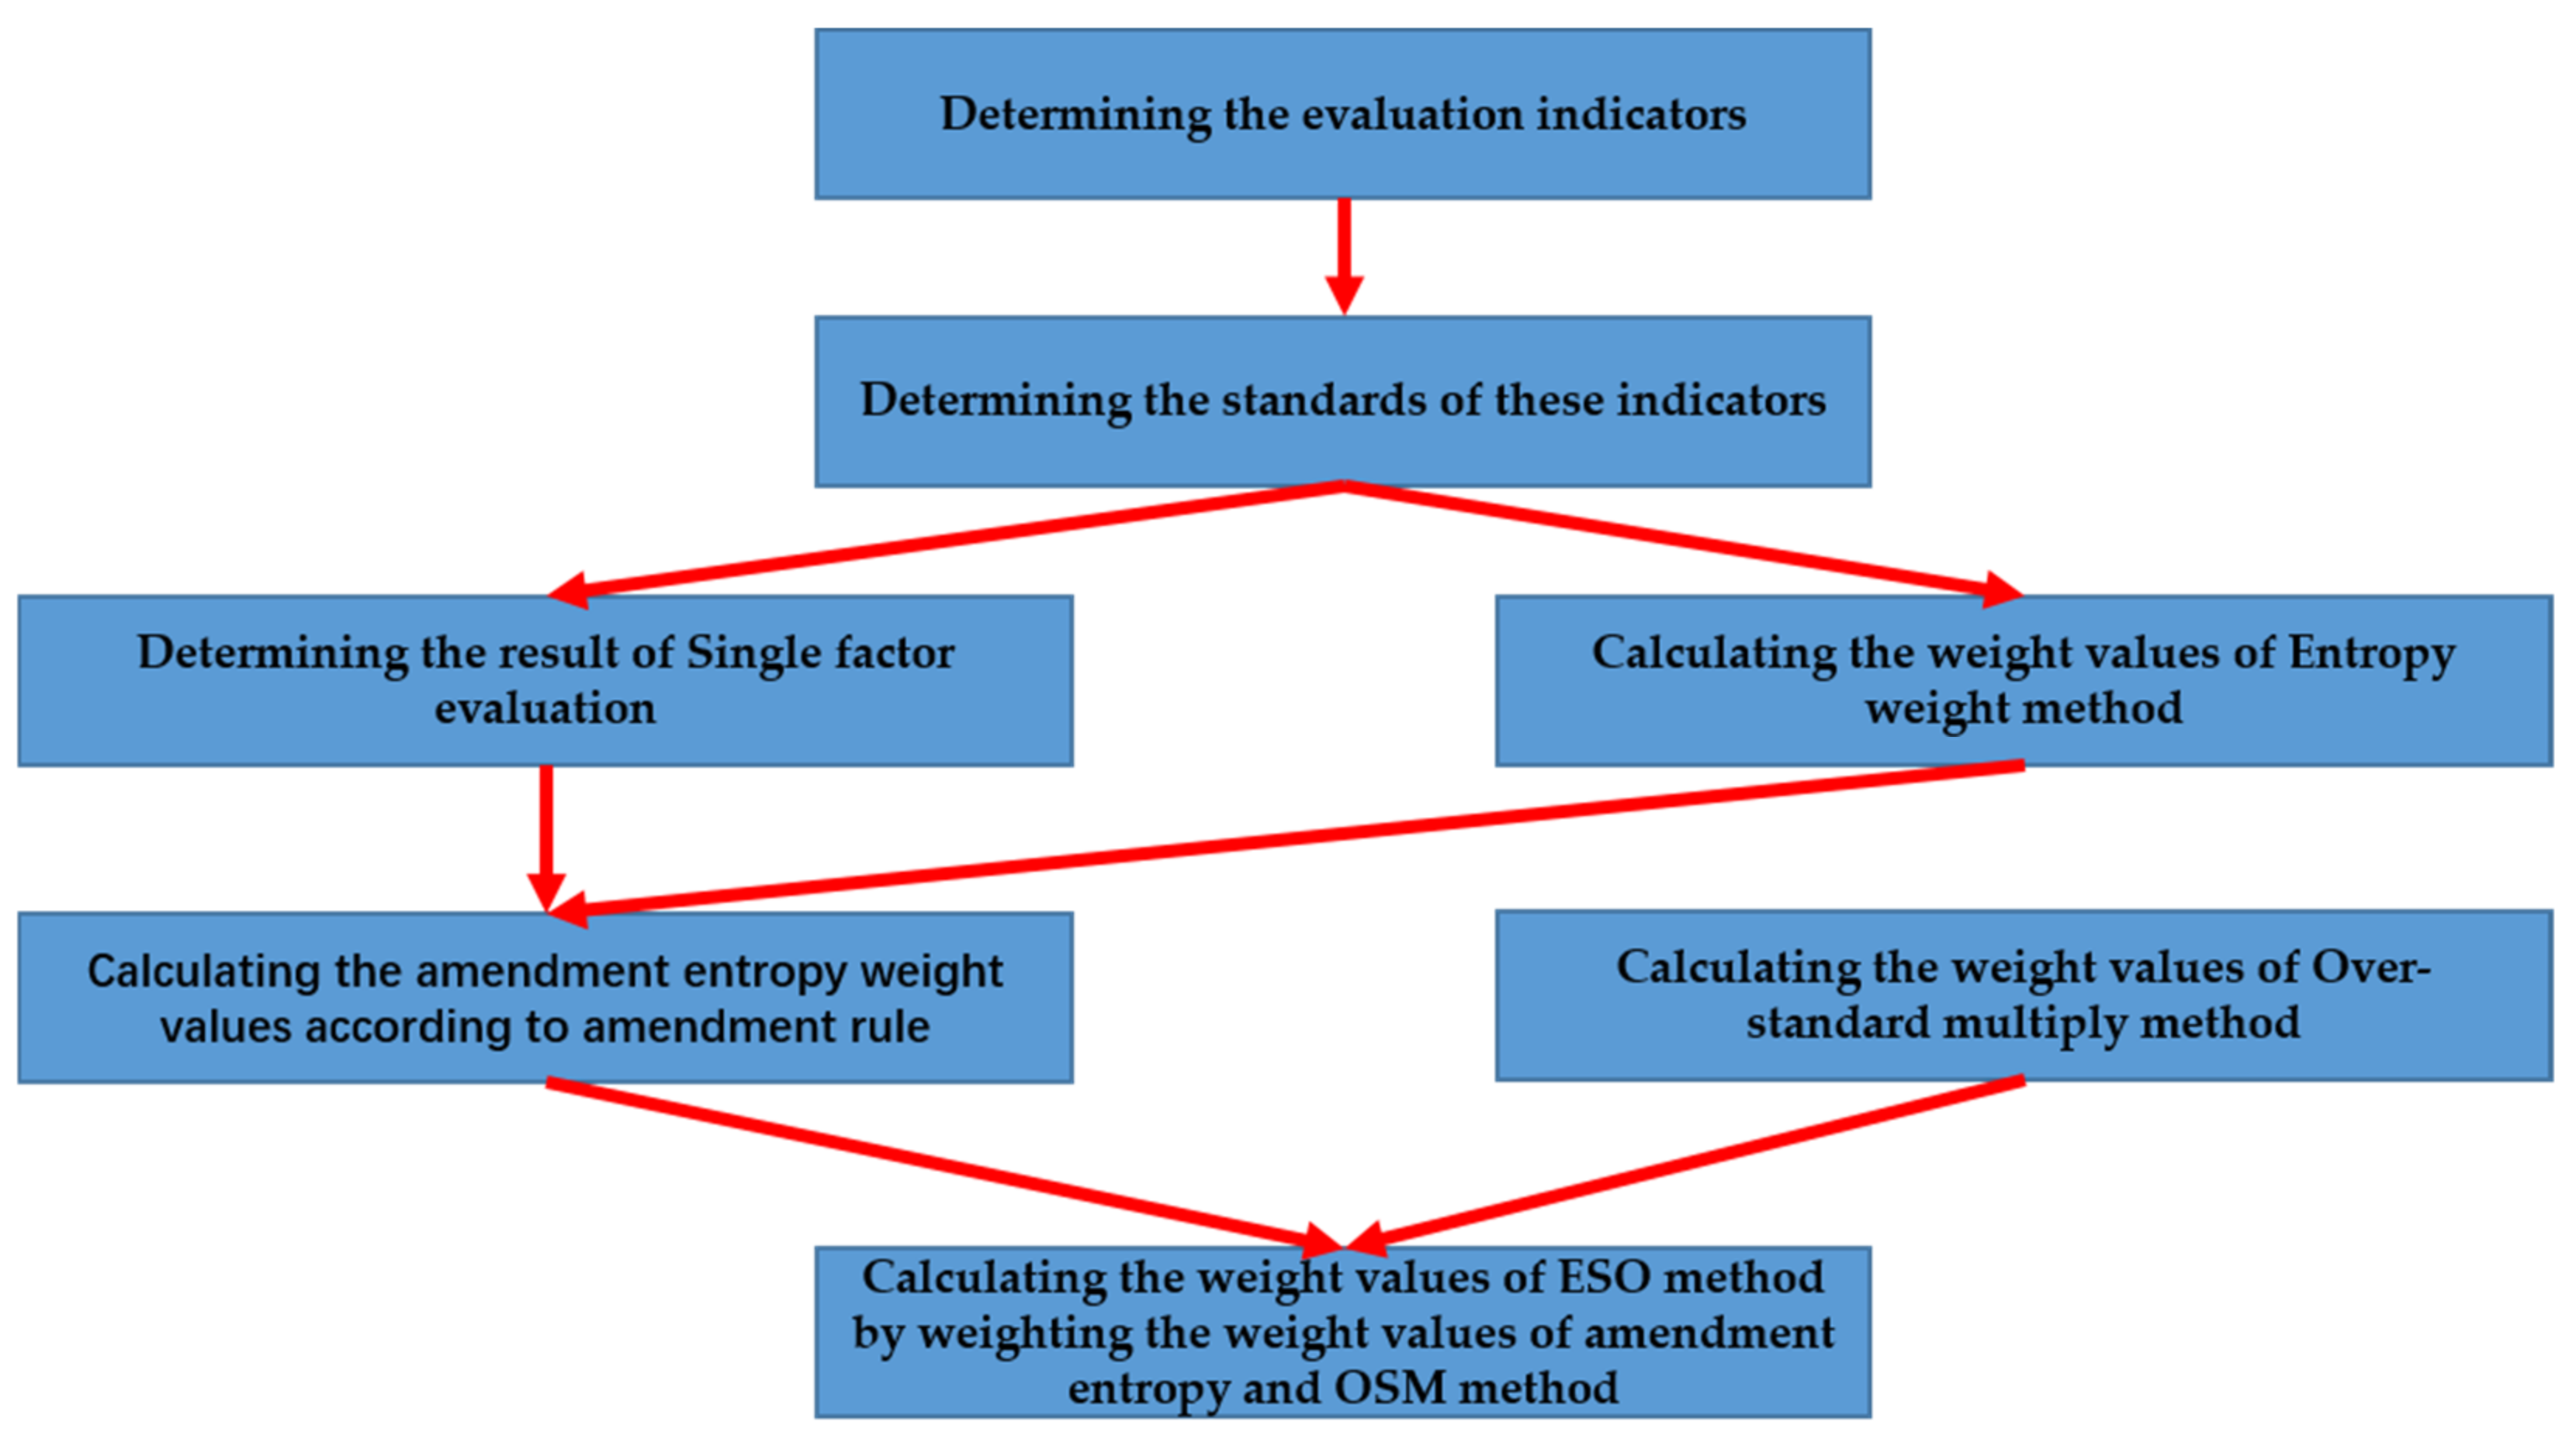
2.2.2. ESO Method

Weight assignment is conducted to quantitatively evaluate the importance of each indicator to the water quality, which is the most critical step in synthetic evaluation. The accuracy of the calculated weight is directly related to the final evaluation results. In the typical fuzzy synthetic evaluation method, the weight of every indicator is determined by calculating the superscale, which is the ratio of the value of each indicator at each monitoring point to the corresponding water quality standard [25]. However, in this study, the ESO method includes four main steps: entropy weight calculation, weight amendment based on the single-factor evaluation results, over-standard weighting, and combined weight calculation. The steps and technology roadmap of the ESO method are as shown in Figure 3.
  • Step 1—Entropy weight calculation
During water quality evaluation, the entropy value can be used to assess the degree of discreteness of the evaluation indicator: the smaller the information entropy value, the greater the degree of discreteness of the indicator, and the greater its influence of the indicator on synthetic evaluation (i.e., weight) [26]. That is, the entropy weight reflects the useful information of the indicator to all samples. As the entropy weight is the comprehensive weight reflecting the dispersion of all samples, the value need not be calculated for each sample individually; therefore, this method also has a lower workload. The EWM calculation steps are as follows [27]:
1
Calculation of the original matrix, Q = (qij)(m×n), I = 1, 2, , m; j = 1, 2, , n.
For the “bigger the better” indicator:
q i j = x i j x m i n , j x m a x , j x m i n , j
For the “smaller the better” indicator:
q i j = x m a x , j x i j x m a x , j x m i n , j
2
The original matrix is normalized to obtain the matrix Cn = (cnij)(m×n)
c n i j = q i j t = 1 m q t j
3
As the logarithm will appear in the entropy calculation, matrix Cn must be modified to prevent its zero element from being unable to be calculated. The revision is as follows:
c i j = 1 + c n i j t = 1 m 1 + c n t j
4
Entropy calculation:
E j = i = 1 m c i j × l n c i j l n m
5
Determination of entropy weight:
W j = 1 E j n j = 1 n E j
where m is the number of samples, n is the number of indicators, qij is the scale value of indicator j in sample i that expresses the degree of discreteness of an index, xij is the measured value of indicator j in sample i, xmin,j is the minimum value in the measured value of evaluation indicator j, xmax,j is the maximum value in the measured value of evaluation indicator j, cnij is the normalized scale value of indicator j in sample i, c’ij is the normalized scale value of indicator j in revised sample i, Ej is the information entropy of evaluation indicator j, and Wj is the weight value of evaluation indicator j.
  • Step 2—Weight correction based on the single-factor evaluation results
Although the entropy method can obtain the comprehensive weight that reflects the difference in the degree of pollution of all samples, its weight value only reflects the difference in the degree of pollution of each sample and cannot express the degree of pollution. To resolve this problem, considering more angles, a method that can reflect the degree of pollution must be used to modify the entropy weight. Although the result of single-factor evaluation is conservative, it can fully reflect the degree of pollution of each indicator; therefore, the result of single-factor evaluation is used in this study as an amendment to modify the entropy weight, with the following correction method:
1
Determination of the amendment data. The amendment data refers to the basic data used to modify the entropy weight, which can reflect the user’s attitude towards the influencing factors of the parameters. This study thinks that the pollution degree of each parameter is an important factor affecting its weight, so the single-factor evaluation results are used as amendment data. The choice of the amendment data can be determined according to the actual demand and, therefore, it is subjective. However, the ESO method is objective after determining the amendment data. If users agree with the amendment rule of this study, they also could take the single factor assessment results as amendment data, then the subjectivity disappears.
2
Calculation of the amendment entropy weight according to the single-factor evaluation results using the amendment rule. The amendment data can be selected to the requirement. As grade III is used to indicate whether the water quality is qualified or not, the weights of sample indices better than grade III will be reduced, while those of sample indices inferior to grade III will increase, taking grade III water as the reference point in the algorithm proposed in this study. This work is to avoid ignorance to indicators with high pollution to cause an unreasonable result. The formula is as follows.
W n j = W j × i = 1 3 m × n N
where Wnj is the amendment weight of indicator j, Wj is the entropy weight of indicator j, m is the amendment value according to the single-factor evaluation results, n is the number of samples corresponding to different amendment values, and N is the number of samples.
As grade III in single-factor evaluation indicates whether water quality is qualified or unqualified, it is given an amendment value of 1. The water quality indicators better than grade III were not considered, and given an amendment value of 0, while those inferior to grade III needed to be considered; thus, as the water quality grade increased, the amendment value also gradually increased from 1. The amendment values are presented in Table 1.
3
The amendment entropy weight calculated by formula (11) was normalized, then, amendment weight Wnj based on the result of single-factor evaluation was obtained.
W j = W n j j = 1 n W n j
where Wnj is the amendment weight of indicator j, W’j is the normalized amendment weight of indicator j (amendment entropy weight).
  • Step 3—OSE weight calculation
Although the amendment weight reflects the comprehensive pollution degree and its difference for each sample at the same time, the weight value obtained was the comprehensive weight of each indicator in all samples, which cannot reflect the pollution degree of each indicator within each sample. Although this allows the weight calculation results to have high fault tolerance, it is unreasonable for a certain indicator to use the same weight and completely ignore the difference if there are significant differences between different samples. The OSM method can quantitatively calculate the over-standard degree of each indicator in each sample and then normalize it in the sample; the weight value of each indicator in each sample can then be obtained. Therefore, the conflict between the overall characteristics of the samples and differences between them can be solved by calculating the combined amendment entropy and over-standard weights. The calculation steps of the OSM are as follows [28]:
1
Calculation of the degree by which each indicator exceeds the standard in each sample.
For the “bigger the better” indicator:
k i j = 1 5 × t = 1 5 v j t x i j
For the “smaller the better” indicator:
k i j = x i j 1 5 × t = 1 5 v j t
2
Determination of the weight value W″ij:
W i j = k i j t = 1 n k t j
where kij is the degree by which sample i exceeds the standard of indicator j, vjt represents the standard value of the t-grade water quality in indicator j, xij is the measured value of indicator j in sample i, and W″ij represents the weight value of indicator j in sample i.
  • Step 4—The arithmetic average method was used to calculate the combined weights. The weights obtained here are called ESO weights, as we used the ESO method in this study [17].
    W c i j = W j + W i j 2
    where Wcij is the combination weight (ESO weight) of the amendment entropy and over-standard weights, Wj is the normalized amendment weight of indicator j, and Wij is the over-standard weight of indicator j in sample i.

3. Results and Discussion

3.1. Entropy Weight and Amendment Entropy Weight

The single-factor evaluation results for Chagan Lake from 2007 to 2016 are shown in Table 2. The F results showed that the water quality was inferior to class V in three samples, and class V in seven samples, while the CODCr results showed that there were eight class V and two class IV samples; thus, F and CODCr were the two factors that exceeded the standard most severely. Although the CODMn and TN results indicated that all samples were inferior to class III, there were few class V samples, while there were three class V samples for TP and five class III samples. Therefore, the over-standard degrees of CODMn, TN, and TP were slightly better than those of F and CODCr. Only two BOD5 samples failed to meet the standard, and the other eight samples were class III, which was a slightly over-standard factor. All the DO and NH3-N samples reached the standard of class III, which was the qualification factor. Therefore, the pollution degree of each factor was decreased in the following order: F and CODCr > CODMn, TN, and TP > BOD5> NH3-N > DO.
The entropy and amendment entropy weights determined following steps 1 and 2 of the ESO method are shown in Table 3. The data show that TP, BOD5, and CODCr were the main indicators influencing the entropy weight, while the weight values of other indicators were relatively evenly distributed, which is consistent with the data dispersion of samples (expressed by variance) for each indicator in Table 3 (The indicators with underline are the main pollution indicators determined by each method). This result demonstrates that the entropy weight values can be determined from the dispersion of the sample data [29].
The main influencing indicators of the amendment entropy weight were TP, CODCr and F, and the weight values of the indicators which exceeded the standard seriously in the single-factor evaluation, such as F, CODCr, CODMn, TP, and TN, were increased to a certain extent compared with the entropy weight values, while those of DO, NH3-N, and BOD5, which did not exceed the standard or slightly exceeded the standard, were reduced to a certain extent, and the DO even became 0. This result shows that the amendment entropy weight is affected by the results of single-factor evaluation to a certain extent; that is, the higher the degree of exceeding the standard of the indicator, the greater the increase of the amendment weight value, and vice versa. The weight value of DO became 0 was because all its samples were better than class III, and it did not need to be concerned according to the amendment rules in step 2, so it was given a weight of 0. However, the result of amendment entropy weight was not completely consistent with single-factor evaluation; for example, TP was not the most serious over-standard factor in single-factor evaluation, but it was given the largest amendment weight value because it was affected by dispersion degree according to Table 3.
The amendment weight values of the indicators that greatly exceeded the standard in single-factor evaluation, such as F, CODCr, CODMn, TP, and TN, were higher than the entropy weight values, while those of DO, NH3-N, and BOD5, which did not exceed the standard or slightly exceeded the standard, were reduced to a certain extent, and the DO even reached 0. This result indicates that the amendment entropy weight is affected by the results of single-factor evaluation, to a certain extent. That is, the higher the degree by which the indicator exceeds the standard, the greater the increase in the amendment weight value, and vice versa. The weight value of DO was 0 because the quality of all DO samples was better than class III and, therefore, it did not need to be considered according to the amendment rules in step 2 and was given a weight value of 0. However, the amendment entropy weight result was not fully consistent with the single-factor evaluation; for example, TP was not the most severe over-standard factor in single-factor evaluation, but it was given the largest amendment weight value as it was affected by the dispersion degree, as shown in Table 3.
According to the above analysis results, the amendment entropy weight not only retained the attention to the sample data dispersion but also considered the influence of the over-standard degree of each indicator; the angle was more comprehensive, and the evaluation result was closer to reality. Owing to the attention to the over-standard samples and contempt for the qualified samples in the amendment rule, the amendment weights were allocated more to the indicators with a higher degree of pollution; thus, the final comprehensive evaluation results were more conservative.
Although the single-factor evaluation result is also conservative, it is inherently different to the ESO method. The single-factor evaluation method adopts the worst results in each indicator as the comprehensive water quality grade, causing the results to become more biased [30,31]. For example, the 2011 single-factor evaluation results in Table 2 show that classes, I, II, III, IV, V, and inferior to V were observed for one, one, three, two, one, and one indicator, respectively; however, the final evaluation results were directly classified as class IV. However, the ESO method does not ignore the influence of samples and indicators with any water quality grade. Rather, it increases the weight values of over-standard factors, causing the evaluation grade to become too high. Consideration will only cease when the quality of all samples of an indicator is better than class III because if the water quality indicator is excellent in all samples, it is very unlikely to become a pollution factor and it no longer requires consideration.

3.2. Over-Standard and ESO Weights

The weight values of the OSM and ESO methods determined according to steps 3 and 4 of the ESO method are shown in Table 4 and Table 5 (underlined data are the maximum and minimum values of the indicators in all samples). The results show that the over-standard weight values of some indicators varied greatly between different samples; for example, the weight value of TP was 0.202 in 2010, while it was only 0.059 in 2014, and that of BOD5 was 0.067 in 2011, but 0.12 in 2014. Although some differences in the ESO weight values of these indicators in different samples remained, they were more similar. For example, the weight values of TP were 0.215 and 0.143 in 2010 and 2014, while those of BOD5 became 0.091 and 0.111 in 2011 and 2014, respectively. The data of other indicators were also aggregated, to a certain extent.
The above analysis results indicate that the ESO weight combines the characteristics of the amendment entropy and over-standard weights. According to Section 3.2, the values of each indicator in the amendment entropy weight were the result of the comprehensive action of all sample data. Even if the individual sample data are incorrect, they will not significantly impact the comprehensive weight, resulting in high fault tolerance. However, this is not only an advantage, but also a deficiency. The amendment entropy weight reflects the average level of each indicator under all sample conditions; however, it cannot precisely represent the actual situation of each indicator within each sample. The OSM method can only calculate the over-standard degree of each indicator within each sample [32]. Therefore, the ESO weight, which combines the amendment entropy and over-standard weights, simultaneously has global and local characteristics.

3.3. Fuzzy Synthetic Evaluation Results

The fuzzy synthetic evaluation method separately combined with weight values of OSM, EWM, amendment EWM, and ESO method was used to evaluate the water quality of each sample from Chagan Lake, and the results are shown in Table 6. The single-factor evaluation results showed that the water quality of all samples was class V and inferior to V; thus, they did not meet the standard. The EWM showed that five samples exhibited class II water quality, and another five exhibited class III water quality, all of which met the standard. The amendment EWM indicated that eight samples met the standard, while the other two did not. The OSM method indicated that seven samples met the standard, while the other three did not. The ESO method showed that eight samples met the standard, while two samples did not. The above results indicate that the ESO method evaluation result was between that of EWM and the single-factor evaluation method and was similar to that of the OSM method; however, some differences remain. This is mainly due to the effect of the over-standard method on the ESO method in the final link, which has a great influence, while the entropy weight value is first modified by the single-factor evaluation results and then combined with the over-standard weight, which dilutes the influence twice. The evaluation results of the amendment EWM and ESO methods were consistent, and there was only a slight difference.
The result of the single-factor evaluation method was too conservative, and the consideration angles of the OSM and entropy methods were relatively simple; therefore, the water quality grade of the ESO method was taken as the final result of the water quality evaluation of Chagan Lake in this study. The water quality of Chagan Lake was class IV in 2009 and 2015, and class III during the other years. According to the requirements for lake water quality in the national 13th Five-Year Plan, only the water quality of classes I, II, and III meets the standards; therefore, among the ten samples of Chagan Lake, those collected in 2009 and 2015 did not meet the standard, while those collected in the other years did.

3.4. Applicability of the ESO Method

According to Section 2.2.2, the ESO method proposed in this study uses an objective operation formula and is more stable than the traditional combination weighting method (subjective + objective weighting methods). The ESO method evaluation result is not affected by the professional ability of users and can be popularized more easily. According to the analysis results in Section 3.1, the ESO method considers the influencing factors more comprehensively than the objective weighting methods, and the weight can better reflect the actual water quality situation. Therefore, this method is suitable for beginners and frontline staff who do not have high professional literacy and cannot accurately conduct subjective weighting.
The traditional weighting method calculates a comprehensive weight value for each indicator to reflect the proportion of its impact on water quality, which is applicable to spatial samples and even time-series samples with short intervals. However, for time-series samples with a long interval, the influence of each indicator on water quality is not constant over time. As shown in the single-factor evaluation results provided in Table 2, the overall water quality of Chagan Lake in 2016 was worse than that in 2008. However, according to Table 6, the entropy weight method evaluation results show that the relative water quality grade in 2016 was better than that in 2008, which is obviously unreasonable. While the result of the ESO method considering local weight is consistent with the actual water quality situation, which is reasonable. Therefore, the ESO method is also suitable for time-series samples with long intervals.

4. Conclusions

This study systematically analyzes the advantages and disadvantages of the subjective, objective, and traditional combination weighting methods, and constructs an ESO weighting method based on the single-factor evaluation method, EWM, OSM method, and amendment rules. Using water quality data of Chagan Lake from 2007 to 2016 as research samples, the weights of the EWM, OSM, and ESO methods were calculated and combined with the fuzzy synthetic evaluation method to obtain the final water quality evaluation results for Chagan Lake. Based on the comparative analysis of the results of the above weighting methods and final water quality evaluation results, the following conclusions were drawn:
As an improved combination weighting method, the ESO weighting method does not use any subjective processes; therefore, its evaluation results are relatively stable and it has low requirements for the professional ability of users, and can be popularized more easily. This method not only considers the discreteness of the sample data, but also considers the influence of the degree of exceeding the standard in the single-factor evaluation of each indicator; the influencing factors of consideration are more comprehensive, and the evaluation result is closer to reality. Therefore, this method is suitable for beginners and frontline staff who do not have high professional literacy and cannot accurately conduct subjective weighting. Meanwhile, owing to the amendment rule and emphasis on the local weight of the sample in the ESO method, it is more applicable to time-series data than the comprehensive weight of the traditional weighting method.
Owing to the attention to the over-standard samples and contempt for the qualified samples in the amendment rules of the ESO method, the amendment weights were more allocated to the indicators with a higher degree of pollution; thus, the final comprehensive evaluation results were relatively strict. However, this differs with respect to the single-factor evaluation method, which determines water quality based on the grade of the worst indicator, while the ESO method obtains the result of the comprehensive action of all indicators; thus, the strict result of the ESO method was more reasonable.
The evaluation result of the ESO method was between those of the EWM and single-factor evaluation methods, and slightly stricter than that of the OSM method. The evaluation results of the amendment entropy weight method and ESO method were relatively consistent, with only a slight difference. This result shows that, if the sample data are not a time-series, then the ESO weight should not be calculated, and the amendment entropy weight can be used directly.
The water quality of Chagan Lake in 2009 and 2015 was class IV, which did not meet the standard, while that in the remaining eight years was class III, which met the requirements of the national 13th Five-Year Plan.

Author Contributions

W.Z. processed the data and analyzed the results; W.Z. and X.F. wrote the manuscript; X.L., Z.F. and C.X. reviewed the manuscript and made helpful suggestions; Y.C. and W.Z. revised the manuscript. All authors have read and agreed to the published version of the manuscript.

Funding

The study was financially supported by National Natural Science Foundation of China (No. 41572216),the China Geological Survey Shenyang Geological Survey Center “Hydrogeological survey of Songnen Plain” Survey project (No. [2019]DD20190340-W09), the Provincial School Co-construction Project Special-LeadingTechnology Guide (SXGJQY2017-6), the Jilin Province Geological Exploration Fund Project ((2018) Geological Prospecting 36-13), and the Key research and development program of Shaanxi Province (2017ZDCXL-SF-03-01-01).

Institutional Review Board Statement

Not applicable.

Informed Consent Statement

Not applicable.

Data Availability Statement

Not applicable.

Acknowledgments

We would like to thank the anonymous reviewers and the editor.

Conflicts of Interest

The authors declare no conflict of interest.

References

  1. Hu, Z.; Hu, L.; Cheng, H.; Qi, D. Application of Pollution Index Method Based on Dynamic Combination Weight to Water Quality Evaluation. In Proceedings of the IOP Conference Series: Earth and Environmental Science, Guilin, China, 20–22 April 2018. [Google Scholar]
  2. Lu, R.S.; Lo, S.L.; Hu, J.Y. Analysis of reservoir water quality using fuzzy synthetic evaluation. Stoch. Environ. Res. Risk Assess. 1999, 13, 327–336. [Google Scholar] [CrossRef]
  3. Rahmati, O.; Samani, A.N.; Mahdavi, M.; Pourghasemi, H.R.; Zeinivand, H. Groundwater potential mapping at Kurdistan region of Iran using analytic hierarchy process and GIS. Arab. J. Geosci. 2014, 8, 7059–7071. [Google Scholar] [CrossRef]
  4. Lee, S. Determination of Priority Weights under Multiattribute Decision-Making Situations: AHP versus Fuzzy AHP. J. Constr. Eng. Manag. 2015, 141, 05014015. [Google Scholar] [CrossRef]
  5. Delgado, A.; Romero, I. Environmental conflict analysis using an integrated grey clustering and entropy-weight method: A case study of a mining project in Peru. Environ. Model. Softw. 2016, 77, 108–121. [Google Scholar] [CrossRef]
  6. Wang, J.; Li, S.-C.; Li, L.-P.; Lin, P.; Xu, Z.-H.; Gao, C.-L. Attribute recognition model for risk assessment of water inrush. Bull. Int. Assoc. Eng. Geol. 2017, 78, 1057–1071. [Google Scholar] [CrossRef]
  7. Gorgij, A.D.; Kisi, O.; Moghaddam, A.A.; Taghipour, A. Groundwater quality ranking for drinking purposes, using the entropy method and the spatial autocorrelation index. Environ. Earth Sci. 2017, 76, 9. [Google Scholar] [CrossRef]
  8. Ma, F.; Li, C.; Wang, X.; Yang, Z.; Sun, C.; Liang, P. A Bayesian method for comprehensive water quality evaluation of the Danjiangkou Reservoir water source area, for the middle route of the South-to-North Water Diversion Project in China. Front. Earth Sci. 2013, 8, 242–250. [Google Scholar] [CrossRef]
  9. Liu, J.G.J.; Jiang, J. Application of different fuzzy assessment methods of water quality assessment in Dianchi Lake. Environ. Pollut. Control. 2010, 32, 20–25. [Google Scholar]
  10. Liu, K.; Lin, B. Research on influencing factors of environmental pollution in China: A spatial econometric analysis. J. Clean. Prod. 2019, 206, 356–364. [Google Scholar] [CrossRef]
  11. Qian, B.; Zhu, Y.X.; Wang, Y.X.; Yan, F. Can Entropy Weight Method Correctly Reflect the Distinction of Water Quality Indices? Water Resour. Manag. 2020, 34, 3667–3674. [Google Scholar]
  12. Zhi-Hong, Z.; Yi, Y.; Jing-Nan, S. Entropy method for determination of weight of evaluating indicators in fuzzy synthetic evaluation for water quality assessment. J. Environ. Sci. 2006, 18, 1020–1023. [Google Scholar]
  13. Pan, Z.; Wu, K.; Huang, Q. An Improved Method to Determine the Weight on Fuzzy Evaluation of the Water Environmental Quality. Biography 2008, 1, 2. [Google Scholar]
  14. Yang, J.Y.; Zhang, L.L. Fuzzy Comprehensive Evaluation Method on Water Environmental Quality based on Entropy Weight with Consideration of Toxicology of Evaluation Factors. In Progress in Environmental Science and Engineering; Li, H., Xu, Q.J., Zhang, D., Eds.; Trans Tech Publications Ltd.: Durnten, Switzerland, 2012; pp. 2383–2388. [Google Scholar]
  15. Yan, F.; Yi, F.H.; Chen, L. Improved Entropy Weighting Model in Water Quality Evaluation. Water Resour. Manag. 2019, 33, 2049–2056. [Google Scholar]
  16. Wang, X.T.; Yang, W.M.; Xu, Z.H.; Hu, J.; Xue, Y.G.; Lin, P. A Normal Cloud Model-Based Method for Water Quality Assessment of Springs and Its Application in Jinan. Sustainability 2019, 11, 2248. [Google Scholar] [CrossRef] [Green Version]
  17. Jun, P.; Li, M.; Zhen, Z. The Method of Quadratic Combination Weighting Fuzzy Comprehensive Evaluation applied in Water Quality Assessment. In Proceedings of the International Conference on Material and Environmental Engineering, Jiujiang, China, 21–23 March 2014; Zhang, Y., Ed.; Atlantis Press: Paris, France, 2014; pp. 127–130. [Google Scholar]
  18. Yan, W.; Li, J.; Bai, X. Comprehensive assessment and visualized monitoring of urban drinking water quality. Chemom. Intell. Lab. Syst. 2016, 155, 26–35. [Google Scholar] [CrossRef]
  19. Wu, X.; Hu, F. Analysis of ecological carrying capacity using a fuzzy comprehensive evaluation method. Ecol. Indic. 2020, 113, 13. [Google Scholar] [CrossRef]
  20. Liu, X.M.; Zhang, G.X.; Sun, G.Z.; Wu, Y.; Chen, Y.Q. Assessment of Lake Water Quality and Eutrophication Risk in an Agricultural Irrigation Area: A Case Study of the Chagan Lake in Northeast China. Water 2019, 11, 2380. [Google Scholar] [CrossRef] [Green Version]
  21. He, Y.J.; Wang, D.; Wang, G.L. Fuzzy Comprehensive Evaluation on North-China Groundwater Quality. In Progress in Environmental Science and Engineering; Pts 1-42013; Xu, Q.J., Ju, Y.H., Ge, H.H., Eds.; Trans Tech Publications Ltd.: Stafa-Zurich, Switzerland, 2013; pp. 2729–2733. [Google Scholar]
  22. Chai, Y.; Xiao, C.; Li, M.; Liang, X. Hydrogeochemical Characteristics and Groundwater Quality Evaluation Based on Multivariate Statistical Analysis. Water 2020, 12, 2792. [Google Scholar] [CrossRef]
  23. Dong, J.; Li, X.; Fang, Y.; Zheng, X. Evaluation and Rediction of Groundwater Quality Based on Improved Fuzzy Synthesis-Exponential Smoothing. Period. Ocean Univ. China 2020, 50, 126–135. [Google Scholar]
  24. Liu, L.; Zhou, J.; An, X.; Zhang, Y.; Yang, L. Using fuzzy theory and information entropy for water quality assessment in Three Gorges region, China. Expert Syst. Appl. 2010, 37, 2517–2521. [Google Scholar] [CrossRef]
  25. Baodong, F. Fuzzy, comprehensive evaluation model for groundwater quality. China Rural Water Hydropower 1998, 9, 29–32. [Google Scholar]
  26. Vranešević, M.; Belić, S.; Kolaković, S.; Kadović, R.; Bezdan, A. Estimating Suitability of Localities for Biotechnical Measures on Drainage System Application in Vojvodina. Irrig. Drain. 2016, 66, 129–140. [Google Scholar] [CrossRef]
  27. Zhu, H.; Zhu, J.; Zou, Q. Comprehensive Analysis of Coordination Relationship between Water Resources Environment and High-Quality Economic Development in Urban Agglomeration in the Middle Reaches of Yangtze River. Water 2020, 12, 1301. [Google Scholar] [CrossRef]
  28. Kan, B.; Fu, Q.; Song, Z. Application of fuzzy matter-element model based on the multiple superscale to evaluating water quality in wetland. J. Safety Environ. 2009, 9, 97–99. [Google Scholar]
  29. Wang, Y.; Sheng, D.; Wang, N.; Ma, H.; Wu, J.; Xu, F. Variable Fuzzy Set Theory to Assess Water Quality of the Meiliang Bay in Taihu Lake Basin. Water Resour. Manag. 2014, 28, 867–880. [Google Scholar] [CrossRef]
  30. Zhang, L.; Li, W.-J.; Lai, W. Application Research on Improved BP Neural Network for Water Quality Comprehensive Evaluation. In Proceedings of the International Conference on Graphic and Image Processing, Hong Kong, China, 26–27 October 2013; Zhu, Z., Ed.; SPIE—International Society for Optics and Photonics: Bellingham, WA, USA, 2013. [Google Scholar]
  31. Wu, C.; Ren, Y.; Zhang, B.; Zhang, B. Evaluation of Water Quality of Neijiang in Zhenjiang Based on Fuzzy Mathematics. In Proceedings of the International Conference on Intelligent Computation and Industrial Application (ICIA2011), Hong Kong, China, 18–19 June 2011. [Google Scholar]
  32. Zhang, Y.B.; Si, X.L. Quality Assessment of Surface Water Environment Based on Improved Grey Correlation Method. Yellow River 2017, 39, 109–111, 127. [Google Scholar]
Figure 1. Location of the study area: (a) Jilin Province, China; (b) the position of the study area in Jilin Province; and (c) Chagan Lake wetland ecological environment reserve.
Water 13 01424 g001
Figure 2. Technical roadmap of fuzzy synthetic evaluation method.
Water 13 01424 g002
Figure 3. Technical roadmap of ESO method.
Water 13 01424 g003
Table 1. Amendment values for different water quality grades.
GradeIIIIIIIVVInferior V
m001234
Table 2. Single- factor evaluation results of each indicator in each sample.
YearDOFNH3-NCODCrCODMNBOD5TPTN
2007IIVIIIIVIVIIIVIV
2008IIVIIIIVIVIIIVIV
2009IInferior VIIIVIVIIIIVIV
2010IIVIIIVIVIIIVIV
2011IIVIIVIVIIIIIIIV
2012IIVIIVIVIIIIIIIV
2013IIVIIVIVIIIIIIIV
2014IIVIIVIVIVIIIIV
2015IIInferior VIIVIVIIIIVIV
2016IIInferior VIIVIVIVIIIV
Table 3. Weight values and variance of indicators.
DOFNH3-NCODCrCODMnBOD5TPTN
Entropy weight0.1140.1050.0960.1220.1100.1400.2070.105
Amendment entropy Weight0.0000.1680.0240.2080.1350.1030.2280.135
Variance (10−4)3.182.942.683.543.044.255.972.82
Table 4. Over-standard weight values.
YearDOFNH3-NCODCrCODMnBOD5TPTN
20070.0690.1220.0920.1540.1330.0790.1950.155
20080.07 0.1390.0660.1580.1180.0790.1830.182
20090.0610.1620.0630.1930.1130.0850.1650.158
20100.0710.1150.0710.1760.1300.0800.2020.156
20110.0770.1680.0690.2010.1580.0670.0950.164
20120.0750.1670.0490.2200.1680.0970.0710.153
20130.0820.1550.0650.2030.1580.1040.0760.155
20140.0780.1850.0590.2030.1400.1200.0590.156
20150.0850.1940.0540.1790.1160.0840.1390.150
20160.0800.1660.0610.1690.1330.0970.0820.212
Table 5. ESO weight values.
YearDOFNH3-NCODCrCODMnBOD5TPTN
20070.0350.1450.0580.1810.1340.0910.2120.145
20080.0380.1530.0450.1830.1260.0910.2050.159
20090.0300.1650.0430.2010.1240.0940.1960.146
20100.0350.1410.0470.1920.1320.0910.2150.146
20110.0390.1680.0470.2040.1460.0850.1610.150
20120.0370.1670.0360.2140.1520.1000.1490.144
20130.0410.1610.0450.2060.1470.1040.1520.145
20140.0390.1760.0410.2050.1370.1110.1430.146
20150.0420.1810.0390.1940.1250.0940.1830.142
20160.0400.1670.0420.1880.1340.1000.1550.174
Table 6. Water quality indicator and grade of each sample.
YearSingle-Factor Evaluation MethodOver-Standard Method Entropy Method Amendment Entropy Method ESO Method
2007V3.3442.9883.5123.438
2008V3.8023.5353.8673.847
2009Inferior V4.0283.5424.1004.079
2010V3.5873.2993.6633.639
2011V3.4132.7313.3923.411
2012V3.7002.9873.5553.649
2013V3.3022.9053.2753.303
2014V3.4022.8593.3143.385
2015Inferior V4.0263.4914.0434.050
2016Inferior V4.0213.2813.7353.895
Publisher’s Note: MDPI stays neutral with regard to jurisdictional claims in published maps and institutional affiliations.

