Stepped Spillway Slope Effect on Air Entrainment and Inception Point Location


Department of Hydraulic Engineering, College of Civil Engineering and Architecture, Zhejiang University, Hangzhou 310058, China
*
Author to whom correspondence should be addressed.
Water 2021, 13(10), 1428; https://doi.org/10.3390/w13101428
Submission received: 13 April 2021
/
Revised: 8 May 2021
/
Accepted: 10 May 2021
/
Published: 20 May 2021
(This article belongs to the Section Hydraulics and Hydrodynamics)
Abstract
:Spillway is a crucial hydraulic structure used to discharge excess water from the dam reservoir. Air entrainment is essential to prevent cavitation damage on the spillway, however, without air entrainment the risk of cavitation over the spillway increases. The most important parameter for the determination of air entrainment in stepped spillways is the inception point. The inception point is the location where the air starts to inter into the water flow surface over the spillway. It occurs when the turbulent boundary layer meets the free surface. The location of the inception point depends upon different parameters like flow rate, geometry, step size, and slope of the spillway. The main aim of this study was applying numerical simulation by using the realizable k-ϵ model and the volume of fluid (VOF) method to locate the location of the inception point. For this purpose, by using different stepped spillways with four different slopes (12.5°, 19°, 29°, and 35°) different flow rates were simulated, which gives the location of the inception point of different channel slopes of stepped spillways at different flow rates. The results demonstrated that the inception point location of mild slopes is farther from the crest of the spillway than the steep slope stepped spillway. Non-aerated flow zone length increases when the channel slope decreases from steep to mild slope.
1. Introduction
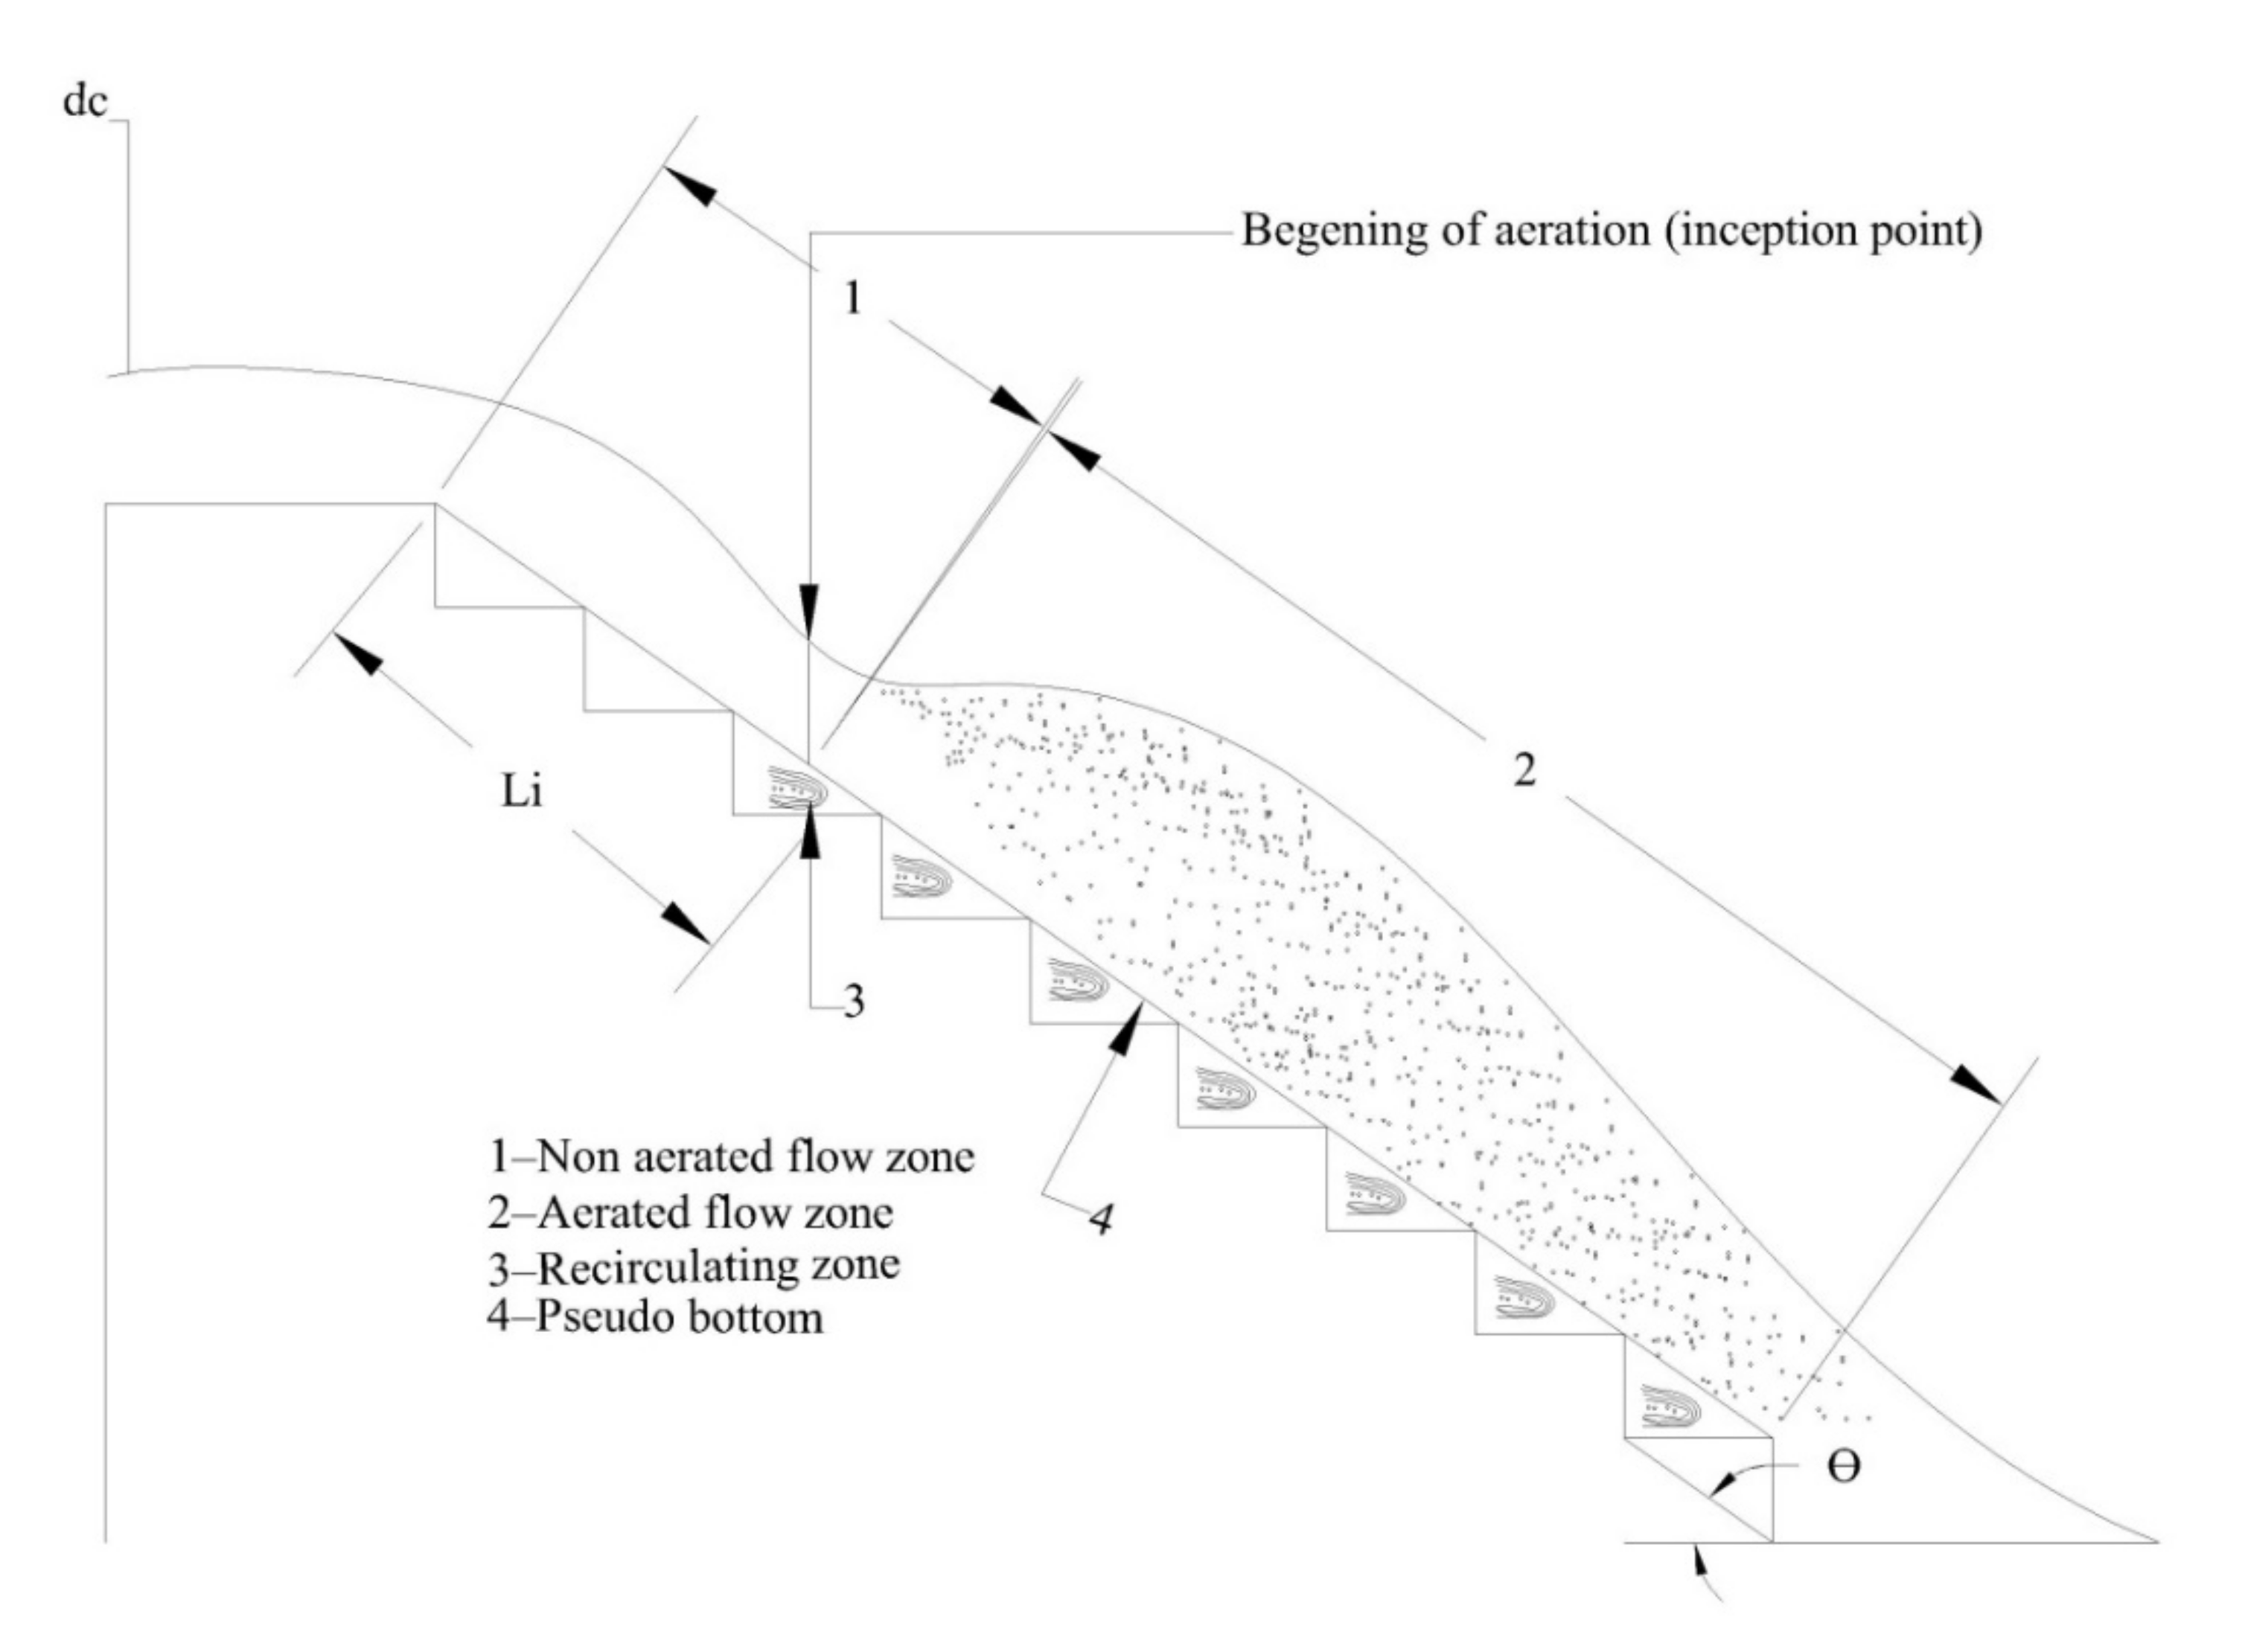
Stepped spillways have gained a huge attention recently for the release of excess water from the reservoir since energy loss in a stepped spillway is higher than the smooth spillways. Due to an increase in energy loss, the stilling basin length at the bottom part of the spillway would be shorter than the smooth spillway. Because the length of a hydraulic jump is shorter in the bottom of the spillway, called stilling basin, in the case of a stepped spillway than the smooth spillways. Engineers prefer the stepped spillways where a large amount of energy dissipation is required due to the short stilling basin length. Use of roller-compacted concrete (RCC) reduces cost and construction of steps become faster which increases dissipation energy as compared to a straight type of smooth spillway which was used in the past. Stepped spillways subsidize the elimination of downstream energy loss The steps’ roughness increases the dissipation energy in the stepped spillways. This means the steps water depth increases, and flow velocity reduces, which causes a higher dissipation of energy in stepped than smooth spillways. Another advantage of stepped spillways is the increase of size of the boundary layer turbulence, which enables free surface air to move along the spillway. This free surface air reduces the cavitation damage on the spillway surface. The boundary layer thickness depends mostly upon the roughness height and the stream wise location [1,2]. After a specific location, this boundary layer turbulence reach the free surface; this is termed as surface inception point [3]. If this turbulence incapacitates the surface tension, the air starts entering into the water and this is called the start of the aerated zone. After that point, the aerated zone thickness is increased in the way scattering to the steps until the total flow is aerated [4]. The pseudo-bottom inception point is found at distance Li, and is in fact the space among the spillway crest and location where the pseudo-bottom air concentration extends to Cb = 0.01 [5]. In addition, this point is very relevant to measure the cavitation potential in stepped spillways. The pseudo-bottom is formed due to joining the corners of the steps by a line or a plane tangent to the corners of the steps. Both points, the inception surface and pseudo-bottom inception point, are both situated very close to each other [6].
The concept of air entrainment in the stepped spillway is determined between entrained and entangled air in the stepped spillway. Entrained air is conveyed through the air bubbles while the trapped air is conveyed overhead in the coherent water body. The addition of entrained air and trapped air is entitled total air absorption [7]. The inception point location in the stepped spillway is of particular interest because of the upstream cavitation risk if the discharge exceeding a certain limit requires aeration upstream of the inception point [8]. The locality of the inception point for the smooth spillway is closer to the bottom than the stepped spillway. The maximum black water discharge is reduced in the stepped spillway than the uniform spillway [9]. Aerated flows in the stepped spillways are more disposed to inhibit cavitation loss than the non-aerated flows [10]. Energy dissipation in the white water flow is less than the black water flow because of drag reduction in the aerated flow region. Drag reduction is caused by the boundary of air bubbles and mixing layers [11].
Frequently stepped spillways are planned to operate in skimming flow regions because most spillways work on moderate discharge [12]. The water flows as a clear stream in the skimming flow region over the pseudo-bottom; beneath the pseudo-bottom, the three-dimensional vortices are formed [13]. Energy loss during the skimming flow is due to these three-dimensional vortices. Skimming flow occurs for higher discharge, and smaller step size in which water flows over the step edges and the recirculation zone is developed in the triangular region, which is formed by the step faces and pseudo-bottom [14,15]. For small discharge and large step size, there is flow occurring in the stepped spillway called nappe flow. In the flow region which is called nappe, the stream forms a nappe which is felled from one step to another. The free-falling nappes dissipate more energy than the skimming flow region due to more impact of water with a step face [16]. After nappe to skimming flow region, there is also a flow arise, which is called transition flow. In the transition flow region, mutually, nappe and skimming flow arise in different portions of the stepped spillway [17].
At the inception point, the air enters into the flow due to the large amount of turbulence, when the boundary layer turbulence extents the free surface the air starts entering into the water. Cavitation is a very serious problem in the stepped spillways. It will occur on the step edges, or step surfaces when pressure falls below the vapor pressure [18]. A spillway could be severely damaged with the cavitation, one way to reduce cavitation damage to the stepped spillway is entering significant air amount along the spillway. In order to decide the location of inception point (Li) on the stepped spillway, the un-aerated zone, which is disposed to cavitation damage during the flow, should be determined [19]. As the length of the non-aerated region over the stepped spillway increases, the cavitation risk heightens, and more area of the stepped spillway could be affected by the cavitation. An average of 5–8% air concentration is essential to prevent cavitation loss in the stepped spillway. For specific stepped spillway geometries, point of inception or fright of air entrainment transfers downstream with flow rate rises and the magnitude of the non-aerated flow region rises with the rise in the discharge so chances of cavitation in the stepped spillway increases when the discharge value is increased [20,21]. The geometry of a stepped spillway through skimming flow regime is presented in Figure 1. It also shows the length of non-aerated flow zone and aerated flow and the point where the air starts entering into the water.
Channel slope in the stepped spillway is an important parameter for the construction of any type of stepped spillway. Channel slope is actually the quotient of step height to the step length or whole elevation of the channel to the channel length. On the basis of the slope of channel, the stepped spillway is categorized into three types, mild slope stepped spillway; moderate slope stepped spillway; steep slope stepped spillway. The stepped spillway having a slope range of 10 to 14 is called a mild slope stepped spillway. A stepped spillway with a slope range of 14 ≤ ѳ ≤ 22 is called a moderate slope stepped spillway. A stepped spillway with a slope range of ѳ ≥ 22 is called a steep slope stepped spillway [22,23].
Numerical modeling is a technique that is used frequently nowadays in many engineering fields. Computational fluid dynamics (CFD) is a type of numerical method which is used to solve fluid problems. The use of CFD has received significant attention for hydraulic engineers for constructing the difficult spillway design and other hydraulic structures. In CFD there is no need for construction of a physical model or prototype model, so it proves to be very cost-effective throughout the design process. Physical modeling is very time consuming, and the creation of physical models, as well as contracting the facility and hiring the soft researchers to accomplish experiments can be very expensive. Hydraulic engineers are consequently attracted to CFD and use various software packages for numerical modeling. CFD is subsequently attractive in relations of cost and time. More prominently, the complete flow explanation is attained with sufficient accuracy [24,25,26].
Numerical simulation of over stepped spillways is accomplished by the Reynolds Averaged Navier–Strokes coupled with different turbulence simulation Reynolds stresses model, sst k-ὠ model, v2-f, and LES models [27,28]. These Navier–Strokes equations are problematic to solve, these equations are resolved by using different viable software like Fluent and Flow-3D and other software. This software uses finite volume methods to solve the Navier–Strokes equations [29]. Qian et al. [30] analysed and compare the impact of four turbulence models and the extent of the velocity of the mean water flow. The obtained results are compared with those obtained with PVC. The V2-f turbulence model underestimates the mean velocity while the results found by realizable k-ϵ, k-ὠ SST models are reliable and superior to those values obtained by PIV. Wei et al. [31] developed a model to measure the amount of air in nature-aerated open channel flows. The air-water flow contains the two regions’ low flow areas, where the amount of air is less than 0.5, and the higher flow region where the amount of air is greater than 0.5. Zhong Dong et al. [32] used the Fluent software to simulate the flow above the flat stepped spillway. They determined that the k-ϵ model is the most efficient model to simulate the flow over the stepped spillways. Chen et al. [33] used the Flow-3D software and compared the different turbulence models. They measured the velocity outline and water surface length through experimental and numerical modeling. Morovati et al. [34] studied the five different types of pooled stepped spillways and offered the effect of alignment of the different pools and considered the vortex flow, velocity contours, and standing side wall waves. Morovati and Eghbalzadeh [35] considered the inception point, pressure, and a void fraction over the pooled stepped spillway using the Flow-3D model. They used the volume of fluid (VOF) technique and k-ϵ turbulence model to simulate the free surface. They studied the different pressure values on the crest of the spillway. There is no negative pressure arising on the crest and horizontal face of the step. Negative pressure only happens on the vertical face of the step. Chen et al. [36] studied and examined the dam slope and ogee of the spillway bottom on the energy loss proportion. They decided that loss in energy increase as the spillway rise increases. In addition, they studied that energy loss in the stepped spillway without ogee is much more than the stepped spillway with the ogee at the toe of the spillway. They studied the characteristics of the turbulent flow on the stepped spillways. They utilized the different models to study the turbulence over the stepped spillway. Wan et al. [37] calculated the location of the inception point in diverse types of stepped spillways. They used the volume of fluid and realizable k-ϵ models to study the inception point in different types of stepped spillways. They studied the effect of step height and geometry of the step on the inception point location. They concluded that the increase of step height inception point moves upward toward the crest of the spillway. Wan et al. [38] calculated the cavitation loss in high-speed smooth spillways by using Fluent software. They use the volume of fluid (VOF) and standard k-ϵ models to measure the cavitation in the high-speed smooth spillway. They concluded that cavitation mostly occurs at the end of the chute where pressure is minimum below the vapor pressure. Craft et al. [39] used nonlinear models for different step heights. Cheng et al. [40] used the standard k-ϵ model to simulate the flow over the stepped spillway model and after that they used the RNG (renormalized group) k-ϵ model to simulate the same stepped spillway model. They found that the results found by the RNG turbulence model are more precise than the results gained by the standard k-ϵ model. So, they resolved that the turbulence model plays an important part in the precision of simulation of flow by using computational fluid dynamics to simulate the stepped spillway models. Tebbara et al. [41] used the ADINA software to simulate the flow above the stepped spillway. They used the different step configurations to determine the skimming flow development region and surface water profile, and the resolve of the energy dissipation ratio. They compared the numerical results with the laboratory experiments and they concluded that the numerical results have a close agreement with the laboratory experiments. Bai and Zhang [42] used the k-ϵ model to study the pressure values in three types of the stepped spillways (V-formed, inverted v-formed, and flat stepped spillway). The value of negative pressure in case of V-shaped stepped spillway is followed near both sidewalls of each step, while in the case of the inverted v-shaped stepped negative spillway pressure occurs on the axial plane of the step, while in the case of the traditional stepped spillway the negative pressure occurs along the entire cross-section. The value of negative pressure is decreased with the increase in Froude number in all types of stepped spillways. They decided that from all three kinds of stepped spillway models, the inverted v-formed stepped spillway model is most expected to lead to cavitation damage. Daneshfaraz et al. [43] used four types of stepped spillways with different step sizes; they use three changed turbulence models by using Fluent software to simulate different stepped spillway models. They found that the RNG k-ϵ model gives more appropriate results than the other two turbulence models by comparing the results with laboratory experiments. By choosing the appropriate turbulence model, they measured the pressure distribution on the steps and concluded that pressure distribution on the steps is the same for all spillway models. Abbasi and Kamanbedast [44] numerically solved the three groups of stepped spillways using the Flow-3D model; they studied the energy loss and critical depth over the stepped spillways and compared the values with the experiments. Roushanger et al. [45] used various types of modeling by using artificial neural networks and genetic programming techniques (GEP) by using an empirical data set to determine the energy loss in rotating and slipping flows along the stepped spillways.
This study is concerned with determining the air entrainment and location of the inception point by using computation fluid dynamics (CFD). For this purpose, different stepped spillway models are simulated with different slopes to determine the relation of how the size of non-aerated flow area varies with the change of slope. Different stepped spillways models with various slopes, i.e., 12.5°, 19°, 29°, and 35° are modeled to study how the inception point and size of non-aerated flow area vary with the change of slope of stepped spillways. For this, the Fluent software is used to simulate the stepped spillway models with different slopes. The volume of fluid model is utilized to track the boundary between water and air, and also, a realizable k-ϵ model is utilized to measure the turbulence inflow of stepped spillways. All the four stepped spillway models are simulated at different discharge rates. Overall, sixteen different spillways are modeled to analyze the relation between slope, non-aerated flow zone length, inception point, and discharge. For this purpose, four different discharge values are used to simulate the stepped spillway models with different slopes to study how the inception points location and non-aerated flow zone length vary with discharge and slope.
2. Materials and Methods
Computational fluid dynamics (CFD) is a division of fluid dynamics that practices numerical computation and different data structures to resolve various flow problems. The fundamentals of CFD are based upon the Navier–Strokes equations. Finite element and finite difference methods are particularly used for solid structures, they require more memory, and they have a slower solution than the finite volume method. In the finite volume method (FVM), the leading differential calculations called the Navier–Strokes equations, are solved out by discretizing the whole volume into small sets of volumes. Fluent software utilizes the finite volume method to discretize the Navier–Strokes equations. The benefit of utilizing the finite volume method is that it simply allows the unstructured meshes to be easily formulated.
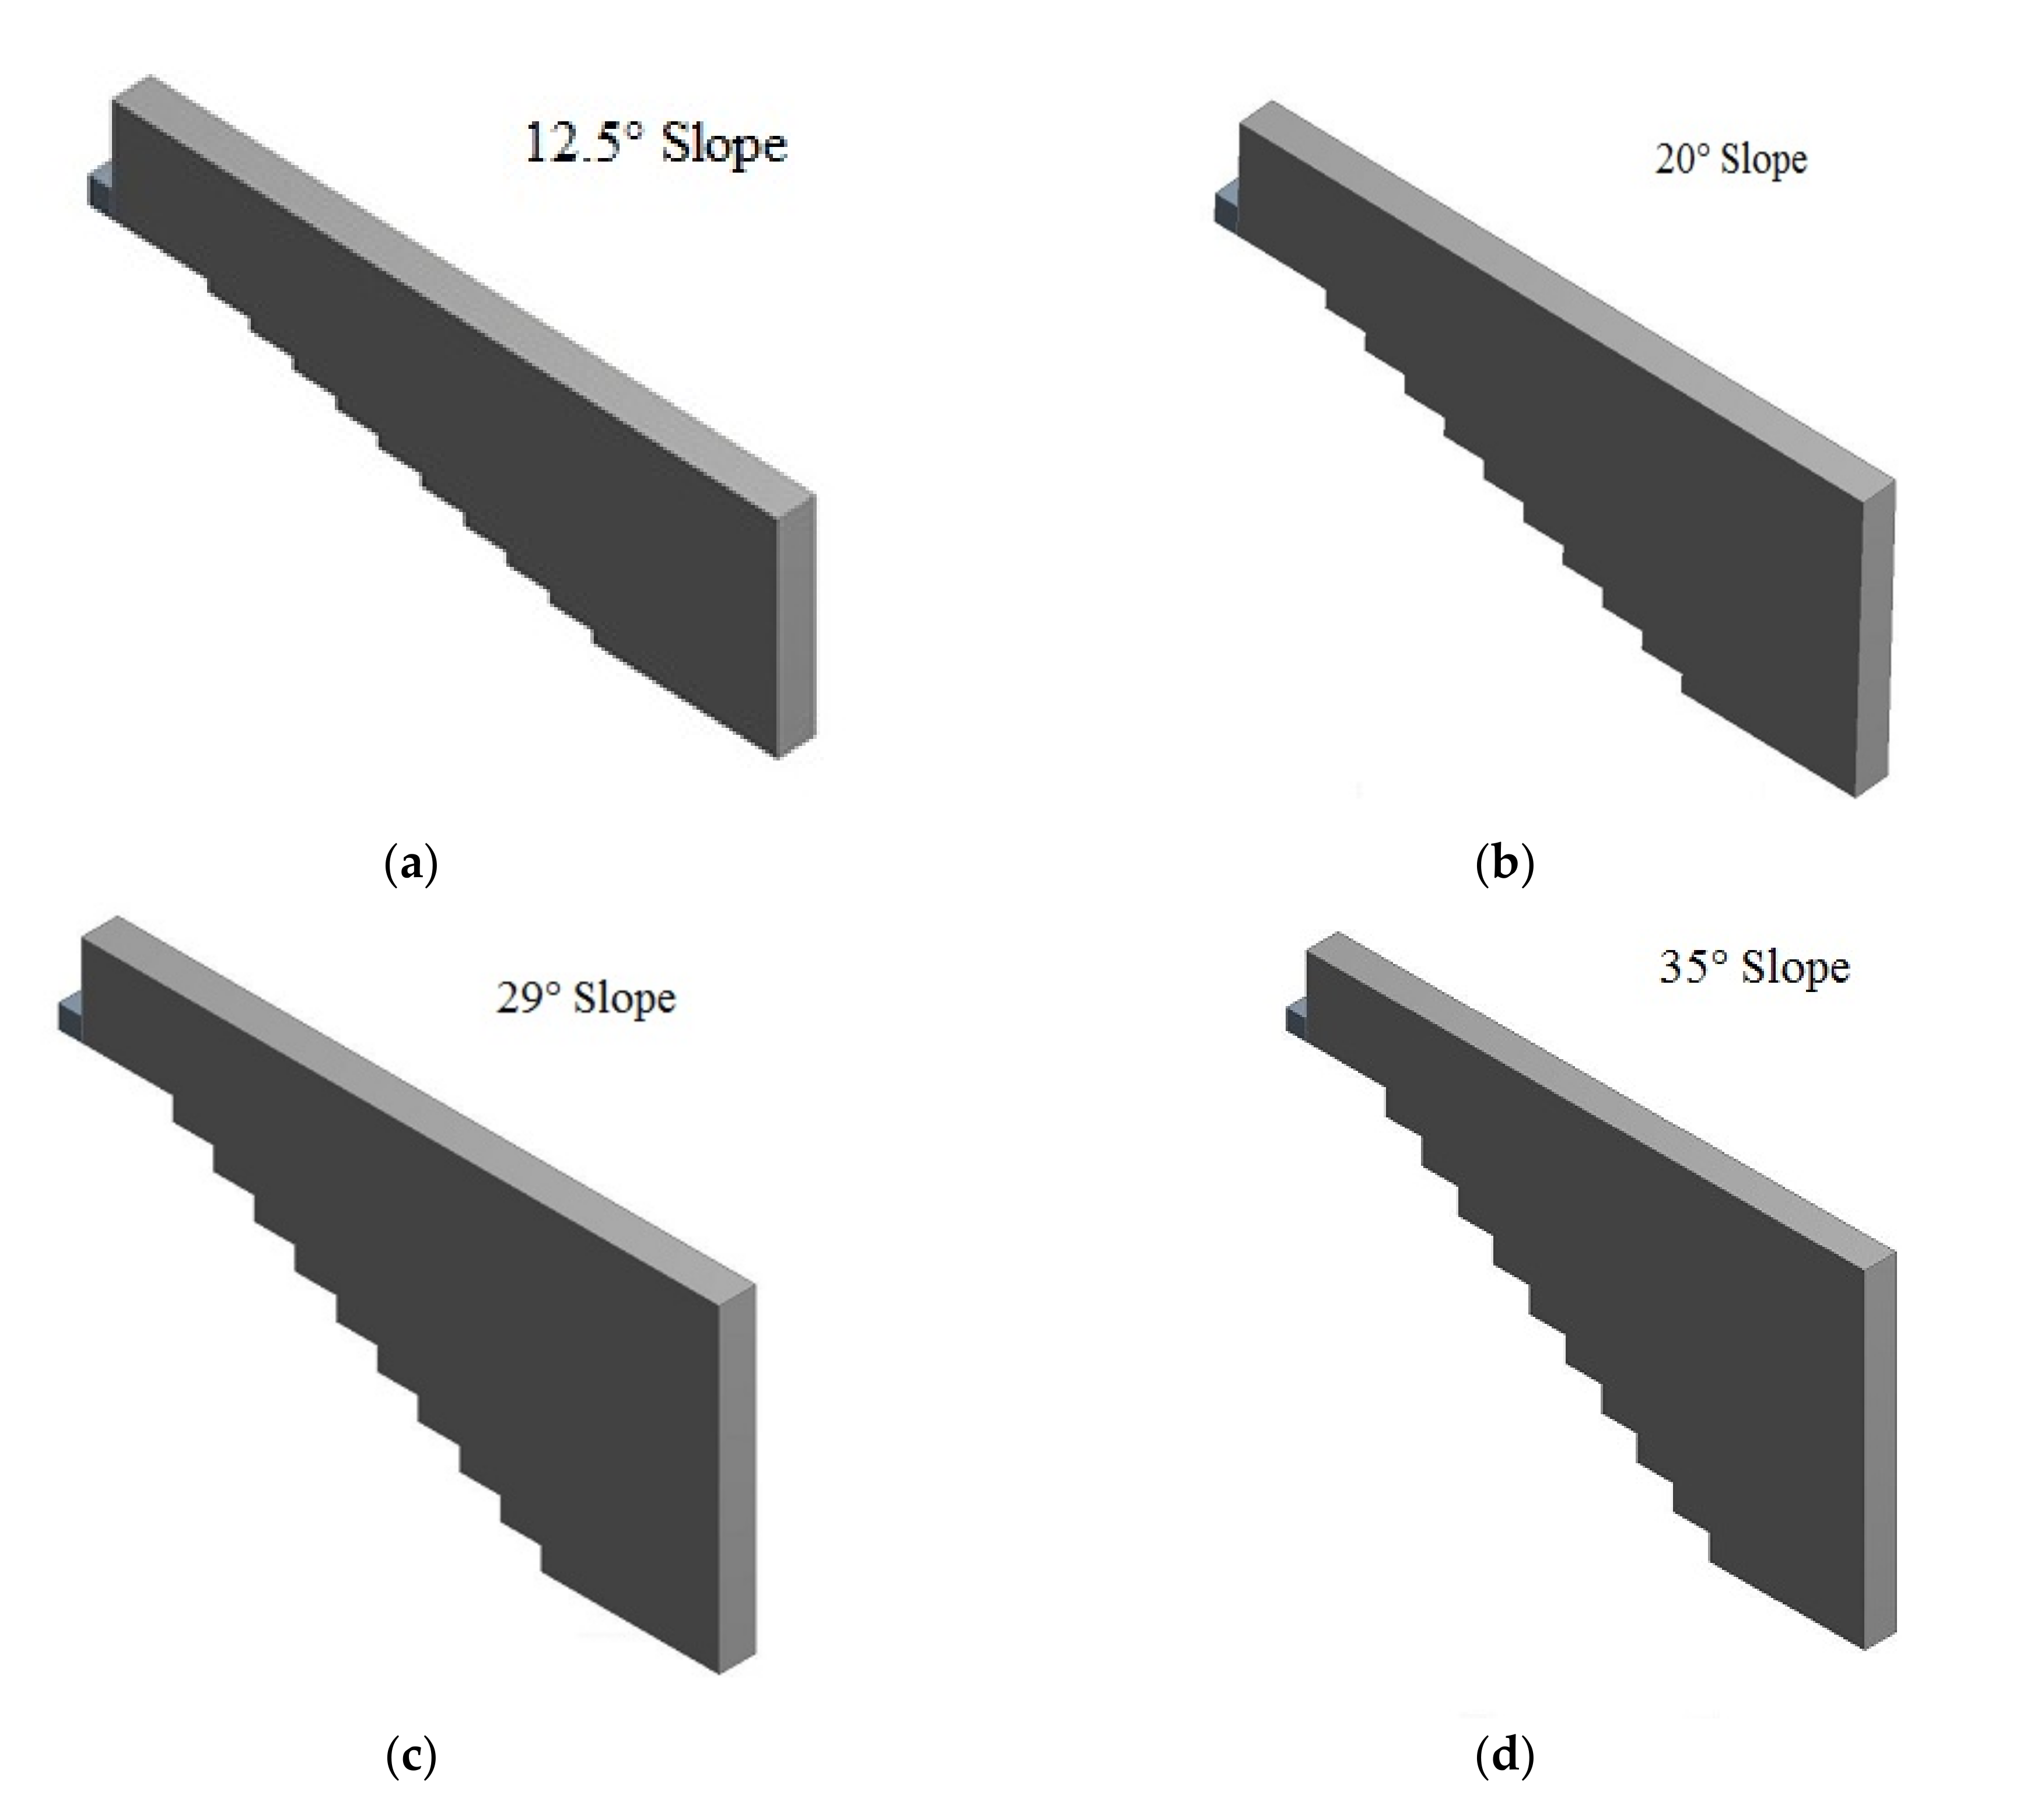
In this paper, four types of stepped spillways are numerically simulated by using Fluent software. The stepped spillways vary from mild to steep slopes. All four stepped spillways which are represented in Figure 2 are simulated by using the multiphase volume of fluid (VOF) method and realizable k-ϵ turbulent model. Different multiphase models are used such as the mixture and Eulerian models. Still, the volume of fluid (VOF) is the best for following the boundary layer in the stepped spillways from the literature. In numerical modeling, SIMPLE is used to couple the pressure and velocity. The SIMPLE algorithm is used for transient simulation because, in this case, simulation is transient, so we use the SIMPLE process for velocity-pressure coupling Second order upwind and first order upwind schemes used for momentum and turbulent kinetic energy dissipation rate and pressure staggered option (PRESTO) are used. A numerical model of stepped spillway consists of three steps spillways which vary in channel slope (12.5°, 19°, 29°, and 35°). The details of all four stepped spillway models are described in Table 1. The channel width is 0.4 m. The entire stepped spillway model has the same steps. The steps of the spillways varying in length and height in all four models to change the slope of the spillway are shown in Figure 2.
2.1. Mesh Gridance
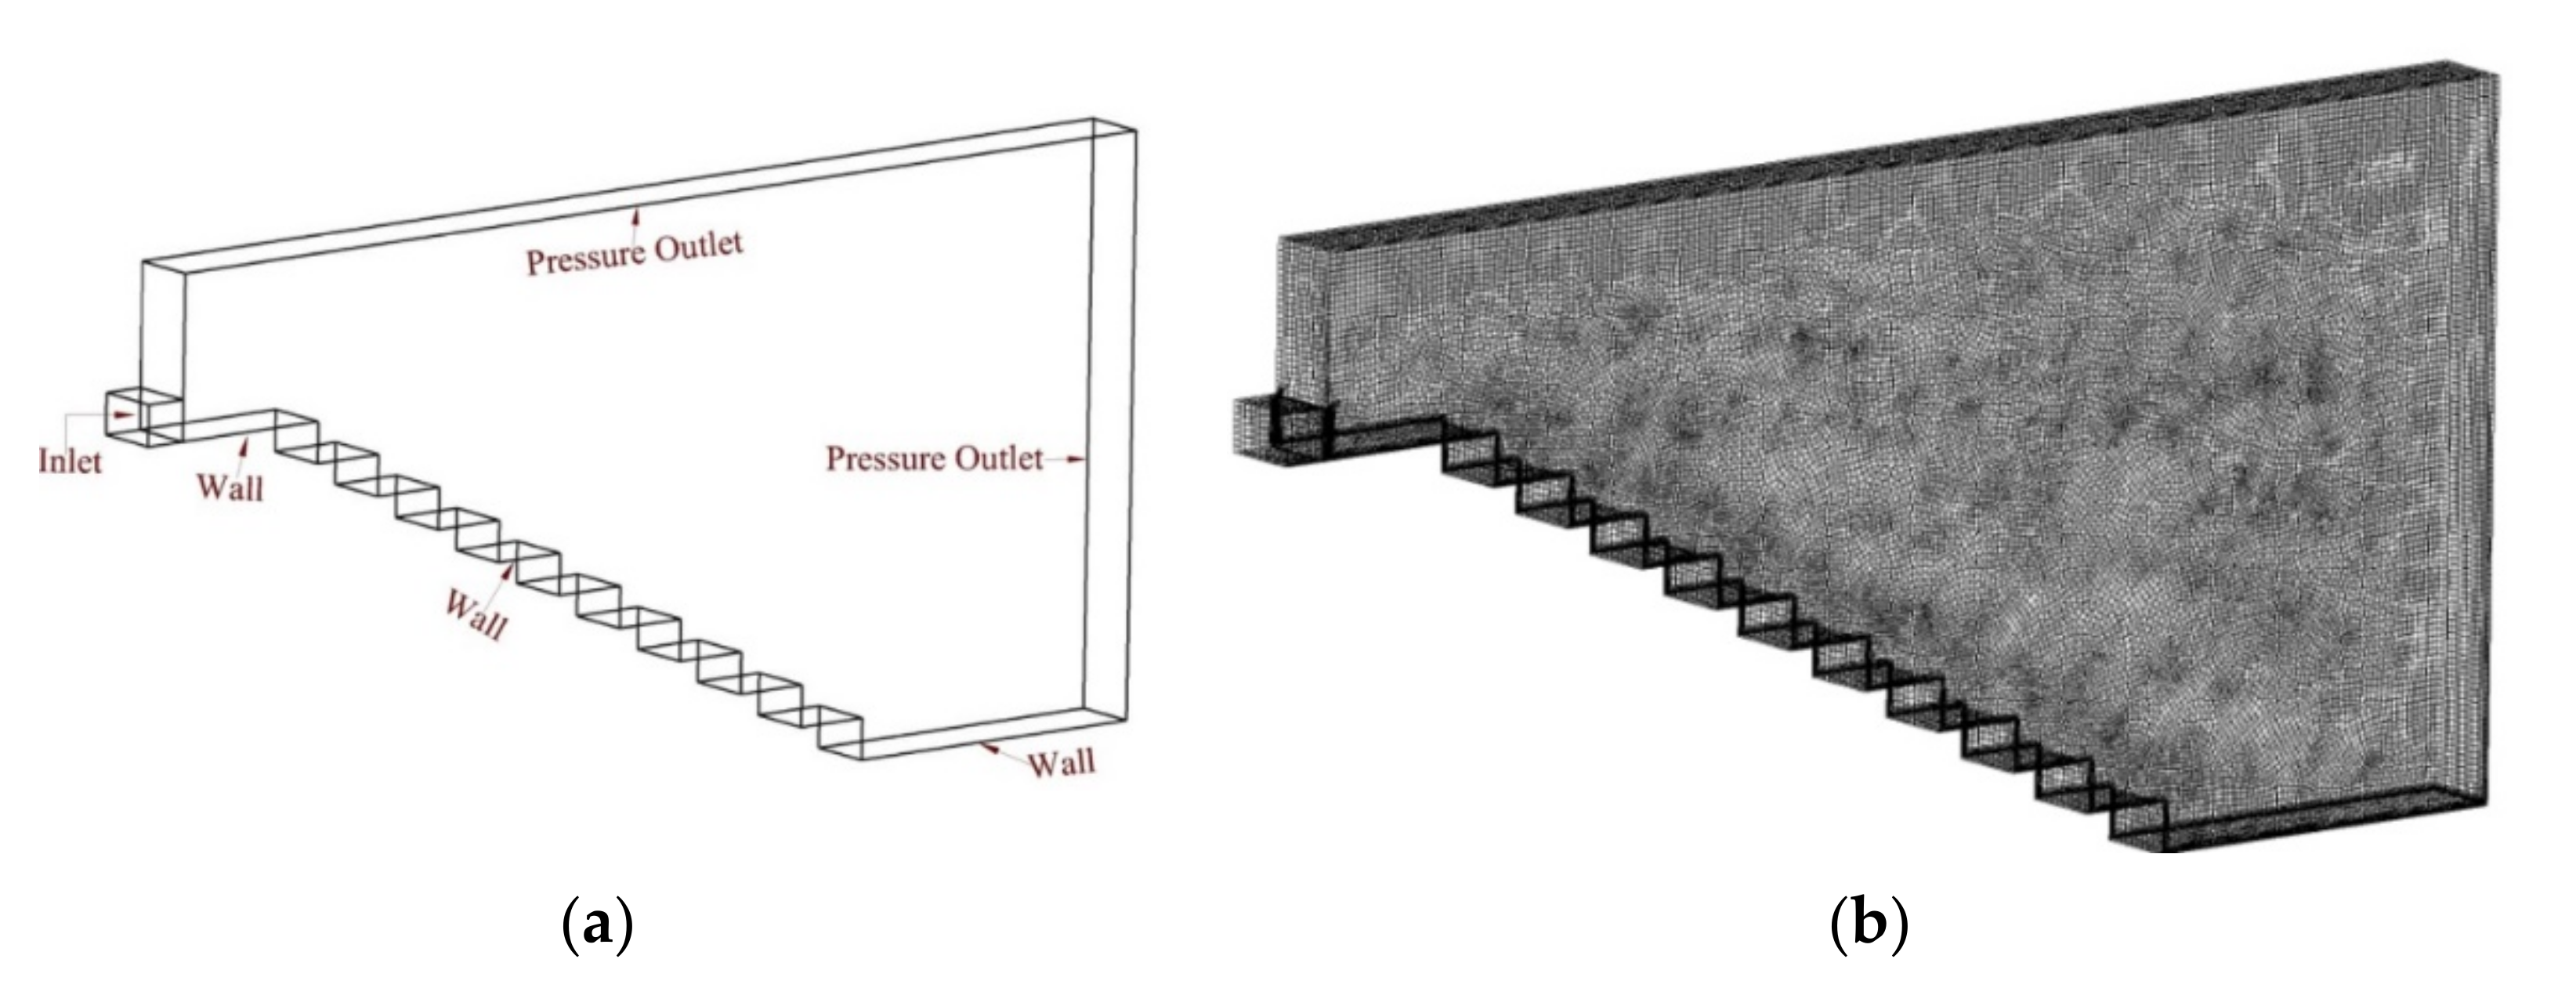
Very fine mesh was applied to achieve good results during the simulation. The number of mesh elements was 287,529 and the number of nodes was 317,868. Ansys, ICEM, meshing software, Canonsburg, USA, as used for meshing. Unstructured grid meshing was applied with high smoothing with a minimum size of 0.001 m. Ten inflation layers were applied along the steps to get better results near the steps. The application of inflation layers was used to help study flow results near the steps. Figure 3 represents the boundary conditions, and the overall view of the mesh used for the computation of models.
2.2. Boundary Conditions
2.2.1. Inlet Boundary
The inlet of stepped spillway models consists of a velocity inlet. The velocity of the stepped spillway varies according to the discharge rate. The velocity applied at the stepped spillways depends upon discharge. The greater the discharge the greater the amount of velocity applied at the inlet.
2.2.2. Outlet Boundary
The outlet of stepped spillways is the pressure outlet with the conditioned that there is no backwater flow from the outlet. The value of backwater flow from the outlet is zero.
2.3. Walls
Walls of the stepped spillway are considered as stationary walls with no-slip velocity. So these are considered as stationary walls.
2.4. Volume of Fluid
Volume of fluid depends upon the multiphase theory, and this model was given by Hirt and Nichols in 1981. The volume of fluid is designed for two liquids, and it is not designed for multi-fluids. Therefore, for air and water, a single set of equations is mutual for both air and water, and the volume fraction of both fluids in equally computational cells is traced all over the domain. In each of the cells throughout the domain, the totality of the volume fraction of air and water is equal to unity. So, for that purpose, an extra variable, which is the volume fraction of air and water is introduced. donates the volume part of water and αa denotes the volume part of air in Equation (1).
VOF measures the volume percentage of air and water at each part. The grounds of variables are joint by air and water, and these signify the volume around values. These variables are either representative of water or air or a mixture of them, and it depends upon their volume fraction values. The interface between air and water is completed through solving the continuity equation, which is in the following method.
In a particular equation, the unit value indicates that the cell is full of water, and if the value of = 0 it demonstrates that the cell is full of air and if the value lies between 0 and 1 it indicates that there must be a free surface between water and air. The geometric restoration arrangement is used to control the place of the free surface. It signifies the interface by using a piecewise-linear method that represents the boundary between air and water as a right slope within both cells. This linear shape is used for the calculation of the advection of fluid.
The terminologies of density and molecular viscosity are properties of volume fraction, and these are not constant, and they depend upon the volume fraction of water. These can be determined by each cell by the following equations.
where and are the density of air and water and and are the molecular viscosity of air and water. By iterating the solution of the volume fraction of water, the values of and can be calculated.
2.5. Turbulence Model
The realizable k-ϵ model developed by Shih et al. [46] is different from the standard k-ϵ model in these features. A variable for the coefficient of uniformity is introduced called and is used in the turbulent viscosity method to satisfy the scientific limitations in the Reynolds stresses, which is related to the physics of the turbulent flows. A different equation of dissipation rate was introduced, which is constructed upon the dynamic equation of average square vortices fluctuation. In this equation, the production term is not involved, and the destruction term does not have any uniqueness. The realizable k-ϵ model executes better with respect to standard k-ϵ in the following aspects when the flow features include strong streamlines twists, turning, and vortices. Because flow over stepped spillways are highly turbulent and include vortices beneath the pseudo-bottom, to better study the turbulence, rotation, and vortices the realizable k-ϵ model is used in this paper. The equations for turbulent kinetic energy and dissipation rate k, ϵ used in realizable k-ϵ are the following.
3. Results and Discussions
In this paper, four different stepped spillway models with different slopes varying from mild slopes to steep slopes were simulated using the volume of fluid (VOF) and k-ϵ realizable models in order to calculate the inception point location and length of the non-aerated flow zone, and how the inception points’ location and length of non-aerated flow zone vary with the channel slope of the stepped spillway. To this end, four stepped spillways with slopes of 12.5°, 19°, 29°, and 35° were simulated at different discharge rates (0.625, 0.75, 0.875, and 1).
3.1. The Commencement of the Skimming Flow Regime
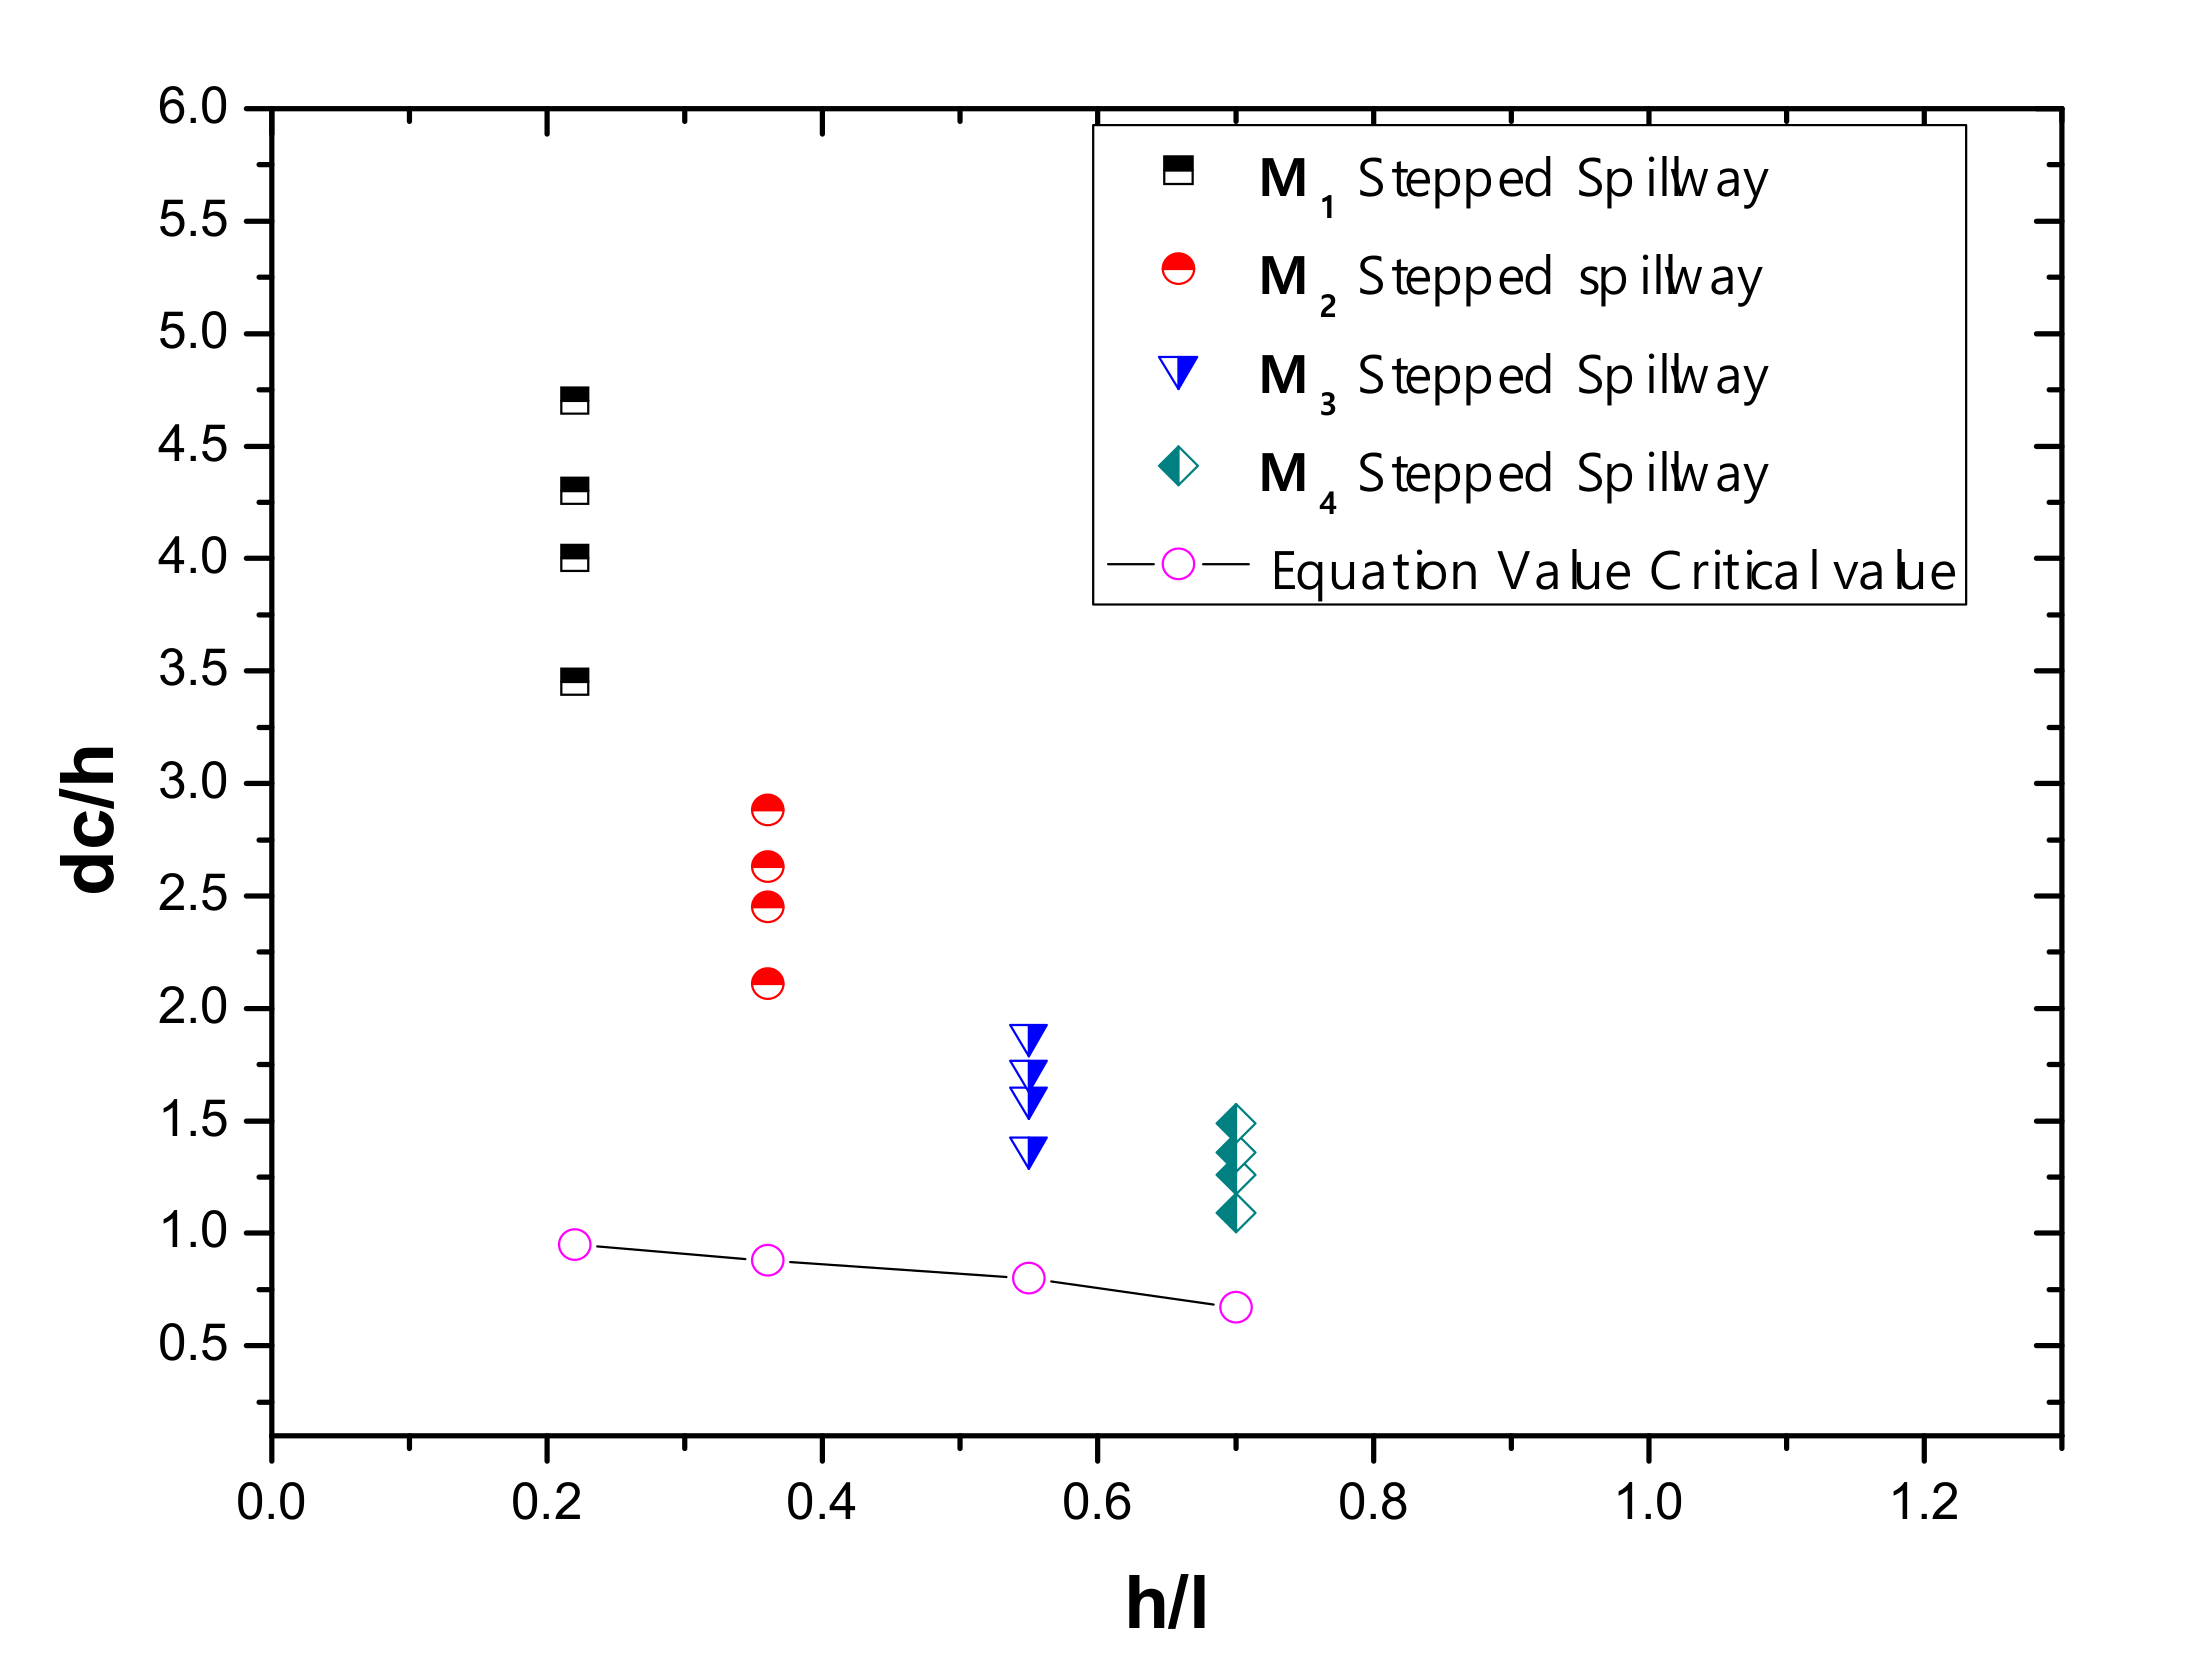
The skimming flow regime in the stepped spillway depends upon flow rate, step height, and step length. For all discharges to determine the skimming flow regime, the discharge value should be larger than the critical value. Chanson, in 1994, determined the onset of skimming flow by developing an equation to find the critical value. The condition for the skimming flow is the dc/h > . In this paper, all the discharge values in all stepped spillways models drop in the condition of the skimming flow regime.
where h is the height of step, l is the length of step and is the critical depth value in Figure 4. For this equation the condition of should be in the range of 0.2 to 1.3. represents the variation of relative critical depth with values of all four stepped spillway models with the critical value determined by the equation. As seen in the graph, it is indicated that all the values are greater than the critical values, so the skimming flow regime has occurred for all the conditions.
3.2. Effect of Channel Slope on Inception Point Location
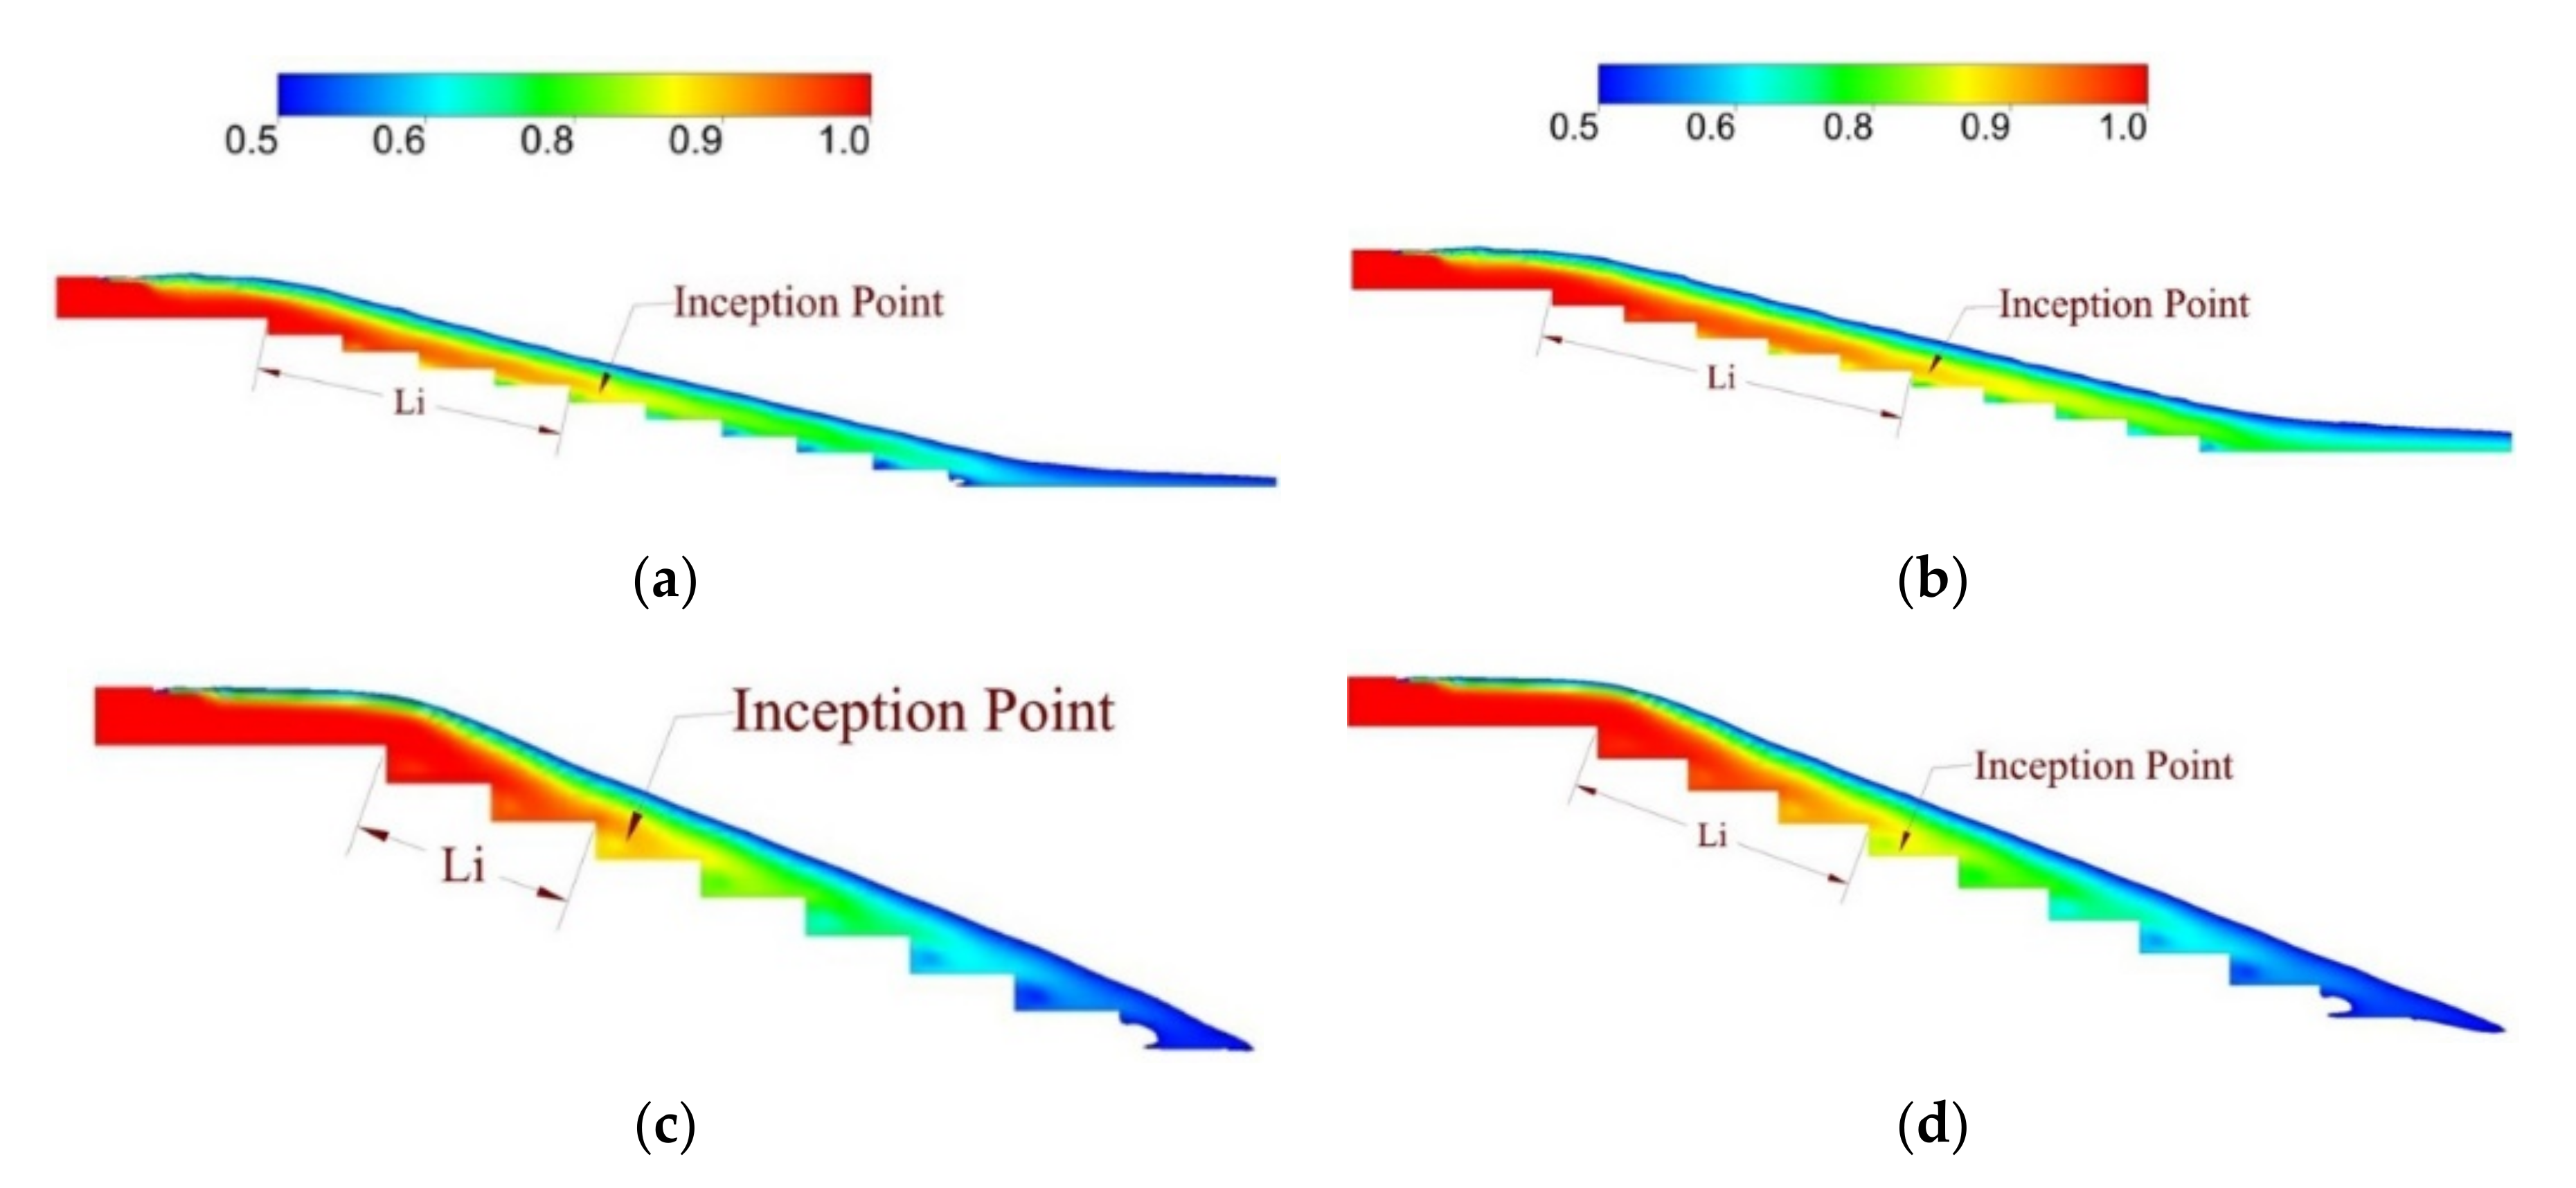
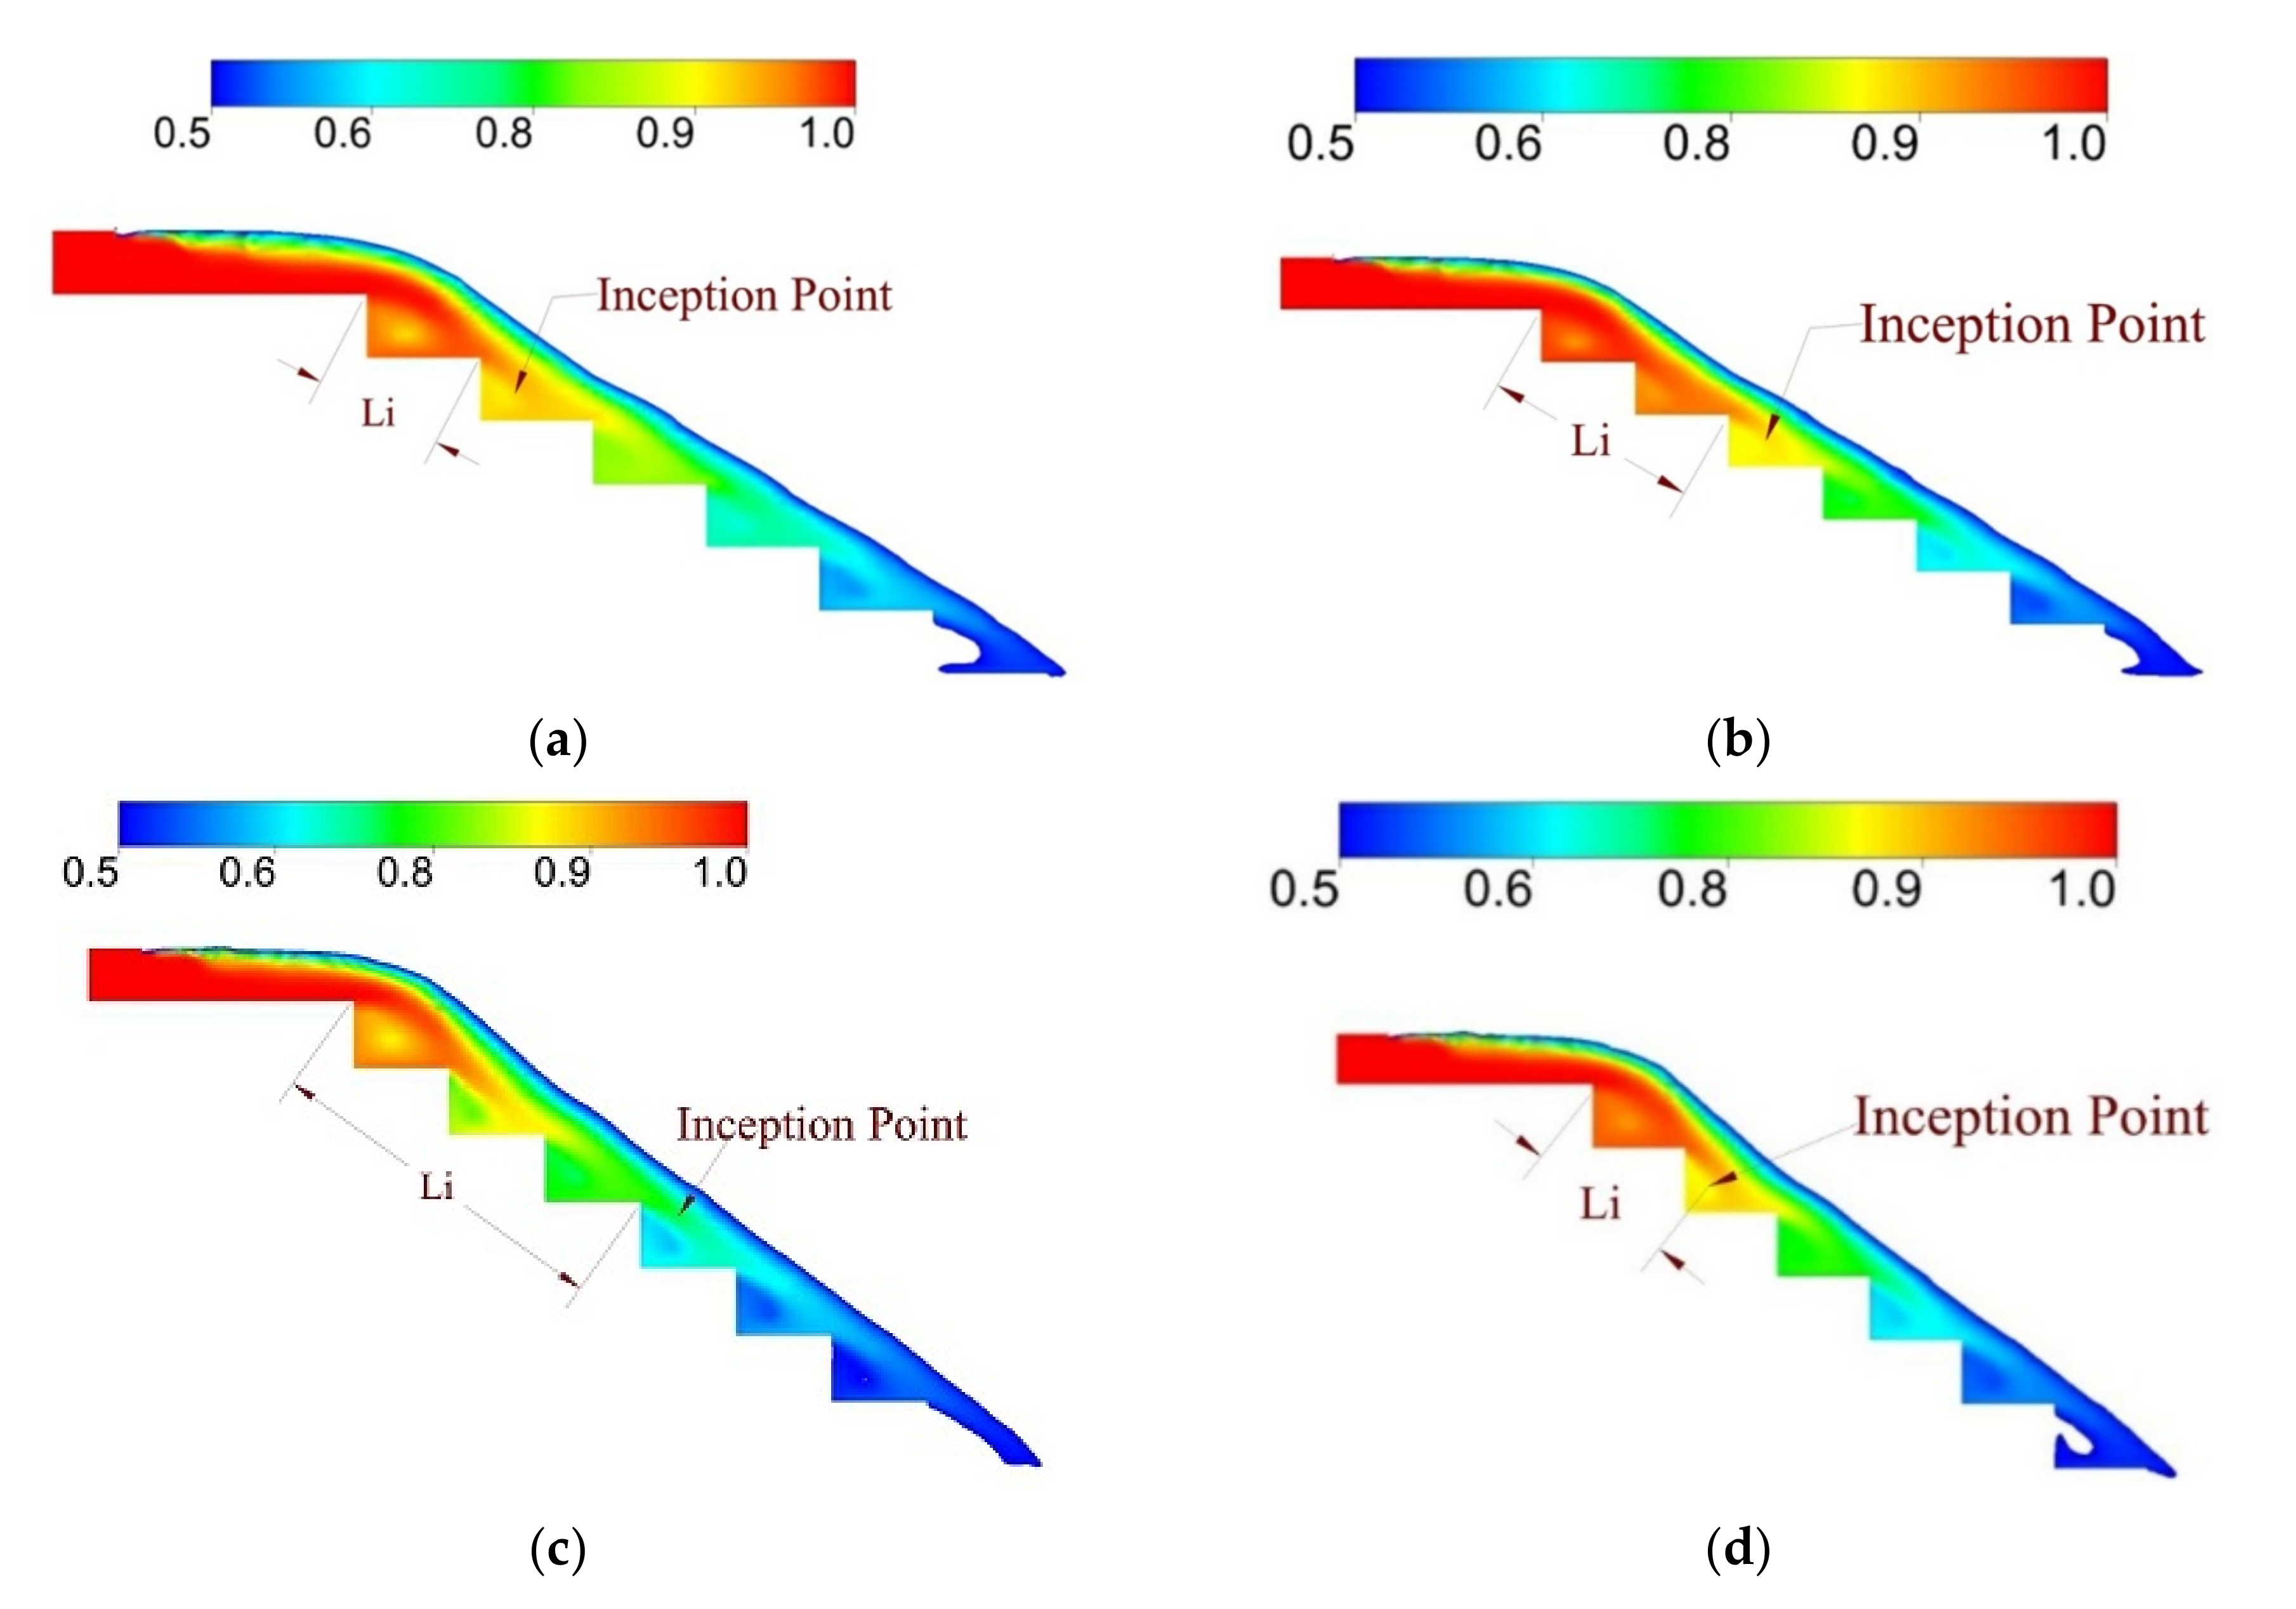
The channel slope of stepped spillways plays an important role during a spillway construction. Slope of the stepped spillway is a very important parameter for calculating the inception point location and non-aerated flow zone length. The inception point location moves upward as the spillway slope increases, and the size of the non-aerated flow zone is decreased as the spillway slope is increased for all the discharges. Figure 5 and Figure 6 represent the water volume fraction contours of 12.5°, 20°, 29°, and 35° at different discharge rates.
The change of non-aerated flow zone length of all models with channel slope, surface roughness, and Froude surface roughness are listed in Table 2. The surface roughness of the stepped spillway depends upon the step height and channel slope. A greater step height and channel slope increased the surface roughness of the stepped spillway. The Froude number is described on the basis of surface roughness height ks, unit discharge q, gravitational acceleration g, and step height h. The formula for the Froude number and surface roughness is described in the Equation (8).
where .
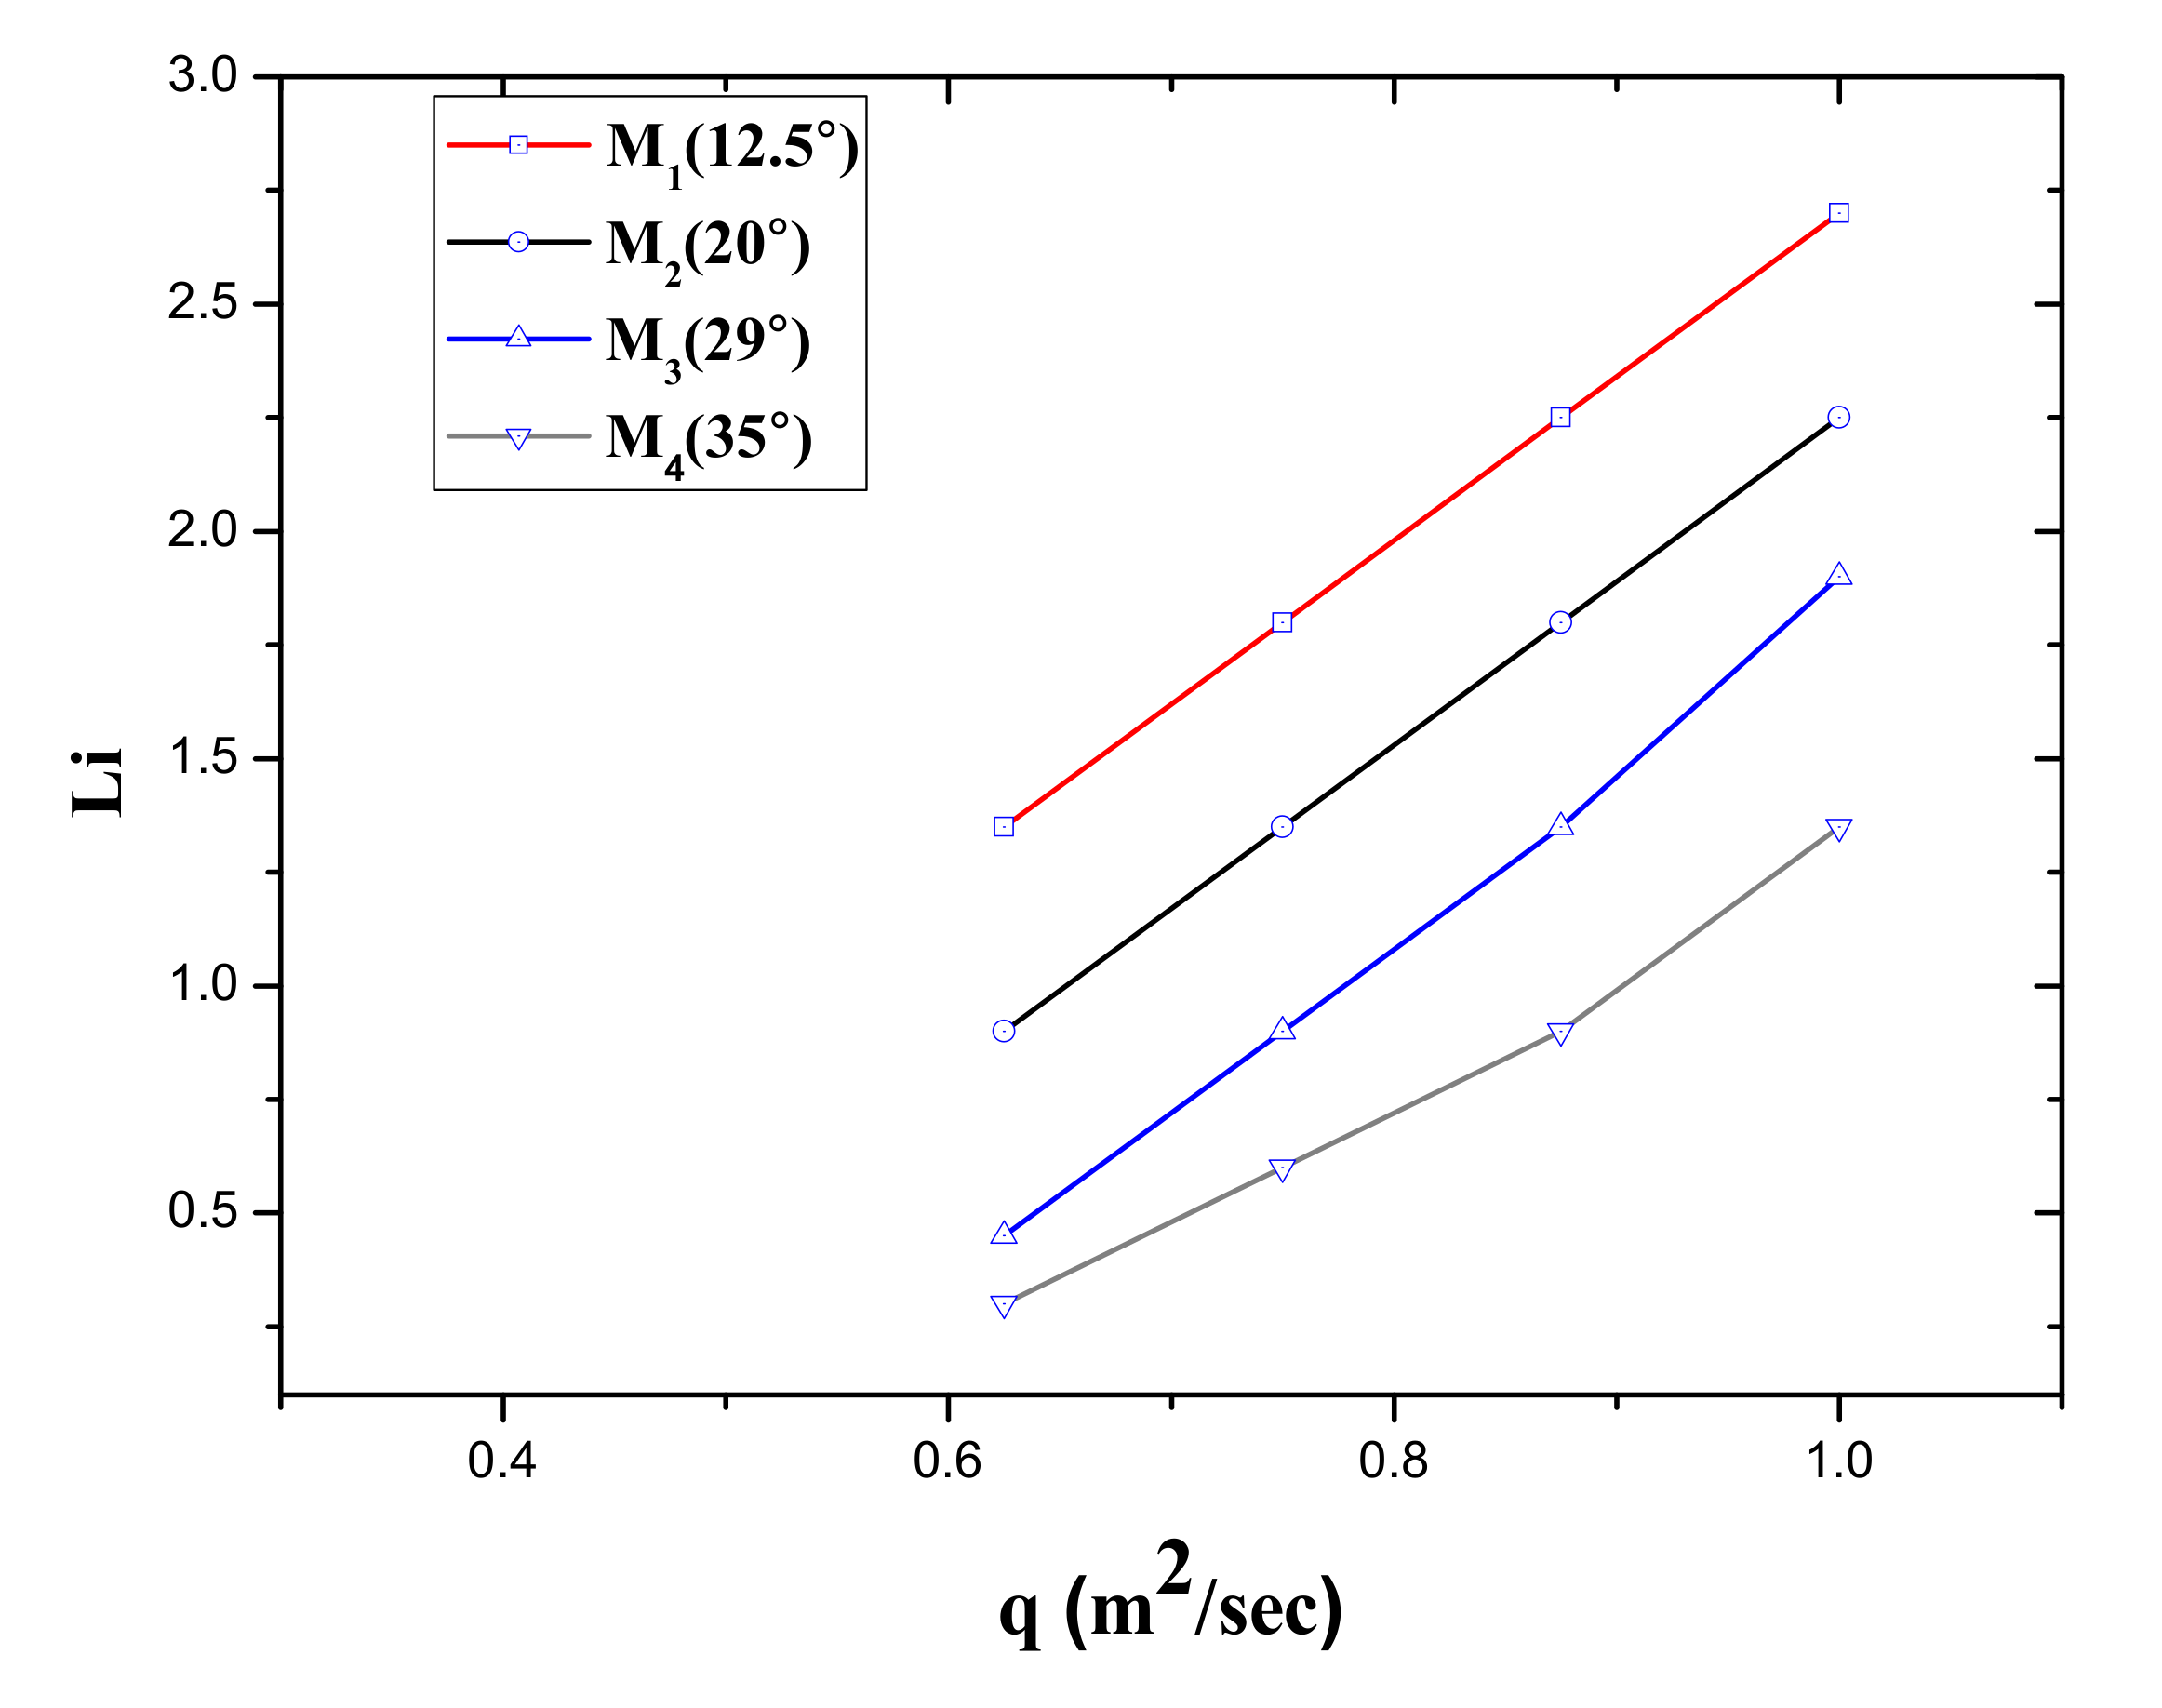
The variation of space from spillway top to the inception point (Li) with discharge (q) is shown in Figure 7. With the increase in unit discharge (q) the distance of inception point Li increases in all stepped spillways models, varying with the channel slope. However, Li is decreased with the increase of the channel slope under the same discharge value. This indicates that a high channel slope has less non-aerated flow zone under constant discharge value.
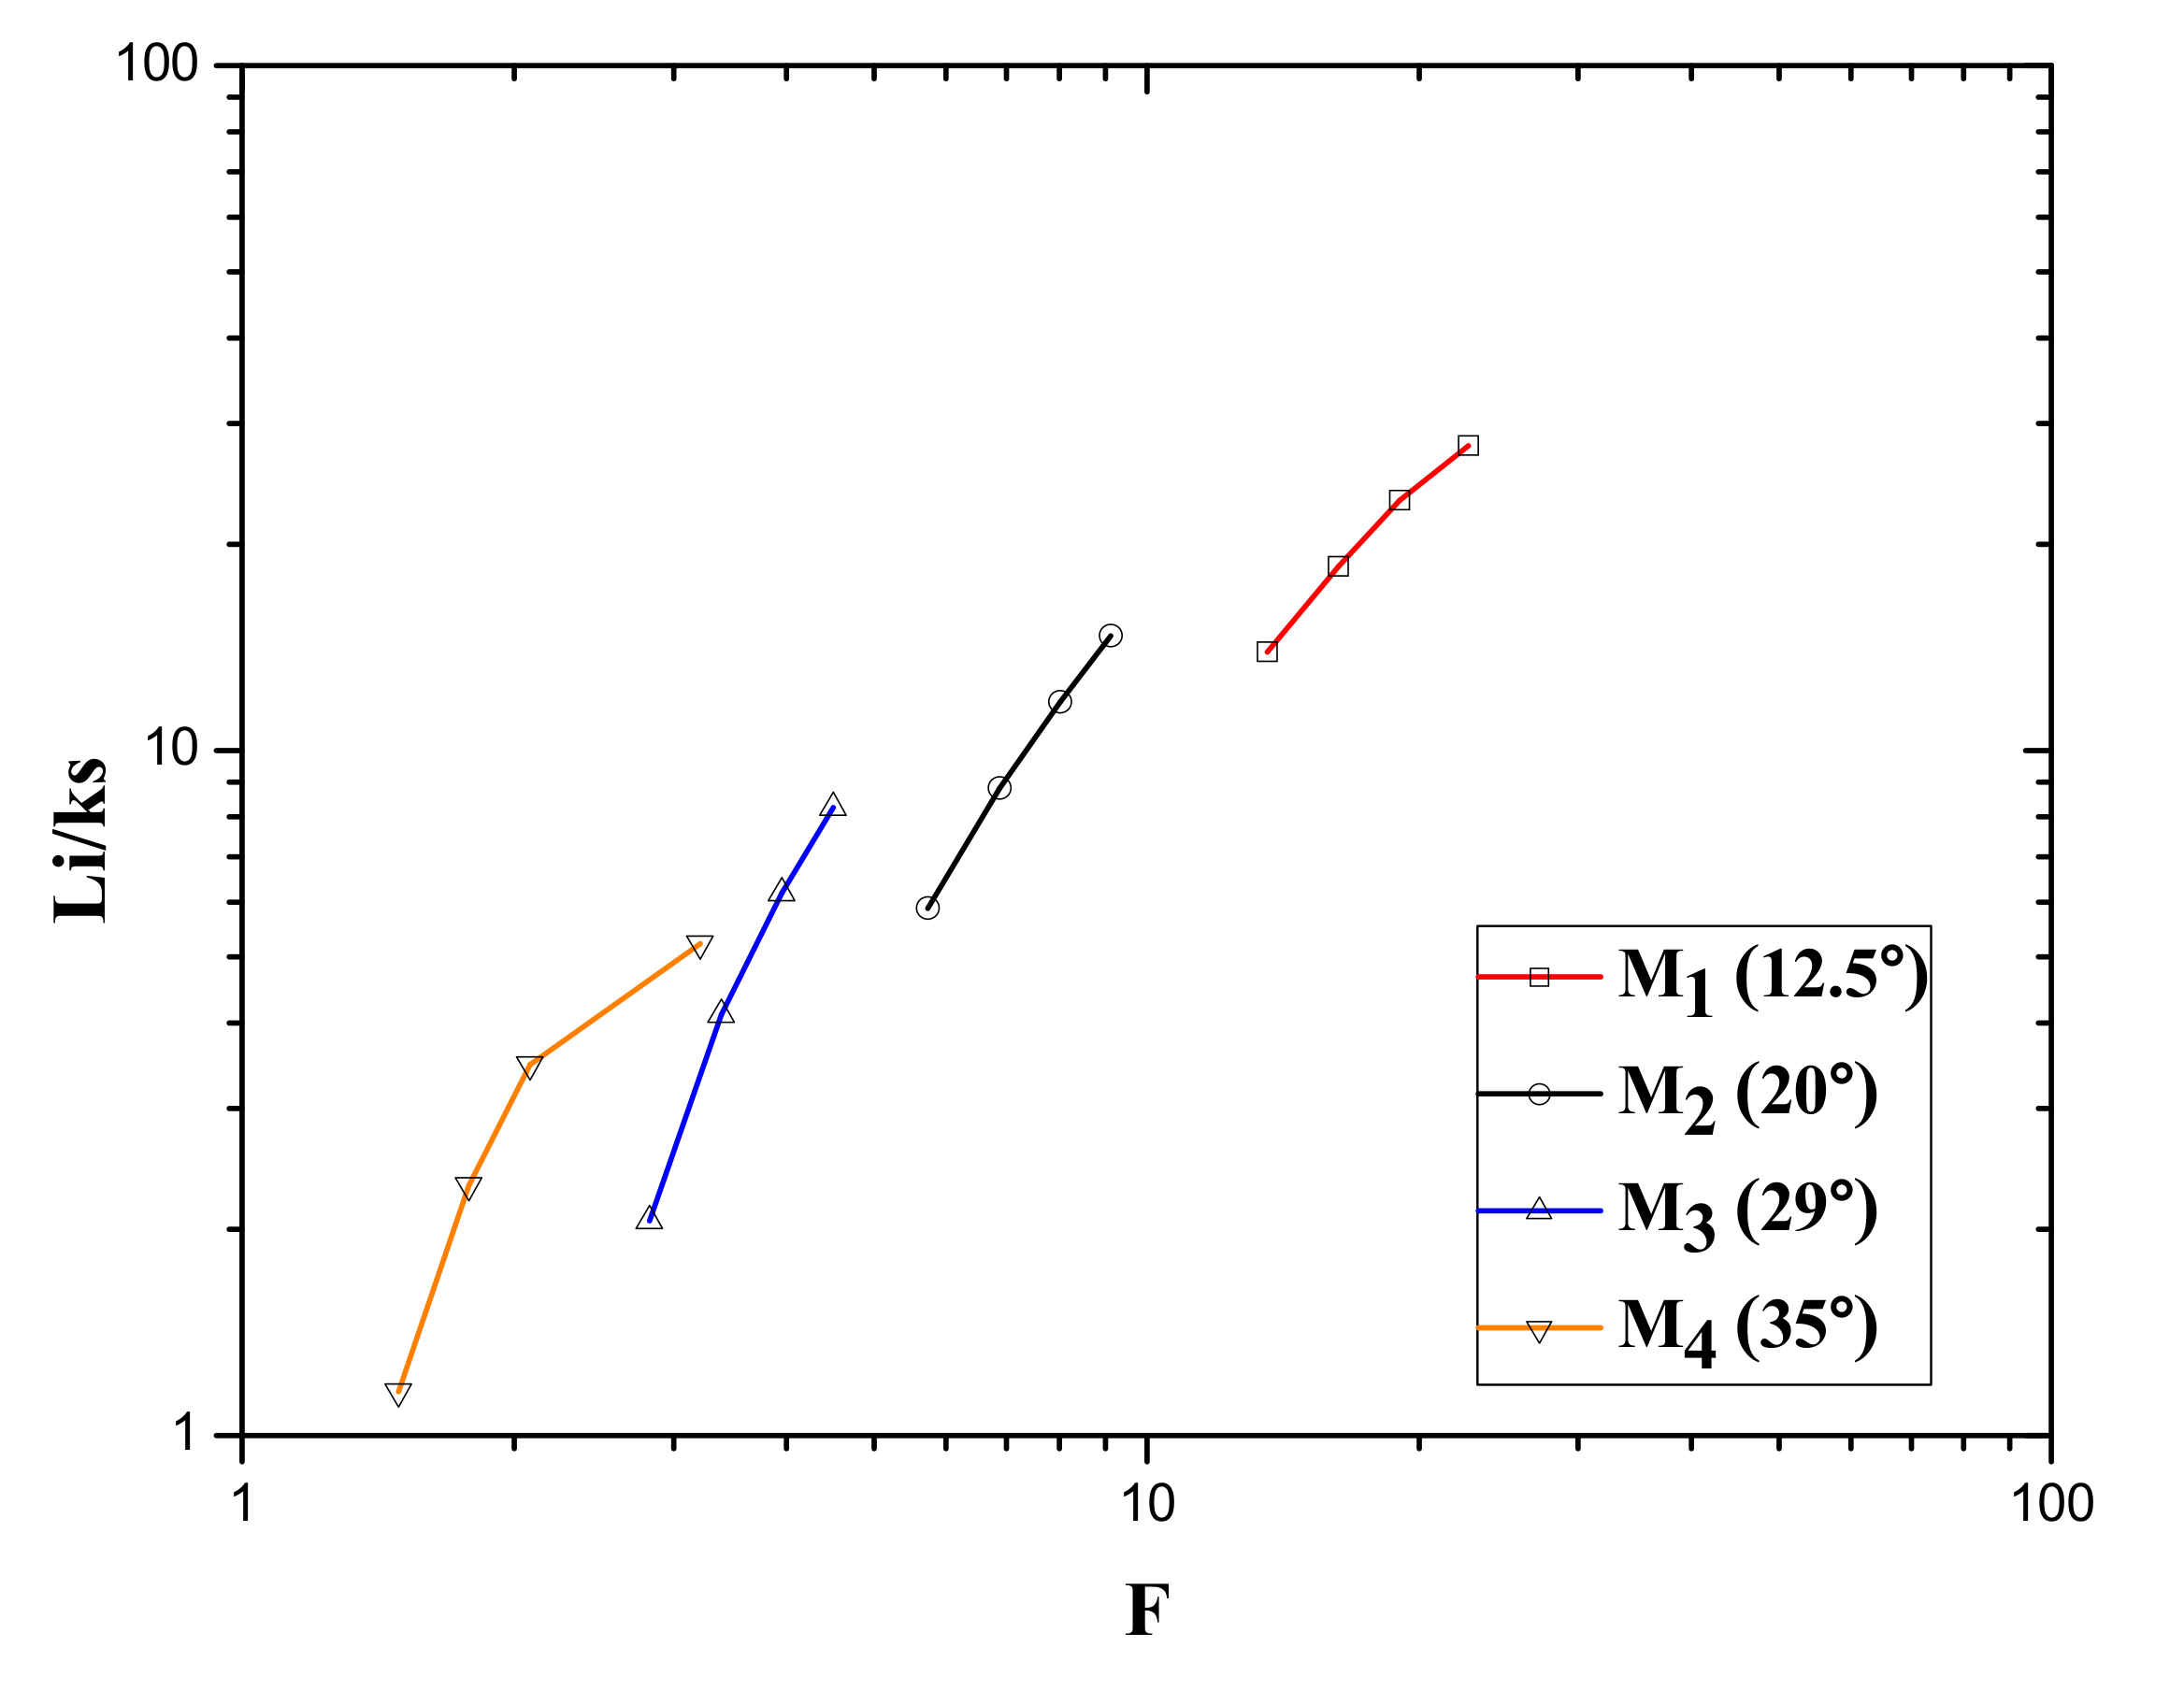
The relationship between the Li and Froude number (F) is described in Figure 8. With the decrease in slope, the Froude number increases at the same discharge value, and with the increase in discharge value the Froude number also increases. So from the figure, it is clear that with the increase in Froude number, Li increases. For smallest value of Li there is a measure of smallest value of Froude number (F).
Li/ks is the normalized distance from the crest of the spillway to the inception point. It is the ratio of Li to the surface roughness ks. Variation of normalized Li with Froude number is shown in Figure 8. The normalized Li is decreased with the increase in surface roughness ks. So normalized Li has a direct relation with the Froude number, Li/ks increases with the rise in the Froude number. The minimum value of Li/ks is shown at the minimum Froude number.
3.3. Variation of Inception Length with Critical Depth
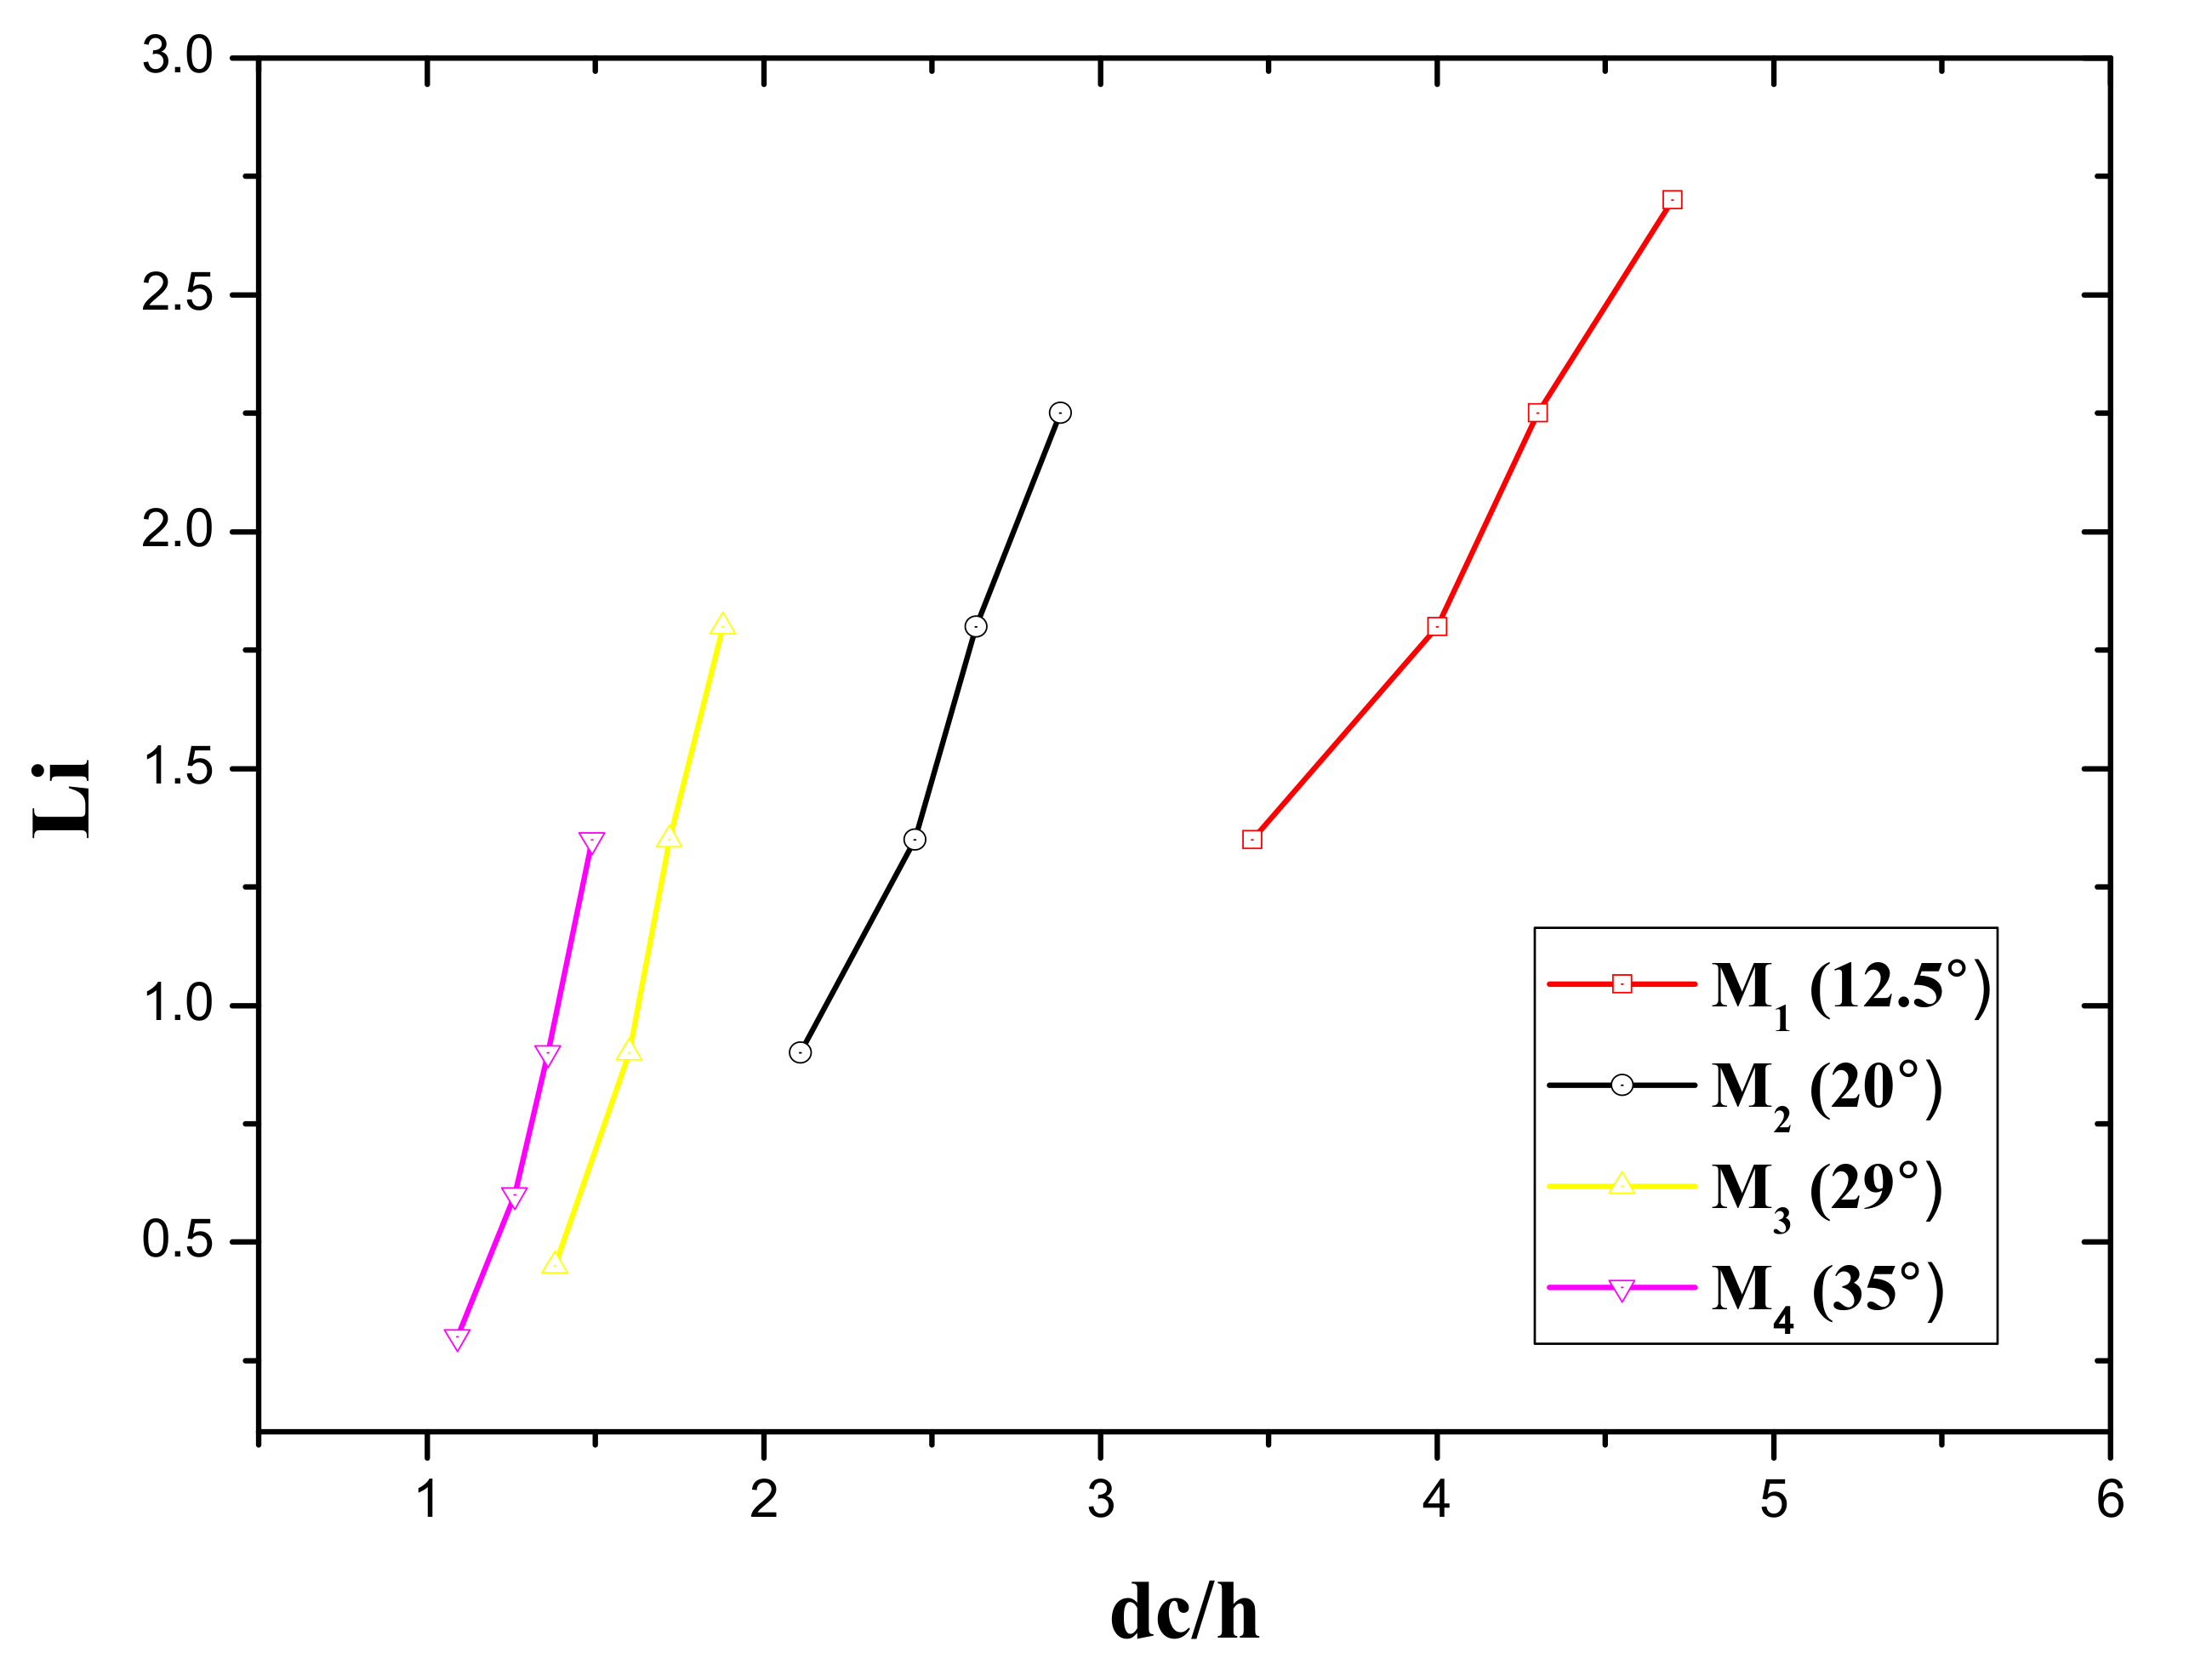
Critical depth (dc) is the depth of flow where energy is minimum for a specific discharge value, for every discharge value there is a unique value of critical depth which can be determined by the formula of which means that with the increase in discharge, the value of critical depth increases. Relative flow depth ( is the quotient of critical flow depth to the step height. Summary of critical depth (dc), relative critical depth (), and () are illustrated in Table 3. With the increase in step height, the relative flow depth is decreased at the same discharge value. Figure 9 illustrates the relationship between relative flow depths to Li. With the increased value of relative flow depth, Li increases for all stepped spillway models. Relative flow depth, which indicates that at lower channel slope value of relative flow depth, is increased, and the span of non-aerated flow zone is also increased.
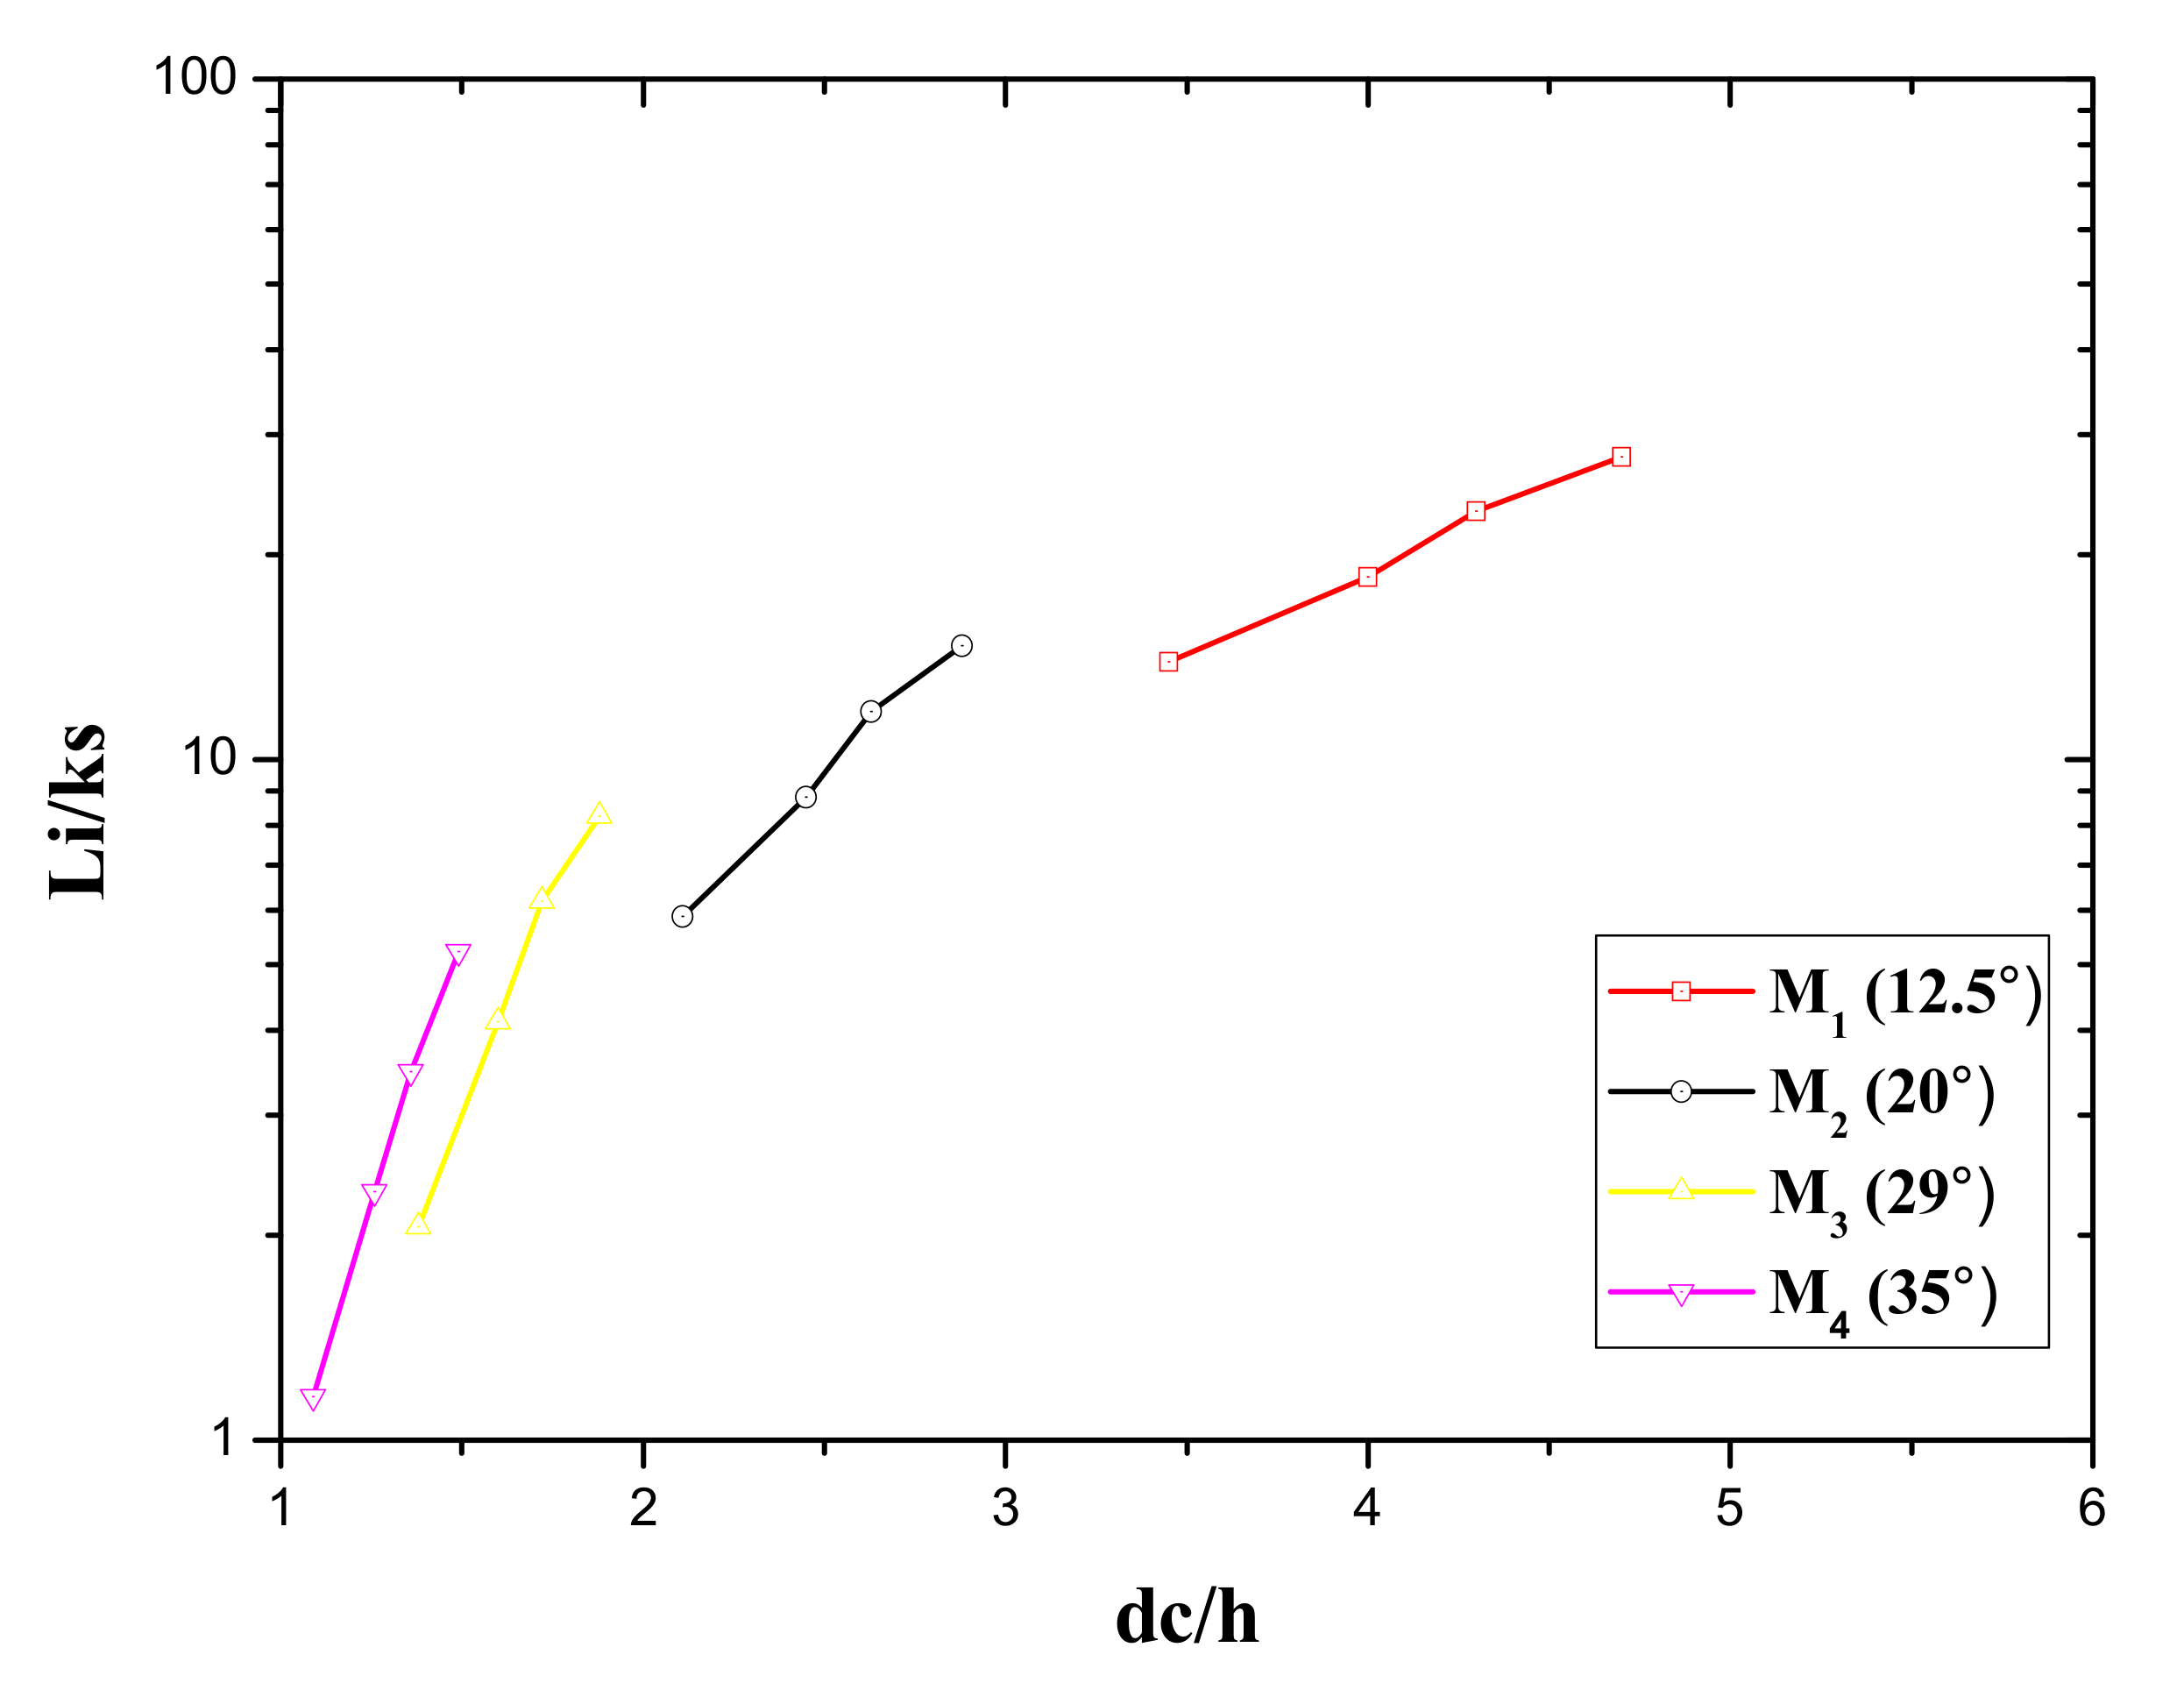
Figure 10 illustrates the relationship between the () and relative flow depth (). The normalized Li increases with the increase in relative flow depth in all four stepped spillway models. The maximum value of normalized Li is observed at the maximum relative critical depth with a minimum slope of 12.5°.
4. Conclusions
Four different stepped spillway models with different slopes varying from mild slopes to steep slopes were simulated using VOF and k-ϵ realizable models to calculate the inception point location and span of the non-aerated flow zone.
An increase of flow rate of a slope of a stepped spillway might prompt the cause of the skimming flow regime. The skimming flow regime in the stepped spillway depends upon the discharge, step height, and step length. For all discharges to determine the skimming flow regime, the discharge value should be larger than critical value.
Location of air entrainment (inception point) moves downward as the discharge rate increases, and the span of non-aerated flow zone Li rises with the increase in discharge in all four models of stepped spillways.
With the increase of slope from mild to steep slope the start of air entrainment is close to the crest, and the inception point moves toward the crest as the slope of the stepped spillway increases.
The normalized Li decreases with the increase in surface roughness ks. So normalized Li has a direct relationship with the Froude number, Li/ks increases with the increase in the Froude number. The minimum value of Li/ks is shown at the minimum Froude number.
Critical depth (dc) is the depth of the flow where the increase in discharge causes depth to increase. The length of the non-aerated flow zone Li has a direct relationship with the critical depth, with the increase in critical depth the Li increases in all the slope channels of stepped spillways.
Relative flow depth is the quotient of critical depth to step height. Relative flow depth indicates that at lower channel slope values the relative flow depth increases and the length of non-aerated flow zone also increases.
Author Contributions
Conceptualization, A.R. and W.W.; methodology, A.R.; validation, A.R. and K.M.; formal analysis, A.R.; investigation, A.R.; resources, W.W.; writing—original draft preparation, A.R.; writing—review and editing, W.W. and K.M.; visualization, A.R. and K.M.; supervision, W.W.; funding acquisition, W.W. All authors have read and agreed to the published version of the manuscript.
Funding
This research was funded by the National Key R&D Program of China, 2018YFC0407203 and the National Natural Science Foundation of China, 51779216, 52079122.
Institutional Review Board Statement
Not applicable.
Informed Consent Statement
Not applicable.
Data Availability Statement
The data and materials that support the findings of this research are available from the corresponding author upon reasonable request.
Conflicts of Interest
The authors declare no conflict of interest.
Nomenclature
| model constant (4.04) | |
| model constant () | |
| B | width of the step (m) |
| 1.9 (model constant) | |
| 1.44 (model constant) | |
| coefficient of uniformity | |
| F | Froude surface roughness |
| generation of k due to buoyancy (kg/(ms3)) | |
| generation of k due to fluid Shear (kg/ms3) | |
| g | gravitational acceleration (m/sec2) |
| h | step height (m) |
| hp | height of Pool (m) |
| k | turbulent kinetic energy (m2/s2) |
| ks | roughness height, ks = hcosθ (m) |
| l | step length (m) |
| lp | length of Pool (m) |
| Li | distance of inception point location from spillway crest (m) |
| normalized distance from spillway crest to Inception Point | |
| M1-M4 | number of stepped spillway model |
| N | number of steps |
| S | modulus of mean rate of tensor |
| source term of kinetic energy () | |
| source term of dissipation rate () | |
| mean rate of deformation | |
| P | pressure in (N/m2) |
| Q | unit discharge (m2/s) |
| R | radius of the edge (m) |
| W | width of the step |
| effect of compressibility on turbulence (kg/ms3) | |
| turbulent prandtl number | |
| turbulent prandtl number | |
| velocity in direction (m/s) | |
| velocity in direction (m/s) | |
| volume fraction of air (%) | |
| volume fraction of water (%) | |
| turbulent dissipation rate (m2/s3) | |
| θ | spillway slope (°) |
| molecular dynamic viscosity (kg/ms) | |
| turbulent dynamic viscosity (kg/ms) | |
| cell density (kg/m3) | |
| density of air (kg/m3) | |
| density of water (kg/m3) | |
| t | time in (sec) |
| channel slope (°) | |
| kinematic viscosity (m2/s) | |
| dc | critical depth |
| Relative critical depth | |
| 1.0 (model constant) | |
| 1.2(model constant) |
References
- Chanson, H. Commercial Search Engines, International Databases or Traditional Libraries. J. Hyd. Res. 2005, 43, 85–87. [Google Scholar]
- Amador, A.; Sánchez-Juny, M.; Dolz, J. Hydraulic design of stepped spillways in HCR dams. Water Eng. 2006, 13, 289–302. [Google Scholar]
- Takahashi, M.; Gonzalez, C.A.; Chanson, H. Self-aeration and turbulence in a stepped channel. Int. J. Multiph. Flow 2006, 32, 1370–1385. [Google Scholar] [CrossRef] [Green Version]
- Chamani, M.R. Air inception in skimming flow regime over stepped spillways. In Hydraulics of Stepped Spillways; Minor, H., Ed.; Balkema: Zurich, Switzerland, 2000; pp. 61–67. [Google Scholar]
- Boes, R.M.; Hager, W.H. Two phase flow characteristics of stepped spillway. J. Hyd. Eng. 2003, 129, 661–670. [Google Scholar] [CrossRef]
- Rasmussen, R.E.H. Some experiments on cavitation erosion in water mixed with air. Int. Symp. Cavitation Hydrodyn. 1956, 20, 1–25. [Google Scholar]
- Wilhelms, S.C.; Gulliver, J.S. Bubbles and waves description of self-aerated spillway flow. J. Hydraul. Res. 2005, 43, 522–531. [Google Scholar] [CrossRef]
- Pfister, M.; Hager, W.H.; Minor, H.E. Bottom Aeration of Stepped Spillways. J. Hydraul. Eng. 2006, 132, 850–853. [Google Scholar]
- Amador, A.; Sánchez-Juny, M.; Dolz, J. Characterization of the Nonaerated Flow Region in a Stepped Spillway by PIV. J. Fluids Eng. 2006, 128, 1266–1273. [Google Scholar] [CrossRef] [Green Version]
- Bradley, J.N. Studies of Flow Characteristics, Discharge and Pressures Relative to Submerged Dams; US Department of the Interior, Bureau of Reclamation: Denver, CO, USA, 1945.
- Chanson, H.; Toombes, L. Hydraulics of Stepped Chutes: The Transition Flow. J. Hydraul. Res. 2004, 42, 43–54. [Google Scholar] [CrossRef] [Green Version]
- Matos, J.; Pinheiro, A.N.; Frizell, K.H.; Quintela, A.C. On the Role of Stepped Overlays to Increase Spillway Capacity of Embankment Dams; ICOLD European Symposium (NNCOLD): Geiranger, Norway, 2001; pp. 473–483. [Google Scholar]
- Chanson, H.; Toombes, L. Experimental investigations of air entrainment in transition and skimming flows down a stepped chute. Can. J. Civ. Eng 2002, 29, 145–156. [Google Scholar] [CrossRef] [Green Version]
- Matos, J. Hydraulic design of stepped spillways over RCC dams. In The International Workshop on Hydraulics of Stepped Spillways; Balkema Publication: Zurich, Switzerland, 2000; pp. 187–194. [Google Scholar]
- Christodoulou, G.C. Design of stepped spillways for optimal energy dissipation. Hydropower Dams 1999, 5, 90–93. [Google Scholar]
- Sorensen, R.M. Stepped spillway hydraulic model investigation. J. Hydraul. Eng. 1985, 111, 1461–1472. [Google Scholar] [CrossRef]
- Ohtsu, I.; Yasuda, Y. Characteristics of flow conditions on stepped channels. In Proceedings of the 27th IAHR Congress, San Francisco, CA, USA, 10–15 August 1997; pp. 583–588. [Google Scholar]
- James, C.S.; Matos, J.; Ohtsu, I.; Yasuda, Y.; Takahashi, M.; Tatewar, S.P.; Ingle, R.N.; Porey, P.D.; Chamani, M.R.; Rajaratnam, N. Onset of Skimming Flow on Stepped Spillways. J. Hydraul. Eng. 2001, 127, 519–525. [Google Scholar] [CrossRef]
- Petreka, J.A. The effect of entrained air on cavitation pitting. In Proceedings of the Minnesota International Hydraulics, Minneapolis, MN, USA, 1–4 September 1953; pp. 507–518. [Google Scholar]
- McLean, F.G.; Hansen, K.D. Roller compacted concrete for embankment overtopping protection. In Geotechnial Practice for Dam Rehabilitation; ASCE: New York, NY, USA, 1993. [Google Scholar]
- Chanson, H. The Hydraulics of Stepped Chutes and Spillways; Balkema: Lisse, The Netherlands, 2001; p. 418. [Google Scholar]
- Carosi, G.; Chanson, H. Turbulence characteristics in skimming flows on stepped spillways. Can. J. Civ. Eng. 2008, 35, 865–880. [Google Scholar] [CrossRef]
- Wood, I.R.; Ackers, P.; Loveless, J. General method of critical point prediction on spillways. J. Hyd. Eng. 1983, 109, 308–312. [Google Scholar] [CrossRef]
- Causon, D.M.; Mingham, C.G.; Ingram, D.M. Advances in calculation methods for supercritical flow in spillway channels. J. Hydraul. Eng. 1999, 125, 1039–1050. [Google Scholar] [CrossRef]
- Tufim, A. Solution for spillway flow by finite difference method. J. Hydraul. Res. 2010, 39, 241–247. [Google Scholar] [CrossRef]
- Meireles, I.; Matos, J. Skimming flow in the non-aerated region of stepped spillways over embankment dams. J. Hydr. Eng 2009, 135, 685–689. [Google Scholar] [CrossRef]
- Ahadian, J.; Aghamajidi, R. Investigation of Geometric Effect of Steps on energy dissipation on Stepped Spillway. Appl. Math. Eng. Manag. Technol. 2014, 2, 495–503. [Google Scholar]
- Bombardelli, F.A.; Meireles, I.; Matos, J. Laboratory measurements and multi-block numerical simulations of the mean flow and turbulence in the non-aerated skimming flow region of steep stepped spillways. Environ. Fluid Mech. 2010, 11, 263–288. [Google Scholar] [CrossRef] [Green Version]
- Qian, Z.D.; Hu, X.Q.; Huai, W.X.; Amador, A. Numerical simulation and analysis of water flow over stepped spillways. Sci. China Ser. E Technol. Sci. 2009, 52, 1958–1965. [Google Scholar] [CrossRef]
- Wei, W.L.; Lv, B.; Liu, Y.L.; Yang, X.F. Numerical Simulation of Flow on Stepped Spillway Combined with Wide Tailing Piers and Stilling Basin. Appl. Mech. Mater. 2012, 170, 2047–2050. [Google Scholar] [CrossRef]
- Dong, Z.Y. Numerical simulation of skimming flow over mild stepped channel. J. Hydrodyn. 2006, 18, 367–371. [Google Scholar] [CrossRef]
- Chen, Q.; Dai, G.; Liu, H. Numerical simulation of overflow in stepped spillway. J. Hydraul. Eng 2002, 33, 20–26. [Google Scholar]
- Morovati, K.; Eghbalzadeh, A.; Soori, S. Numerical Study of Energy Dissipation of Pooled Stepped Spillways. Civ. Eng. J. 2016, 2, 208–220. [Google Scholar] [CrossRef]
- Morovati, K.; Eghbalzadeh, A. Study of inception point, void fraction and pressure over pooled stepped spillways using Flow-3D. Int. J. Numer. Methods Heat Fluid Flow 2018, 28, 982–998. [Google Scholar] [CrossRef]
- Chen, Q.; Dai, G.; Liu, H. Volume of Fluid Model for Turbulence Numerical Simulation of Stepped Spillway Overflow. J. Hydraul. Eng. 2002, 128, 683–688. [Google Scholar] [CrossRef]
- Wan, W.; Raza, A.; Chen, X. Effect of Height and Geometry of Stepped Spillway on Inception Point Location. Appl. Sci. 2019, 9, 2091. [Google Scholar] [CrossRef] [Green Version]
- Rajaratnam, N. Skimming flow in stepped spillways. J. Hydraul. Eng. 1990, 116, 587–591. [Google Scholar] [CrossRef]
- Wan, W.; Liu, B.; Raza, A. Numerical Prediction and Risk Analysis of Hydraluic Cavitation Damage in a High-Speed-Flow. Shock Vib. 2018, 1817307. [Google Scholar]
- Craft, T.J.; Launder, B.E.; Suga, K. Development and application of a cubic eddy-viscosity model of turbulence. Int. J. Heat Fluid Flow 1996, 17, 108–111. [Google Scholar] [CrossRef]
- Cheng, X.; Chen, Y.; Luo, L. Numerical simulation of air-water two-phase flow over stepped spillways. Sci. China Ser. E Technol. Sci 2006, 49, 674–684. [Google Scholar] [CrossRef]
- Tabbara, M.; Chatila, J.; Awwad, R. Computational simulation of flow over stepped spillways. J. Comp. Struct 2005, 83, 2215–2224. [Google Scholar] [CrossRef]
- Bai, Z.L.; Zhang, J.M. Comparison of Different Turbulence Models for Numerical Simulation of Pressure Distribution in V-Shaped Stepped Spillway. Math. Probl. Eng. 2017, 2017, 3537026. [Google Scholar] [CrossRef] [Green Version]
- Daneshfaraz, R.; Joudi, A.R.; Ghahramanzadeh, A.; Ghaderi, A. Investigation of flow pressure distribution over a stepped spillway. Adv. Appl. Fluid Mech. 2016, 19, 811–828. [Google Scholar] [CrossRef]
- Abbasi, S.; Kamanbedast, A.A. Investigation of Effect of Changes in Dimension and Hydraulic of Stepped Spillways for Maximization Energy Dissipation. World Appl. Sci. J. 2012, 18, 261–267. [Google Scholar]
- Roushangar, K.; Akhgar, S.; Salmasi, F.; Shiri, J. Neural networks- and neuro-fuzzy-based determination of influential parameters on energy dissipation over stepped spillways under nappe flow regime. J. Hydr. Eng 2017, 23, 57–62. [Google Scholar] [CrossRef]
- Shih, T.H.; Liou, W.W.; Shabbir, A.; Yang, Z.; Zhu, J. A New k-ε Eddy Viscosity Model for High Reynolds-Number Turbulent Flows-Model Development and Validation. Comput. Fluids 1994, 24, 227–238. [Google Scholar] [CrossRef]
Figure 1.
The geometry of a stepped spillway with air entrainment during the skimming flow regime.

Figure 2.
Three-dimensional stepped spillway models used for numerical experiments; (a) M1 stepped spillway model with slope of 12.5°; (b) M2 stepped spillway model with slope of 20°; (c) M3 stepped spillway model with slope of 29°; (d) M4 stepped spillway model through a slope of 35°.
Figure 2.
Three-dimensional stepped spillway models used for numerical experiments; (a) M1 stepped spillway model with slope of 12.5°; (b) M2 stepped spillway model with slope of 20°; (c) M3 stepped spillway model with slope of 29°; (d) M4 stepped spillway model through a slope of 35°.

Figure 3.
(a) Boundary conditions of the whole domain; (b) overall view of the mesh.

Figure 4.
Variation of relative critical depth (dc/h) of different slope stepped spillway with (h/l) values with critical values (derived from the equation).
Figure 4.
Variation of relative critical depth (dc/h) of different slope stepped spillway with (h/l) values with critical values (derived from the equation).

Figure 5.
Water volume fraction contours of stepped spillway models with slopes of 12.5° and 20° at different discharge rates; (a) 12.5° model with discharge of 0.625 m2/s; (b) 12.5° model with discharge of 0.75 m2/s; (c) 20° model with discharge of 0.625 m2/s; (d) 20° model with discharge of 0.75 m2/s.

Figure 6.
Water volume fraction contours of stepped spillway models with slopes of 29° and 35° at different discharge rates; (a) 29° model with discharge of 0.625 m2/s; (b) 29° model with discharge of 0.75 m2/s; (c) 35° model with discharge of 0.625 m2/s; (d) 35° model with discharge of 0.75 m2/s.
Figure 6.
Water volume fraction contours of stepped spillway models with slopes of 29° and 35° at different discharge rates; (a) 29° model with discharge of 0.625 m2/s; (b) 29° model with discharge of 0.75 m2/s; (c) 35° model with discharge of 0.625 m2/s; (d) 35° model with discharge of 0.75 m2/s.

Figure 7.
Relationship between discharge (q) and inception point length of different sloped stepped spillways.
Figure 7.
Relationship between discharge (q) and inception point length of different sloped stepped spillways.

Figure 8.
Variation of normalized Li with the Froude number of different sloped stepped spillway models.
Figure 8.
Variation of normalized Li with the Froude number of different sloped stepped spillway models.

Figure 9.
Variation of inception point length with relative critical depth (dc/h) of different sloped stepped spillways.
Figure 9.
Variation of inception point length with relative critical depth (dc/h) of different sloped stepped spillways.

Figure 10.
Normalized inception point (Li/ks) relationship with the relative critical depth of different sloped stepped spillways.
Figure 10.
Normalized inception point (Li/ks) relationship with the relative critical depth of different sloped stepped spillways.


Table 1.
Details of the four models used for computation.
| Model | Step Height (h) | Step Length (m) | Slope |
|---|---|---|---|
| M1 | 0.1 | 0.45 | 12.5° |
| M2 | 0.163 | 0.45 | 19° |
| M3 | 0.25 | 0.45 | 29° |
| M4 | 0.315 | 0.45 | 35° |
Table 2.
Table of unit discharge (q), step height, inception point (Li), and normalized Li for 12.5°, 20°, 29°, and 35° stepped spillways.
Table 2.
Table of unit discharge (q), step height, inception point (Li), and normalized Li for 12.5°, 20°, 29°, and 35° stepped spillways.
| Unit Discharge q (m2/s) | Channel Slope ° | Step Height (m) | Froude Number F | Inception Point Length Li | Surface Roughness ks | Li/ks |
|---|---|---|---|---|---|---|
| 0.625 | 12.5° | 0.1 | 13.58 | 1.35 | 0.097 | 13.91 |
| 0.75 | 12.5° | 0.1 | 16.3 | 1.8 | 0.097 | 18.55 |
| 0.875 | 12.5° | 0.1 | 19.02 | 2.25 | 0.097 | 23.19 |
| 1 | 12.5° | 0.1 | 22.69 | 2.7 | 0.097 | 27.83 |
| 0.625 | 20° | 0.163 | 5.73 | 0.9 | 0.153 | 5.88 |
| 0.75 | 20° | 0.163 | 6.88 | 1.35 | 0.153 | 8.82 |
| 0.875 | 20° | 0.163 | 8.02 | 1.8 | 0.153 | 11.76 |
| 1 | 20° | 0.163 | 9.12 | 2.25 | 0.153 | 14.7 |
| 0.625 | 29° | 0.25 | 2.82 | 0.45 | 0.218 | 2.06 |
| 0.75 | 29° | 0.25 | 3.39 | 0.9 | 0.218 | 4.12 |
| 0.875 | 29° | 0.25 | 3.95 | 1.35 | 0.218 | 6.19 |
| 1 | 29° | 0.25 | 4.5 | 1.8 | 0.218 | 8.25 |
| 0.625 | 35° | 0.315 | 1.49 | 0.3 | 0.258 | 1.16 |
| 0.75 | 35° | 0.315 | 1.78 | 0.6 | 0.258 | 2.32 |
| 0.875 | 35° | 0.315 | 2.08 | 0.9 | 0.258 | 3.48 |
| 1 | 35° | 0.25 | 3.21 | 1.35 | 0.258 | 5.23 |
Table 3.
Summary of critical depth (dc), relative critical depth (dc/h), and ks/h for 12.5°, 20°, 29°.
Table 3.
Summary of critical depth (dc), relative critical depth (dc/h), and ks/h for 12.5°, 20°, 29°.
| Critical Depth dc | Channel Slope ° | Step Height | Surface Roughness ks | dc/h | ks/h |
|---|---|---|---|---|---|
| 0.345 | 12.5° | 0.1 | 0.097 | 3.45 | 0.97 |
| 0.4 | 12.5° | 0.1 | 0.097 | 4 | 0.97 |
| 0.43 | 12.5° | 0.1 | 0.097 | 4.3 | 0.97 |
| 0.47 | 12.5 | 0.1 | 0.097 | 4.7 | 0.97 |
| 0.345 | 20° | 0.163 | 0.153 | 2.11 | 0.938 |
| 0.4 | 20° | 0.163 | 0.153 | 2.45 | 0.938 |
| 0.43 | 20° | 0.163 | 0.153 | 2.63 | 0.938 |
| 0.47 | 20° | 0.163 | 0.153 | 2.88 | 0.938 |
| 0.345 | 29° | 0.25 | 0.218 | 1.38 | 0.872 |
| 0.4 | 29° | 0.25 | 0.218 | 1.6 | 0.872 |
| 0.43 | 29° | 0.25 | 0.218 | 1.72 | 0.872 |
| 0.47 | 29° | 0.25 | 0.218 | 1.88 | 0.872 |
| 0.345 | 35° | 0.315 | 0.258 | 1.09 | 0.819 |
| 0.4 | 35° | 0.315 | 0.258 | 1.26 | 0.819 |
| 0.43 | 35° | 0.315 | 0.258 | 1.36 | 0.819 |
| 0.47 | 35° | 0.315 | 0.258 | 1.49 | 0.819 |
Publisher’s Note: MDPI stays neutral with regard to jurisdictional claims in published maps and institutional affiliations. |
© 2021 by the authors. Licensee MDPI, Basel, Switzerland. This article is an open access article distributed under the terms and conditions of the Creative Commons Attribution (CC BY) license (https://creativecommons.org/licenses/by/4.0/).
Share and Cite
MDPI and ACS Style
Raza, A.; Wan, W.; Mehmood, K. Stepped Spillway Slope Effect on Air Entrainment and Inception Point Location. Water 2021, 13, 1428. https://doi.org/10.3390/w13101428
AMA Style
Raza A, Wan W, Mehmood K. Stepped Spillway Slope Effect on Air Entrainment and Inception Point Location. Water. 2021; 13(10):1428. https://doi.org/10.3390/w13101428
Chicago/Turabian StyleRaza, Awais, Wuyi Wan, and Kashif Mehmood. 2021. "Stepped Spillway Slope Effect on Air Entrainment and Inception Point Location" Water 13, no. 10: 1428. https://doi.org/10.3390/w13101428
Note that from the first issue of 2016, this journal uses article numbers instead of page numbers. See further details here.