Technical Note

Real-Time Determination of Total Solids in UASB Reactors Using a Single Emitter Ultrasonic Sensor

by
Priscilla N. P. Neves
1,4,*,
Lariza S. Azevedo
1,
Martijn Hoep
4,
Thiago Bressani-Ribeiro
1,
Matthijs Wiersma
4,
Ronaldo N. Ferreira
4,
R. Martijn Wagterveld
2,
Doekle Yntema
3,
Carlos A. L. Chernicharo
1 and
Luewton L. F. Agostinho
4
1
DESA, Universidade Federal de Minas Gerais, Belo Horizonte 31270-901, Brazil
2
Lamp-Ion B.V., 8472 CL Wolvega, The Netherlands
3
YNOVIO B.V., 8939 EG Leeuwarden, The Netherlands
4
Water Technology Research Group, NHL Stenden University of Applied Sciences, Rengerslaan 8-10, 8917 DD Leeuwarden, The Netherlands
*
Author to whom correspondence should be addressed.
Water 2021, 13(11), 1437; https://doi.org/10.3390/w13111437
Submission received: 21 April 2021 / Revised: 13 May 2021 / Accepted: 14 May 2021 / Published: 21 May 2021
(This article belongs to the Special Issue Innovative Technologies for Wastewater and Water Treatment)

Abstract

:
The lack of proper sludge withdrawal routines has been one of the main causes of solids washout and consequent deterioration of effluent quality from up-flow anaerobic sludge blanket (UASB) reactors treating sewage in developing countries. The establishment of an adequate sludge withdrawal routine depends on the knowledge of the sludge mass inside the reactor, but for this, it is necessary to continuously monitor the solid’s profile along the height of the digestion compartment of such reactors. Knowing the sludge concentration at the highest point of this compartment, immediately before the passage of the liquid to the settling compartment, allows the definition of more robust strategies for sludge discharge, in order to not exceed the retention capacity (storage) of solids in the reactor. To couple with that, a low-cost ultrasound sensor was developed and tested with the aim of monitoring total solids concentration inside UASB reactors. Bench and demo-scale tests were performed to validate the developed technology. Results have shown that the sensor can provide real-time values of total solids inside the reactor with 0.1% accuracy up to 1% total solids content.

1. Introduction

Ultrasound sensors have been used in applications ranging from medical body imag- ing to distance measurements in navigation [1]. It is a real-time measurement that uses high- frequency sound waves to determine the size, direction and location of objects of higher density than the medium they are immersed in [1]. Some examples of the application of such sensors in water and wastewater treatment systems involve the breakdown of organic matter, disinfection due to the pathogenic cell lysis and liquid level measurement [2,3]. Also, and more recently, Kandemir et al. [4] reported the use of acoustic fields to selectively separate particles in water.
Up-flow anaerobic sludge blanket (UASB) reactors are widely applied for sewage treatment in warm climate regions [5]. The anaerobic biomass present in such reactors is responsible for the degradation of organic compounds, resulting mainly in biogas rich in methane. The biomass and other organic and inorganic constituents form what is referred to as a sludge bed and sludge blanket. The sludge bed develops in the lower part of the digestion compartment, while the sludge blanket, composed of loose and less concentrated sludge, remains dispersed in the digestion compartment. The up-flow movement of the influent (raw sewage) and of the biogas produced in the process cause the expansion of the sludge blanket and, to a lesser extent, the sludge bed. Due to the different particle sizes, the sludge blanket has a vertical profile with different solids concentrations ranging from approximately 0.01% at the top layer of the reactor up to 6% at its bottom. Monitoring the sludge mass in the reactor through total solids (TS) analysis is crucial for determining the excess sludge withdrawal routine [6].
Throughout the continuous operation of a UASB reactor, the sludge mass expands as a result of the growth of microorganisms (biomass), the accumulation of inert solids and organic matter, and the hydraulic conditions inside the reactor. When the reactor is not well-operated, these solid particles can be washed out from the UASB reactor with the effluent, compromising its quality [7]. In a recently published work, Chernicharo et al. [6] reported that a well operated UASB reactor should present TS concentrations below 0.5% at the upper part of the digestion compartment (before the settler). For that, a systematic monitoring of this parameter is necessary in order to improve the control of the sludge mass and to better establish the sludge withdrawal routines.
Currently, the TS concentration in UASB reactors is monitored via collecting sludge samples at different heights and providing gravimetric analysis to determine the different solid fractions, i.e., total, fixed and volatile solids. This analysis requires at least 12 h to be completed [8]. Considering the time between sample collection and analysis, the characterization can easily take 24 h. Furthermore, large reactors have several solids monitoring points, generating numerous samples to be analyzed in the laboratory.
The adoption of a real-time TS measurement in wastewater treatment plants (WWTPs) would certainly improve the robustness and reliability of the treatment process, decrease operation complexity, promote medium and long-term capital savings and ensure a more stable operation [9]. Additionally, it would allow constant monitoring of the sludge mass in the reactor, allowing operators to react fast in malfunction episodes and better define sludge withdrawal strategies.
This work presents the development and validation (in bench and demo-scale) of an ultrasound sensor system to provide real-time TS concentrations values in the digestion compartment of UASB reactors. The sensor was developed to detect TS concentrations ranging from 0% (baseline) to 1%, as 0.5% is considered an “ideal” concentration at the highest portion of the digestion compartment, i.e., immediately before the internal transition to the settler compartment.

2. Setup and Experimental Methods

The experiments to test and validate the US device were carried out in two (subse- quent) phases: at bench (lab) and demo-scale. The bench-scale tests were performed in the Water Application Centre (Leeuwarden, The Netherlands) and resulted in a “ready to use” first prototype, which was further tested in a demo-scale UASB reactor at the Centre for Research and Training in Sanitation UFMG/COPASA (CePTS) (Belo Horizonte, Brazil).

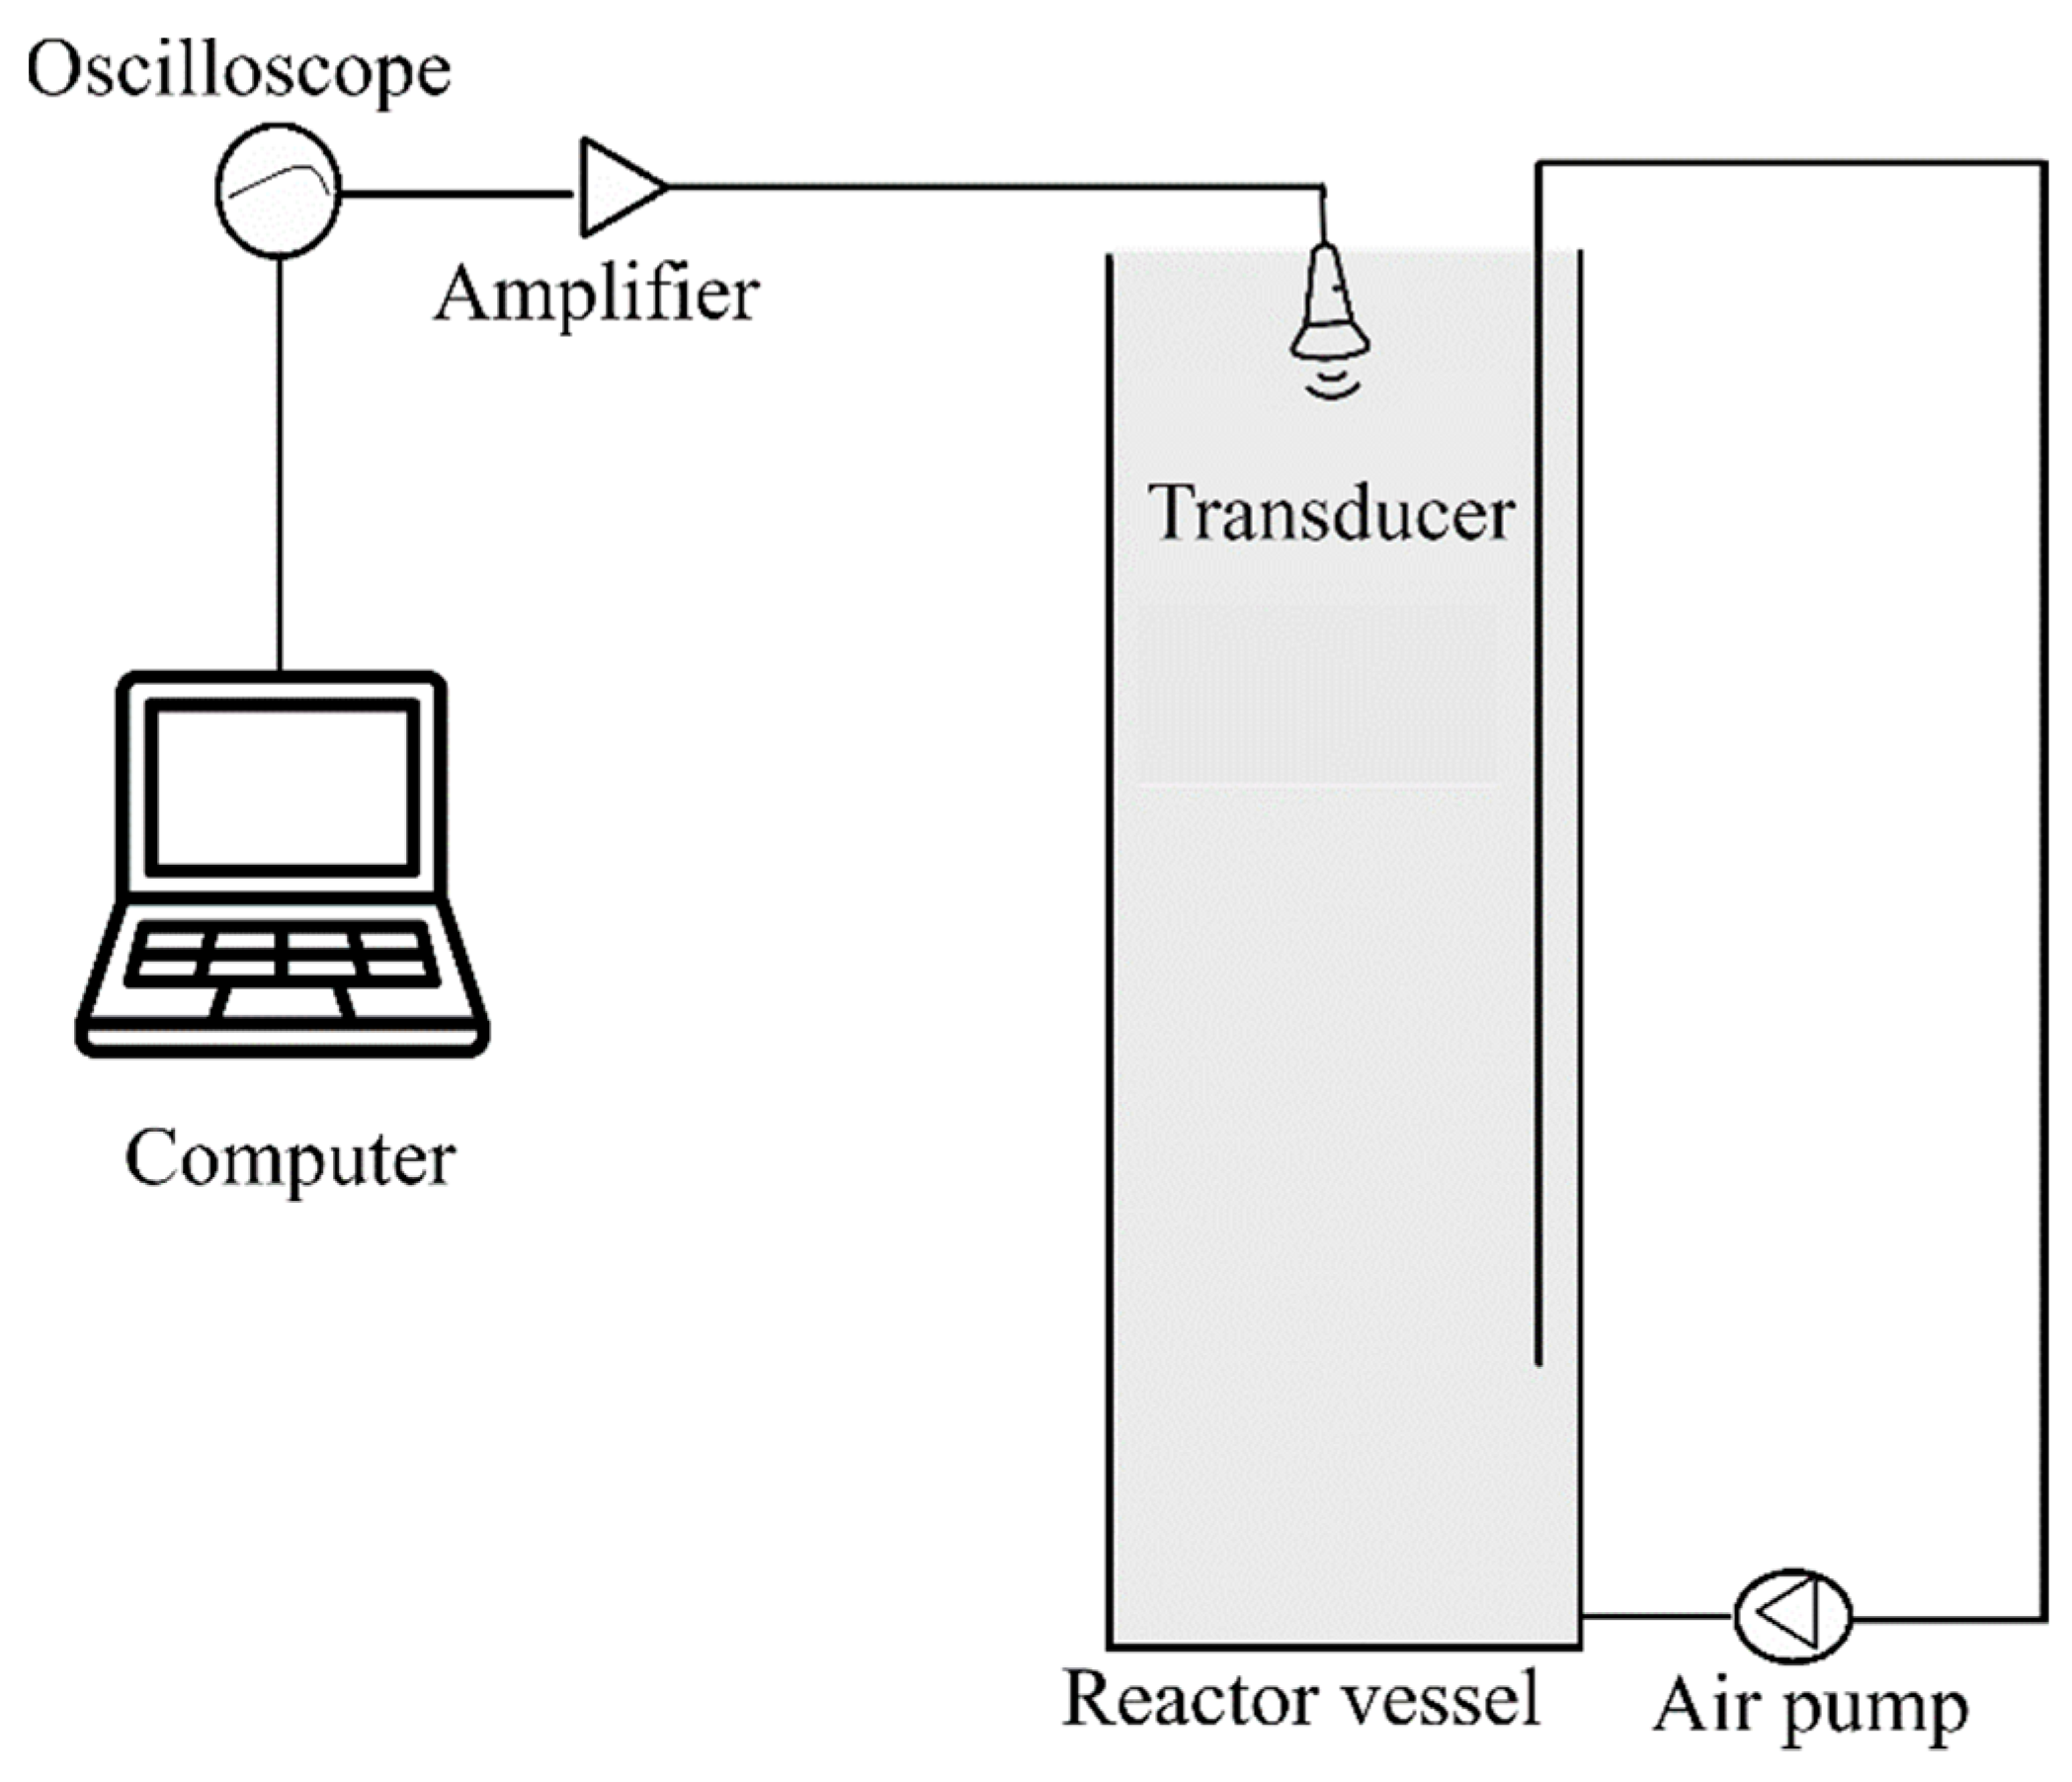
2.1. Bench-Scale Tests

The bench-scale tests were conducted to verify and optimize the performance of the sensor. The following aspects were evaluated in this phase: (i) the performance of two different frequencies (transducers), i.e., 500 and 200 kHz, (ii) the response of the sensor to different solids concentration, (iii) the maximum detectable concentration and the accuracy of the signal.
The setup consisted of a cylindrical glass reactor with a height of 60 cm and a 6.5 cm diameter basis. The reactor had a detachable (glass) bottom with two sampling ports used as a gas inlet and effluent outlet (drain). The inlet was connected to a pump used to introduce air into the reactor for mixing the sludge. This was done to mimic the conditions found in real scale reactors. The ultrasound emitter (transducer) was positioned at the reactor top (60 cm from the bottom) with its base placed parallel to the bottom of the reactor to provide maximum reflection of the signal and reduce scattering. A representation of the setup is shown in Figure 1, and some technical information of the equipment used is presented in Table 1.
Two transducers were initially evaluated: a low-cost 200 KHz commercial transducer (Generic Fishfinder) and a more expensive (stainless steel housing) 500 kHz transducer (Optimus system). The bench-scale tests showed, in an early stage, a good performance of the low-cost 200 kHz transducer. Therefore, further tests were carried out with this frequency only.
To be able to send pulsed signals to the transducer and to filter and amplify incoming signals, a device (from now on referred to as “control box”) was developed and connected between the transducer and a digital oscilloscope (Picoscope). The digital oscilloscope was also used for real-time visualization of the signal and for recording the generated waves. After recording, the signals were processed and treated with a MATLAB® routine developed in-house.
The tests were performed as follows: fresh sludge was collected from a WWTP located in Leeuwarden, The Netherlands. The collected sludge was tested to verify its solids concentration via gravimetric tests. The results obtained in the analysis of the fresh sludge have shown an initial concentration of around 4% total solids (TS) content. After characterization, the sludge was homogenized and diluted using demineralized water to obtain different solid contents, i.e., 0, 0.2%, 0.4%, 0.7% and 0.9%. These values were chosen as a starting point to test the sensor, considering the concentrations typically found in the upper portions of the digestion compartment of UASB reactors treating domestic wastewater [5].
The reactor was then filled, for each specific run, with the different solutions (including the baseline, i.e., 0%). After filling, air was pumped via the bottom part to provide the homogenization of the sludge inside the reactor for 5 min. Then, the sensor was triggered to activate the signal. For each specific concentration, a set of 32 sinusoidal waves were generated in 160 ms and afterwards stored in a portable computer. This procedure was repeated 10 times, resulting in 320 files that could be analyzed per tested concentration.
Via the MATLAB® routine, the second peak of the signal was isolated, the amplitude values of each wave were accumulated, and the area under the curve of the obtained graph (voltage vs time) was processed. Thus, for each TS concentration, a set of 320 area values were generated. The routine was written to give as an output a matrix of area values, per each tested TS concentration, as well as other descriptive statistics values (standard deviation, standard error, mean and median), which were used to define an ideal central parameter and to calculate the errors. All these tests were done in triplicate.
The calibration curve was built by plotting the values obtained from the signal treat- ment routine versus their respective sludge concentration values. The obtained curve was used to define a correlation equation for the tested parameters, as well as to verify practical factors like the accuracy of the method and the response to maximum and minimum concentrations.

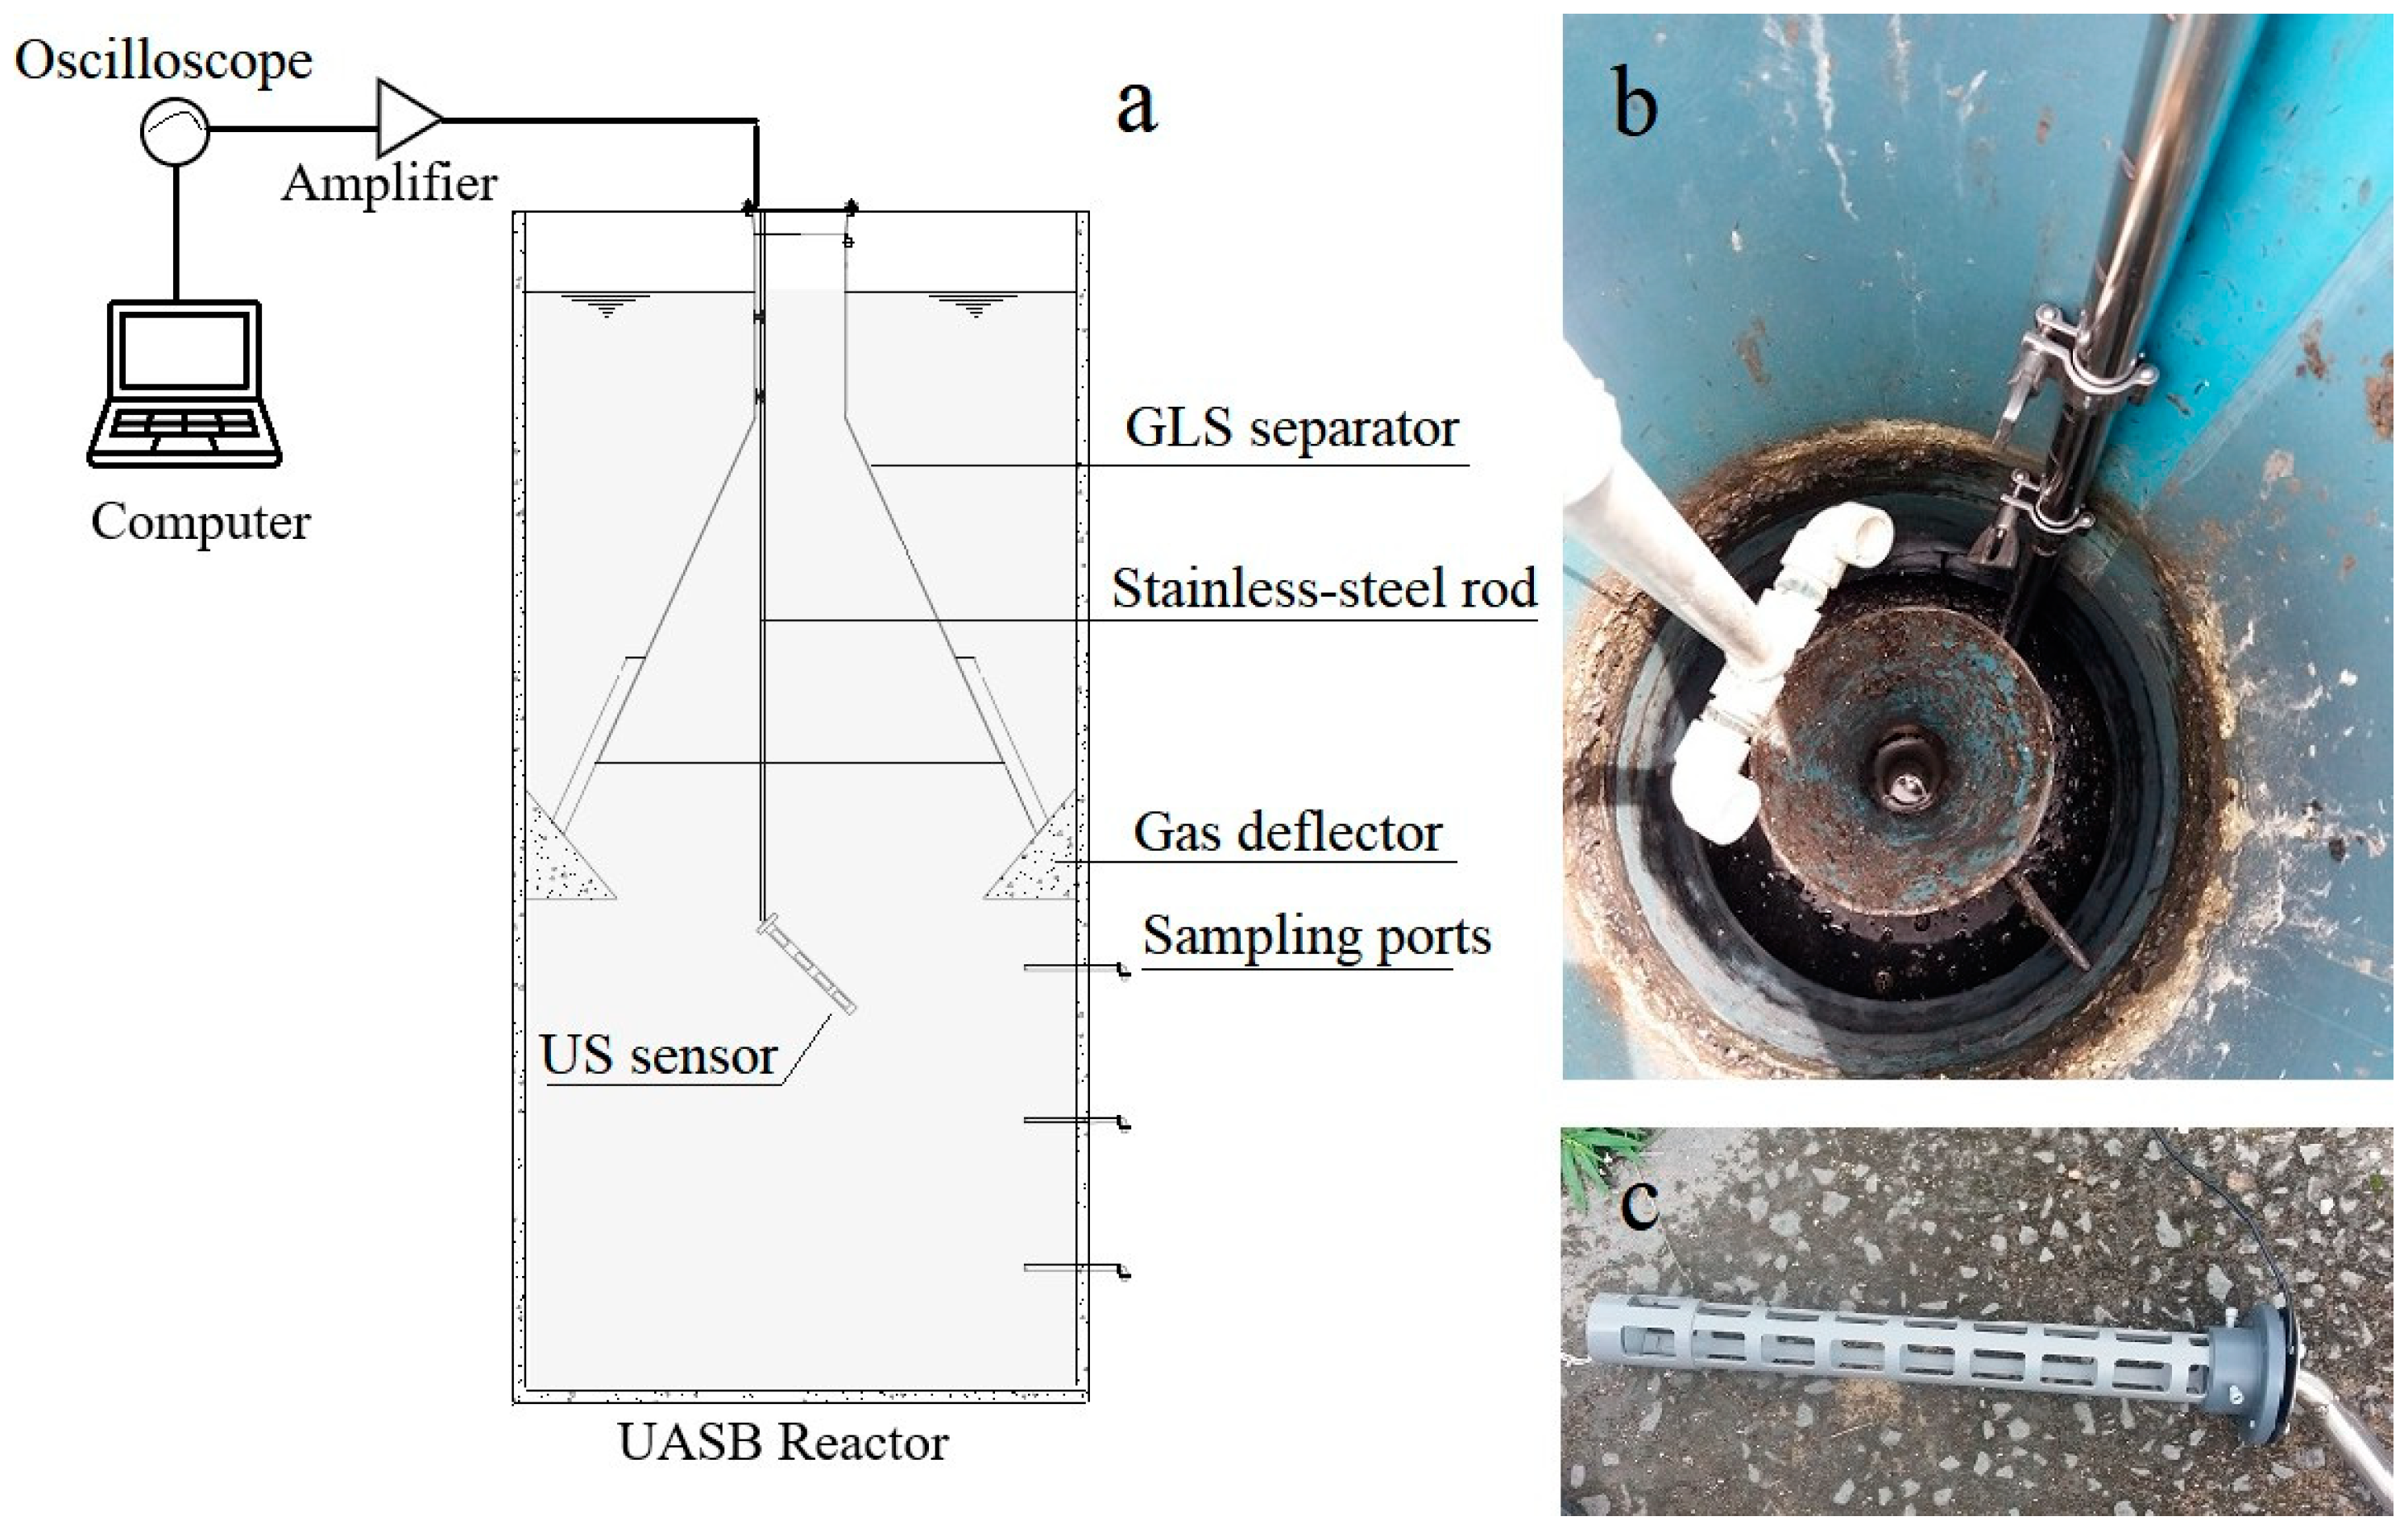
2.2. Demo-Scale Tests

The main objectives of this phase tests were to evaluate the performance of the sensor in pilot-scale and verify whether the calibration curve done during the bench-scale tests would produce similar output under these conditions. They can be divided into three phases: (i) the vertical TS profile tests, (ii) the calibration curve tests and (iii) the long-term performance tests. In sequence, first, the setup used for the experiments is presented, and then the methods used in each test are described.

2.2.1. Demo-Scale Tests Setup

A schematic representation of the UASB reactor (14 m3; influent flow rate: 37 m3.day−1) used during the tests is presented in Figure 2a. The drawing was made in order to allow the visualization of the gas–liquid–solid (GLS) separator, the effluent level, the gas deflectors and the sampling ports. The reactor has six different sampling ports, positioned at 0.05, 0.6, 1.1, 1.6, 2.1 and 4.5 m (in relation to its bottom), which were used to collect samples for the gravimetric analysis. The reactor was operated continuously (24-7), fed with wastewater from the city of Belo Horizonte, Brazil, after preliminary treatment.
The sensor used for the demo-scale tests was the same used in the bench-scale tests. However, the bottom part of the demo-scale reactor (in this case, 4.5 m deep) was not used as a reflection surface due to expected (excessive) losses. Conversely, a 30 cm long PVC housing was built and connected to the transducer, which contained a circular glass bottom used as a reflection surface (see Figure 2c). Few lateral openings were included in the housing to guarantee the same solid density as experienced inside the reactor at the same height (Figure 2c). The sensor was attached to a stainless-steel rod, which was fixed to the top of the GLS separator (Figure 2b). The rod was motile to allow positioning adjustments of the sensor. An attachment between the stainless-steel rod and the sensor itself was done in order to keep the sensor at a specific angle (approximately 120◦) to avoid sludge accumulation in the reflector.

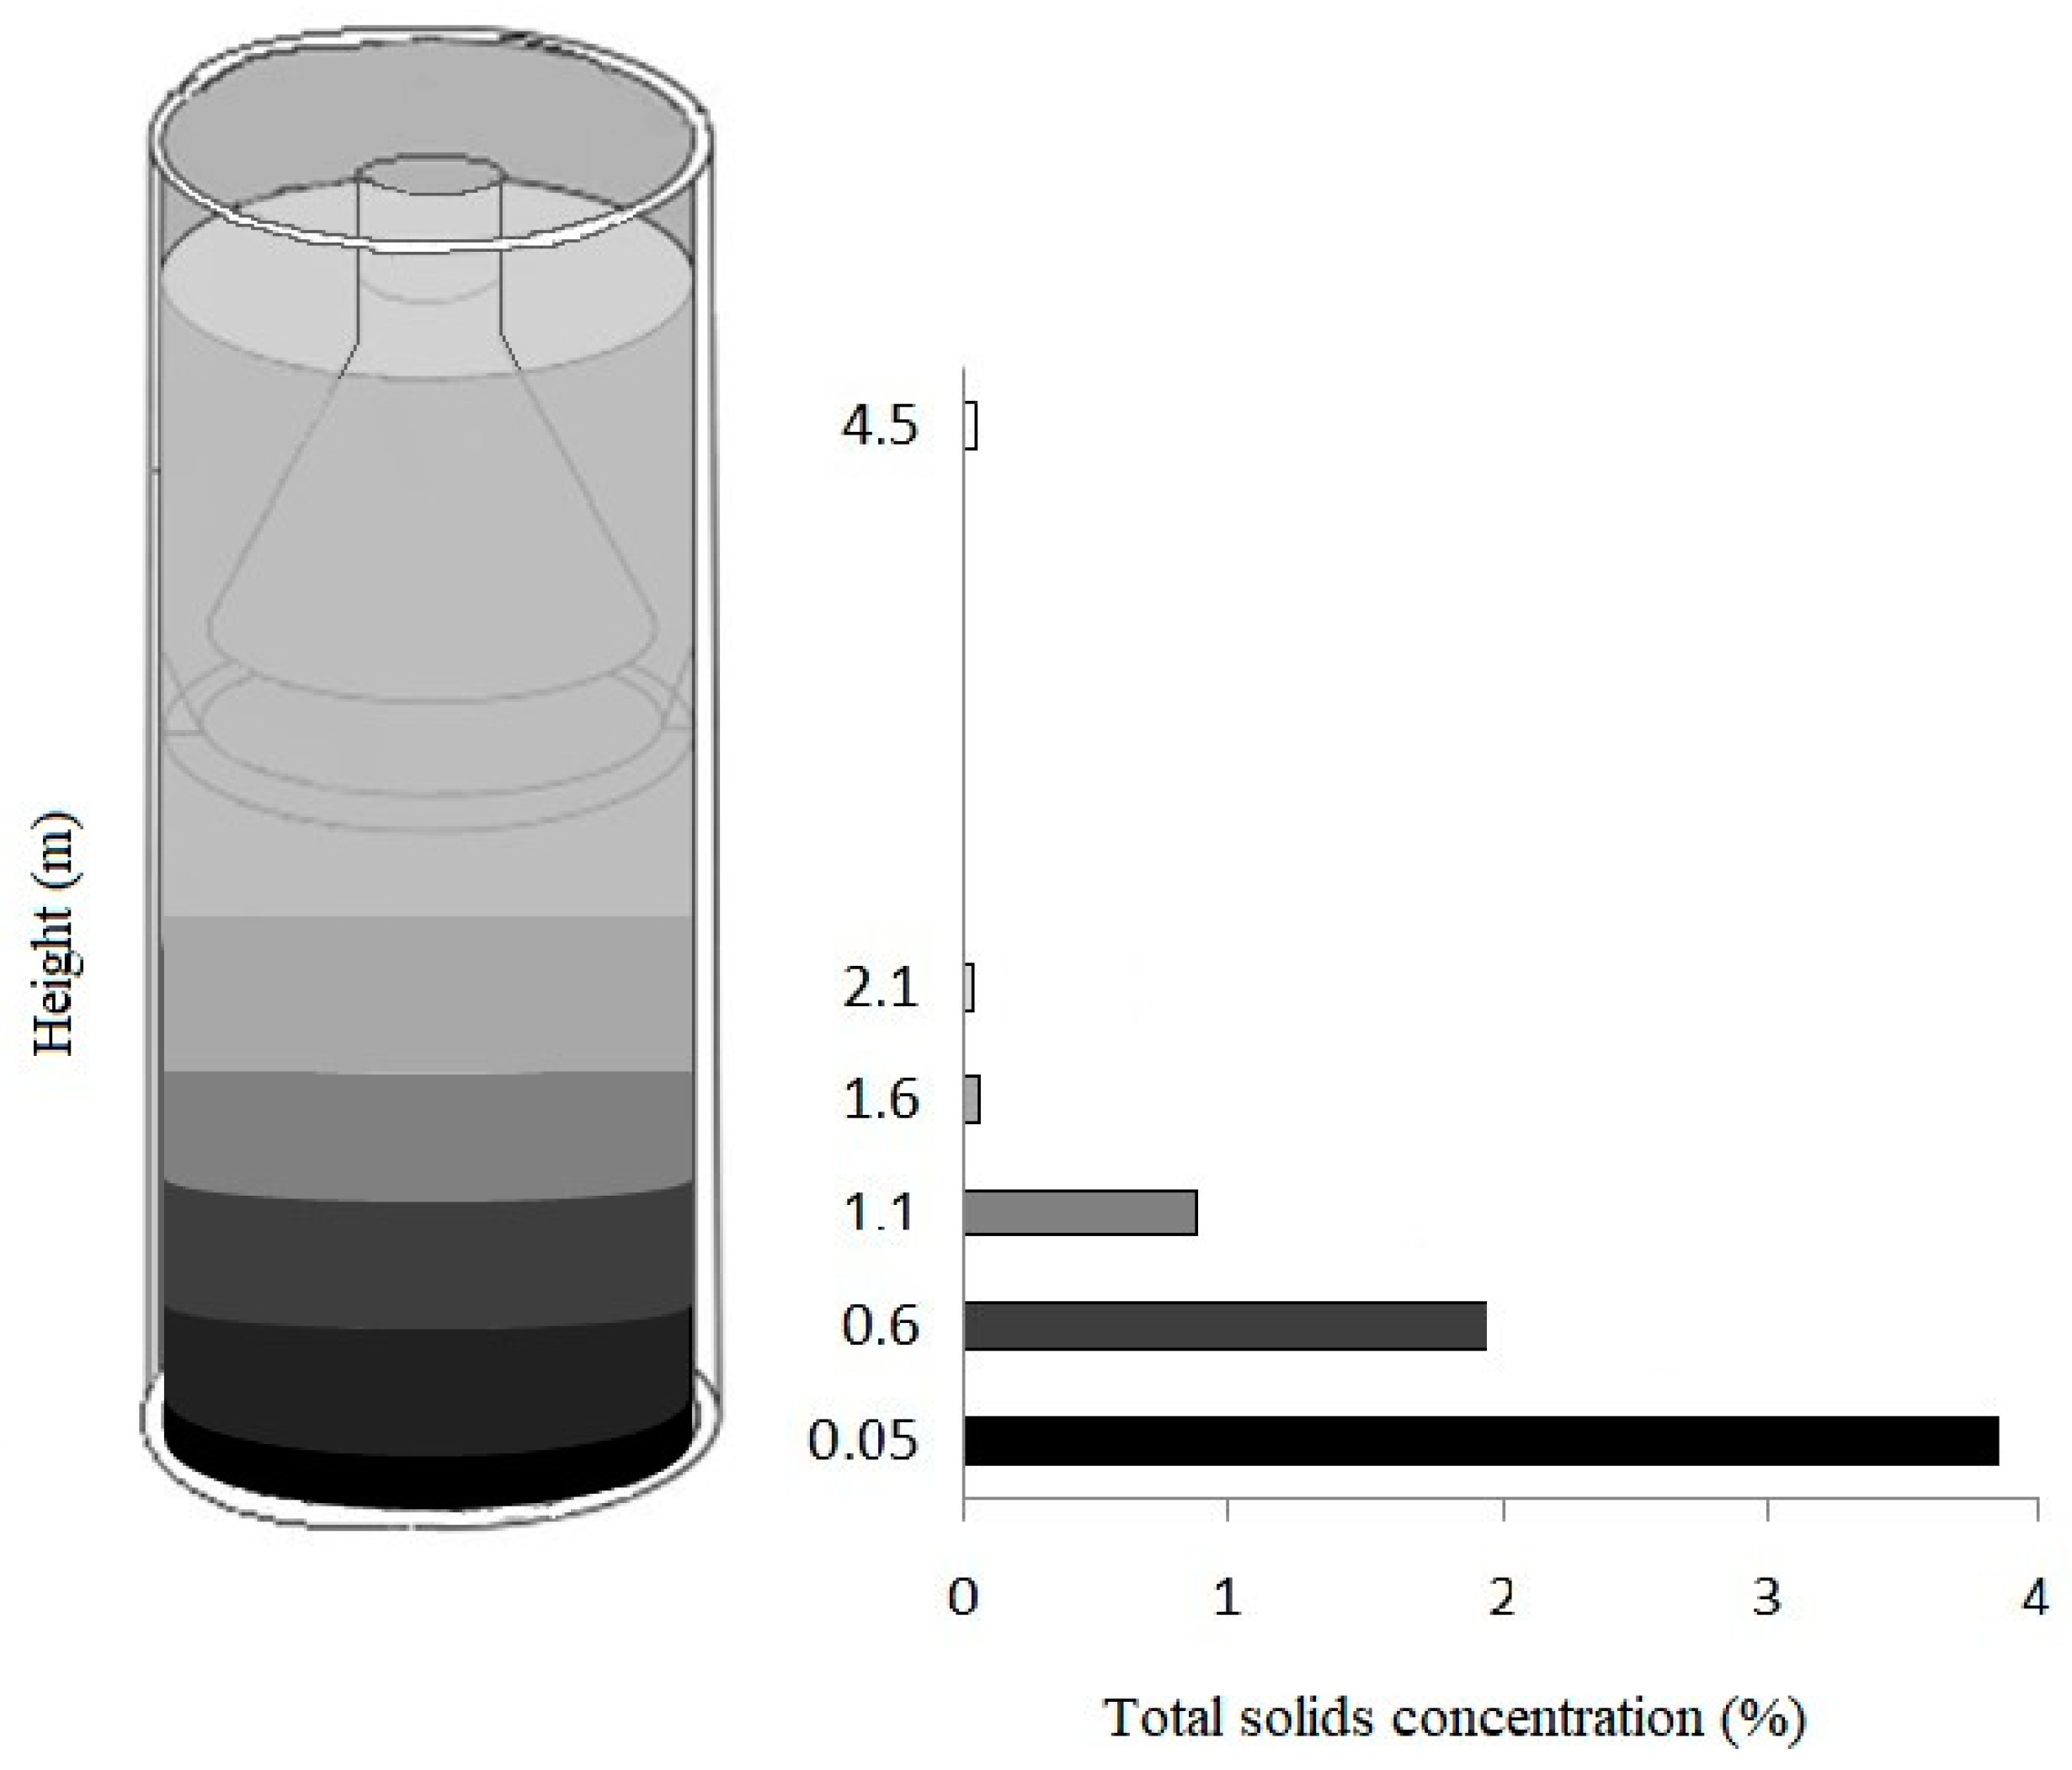
2.2.2. Total Solids Vertical Profile Test

To verify which position would be the best for the installation of the sensor, some pretests were conducted in order to check the vertical solids concentration profile inside the reactor. These tests were done via collecting samples from the reactor sampling ports and analyzing them for total solids. They also had the objective of providing info about the best position for the installation of the sensor (lately defined as 2.1 m in relation to the reactor bottom), as well as the deepest position it could be installed at during the calibration curve tests (lately defined as 1.1 m in relation to reactor bottom).

2.2.3. Calibration Curve

The calibration curve test was conducted using a method similar to that used for the bench-scale tests. In this case, however, instead of preparing solutions with different TS concentration, the sensor was submerged inside the reactor in two different positions (2.1 and 1.6 m) and activated via the oscilloscope from outside. The method for signal generation and treatment was the same used for bench-scale. For each signal collection, a sludge sample was also collected from the respective sampling port and analyzed regarding total solids content. After that, a calibration curve was build confronting the values obtained with the sensor and the gravimetric tests. These tests were performed four times over two weeks to verify possible modifications of the signal over time in the same positions.

2.2.4. Long-Term Performance Test

The long-term performance tests were conducted in the following way. After the calibration curve tests, the sensor was kept inside the reactor for 25 weeks (to verify its long-term performance, possible influence of fouling and resistance to the aggressive environment). During this period, weekly tests (sensor measurements and gravimetric analysis) were done at three different positions (1.1, 1.6 and 2.1 m). Also in these tests, the method used to generate, collect and treat the signals from the sensor was the same used in the bench-scale test. During maintenance/flushing episodes, the collection was not done. Furthermore, in some testing weeks, concentrations higher than 1% were already found at positions 1.6 and 1.1 m. Therefore, a total of 21 analysis points were collected. After the tests, a correlation curve was built to confront sensor signal data and gravimetric results.

3. Results

To characterize the signal, some preliminary bench-scale experiments were conducted using a 0.2% TS concentration solution. These experiments have shown a raw signal composed of basically three peaks. The initial peak was attributed to internal vibrations of the transducer. The second and third peaks were attributed to reflections of the signal on the reactor bottom part. The different signals collected have shown that a good correlation between sensor results and solids concentration could be obtained by just using the area of the second peak. Not only because the attenuation of this signal was clearly detected for the tested solids concentrations, but also because, for high concentrations (above 0.9%), it could be seen that the third peak practically disappeared. This relation between signal attenuation and solids concentration is reported many times in the literature [10,11,12,13,14,15,16]. For the tested frequency (200 kHz) and the total applied power, it was observed that the second peak was barely detectable at TS concentrations close to 1%, even though still measurable using the MATLAB® routine. Due to this result, a maximum detectable concentration of 1% was assumed as the top limit of the sensor for the subsequent tests. Such threshold was, nevertheless, not a big concern for the intended use of the sensor, as the target concentration was set to 0.5% [17].
After defining these conditions, further tests were conducted for the different TS concentrations. In these tests, the signal was repeatedly captured for a time interval of approximately 1.6 s, in order to generate (as mentioned above) a set of data composed of 320 different images of the same signal. Each set was treated with the MATLAB® routine to define the area of each image’s secondary peak and provide a table with descriptive statistics of the data set. To define the relation between the generated signal and its respective TS concentration (determined by the gravimetric analysis), a correlation plot was built confronting the values obtained by the area calculation (y-axis) with the values obtained via the gravimetric analysis for the respective set of data. These results are presented in sequence.

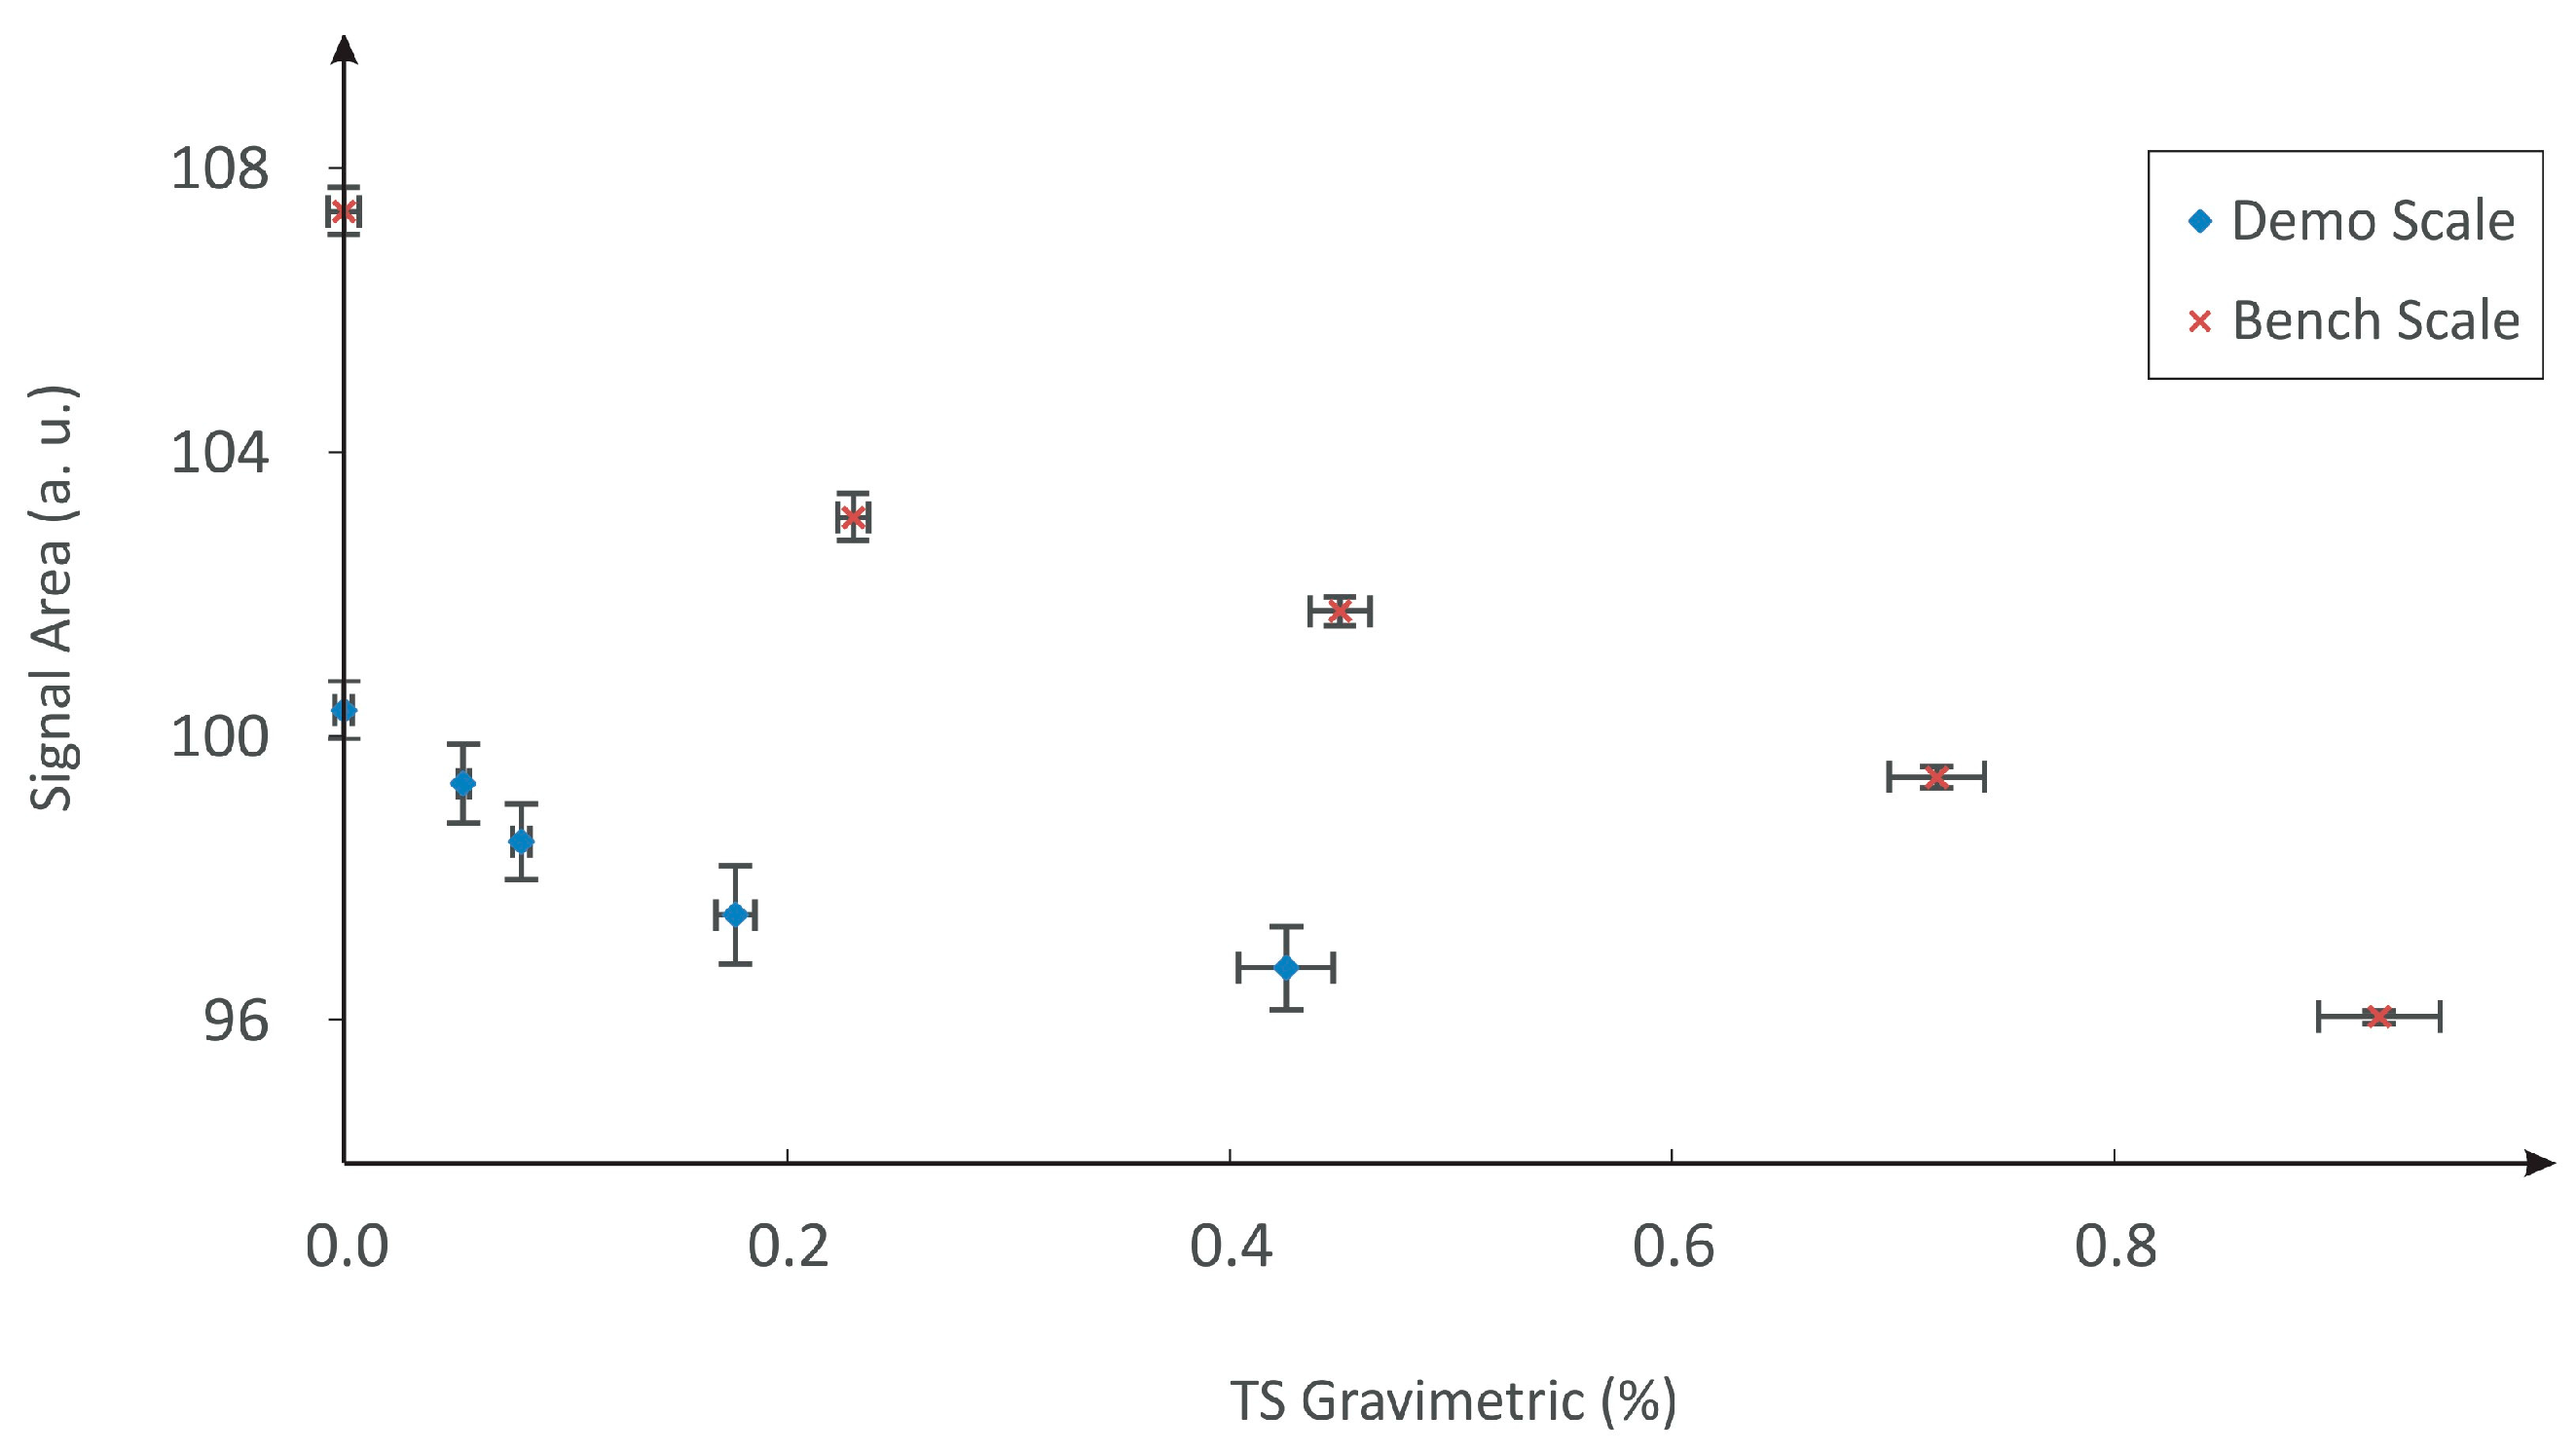
3.1. Correlation between US Signals and Gravimetric Analysis

The results of the tests conducted to correlate the values obtained from the signal and gravimetric analysis at the bench- and demo-scale are presented in Figure 3. The figure shows that, for the bench-scale test, the standard deviation calculated for each set of signals is significantly smaller than the difference between two consecutive sets, indicating an accuracy of approximately 0.2% (TS concentration) of the sensor. This accuracy was also observed in the demo-scale tests (see also Figure 3), even though less pronounced than in the former tests due to the fact that the standard deviation of the signal set was bigger in the latter. This is corroborated by the (signal) values obtained in the demo-scale tests for TS concentrations between 0.05% and 0.08%, which clearly shows that the values are not significantly different in that case. Another aspect that can be observed from Figure 3 is the difference of the signal response obtained in the bench-scale tests and the demo-scale tests for similar TS concentration (approximately 10%). This is attributed to the fact that the reflection object was positioned at 60 cm in the bench-scale tests (reactor bottom) and at 30 cm for the demo-scale tests (PVC housing). Additionally, it is possible to assume that the higher standard deviation can be related to up-flow velocity variations and/or sludge inhomogeneity in the demo-scale reactor.

3.2. Vertical TS Profile and Long Performance Tests

Four days before performing the demo-scale tests with the sensor, a careful analysis of the TS concentrations along the UASB reactor depth was performed. These tests were performed using the sampling ports (see Figure 2a). The results obtained are shown in Figure 4.
As it can be seen, the TS values vary along the reactor vertical axis between 0 (at the top) and 3.7% (at the bottom). The results obtained in these tests indicated that the sensor should be positioned above the 1.1 m position, as the TS concentration at this point already exceeds the 1% maximum limit of the sensor. Therefore, it was decided to use the sensor for the vertical profile analysis at three different positions, i.e., 1.1, 1.6 and 2.1 m.
Figure 5 shows the results obtained during the long performance/correlation curve tests (circle symbols). As it can be seen, the correlation coefficient between the two sets of data suggests a strong correlation (R2 = 0.97). It is noteworthy that for TS concentration values above 0.6%, the curve fit is poorer. However, it can be seen from the values presented for the absolute error between the two methods (diamond symbols) that the difference between the two measurements remains mostly below 0.1% (the mode determined from the absolute error population is 0.03%). A dashed line was included in the plot to better allow the identification of these values. It is important to stress that it reaches values as high as 0.2% for concentrations above 0.6%. However, it was observed that the gravimetric tests also presented quite large variations around that same region, most probably caused by fluctuations inside the reactor. The best correlation was obtained for concentrations below 0.5%, indicating that the system works better for its intended region. The higher errors found for concentrations close to 1% can be related to the fact that these values are close to the detection limit of the device, 1%. The same behavior was observed in the results obtained from the bench-scale tests.
Additionally, it was observed that some TS concentration values measured by the US sensor were overestimated. Part of the observed error may be due to the abrupt variations in the up-flow velocity of the liquid inside the UASB reactor. Such oscillations in the reactor led to a different environment from that experienced in the construction of the calibration curve. The variation in the up-flow velocity combined with the interactions between gas, liquid and solids caused an intense mass movement [18,19], which created on homogeneous distribution of solids (or different from that observed in the calibration curve) in the vicinity of the sensor. In addition, some of these variations in flow may have occurred exactly during data collection, causing distortion in the observed values shown in Figure 5.

4. Conclusions

Results have shown that an ultrasound-based sensor can be used to measure online total solids concentration in UASB reactors treating domestic wastewater. The tests indicated that it could be reliably used for TS concentrations below 1% with an accuracy of 0.1%. Furthermore, the sensor has shown good performance during the long performance tests (25 weeks), which indicates that the chosen structure and materials might be able to resist the aggressive conditions inside the UASB reactors. Other tests have yet to be performed to verify which configurations would allow better detection of concentrations above 1%. The latter can be achieved using, e.g., higher power, small reflection distances and/or different frequencies. It is believed that such type of technology is also promising for different applications in water technology, e.g., monitoring sand losses in rapid sand filtration and particle density in granular-based reactors, as well as for other industries, e.g., food technology and mining.

Author Contributions

Conceptualization, L.L.F.A., L.S.A., M.H., T.B.-R., R.M.W., D.Y., C.A.L.C., M.H.; methodology, P.N.P.N., M.H., M.W., L.L.F.A., R.M.W., D.Y.; validation, P.N.P.N., M.H., M.W., L.L.F.A., L.S.A., T.B.-R., R.M.W., D.Y., R.N.F., C.A.L.C.; investigation, L.L.F.A., L.S.A., T.B.-R., R.M.W., D.Y., C.A.L.C.; data curation, P.N.P.N., M.H., M.W., L.L.F.A., R.M.W., D.Y.; writing—original draft preparation, P.N.P.N., L.L.F.A.; writing—review and editing, P.N.P.N., L.L.F.A., L.S.A., T.B.-R., R.M.W., D.Y., R.N.F., C.A.L.C.; visualization, P.N.P.N., L.L.F.A.; supervision, P.N.P.N., L.L.F.A., C.A.L.C.; project administration, L.L.F.A., C.A.L.C.; All authors have read and agreed to the published version of the manuscript.

Funding

This research was funded by The Dutch agency Regiorgaan SIA as a KIEM subsidy grant number CE.02.063 and by the following Brazilian institutions: Conselho Nacional de Desenvolvi- mento Científico e Tecnológico do Brasil (CNPq) (grant number 465746/2014-4), Fundação de Amparo à Pesquisa de Minas Gerais (FAPEMIG) (grant number APQ-03604-17), Coordenação de Aperfeiçoa- mento de Pessoal de nível Superior (CAPES) (Finance code 001) and Instituto Nacional de Ciência e Tecnologia em Estações Sustentáveis de Tratamento de Esgoto (INCT ETEs Sustentáveis/INCT Sustainable Sewage Treatment Plants).

Data Availability Statement

The data presented in this study are available on request from the corresponding author. The data are not publicly available due to commercial restrictions and interest in the final product.

Acknowledgments

This work was supported by the following institutions: The Dutch Consil for Research in Superior Education (NWO), represented by its Applied Science Organization (SIA). Conselho Nacional de Desenvolvimento Científico e Tecnológico do Brasil (CNPq) [grant number 465746/2014-4], Fundação de Amparo à Pesquisa de Minas Gerais (FAPEMIG) [grant number APQ- 03604-17], Coordenação de Aperfeiçoamento de Pessoal de nível Superior (CAPES) [Finance code 001] and Instituto Nacional de Ciência e Tecnologia em Estações Sustentáveis de Tratamento de Esgoto (INCT ETEs Sustentáveis/INCT Sustainable Sewage Treatment Plants). We also acknowledge the support from the sanitation company of Minas Gerais—COPASA.

Conflicts of Interest

The authors declare no conflict of interest. The founders had no role in the design of the study; in the collection, analyses, or interpretation of data; in the writing of the manuscript, or in the decision to publish the results.

References

  1. Powles, A.E.; Martin, D.J.; Wells, I.T.; Goodwin, C.R. Physics of ultrasound. Anaesth. Intensive Care Med. 2018, 19, 202–205. [Google Scholar] [CrossRef]
  2. Kumar, R.; Yadav, N.; Rawat, L.; Goyal, M. Effect of two waves of ultrasonic on waste water treatment. J. Chem. Eng. Process. Technol. 2014, 5, 1. [Google Scholar]
  3. Fetyan, N.A.; Salem Attia, T.M. Water purification using ultrasound waves: Application and challenges. Arab. J. Basic Appl. Sci. 2020, 27, 194–207. [Google Scholar] [CrossRef]
  4. Kandemir, M.; Beelen, M.; Wagterveld, R.; Yntema, D.; Keesman, K. Dynamic acoustic fields for size selective particle separation on centimeter scale. J. Sound Vib. 2021, 490, 115723. [Google Scholar] [CrossRef]
  5. Chernicharo, C.; Van Lier, J.; Noyola, A.; Ribeiro, T.B. Anaerobic sewage treatment: State of the art, constraints and challenges. Rev. Environ. Sci. Bio/Technol. 2015, 14, 649–679. [Google Scholar] [CrossRef]
  6. Chernicharo, C.A.; Bressani-Ribeiro, T.; Lobato, L.C. Operation of UASB reactors for sewage treatment. In Anaerobic Reactors for Sewage Treatment: Design, Construction and Operation, 1st ed.; Carlos Augusto de Lemos Chernicharo, T.B.R., Ed.; IWA Publishing: London, UK, 2019; Volume 1, pp. 126–158. [Google Scholar]
  7. Chernicharo, C.A.L. Biological Wastewater Treatment Series: Anaerobic Reactors, 1st ed.; IWA Publishing: London, UK, 2007; p. 188. [Google Scholar]
  8. American Public Health Association (APHA); The American Water Works Association (AWWA). Standard Methods for the Examination of Water and Wastewater, 22nd ed.; American Public Health Association: Washington, DC, USA, 2012; pp. 66–73. [Google Scholar]
  9. Lira, V.V. Automação de um Sistema de Tratamento de Esgotos Baseado no Processo de Lodo Ativado. Masters’s Thesis, Universidade Federal da Paraíba, Campina Grande, Brazil, 2001. [Google Scholar]
  10. Eska, G.; Neumaier, K.; Schoepe, W.; Uhlig, K.; Wiedemann, W.; Wölfle, P. First-Sound Attenuation and Viscosity of Superfluid He 3-B. Phys. Rev. Lett. 1980, 44, 1337. [Google Scholar] [CrossRef] [Green Version]
  11. Spelt, P.D.M.; Norato, M.A.; Sangani, A.S.; Greenwood, M.S.; Tavlarides, L.L. Attenuation of Sound in Concentrated Suspensions: Theory and Experiments. J. Fluid Mech. 2001, 430, 51–86. [Google Scholar] [CrossRef] [Green Version]
  12. Bond, L.J.; Judd, K.M.; Tucker, B.J.; Flake, M.; Boukhny, M. Physics of Phacoemulsification; U.S. Department of Energy: Washington, DC, USA, 2003.
  13. Zheng, Y.; Zhang, Q. Simultaneous measurement of gas and solid holdups in multiphase systems using ultrasonic technique. Chem. Eng. Sci. 2004, 59, 3505–3514. [Google Scholar] [CrossRef]
  14. Chen, A.; Freear, S.; Cowell, D. Measurement of solid in liquid content using ultrasound attenuation. In Proceedings of the 5th World Congress on Industrial Process Tomography, Bergen, Norway, 3–6 September 2007; pp. 820–826. [Google Scholar]
  15. Magalhães, S.; Scheid, C.; Calçada, L.; Lutterbach, L.; Rezende, R.; Waldmann, A. Real time prediction of suspended solids in drilling fluids. J. Nat. Gas Sci. Eng. 2016, 30, 164–175. [Google Scholar] [CrossRef]
  16. Upadhyay, A.K.; Sharma, B. Analysis of Attenuation Coefficient of Halides and Chalcogenides. Int. J. Eng. Technol. Sci. Res. 2017, 4, 1236–1243. [Google Scholar]
  17. da Silva Lobato, L.C.; Ribeiro, T.B.; da Silva, B.S.; Flórez, C.A.D.; Neves, P.N.P.; de Lemos Chernicharo, C.A. Contribuição para o aprimoramento de projeto, construção e operação de reatores UASB aplicados ao tratamento de esgoto sanitário–Parte 3: Gerenciamento de lodo e escuma. Rev. DAE 2018, 66, 30–55. [Google Scholar] [CrossRef]
  18. Iliuta, I.; Thyrion, F.; Muntean, O. Axial dispersion of liquid in gas-liquid cocurrent downflow and upflow fixed-bed reactors with porous particles. Chem. Eng. Res. Des. 1998, 76, 64–72. [Google Scholar] [CrossRef]
  19. Peña, M.; Mara, D.; Avella, G. Dispersion and treatment performance analysis of an UASB reactor under different hydraulic loading rates. Water Res. 2006, 40, 445–452. [Google Scholar] [CrossRef] [PubMed]
Figure 1. Setup used for the bench-scale experiments.
Water 13 01437 g001
Figure 2. Setup used for the demo-scale experiments. (a) Cross-section of the UASB reactor showing the position where the sensor was installed. (b) Top view picture of the UASB reactor, which shows the stainless still support used to fixate the sensor. (c) Photo of the sensor housing before it was inserted in the reactor.
Water 13 01437 g002
Figure 3. Correlation between the sensor signal and gravimetric analysis obtained during the bench- scale and the demo-scale tests. The error bars are defined as the standard deviation of the sensor signals (vertical error bars) and the standard error calculated from the gravimetric analysis triplicates (horizontal error bars).
Water 13 01437 g003
Figure 4. Solids profile inside the demo-scale UASB reactor obtained by gravimetric analysis.
Water 13 01437 g004
Figure 5. Correlation between sensor signal and gravimetric analysis in different positions inside the UASB reactor obtained during the long performance tests. The circles represent the results obtained from the correlation between gravimetric values and sensor values (converted to TS concentration). The diamonds are the absolute errors, calculated as the difference between the gravimetric values and the sensor values (×10−2) for each point. The error bars, shown in the correlation symbols (circles), are defined as the standard deviation of the sensor signals (vertical error bars) and the standard error calculated from the gravimetric analysis triplicates (horizontal error bars). The dashed line is to highlight absolute errors below (and above) 0.01%. The dotted line is a linear correlation curve.
Water 13 01437 g005
Table 1. Characteristics and types of devices used in the setup.
ComponentTechnical Info
Transducer 1Optimus system 0.5 MHz 1.91 mm diameter
Transducer 2Generic Fishfinder
PumpWatson Marlow 530U- 220 rpm
OscilloscopePicoScope 2205 with Picotech v6.13.6
Control BoxOpTelOplaBox for the 500 kHz transducer (10v)
Publisher’s Note: MDPI stays neutral with regard to jurisdictional claims in published maps and institutional affiliations.

