Article

Zooplankton Community Dynamics in Temporary Mediterranean Wetlands: Which Drivers Are Controlling the Seasonal Species Replacement?

by
Juan Diego Gilbert
1,
Inmaculada de Vicente
2,
Fernando Ortega
1 and
Francisco Guerrero
1,3,*
1
Departamento de Biología Animal, Biología Vegetal y Ecología, Campus de Las Lagunillas s/n., 23071 Jaén, Spain
2
Departamento de Ecología, Campus de Fuentenueva s/n., 18071 Granada, Spain
3
Centro de Estudios Avanzados en Ciencias de la Tierra, Energía y Medio Ambiente, Campus de las Lagunillas s/n., 23071 Jaén, Spain
*
Author to whom correspondence should be addressed.
Water 2021, 13(11), 1447; https://doi.org/10.3390/w13111447
Submission received: 25 March 2021 / Revised: 19 May 2021 / Accepted: 20 May 2021 / Published: 21 May 2021
(This article belongs to the Special Issue Advances in Mountain and Mediterranean Wetlands Conservation)

Abstract

:
Temporary Mediterranean wetlands are characterized by both intra and interannual variations in their environmental conditions. These inherent fluctuations in limnological features affect the seasonal variation in the structure and dynamics of the aquatic communities. In this study, we hypothesized that zooplankton community is coupled to seasonal changes of the environmental variables along the hydroperiod. To get this purpose, the study was focused in monitoring, by collecting monthly samples during an annual period, seven temporary Mediterranean ponds located in the south-eastern region of the Iberian Peninsula (Alto Guadalquivir region, Andalusia). The relationships between zooplankton community and the different limnological variables were analyzed based on two approaches: a Spearman correlation analysis and a correspondence canonical analysis (CCA). The results have shown that chlorophyll-a concentration, Secchi depth, total nitrogen concentration, wetland area and depth were the variables with a greater influence on the zooplankton community, explaining the zooplankton species replacement. Moreover, optima and tolerance of the zooplankton species were obtained from the position of species within CCA diagram, allowing the separation of different groups of zooplankton along the hydroperiod. We finally highlight that the monitoring of zooplankton community and environmental conditions are necessary to evaluate how theses singular and endangered aquatic ecosystems will be affected by anthropogenic activities in the future.

1. Introduction

Mediterranean ecosystems drastically differ from the colder-temperate aquatic ecosystems of Northern European in both structure and function [1]. Mediterranean wetlands are characterized by uneven hydroperiods with high intra and interannual water level variations, which lead to spatial and temporal fluctuations. Consequently, one of the most definitory aspects of these ecosystems is the temporality of many of them, which normally begin to fill in the autumn and dry up in the summer. This also conditions in many cases intra-annual differences in salinity values, so that they contain waters with lower salinity at the beginning of the hydrological cycle and more saline waters at the end of the hydroperiod [1]. This situation is responsible for changes in their communities and ecological processes, making them ecologically rich ecosystems supporting a high diversity [2]. This peculiar feature has increased the interest in Mediterranean wetlands, and a considerable number of studies have been focused on processes and the structure of their communities [3,4,5]. Despite this, more studies are still required to know the structure and dynamics of aquatic communities that temporary Mediterranean wetlands support, which actually are threatened by habitat degradation [6,7,8]. This concern has induced a change in the direction of research in the European framework trying to ensure the conservation of these ecosystems, with the implementation of diverse management and protection directives (Habitat Directive Natura 2000 network, Water Framework Directive 2000/60/EC).
Within aquatic ecosystems, plankton communities are an essential element, playing an important role in nutrient recycling and energy flow [9]. Among plankton, zooplankton is recognized as a fundamental component in Mediterranean wetlands [10]. Zooplankton are excellent components for monitoring aquatic environments [11,12,13] due to their small size, short generation time, high sensitivity to environmental changes and low-cost sample collection.
Multiple studies, in a variety of shallow Mediterranean wetlands, have recognized that temporal and spatial variability of these systems can significantly influence the structure and composition of these aquatic invertebrates [2,3,14]. In fact, zooplankton composition and abundance are controlled by many factors such as water hydrochemistry, season, lake morphology, presence of macrophytes, predators and lake production [15]. However, the seasonal relationships between environmental factors and zooplankton assemblages are neglected or only beginning to be explored.
In this study, and considering the seasonal environmental variability that characterize Mediterranean wetlands, we hypothesized that zooplankton community is coupled to seasonal changes of the environmental variables along the hydroperiod. To test the hypothesis, we identify the most important variables in the dynamics of these Mediterranean aquatic ecosystems and the influence in the structure of zooplankton communities (cladocerans and copepods) during a period of flooding and desiccation.

2. Materials and Methods

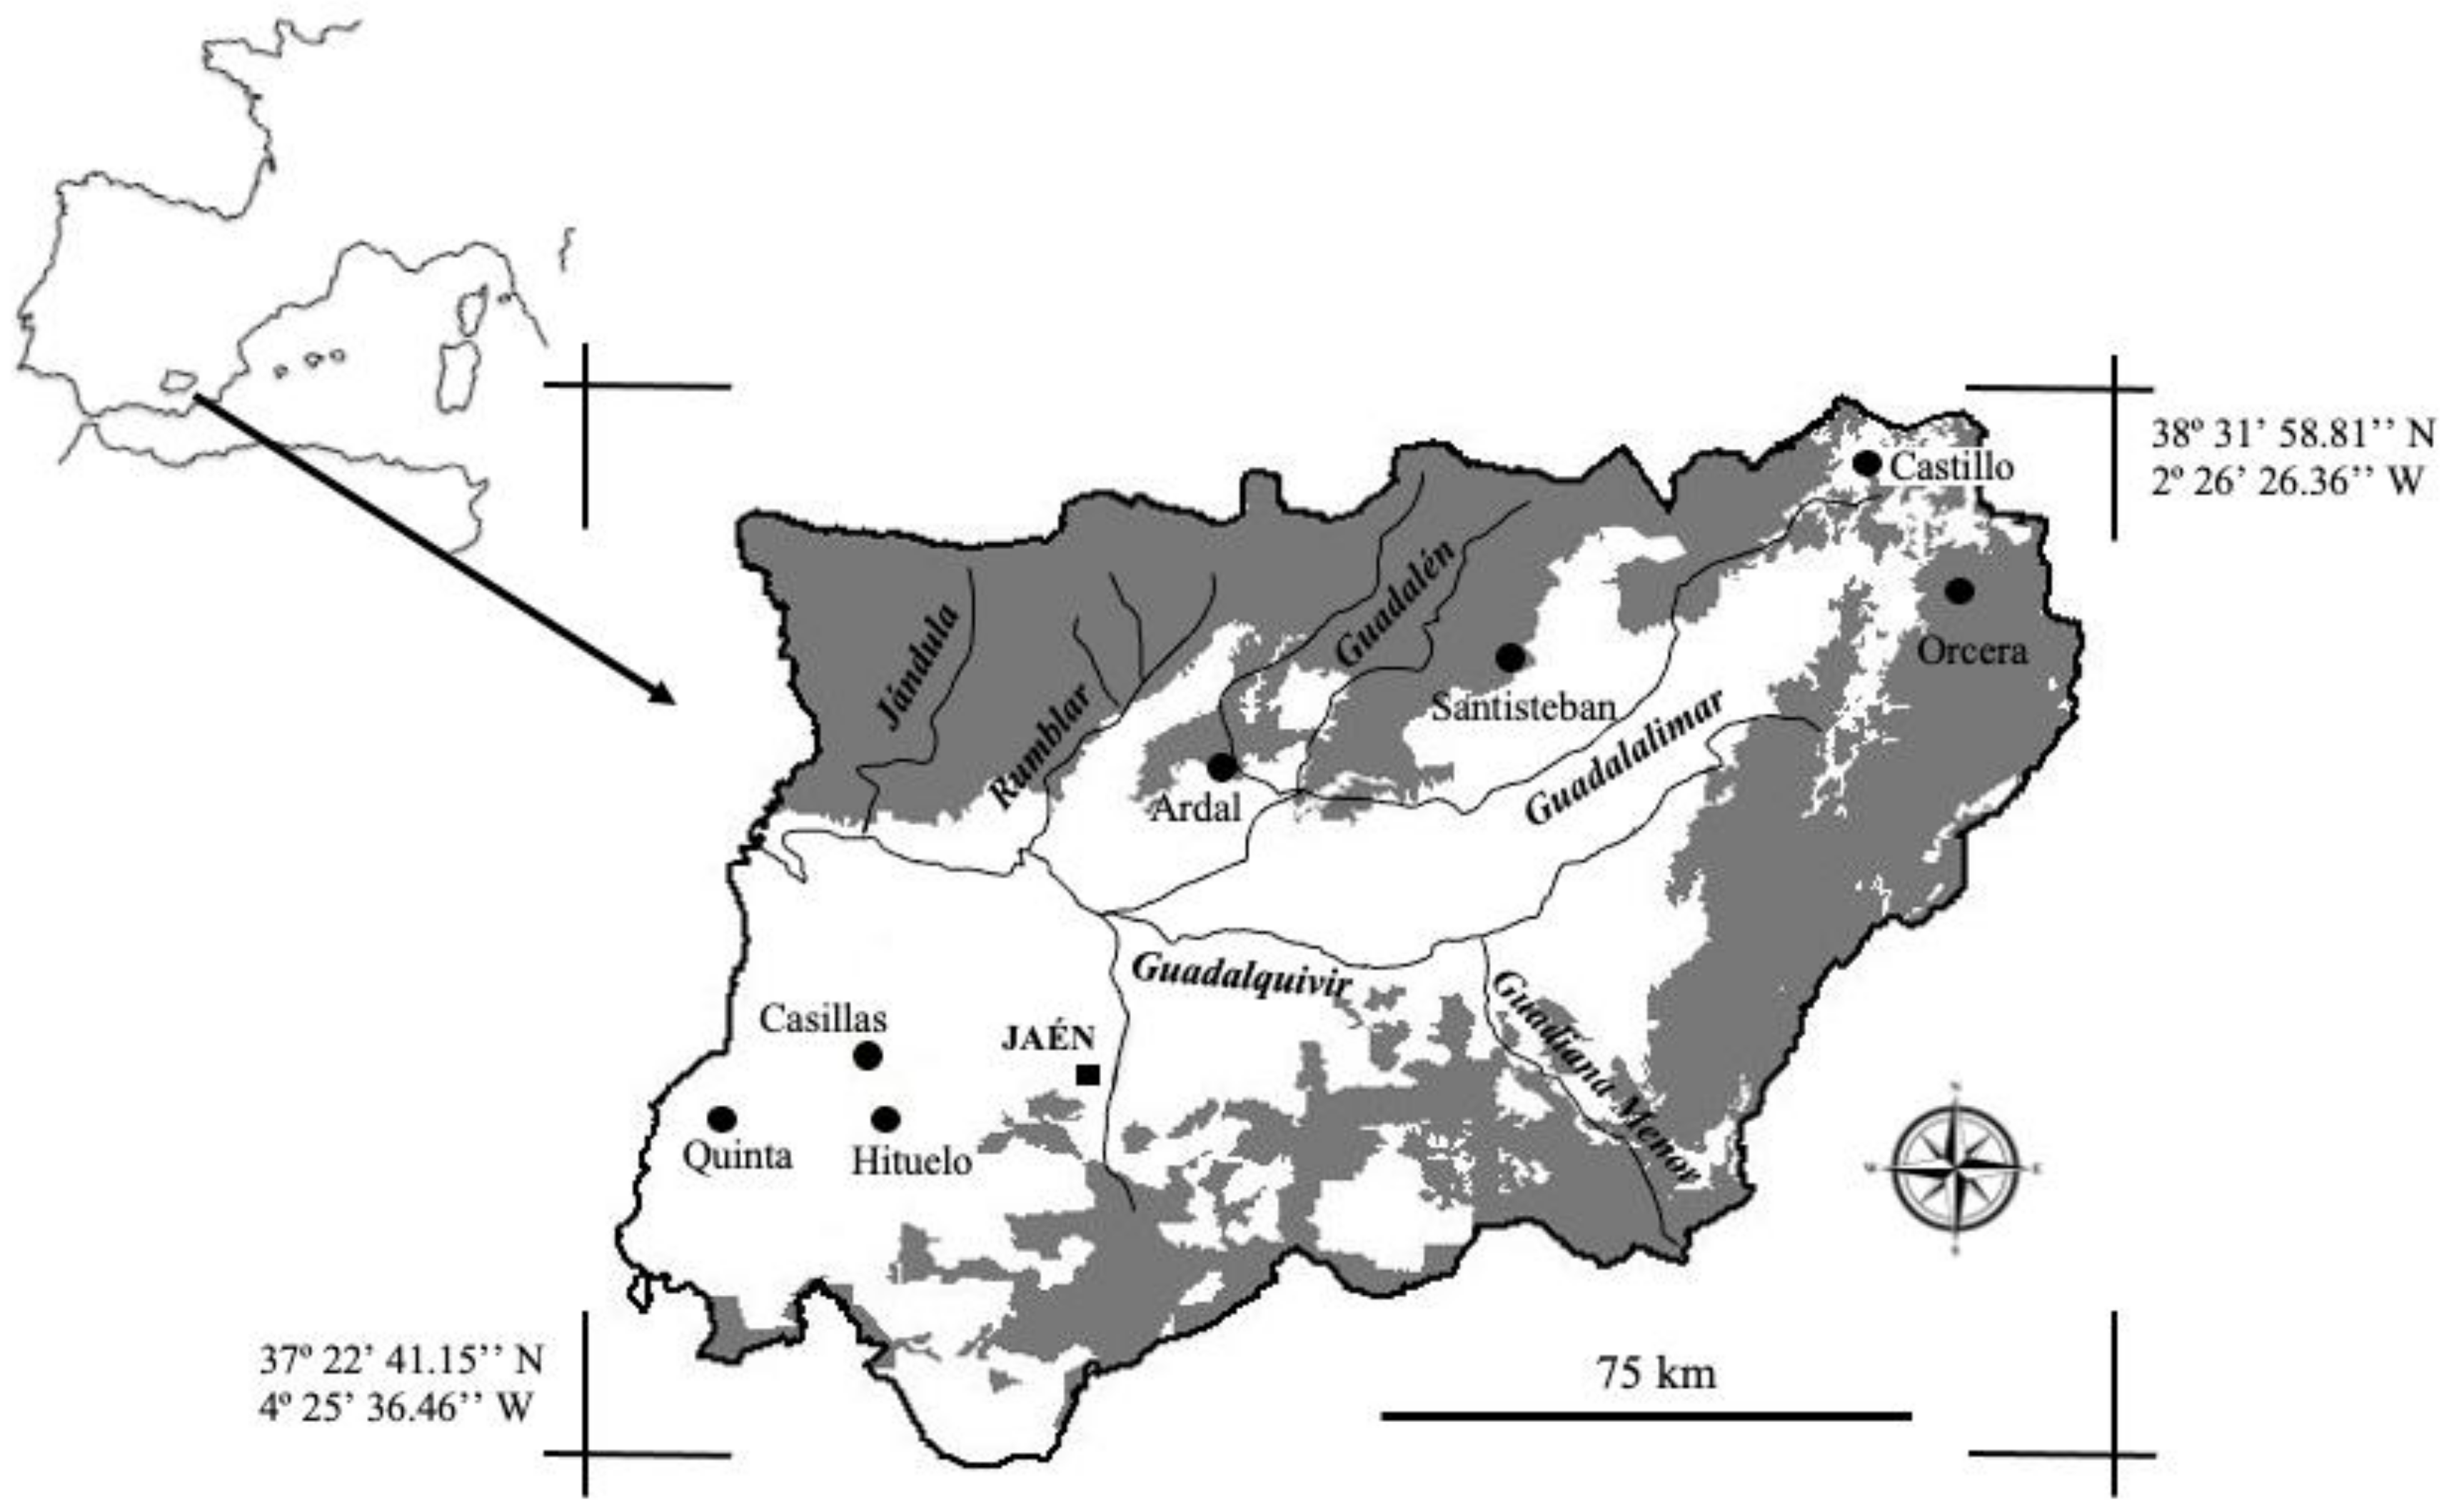
2.1. Study Area and Sample Collection

The study was carried out in seven endorheic ponds located in the South-East of the Iberian Peninsula (Figure 1). These ecosystems are all of them small size, shallow, fishless and temporary, with drastic water level fluctuations in relation to rainfall. Studied ponds present some differences such as the geology and the percentage of olive groves in their watersheds. Three of the ponds (Quinta, Casillas and Hituelo) are located in the Guadalquivir valley and with a high percentage of olives tree (>80%) in their catchment area. Three other ponds (Ardal, Santisteban and Castillo) are located on siliceous materials, while the other pond (Orcera) is located on calcareous materials. Of these four ponds, Castillo is located on an intermediate agricultural land (between 40% and 60% of olive groves) and finally the other three ponds are located in lands with no or low presence of olive groves (less than 10%).
Samples were collected during an annual period, from December 2009 to December 2010. All studied ponds were dry in late spring or summer 2009, filling in autumn-winter 2009–2010. Indeed, all ponds (except Castillo) were dry at the beginning of the sample period. Physicochemical variables and biological samples were taken monthly in each pond. Pond surface area at each sampling date was calculated using measurements of the major and minor axes fitted to simple shapes (circle or ellipse). The hydroperiod length (days of pond inundation—DWI) was measured from the first time when the pond basin was waterlogged.
Water depth at the deepest point was measured in situ in each sampling date with a ruler. Temperature, pH, oxygen and conductivity were determined in situ with a multiparameter probe (YSI 556 MPS). Turbidity was measured in situ as nephelometric turbidity units (NTU) with a Hanna HI93703 probe. Water transparency was determined using a Secchi disk. Many times, and due to the shallowness of ponds, the bottom could be seen from the surface and then Secchi disc depth could not be measured. To tackle this problem, we used the index of the transparency [16], which permit us to obtain the percentage of Secchi disc depth with respect to pond depth. Thus, if Secchi depth is equal to the depth (which means that the bottom could be observed from the surface), the value of the index is 100%; lower values of percentage mean lower transparency and difficulties for light to reach the bottom. Chlorophyll-a concentration (Chl-a) was obtained from fluorescence measurements taken in situ with a field fluorometer Aquafluor Turner Design Handheld, previously calibrated by fluorometry. The percentage covered by submersed macrophytes (SM—charophytes and vascular plants) was estimated as a percentage of pond surface based on visual site mapping.
In the laboratory, unfiltered integrated water samples were digested with potassium persulfate for analysis of total P (TP) and with sulfuric acid for analysis of total N (TN). TP and TN were spectrophotometrically quantified by using the molybdenum-blue method [17] and the ultraviolet spectrophotometric screening [18], respectively. Detection limits were 1 μg P L−1 (TP) and 40 μg N L−1 (TN). Organic matter (OM) was estimated by the loss on ignition at 450 °C during 3 h.
Zooplankton samples were taken along two longitudinal transects, one from the shoreline to the open waters and another along the shoreline, with a plankton net with a mesh size of 63 µm and a mouth diameter of 27.5 cm. Both samples were combined to obtain an integrated sample and fixed in situ with 4% formalin (final concentration). In each sampling time two zooplankton samples were collected, one for estimating the abundance of copepods (calanoids and cyclopoids) and branchiopods, and another one for measuring total biomass. Once in the laboratory, zooplankton taxa were firstly identified to species level using taxonomic keys [19,20,21], and later abundance data was also obtained. As a result, for each zooplankton sample, the following parameters were calculated: (i) community parameters: species richness (R), Shannon–Wiener diversity index (H’), Pielou evenness index (J) and Simpson dominance index (D); (ii) ratio calanoid copepods abundance (Cal) versus cyclopoid copepods (Cycl) plus cladocerans abundance (Cla—[22]); (iii) ratio of abundance of large cladocerans (Daphnia and Simocephalus) versus the total abundance of cladocerans [10]; (iv) total zooplankton biomass; obtained from the dry weight values at 105 °C. Community parameters values were obtained using the software PAST 2.8b.

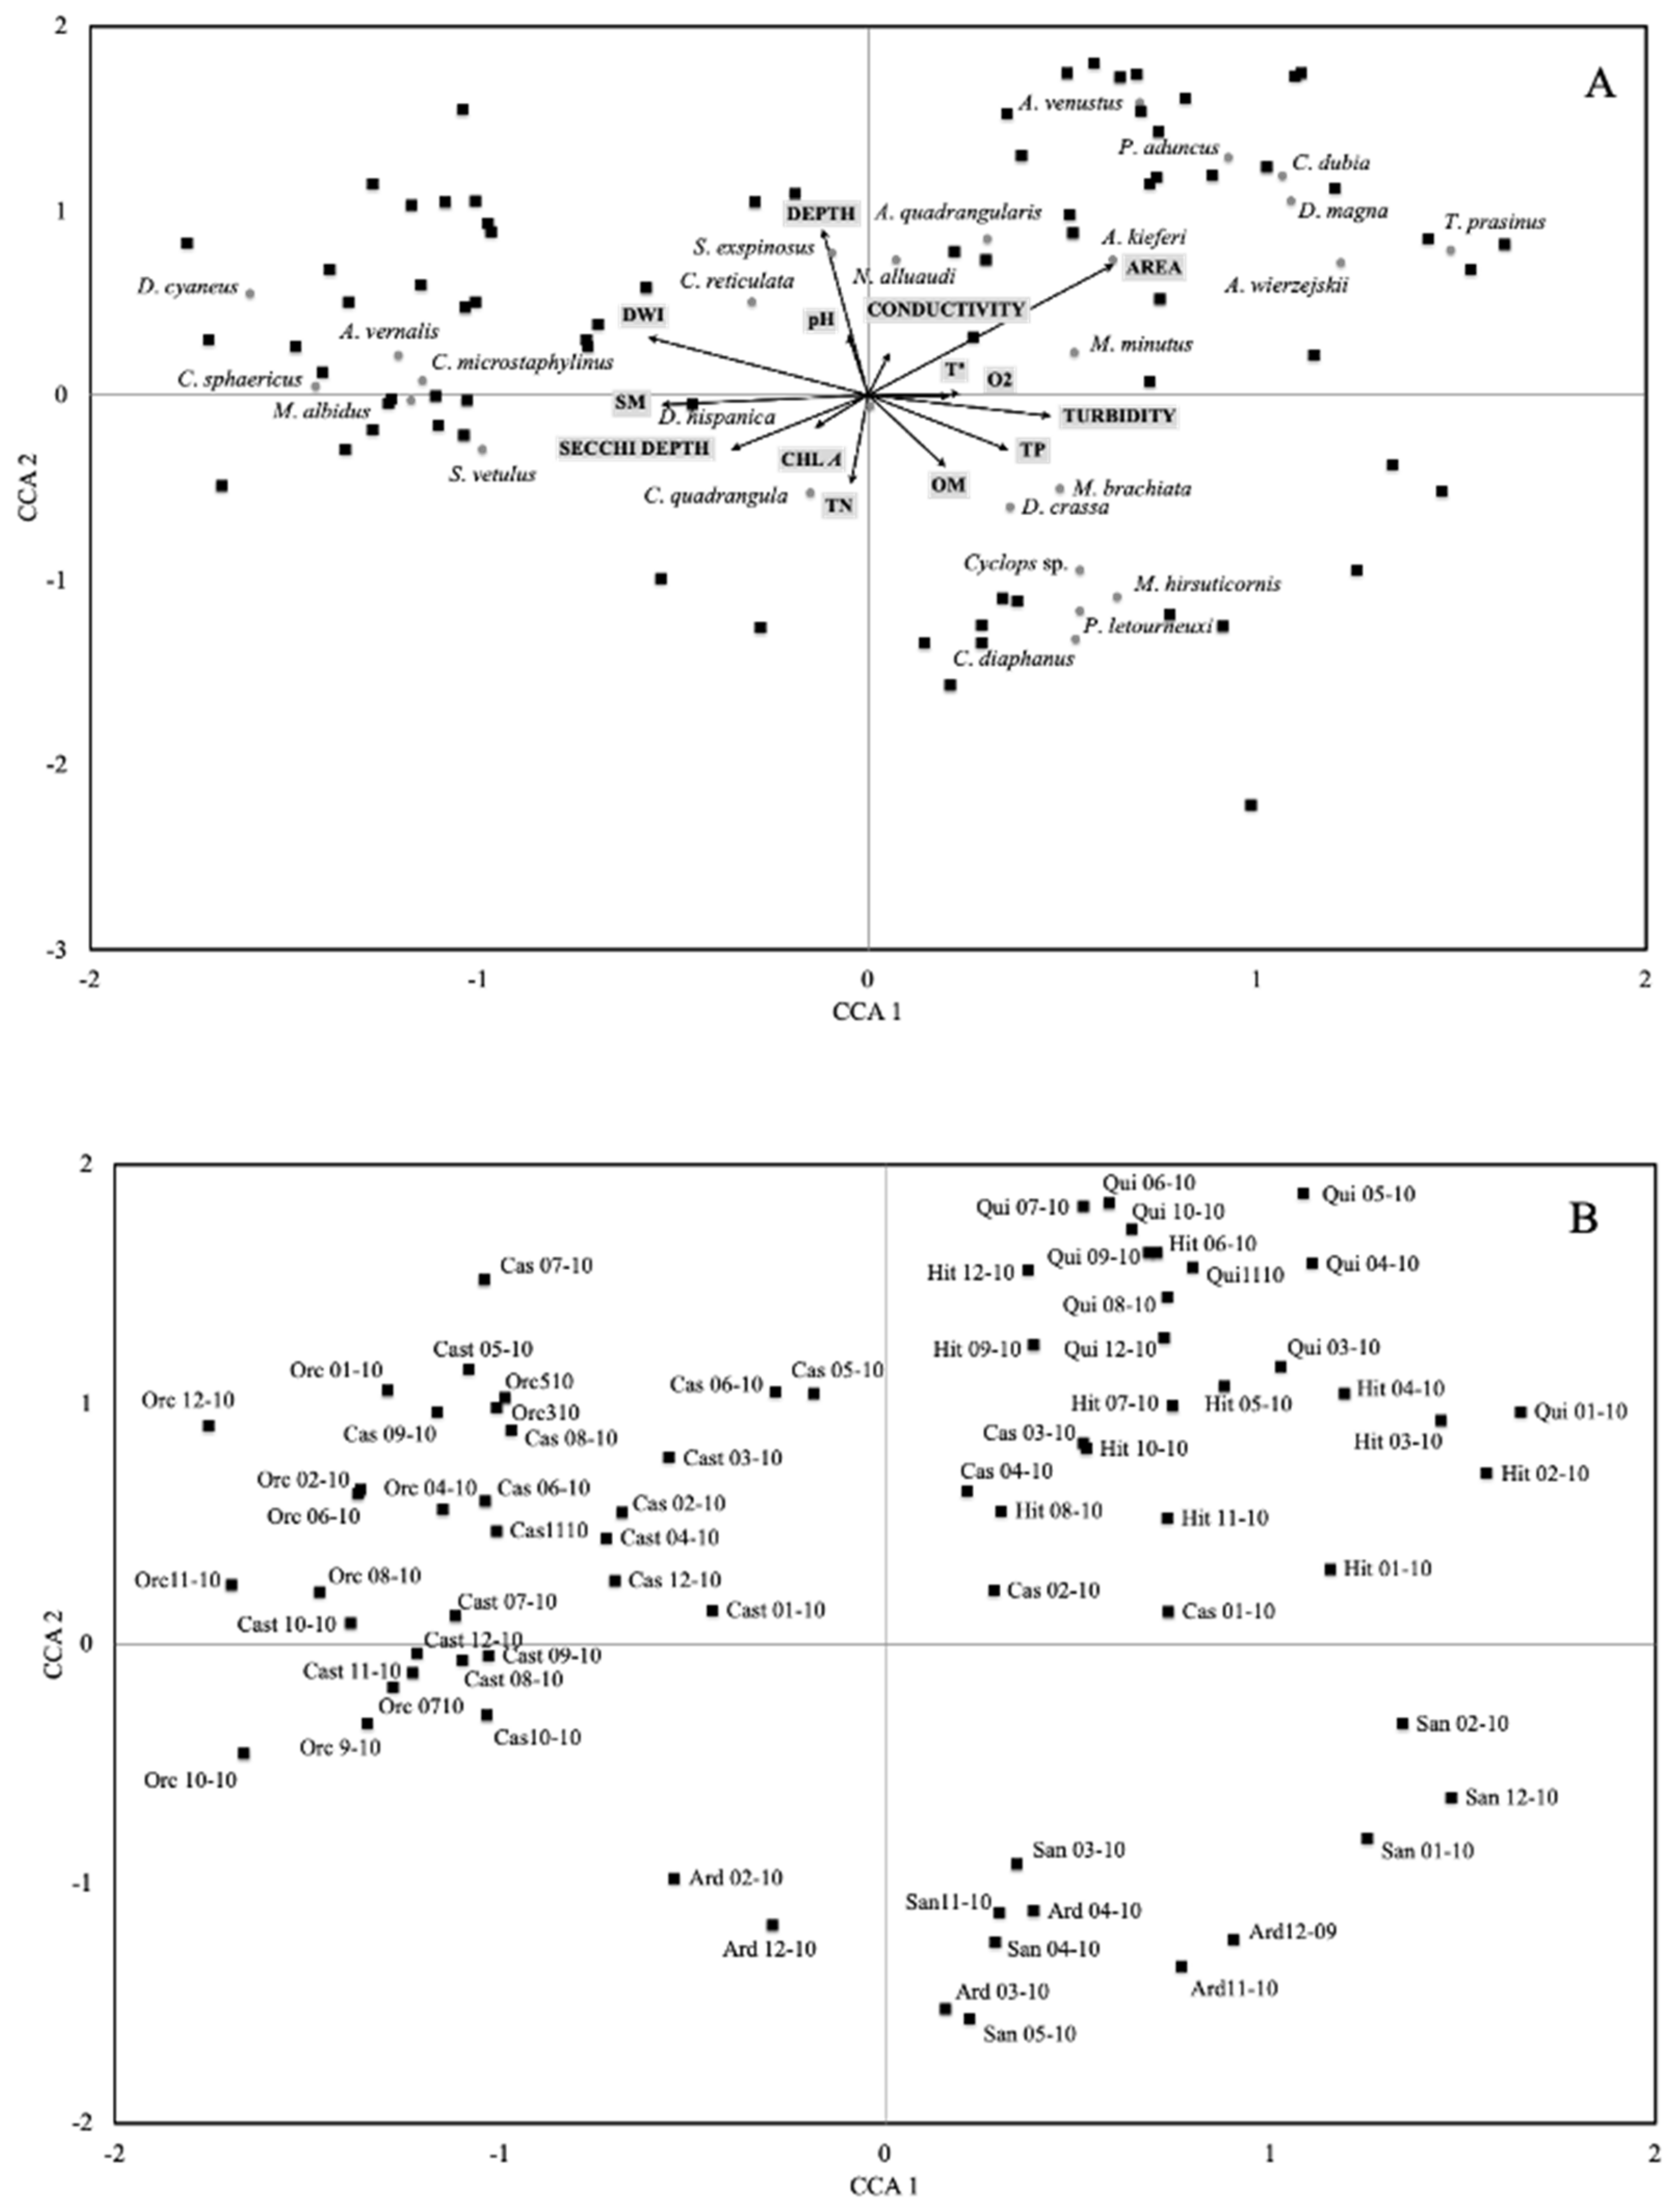
2.2. Statistical Analysis
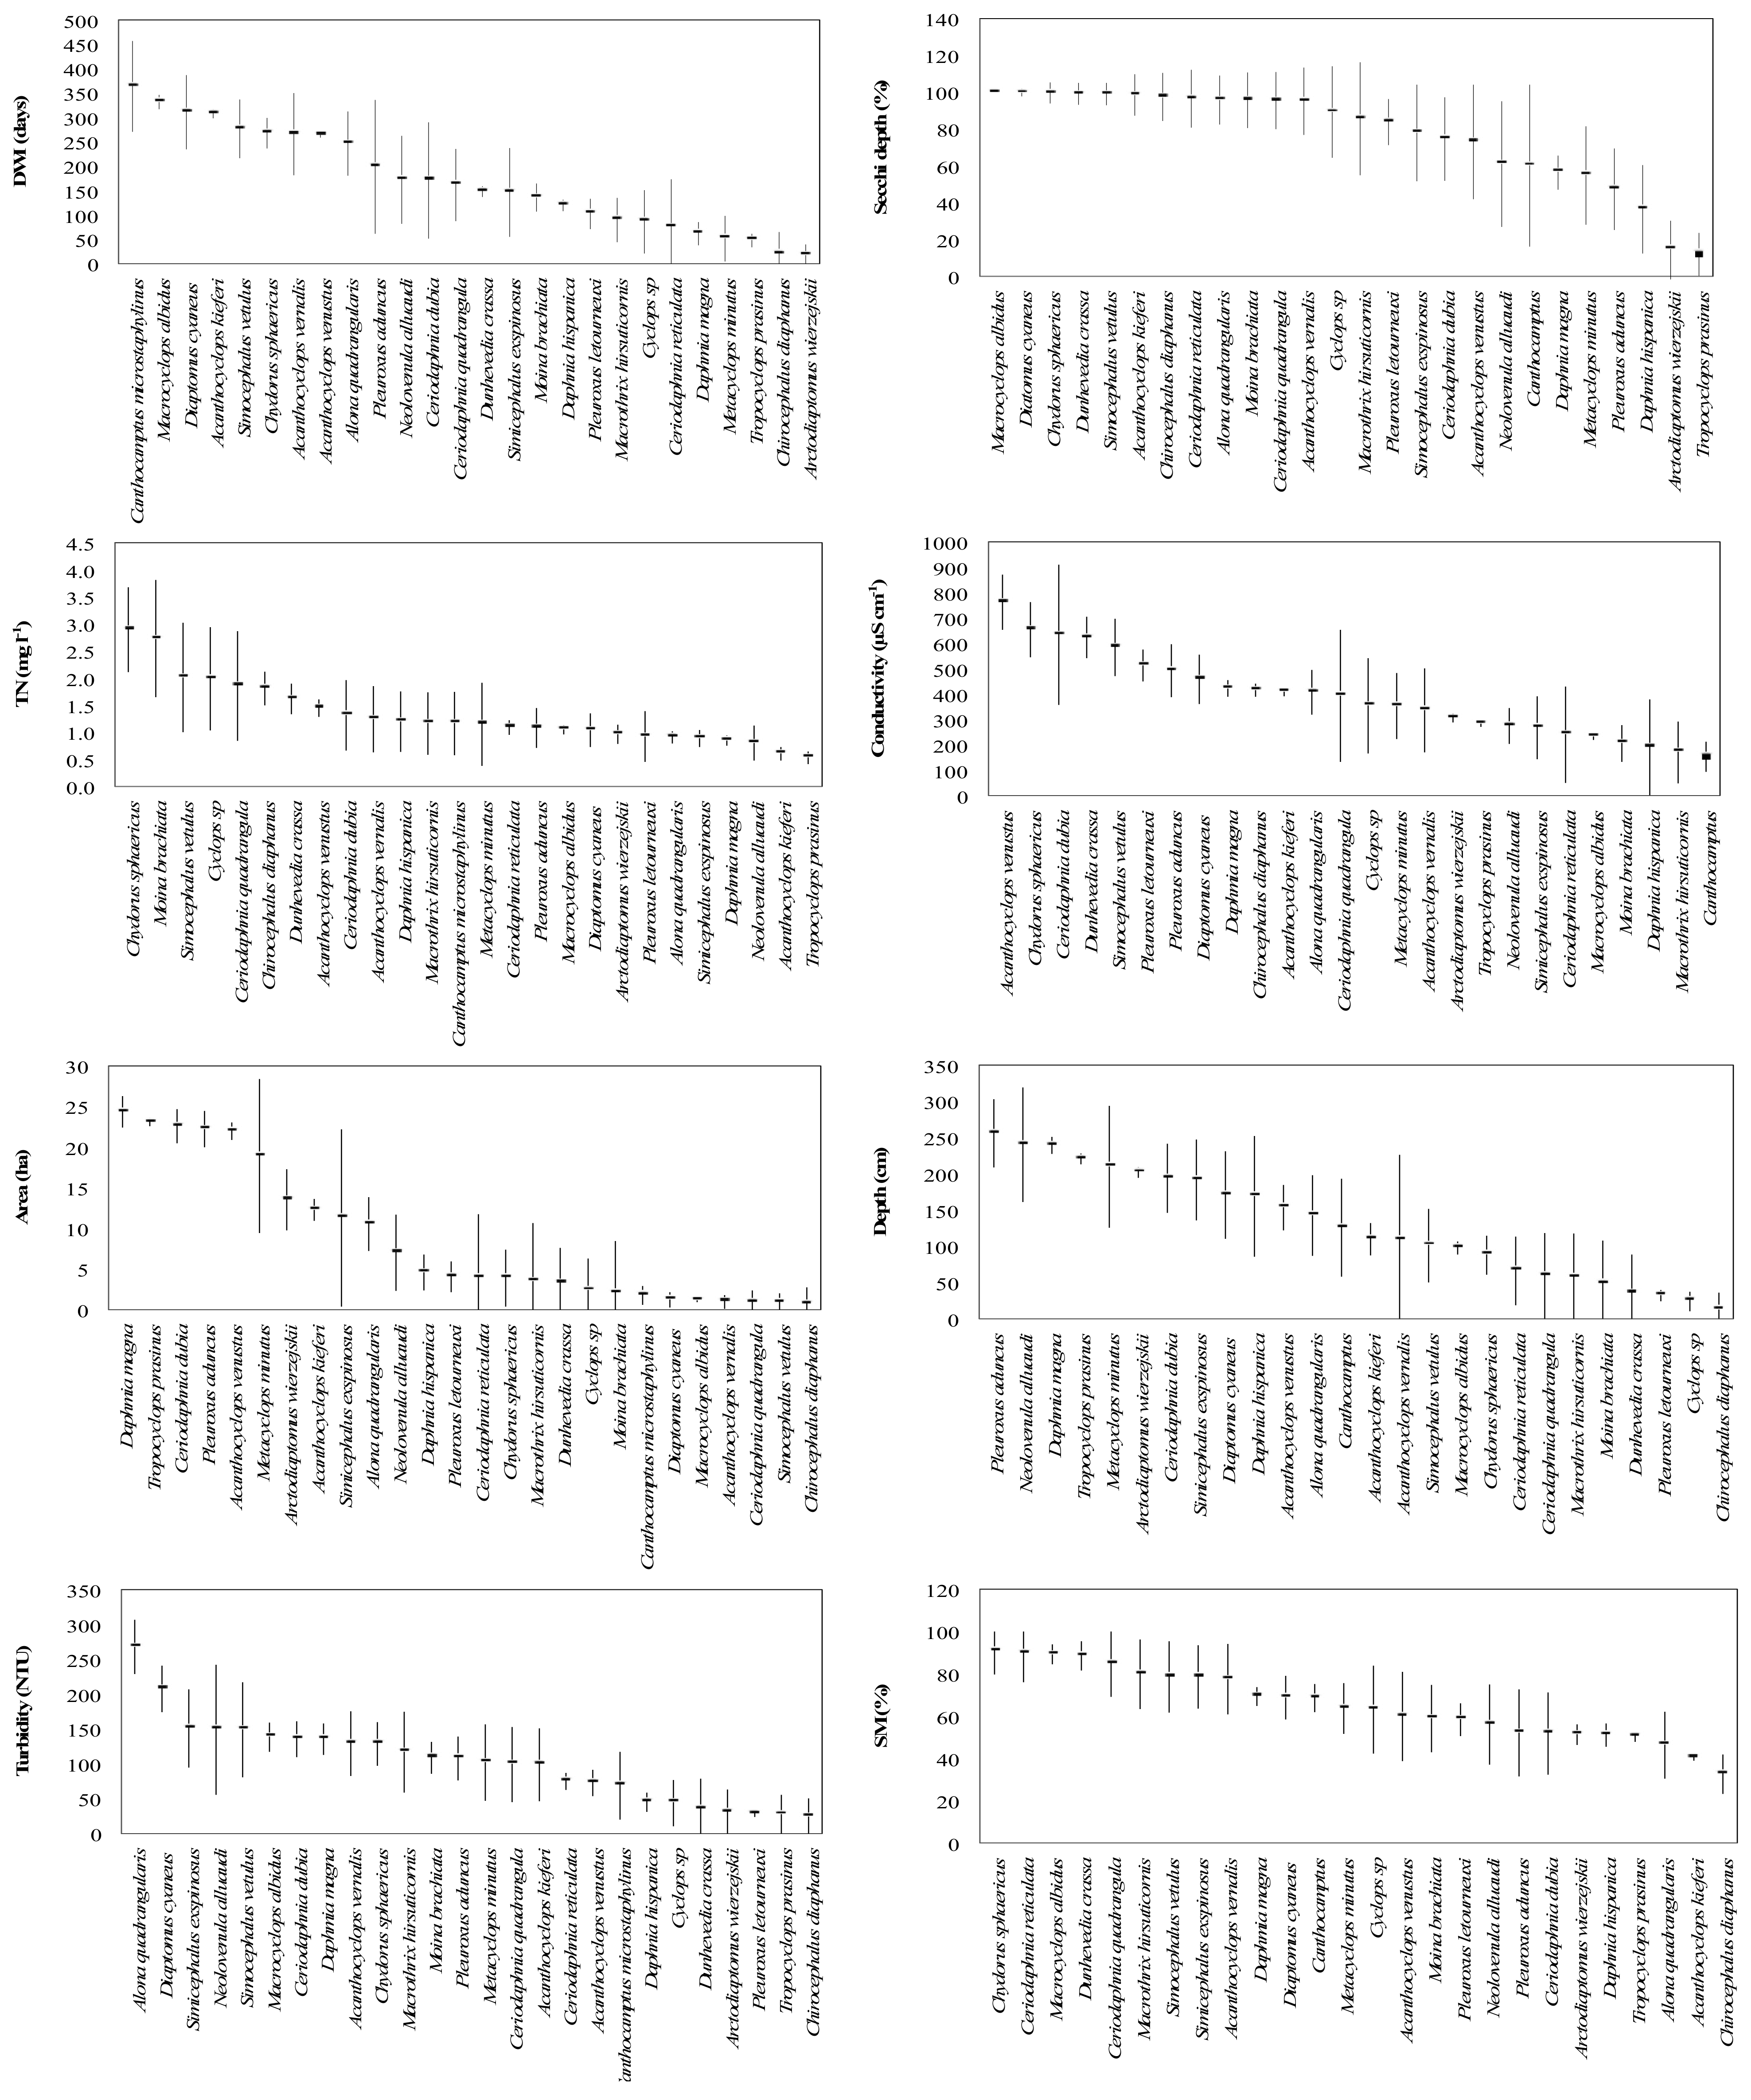
Zooplankton assemblages were analyzed based on three different approaches: (i) a permutational analysis of variance (PERMANOVA), performed with 9999 permutations on the Bray–Curtis measure to test differences in the environmental variables and zooplankton communities across ponds and date, (ii) a Spearman correlation analysis between the four arrays above mentioned (community parameters, different ratios between zooplankton groups, zooplankton biomass and environmental variables) and (iii) a canonical correspondence analysis (CCA), a multivariate direct gradient analysis commonly used in ecology to obtain a linear combination of environmental variables assuming an unimodal species–environment relationship [23,24]. CCA was selected because a preliminary detrended correspondence analysis (DCA) indicated that the data set exhibited a length of gradient >3 [25].
Later, the results of CCA were plotted using the obtained linear combination scores (LC scores [26]). In the ordination graph only the first two axes were used because they showed the highest eigenvalues and amount of variation by CCA ordination. A Monte Carlo permutation test (999 permutations) was used to assess the statistical significance of the ordination axes and of the species–environment correlations (Intraset correlations; [27]).
In turn, the position of species within the CCA diagram indicates approximately their environmental optima [27]. In this sense, the CCA is a method based on weighted averaging (WA) where the optimum for an environmental factor of a species is estimated as:
u k = y i k x i y k i
and the tolerance of a species as:
t k = ( y i k ( x i u k ) 2 y k i ) 1 / 2
where uk is the optimum of species k; yki is the abundance of species k at site i; xi is the value of the environmental factor at site i.
Prior to analyses, the data (species abundances and environmental variables) were tested to normality with a Kolmogorov–Smirnov test. When the assumption of normality was not fulfilled, a log10 (× + 1) transformation was used to reduce the influence of the most dominant species and to remove the influence of different scales of measured variables. Rare species (<10% of abundance in the samples) were removed from the analysis. Spearman correlation analysis was performed by using the software Statistica and CCA with PC-ORD.

3. Results

Although in general, strong differences in their environmental conditions among the seven studied ponds emerged (see Table 1), some general patterns can be described. Conductivity values indicate that all ponds are fresh-hyposaline during the study period (sensu [28]), ranging from 57.7 in Ardal to 955 μS cm−1 in Quinta, both in November 2010. For all studied ponds, Chl-a concentration was extremely low (<10 μg L−1), which additionally to the high-water transparency, lastly promotes that macrophytes may cover a high percentage of pond area. Contrary to it was expected based on the low algal biomass, TP concentrations were generally high, ranging from 35.4 in Orcera to 206.7 μg L−1 in Casillas. Finally, flooding period widely differ among the studied ponds, experiencing the shortest flooding time in ponds, which seasonally dried up (Ardal and Santisteban), and the longest in the first to be flooded (Castillo).
Attending to the zooplankton community parameters, the studied ponds also shown obvious differences (see Table 2). The total cumulative species richness ranges from a minimum of six species in Ardal to a maximum of 13 species in Hituelo pond, with minimum and maximum values in Casillas pond (one species in summer and ten species in winter). As a general rule, the richness of branchiopods species is higher than the copepods. The low values of diversity and equitability are also noteworthy.
Table 3 shows the seasonal abundance data for copepods and branchiopods in all studied ponds, and the ratios Cal:Cycl+Cla, GranCla:TotCla and total biomass values. The results obtained show a high variability between stations and ponds in all community parameters, being remarkable the greater abundance of copepods on branchiopods.
The results of the PERMANOVA have shown that considering the seven studied ecosystems, samples from different ponds are statistically different attending both, environmental variables (F(1,6) = 7.771; p < 0.001) and zooplankton communities (F(1,6) = 10.44; p < 0.001). When the seasonal differences between all the ponds are taken into account, the results show the same results, both for environmental variables (F(1,3) = 7.801; p < 0.0001) and for the zooplankton community (F(1,3) = 1.611; p < 0.01), reflecting a different seasonal dynamic. Furthermore, when the seasonal changes are analyzed for every pond individually, the results shown that for environmental variables exists significant statistical differences in Castillo (F(1,3) = 2.514; p < 0.05), Orcera (F(1,3) = 3.768; p < 0.0008), Hituelo (F(1,3) = 4.777; p < 0.05), Quinta (F(1,3) = 7.307; p < 0.0001) and Casillas pond (F(1,3) = 6.045; p < 0.05), while no differences have been shown in Ardal (F(1,1) = 3.501; p = 0.2011) and Santisteban (F(1,2) = 1.53; p = 0.2595). For zooplankton communities the results are quite different, with statistical differences in three of the same ponds (Orcera (F(1,3) = 4.015; p < 0.005), Hituelo (F(1,3) = 1.768; p < 0.05) and Casillas (F(1,3) = 2.241; p < 0.05)), and without differences in the other four ponds (Castillo (F(1,3) = 1.356; p > 0.05), Ardal (F(1,1) = 0.6502; p > 0.05) and Santisteban (F(1,2) = 0.749; p > 0.05) and Quinta (F(1,3) = 1.479; p > 0.05)).
Spearman correlation between zooplankton community parameters and environmental variables shows that among all variables, Chl-a, Secchi depth, pond area, depth and TN were those with a greater influence on the parameters of the community (Table 4). Chl-a was negatively related to total zooplankton and branchiopods richness, to zooplankton Shannon–Wiener diversity, to zooplankton dominance, and to the ratio Cal:Cycl+Cla. TN concentration was negatively correlated to total zooplankton and copepod richness and to the ratio Cal:Cycl+Cla. Positive relationships between Secchi depth and richness were also observed, and also with the ratio GranCla:TotCla. Finally, morphometric parameters such as pond area and depth were, in general, positively and significantly related to zooplankton richness (i.e., total and branchiopods richness), and to the ratio Cal:Cycl+Cla.
The relationship between zooplankton assemblages and environmental variables in CCA (Table 5) was significant (Monte Carlo test, p < 0.001). The first three CCA axes explain 25.4% of the total variance of the species–environment relationship. The first axis (10.3%) was positively and significantly correlated with turbidity and negatively with SM and DWI. The second axis (9%) was positively correlated with area, depth and Secchi depth and negatively with TN. Finally, the third axis 3 (6.1%) was only negatively correlated with conductivity. The CCA ordination (Figure 2) shows that on the first axis, samples with positive coordinates that represent the initial stages after the flooding event are dominated by the copepods Tropocyclops prasinus and Arctodiaptomus wierzejskii. These species appear in sites with high values of turbidity and obviously with low percentages of macrophytes. On the other hand, samples located in negative coordinates (with an increase of the flood period, macrophytes coverage and reduction of turbidity) are represented by the copepods Diaptomus cyaneus, Macrocyclops albidus and by the cladocerans Chydorus sphaericus and Simocephalus vetulus. The second axis distributes the samples according principally to pond morphometry and nutrient concentration (TN). Samples located in the upper part of this axis are present in ponds with higher depth and the species associated are the cladocerans Daphnia magna, Ceriodaphnia dubia, Pleuroxus aduncus and the copepod Acanthocyclops venustus. In the lower part, appear samples that have greater nutrient concentrations, and the species related are the anostraca Chirocephalus diapahanus, the cladocerans, Pleuroxus letourneuxi, Macrothrix hirsuticornis and the copepod Cyclops sp.
Finally, Figure 3 shows optima and tolerance of the most important variables that explain the zooplankton distribution in the CCA analysis (turbidity, SM, DWI, area, depth, Secchi depth, TN and conductivity). The position of the different species in each of these figures provides a very interesting information about their ecological niche. Thus, for example, the predominant position in the lower parts of the figures of the anostraca species Chirocephalus diaphanus indicates, and thus agrees with the bibliographic data [21], that it is a species that lives in small and shallow ponds, with short hydroperiods and with transparent and fresh or subsaline waters. In the same way, these results also show that calanoid diaptomids appear in ponds with a medium-high surface area and depths greater than 1 m, being also a group that does not tolerate very high concentrations of nutrients (TN). Finally, it is also interesting to note the predominance of brachiopods in ponds with a high percentage of submerged macrophytes.

4. Discussion

The Mediterranean region includes high-diversified wetlands with unusual limnological characteristic that makes them different from the temperate aquatic systems [1]. These wetlands are valuable in terms of salinity, which range from freshwater to hypersaline and, also, in terms of the hydroperiod comprising a gradient from permanent to temporary systems [1,29]. In this context, it is essential to recognize that zooplankton represent a model community for monitoring changes in these ecosystems [30].
The results obtained in this study shows that local conditions, like geology and the land uses in the watersheds between others, are manifested in differences in the environmental variables and also in the different biotic communities (zooplankton community) that ponds present. These results coincide with those obtained previously in the same study area [31,32]. Moreover, these differences are also globally pointed out between seasons. In a more detailed study and considering the environmental variables, these differences are not patent in ponds with a lower hydroperiod (Ardal and Santisteban), but are clearly manifest in ponds located in the Guadalquivir valley (Hituelo, Quinta and Casillas) and in the other two ponds (Castillo and Orcera). Regarding the zooplankton community, the situation is unlike, since only in three ponds significant statistical differences have been found (Orcera, Hituelo and Casillas). In these ponds we could indicate that seasonal differences in environmental conditions are reflected in zooplankton communities. However, the absence of differences in two of the other ponds would be clearly justified by the similarity in the environmental variables (Ardal and Santisteban), while in the other two ponds (Castillo and Quinta) it would be more difficult to find a justification.
Our results clearly show the high intra and interannual variability of Mediterranean wetlands [1]. Thus, if this study were carried out on a multiyear scale, the differences that have not been manifested in some studied ponds would surely become evident. Among the most obvious differences we would have the changes in salinity, which would clearly manifest themselves in different zooplankton communities [33], a community that shows adaptations to unpredictable aquatic habitats [34].
The results found in this study are similar to those shown in the bibliography, which exhibit high seasonal variability in populations of crustaceans in Mediterranean temporary ponds, with marked differences between the filling, intermediate and desiccation phases [35,36,37]. However, there are some differences, such as that normally anostracans and diaptomid copepods are the most abundant organisms in the filling phase, cladocerans in the intermediate stage—coinciding with a clear water stage—and some cyclopoids and small cladocerans in the drying stage [35]. In our case, this pattern is not so evident because: (i) except in two ponds, there is no drying phase; (ii) the late and short duration of the flood period could affect the composition of the zooplankton assemblages [36,37] and so, could surely also limit individual and population growth, and restrict the presence of some species [38]; (iii) during the study period, copepods were the most abundant group in all seasons and ponds (except in the Casillas pond in summer), without great abundance of branchiopods in any case. This situation could be due to the high trophic level of the ponds studied [31], a situation that is supported by the low values of the Cal:Cycl+Cla ratio, which has been associated with eutrophic systems [22].
Our results obtained in the correlation analysis reflect the suitability of use total zooplankton and cladocerans species richness and the ratio Cal:Cycl+Cla as biological monitoring indicators. Our results confirm the results obtained in previous studies carried out in coastal Mediterranean wetlands [39]. Attending to the factors that regulates this previous result, several studies [40,41] had reported a negative relationship between zooplankton richness and eutrophic conditions, a result that is also observed in this study (Table 3). Similar results have been previously found indicating the same relationships between TN concentration and zooplankton richness in other Spanish Mediterranean wetlands [39].
On the other hand, and alike to [42], we found a positive and significant influence of pond area and depth on richness of total zooplankton and cladocerans richness. This positive relationship might be explained by a greater number of available niches and larger habitat heterogeneity [43]. However, and contrary to the results observed by many other authors [44], in our case we have not found a relationship with the macrophytes coverage, which support an increment of the habitat heterogeneity, and zooplankton richness. At this point, it is worth to note that this correlation between zooplankton richness and macrophytes coverture has been mainly obtained in lakes characterized by the presence of fish where macrophytes act as a refuge zone [45]. However, a great majority of Mediterranean wetlands, and all of the studied ponds are fishless ecosystems, and thus, an increase in macrophytes biomass could cause a reduction in the phytoplankton biomass, which lastly promote a decrease in the biomass and richness of the zooplankton. Furthermore, macrophytes may also host a diverse and abundant macroinvertebrate assemblage, and it is likely that zooplankton will also face predatory macroinvertebrates once they enter the littoral zone [46]. Therefore, if this phase of high abundance of macrophytes is prolonged in time, as has happened in the study ponds, it translates into a decrease in the total richness of zooplankton.
The results of the CCA have evidenced that eight variables play an important role for determining the zooplankton composition. The extraction of these variables and plotting in a graph have led to a well-defined separation of three groups, which represent a transition of distinctive species assembly along the hydroperiod. In the initial stages, an increase in nutrients concentration occurs as a result of nutrient release from sediments linked, among others, to desorption processes and also due to the organic matter mineralization [47,48,49]. Moreover, an increase in turbidity values also occurs as a consequence of the resuspension of sediment particles during the filling process and by the growth of phytoplankton promoted by an increase in nutrient availability. The species related with these conditions appears in the lower-right quadrant of the CCA, represented among others by Chirocephalus diaphanus, an anostraca, typical of initial stages after pond rewetting [50]. As we indicated previously, Figure 3 shows the same results, that is, a species that lives in small and shallow ponds, with short hydroperiods.
In the intermediate and successive stages of the hydroperiod, nutrient concentrations decreased mainly due to the biological uptake (e.g., macrophytes). It is well-known that the establishment of macrophytes lead to maintain a clear water state because they are effective competitors for nutrients and light with phytoplankton [51]. During this stage, two groups of species can be distinguished. The first is placed in the upper-right quadrant and it is related to intermediate stages characterized by large cladocerans as genus Daphnia. It plays an important role in establishing water clarity by top-down control (grazing) of phytoplankton [52,53,54]. The second group appears in the left part being related to maturate stages after flooding events, which in the case of the study wetlands is related to a longer flood period and therefore a greater coverage of macrophytes with flowering and fruiting stages. This period can be lengthened more or less depending on the hydroperiod of each year, and it is characterized by Dyaptomus cyaneus, Macrocyclops albidus and Chydorus sphaericus. Figure 3 confirms the presence of these species in ponds with high macrophyte coverage.
Finally, it is necessary to indicate that changes in the physical and chemical variables are important drivers of the dynamics of the aquatic community of temporary wetlands, including the zooplankton community. Therefore, an adequate assessment of these wetlands requires a previous step of understanding the organization, structure and functioning of the ecosystem and the composition of these aquatic communities [14,50]. The results obtained under a regional approach facilitate the future application of measures to address possible threats in these temporary ecosystems. Among all of them, the most significant threat is climate change, being its most notable outcome the unpredictability in rainfall patterns that ultimately affects the hydroperiod of temporary aquatic systems. Accordingly, in a scenario of global change, drastic changes are expected in physical, chemical and biological variables, which together with the inherent unpredictable functioning of Mediterranean wetlands will have a greater effect on these ecosystems. In this sense, the results obtained have clearly revealed the role of the zooplankton community as a useful biological indicator of the functioning of the aquatic ecosystem. All in all, our results support the need to include the zooplankton community in monitoring studies as they allow a rapid identification of ecosystem changes, helping to propose management tools for these ecosystems.

Author Contributions

Conceptualization, J.D.G., F.O., I.d.V., F.G.; methodology, J.D.G., F.O., I.d.V., F.G.; software, J.D.G.; formal analysis, J.D.G., F.G.; resources, F.G., I.d.V.; data curation, J.D.G., F.O., I.d.V., F.G.; writing—original draft preparation, J.D.G., F.G.; writing—review and editing J.D.G., F.O., I.d.V., F.G.; visualization, J.D.G., F.O., I.d.V., F.G.; supervision, I.d.V., F.G. All authors have read and agreed to the published version of the manuscript.

Funding

This research received no external funding.

Institutional Review Board Statement

Not applicable.

Informed Consent Statement

Not applicable.

Data Availability Statement

Not applicable.

Acknowledgments

We are thankful to the Andalusian Environmental Office (Consejería de Medio Ambiente, Junta de Andalucía, Spain) for allowing us to collect water and zooplankton samples in the studied wetlands. We also thank three anonymous referees for their valuable comments to improve the manuscript.

Conflicts of Interest

The authors declare no conflict of interest.

References

  1. Álvarez-Cobelas, M.; Rojo, C.; Angeler, D.G. Mediterranean limnology: Current status, gaps and the future. J. Limnol. 2005, 64, 13–29. [Google Scholar] [CrossRef] [Green Version]
  2. Gilbert, J.D.; de Vicente, I.; Ortega, F.; Jiménez-Melero, R.; Parra, G.; Guerrero, F. A comprehensive evaluation of the crustacean assemblages in southern Iberian Mediterranean wetlands. J. Limnol. 2015, 74, 169–181. [Google Scholar] [CrossRef] [Green Version]
  3. Boix, D.; Gascón, S.; Sala, J.; Badosa, A.; Brucet, S.; López-Flores, R.; Martinoy, M.; Gifre, J.; Quintana, X.D. Patterns of composition and species richness of crustaceans and aquatic insects along environmental gradients in Mediterranean water bodies. Hydrobiologia 2008, 597, 53–69. [Google Scholar] [CrossRef]
  4. Badosa, A.; Frisch, D.; Arechederra, A.; Serrano, L.; Green, A.J. Recovery of zooplankton diversity in a restored Mediterranean temporary marsh in Doñana National Park (SW Spain). Hydrobiologia 2010, 654, 67–82. [Google Scholar] [CrossRef]
  5. Gilbert, J.D.; de Vicente, I.; Jiménez-Melero, R.; Parra, G.; Guerrero, F. Selecting priority conservation areas based on zooplankton diversity: The case of Mediterranean wetlands. Mar. Freshw. Res. 2014, 65, 857–871. [Google Scholar] [CrossRef]
  6. Grillas, P.; Gauthier, P.; Yavercovski, N.; Perennou, C. Mediterranean Temporary Pools. Issues Relating to Conservation, Functioning and Management; Station Biologique de la Tour du Valat: Arles, France, 2004; Volume 1. [Google Scholar]
  7. Guerrero, F.; Parra, G.; Jiménez-Gómez, F.; Salazar, C.; Jiménez-Melero, R.; Galotti, A.; García-Muñoz, E.; Lendínez, M.L.; Ortega, F. Ecological studies in Alto Guadalquivir wetlands: A first step towards the application of conservation plans. Limnetica 2006, 25, 95–106. [Google Scholar]
  8. Zacharias, I.; Zamparas, M. Mediterranean temporary ponds. A disappearing ecosystem. Biodiver. Conserv. 2010, 19, 3827–3834. [Google Scholar] [CrossRef]
  9. Harris, R.; Jenkinson, I.; Lehman, J. The first 25 years of Journal of Plankton Research: Looking to the future. J. Plankton Res. 2004, 26, 1–3. [Google Scholar] [CrossRef]
  10. Moss, B.; Stephen, D.; Álvarez, C.; Becares, E.; van de Bunt, W.; Collings, S.E.; van Donk, E.; de Eyto, E.; Feldmann, T.; Fernández-Aláez, C.; et al. The determination of ecological quality in shallow lakes—A tested system (ECOFRAME) for implementation of the European Water Framework Directive. Aquat. Conserv. Mar. Freshw. Ecosyst. 2003, 13, 507–549. [Google Scholar] [CrossRef]
  11. Lougheed, V.; Chow-Fraser, P. Development and use of a zooplankton index of wetland quality in the Lauretian Great Lakes basin. Ecol. Appl. 2002, 12, 474–486. [Google Scholar] [CrossRef]
  12. Bianchi, F.; Acri, F.; Bernardi-Aubry, F.; Berton, A.; Boldrin, A.; Camatti, E.; Cassin, D.; Comaschi, A. Can plankton communities be considered as bio-indicators of water quality in the Lagoon of Venice? Mar. Pollut. Bull. 2003, 46, 964–971. [Google Scholar] [CrossRef]
  13. Boix, D.; Gascón, S.; Sala, J.; Martinoy, M.; Gifre, J.; Quintana, X.D. A new index of water quality assessment in Mediterranean wetlands based on crustacean and insect assemblages: The case of the Catalunya (NE Iberian Peninsula). Aquat. Conserv. Mar. Freshw. Ecosyst. 2005, 16, 441–455. [Google Scholar] [CrossRef]
  14. Frisch, D.; Moreno-Ostos, E.; Green, A.J. Species richness and distribution of copepods and cladocerans and their relation to hydroperiods and other environmental variables in Doñana, south-west Spain. Hydrobiologia 2006, 556, 327–340. [Google Scholar] [CrossRef]
  15. Wetzel, R.G. Limnology: Lake and River Ecosystems, 3rd ed.; Academic Press: London, UK, 2001. [Google Scholar]
  16. Armengol, X.; Antón-Pardo, M.; Atiénzar, F.; Echevarrías, J.L.; Barba, E. Limnological variables relevant to the presence of the endangered White-headed duck in southeastern Spanish wetlands during a dry period. Acta Zool. Acad. Sci. Hung. 2008, 54 (Suppl. 1), 45–60. [Google Scholar]
  17. Murphy, J.; Riley, J.P. A modified single solution method for determination of phosphate in natural waters. Anal. Chem. Acta 1962, 27, 31–36. [Google Scholar] [CrossRef]
  18. APHA. Standard Methods for the Examination of Water and Wastewater; American Public Health Association Inc.: New York, NY, USA, 1995. [Google Scholar]
  19. Dussart, B. Calanoides et Harpacticoides. Les Copépodes des eaux Continentales d´Europe Occidentale; Tome I; Boubee, N. & Cie: Paris, France, 1967. [Google Scholar]
  20. Dussart, B. Cyclopoides et Biologie. Les Copépodes de eaux Continentales d´Europe Occidentale; Tome II; Boubee, N. & Cie: Paris, France, 1969. [Google Scholar]
  21. Alonso, M. Crustacea, Branchiopoda. Fauna Ibérica; Museo Nacional de Ciencias Naturales, CSIC: Madrid, Spain, 1996. [Google Scholar]
  22. Gannon, J.E.; Stemberger, R.S. Zooplankton (especially crustaceans and rotifers) as indicators of water quality. Trans. Am. Microsc. Soc. 1978, 97, 16–35. [Google Scholar] [CrossRef]
  23. Ter Braak, C.J.F. Unimodal Models to Relate Species to Environment; Agricultural Mathematics Group: Wageningen, The Netherlands, 1987. [Google Scholar]
  24. Ter Braak, C.J.F.; Verdonschot, P.F.M. Canonical correspondence analysis and related multivariate methods in aquatic ecology. Aquat. Sci. 1995, 57, 255–289. [Google Scholar] [CrossRef]
  25. Iturrondobeitia, J.C.; Caballero, A.I.; Arroyo, J. Avances en la utilización de los ácaros oribátidos como indicadores de las condiciones edáficas. Munibe 2004, 21, 70–91. [Google Scholar]
  26. Palmer, M.W. Putting things in even better order: The advantages of canonical correspondence analysis. Ecology 1993, 74, 2215–2230. [Google Scholar] [CrossRef]
  27. Ter Braak, C.J.F. Canonical correspondence analysis: A new eigenvector technique for multivariate direct gradient analysis. Ecology 1986, 67, 1167–1179. [Google Scholar] [CrossRef] [Green Version]
  28. Waiser, M.J.; Robarts, R.D. Saline Inland Waters. In Encyclopedia of Inland Waters, 1st ed.; Likens, G.E., Ed.; Elsevier: Oxford, UK, 2009; Volume 2, pp. 634–644. [Google Scholar]
  29. Beklioglu, M.; Romo, S.; Kagalou, I.; Quintana, X.D.; Bécares, E. State of the art in the functioning of shallow Mediterranean lakes: Workshop conclusions. Hydrobiologia 2007, 584, 317–326. [Google Scholar] [CrossRef]
  30. Kagalou, I.I.; Kosiori, A.; Leonardos, I.D. Assessing the zooplankton community and environmental factors in a Mediterranean wetland. Environ. Monit. Assess. 2010, 170, 445–455. [Google Scholar] [CrossRef] [PubMed]
  31. Gilbert, J.D.; Guerrero, F.; Jiménez-Melero, R.; de Vicente, I. Is the bioproduction number a good index of the trophic state in Mediterranean wetlands? Knowl. Manag. Aquat. Ecosyst. 2015, 416, 5. [Google Scholar] [CrossRef] [Green Version]
  32. Gilbert, J.D.; de Vicente, I.; Ortega, F.; García-Muñoz, E.; Jiménez-Melero, R.; Parra, G.; Guerrero, F. Linking watershed land uses and crustacean assemblages in Mediterranean wetlands. Hydrobiologia 2017, 799, 181–191. [Google Scholar] [CrossRef]
  33. López-González, P.; Guerrero, F.; Castro, M.C. Seasonal fluctuations in the plankton community in a hypersaline temporary lake (Honda, southern Spain). Int. J. Salt Lake Res. 1998, 6, 353–371. [Google Scholar] [CrossRef]
  34. Marrone, F.; Ortega, F.; Mesquita-Joanes, F.; Guerrero, F. On the occurrence of Metadiaptonus chevreuxi (Calanoida, Diaptomidae, Paradiaptomidae) in the Iberian Peninsula, with notes on the ecology and distribution of its European populations. Water 2020, 12, 1989. [Google Scholar] [CrossRef]
  35. Sahuquillo, M.; Miracle, M.R. Crustacean and rotifer seasonality in a Mediterranean temporary pond with high biodiversity (Lavajo de Abajo de Sinarcas, Eastern Spain). Limnetica 2010, 29, 75–92. [Google Scholar]
  36. Brucet, S.; Boix, D.; López-Flores, R.; Badosa, A.; Moreno-Amich, R.; Quintana, X.D. Zooplankton structure and dynamics in permanent and temporary Mediterranean salt marshes: Taxon-based and size-based approaches. Arch. Hydrobiol. 2005, 162, 535–555. [Google Scholar] [CrossRef]
  37. Florencio, M.; Fernández-Zamudio, R.; Lozano, M.; Díaz-Paniagua, C. Interannual variation in filling season affects zooplankton diversity in Mediterranean temporary ponds. Hydrobiologia 2020, 847, 1195–1205. [Google Scholar] [CrossRef]
  38. Boix, D.; Sala, J.; Moreno-Amich, R. The faunal composition of Espolla pond (NE Iberian peninsula): The neglected biodiversity of temporary waters. Wetlands 2001, 21, 577–592. [Google Scholar] [CrossRef]
  39. Badosa, A.; Boix, D.; Brucet, S.; López-Flores, R.; Quintana, X.D. Short-term variation in the ecological status of a Mediterranean coastal lagoon (NE Iberian Peninsula) after a man-made change of hydrological regime. Aquat. Conserv. Mar. Freshw. Ecosyst. 2008, 18, 1078–1090. [Google Scholar] [CrossRef]
  40. Pinto-Coelho, R.; Pinel-Alloul, B.; Méthot, G.; Havens, K.E. Crsutacean zooplankton in lakes and reservoirs of temperate and tropical regions: Variation with trophic status. Can. J. Fish. Aquat. Sci. 2005, 62, 348–361. [Google Scholar] [CrossRef] [Green Version]
  41. Kane, D.D.; Gordon, S.I.; Munawar, M.; Charlton, M.N.; Culver, D.A. The planktonic index of biotic integrity (P-IBI): An approach for assessing lake ecosystem health. Ecol. Indic. 2009, 9, 1234–1247. [Google Scholar] [CrossRef]
  42. Jeppesen, E.; Jensen, J.P.; Søndergaard, M.; Lauridsen, T.; Landkildehus, F. Trophic structure, species richness and biodiversity in Danish lakes: Changes along a phosphorus gradient. Freshw. Biol. 2000, 45, 201–218. [Google Scholar] [CrossRef]
  43. Kuczynska-Kippen, N.; Joniak, T. The impact of water chemistry on zooplankton occurrence in two types (field versus forest) of small water bodies. Int. Rev. Hydrobiol. 2010, 95, 130–141. [Google Scholar] [CrossRef]
  44. Kuczynska-Kippen, N.; Joniak, T. Zooplankton diversity and macrophyte biometry in shallow water bodies of various trophic state. Hydrobiologia 2016, 774, 39–51. [Google Scholar] [CrossRef] [Green Version]
  45. Jeppesen, E.; Lauridsen, T.L.; Kairesalo, T.; Perrow, M.R. Impact of submerged macrophytes on fish-zooplankton interactions in lakes. In The Structuring Role of Submerge Macrophytes in Lakes, 1st ed.; Jeppesen, E., Søndergaard, M., Søndergaard, M., Christoffersen, K., Eds.; Springer: New York, NY, USA, 1998; pp. 91–114. [Google Scholar]
  46. González-Sagrario, M.; Balseiro, E.; Ituarte, R.B.; Spivak, E. Macrophytes as refuge or risky area for zooplankton: A balance set by littoral predacious macroinvertebrates. Freshw. Biol. 2009, 54, 1042–1053. [Google Scholar] [CrossRef]
  47. Romo, S.; Villena, M.J.; Sahuquillo, M.; Soria, J.M.; Giménez, M.; Alfonso, T.; Vicente, E.; Miracle, M.R. Response of a shallow Mediterranean lake to nutrient diversion: Does it follow similar patterns as in northern shallow lakes? Freshw. Biol. 2005, 50, 1706–1717. [Google Scholar] [CrossRef]
  48. Søndergaard, M.; Jensen, J.P.; Jeppesen, E. Role of sediments and internal loading of phosphorus in shallow lakes. Hydrobiologia 2003, 506–509, 135–145. [Google Scholar] [CrossRef]
  49. Gilbert, J.D.; Guerrero, F.; de Vicente, I. Sediment desiccation as a driver of phosphate availability in the water column of Mediterranean wetlands. Sci. Total Environ. 2014, 466–467, 965–975. [Google Scholar] [CrossRef] [PubMed]
  50. Angeler, D.G.; Viedma, O.; Sánchez-Carrillo, S. Conservation issues of temporary wetland Branchiopoda (Anostraca, Notostraca: Crustacea) in a semiarid agricultural landscape: What spatial scales are relevant? Biol. Conserv. 2008, 141, 1224–1234. [Google Scholar] [CrossRef]
  51. Scheffer, M. Ecology of Shallow Lakes, 1st ed.; Springer: New York, NY, USA, 1998. [Google Scholar]
  52. Kasprzak, P.; Lathrop, R.C.; Carpenter, S.R. Influence of different-sized Daphnia species on chlorophyll concentration and summer phytoplankton community structure in eutrophic Wisconsin lakes. J. Plankton Res. 1999, 21, 2161–2174. [Google Scholar] [CrossRef]
  53. Moreno-Ostos, E.; Paracuellos, M.; de Vicente, I.; Nevado, J.C.; Cruz-Pizarro, L. Response of waterbirds to alternating clear and turbid water phases in two shallow Mediterranean lakes. Aquat. Ecol. 2008, 42, 701–706. [Google Scholar] [CrossRef]
  54. Effler, S.W.; Spada, M.E.; Gelda, R.K.; Peng, F.; Matthews, D.A.; Kearns, C.M.; Hairston, N.G., Jr. Daphnia grazing, the clear water phase, and implications of minerogenic particles in Onondaga Lake. Inland Waters 2015, 5, 317–330. [Google Scholar] [CrossRef]
Figure 1. Distribution of the studied ponds in the Alto Guadalquivir region (Southeastern Spain).
Water 13 01447 g001
Figure 2. CCA ordination diagram. (A) Biplot showing the position of all samples (black squares); the zooplankton taxa (grey circles) and the environmental variables (arrows) in the plane of the first two axes. (B) Biplot showing the position of all samples (each pond and date - month and year in numbers) in the plane of the two first axes (Orc: Orcera; Cas: Casillas; Cast: Castillo; Hit: Hituelo; San: Santisteban; Orc: Orcera; Ard: Ardal).
Water 13 01447 g002
Figure 3. Optima (points) and tolerance (bars) of the most important variables extracted from the CCA analysis. The 26 taxa arranged in order of decreasing optima. The optima and tolerance for each environmental variable are represented in decreasing order of the optima for each taxon. Note that, as it was expected, the position of species in relation to selected variables is similar to that obtained in CCA analysis. Only the taxa present in more than 10% of samples were considered.
Water 13 01447 g003
Table 1. Mean and standard deviation of limnological variables measured in the studied ponds.
CastilloOrceraArdalSantistebanHitueloQuintaCasillas
Conductivity (µS cm−1)144 ± 55444 ± 126116 ± 52454 ± 128343 ± 74561 ± 199236 ± 44
pH8.3 ± 0.68.1 ± 0.58.1 ± 0.87.8 ± 0.28.1 ± 0.48.5 ± 0.78.5 ± 0.6
Turbidity (NTU)28 ± 676 ± 431 ± 2571 ± 9620 ± 2411 ± 632 ± 44
Chl-a (µg L−1)8.91 ± 7.467.64 ± 4.577.23 ± 3.558.55 ± 2.977.76 ± 10.088.82 ± 8.566.98 ± 5.06
SM (%)80 ± 1988 ± 1465 ± 1756 ± 2754 ± 1466 ± 2364 ± 28
Area (ha)1.94 ± 1.241.68 ± 1.240.14 ± 0.095.10 ± 5.2016.82 ± 4.8222.81 ± 3.453.62 ± 1.14
Depth (cm)148 ± 61172 ± 7829 ± 927 ± 17179 ± 5220 0 ± 51242 ± 87
Secchi depth (cm)94 ± 54172 ± 7829 ± 915 ± 6111 ± 65146 ± 69113 ± 76
Temperature (°C)17.1 ± 8.214.4 ± 7.616.3 ± 6.514.7 ± 5.920.5 ± 7.820.4 ± 7.017.8 ± 7.1
O2 (%)87.8 ± 17.977.6 ± 17.1116.4 ± 32.874.5 ± 14.492.0 ± 10.082.7 ± 15.682.6 ± 21.7
OM (mg L−1)3.9 ± 2.83.5 ± 2.58.2 ± 5.48.5 ± 3.74.2 ± 2.06.1 ± 4.93.8 ± 3.9
TP (µg L−1)57.8 ± 44.135.4 ± 23.5150.9 ± 87.0122.3 ± 80.455.5 ± 33.649.1 ± 22.1206.7 ± 155.3
TN (mg L−1)1.1 ± 0.31.1 ± 0.82.0 ± 1.01.6 ± 0.70.7 ± 0.31.0 ± 0.61.0 ± 0.3
DWI (days)414353192171343340343
Coordinates (UTM)30SWH235730SWH354230SVH472130SVH813430SVG067930SUG867930SVG1084
Altitude (m)7801270400637476289442
Table 2. Annual mean and standard deviation of zooplankton community parameters in the studied ponds.
Total Cumulative RichnessCopepod Abundance (ind L−1)Branchiopod’s Abundance (ind L−1)Shannon-Wiener (H’)Equitability (J)Simpson (D)Cal:Cycl+ClaGranCla:TotClaTotal Biomass (mg L−1)
Castillo947.06 ± 127.211.51 ± 4.160.71 ± 0.290.49 ± 0.200.61 ± 0.160.0023 ± 0.00700.411 ± 0.4200.104 ± 0.149
Orcera865.73 ± 148.8922.07 ± 67.510.60 ± 0.370.44 ± 0.270.67 ± 0.210.2299 ± 0.53090.151 ± 0.2050.123 ± 0.201
Ardal6419.93 ± 678.4945.62 ± 86.900.58 ± 0.220.50 ± 0.280.64 ± 0.18---0.0020.001 ± 0.001
Santisteban9809.82 ± 956.0218.36 ± 34.630.30 ± 0.330.20 ± 0.190.85 ± 0.20---0.0347 ± 0.04820.303 ± 0.195
Hituelo1339.72 ± 100.370.97 ± 2.670.46 ± 0.430.29 ± 0.270.74 ± 0.2752.9825 ± 118.83700.059 ± 0.0920.074 ± 0.119
Quinta12289.70 ± 938.6011.56 ± 32.240.56 ± 0.430.40 ± 0.340.70 ± 0.250.001 ± 0.0010.234 ± 0.2590.015 ± 0.014
Casillas1221.36 ± 51.691.96 ± 4.000.47 ± 0.350.32 ± 0.260.75 ± 0.1911.9280 ± 23.03030.078 ± 0.1430.039 ± 0.048
Table 3. Seasonal mean abundance and standard deviation of copepods and branchiopods (ind L−1) in all studied ponds. Additionally, shown Cal:Cycl+Cla, GranCla:TotCla ratios and total mean and standard deviation for biomass values (mg L−1).
PondSeasonCopepod Abundance
(ind. L−1)
Branchiopoda Abundance
(ind. L−1)
Cal:Cycl+ClaGranCla:TotClaTotal Biomass
CastilloWinter13.86 ± 28.911.35 ± 3.070.0003 ± 0.00020.77 ± 0.370.08 ± 0.13
Spring5.74 ± 7.910.57 ± 0.780.009 ± 0.010.55 ± 0.380.01 ± 0.01
Summer115.12 ± 238.430.26 ± 0.320.00210.45 ± 0.470.10 ± 0.11
Autumn47.75 ± 49.635.92 ± 10.25---0.0140.19 ± 0.23
OrceraWinter1.32 ± 1.200.08 ± 0.080.82 ± 0.920.0710.02 ± 0.02
Spring8.05 ± 7.131.75 ± 3.94---0.041 ± 0.0300.004 ± 0.003
Summer312.95 ± 302.7379.39 ± 126.66---0.12 ± 0.010.23 ± 0.30
Autumn58.11 ± 74.216.51 ± 8.760.103 ± 0.0800.47 ± 0.100.24 ± 0.24
ArdalWinter135.1 ± 156.1290.74 ± 134.91------0.0004 ± 0.0001
Spring1171.47 ± 1656.3371.73 ± 49.78---0.0020.001
Summer---------------
Autumn359.31 ± 392.705.92 ± 7.19------0.001 ± 0.001
SantistebanWinter709.65 ± 881.7111.97 ± 28.41---0.07 ± 0.070.28 ± 0.15
Spring1580.43 ± 833.2228.17 ± 40.01---0.03 ± 0.010.20 ± 0.04
Summer---------------
Autumn603.03 ± 1040.8125.06 ± 47.76------0.40 ± 0.54
HitueloWinter136.87 ± 192.971.28 ± 1.481.18 ± 0.030.23 ± 0.060.21 ± 0.19
Spring7.98 ± 13.591.41 ± 3.8738.31 ± 33.300.010 ± 0.0050.07 ± 0.06
Summer4.08 ± 6.180.01 ± 0.003172.21 ± 216.15---0.009 ± 0.01
Autumn28.37 ± 40.410.87 ± 2.810.24 ± 0.340.08 ± 0.080.009 ± 0.009
QuintaWinter989.41 ± 1790.8627.23 ± 52.550.001 ± 0.0010.60 ± 0.050.017 ± 0.02
Spring4.67 ± 9.920.24 ± 0.250.0030.37 ± 0.100.02 ± 0.02
Summer93.66 ± 132.211.57 ± 1.78------0.006 ± 0.008
Autumn57.50 ± 69.469.90 ± 20.420.00030.02 ± 0.020.02 ± 0.008
CasillasWinter45.52 ± 87.953.08 ± 5.930.53 ± 0.570.04 ± 0.060.08 ± 0.05
Spring21.83 ± 26.581.67 ± 3.215.40 ± 0.360.24 ± 0.320.08 ± 0.04
Summer0.46 ± 0.591.81 ± 3.290.32 ± 0.22---0.005 ± 0.006
Autumn6.56 ± 12.030.85 ± 1.9441.75 ± 33.350.12 ± 0.110.0003 ± 0.0002
Table 4. Coefficients of the Spearman correlation among zooplankton parameters and environmental variables. * p < 0.05; ** p < 0.01; *** p < 0.001.
ConductivitypHTurbidityChl-aSMAreaDepthSecchi TemperatureO2MOTPTNDWI
Total richness −0.290 *−0.318 **0.256 *0.284 *−0.350 ** −0.250 *
Copepod richness−0.403 *** 0.438 ***−0.270 *−0.272 * −0.387 **
Branchiopod’s richness −0.316 **−0.318 **0.304 **0.279 *−0.321 **
Shannon-Wiener (H’) −0.246 *
Equitability (J) −0.250 *
Simpson (D) −0.231 *
Cal:Cycl+cla −0.252 * 0.350 *0.535 ***−0.270 * −0.301 * −0.403 ***
GranCla:TotCla 0.270 *
Total biomass
Table 5. Summary of CCA analysis among zooplankton assemblages and environmental variables. Bold letters reflect the significant related variables for each axis.
Axis1Axis 2Axis 3
Axis summary statistics
Eigenvalue0.6770.5940.401
p-value0.0010.0010.001
% of variance explained10.396.1
Cumulative % explained10.319.325.4
Pearson Correlation, Spp-Evnt*0.9200.8840.842
p-value0.0010.0010.001
Correlations of environmental variables and canonical axes (Intraset correlations of terBraak, 1986)
Conductivity0.0560.2320.490
pH−0.0520.3310.140
Turbidity0.470−0.1140.195
Chl-a−0.135−0.173−0.384
SM0.531−0.0510.207
Area0.6330.711−0.038
Depth−0.1170.8980.252
Secchi depth−0.350−0.293−0.431
Temperature0.2090.007−0.091
O20.2350.0070.319
OM0.199−0.383−0.430
TP0.361−0.298−0.039
TN−0.0440.481−0.287
DWI0.5650.318−0.476
Publisher’s Note: MDPI stays neutral with regard to jurisdictional claims in published maps and institutional affiliations.

