
Development of a Simulation Model for Real-Time Urban Floods Warning: A Case Study at Sukhumvit Area, Bangkok, Thailand


1
Department of Civil Engineering, Shibaura Institute of Technology, 3-7-5 Toyosu, Koto-ku, Tokyo 135-8548, Japan
2
Water Engineering and Management, School of Engineering and Technology, Asian Institute of Technology, Klong Luang 12120, Pathum Thani, Thailand
*
Author to whom correspondence should be addressed.
Water 2021, 13(11), 1458; https://doi.org/10.3390/w13111458
Submission received: 8 April 2021
/
Revised: 13 May 2021
/
Accepted: 19 May 2021
/
Published: 22 May 2021
(This article belongs to the Special Issue Modelling of Floods in Urban Areas)
Abstract
:Increasingly frequent, high-intensity rain events associated with climatic change are driving urban drainage systems to function beyond their design discharge capacity. It has become an urgent issue to mitigate the water resource management challenge. To address this problem, a real-time procedure for predicting the inundation risk in an urban drainage system was developed. The real-time procedure consists of three components: (i) the acquisition and forecast of rainfall data; (ii) rainfall-runoff modeling; and (iii) flood inundation mapping. This real-time procedure was applied to a drainage system in the Sukhumvit area of Bangkok, Thailand, to evaluate its prediction efficacy. The results showed precisely that the present real-time procedure had high predictability in terms of both the water level and flood inundation area mapping. It could also determine hazardous areas with a certain amount of lead time in the drainage system of the Sukhumvit area within an hour of rainfall data. These results show the real-time procedure could provide accurate flood risk warning, resulting in more time to implement flood management measures such as pumping and water gate operations, or evacuation.
1. Introduction
Globally, flooding continues to be a challenge for urban areas, a problem increasingly exacerbated by higher frequency, intense rainfall events [1,2,3]. Although there is a trend towards implementing water-sensitive urban design (WSUD) or nature-based solutions (NBS), in conjunction with hard engineering approaches [4,5,6,7,8,9] system wide development and improvement of urban drainage systems continue to be a financial and planning challenge for many municipalities [10,11,12,13]. A complementary approach to physical improvements of the drainage system that have the potential to aid in reducing flood damage and loss of life is the development of a real-time flood warning system. Research has been conducted with respect to real-time urban flood warning systems that include the combination of hydraulic and probabilistic modeling for real-time urban flood prediction [14], the application of recurrent neural networks for urban flood control in Taiwan [15], the use of radar images for urban flood detection in the UK [16], and an analysis sensitivity to spatiotemporal resolution of rainfall input and hydro-logic modeling for flash flood forecasting in USA [17], but demonstration of the real-time forecasting techniques remains limited.
Bangkok, Thailand, regularly experiences both large-scale fluvial and localized pluvial flooding that results in considerable damage and that is exacerbated by a number of factors, including rapid urbanization, a change of upstream condition in the northern part of Thailand, limitation of drainage capacity design, tidal effect, land subsidence from groundwater consumption and climate change [18,19,20,21,22]. The Sukhumvit area of downtown Bangkok is a vibrant and important commercial, tourist, and residential hub and, therefore, was chosen as our study site. The objective of the study, then, was to develop and demonstrate a real-time flood forecasting procedure that linked existing ground-level rain gauges, weather radar, a dynamic rainfall forecasting package and a conceptual, deterministic hydrologic/hydraulic model to simulate the drainage system responses in Sukhumvit to sudden heavy rainfall. The goal of the real-time procedure was to provide flood risk warnings sooner than currently is possible and allow earlier implementation of flood management measures such as pumping and water gate operations, or evacuation.
2. Materials and Methods
2.1. Study Area
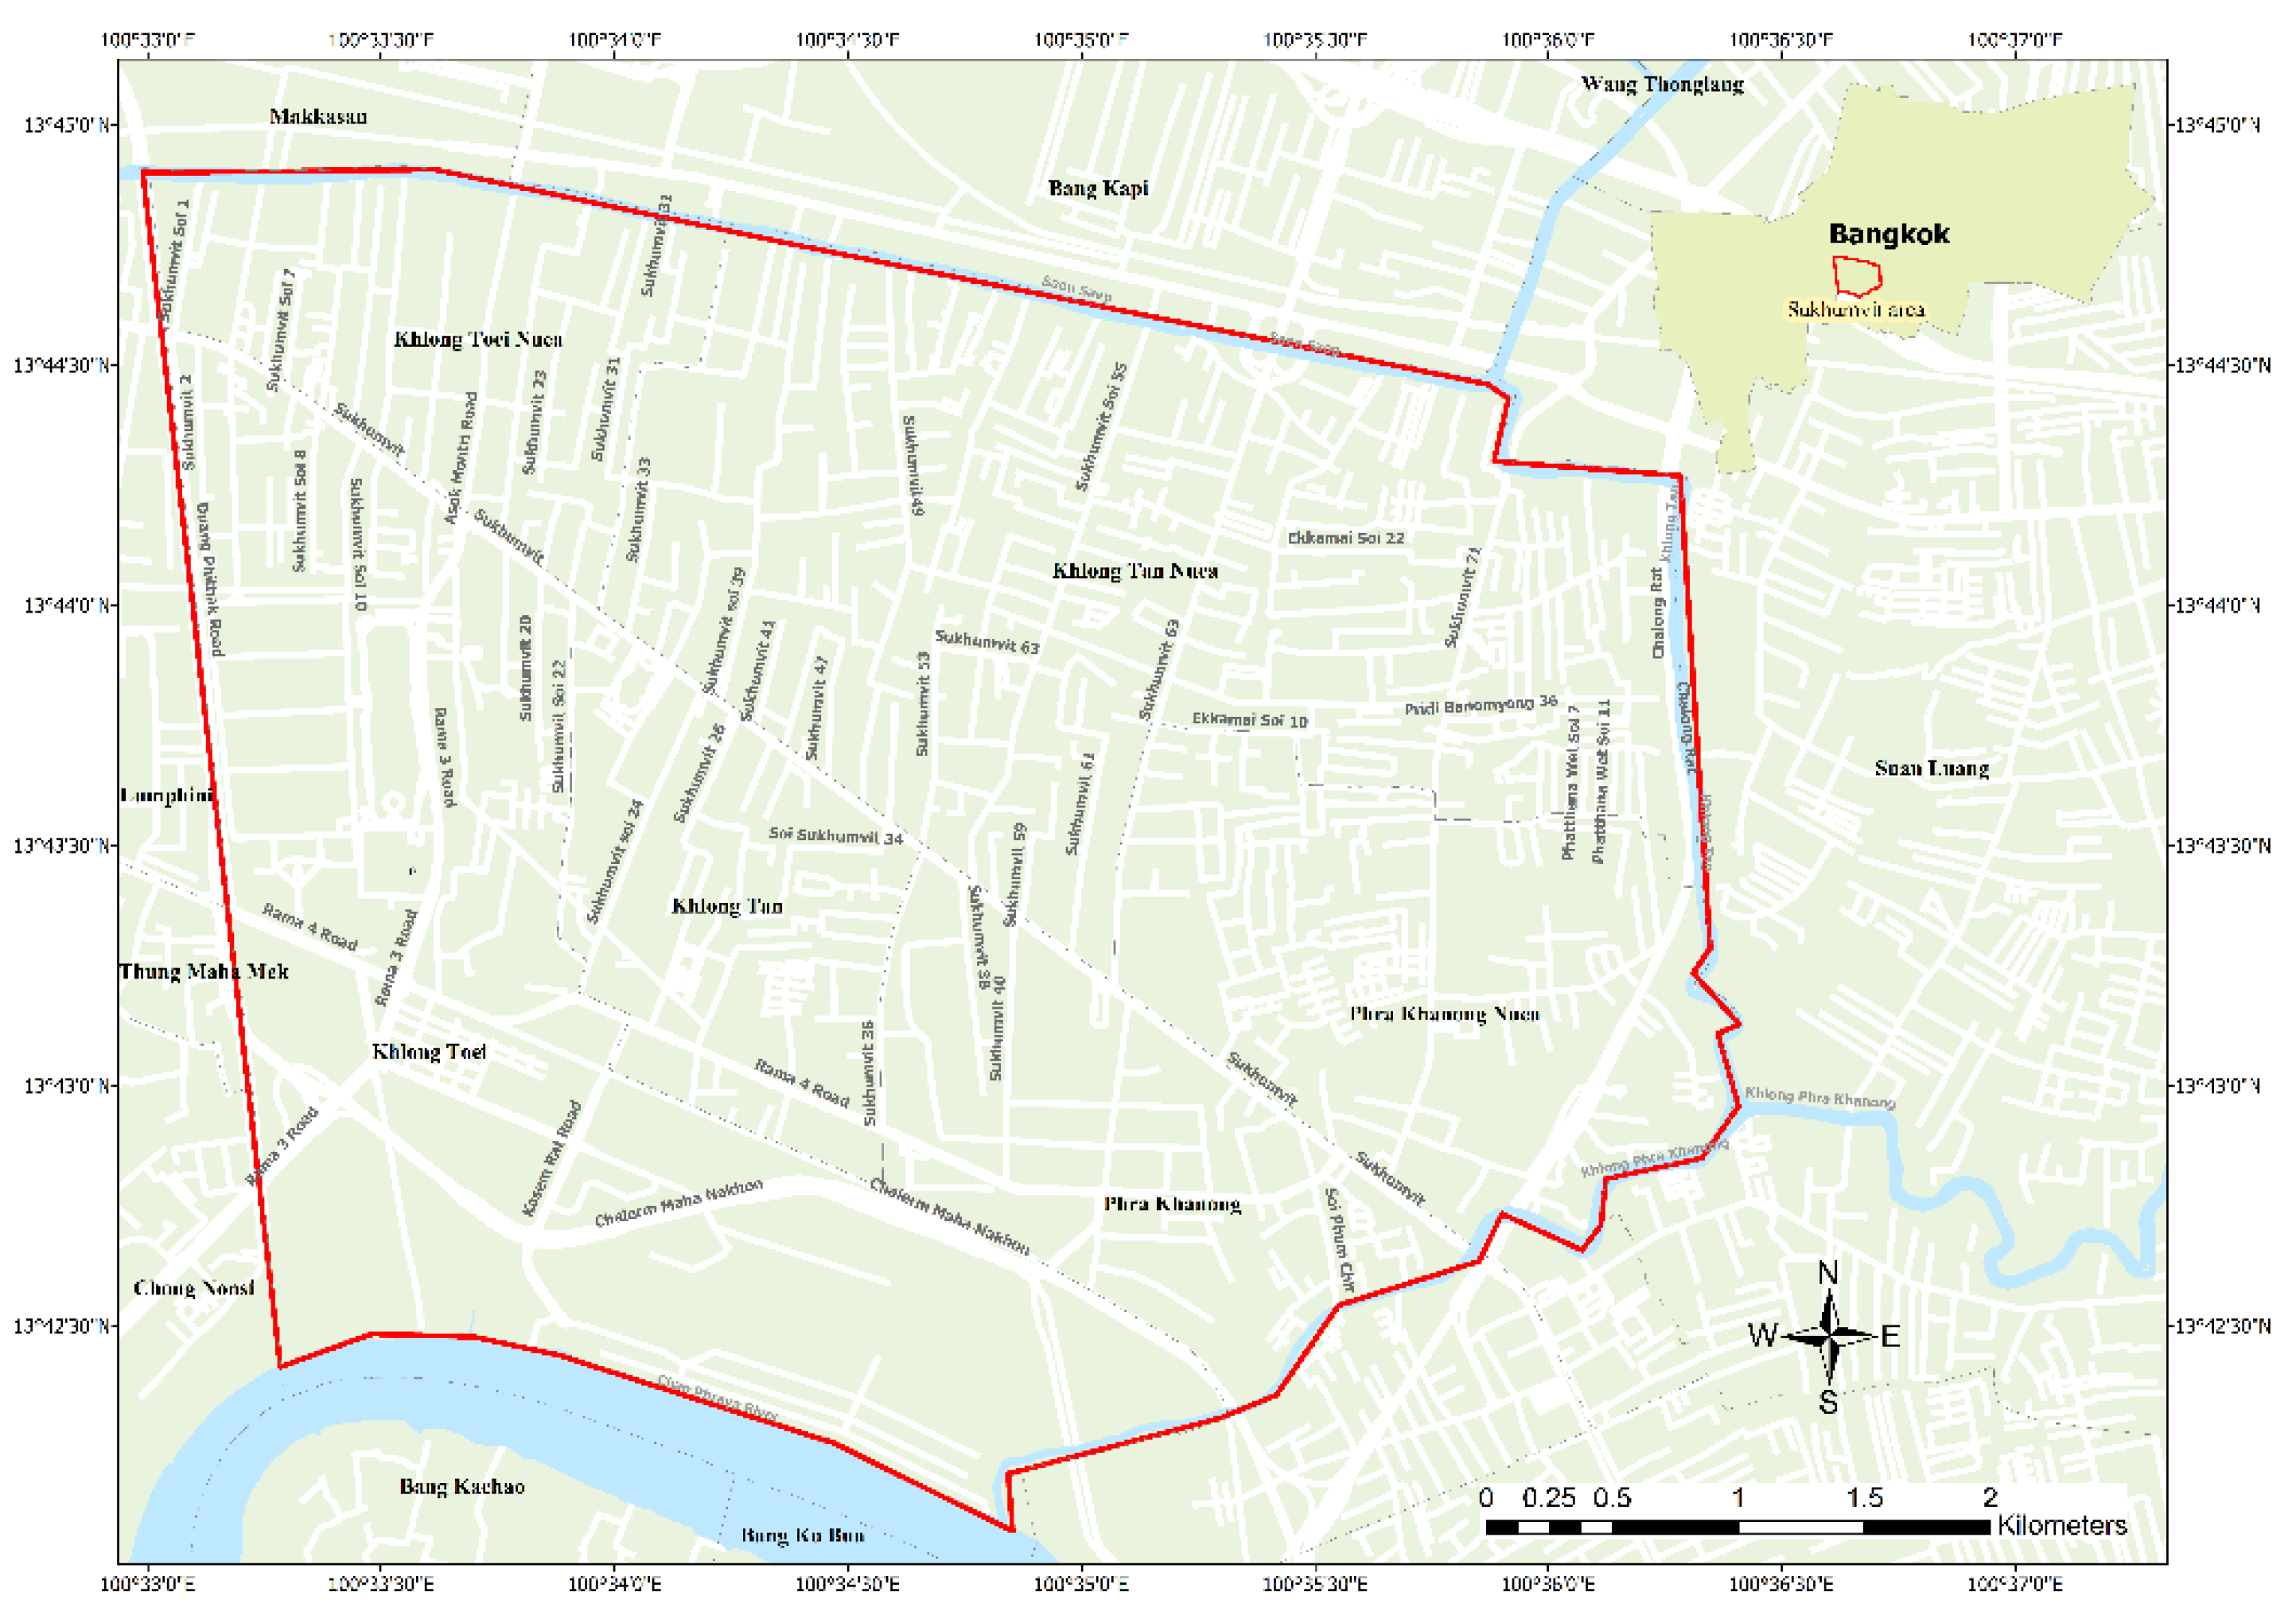
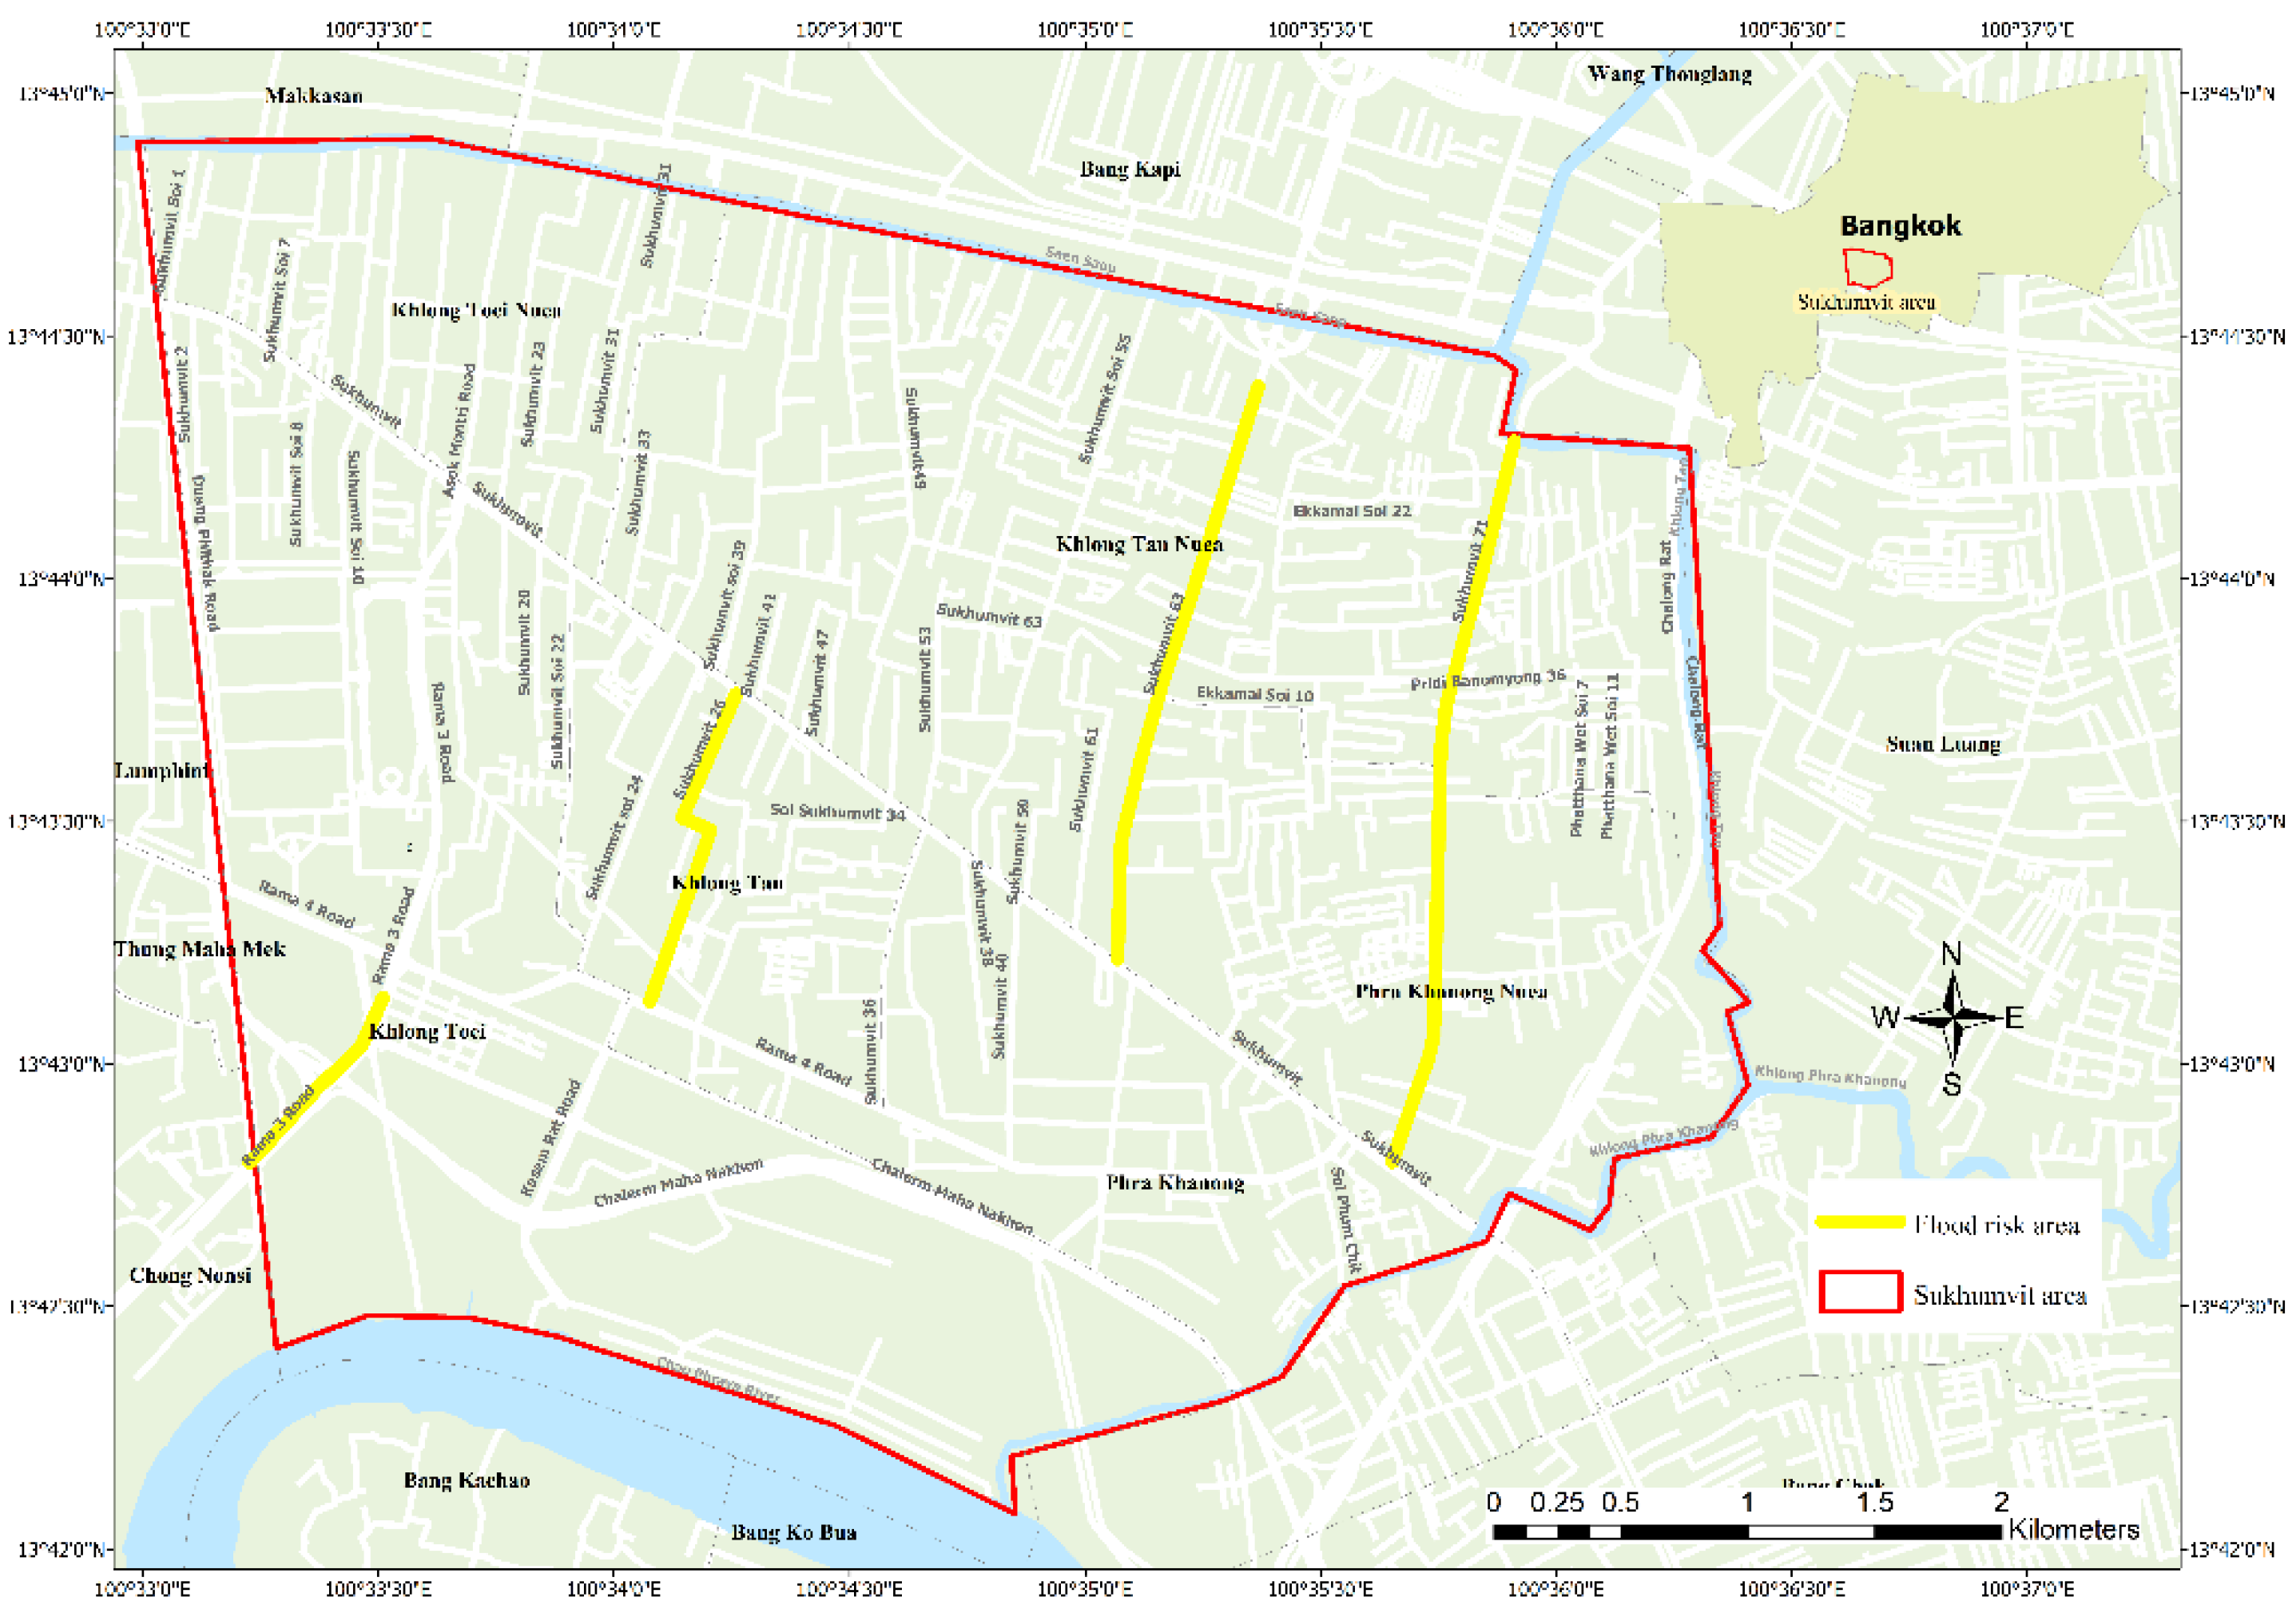
Bangkok experiences a Tropical Savanna type (Aw) climate, with distinct rainy and dry seasons. Mean annual precipitation is 1651 mm, with about 85% falling in the rainy season, May to October. The Sukhumvit area of Bangkok, located north of the Chao Phraya River, is densely urbanized and one of the central business districts (Figure 1). The study area bounded by canals and the Chao Phraya River, is 24 sq.km, with a population density of 8400 persons/sq.km. The study catchment is quite flat, with average elevation being around 0.4 to 1.0 m above mean sea level (MSL), while maximum levee elevation along Klong (Canal) Sean Seap and Klong Tan/Phra Khanong are 1.2 m above MSL [19].
The Sukhumvit area has a primary drainage system consisting of surrounding canals and the secondary drainage system inside the area. Because of the relatively flat topography of the area, stormwater drainage via gravity flow can be a challenge and pumping stations, therefore, are an integral component of the drainage system. When the water level in the primary drainage system around Sukhumvit area increases, drainage of the secondary system becomes a particular problem. The study reported here is built on some previous modelling efforts for the Sukhumvit area. Weesakul et al. [23] used a street network connected to a pipe flow model and developed inundation maps using MIKE 11 GIS software which is a river modelling system that has been developed by the Danish Hydraulic Institute (DHI) [24]. The representation of the flood was made in a digital elevation model (DEM) layer. Nguyen [25] studied the rainfall forecasting and real-time hydrologic information system for Bangkok with an urban drainage model application for Sukhumvit. This work used a 1D modelling approach for pipe flow and the street flow network. The streets were created as channel flow elements with cross sections similar to the open canals that are connected to the pipe flow network for calculation of surcharged or flooded water volume. Shrestha [10] studied the impact of climate change on urban flooding by applying different climate change precipitation scenarios and simulated runoff by coupling a 1D and 2D flood model in this area. This study mainly aimed to develop a real-time procedure for predicting the inundation risk in this area by using a combination of recorded and forecasted rainfall data to simulated runoff and to provide an early warning for flood location.
2.2. The Framework of the Real-Time Urban Drainage Model
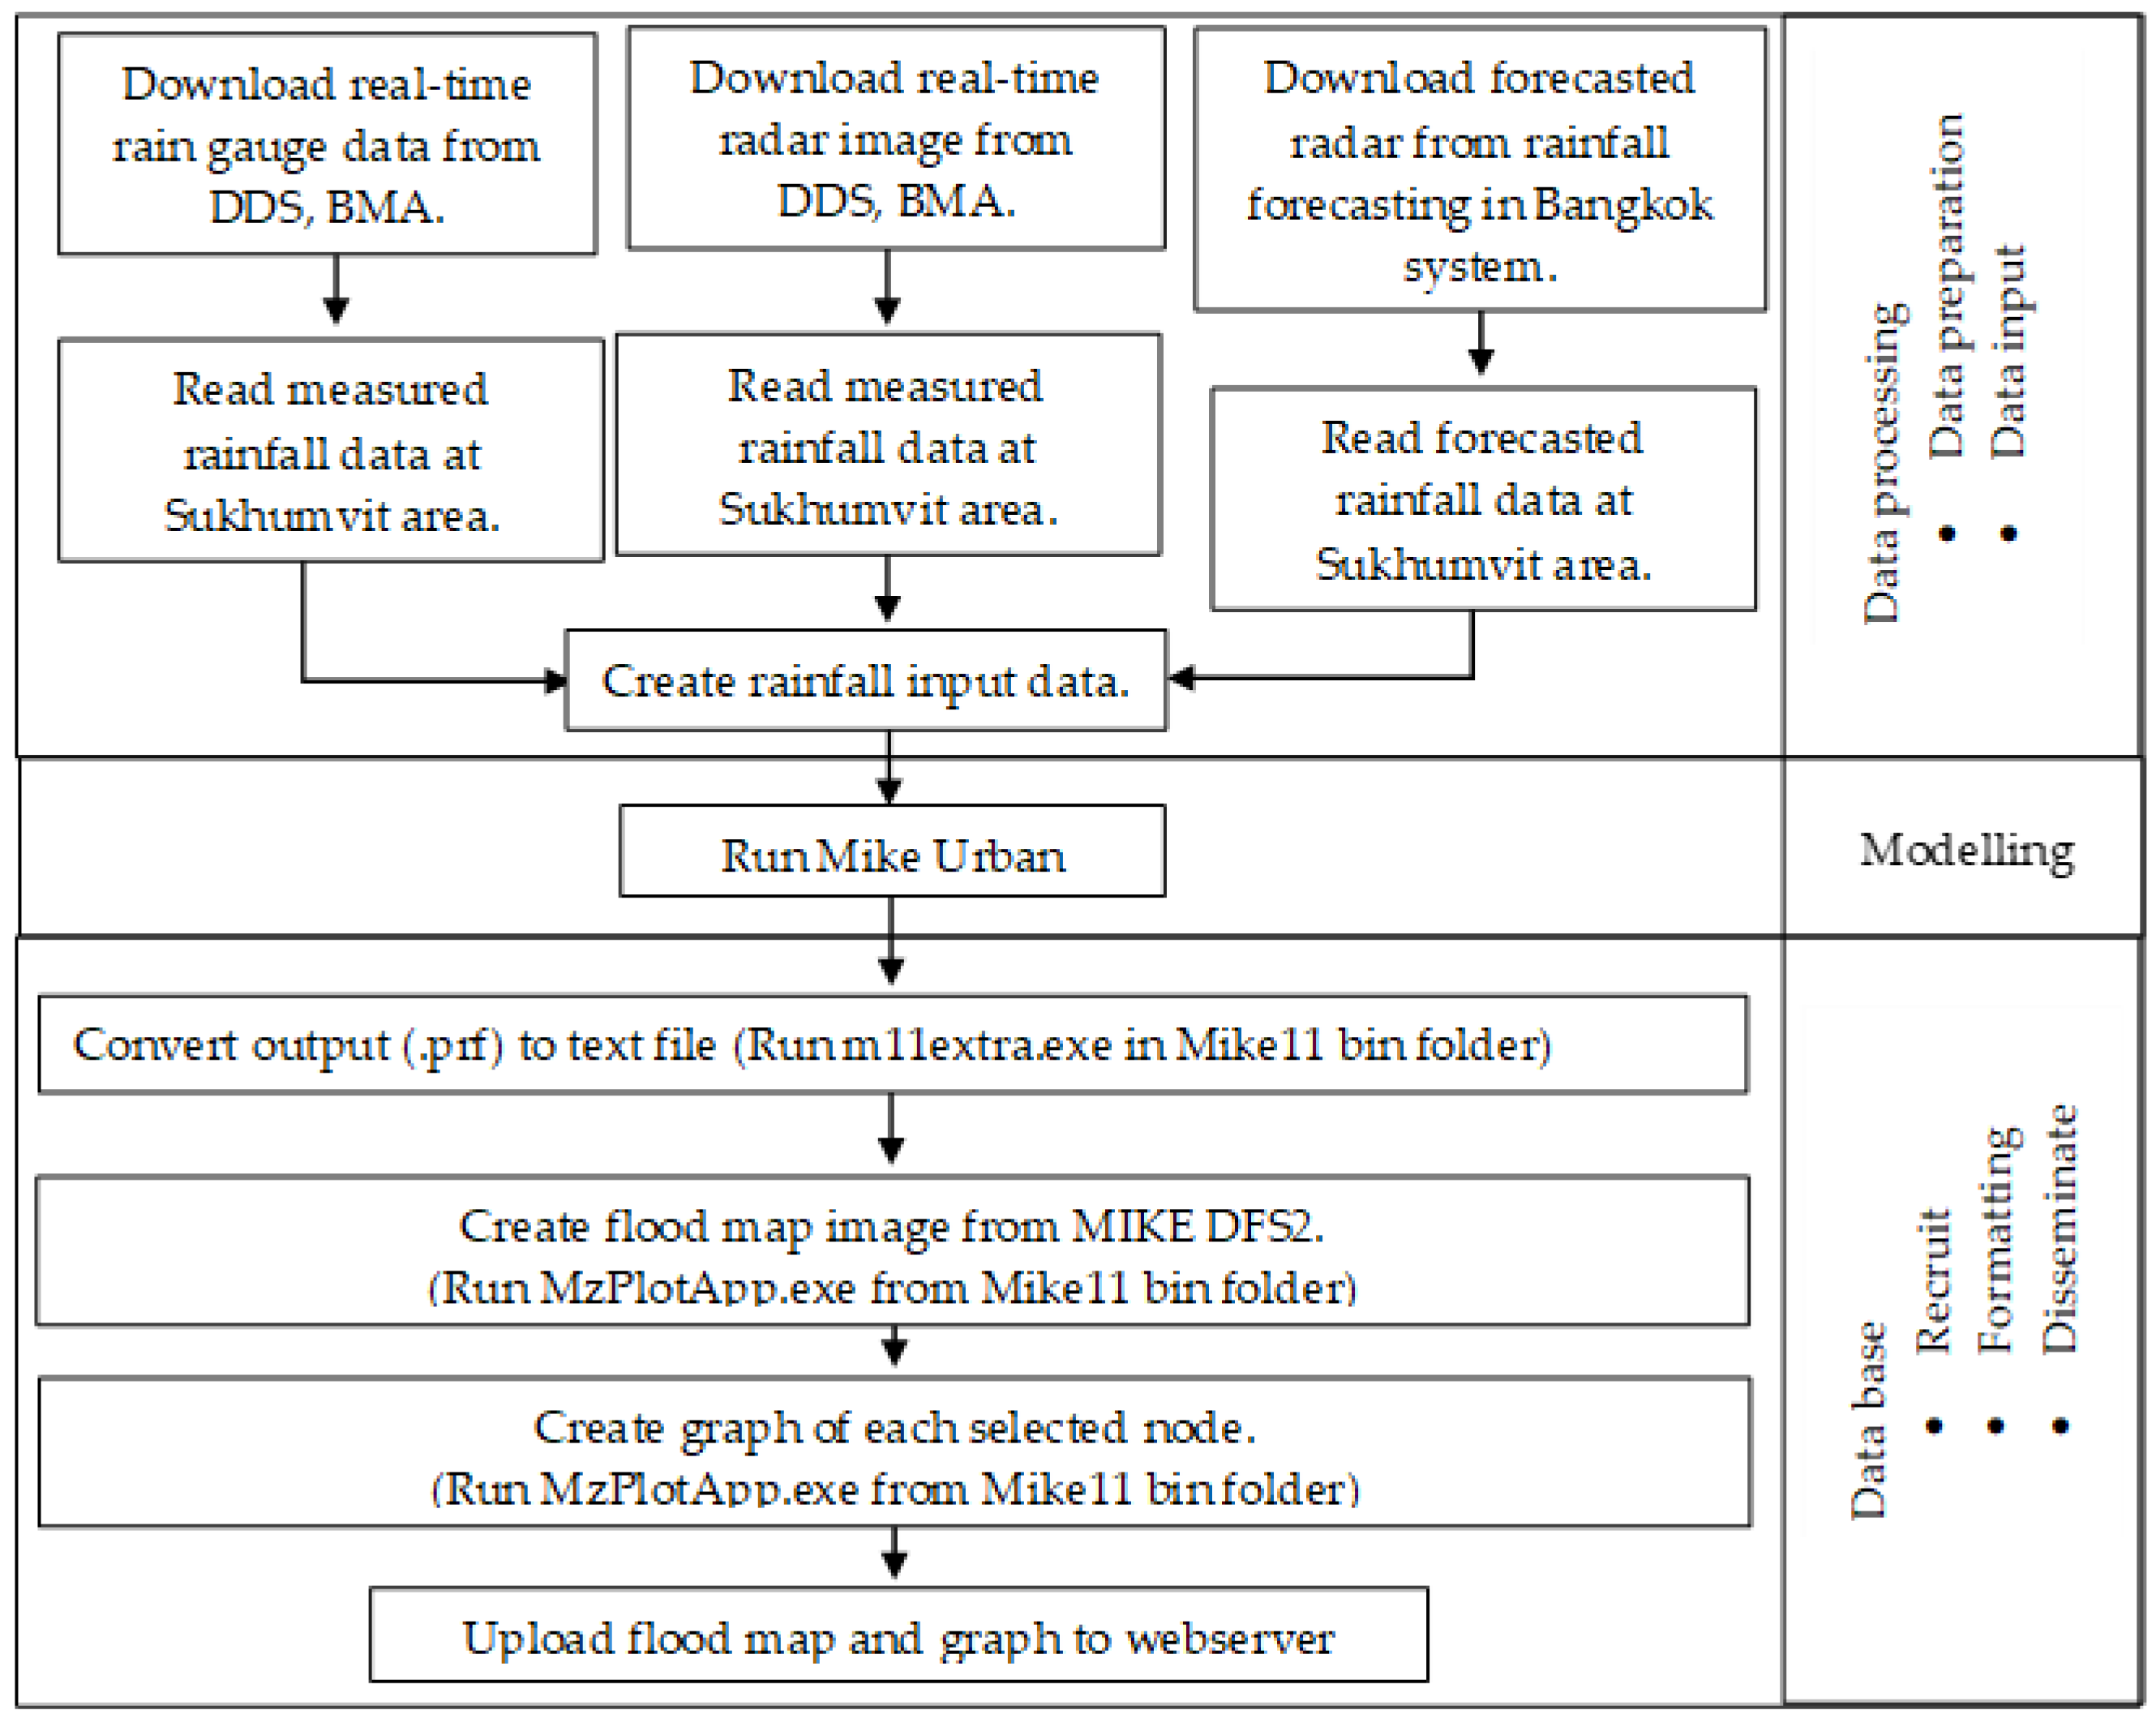
The development of a real-time urban drainage procedure and model for the Sukhumvit area was the main objective of this research. The procedure consists of three com-ponents as summarized in Figure 2. The first component was to obtain real-time, near-real time, and historical rainfall data from two different sources, a network of on-ground rain gauge stations in the general study area and the Bangkok Metropolitan Administration Department of Drainage and Sewerage (BMA, DDS) C-Band Radar at the Nong Jok Radar Station. Subsequently, forecasting of rainfall moving into the study area was undertaken using a translation method. This combination of on-ground gauges, radar imaging, and rainfall forecasting provided the rainfall information to drive the hydrology and hydraulic catchment modelling. As such, component 2 of the real-time procedure consisted of catchment run-off and hydraulic modeling using MIKE URBAN. The third component of the real-time procedure was to post-process the MIKE URBAN output and visualize catchment surface flooding using the MIKE DFS2 mapping capability. Each of the three components is discussed in more detail in the following sections.
2.3. Data Processing
2.3.1. Rainfall Input Data for Real-Time Urban Drainage System (RTUDS)
Rainfall data for the real-time urban drainage system RTUDS system were obtained from two sources, recording rain gauges and rainfall measured by radar operated by BMA, DDS.
- (a)
- Measured Rainfall Input Data—Rain Gauges
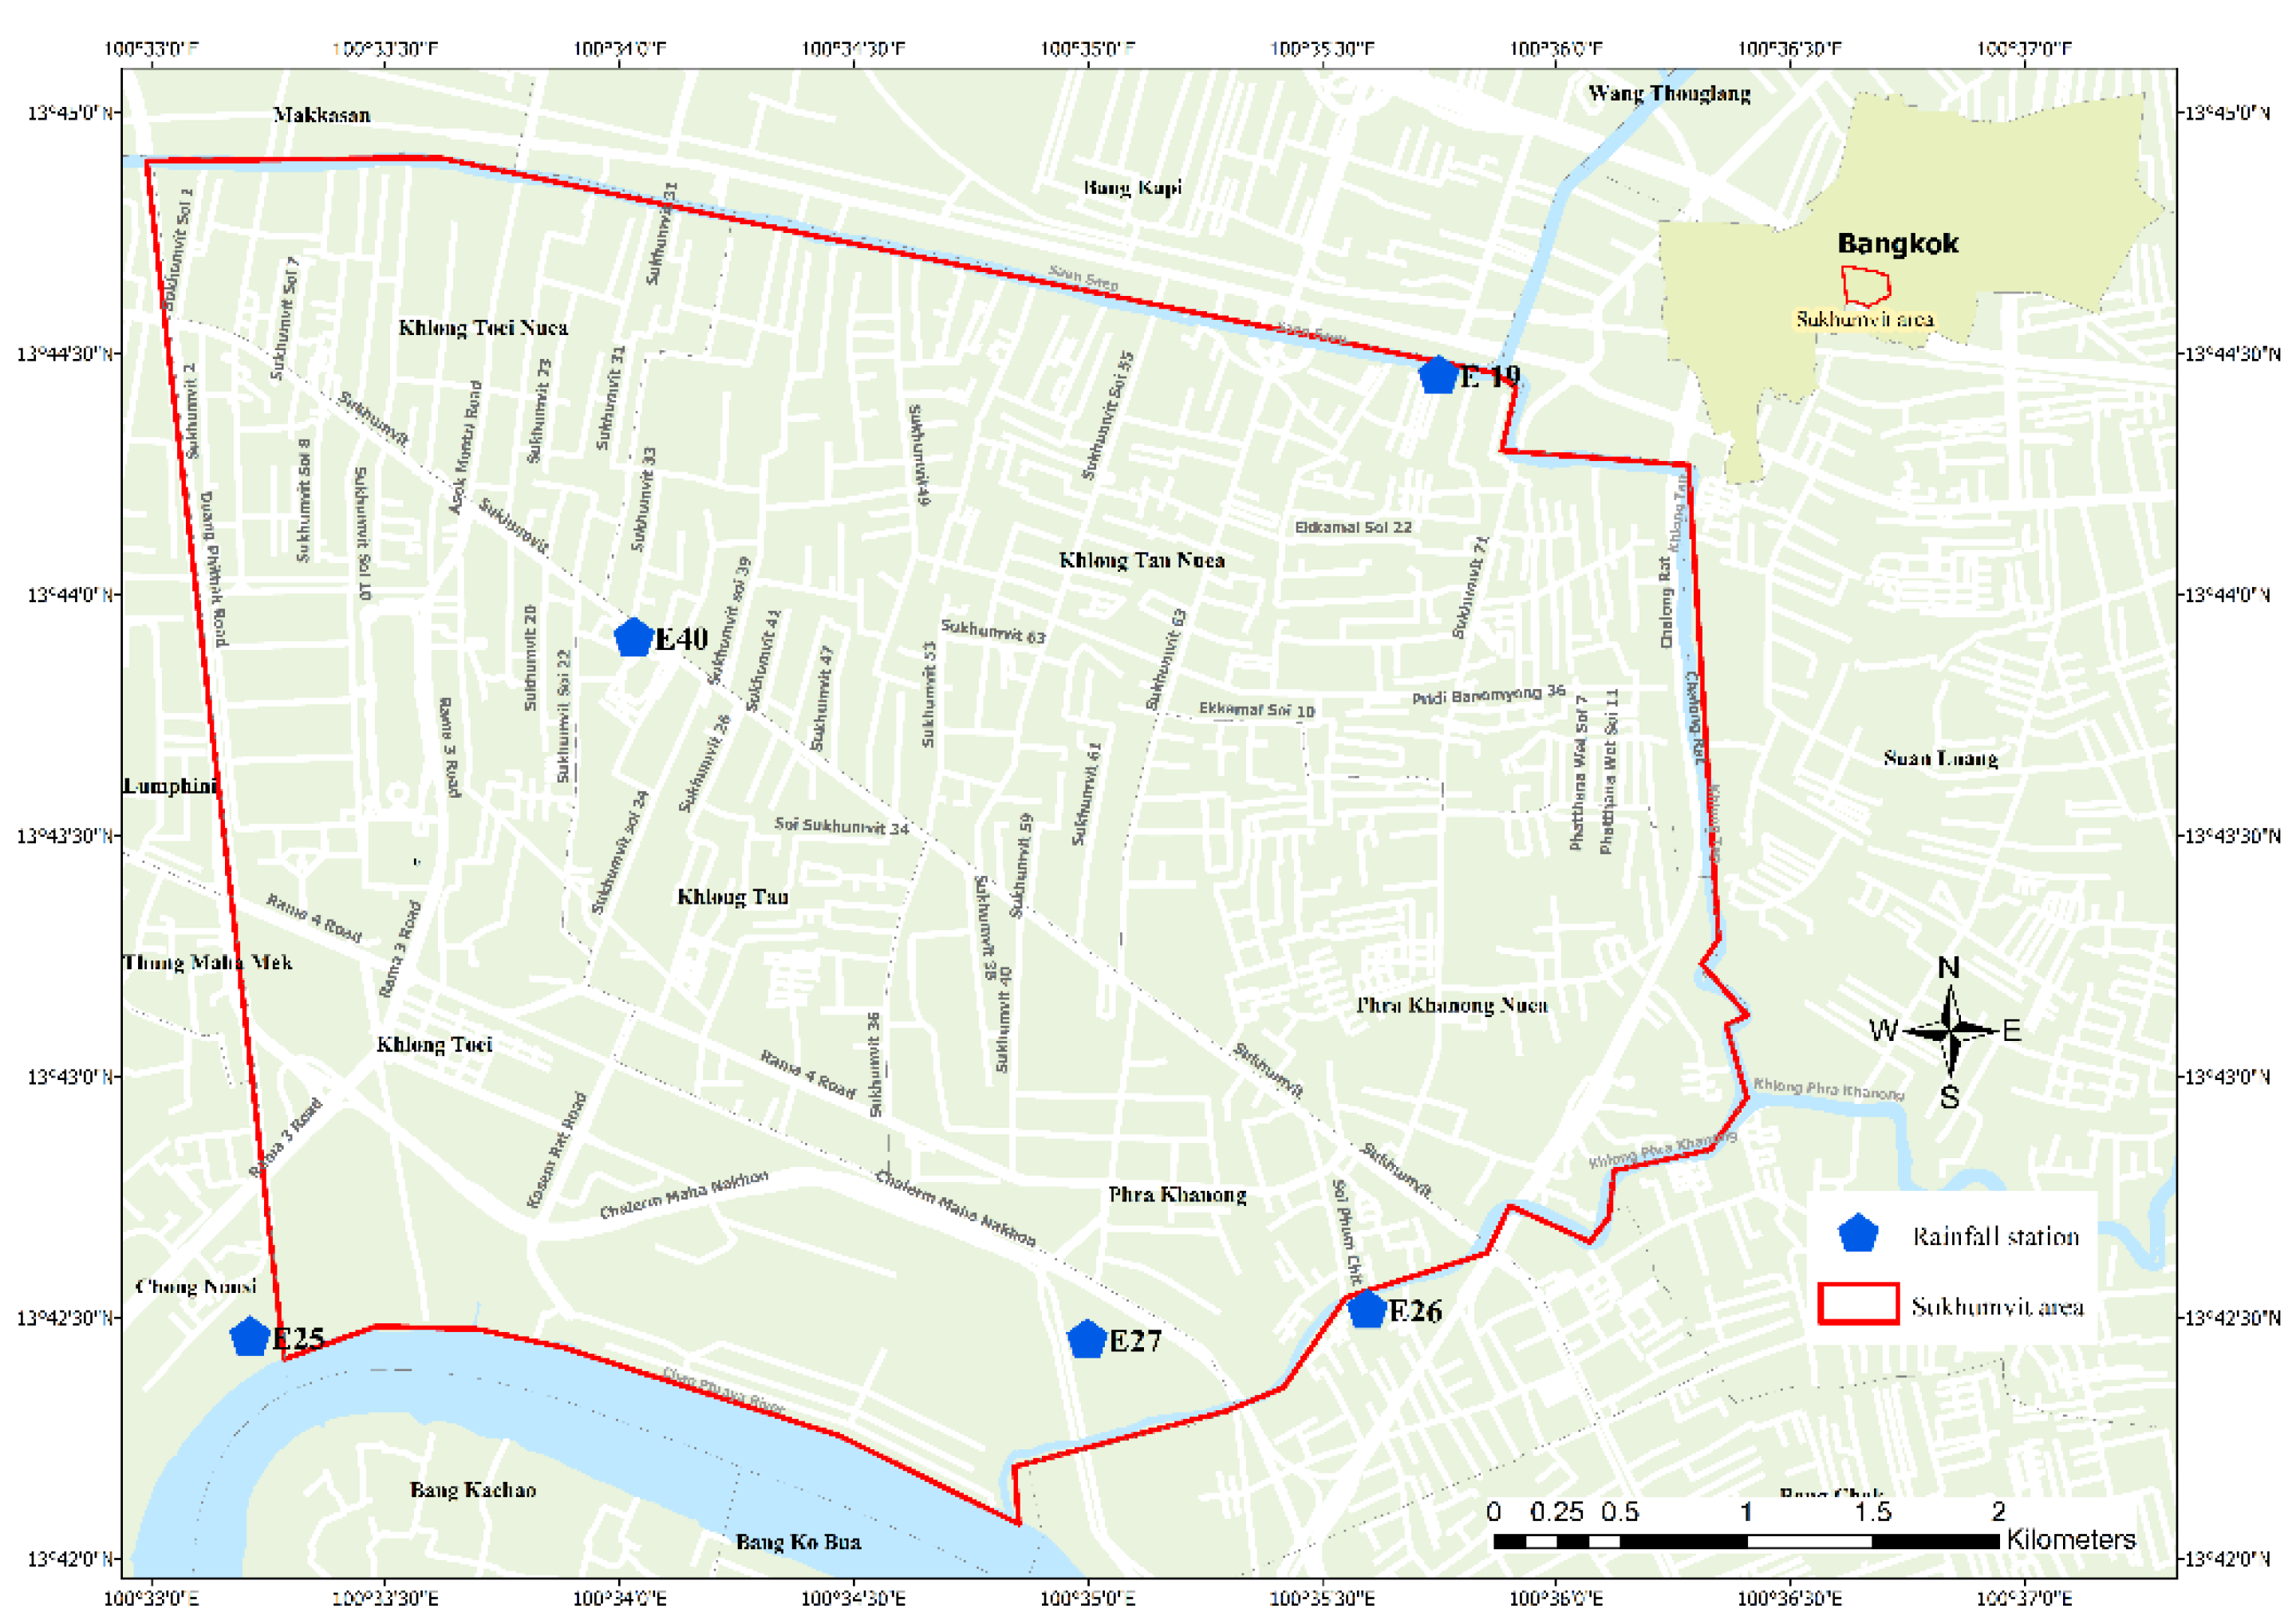
There are five recording rain gauges (E19, E25, E26, E27, and E40) in proximity to the study area (Figure 3). The rainfall dataset period was stored from April 2014 to November 2015. The rain gauges record every 5 min, and data are available in near real-time from BMA, DDS, and the application for this RTUDS. Therefore, it was designed to use 10 min of measured rainfall input data or two time steps.
- (b)
- Forecasted Rainfall Input Data—Radar
Radar images from the BMA, DDS C-Band Radar at the Nong Jok station (Figure 4), were accessed through the BMA website [26]. The range of the scanning area was 90 km, which covered 12 provinces around Bangkok. The size of the radar images was 2048 × 2034 pixels, and each pixel had an area of 0.01 sq.km. It should be noted that for this demonstration project the BMA, DDS radar was not directly accessed, as would be the case for full implementation of a real-time system, but rather the radar images were obtained directly through the BMA website.
The radar images were updated and downloaded at 5-min time steps, and following the rain gauge data procedure, two-time steps (10 min) were used to begin the forecasting process.
- (c)
- Rainfall Forecasting
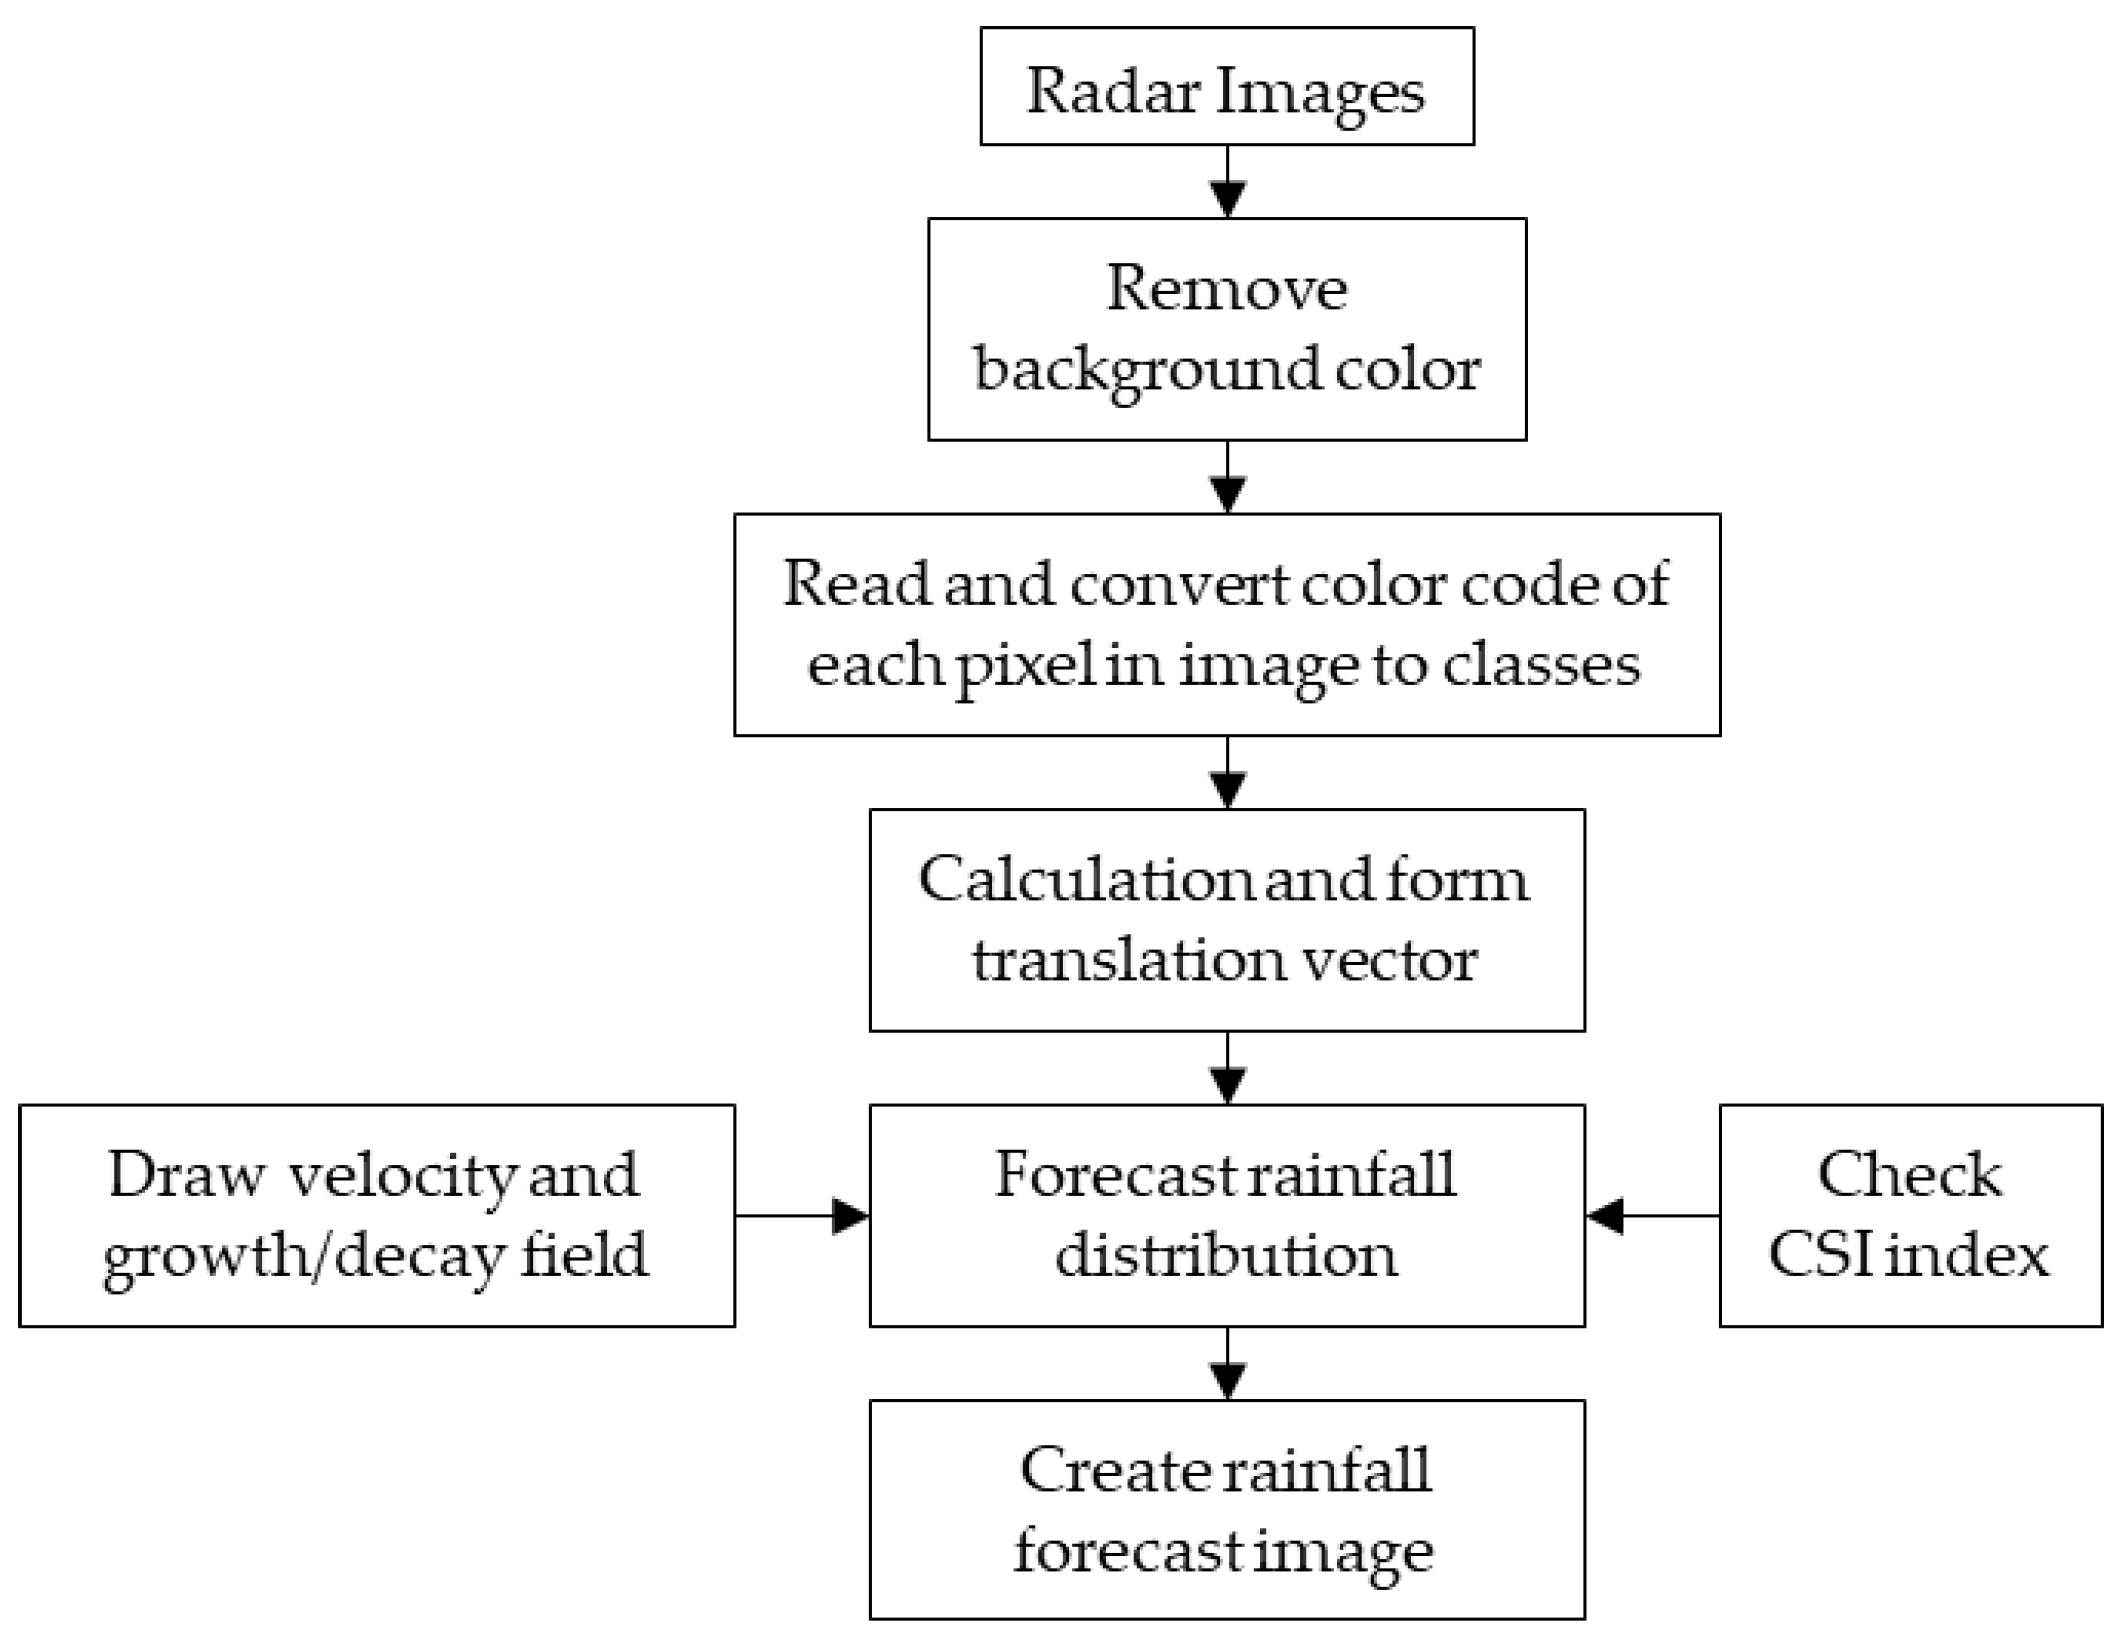
In this final rainfall processing step, the translation method [27] was applied as the main algorithm for forecasting rainfall using the radar images. From consecutive radar images, the translation program estimates translation vectors using the method of least squares, which predicts the rainfall movement pattern. After the values of parameters are determined, the current rainfall is then extrapolated into future rain. Figure 5 presents the step-by-step procedure of forecasting rainfall using the translation method [27].
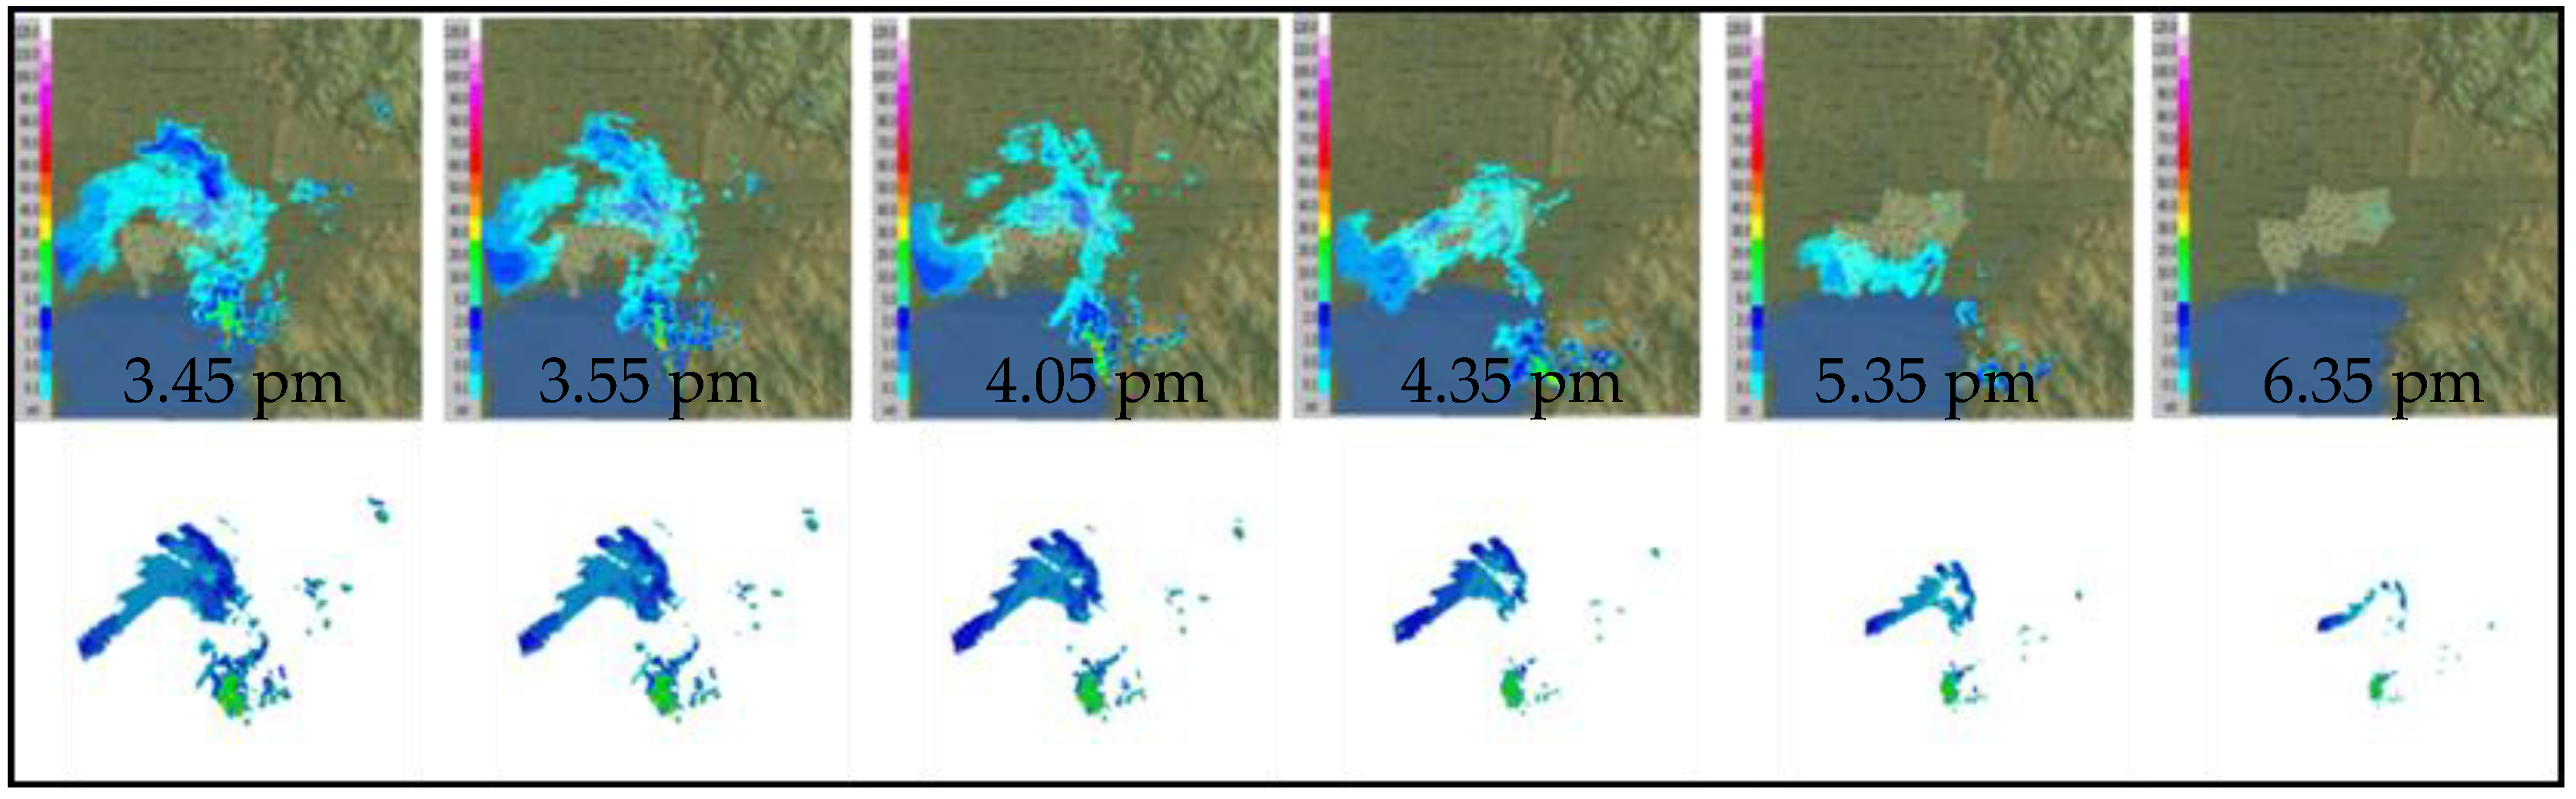
Due to the inability to directly access the radar images over the study area, the visual on-screen radar images from the BMA website, which are composed of Red (R), Green (G), and Blue (B) colors, were implemented in this study. The first step in using the radar images for the translation method was to remove all background colors other than those representing precipitation. A computer program was developed which can read the Red, Green, and Blue values in each of the pixels in a visual radar image as shown in Figure 6.
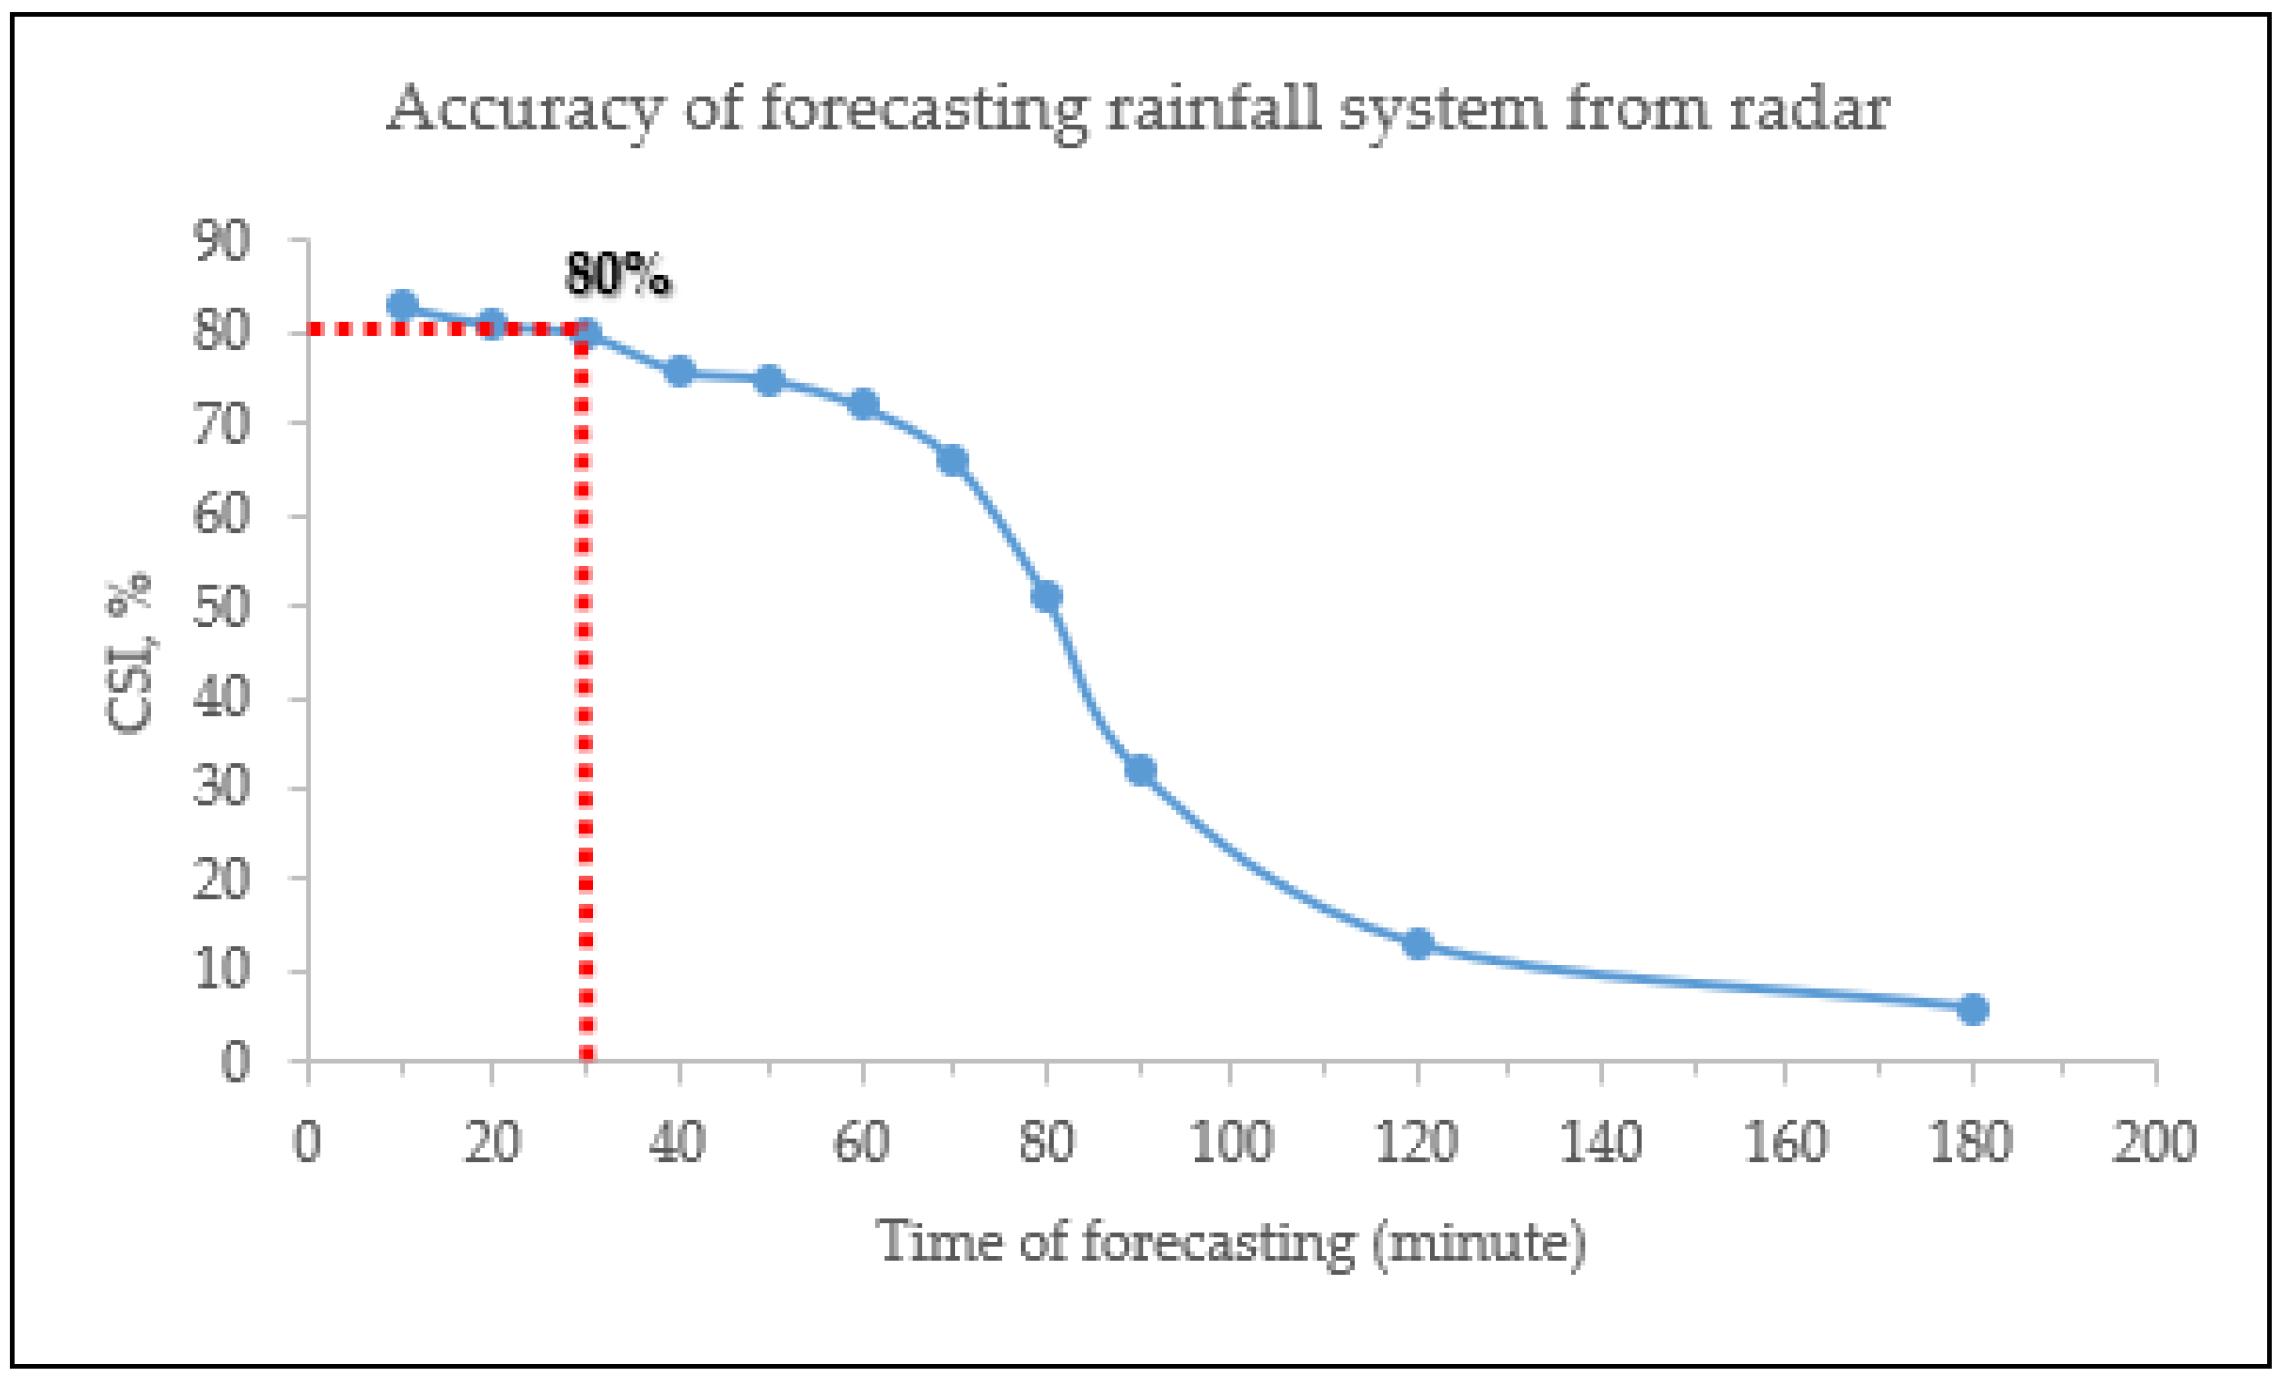
There are two important factors related to rainfall data processing that will influence the efficacy of a real-time system in improving estimates of flood risk [28,29]. First, the accuracy of the rainfall forecasting system, based on the radar imagery, plays a major role in the estimated water levels produced by the catchment model. The translation forecasting system employed in this study [27] evaluated performance by the critical success index (CSI). It was used to evaluate anomalies predicted using forecasting rainfall as compared to the measured data. CSI is the ratio of the sum of hit(A), miss(B), and false(C) whereas the example outlined in the definition of CSI = (A)/(A + B + C) [30]. As in Figure 7, the optimal success of 80% occurred at a lead time of 30 min from 69 rainfall events, one of which is shown in Figure 6 as an example.
Secondly, the data processing and rainfall computation times are an essential consideration [31,32]. The rainfall forecasting system required at least two-time steps of measured rainfall data, representing a 10-min rainfall duration (i.e., two recording periods of 5 min). This study carried out a run-time analysis and determined that 40 min of the total of rainfall duration was suitable. In other words, the total of rainfall duration was a combination of 10 min of measured rainfall together with 30 min forecasted rainfall duration.
2.3.2. Urban Drainage Modelling
MIKE URBAN developed by the Danish Hydraulic Institute [24] was used to represent the overland flow flooding and pipe network hydraulics with a 1D/2D approach. Hydraulics of flow for the drainage pipe network was represented in 1D but was linked to a 2D overland flow representation for the catchment flooding. This type of linked 1D/2D approach is increasingly applied for urban flood studies as it represents more accurately the flooding of obstructions, such as buildings, although the approach is computationally more intensive than simple 1D modelling [33,34,35,36].
- (a)
- Boundary Conditions
As noted previously, measured precipitation data and radar images were obtained from Bangkok Metropolitan Administration (BMA). The meteorological stations selected for on-ground rain gauge data in the study area were E19, E25, E26 E27, and E40 for the period of record, 2014 to 2015.
- (b)
- Pipe Flow Model 1D
The hydraulic model of this study area developed in MIKE URBAN was based on an earlier 1D-1D approach by Chingnawan [37] in which street and sewer links were connected to each other, and the first calibration from observed data at three stations for the event of 5 October 2002 was undertaken. Validation of this model was undertaken by Chingnawan [37] with data from an event on 7 October 2002. A second calibration effort with this first-generation model was undertaken by Nguyen [25], using precipitation data and water level data from three stations for events from 16 November 2004 and 20 November 2004. The three stations that were used for the calibration of the models were Aree Station, Thonglor Station and Ekamai Station. The calibration for the 16 November 2004 event produced an efficiency index of 78%, 82%, 86%, and root mean square error of 0.06, 0.04, and 0.03 m for the three stations, respectively, while the calibration for the 24 November 2004 resulted in an efficiency index of 78%, 82%, 86% and root mean square error of 0.06, 0.04 and 0.03 m for the three stations, respectively. In 2013, the model was revised by Shrestha [38] using a coupled 1D/2D approach. This second-generation 1D/2D model was calibrated using the measured water level and rainfall data for the storm event of 15 October 2003. The Sukhumvit 26 and Ekamai water level stations were used in the calibration, with the root mean square error (RMSE) and efficiency index (EI) for the Sukhumvit 26 station being 0.04 m and 82%, respectively, and the Ekamai station having RMSE and EI values of 0.24 and 60%, respectively. The results for these first- and second-generation models indicate that MIKE URBAN can be applied with relatively good accuracy for the purposes of this current study.
- (c)
- Overland Flow Model 2D
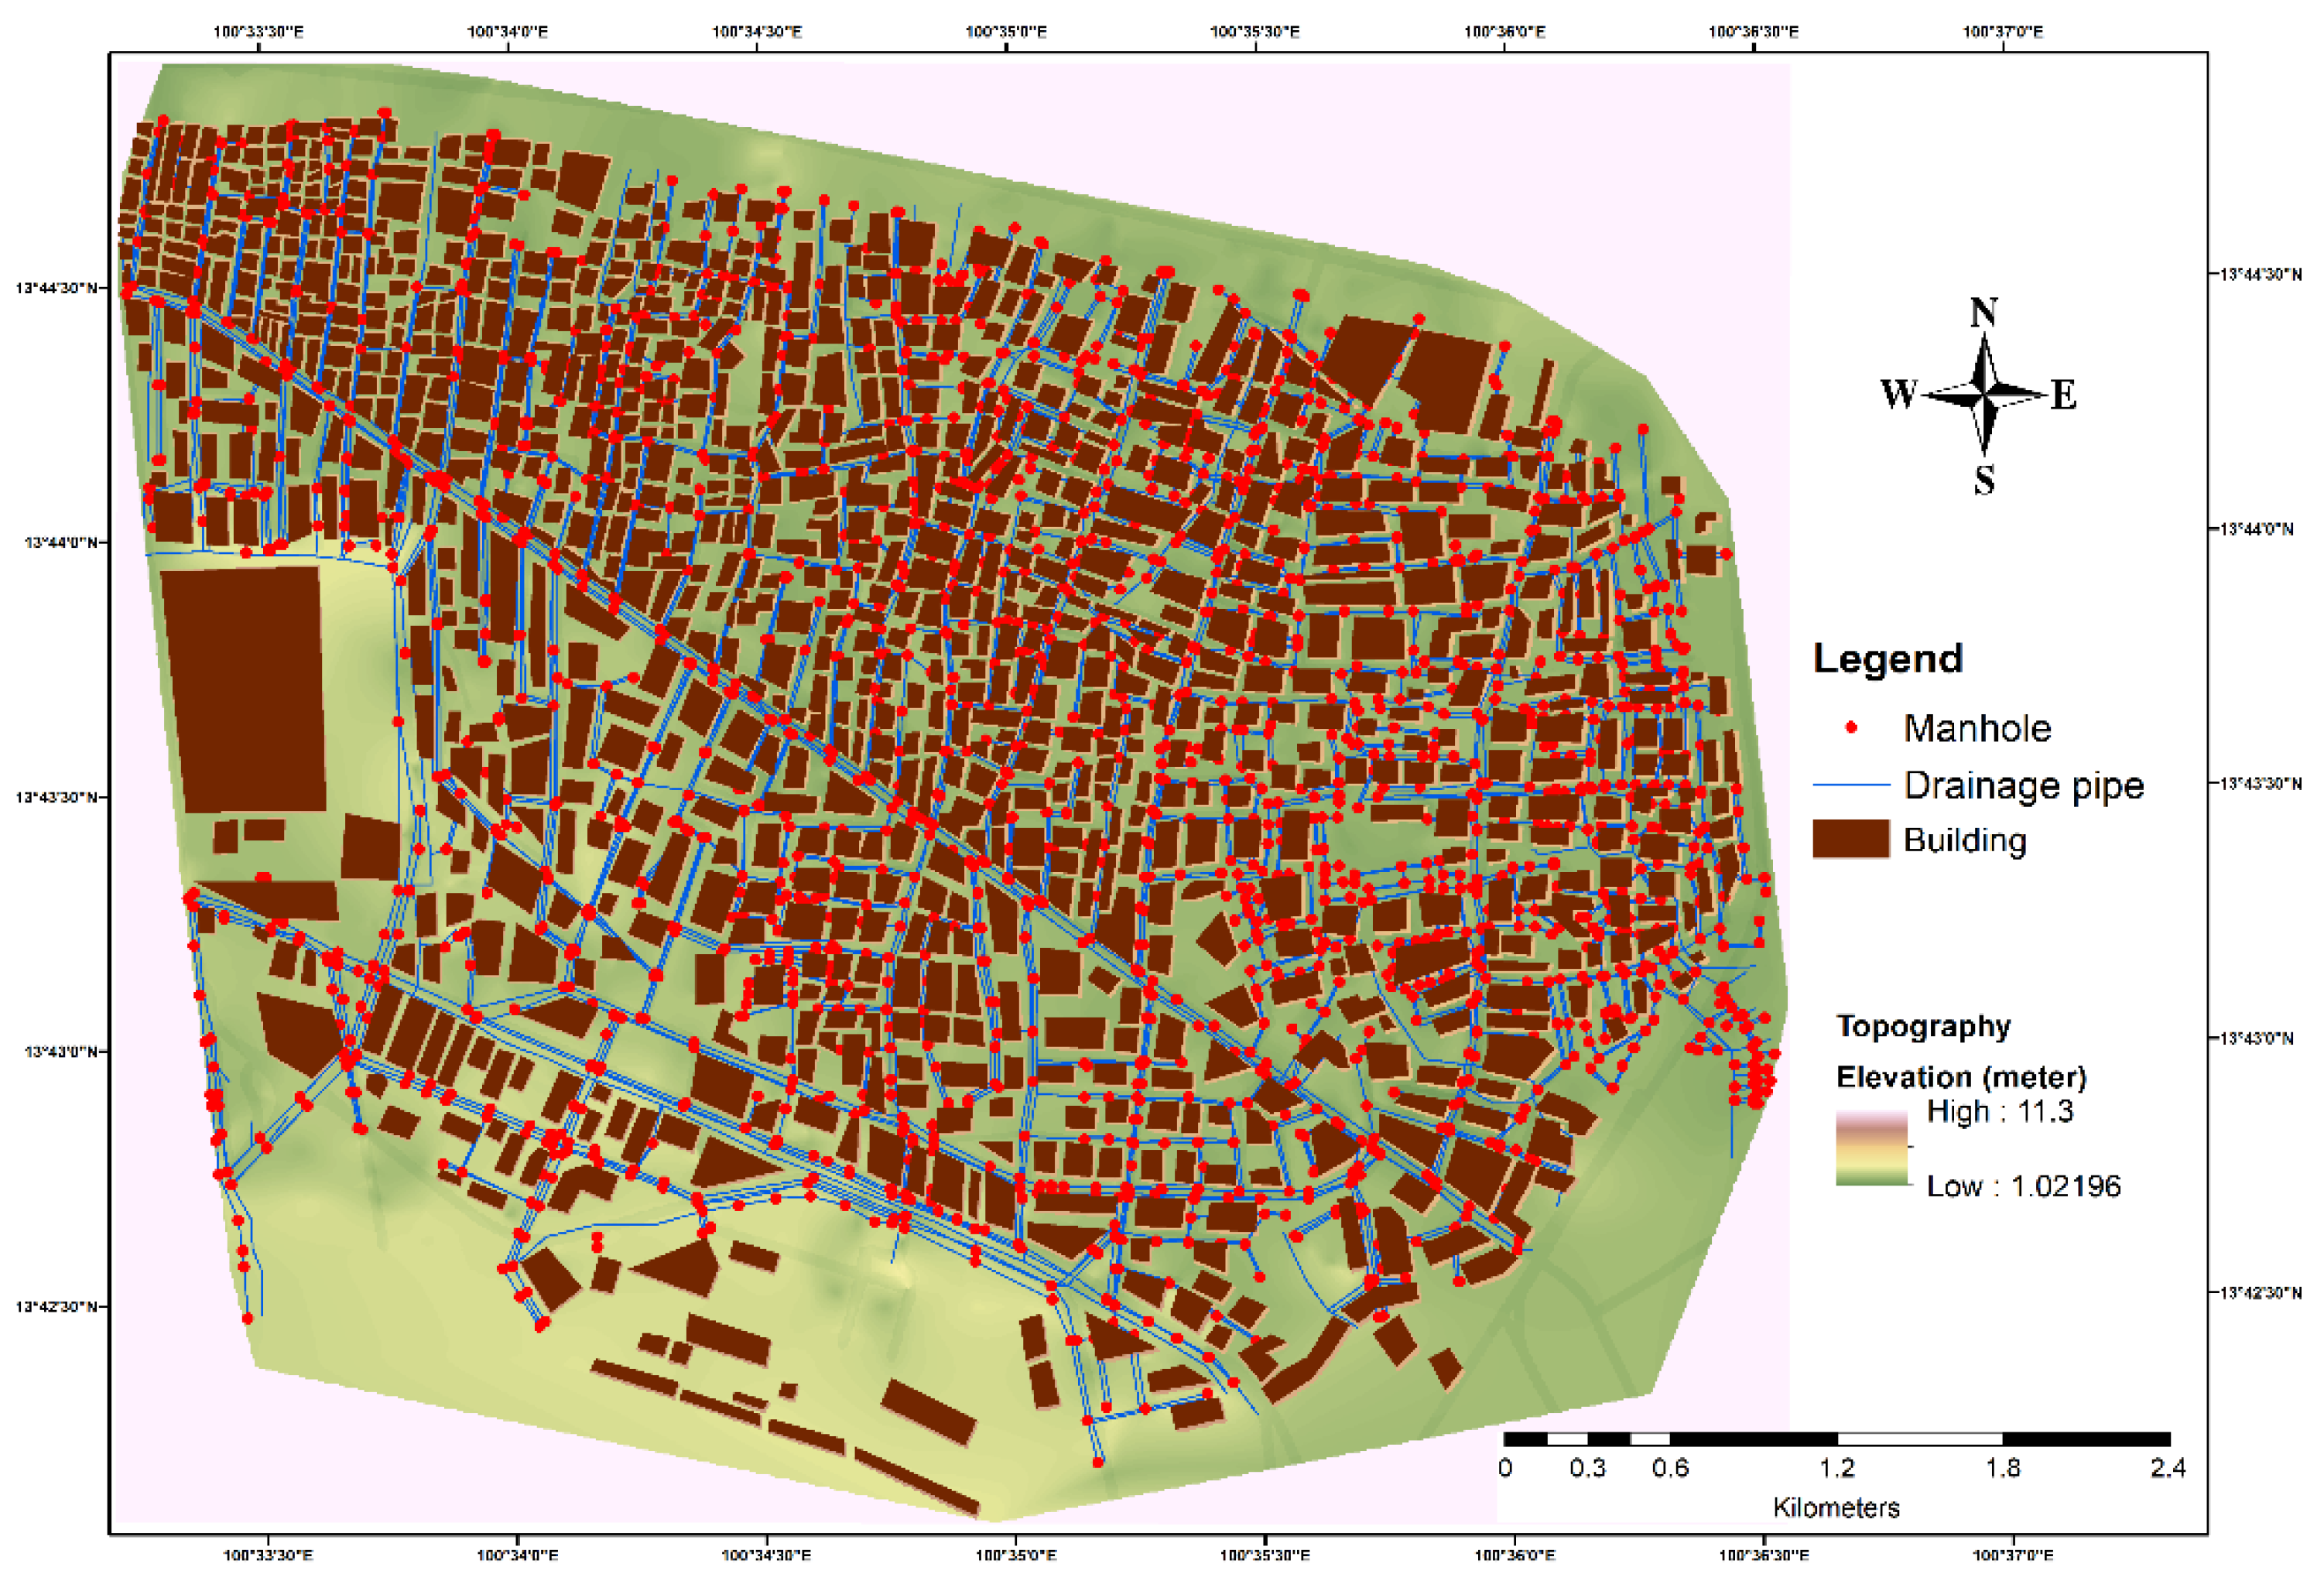
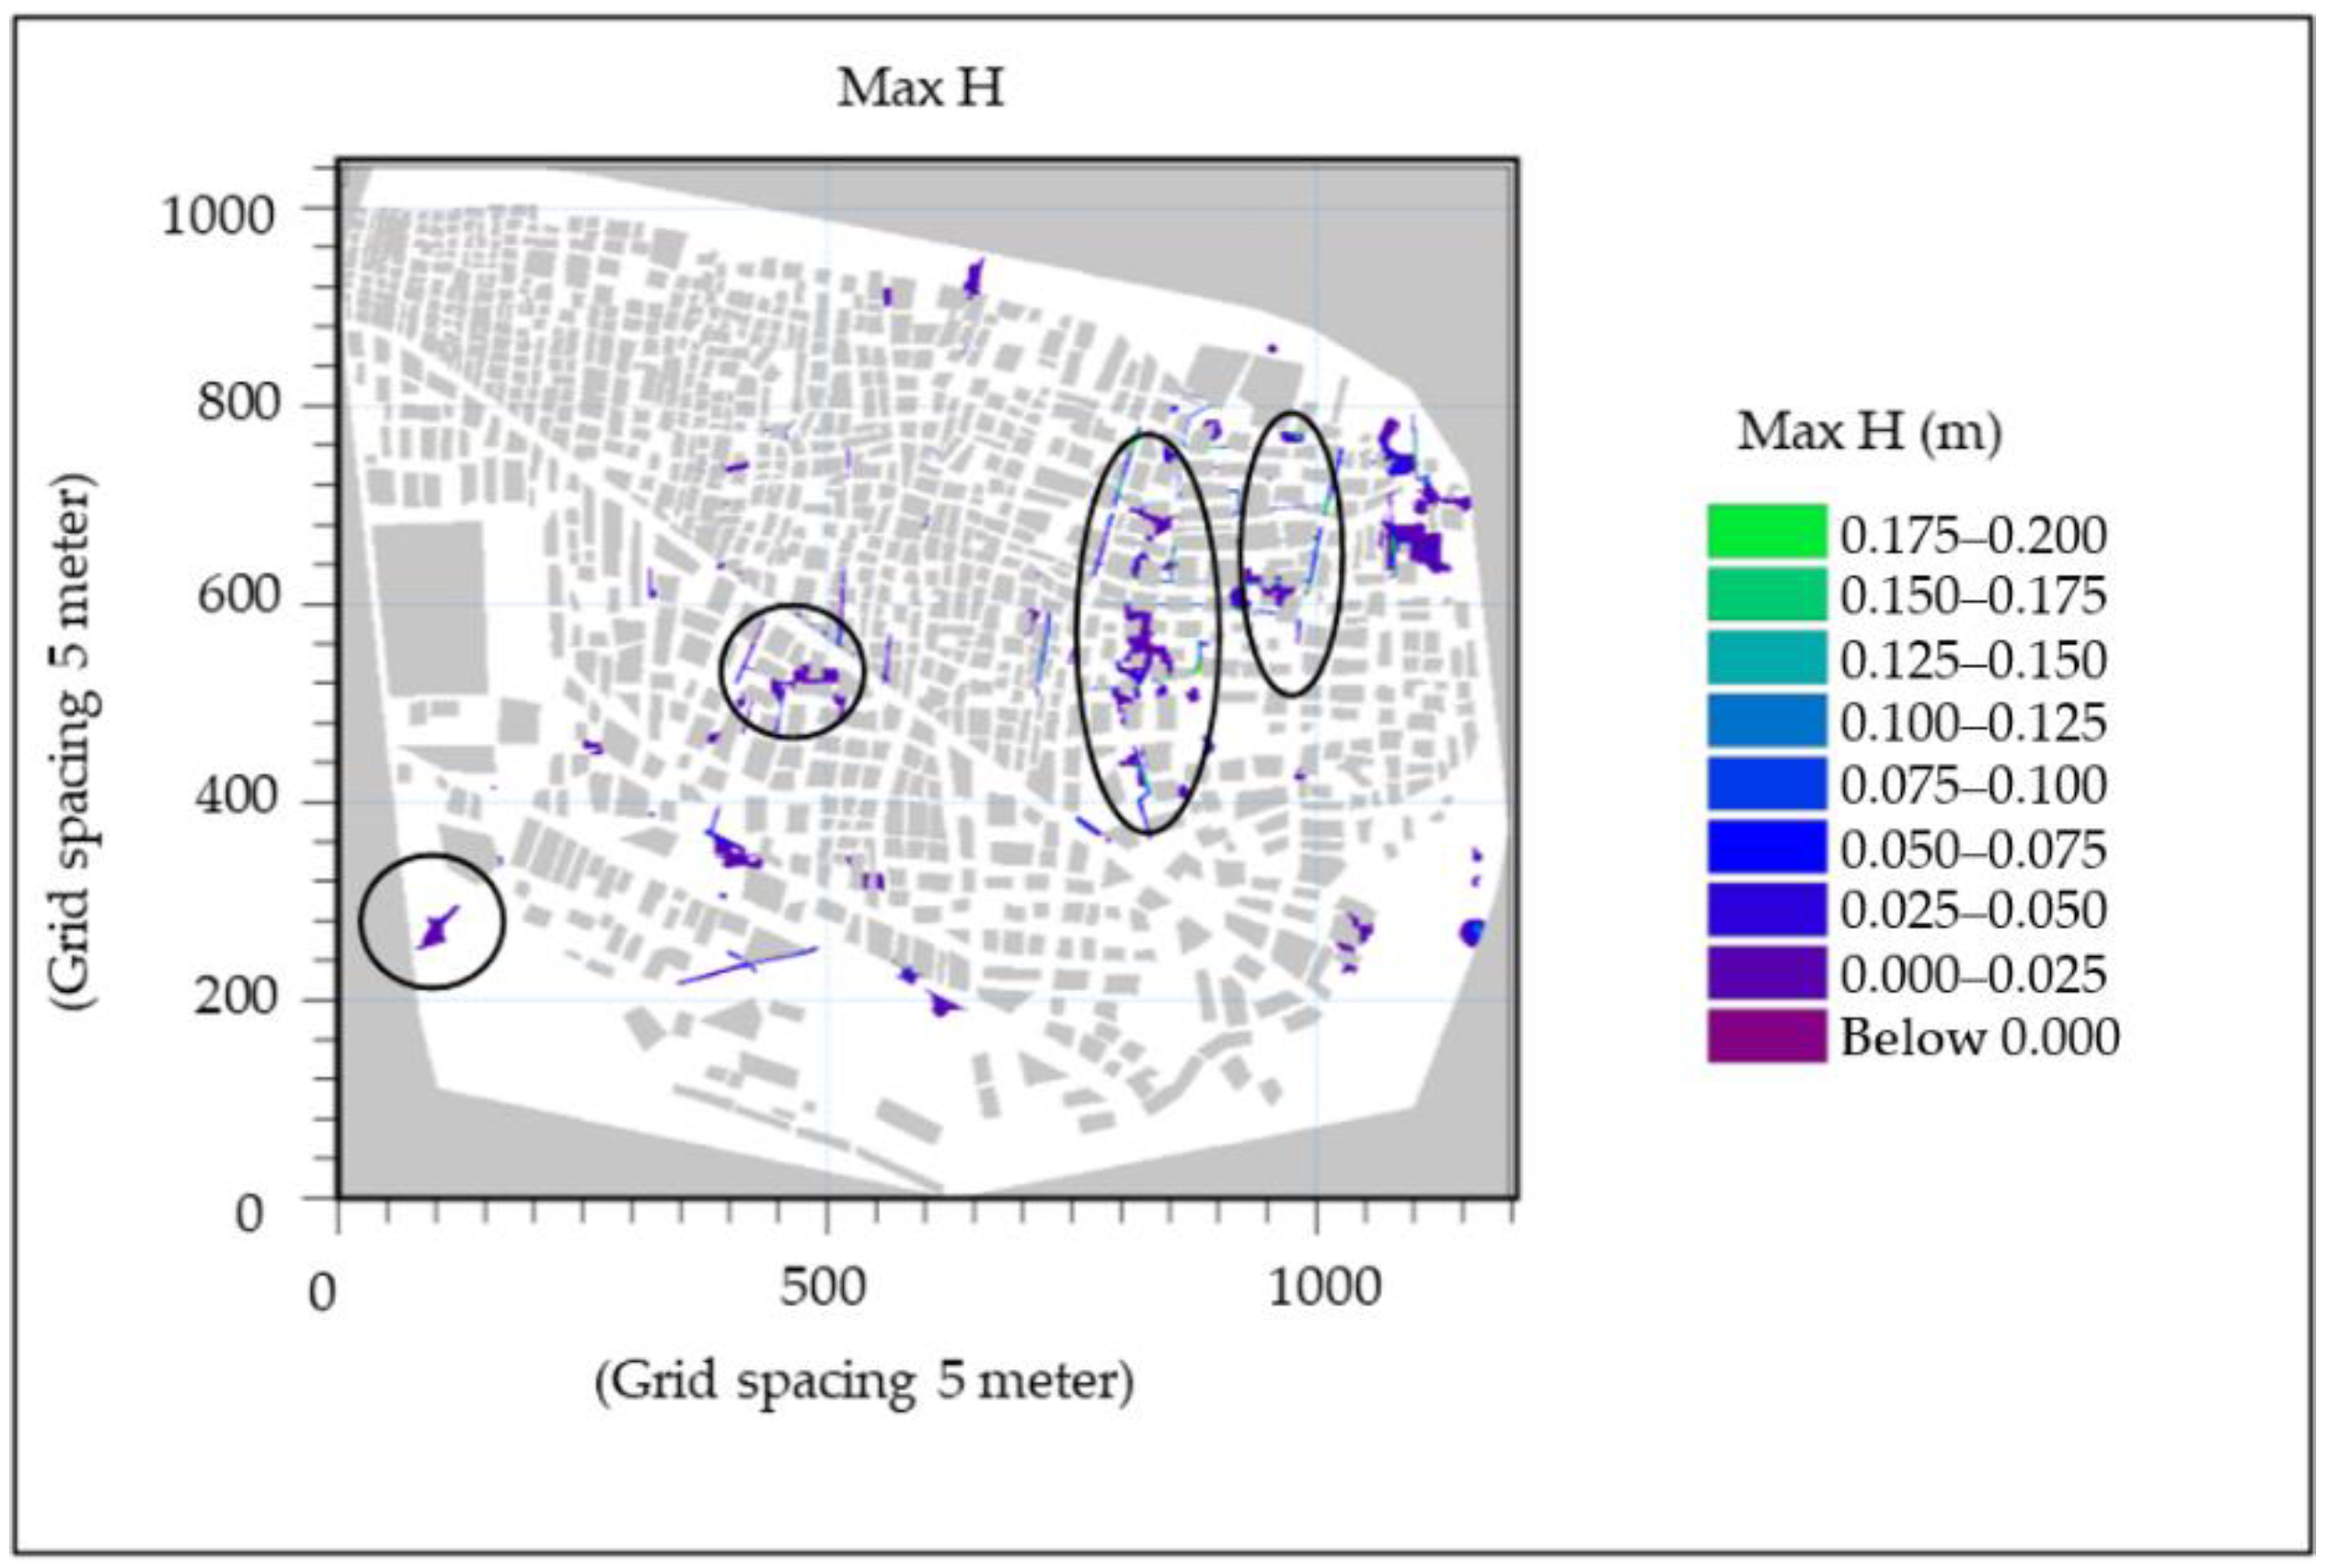
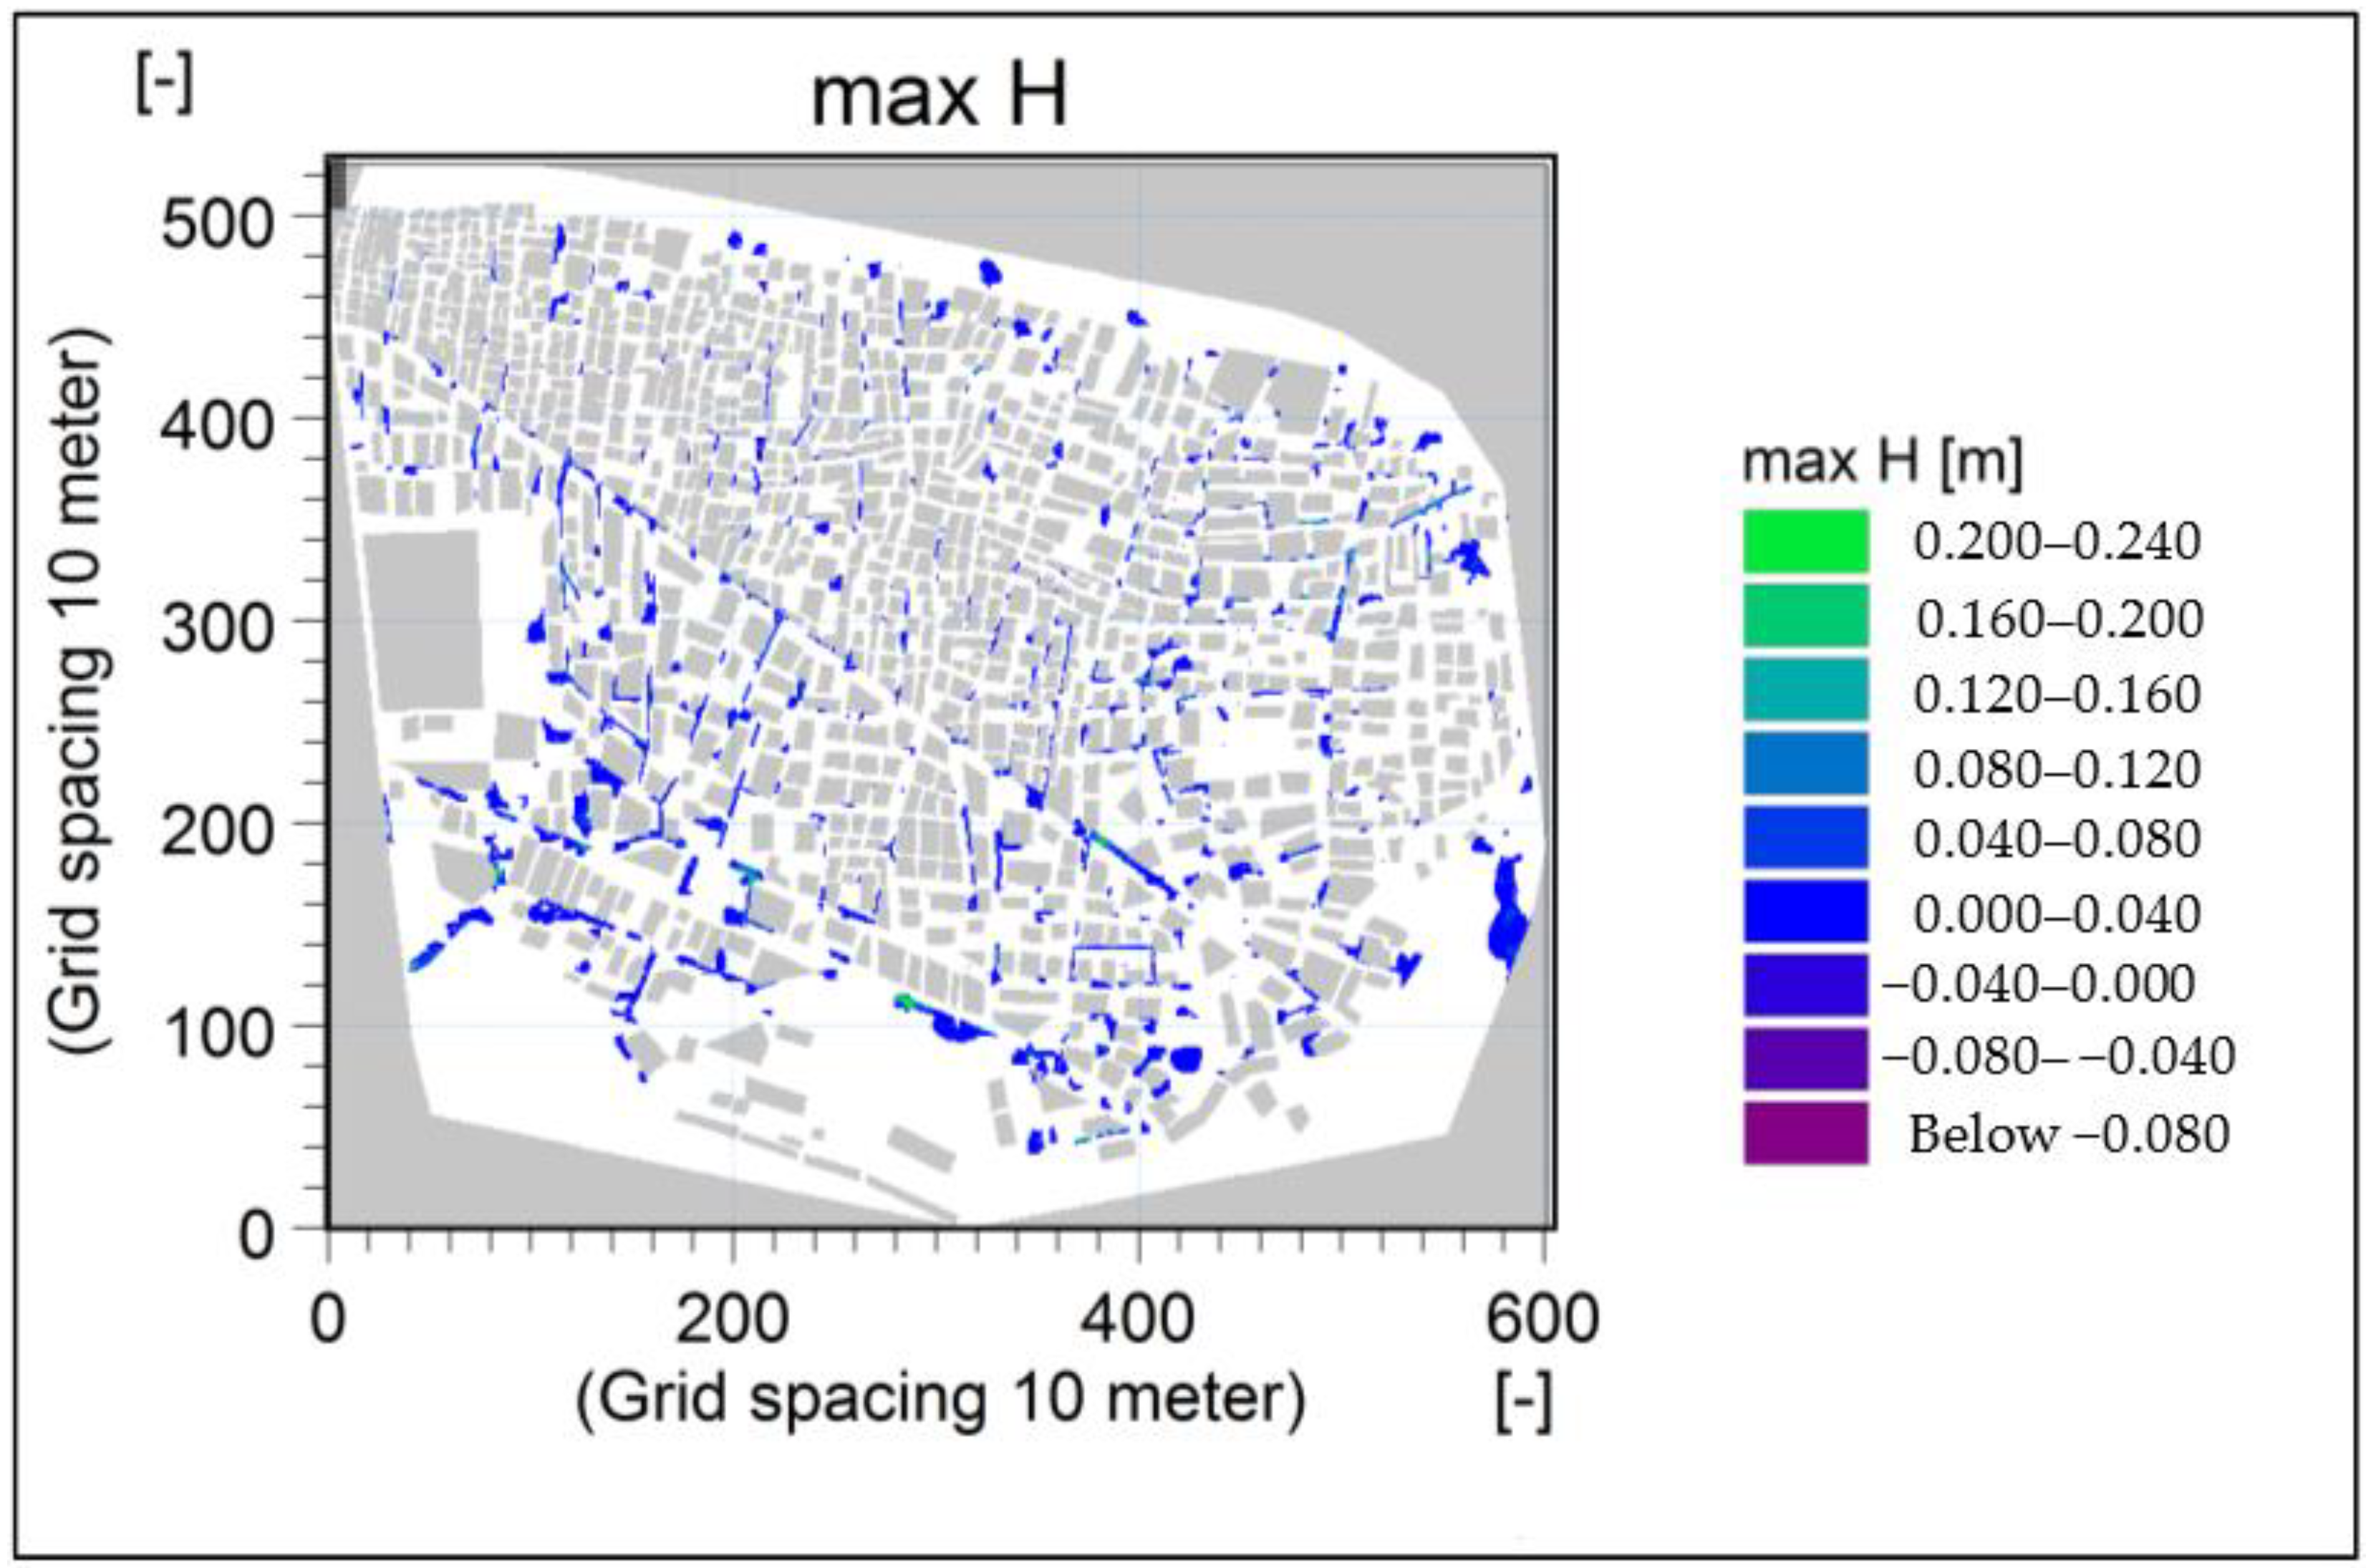
The second-generation model developed by Shrestha [38] served as the basis for this study, but all model components such as pipe network, pumping station, and outlet configurations were updated. The overland flow model in the current study was represented using a DEM. The elevation gradient in the grid cells defines the topography of the study area. The computation grid size had a 10 m resolution and a computation time step of 2 sec to ensure model stability. All the nodes except outlets were coupled to 2D cells at the ground elevation, as in Figure 8. The characteristics of the drainage system and typologies of roads and buildings have a substantial impact on the water level in flooded areas [39]. Those points were applied to each component of 2D hydraulic model, such as pipe network in node and link, road and building as 2D cells for overland flow simulation. In this study, the validation of the 2D hydrodynamic model was performed by comparing modeled flood areas produced by MIKE FLOOD with a map of flood-prone areas provided by BMA. In addition, an assessment of the overland model was carried out using a condition of 45% imperviousness per the study by Shrestha [38] with measured water level and rainfall data for the event of 11 October 2014. For this event, the flood risk areas confirmed by the BMA matched almost identically to the map of their flood-prone area. The overland flow model for the 11 October 2014 event from 11:50 AM to 2:00 PM is summarized in Figure 9. From the flood map and model results (Figure 9), the maximum floodwater depth for the rainfall event varied between 0.025 m to 0.125 m. Compared to the map of flood-prone areas developed by the DDS, BMA in Figure 10, almost the same streets exhibit a flooding pattern. In this way, the validation of the 1D-2D model can be considered as excellent for the Sukhumvit area at a planning scale.
The overland flow model was validated using the rainfall data on 11 October 2014 from 11:50 AM to 2:00 PM. The result of the model was compared with the observed flood data on the day, as shown in Figure 9.
From the flood map and model results (Figure 9), the maximum floodwater depth for the rainfall event on 11 October 2014 varies between 0.025 m to 0.125 m. Compared the flood map to the flood risk areas map developed by the DDS, BMA in Figure 10, almost the same streets exhibit a flooding pattern. In this way, the validation of the 1D-2D model can be considered as excellent for the Sukhumvit area.
2.3.3. The Real-Time Urban Drainage System Design
- (a)
- Analysis of Forecasted Lead Time
The model run time was tested using different cases that varied duration of measured and forecasted rainfall. The shortest period of rainfall was from both rain gauges and radar at 5 min time steps. The computation time recorded from the start running time until the model finishes running. To set up running time for the system, there were several different cases of rainfall duration starting from the minimum time step of rainfall data that was 5 min to at least 60 min. Moreover, from rainfall duration, it divided into measured and forecast rainfall duration, which was the total rainfall duration of the system. To set the overall decision-making time, the other task processing times also needed to be considered.
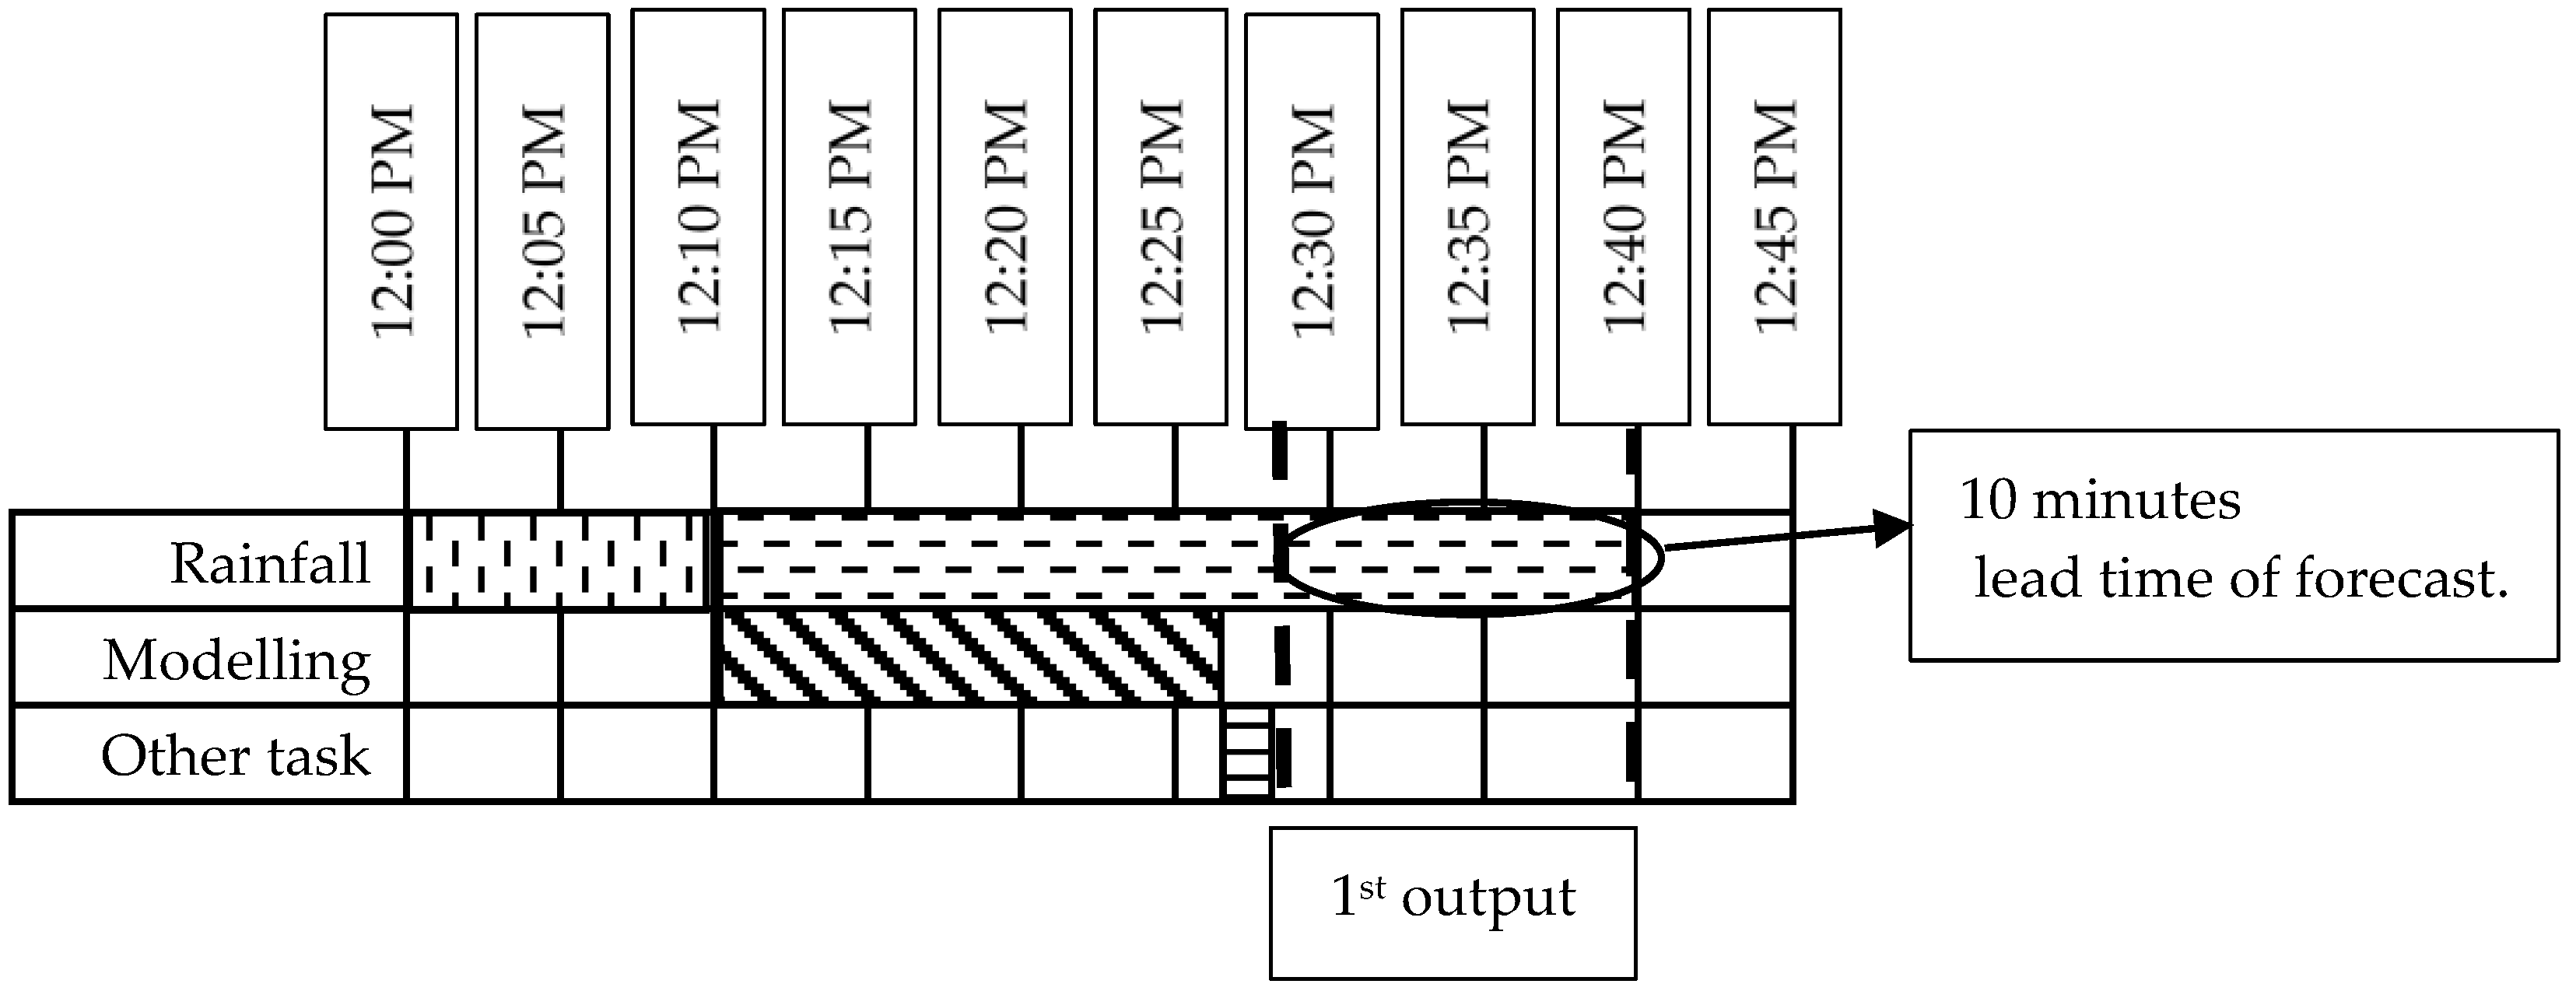
These considerations can be an important limitation of setting up the real-time system. If the model run time and overall decision-making time is too long, the advantage of real-time modelling is lost. Moreover, the radar forecast needs at least three recorded images in order to forecast the rainfall. Thus, the measured rainfall duration will be 10 min, and the rest of the duration will be the forecast and the decision part, which takes 30 min. The model running time plus other tasks will take 20 min, and there are around 10 min of lead time from each forecasting time of the RTUDS.
- (b)
- Flood Forecast Dissemination
The presentation of time-series water level and inundation map and animation are produced to help flood agencies and the community to understand the flood risk for the area and to manage and decrease flood damage as the result real-time actions that may be implemented. The RTUDS results are presented in two ways. The first method reports the MIKE URBAN simulation results via Mzplotcomapp.exe which visualizes the time series of water levels at various considered nodes. The monitor stations of public services such as school and hospital, and the criteria of selected locations that will show the time series of water level. The simulated results will be concentrated on the area in which flooding always occurs. All the areas having time series of water level results will be shown automatically, and the flood map presentation has the benefit of being understood easily and of timely implementation for all urban flooding.
3. Results
Model Accuracy and Limitation
A real-time urban drainage system was successfully developed in this study. The model running time was tested using different cases that varied the duration of rainfall. The shortest period of precipitation was 40 min. The time recorded from the start running time until the model finish running was 20 min. It covered modelling time and the other tasks such as computing, sending, and receiving data. The 40 min of total rainfall duration that input to the model will contain 10 min of measured rainfall duration and 30 min of forecasted duration. The lead time of the forecast is approximately 10 min ahead due to current computer specification as shown in Figure 11.
Figure 12 shows the results of the simulated water level at two selected nodes and the maximum flood level map in the study with three different sources of rainfall data.
This study consists of the simulation results based on 10 rainfall events on 8 June 2015 from 0.00 AM to 6.00 AM. It is divided into three different scenarios of rainfall input sources such as:
- (1)
- Rainfall from RTUDS
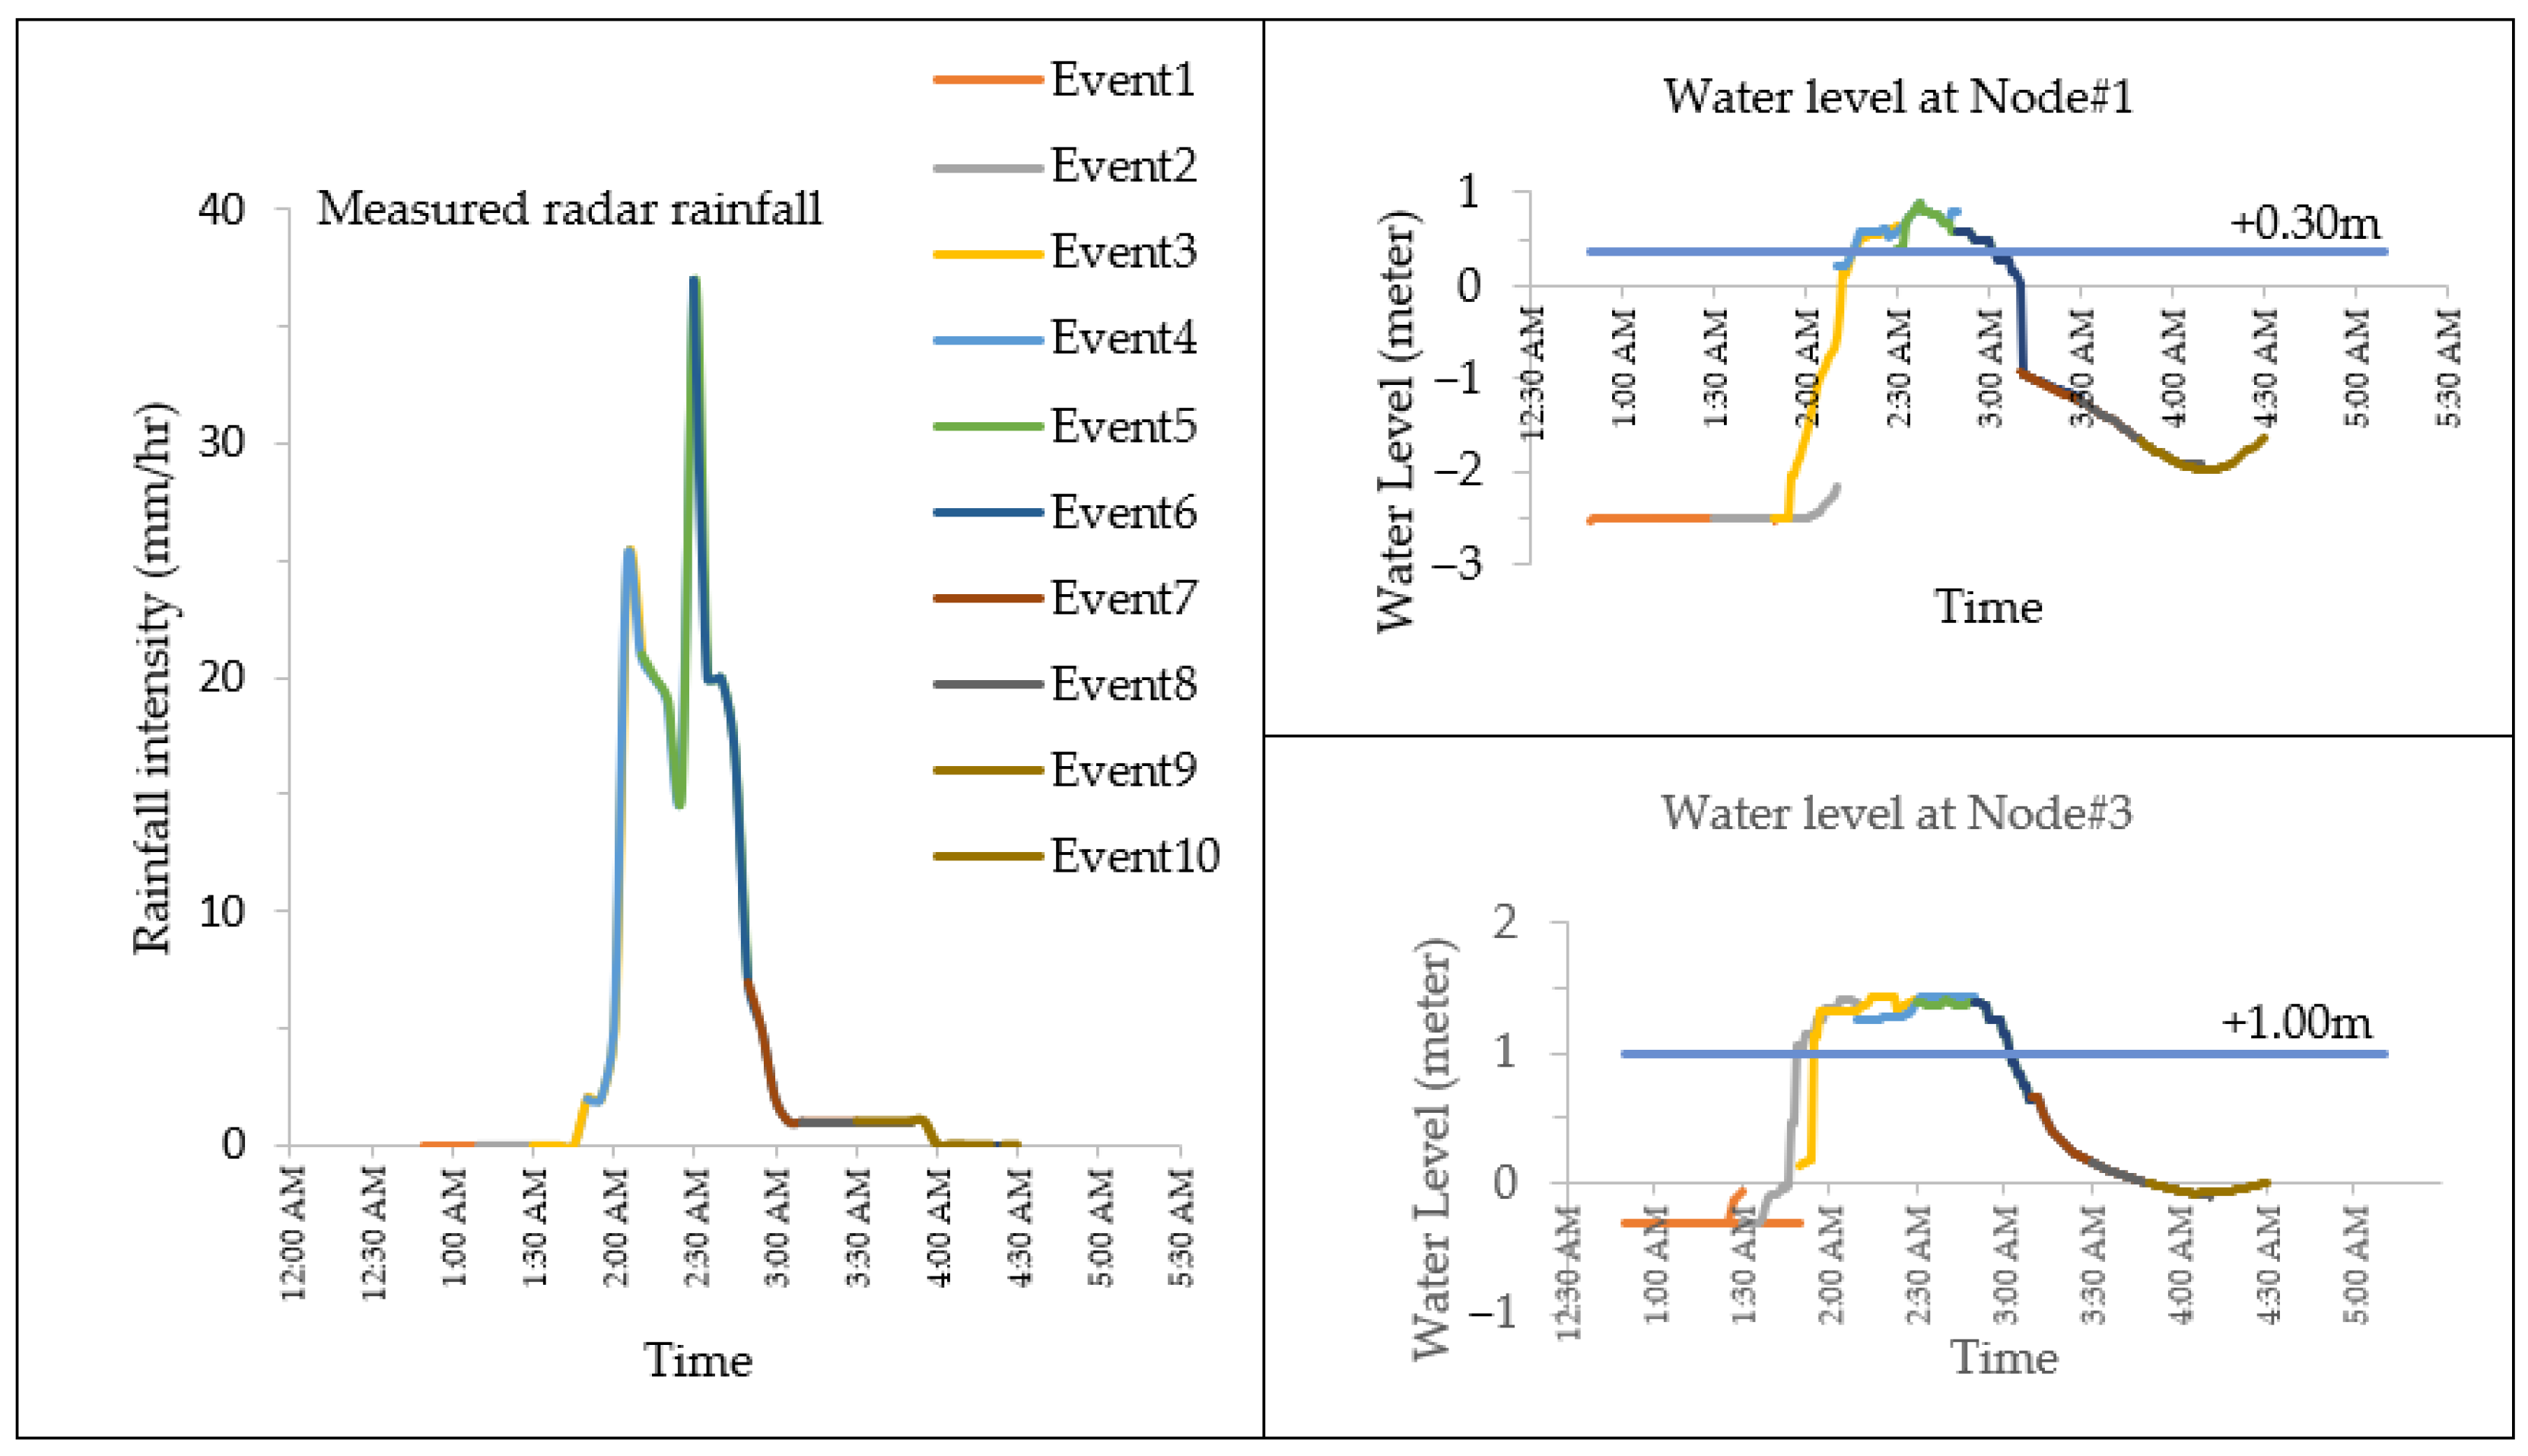
In this case, the real-time system used 40 min of rainfall from a combination of 10 min of recorded rainfall and 30 min of forecasted rainfall. It showed the continuous results of 10 events, as shown in Figure 13 and Figure 14.
- (2)
- Rainfall from Measured Radar
In this case, the result of water level and flood inundation was produced to compare with RTUDS. The rainfall input was used from measured radar data with the same 40 min in each rainfall event for simulation (Figure 15 and Figure 16).
- (3)
- Rainfall from Rain Gauge Station
This case used measured rainfall from the rain gauge station at station E40 as a represent station of the area. The rainfall duration was 40 min in each rainfall event for simulation (Figure 17 and Figure 18).
- Real-Time Urban Drainage System—RTUDS Rainfall
- Measured radar rainfall.
- Measured rain gauge.
The RTUDS provided the maximum depth of flood, and the notification flood occurs from three different rainfall source scenarios. Table 1 summarizes the results.
On the same day, BMA, DDS reported flooding occurred from 3.00 AM, and covered most of the main roads in study areas such as Rama III, IV, Sukhumvit, and Asokemontri. The results of the analysis here illustrate that the real-time urban drainage system can provide advanced notice of 10 min of the potential for flooding. The advanced notice provided by the RTUDS can facilitate preparation time for BMA DDS to manage the system through the operation of flood gates and deployment of pumps to critical areas. In addition, people in the area can be provided with ongoing updates of flood status and risk. Moreover, RTUDS rainfall is based on both measured and forecasted radar rainfall. Therefore, the accuracy depends on the forecasting of radar rainfall data. The lead time of the forecast of around 10 min to know the future situation is still quite short. It needs to be improved to make the lead time of the forecast longer.
4. Discussion
Previous studies undertaken in Sukhumvit [25,37] have shown the significance of real-time system accuracy, and the limitations based on the forecasting methods and the computer limitation. This study has achieved the 10 min lead time by using the present real-time modeling with 40 min rainfall duration and 15–20 min processing time. This result has greatly improved on previous research [25]. It showed that there is a significant increase in term of processing frequency duration from 60 min of rainfall duration with 60 min of processing time to 40 min of rainfall duration with 15–20 min of processing time due to the computer limitation and the updated time series of the rainfall data source. Although the lead time will be short, this study can provide the forecasting results over a shorter duration. Therefore, people or related officers can use these results for deciding to avoid flooding. In addition, computer performance is one of the most important parts of the real-time system. Therefore, computational time will be the main parameter to design the schedule of the system and determine the lead time of the forecast. The technology of software for modeling and hardware in terms of computer devices has been developed from previous studies until now. Thus, computation time in this study is less than in the past, and it allows the real-time forecasting model to provide a longer lead time of forecasting and more frequent results.
5. Conclusions
The study highlighted the challenges of real-time urban flood warning development. The methodology of automatic processing can be applied to other areas of urban and peri-urban Bangkok and has potential to be developed for other cities in Southeast Asia. The integrated system-linked rainfall forecasting from radar, drainage pipe flow modelling and the overland flood modelling in an effort to streamline the flood risk prediction process. In this way, the research can help to reduce the complicated process from computing and provide shorter and more frequent flood forecast updates.
The selected 40 min of rainfall data (10 min record and 30 min forecast) was optimally applied in the real-time system. The system updates every 20 min and provides the lead time forecast of 10 min. This is a computation and analysis improvement compared to the one hour of time needed for flood prediction as reported by Boonya-aroonnet [40] for a single event. However, the improvement of this study came from the integration of software contained with rainfall forecasting and flood simulation. In addition, this study benefited from improved hardware and software technology as compared to the early 2000s. The shorter simulation time and more frequent reporting of results can be further developed for a flood warning system.
Moreover, the real-time urban drainage system still needs a stable source of rainfall data. Otherwise, it will be terminated. The automatic switch mode to choose the source of the rainfall data can help the system run continuously. The boundary around the study area must be linked to the model in real-time—for example, the water level in the canal around the city. The future technology of computer servers and databases can reduce the complex steps of the computer system and shorten the model running time. More capacity of the memory in the computer will create more space to store the backup result file. Otherwise, it needs to be taken out and stored in external memory or on the cloud. Additional field measurement is recommended. For example, the discharge of the sewer should be measured. The comparison of the calculating and field measurement discharge is essential to obtain higher model accuracy.
Author Contributions
Conceptualization, D.C. and S.W.; methodology, D.C.; software, D.C.; validation, D.C.; formal analysis, D.C.; investigation, D.C.; data curation, D.C.; writing—original draft preparation, D.C.; writing—review and editing, D.C. and H.M.; visualization, D.C. and H.M.; supervision, S.W. and H.M. All authors have read and agreed to the published version of the manuscript.
Funding
This research received no external funding.
Institutional Review Board Statement
Not applicable.
Informed Consent Statement
Not applicable.
Data Availability Statement
Not applicable.
Acknowledgments
The authors wish sincere thanks to the Drainage and Sewerage Department, the Bangkok Metropolitan Administration for providing data and necessary information for the research. The authors also would like to thank all laboratory members for their advice and helps in the computer technical. Finally, we would like to thank three anonymous reviewers and editors for thorough and constructive comments that greatly improved the clarity and impact of this work.
Conflicts of Interest
The authors declare no conflict of interest.
References
- René, J.-R.; Djordjević, S.; Butler, D.; Madsen, H.; Mark, O. Assessing the potential for real-time urban flood forecasting based on a worldwide survey on data availability. Urban Water J. 2013, 11, 573–583. [Google Scholar] [CrossRef] [Green Version]
- Irvine, K.N. Climate Change and Urban Hydrology: Research Needs in the Developed and Developing Worlds. J. Water Manag. Model. 2013. [Google Scholar] [CrossRef]
- Chang, C.-H.; Irvine, K. Climate Change Resilience and Public Education in Response to Hydrologic Extremes in Singapore. Br. J. Environ. Clim. Chang. 2014, 4, 328–354. [Google Scholar] [CrossRef]
- Ruangpan, L.; Vojinovic, Z.; Di Sabatino, S.; Leo, L.S.; Capobianco, V.; Oen, A.M.P.; McClain, M.E.; Lopez-Gunn, E. Nature-based solutions for hydro-meteorological risk reduction: A state-of-the-art review of the research area. Nat. Hazards Earth Syst. Sci. 2020, 20, 243–270. [Google Scholar] [CrossRef] [Green Version]
- Zevenbergen, C.; Fu, D.; Pathirana, A. Transitioning to Sponge Cities: Challenges and Opportunities to Address Urban Water Problems in China. Water 2018, 10, 1230. [Google Scholar] [CrossRef] [Green Version]
- Fletcher, T.D.; Shuster, W.; Hunt, W.F.; Ashley, R.; Butler, D.; Arthur, S.; Trowsdale, S.; Barraud, S.; Semadeni-Davies, A.; Bertrand-Krajewski, J.-L.; et al. SUDS, LID, BMPs, WSUD and more—The evolution and application of terminology surrounding urban drainage. Urban Water J. 2014, 12, 525–542. [Google Scholar] [CrossRef]
- Irvine, K.N.; Loc, H.H.; Sovann, C.; Suwanarit, A.; Likitswat, F.; Jindal, R.; Koottatep, T.; Gaut, L.H.C.; Qi, L.W.; Wandeler, K.D. Bridging the Form and Function Gap in Urban Green Space Design through Environmental Systems Modeling. J. Water Manag. Model. 2021. [Google Scholar] [CrossRef]
- Lashford, C.; Rubinato, M.; Cai, Y.; Hou, J.; Abolfathi, S.; Coupe, S.; Charlesworth, S.; Tait, S. SuDS & Sponge Cities: A Comparative Analysis of the Implementation of Pluvial Flood Management in the UK and China. Sustainability 2019, 11, 213. [Google Scholar] [CrossRef] [Green Version]
- Lim, H.; Lu, X. Sustainable urban stormwater management in the tropics: An evaluation of Singapore’s ABC Waters Program. J. Hydrol. 2016, 538, 842–862. [Google Scholar] [CrossRef]
- Kang, N.; Kim, S.; Kim, Y.; Noh, H.; Hong, S.J.; Kim, H.S. Urban Drainage System Improvement for Climate Change Adaptation. Water 2016, 8, 268. [Google Scholar] [CrossRef] [Green Version]
- Oladunjoye, O.A.; Proverbs, D.G.; Collins, B.; Xiao, H. A cost-benefit analysis model for the retrofit of sustainable urban drainage systems towards improved flood risk mitigation. Int. J. Build. Pathol. Adapt. 2019, 38, 423–439. [Google Scholar] [CrossRef]
- Ngo, T.T.; Jung, D.; Kim, J.H. Robust Urban Drainage System: Development of a Novel Multiscenario-Based Design Approach. J. Water Resour. Plan. Manag. 2019, 145, 04019027. [Google Scholar] [CrossRef]
- Nazari, B.; Seo, D.-J.; Muttiah, R.; Worth, T.C.O.F. Assessing the Impact of Variations in Hydrologic, Hydraulic and Hydrometeorological Controls on Inundation in Urban Areas. J. Water Manag. Model. 2016. [Google Scholar] [CrossRef] [Green Version]
- Kim, H.I.; Keum, H.J.; Han, K.Y. Real-Time Urban Inundation Prediction Combining Hydraulic and Probabilistic Methods. Water 2019, 11, 293. [Google Scholar] [CrossRef] [Green Version]
- Chang, F.-J.; Chen, P.-A.; Lu, Y.-R.; Huang, E.; Chang, K.-Y. Real-time multi-step-ahead water level forecasting by recurrent neural networks for urban flood control. J. Hydrol. 2014, 517, 836–846. [Google Scholar] [CrossRef]
- Mason, D.; Giustarini, L.; Garcia-Pintado, J.; Cloke, H. Detection of flooded urban areas in high resolution Synthetic Aperture Radar images using double scattering. Int. J. Appl. Earth Obs. Geoinf. 2014, 28, 150–159. [Google Scholar] [CrossRef] [Green Version]
- Rafieeinasab, A.; Norouzi, A.; Kim, S.; Habibi, H.; Nazari, B.; Seo, D.-J.; Lee, H.; Cosgrove, B.; Cui, Z. Toward high-resolution flash flood prediction in large urban areas—Analysis of sensitivity to spatiotemporal resolution of rainfall input and hydrologic modeling. J. Hydrol. 2015, 531, 370–388. [Google Scholar] [CrossRef] [Green Version]
- Loc, H.H.; Park, E.; Chitwatkulsiri, D.; Lim, J.; Yun, S.-H.; Maneechot, L.; Phuong, D.M. Local rainfall or river overflow? Re-evaluating the cause of the Great 2011 Thailand flood. J. Hydrol. 2020, 589, 125368. [Google Scholar] [CrossRef]
- Drainage and Sewerage Department. Available online: https://dds.bangkok.go.th/content/doc3/index.php (accessed on 28 March 2021).
- Laeni, N.; Brink, M.V.D.; Arts, J. Is Bangkok becoming more resilient to flooding? A framing analysis of Bangkok’s flood resilience policy combining insights from both insiders and outsiders. Cities 2019, 90, 157–167. [Google Scholar] [CrossRef]
- Hilly, G.; Vojinovic, Z.; Weesakul, S.; Sanchez, A.; Hoang, D.N.; Djordjević, S.; Chen, A.S.; Evans, B. Methodological Framework for Analysing Cascading Effects from Flood Events: The Case of Sukhumvit Area, Bangkok, Thailand. Water 2018, 10, 81. [Google Scholar] [CrossRef] [Green Version]
- Nabangchang, O.; Allaire, M.; Leangcharoen, P.; Jarungrattanapong, R.; Whittington, D. Economic costs incurred by households in the 2011 Greater Bangkok flood. Water Resour. Res. 2014, 51, 58–77. [Google Scholar] [CrossRef] [Green Version]
- Weesakul, S.; Mark, O.; Naksua, W.; Chingnawan, S.; Liong, S.-Y.; Phoon, K.-K.; Babovic, V. Real time urban flood modeling for bangkok metropolitan administration, case study: Sukumvit area. In Hydroinformatics; World Scientific Publishing: Singapore, 2004; pp. 1907–1914. [Google Scholar]
- Mike. Flood. Available online: https://www.mikepoweredbydhi.com/products/mike-flood (accessed on 28 March 2021).
- Hung, M.E.N.Q.; Weesakul, S.; Weesakul, U.; Chaliraktrakul, C.; Mark, O.; Larsen, L.C. A Real-Time Hydrological Information System for Cities. Water Encycl. 2005, 121–127. [Google Scholar] [CrossRef]
- Weather Bangkok. Available online: http://weather.bangkok.go.th/radar/RadarNongchok.aspx (accessed on 28 March 2021).
- Weesakul, S. Development of Rainfall Forecasting Platform in Bangkok. Available online: https://www.nstda.or.th/th/2436-rainalert (accessed on 16 December 2020).
- Toth, E.; Brath, A.; Montanari, A. Comparison of short-term rainfall prediction models for real-time flood forecasting. J. Hydrol. 2000, 239, 132–147. [Google Scholar] [CrossRef]
- Henonin, J.; Russo, B.; Mark, O.; Gourbesville, P. Real-time urban flood forecasting and modelling—A state of the art. J. Hydroinform. 2013, 15, 717–736. [Google Scholar] [CrossRef]
- Shah, R.; Sahai, A.K.; Mishra, V. Short to sub-seasonal hydrologic forecast to manage water and agricultural resources in India. Hydrol. Earth Syst. Sci. 2017, 21, 707–720. [Google Scholar] [CrossRef] [Green Version]
- Jeong, J.; Kannan, N.; Arnold, J.; Glick, R.H.; Gosselink, L.; Srinivasan, R. Development and Integration of Sub-hourly Rainfall–Runoff Modeling Capability Within a Watershed Model. Water Resour. Manag. 2010, 24, 4505–4527. [Google Scholar] [CrossRef]
- Notaro, V.; Fontanazza, C.; Freni, G.; Puleo, V. Impact of rainfall data resolution in time and space on the urban flooding evaluation. Water Sci. Technol. 2013, 68, 1984–1993. [Google Scholar] [CrossRef] [Green Version]
- Leandro, J.; Chen, A.S.; Djordjević, S.; Savic, D. Comparison of 1D/1D and 1D/2D Coupled (Sewer/Surface) Hydraulic Models for Urban Flood Simulation. J. Hydraul. Eng. 2009, 135, 495–504. [Google Scholar] [CrossRef]
- Vojinovic, Z.; Tutulic, D. On the use of 1D and coupled 1D-2D modelling approaches for assessment of flood damage in urban areas. Urban Water J. 2009, 6, 183–199. [Google Scholar] [CrossRef]
- Marvin, J.T.; Wilson, A.T. One Dimensional, Two Dimensional and Three Dimensional Hydrodynamic Modeling of a Dyked Coastal River in the Bay of Fundy. J. Water Manag. Model. 2016. [Google Scholar] [CrossRef] [Green Version]
- Abdelrahman, Y.T.; El Moustafa, A.M.; Elfawy, M. Simulating Flood Urban Drainage Networks through 1D/2D Model Analysis. J. Water Manag. Model. 2018. [Google Scholar] [CrossRef]
- Chingnawan, S. Real-Time Modelling of Urban Flooding in the Sukhumvit Area, Bangkok, Thailand; Asian Institute of Technology: Phatumthani, Thailand, 2003. [Google Scholar]
- Shrestha, A.; Babel, M.S.; Weesakul, S. Integrated Modelling of Climate Change and Urban Drainage. Manag. Water Resour. Under Clim. Uncertain. 2014, 89–103. [Google Scholar] [CrossRef]
- Postacchini, M.; Zitti, G.; Giordano, E.; Clementi, F.; Darvini, G.; Lenci, S. Flood impact on masonry buildings: The effect of flow characteristics and incidence angle. J. Fluids Struct. 2019, 88, 48–70. [Google Scholar] [CrossRef]
- Boonya-Aroonnet, S.; Weesakul, S.; Mark, O. Modeling of Urban Flooding in Bangkok. Glob. Solut. Urban Drain. 2002, 1–14. [Google Scholar] [CrossRef]
Figure 1.
Map of Sukhumvit area, Bangkok, Thailand. The boundary of this study area is from one of the water management polder areas in Bangkok [19].
Figure 1.
Map of Sukhumvit area, Bangkok, Thailand. The boundary of this study area is from one of the water management polder areas in Bangkok [19].

Figure 2.
The real-time urban drainage system framework contains three main parts, i.e., data processing, modelling, real-time system with database.
Figure 2.
The real-time urban drainage system framework contains three main parts, i.e., data processing, modelling, real-time system with database.

Figure 3.
Location of the study area and the five rain gauge stations network which were selected for analysis in this study [19].
Figure 3.
Location of the study area and the five rain gauge stations network which were selected for analysis in this study [19].

Figure 4.
Location of the study area and the Nong Jok radar station located at the east side of the Bangkok area which was selected for analysis in this study [26].
Figure 4.
Location of the study area and the Nong Jok radar station located at the east side of the Bangkok area which was selected for analysis in this study [26].

Figure 5.
Flowchart of rainfall forecast using a translation method [25].
Figure 5.
Flowchart of rainfall forecast using a translation method [25].

Figure 6.
The result of the rainfall forecasting system for the event on 9 June 2015 at 3.35 PM [27].
Figure 6.
The result of the rainfall forecasting system for the event on 9 June 2015 at 3.35 PM [27].

Figure 7.
The accuracy of the rainfall forecasting system from radar, based on results reported in [27].
Figure 7.
The accuracy of the rainfall forecasting system from radar, based on results reported in [27].

Figure 8.
Overland flow of the coupled 1D/2D model at Sukhumvit area. The map show network of the drainage pipes and digital elevation model (DEM) which provide topographics of the study area.
Figure 8.
Overland flow of the coupled 1D/2D model at Sukhumvit area. The map show network of the drainage pipes and digital elevation model (DEM) which provide topographics of the study area.

Figure 9.
The maximum flood depth (Max H) from 2D overland flow model on 11 October 2014.

Figure 10.
Flood risk map showing the risk area by yellow line in Sukhumvit polder area. This map is from the statistical profile of Bangkok Metropolitan Administration report [19].
Figure 10.
Flood risk map showing the risk area by yellow line in Sukhumvit polder area. This map is from the statistical profile of Bangkok Metropolitan Administration report [19].

Figure 11.
The real-time urban drainage system timeline, explaining each part of real-time system such as rainfall, modelling and post processing before display results.
Figure 11.
The real-time urban drainage system timeline, explaining each part of real-time system such as rainfall, modelling and post processing before display results.

Figure 12.
The map shows selected locations of Node 1 and 3 for comparing the water level results from the various sources of rainfall data.
Figure 12.
The map shows selected locations of Node 1 and 3 for comparing the water level results from the various sources of rainfall data.

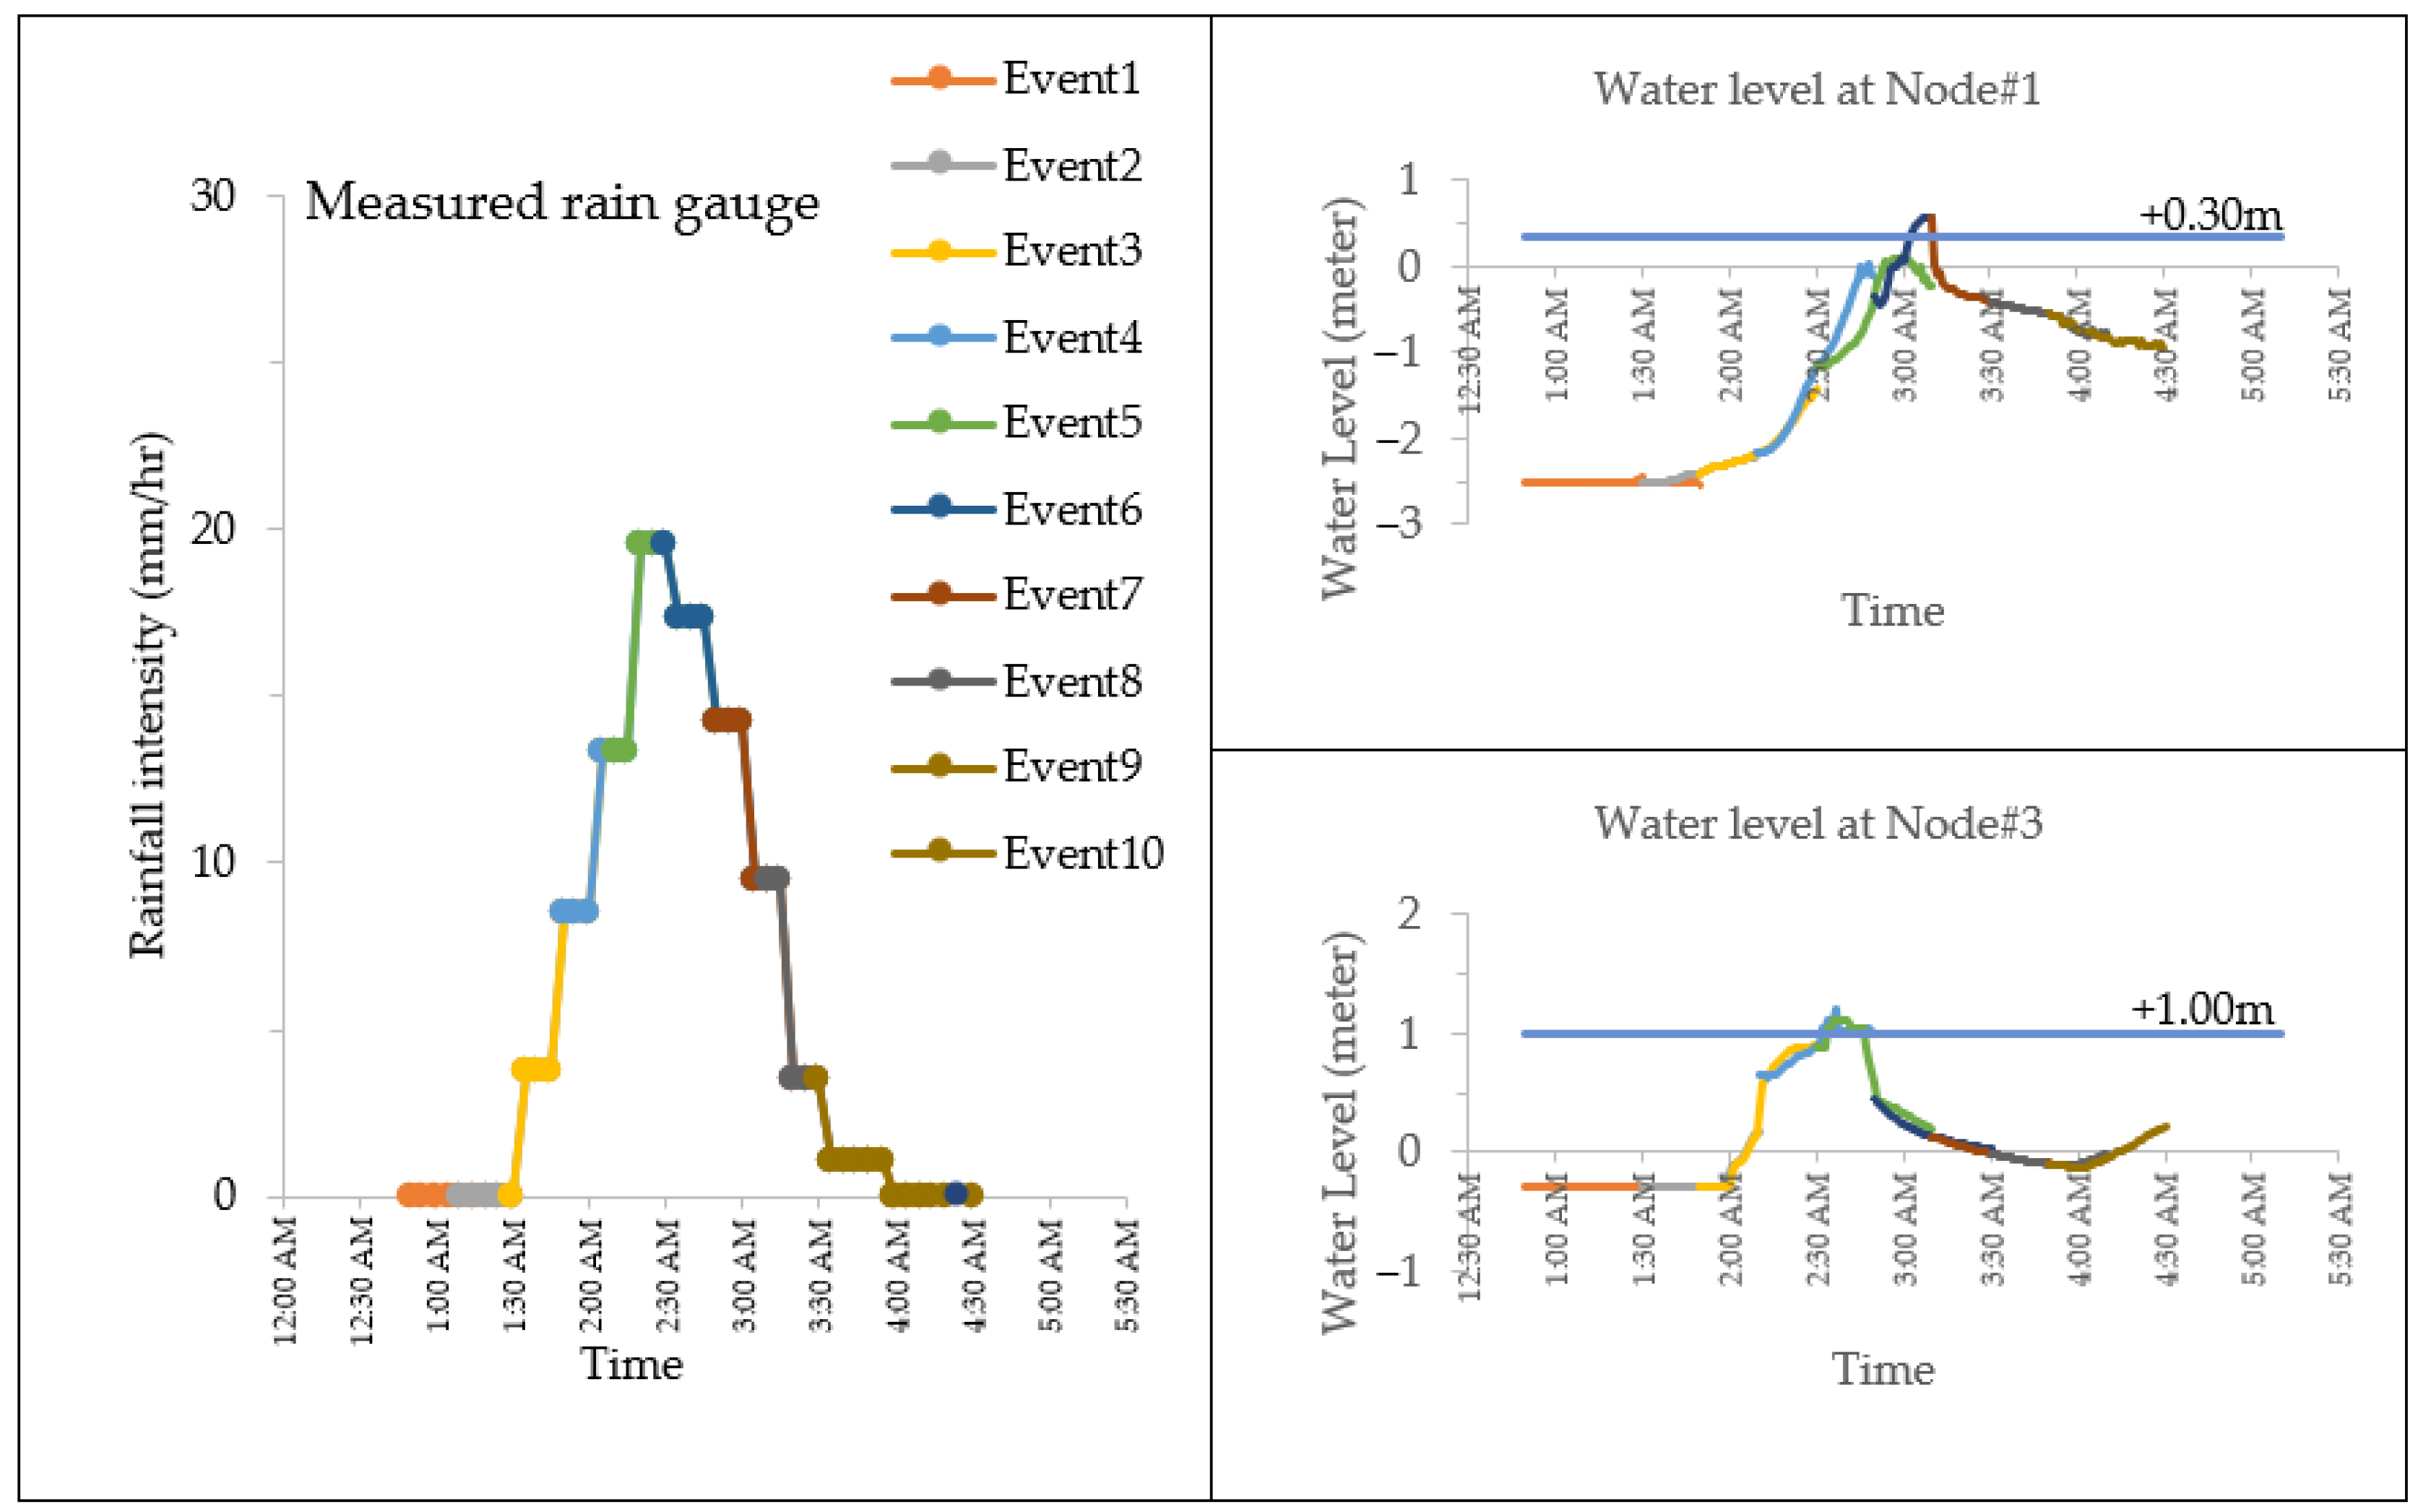
Figure 13.
Rainfall and water level from real-time urban drainage system rainfall.

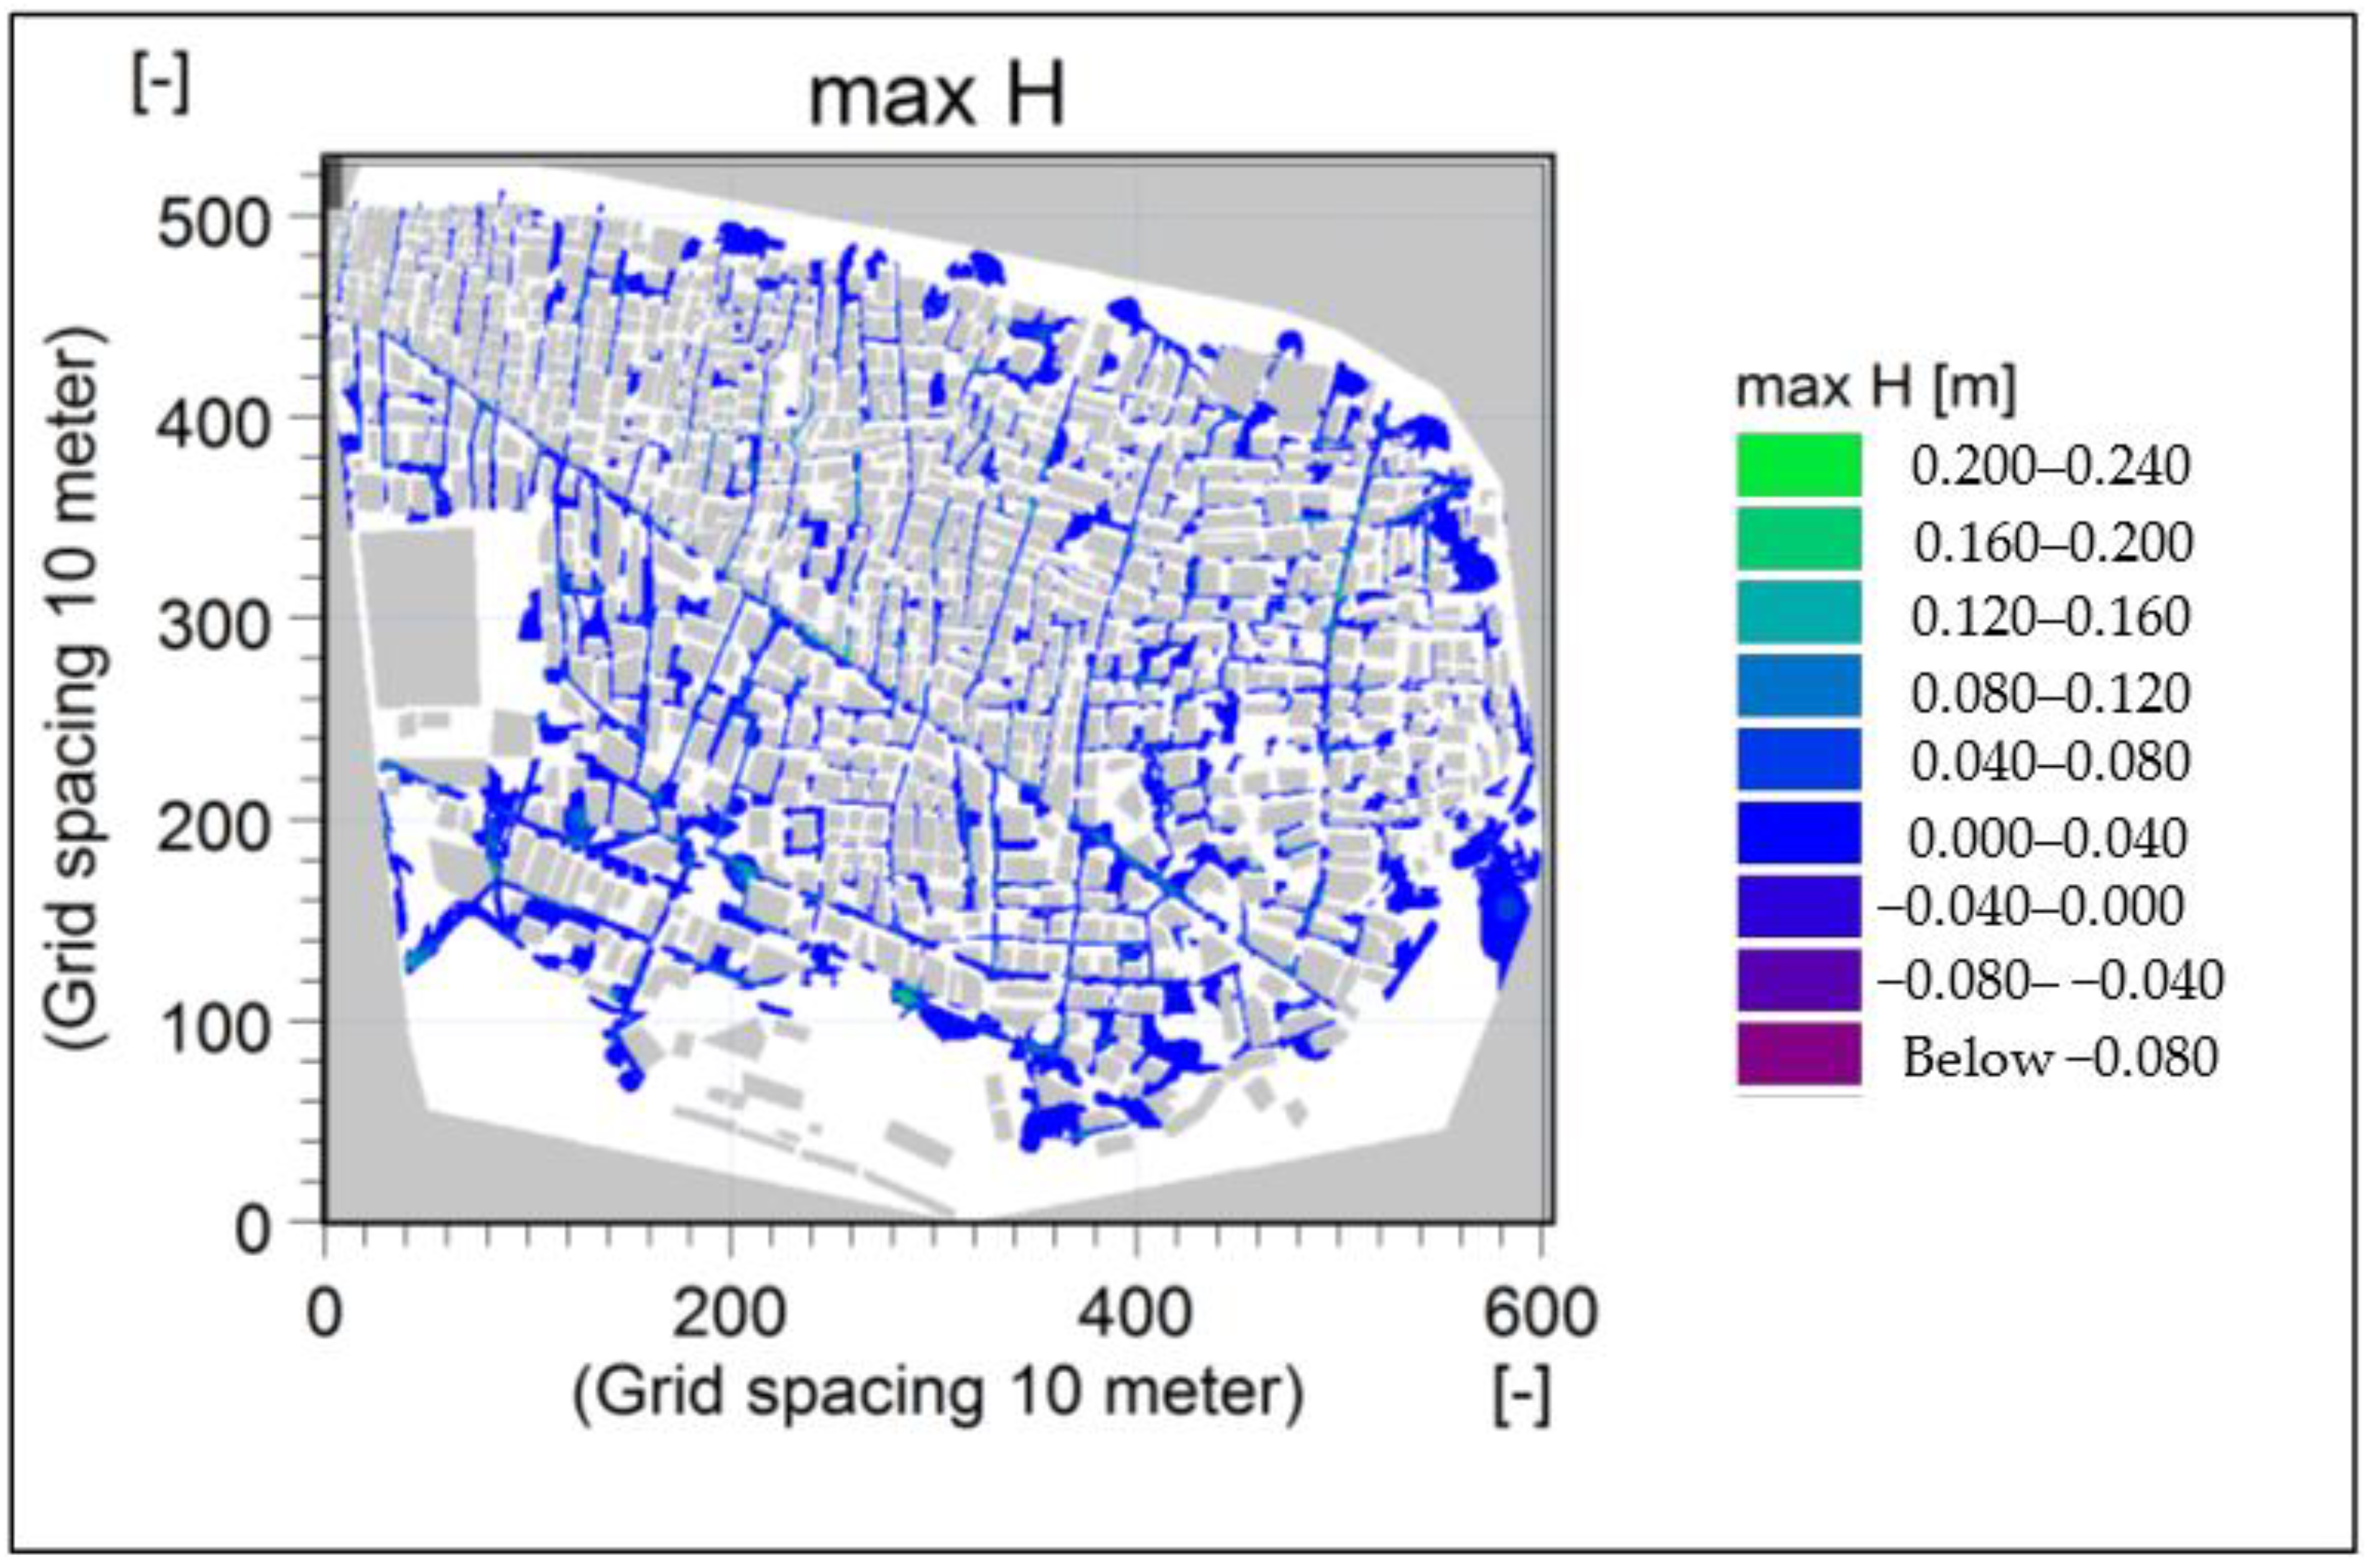
Figure 14.
Maximum flood map from real-time urban drainage system rainfall.

Figure 15.
Rainfall and water level from measured radar rainfall.

Figure 16.
Maximum flood map result from measured radar rainfall.

Figure 17.
Rainfall and water level from measured rain gauge.

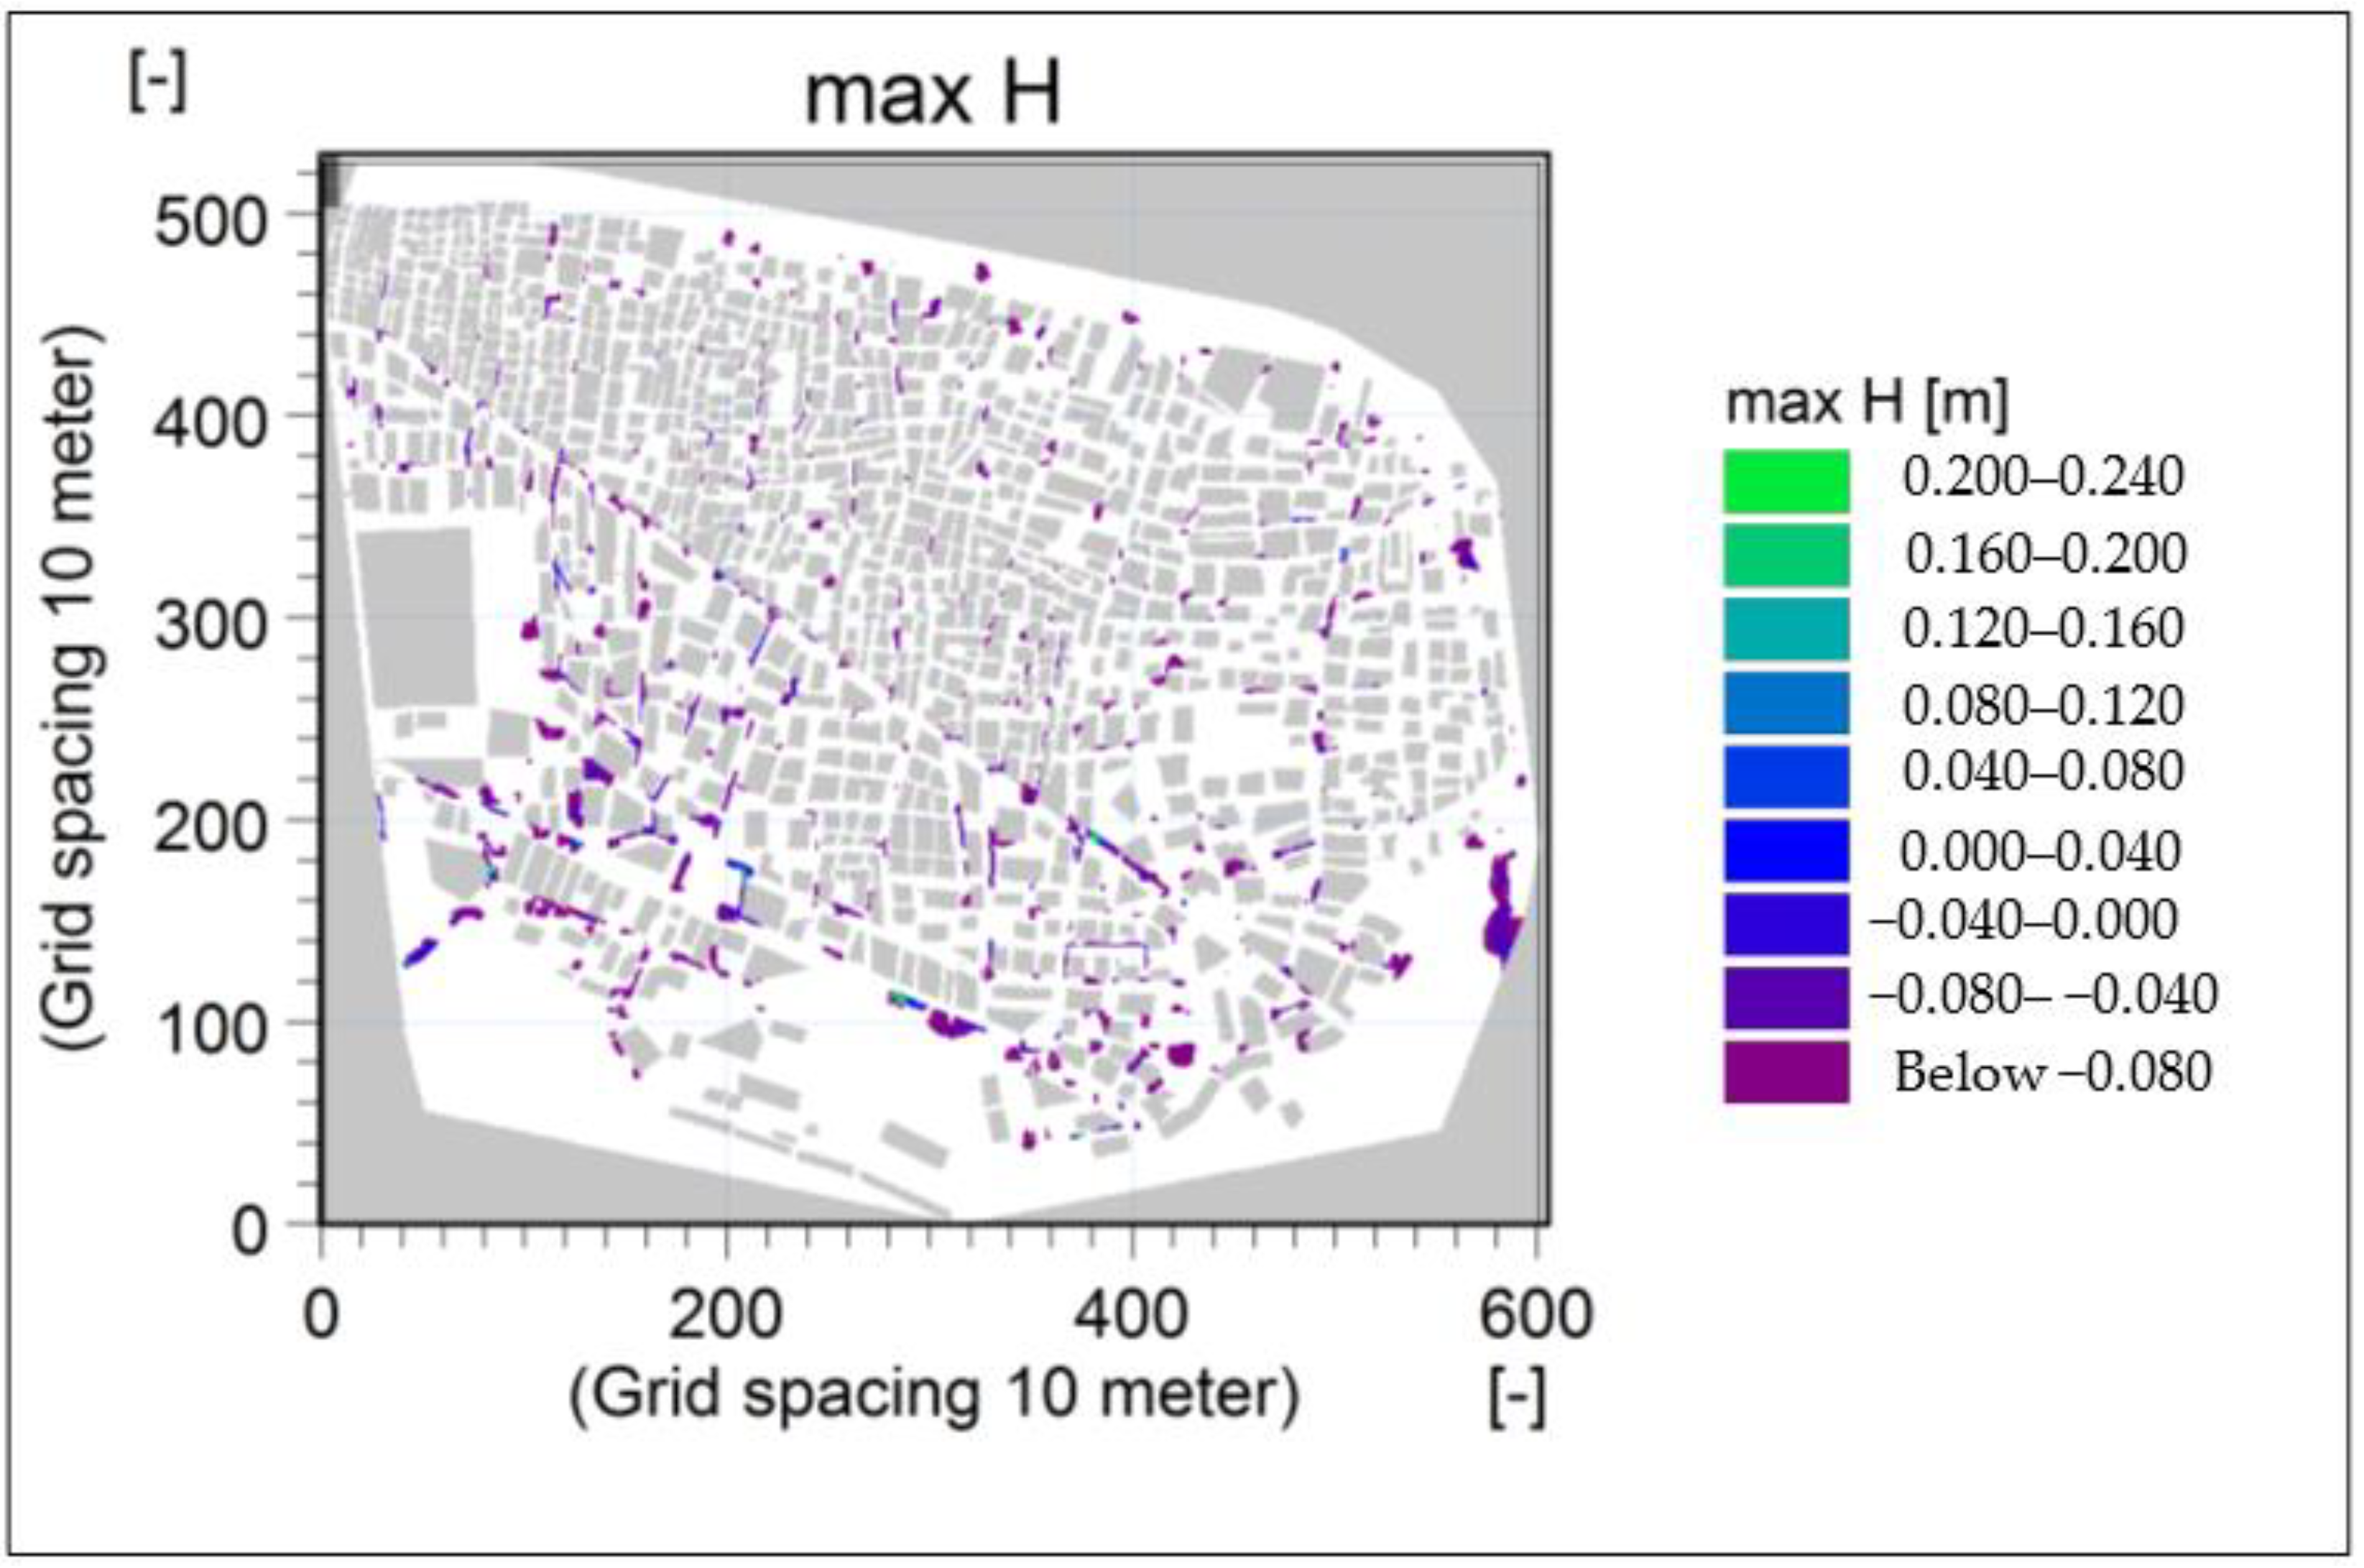
Figure 18.
Maximum flood map result from the measured rain gauge.


Table 1.
Comparison of flood notification from the result of real-time urban drainage system (RTUDS) and measured rainfall on 8 June 2015 from 0.00 AM to 6.00 AM.
Table 1.
Comparison of flood notification from the result of real-time urban drainage system (RTUDS) and measured rainfall on 8 June 2015 from 0.00 AM to 6.00 AM.
| Event No. | Model Start Running at | Rainfall Duration | Flood Notification | ||
|---|---|---|---|---|---|
| RTUDS | Measured Radar | Measured Rain Gauge | |||
| 1 | 1:00 AM | 0:50–1:30 AM | - | - | - |
| 2 | 1:20 AM | 1:10–1:50 AM | - | - | - |
| 3 | 1:40 AM | 1:30–2:10 AM | Flood | - | - |
| 4 | 2:00 AM | 1:50–2:30 AM | Flood | Flood | - |
| 5 | 2:20 AM | 2:10–2:50 AM | Flood | Flood | - |
| 6 | 2:40 AM | 2:30–3:10 AM | Flood | Flood | Flood |
| 7 | 3:00 AM | 2:50–3:30 AM | - | Flood | Flood |
| 8 | 3:20 AM | 3:10–3:50 AM | - | - | Flood |
| 9 | 3:40 AM | 3:30–4:10 AM | - | - | - |
| 10 | 4:00 AM | 3:50–4:30 AM | - | - | - |
Publisher’s Note: MDPI stays neutral with regard to jurisdictional claims in published maps and institutional affiliations. |
© 2021 by the authors. Licensee MDPI, Basel, Switzerland. This article is an open access article distributed under the terms and conditions of the Creative Commons Attribution (CC BY) license (https://creativecommons.org/licenses/by/4.0/).
Share and Cite
MDPI and ACS Style
Chitwatkulsiri, D.; Miyamoto, H.; Weesakul, S. Development of a Simulation Model for Real-Time Urban Floods Warning: A Case Study at Sukhumvit Area, Bangkok, Thailand. Water 2021, 13, 1458. https://doi.org/10.3390/w13111458
AMA Style
Chitwatkulsiri D, Miyamoto H, Weesakul S. Development of a Simulation Model for Real-Time Urban Floods Warning: A Case Study at Sukhumvit Area, Bangkok, Thailand. Water. 2021; 13(11):1458. https://doi.org/10.3390/w13111458
Chicago/Turabian StyleChitwatkulsiri, Detchphol, Hitoshi Miyamoto, and Sutat Weesakul. 2021. "Development of a Simulation Model for Real-Time Urban Floods Warning: A Case Study at Sukhumvit Area, Bangkok, Thailand" Water 13, no. 11: 1458. https://doi.org/10.3390/w13111458
Note that from the first issue of 2016, this journal uses article numbers instead of page numbers. See further details here.