
A Comprehensive Investigation on Abnormal Impoundment of Reservoirs—A Case Study of Qionglin Reservoir in Kinmen Island

1
Department of Urban Planning and Landscape, National Quemoy University, Kinmen County 892, Taiwan
2
Department of Civil Engineering and Engineering Management, National Quemoy University, Kinmen County 892, Taiwan
3
Department of Architecture, National Quemoy University, Kinmen County 892, Taiwan
*
Author to whom correspondence should be addressed.
Water 2021, 13(11), 1463; https://doi.org/10.3390/w13111463
Submission received: 30 March 2021
/
Revised: 14 May 2021
/
Accepted: 20 May 2021
/
Published: 23 May 2021
(This article belongs to the Section Water Use and Scarcity)
Abstract
:Leakage is the most serious problem in reservoir operation, because heavy leakage influences reservoir impoundment efficiency and even leads to a complete loss of reservoir functions. Since its completion in 1982, Qionglin Reservoir has never been fully filled with water except in the spring of 1983 when there was heavy rain. The reservoir management unit suspected that its side slopes, bottom or dam might leak and carried out a number of leakage prevention and improvement works, but all of them failed to fulfill the impoundment function of the reservoir. Hence, this study attempts to find out the reasons why the reservoir cannot impound water. A series of tests and investigations are carried out in this study, including electrical resistivity tomography of dam, tracer test, geological drilling test, reservoir water level observation, investigation of reservoir catchment area and field investigation of dam. The test results and investigation results show that no leakage path and leakage are found. According to the analysis, there is no serious leakage of this reservoir. The main reason for the failure of impoundment is that massive improper development in the catchment area influences the runoff into the reservoir.
1. Introduction
Kinmen is a small island located between Taiwan and the Chinese Mainland, with an area of 151 square kilometers and a population of about 130,000. Figure 1 shows the location of Kinmen. Kinmen Island has a mean annual precipitation of less than 1100 mm and a mean annual evaporation of 1600 mm; therefore, water is very precious. Many small reservoirs have been built in the island to store runoff water from rare rains. Located in the central area of Kinmen islands, Qionglin Reservoir was completed in March 1982. Since its completion, Qionglin Reservoir has never achieved the planned impoundage except in April 1983 when there was heavy rain. The reservoir management unit considered that leakage might occur in Qionglin Reservoir and made many improvements. Three reservoir safety assessments were carried out in 1998, 2001 and 2005, respectively. Leakage prevention and improvement works were conducted in 1998, including laying impermeable cloth at its bottom and reinforced concrete on its slope. Upstream water interception and diversion works were added in 2001. However, due to the poor impoundment, in order to understand the leakage of Qionglin Reservoir, this study carried out tests and investigations on Qionglin Reservoir to explore the reasons for its poor impoundment.
In order to explore the reasons why Qionglin Reservoir has never been fully filled with water, this study carried out a series of tests and investigations: non-destructive testing including electrical resistivity tomography and tracer leakage test, and field investigation including geological drilling, reservoir water level observation, reservoir catchment area investigation, visual inspection of the dam and pumping test. Then, in this study, the results of the above tests and investigations were analyzed and compared with the basic data of the base, including rainfall, underground water and geology, to attempt to put forward the problem of its poor impoundment and make suggestions on its future improvement direction.
2. Literature Review
2.1. Reservoir Leakage Mechanism
Leakage is the most serious problem after reservoir impoundment and occurs as long as leaking pipes run through the bank or the bottom of the reservoir. There are some cases at home and abroad in which serious leakage influences reservoir impoundment efficiency and even causes them to completely lose their functions [1,2]. Reservoir leakage is mainly caused by topographic and geological factors. There are three topographic factors: leakage through a watershed into the adjacent valley, through a bend into the downstream valley and through the bank and bottom of a reservoir into the low-lying discharge area. There are four geological factors: rock and soil layers with good water permeability, fractured or fissured permeable zones, caves and paleochannel [3]. Other causes of leakage are karst phenomena, poor reservoir operation and old reservoir materials.
2.2. Methods of Investigation and Test for Reservoir Leakage
For reservoirs in use, their dams may have borne more weight than what they were originally designed to carry, thus causing local internal damages. In addition, both material aging and violent earthquakes damage dams and foundations. In order to understand the leakage in a dam, the traditional visual inspection cannot provide information about internal damages, and monitoring instruments such as hydraulic pressure gauges can only provide information about single points, neither of which can provide enough information for judgment. Moreover, destructive testing methods and internal monitoring instruments should be avoided for dams as much as possible; therefore, there is little information from inside dams. Hence, the non-destructive geophysical exploration technology and chemical leakage tracing tests are used in this study for dam leakage investigation.
In recent years, the geophysical exploration technologies have been widely used for reservoir dam investigation and monitoring. For the topic of potential reservoir dam leakage, the non-destructive large-scale assessment by the geophysical exploration technologies can make up for the shortage of monitoring points and provide information on dam wetness [4,5]. Mature geophysical exploration technologies that can be applied in leakage investigation are electrical resistivity tomography method [6,7,8], self-potential method [9,10], electromagnetic exploration method [11], elastic wave tomography method [12,13] and seismic surface-wave method [14,15]. These methods are mainly used for non-destructive testing of dam surfaces and measurement in bores. Hence, this study attempted to explore the possibility of internal leakage in dams by the electrical resistivity tomography method (ERT).
Vorokov et al. [7] proposed the application of geophysical exploration in dam investigation and tested abnormal sinking of dam riprap layers, local leakage of dams, engineering properties of dam materials, density and void ratios of dam materials by vibration test and earth resistance method. Song et al. [6] conducted a leakage investigation at Sandong embankment dam in South Korea, by methods such as electrical resistivity tomography, self-potential method and tracer test, which measured reservoir water level dropping and water level change in holes and monitoring of temperature in holes to preliminarily speculate the area that might leak. Oh et al. [15] applied the multi-channel seismic surface-wave method and electrical resistivity tomography method to dam investigation in South Korea, which the earth resistance profile was overlaid with shear wave velocity for integrated interpretation. The dam material composition and the existence of cracks could be understood from the results. Abdel Aal et al. [16] investigated the leakage of an earth dam in Washington State in the United States, which configured seven testing lines and concluded that the leakage path was from the low-resistance area. Lin et al. [17] configured two ERT testing lines on the top of the leaking embankment dam and the downstream shell of Xinshan Reservoir in Taiwan and concluded that the low-resistance area was the suspected abnormal leakage area.
Tracer test is a chemical technology to investigate reservoir leakage. In recent years, tracer test has often been used for hydrogeological investigation, to study the direction and velocity of groundwater flow [18,19,20]. By tracer test, leakage can be detected accurately, quickly and timely, which is of great significance in underground leakage monitoring [21].
2.3. Background of Qionglin Reservoir
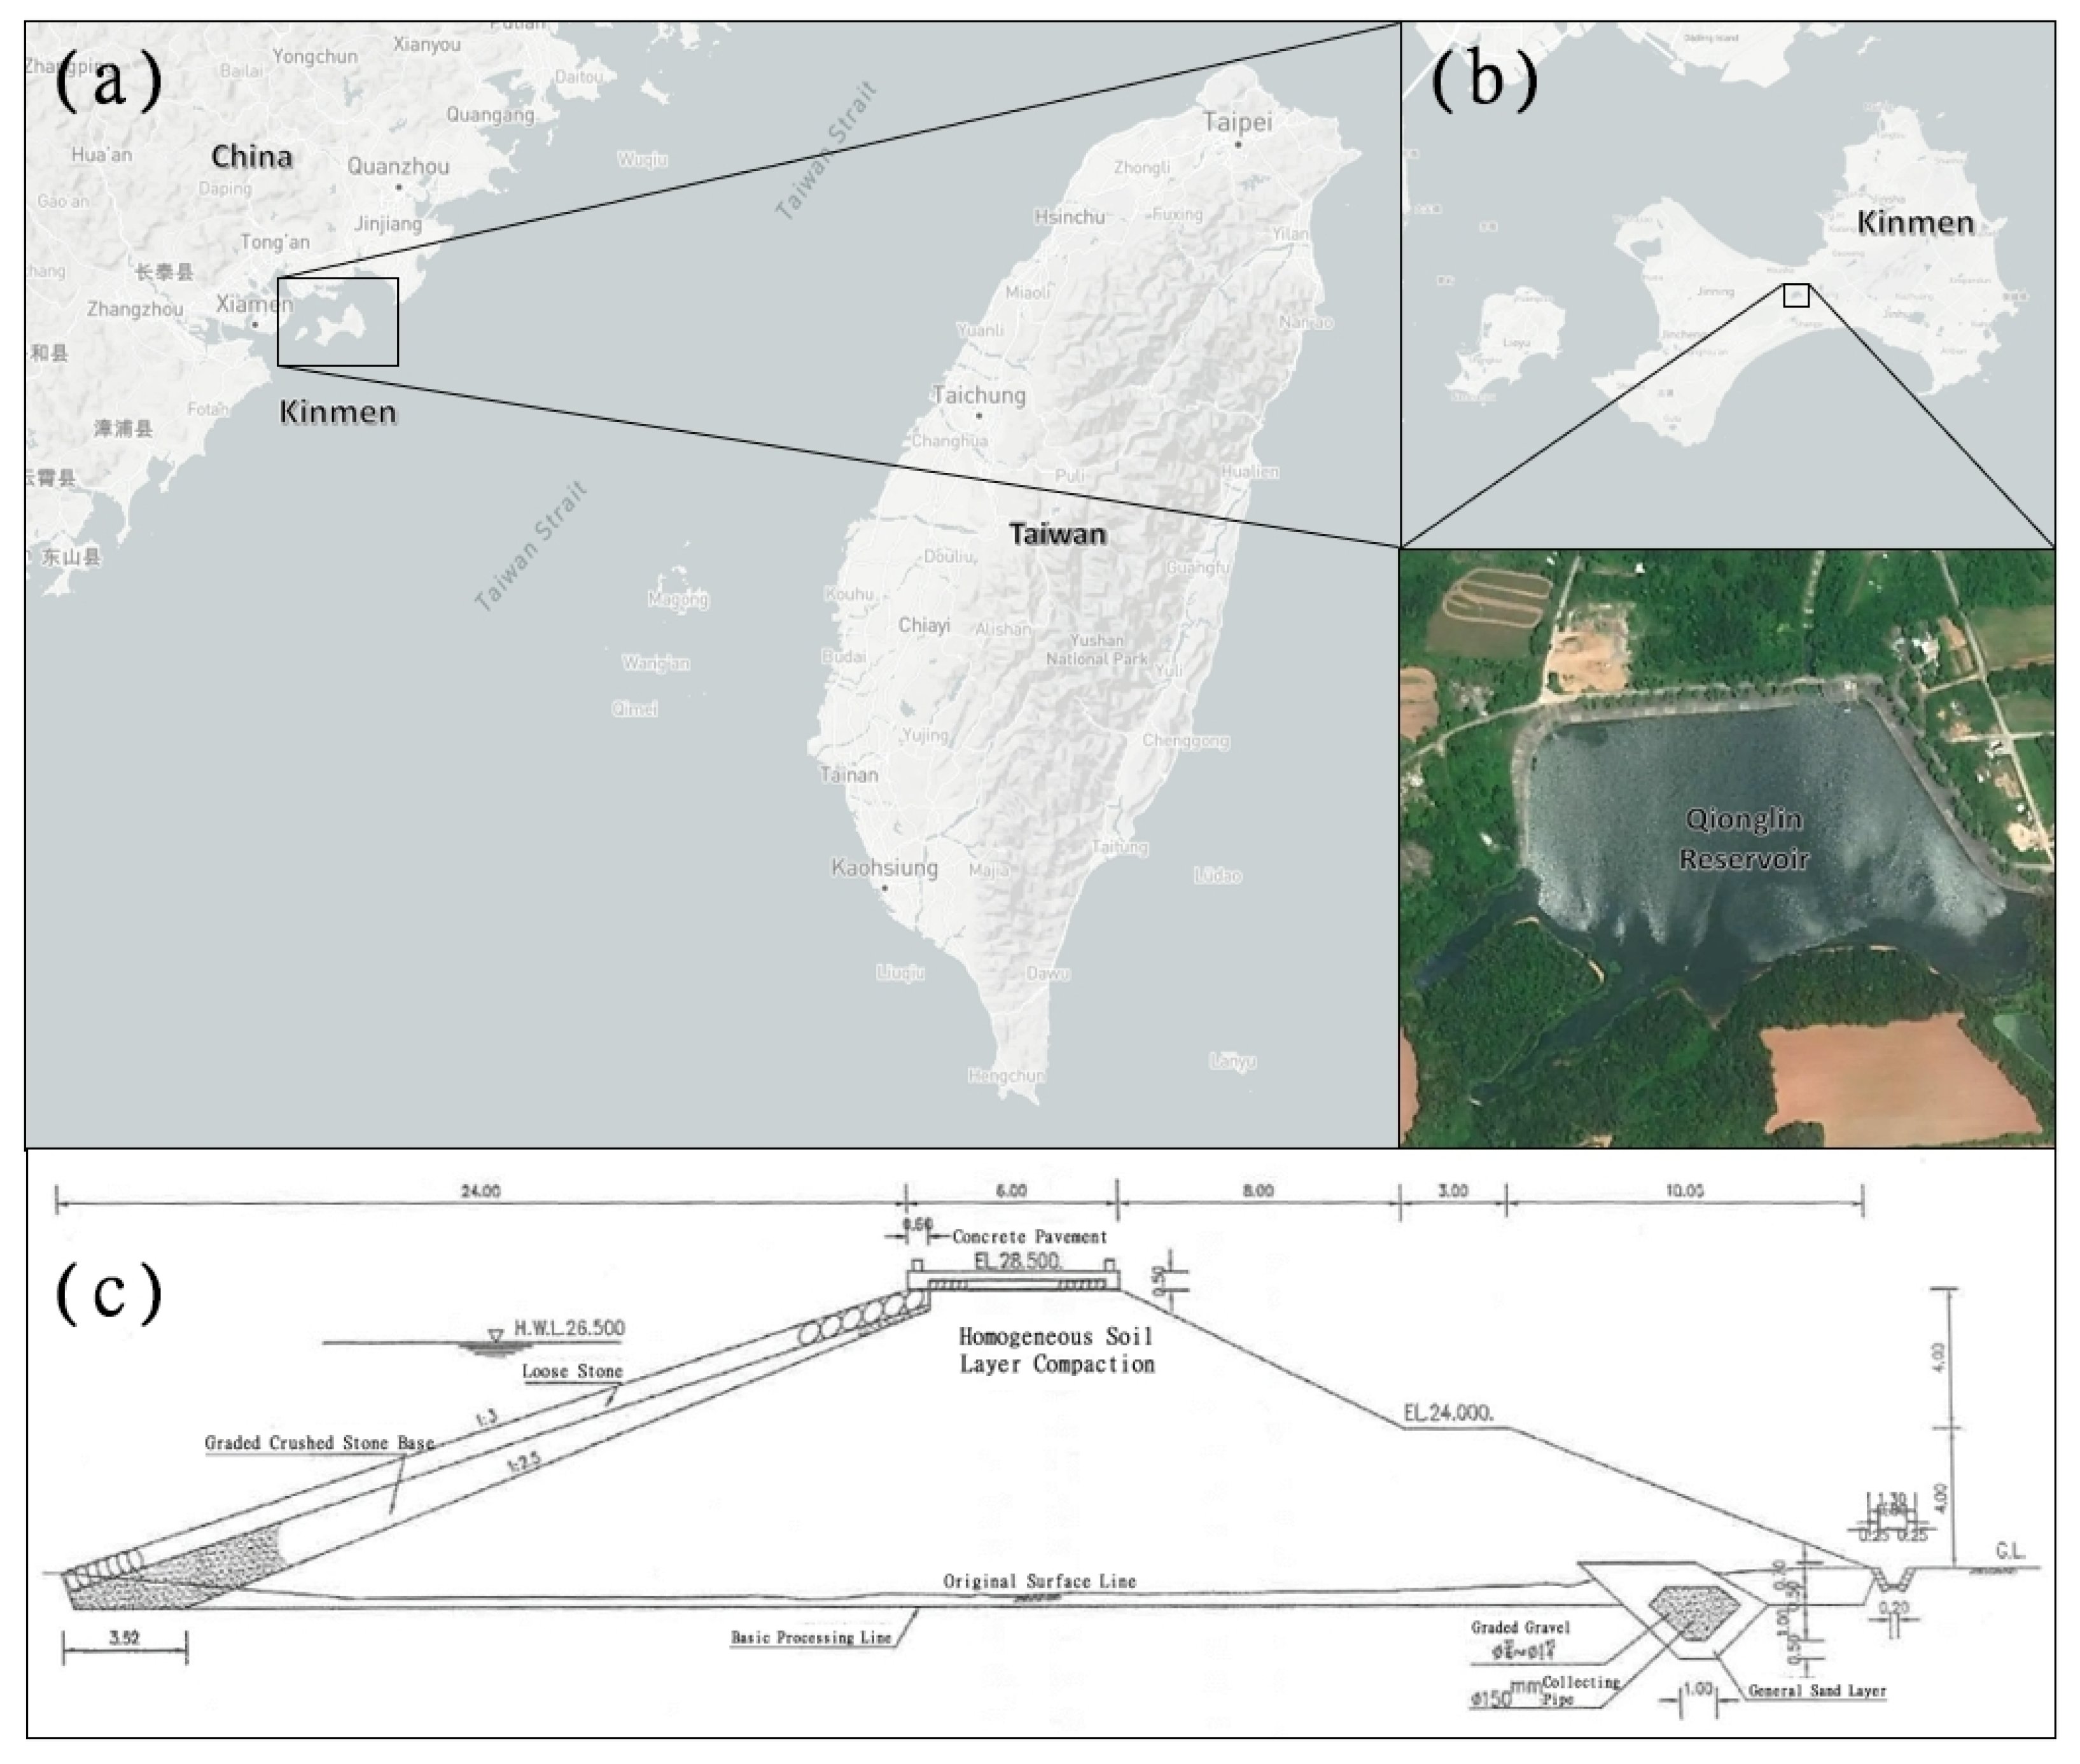
Qionglin Reservoir is located in the central area of the main island of Kinmen, with a catchment area of 153 hectares, an impounded area of 9.9 hectares, a dam height of 9.7 M, a dam crest elevation of 28.5 m, a full water level elevation of 26.5 m and an impoundment capacity of 309,000 m3. It is a rolled homogeneous earth dam, and the standard section of the dam is shown in Figure 1. Since its completion in 1982, Qionglin Reservoir has always been empty due to its poor impoundment. The reservoir management unit considered that it might leak and made many improvements. Three reservoir safety assessments were carried out in 1998, 2001 and 2005, respectively, to try to find out the causes of leakage or impoundment failure. Leakage prevention and improvement works were conducted in 1998, including laying impermeable cloth at its bottom and reinforced concrete on its slope. Upstream water interception and diversion works were added in 2001. However, its impoundment is still poor, and it cannot impound efficiently. Now, the reservoir is temporarily out of service.
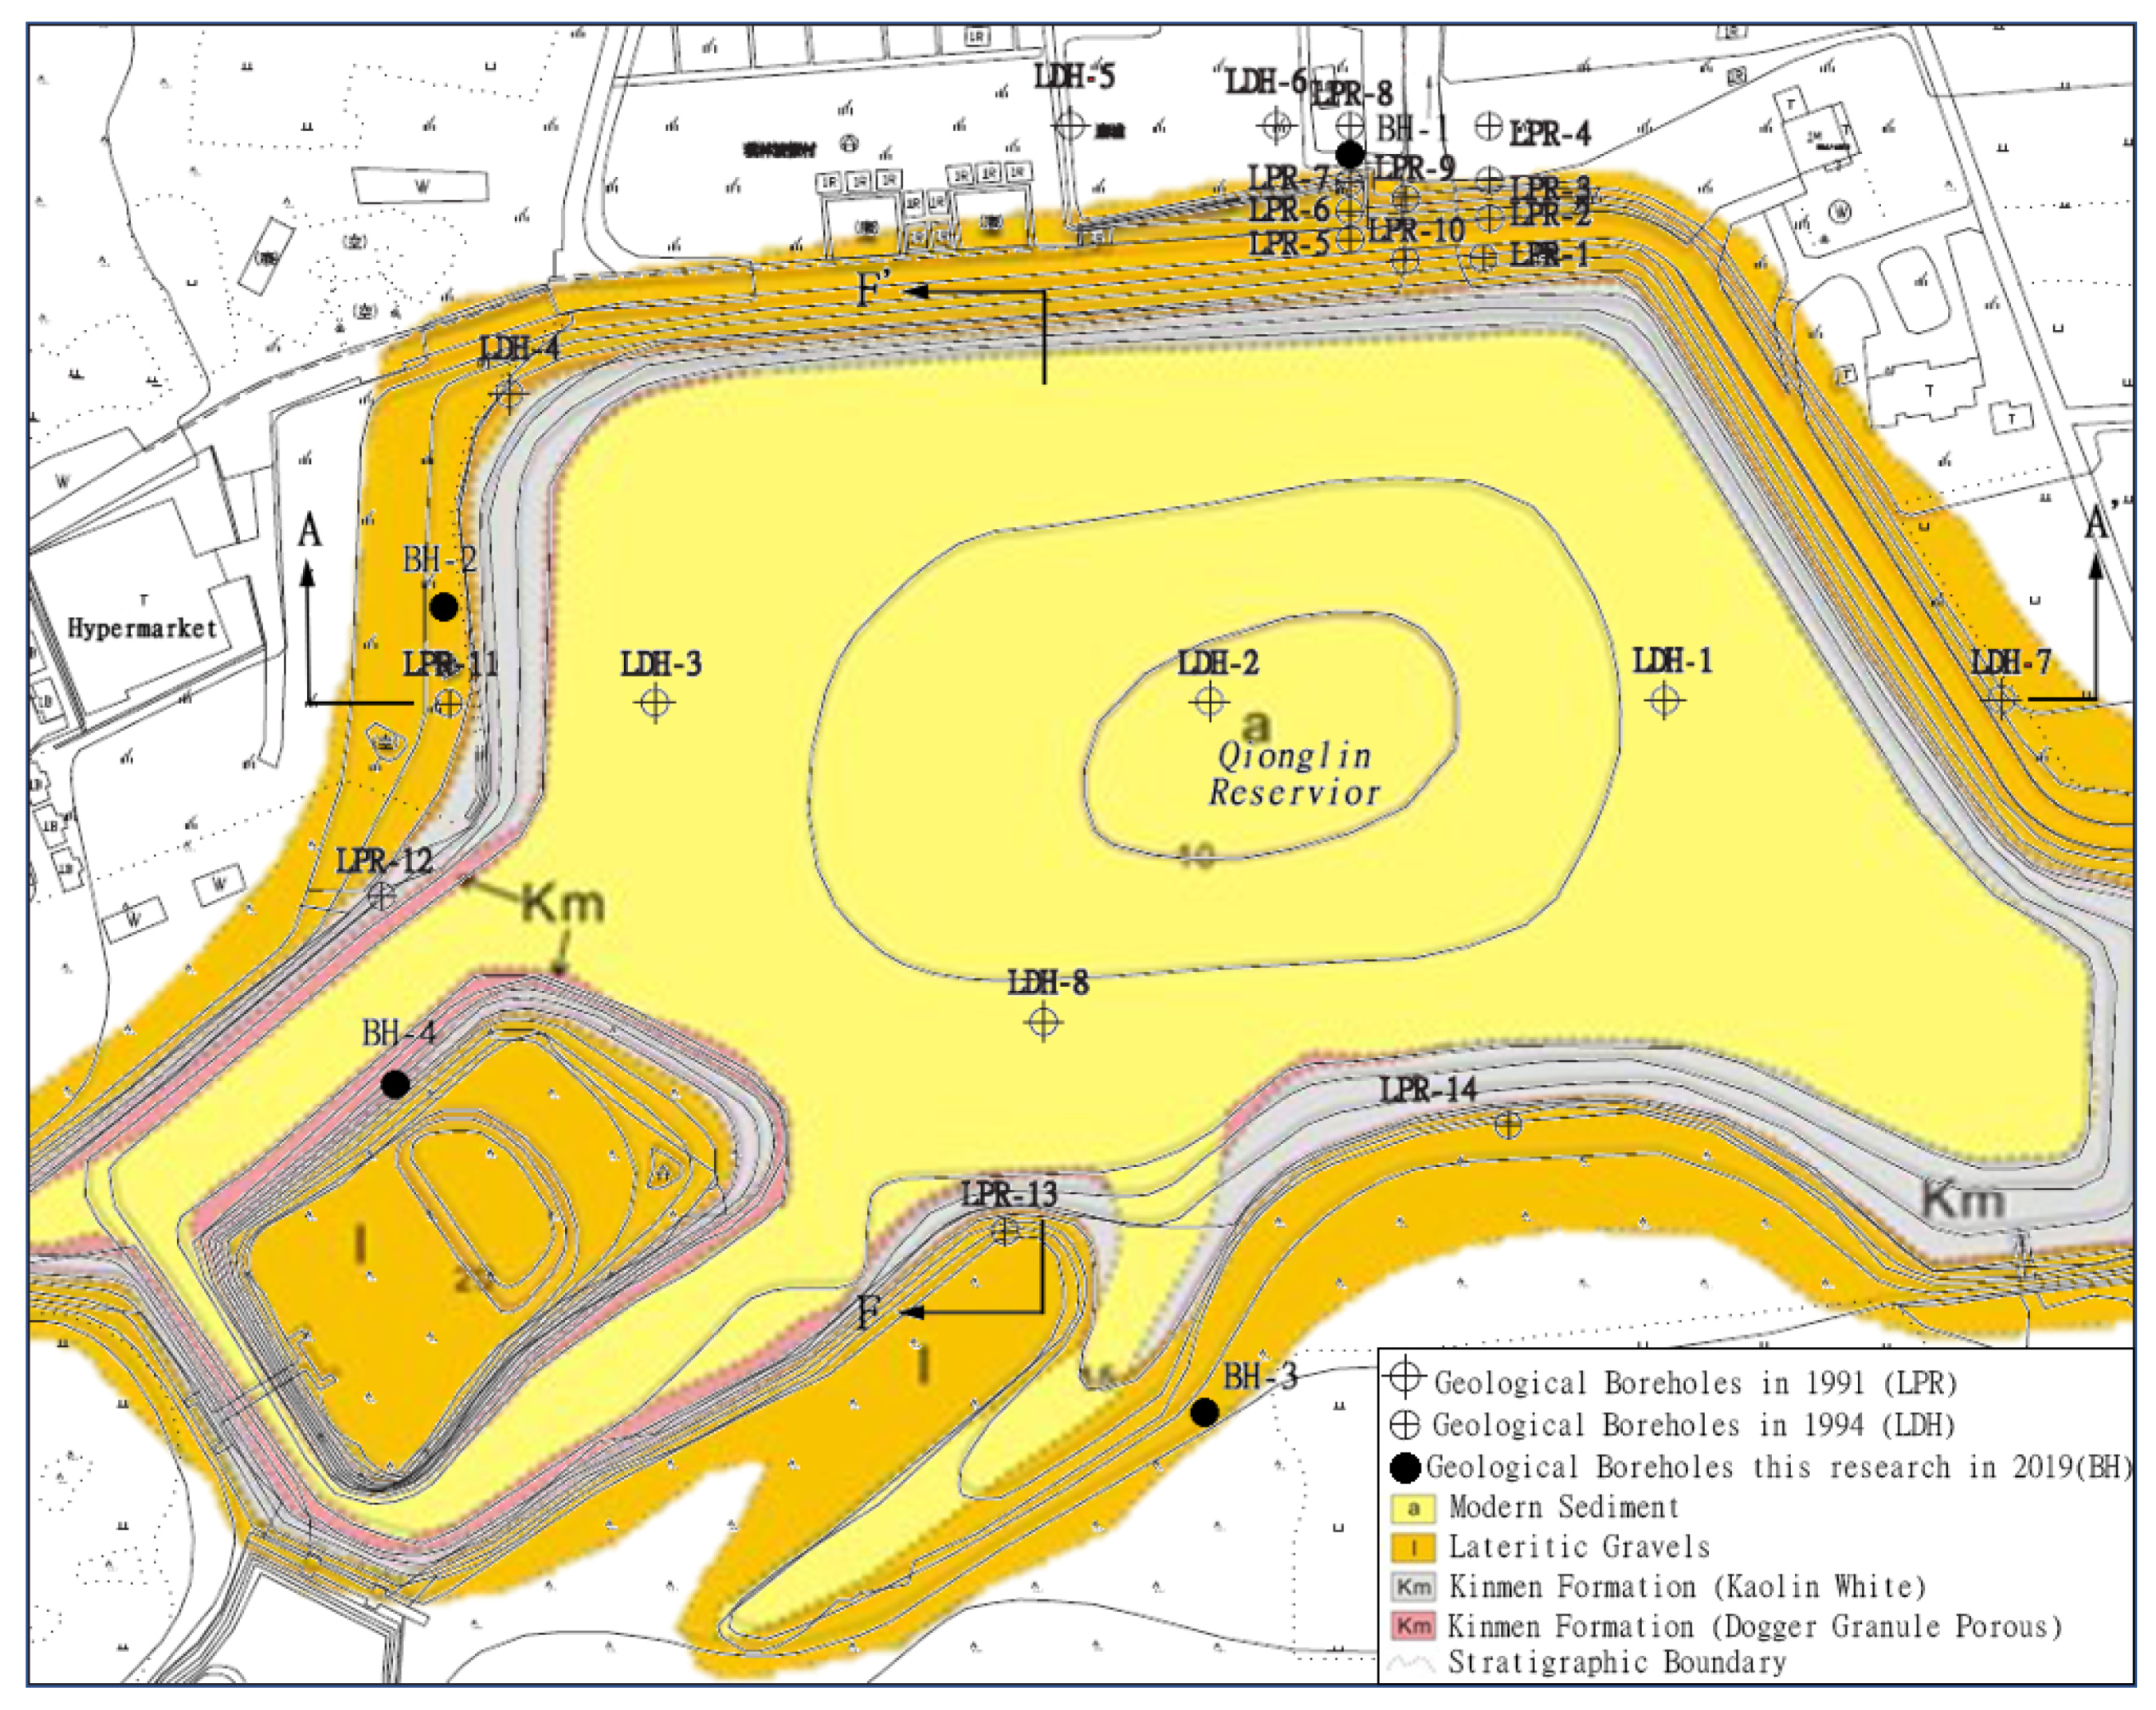
The geology of Qionglin Reservoir can be referred to the 1:50,000 geological map of Kinmen area [22], outcrop mainly consist of modern sediment, red clay-gravel bed and Kinmen bed. The modern sediment is mainly composed of sand, mud and peat. The red clay-gravel bed is mainly composed of red clay and gravel, which are paleochannel deposits, and the gravel is round or oval with a diameter mostly smaller than 10 cm. The Kinmen bed is a sedimentary layer accumulated in ancient channels and is mainly fine sandstone containing gravel and clay. The bed is nearly horizontal and consists of two layers. The upper layer is mainly sandstone containing gravel and clay with a thickness of about 30 m, and the lower layer is mainly fine sandstone containing clay with a thickness of about 42 m. Figure 2 shows the geological map of Qionglin Reservoir.
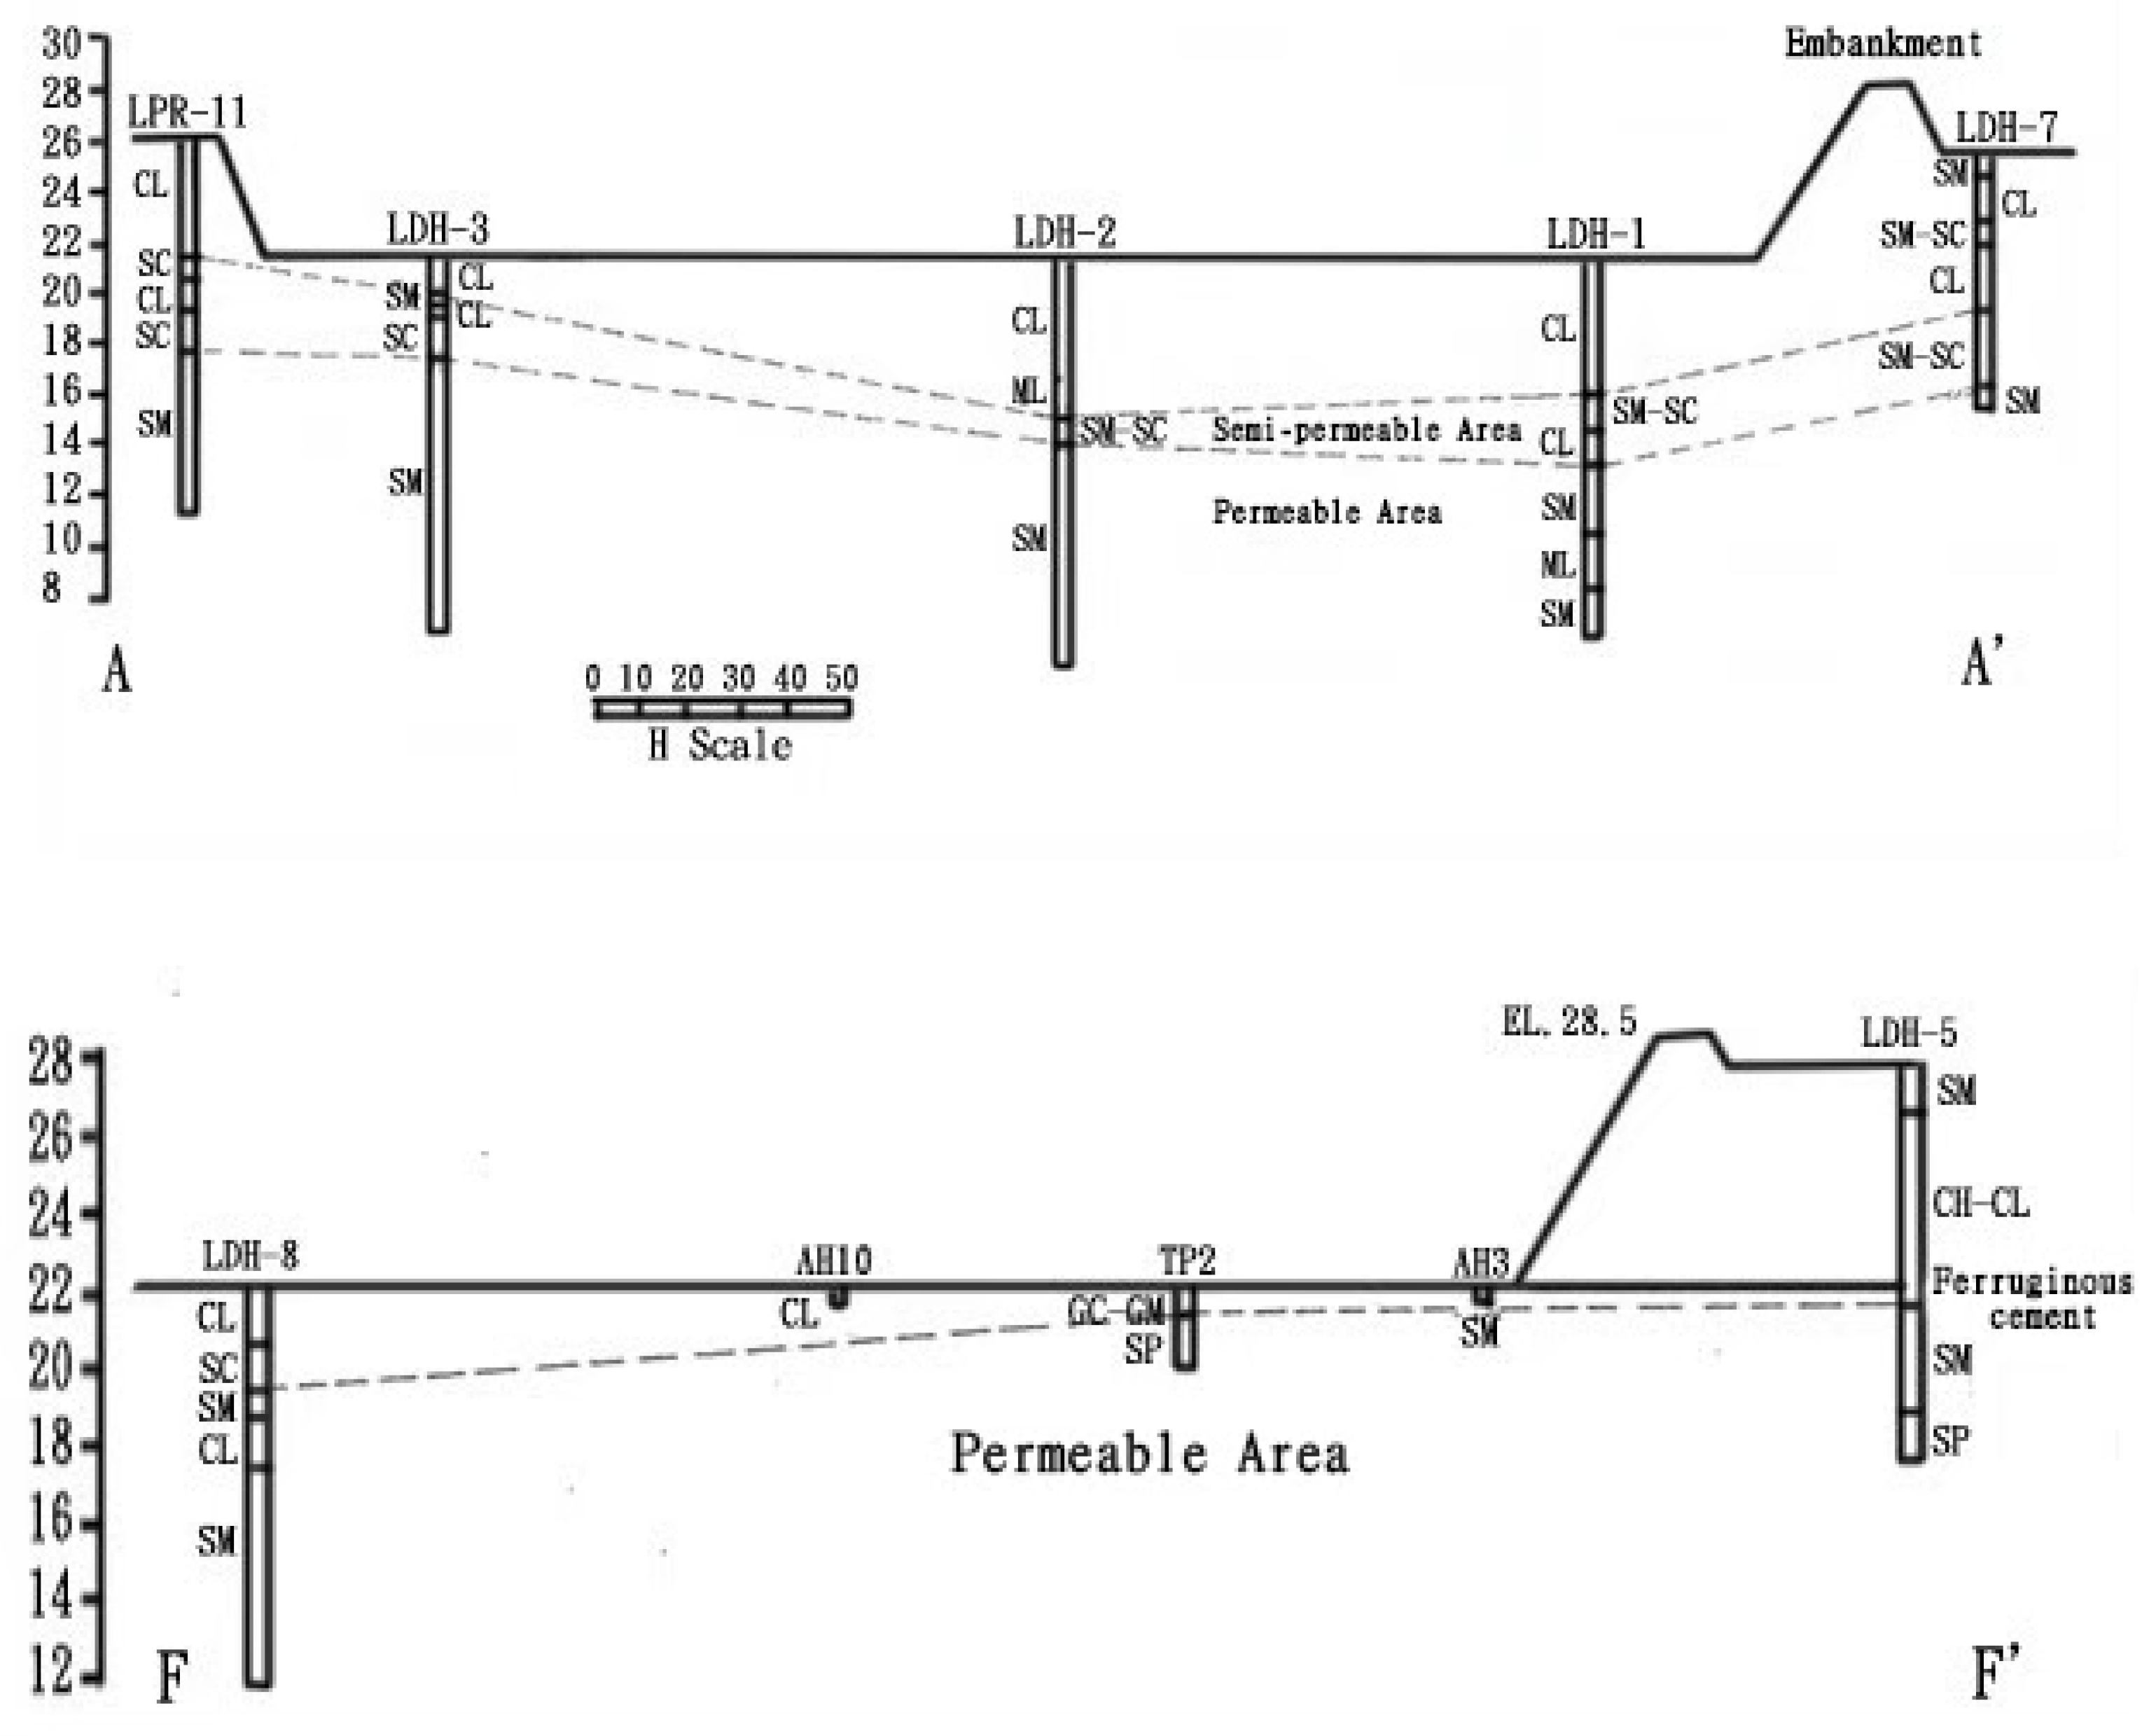
In order to investigate the causes of reservoir leakage, the reservoir management unit in the dam, bottom and surrounding area of the reservoir, drilled 14 holes in 1992 and 8 holes in 1995. The drilling locations over the years are shown in Figure 2. Figure 3 is the geologic cross-section of the dam site drawn after drilling data collection. As shown in Figure 3, the geology of the dam site is mainly red sandy clay (CL), grayish-yellow clayey coarse sand (SC), red and grayish-yellow argillaceous coarse sand (SM) and yellow argillaceous coarse sand (SM SC). According to the investigation results, the SM materials at the bottom, soil slope and in the front of the dam to the northwest of the inundated area were permeable, and the inundated area could easily leak water. Field tests were carried out to understand the soil density of the dam and the bottom of the reservoir, and the results showed that the Relative Compaction (RC) of the dam was about 93% and the Relative Compaction (RC) of the bottom of reservoir was about 89–92%, indicating that the density of the soil layer at the bottom of reservoir was quite consistent. In order to obtain the permeability of the shallow soil in the whole region, the reservoir management unit conducted a 17 hole field permeability test at the bottom of the reservoir, and the results showed that the permeability coefficient of the reservoir area was between 10−5 cm/s and 10−6 cm/s on average. According to the test results, the permeability coefficient of the bottom of the reservoir was low.
3. Research Method
3.1. Electrical Resistivity Tomography (ERT)
In the electrical resistivity tomography method, 2 current electrodes (C1, C2) were mainly used to apply current into the strata at a low-frequency alternating current and 2 potential electrodes (P1, P2) were used to measure potential difference. According to measured injected current, the potential difference between two electrodes and the geometry of electrodes, the apparent resistivity, which is equivalent to the resistivity of the semi-infinite homogeneous media, can be calculated by the electrostatic theory. The spatial influence range depends on the space between electrodes. The greater the spacing between electrodes is, the greater the influence will be. By inverse analysis, the actual resistivity distribution of the strata can be estimated, so as to understand the stratum structure. The earth resistivity is highly related to water content; therefore, the electrical resistivity tomography can be used to help to investigate the leakage of reservoir dam.
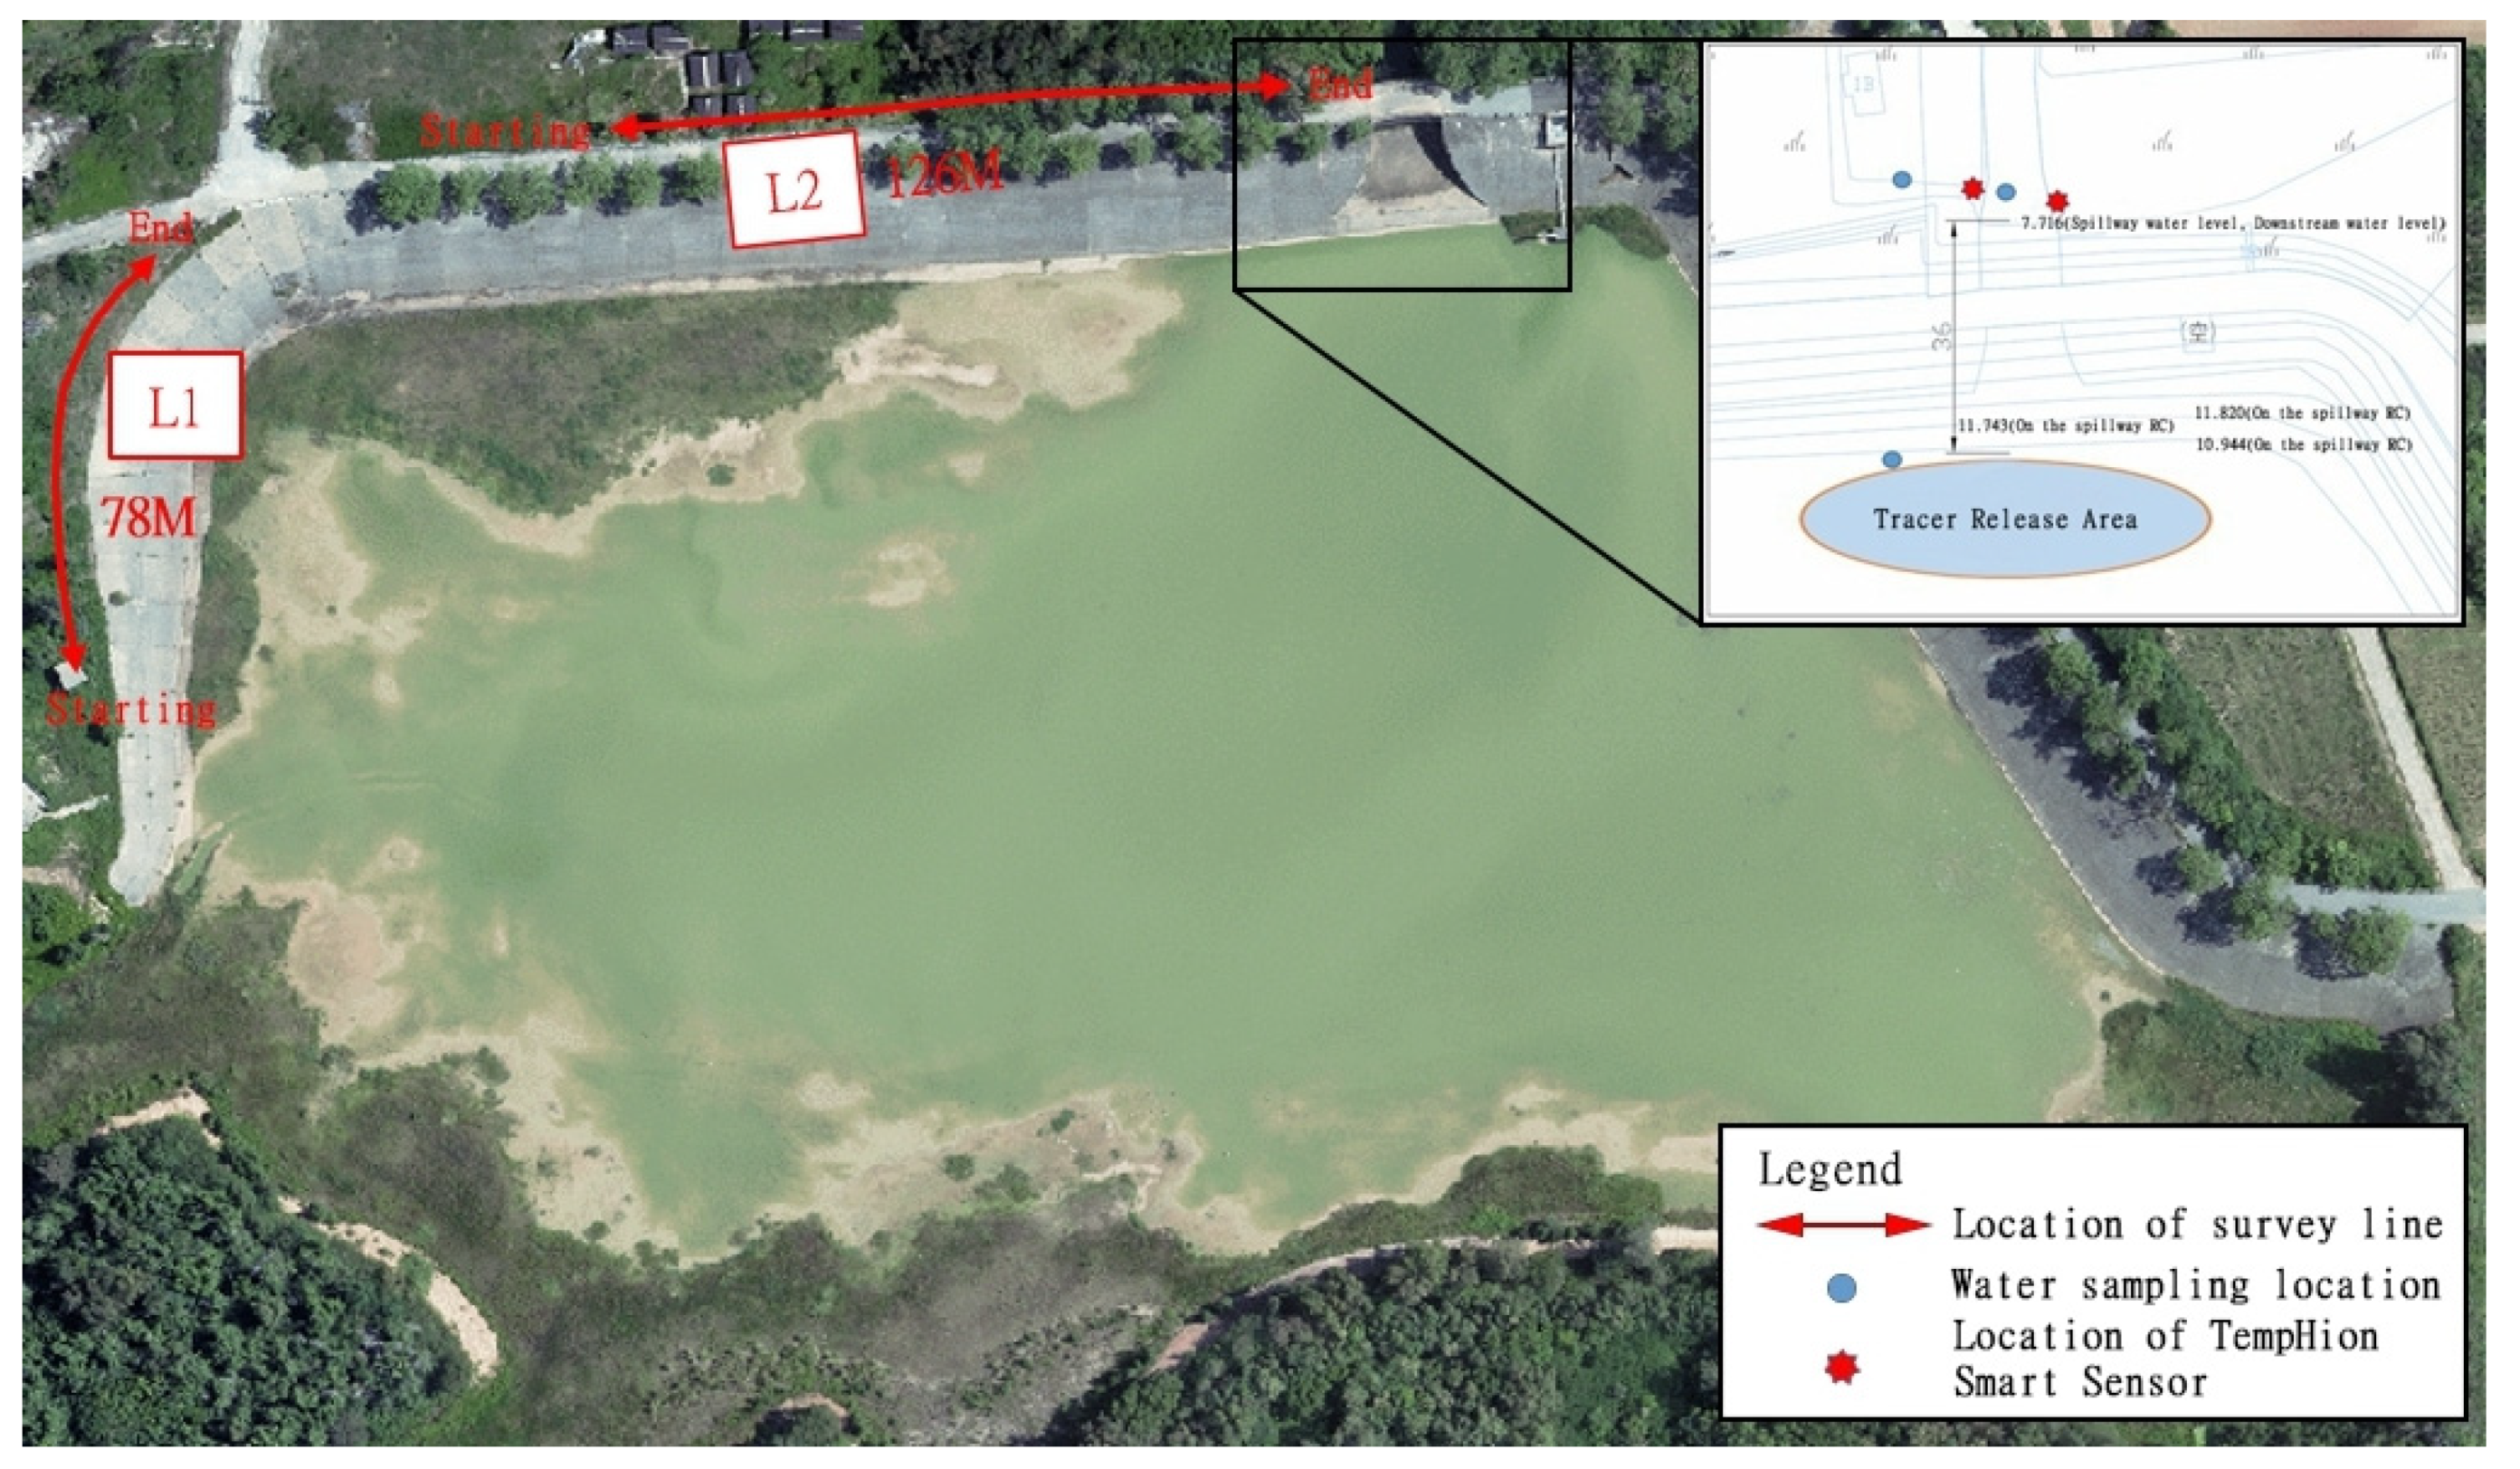
In this study, 2 testing lines were laid out around Qionglin Reservoir, as shown in Figure 4. Of the 2 testing lines, L1 was on the west side of the dam, with a length of 78 m and the electrode spacing of 3 m, and L2 was on the north side of the dam, with a length of 126 m and the electrode spacing of 3 m. The Wenner–Shlumberger array was adopted in field measurement for data collection.
SYSCAL PRO Switch 48, an earth resistance meter produced by IRIS of France, was used in this study. In order to ensure measurement quality, all data were repeatedly measured to ensure that the difference between values of all data obtained from repeated measurement was less than 3%. In addition, the current values of the obtained data were controlled to ensure to obtain the data with high signal-to-noise ratio.
3.2. Tracer
Bromide is considered as one of the best hydrological tracers, because it is conservative in most environments. Br- in the environment is usually in the ocean in the form of halides. Hence, there is no need to worry that using sodium bromide as a tracer causes environmental pollution and does harm to human health, and sodium bromide is easy to measure and has low costs [23,24]. Moreover, according to Flury and Papritz (1993) [25], bromide ions did not react easily with substrates, because the negative ions are repelled by most of the negatively charged substrates and concentrated in the center of the water. Therefore, in most experiments with bromide ions as tracers, the influence of the chemical reaction and absorption between solutes and substrates on transmission mechanisms is assumed to be minimal or even ignored.
In this study, sodium bromide was mainly used as the tracer, and placed near the spillway above the stilling basin of the reservoir in the form of a solution. Then, the sensor was placed on the left bank (the stilling basin outside the reservoir) and the right bank (inside the reservoir area) of the stilling basin to detect the changes of sodium bromide ion concentration. In addition, water samples were respectively collected in the reservoir and stilling basin for the ion chromatography (IC) to analyze the common ions, so as to confirm the test results again. Figure 4 shows the tracer application area and sampling points and the points of sensors.
The tracer receiver used in this program was TempHion Smart Sensor produced by INW. The operating principle of the instrument is that the induction electrode at the front of the instrument is immersed in a cap containing the reference solution of standard electrode, and the water to be tested enters the cap due to capillarity; then, the induction electrode can calculate the ionic concentration of the solution to be tested based on the ionic concentration difference between the solution to be tested and the reference solution of standard electrode. It can test the bromide ion concentration ranging from 0 to 10,000 ppm, with an accuracy of 2% of the tested value. In order to ensure that data can be recorded as soon as bromide ions enter the receiving well, the instrument was placed at an appropriate place below the water level and automatically records data every 10 min.
3.3. Supplementary Drilling Test
In order to investigate the causes of reservoir leakage, in the dam, bottom and surrounding area of the reservoir, the reservoir management unit drilled 14 holes in 1992 and 8 holes in 1995. During the execution of this study, Qionglin Reservoir was kept at a low water level, making it impossible to carry out geological drilling at the bottom and surface excavation. Hence, in this study, a total of 4 places at the lower reaches of the dam, the northwest around the reservoir and the upper reaches were selected for drilling, and the data of the 4 holes were analyzed and compared with the drilling data in literature. The detailed locations are shown in Figure 2.
The field drilling was adopted for the base investigation, and a total of 4 holes numbered BH-1 to BH-4 were drilled, with a total drilling depth of 60 m, as shown in Figure 2 drilling locations of Qionglin Reservoir over the years. The field standard penetration test was carried out to all holes to calculate the blow counts (SPT-N value) penetrating into the strata, and the field permeability test was conducted. Split spoons and thin wall tubes were provided for laboratory test.
3.4. Long-Term Reservoir Water Level Observation
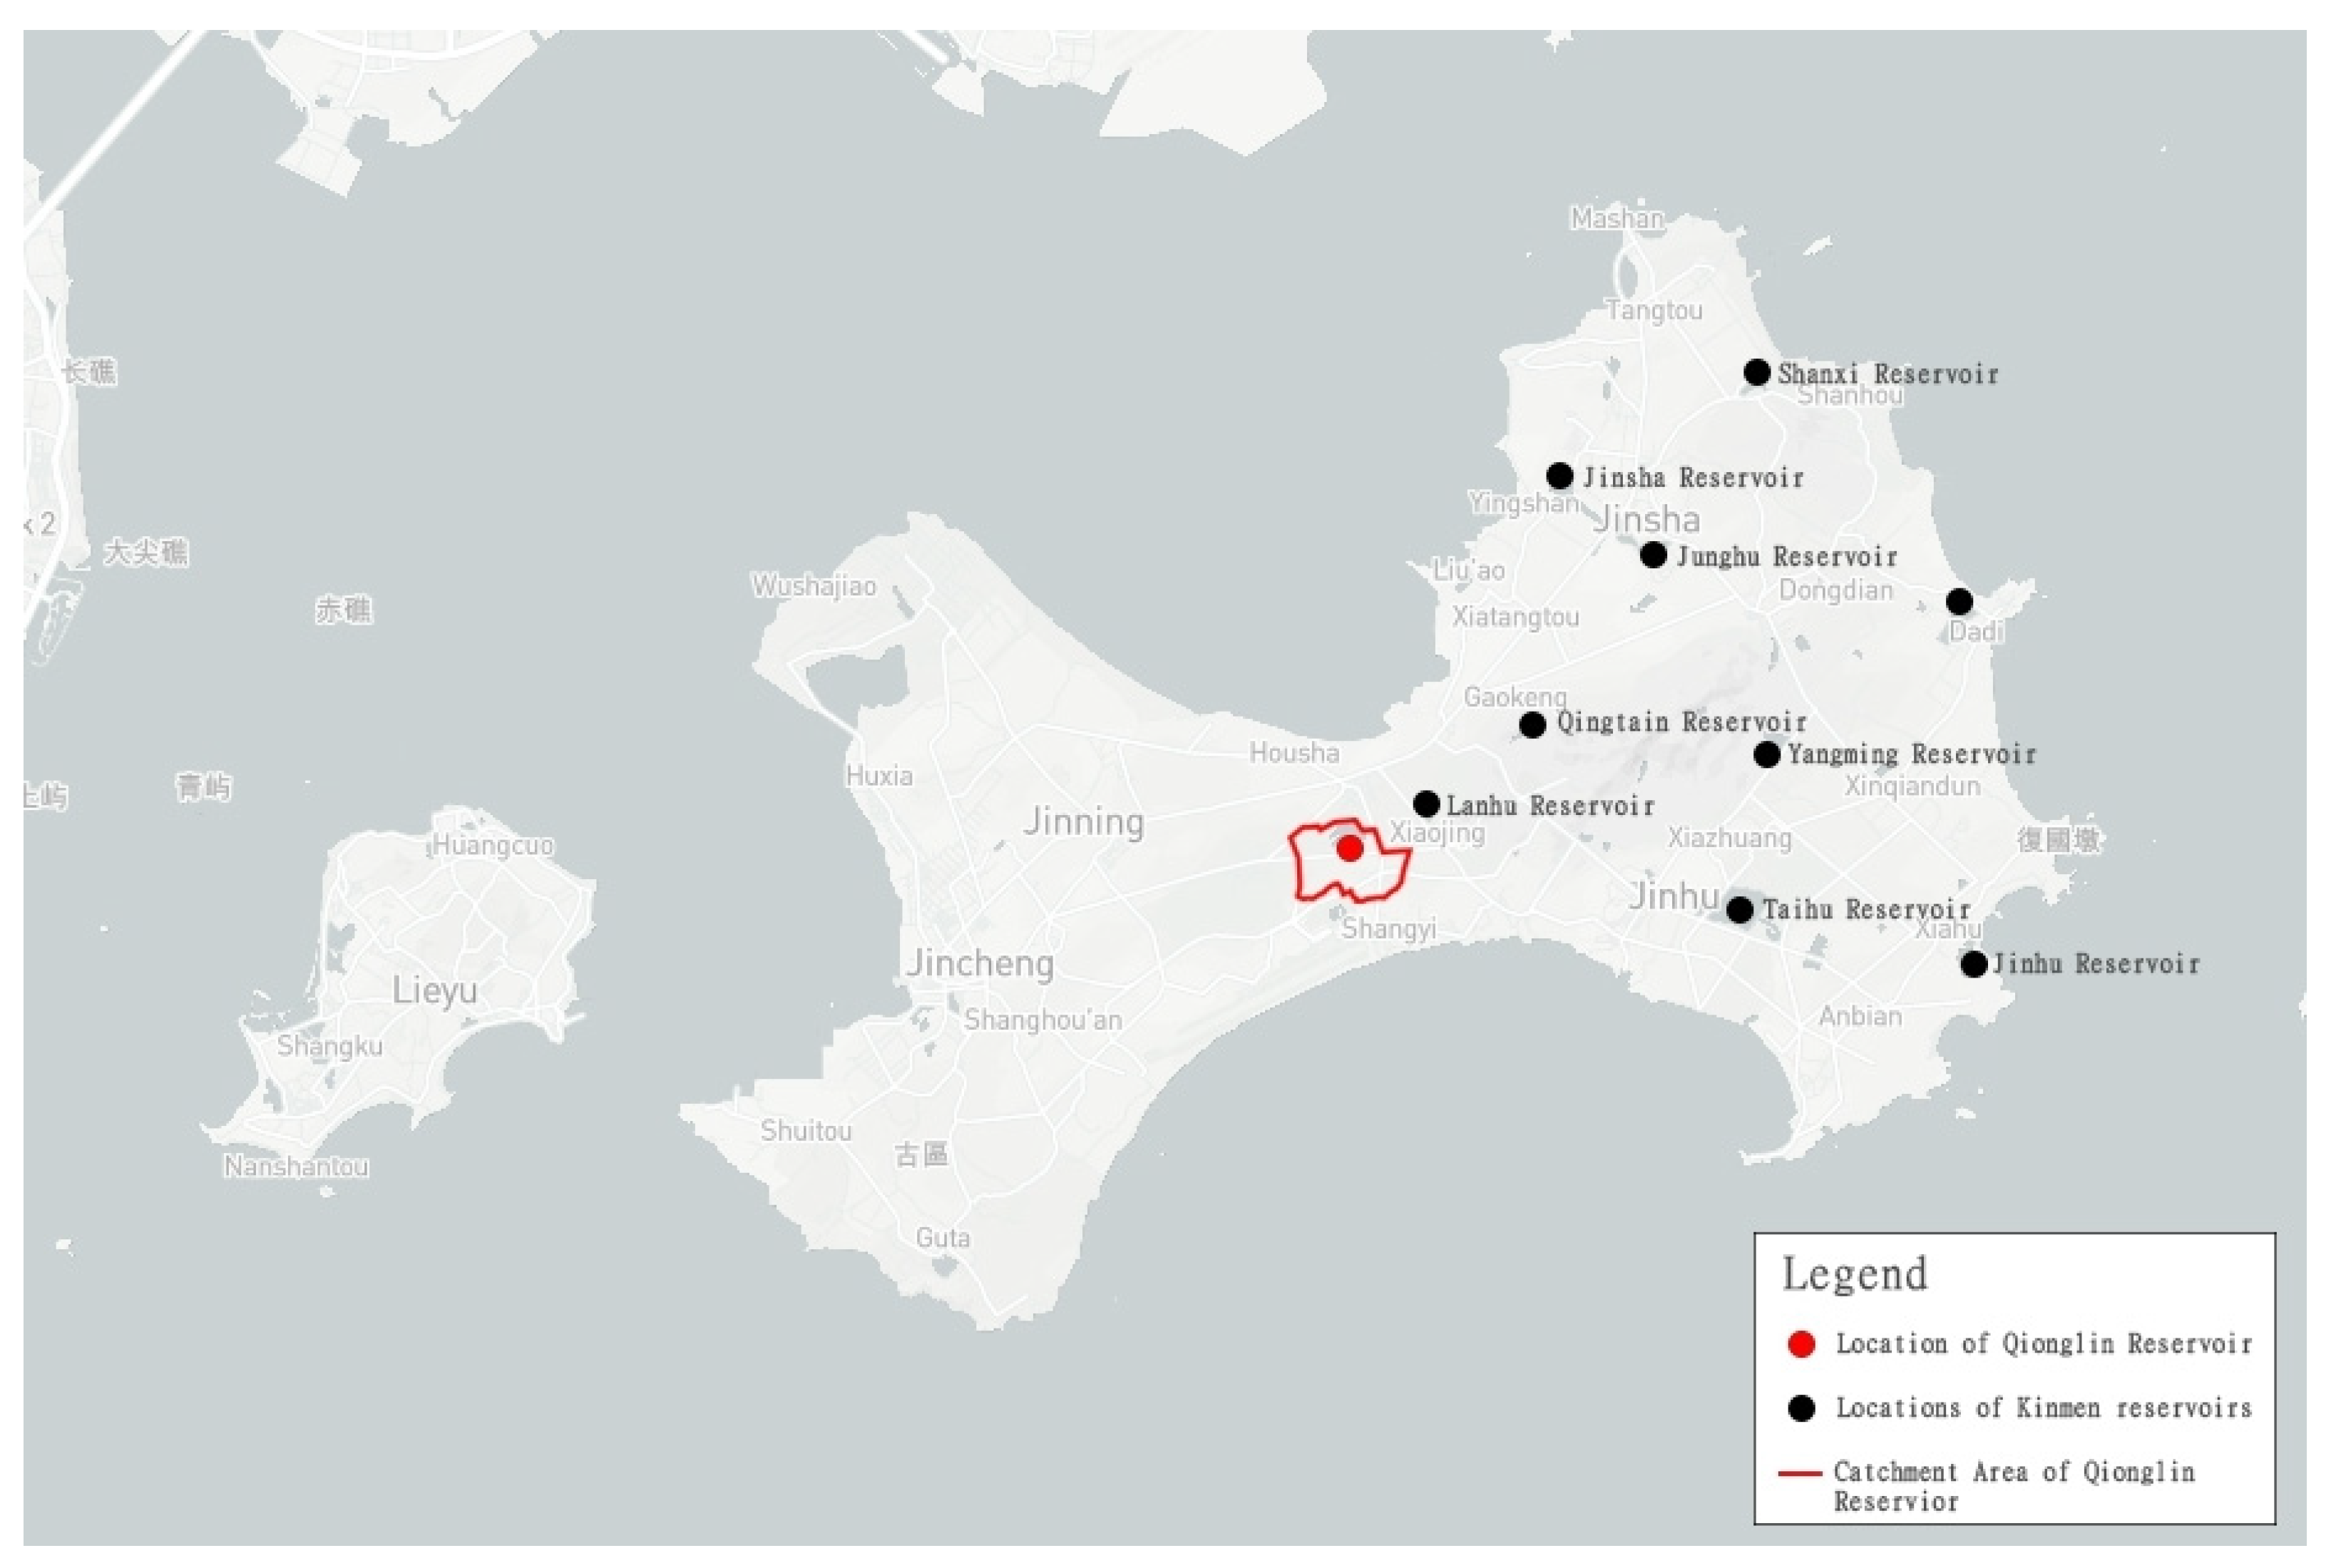
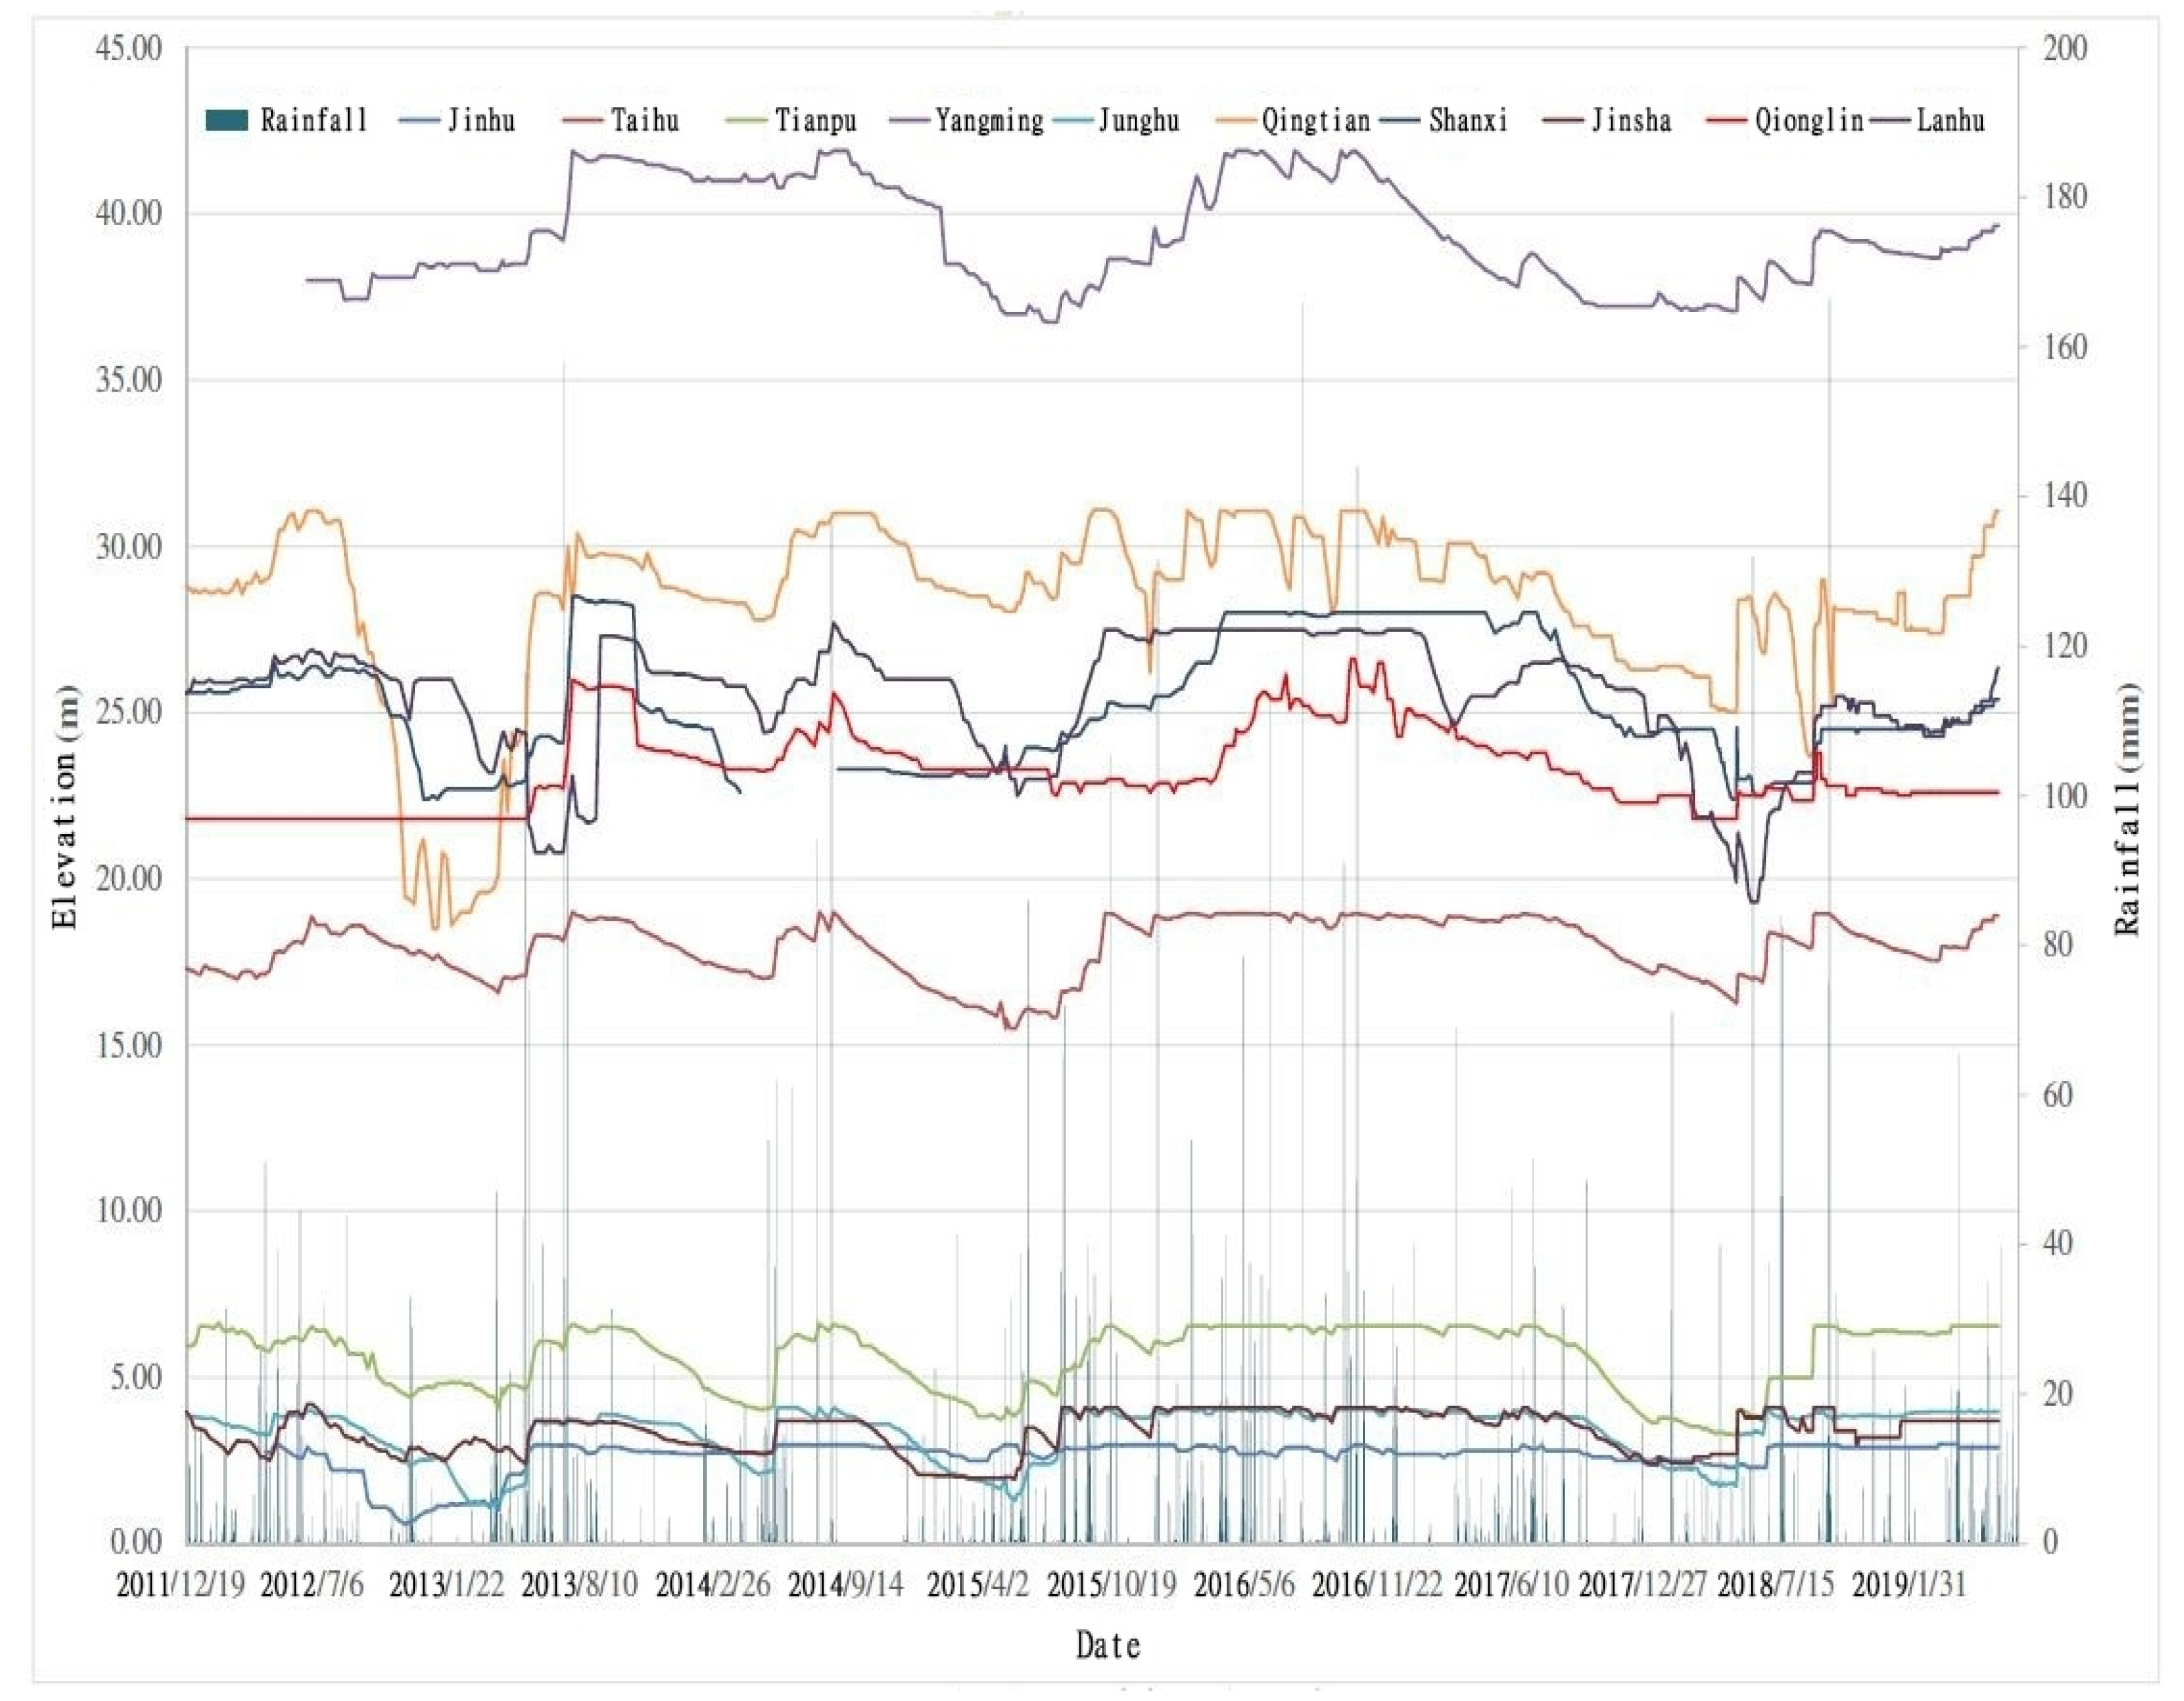
The most intuitive way to investigate reservoir leakage is to observe the water levels of Qionglin Reservoir over the years and to compare it with the change of water levels of other reservoirs in Kinmen Island. There are a total of 10 reservoirs in Kinmen Island, as shown in Figure 5. The water levels, rainfall and evaporation of 10 reservoirs in Kinmen Island from 19 December 2011 to 4 June 2019 were collected in this study for comparison and analysis.
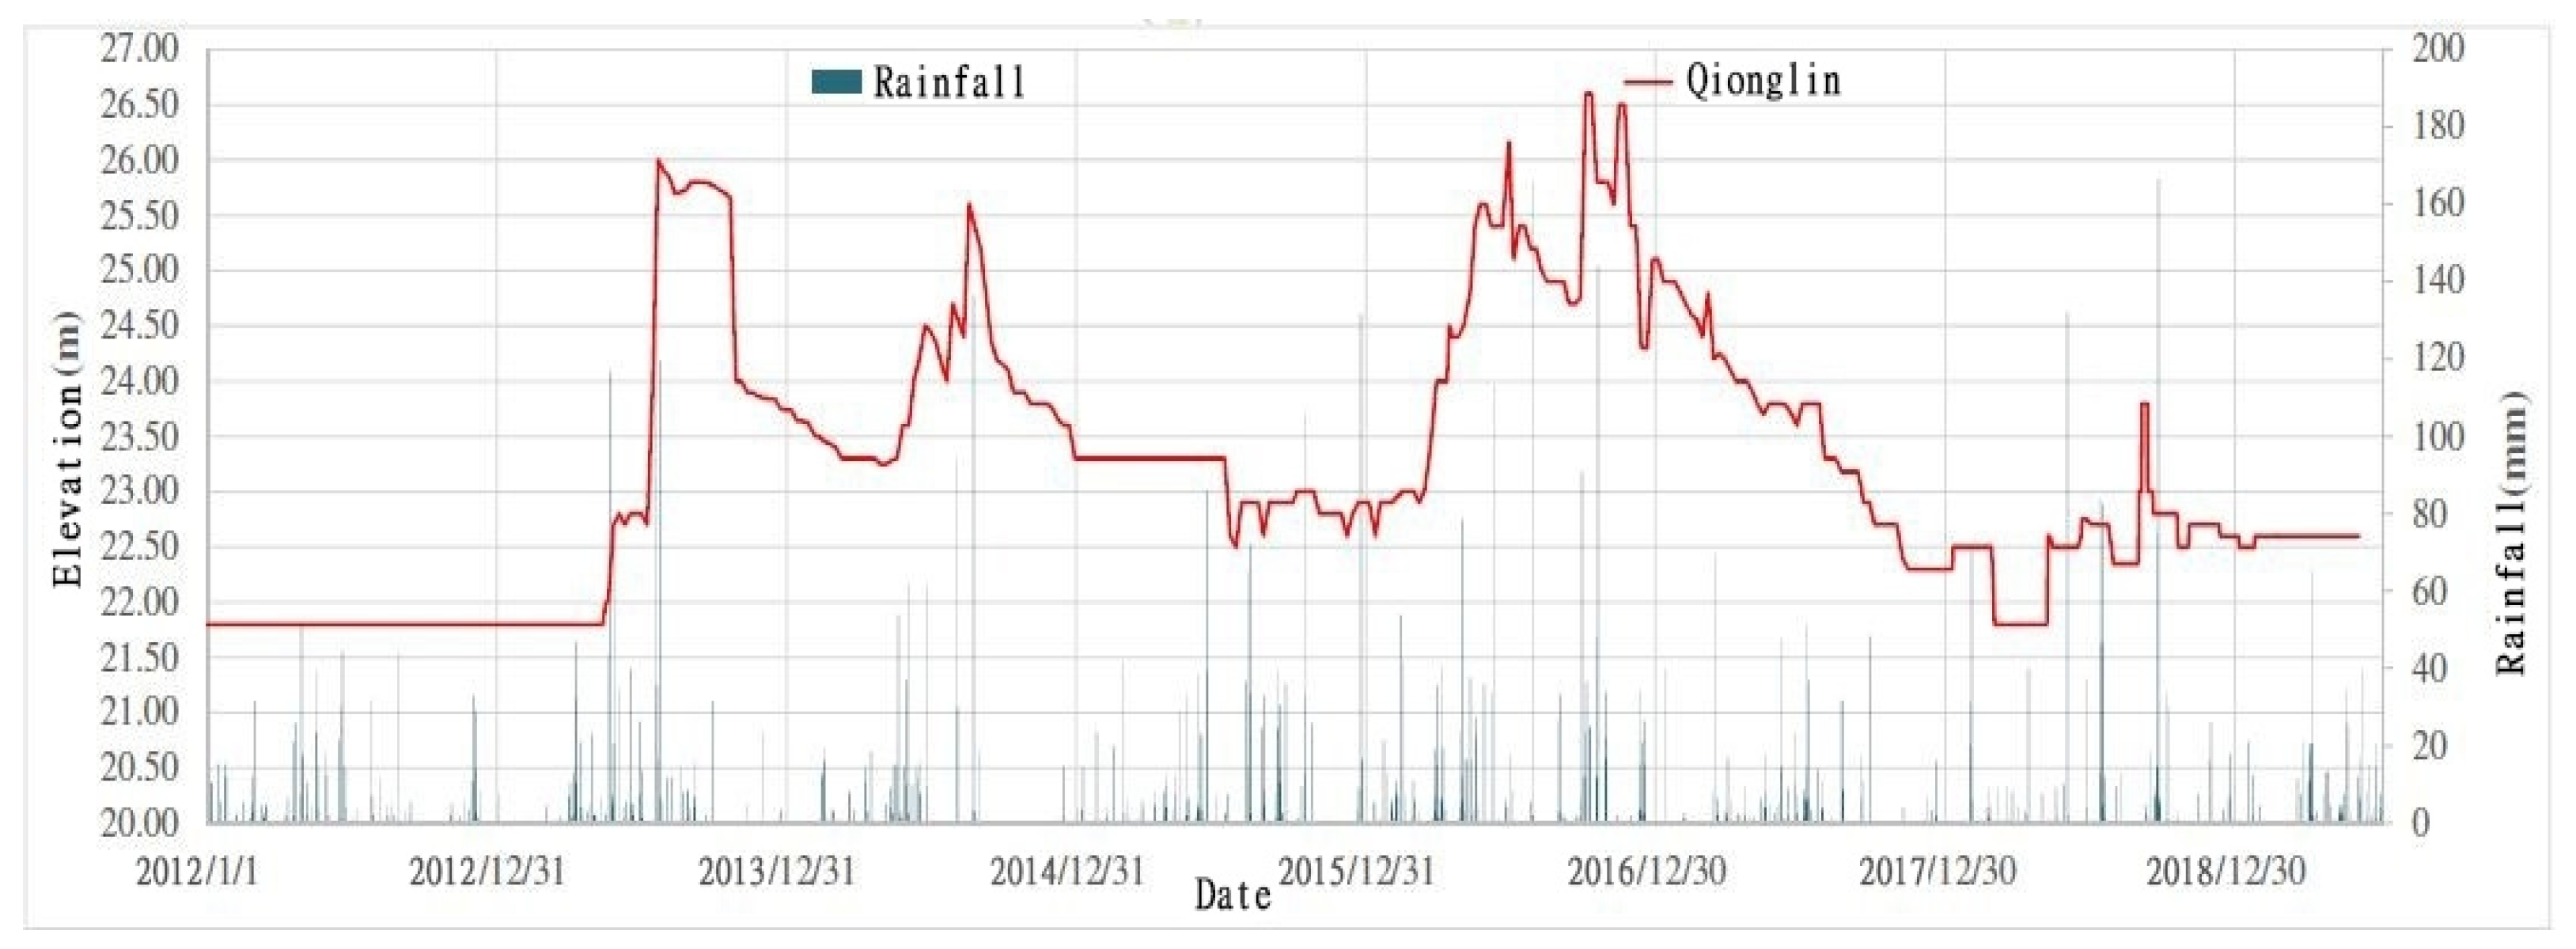
Figure 6 is the comparison between water levels and rainfall of Qionglin Reservoir from 19 December 2011 to 4 June 2019. From the observation of the above water level changes, Qionglin Reservoir was at the dead water level before May 2013; its water level changed significantly from May 2013 to 2017 with the rainfall; the water level changes slightly after dropping to the dead water level in March 2018; and the water level was around EL.22.5–23 m, despite the heavy rain in May and August 2018.
3.5. Field Investigation of the Catchment Area of the Reservoir
The runoff of the reservoir is mainly sourced from the catchment area. The catchment area of Qionglin Reservoir is 125.42 hectares, as shown in Figure 5. The current state of the drainage paths in the catchment area was investigated in this study to facilitate the future analysis of the problem that the reservoir cannot impound.
3.6. Field Investigation of the Dam of the Reservoir
In order to understand the safety of the reservoir structure, an on-site visual inspection on the dam and spillway was conducted in this study, to determine whether there was any abnormity or other potential problems of the reservoir structure. Moreover, in order to understand if the cracks in the walls of the spillway stilling basin were one of the reasons for leakage, a pumping test was carried out in this study to the spillway stilling basin. At the end of the spillway, a pump was used to pump water from the stilling basin, and the water replenishment after the basin drained was observed to evaluate the source and amount of leakage.
4. Results and Analysis
4.1. Electrical Resistivity Tomography Results and Analysis
4.1.1. Field Electrical Resistivity Tomography Results
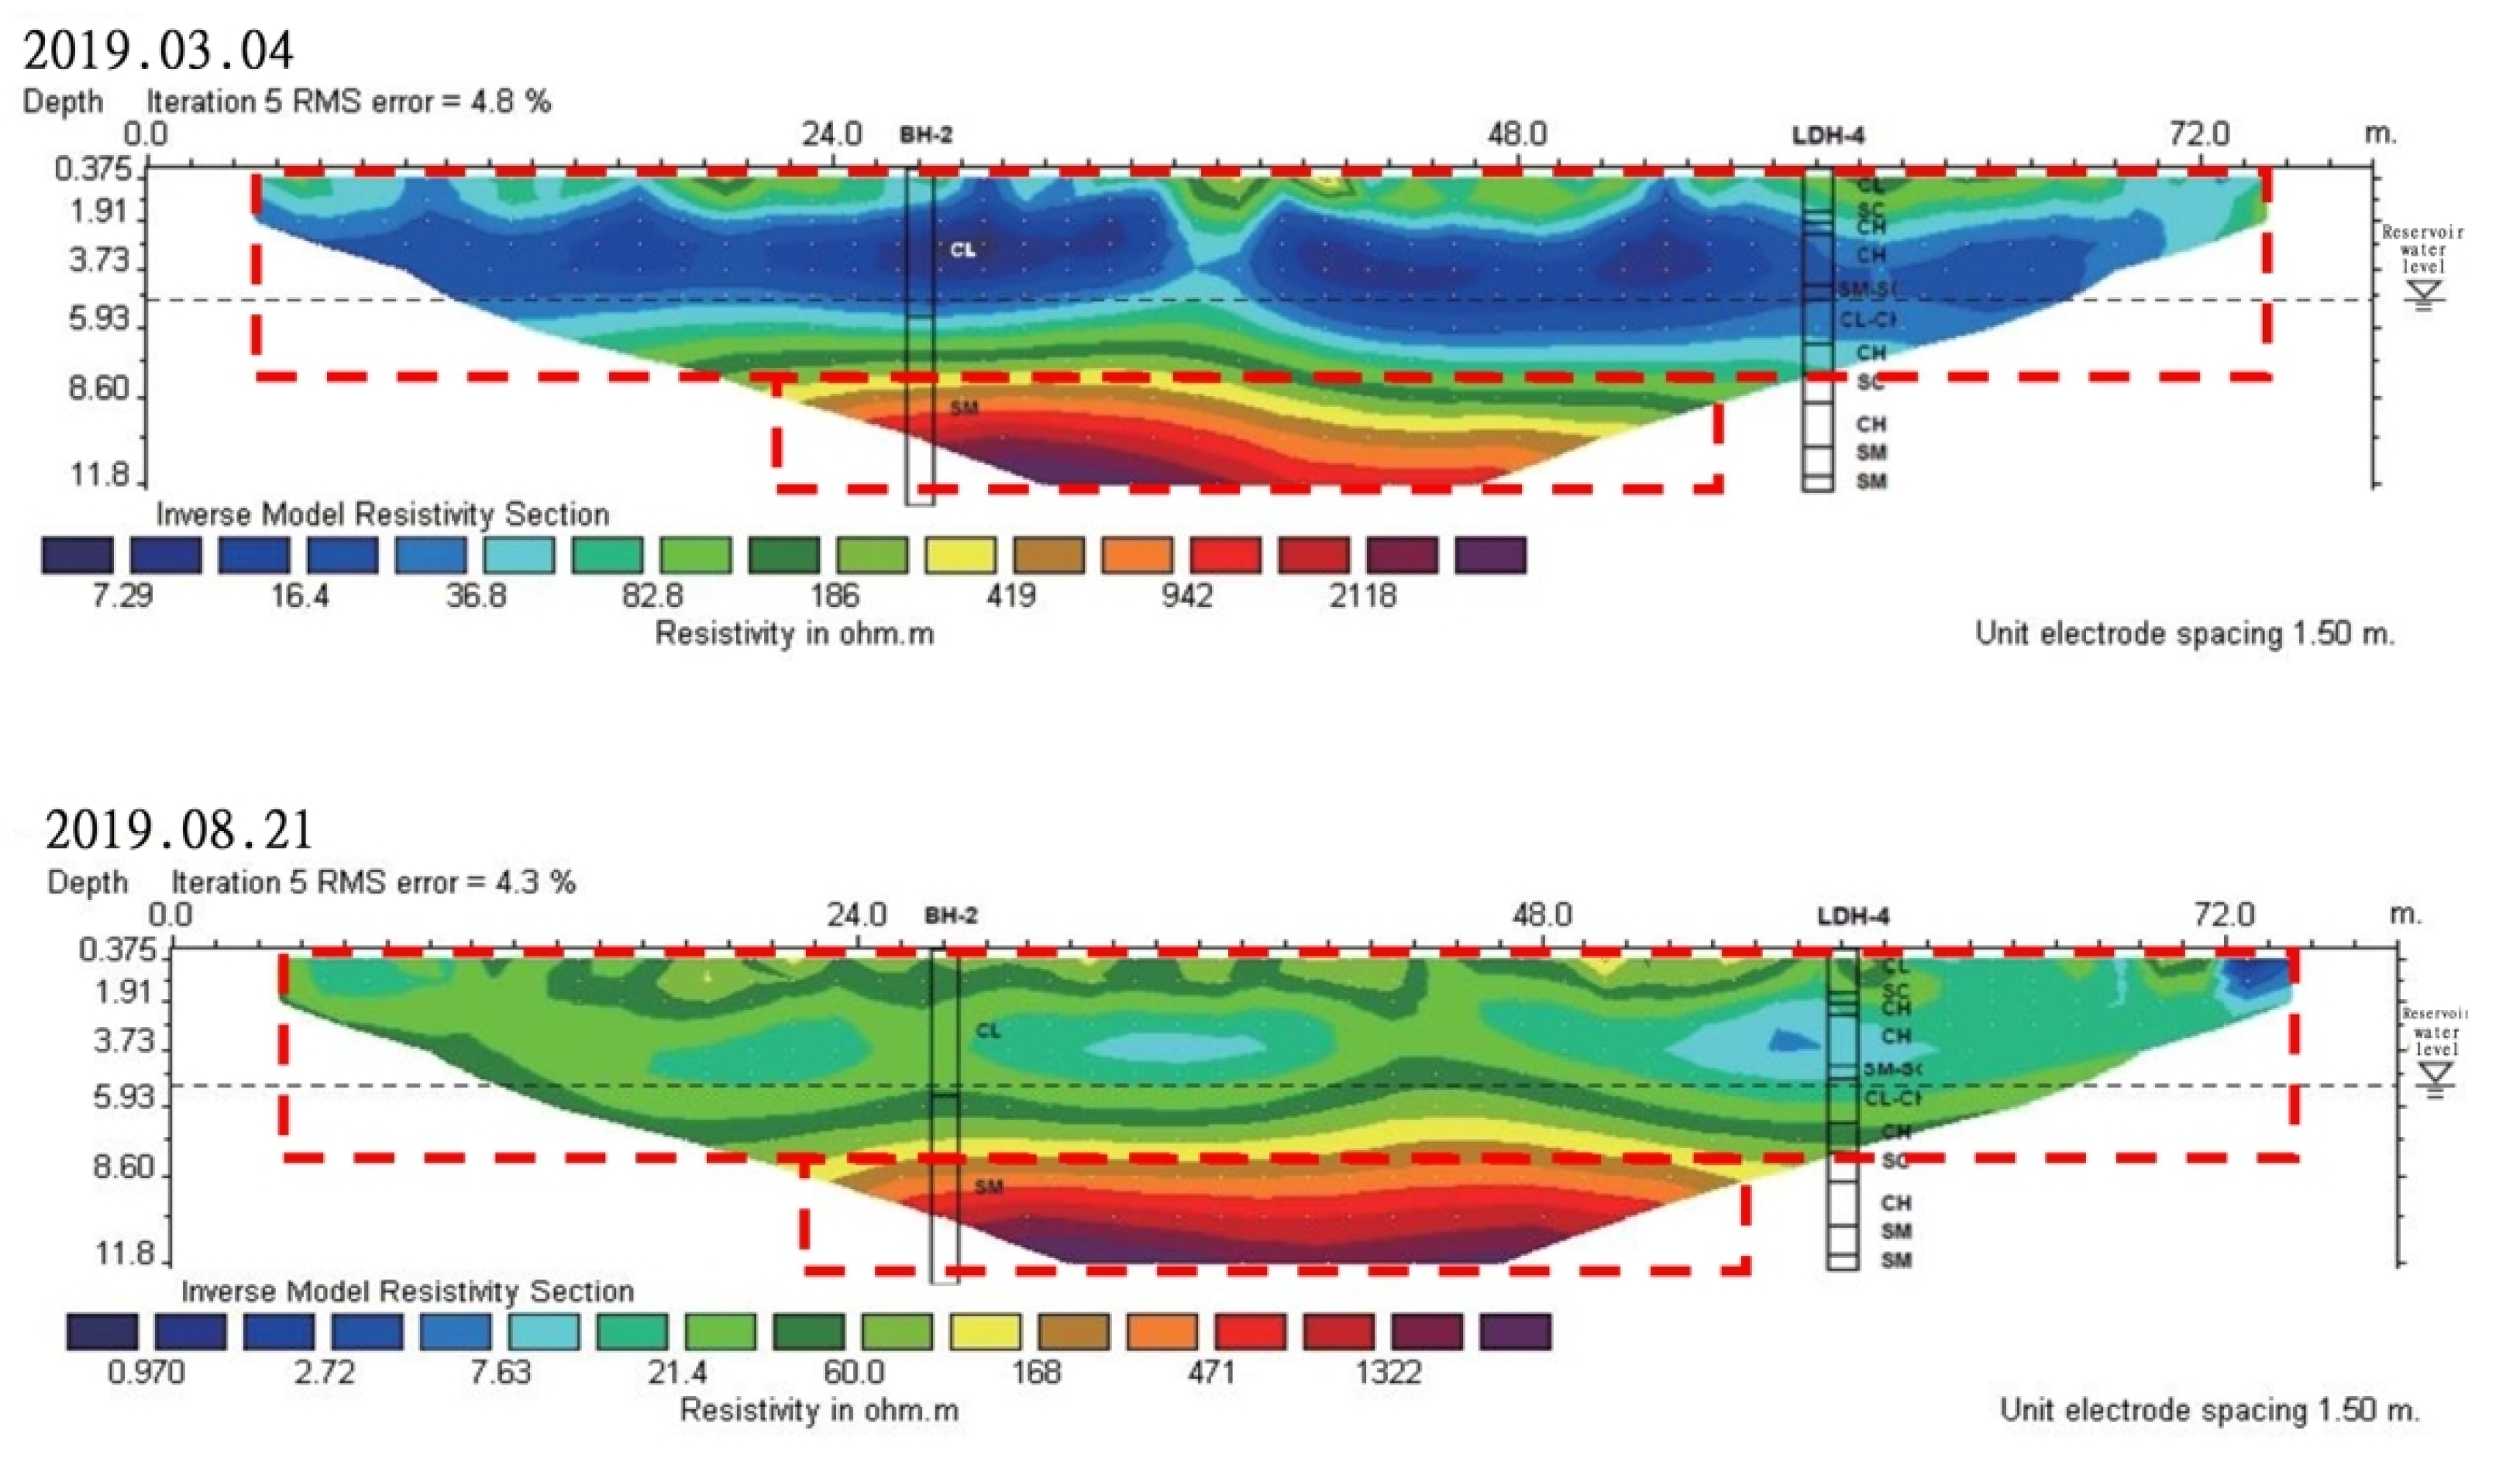
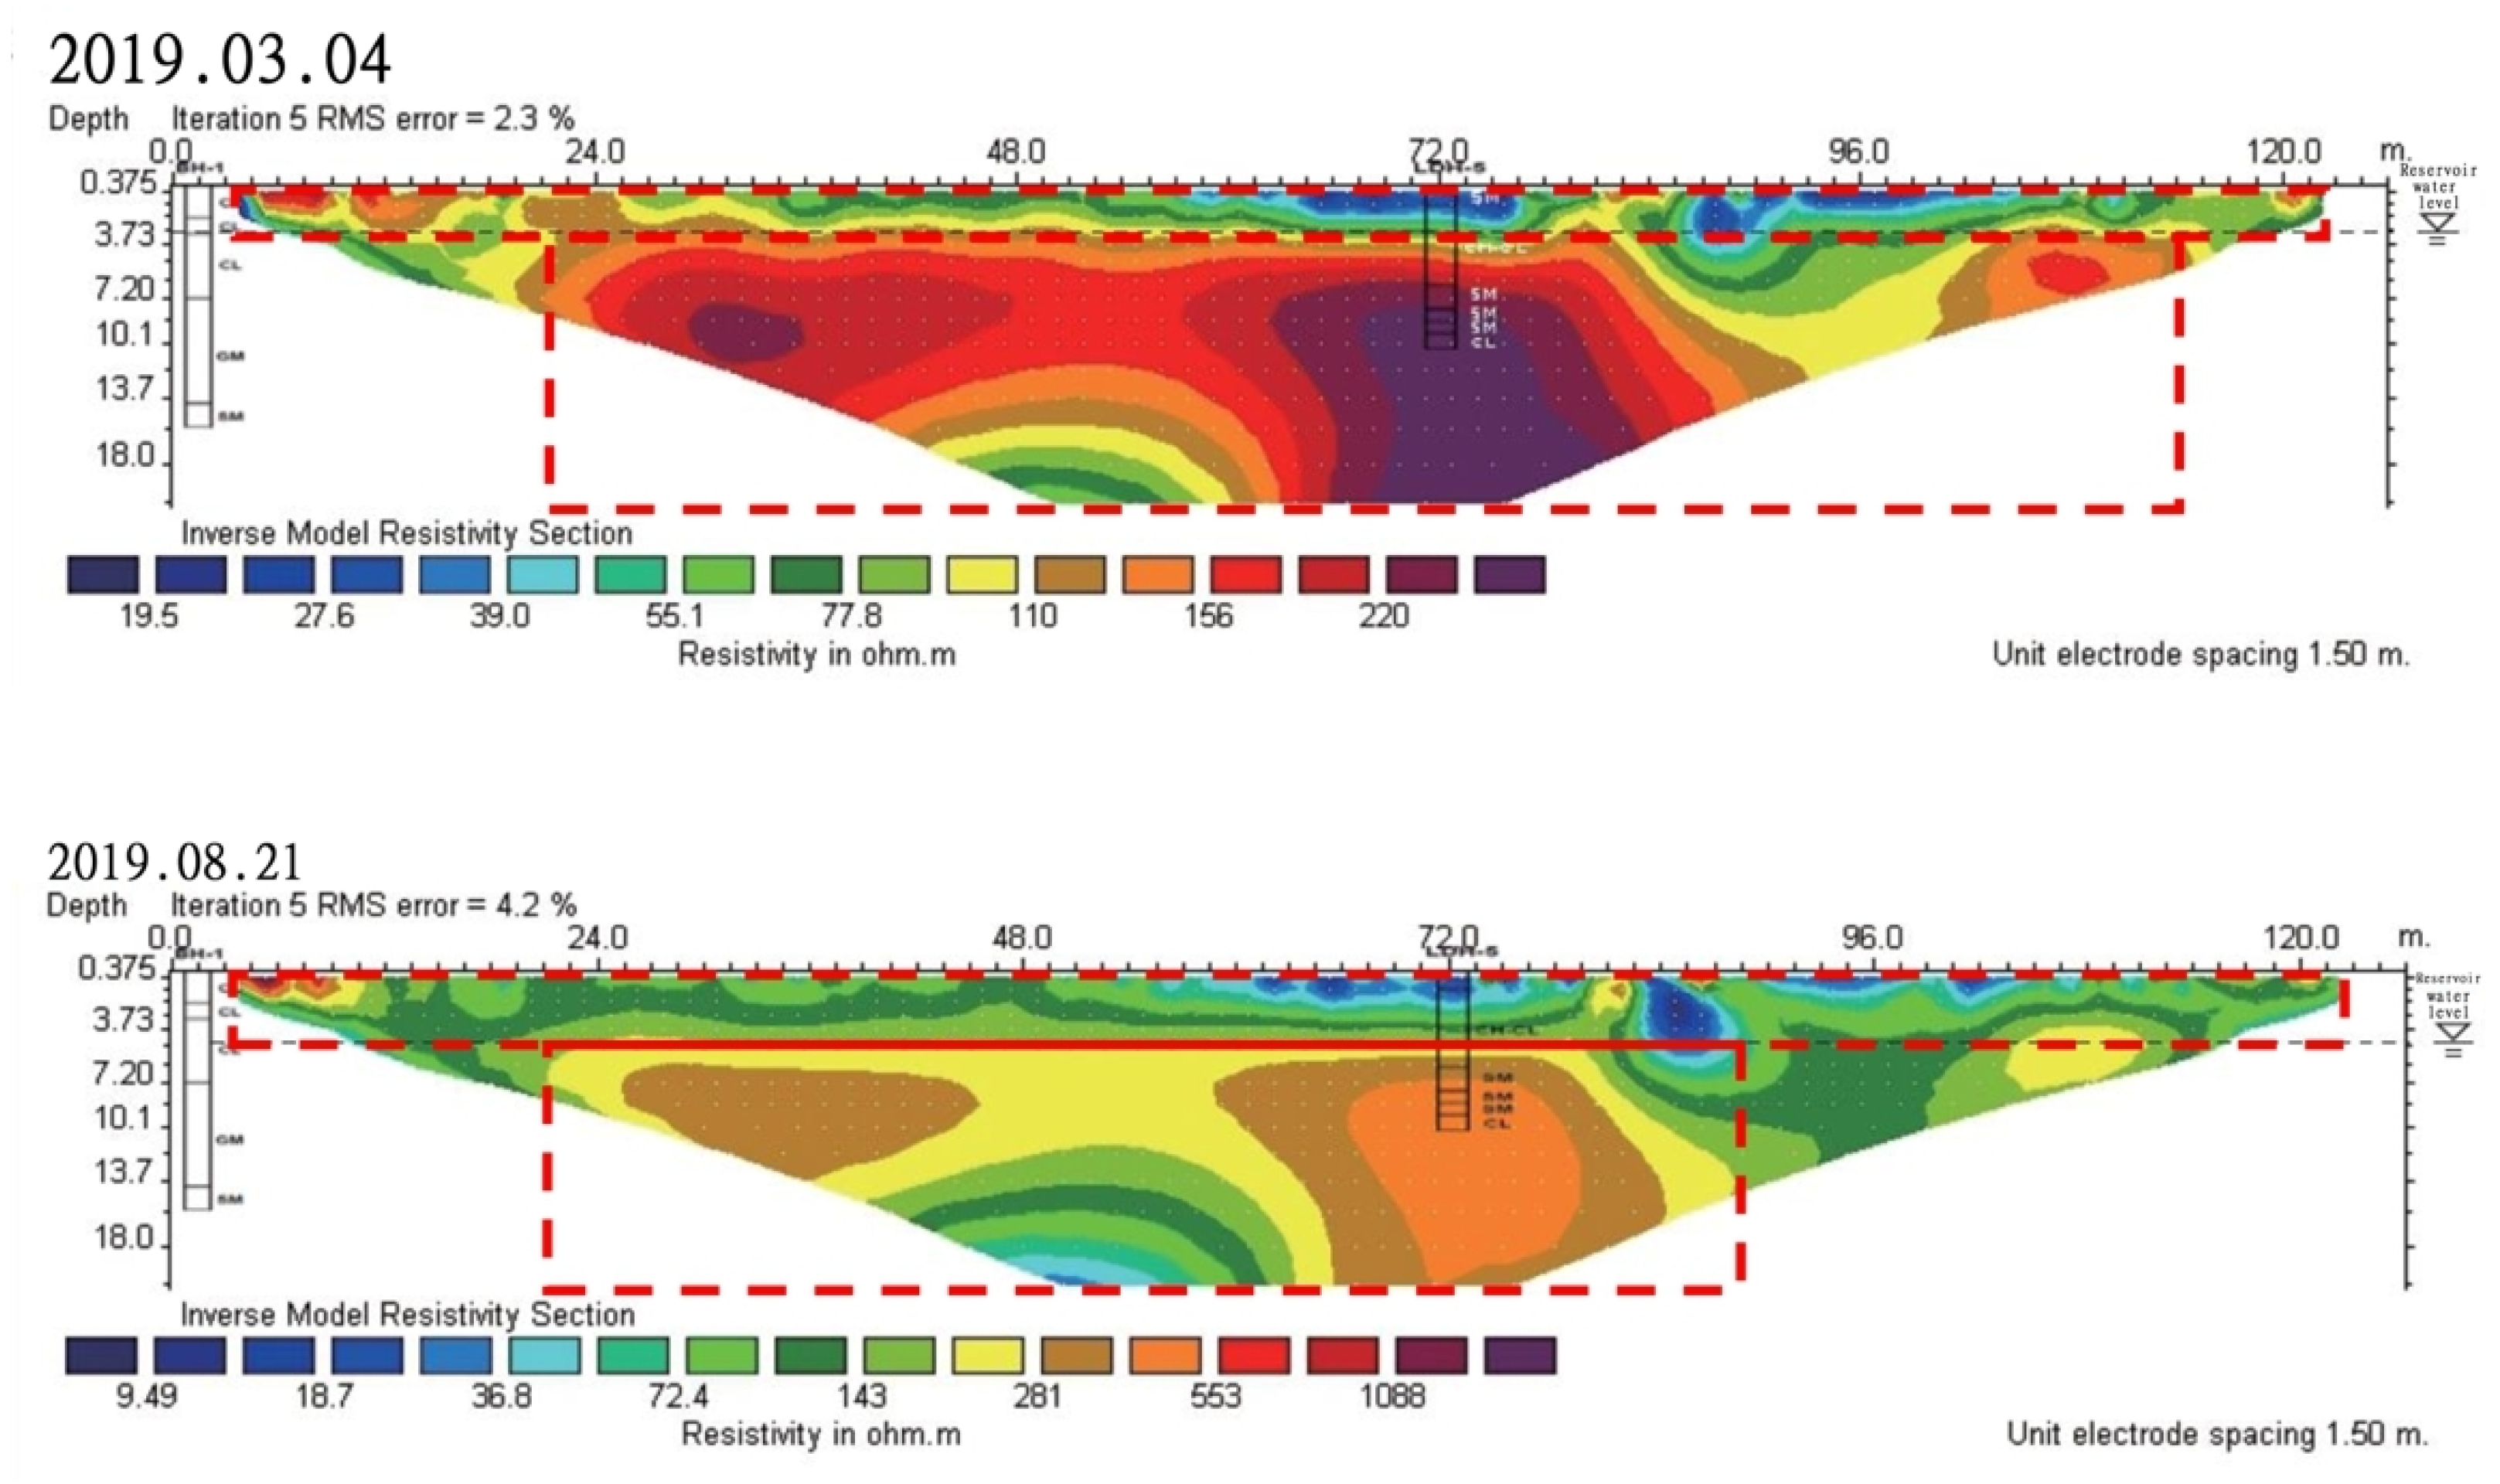
The geological distribution of strata can be examined through geological drilling to confirm the distribution of the permeable and impermeable layers inside and outside the dam. However, in order to find the place where leaks in the dam, the dam surface shall be examined. Hence, in addition to geological drilling, this study carried out an electrical resistivity tomography and analyzed leakage of Qionglin Reservoir through the comprehensive comparison of the two pieces of data. In this study, two testing lines were laid out around Qionglin Reservoir: L1 was on the west side of the dam and L2 was on the north side of the dam. An electrical resistivity tomography was carried out in the rainy season and dry season, respectively. The two tests were performed on 4 March and 21 August. The electrical resistivity tomography results and analysis of the two testing lines are described as follows:
- (1)
- Line L1
The electrical resistivity tomography results of L1 are shown in Figure 7. The resistivity distribution was roughly two-layered, showing a low–high pattern from shallow to deep. In the first layer, the resistivity was relatively low, and the depth was less than 8.6 m; in the second layer, the resistivity was relatively high, and the thickness was about 3 m. The first test was carried out a few days after rain, and it was wet below the surface; therefore, the resistivity was very low, within 6 m below the surface. By comparing the results of the two tests, the overall results tended to be the same with clear distinction under the depth of 6 m, except for the variables caused by rainy days. With the drilling data and the reservoir water level of the day, it could be found that the boundary between the permeable layer and the impermeable layer was the same as the boundary of the earth resistance between the first layer and the second layer.
- (2)
- Line L2
The electrical resistivity tomography results of L2 are shown in Figure 8. The resistivity distribution was roughly two-layered, showing a low–high pattern from shallow to deep. In the first layer, the resistivity was relatively low, and the depth was less than 4 m; in the second layer, the resistivity was relatively high, and the thickness was about 15 m. The overall results of the two tests tended to be the same. With the drilling data and the reservoir water level of the day, it could be found that the boundary between the permeable layer and the impermeable layer was the same as the boundary of the resistance between the first layer and the second layer.
4.1.2. Comprehensive Analysis of Electrical Resistivity Tomography Results
The Wenner–Shlumberger array was adopted in this study for electrical resistivity tomography. This electrode arrangement method has good spatial resolution and is suitable for low-depth investigation. According to the results of this test site, the Wenner–Shlumberger array can provide sufficient depth and maintain good resolution for the testing lines with a span less than 78 m and 126 m.
According to the integrated results of the electrical resistivity tomography and drilling survey, the resistivity distribution was roughly the same as the drilling result (BH1, BH2) distribution. For testing line L1, the first layer was impermeable, mainly composed of CL and CH, and its resistivity was low because drainage is not easy in the clay layer and the soil contains water; the second layer was permeable mainly composed of SC and SM, with low resistivity when wet and high resistivity when dry. According to the comparison between the reservoir water level and the earth resistance profile, there was no leakage on the west side of the dam of the reservoir; therefore, the second layer had a higher resistivity than the first layer. For testing line L2, the first layer was impermeable, composed of CL and small amounts of CH, and its resistivity was low because drainage was not easy in the clay layer and the soil contains water; the second layer was permeable mainly composed of SM, with low resistivity when wet and high resistivity when dry. According to the comparison between the reservoir water level and the earth resistance profile, there was no leakage on the north side of the dam of the reservoir; therefore, the second layer has a higher resistivity than the first layer. Both testing lines showed distinct distribution and a low-to-high order, and no reservoir leakage was found.
Two tests were carried out a few days after rain and in dry weather, respectively. According to the results of L1 and L2, the influence of the rain on the test results was roughly at the boundary between the permeable layer and the impermeable layer, indicating that the local geology is distinct and not leaky.
4.2. Tracer Analysis Result
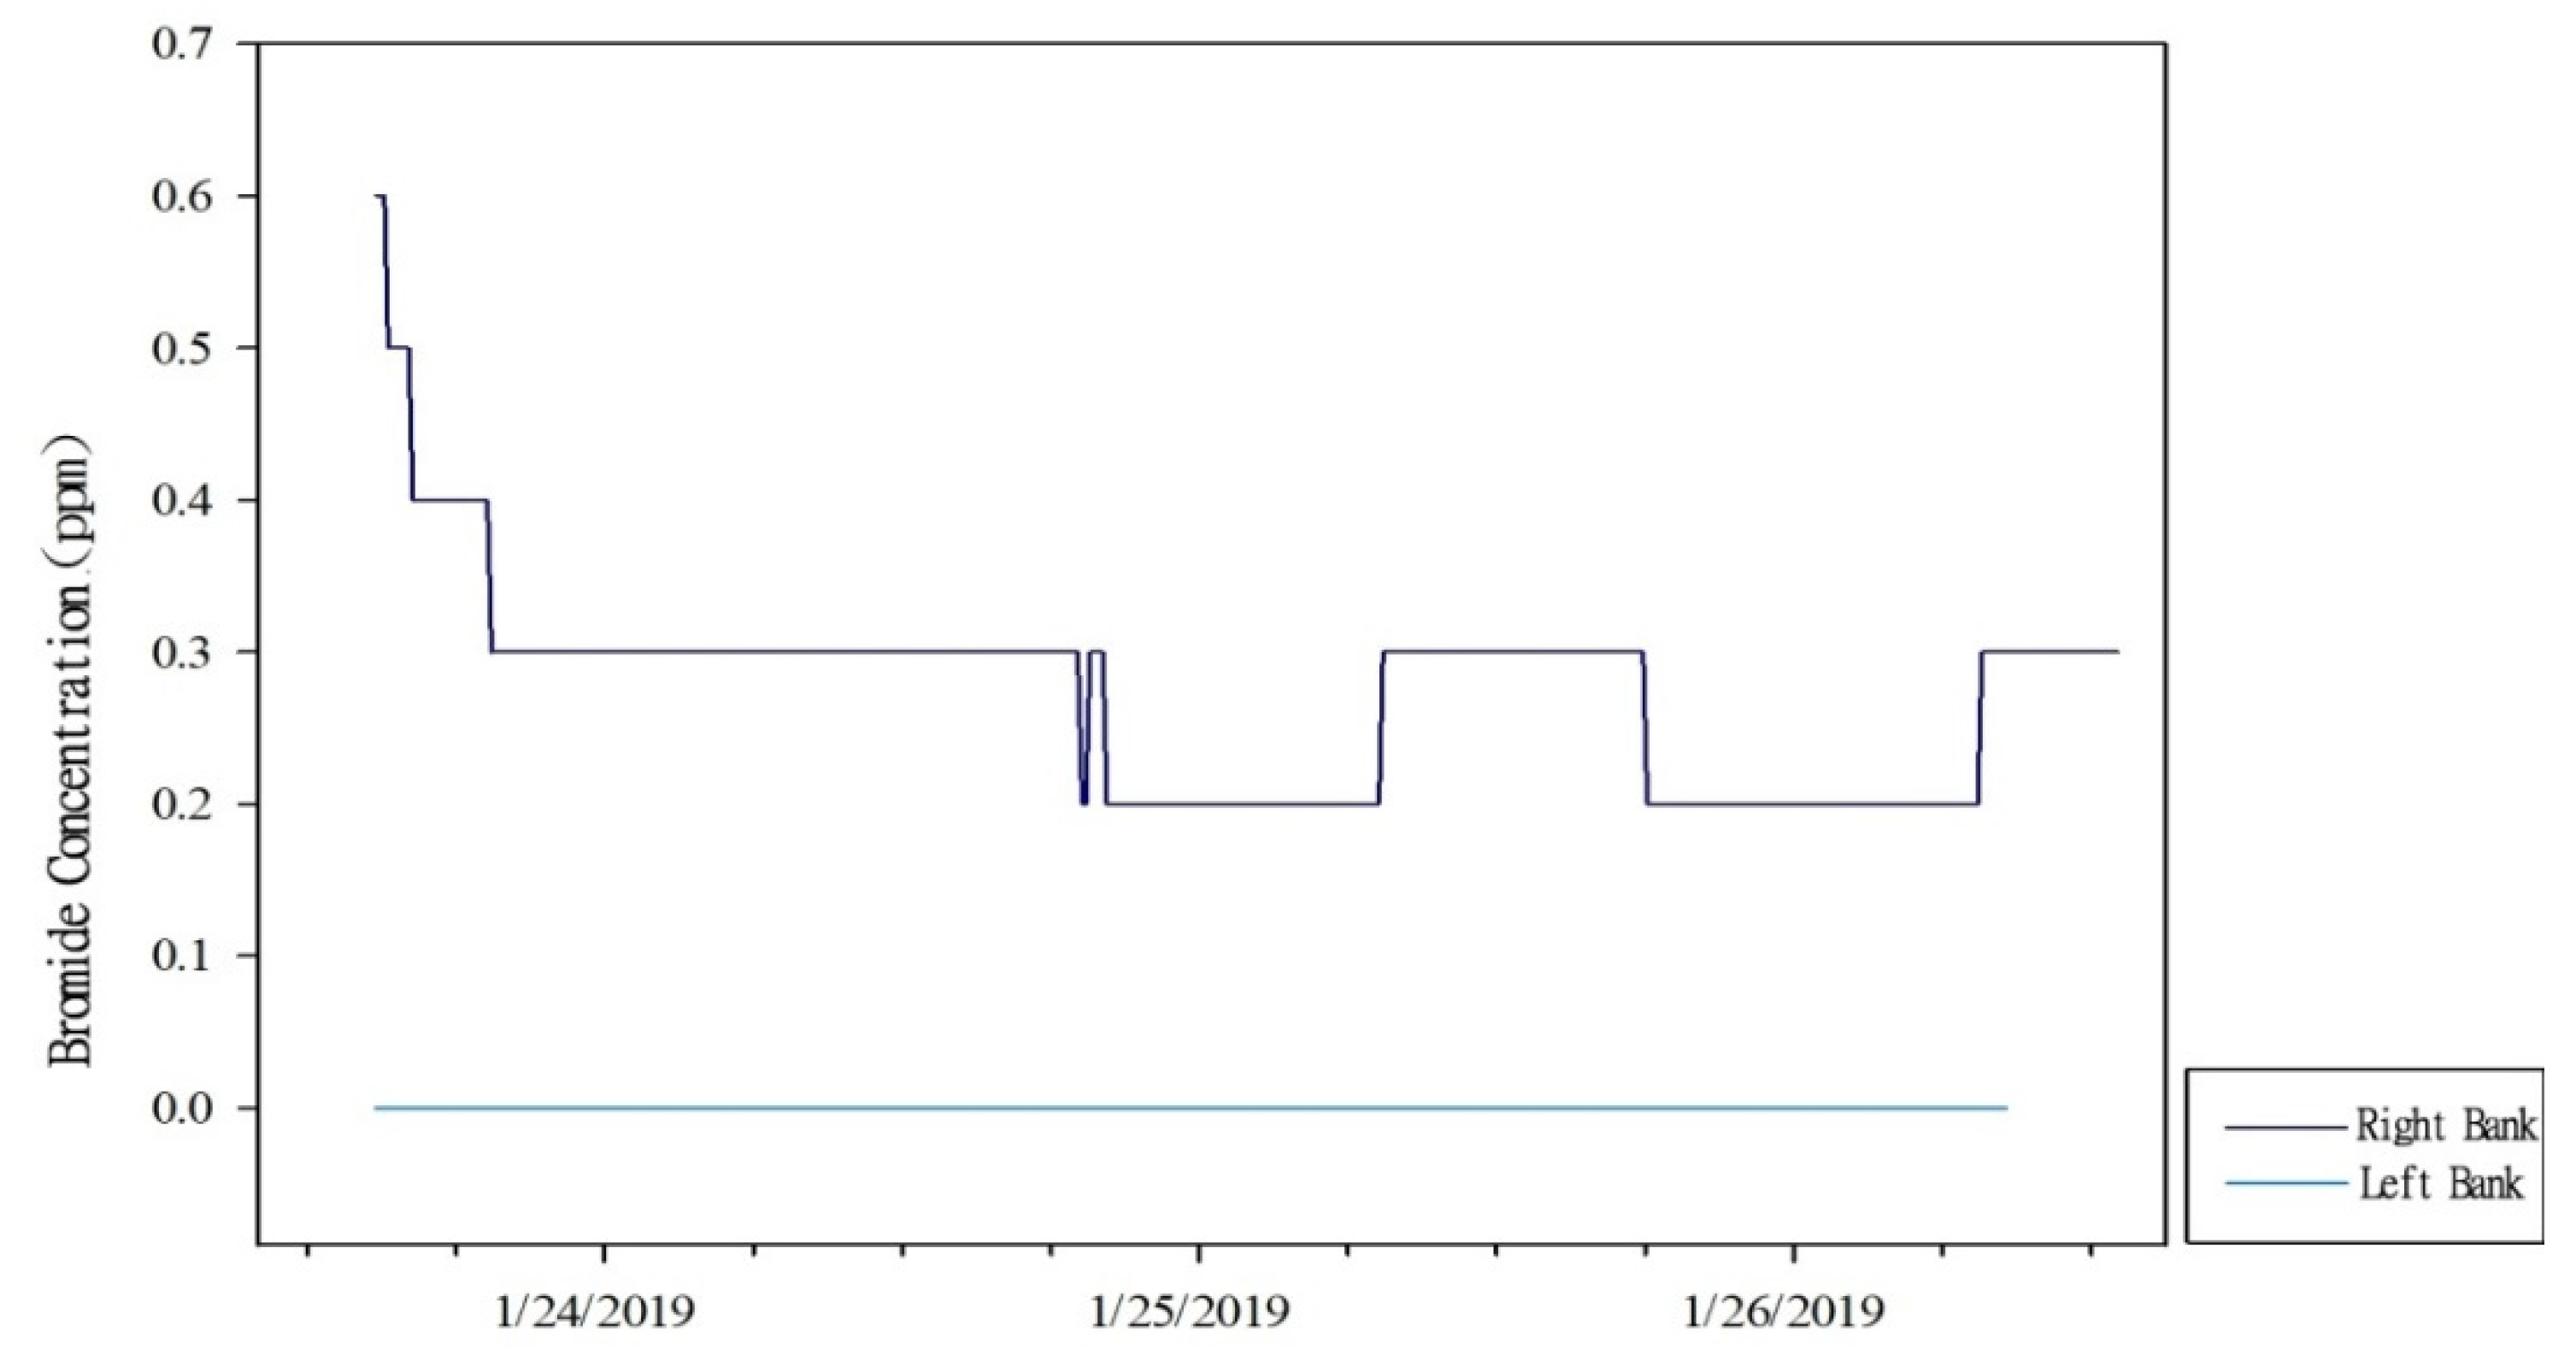
In this study, sodium bromide was used as the tracer and placed near the spillway on the right bank of the stilling basin of the reservoir in the form of a solution. Then, TempHion Smart Sensor was placed on the left bank (outside the reservoir) and the right bank (inside the reservoir area) of the stilling basin to detect the changes in sodium bromide ion concentration. The tracer test was conducted at the spillway of Qionglin Reservoir from 23 January 2019 to 26 January 2019. The estimated water volume of the reservoir was about 14,000 m3, and 5 kg of tracer was added; therefore, the estimated tracer concentration in the water was about 0.5 ppm. In addition to on-site monitoring with a receiver, three groups of water samples were collected and sent back to the laboratory for analysis.
Figure 9 is the diachronic diagram of time-varying bromide ion concentration on the left bank (the stilling basin outside the reservoir) and the right bank (inside the reservoir area) measured by TempHion ISE. At the beginning, the background values of left bank and the right bank were 0 ppm and 0.6 ppm, respectively. As the bromide ion concentration was automatically received every 10 min, the diachronic diagram of the left bank shows that the artificial tracer put in has no influence; while the diachronic diagram of the right bank shows that the concentration decreases rapidly from 0.6 ppm to 0.3 ppm and then remains between 0.3 ppm and 0.2 ppm, indicating that the right bank was not influenced by the artificial tracer put in due to the background value of the right bank of 0.6. It indicates that the stilling basin did not receive any signal from the artificial tracer during the test period (from the afternoon of 23 January 2019 to the noon of 26 January 2019).
In this study, water samples were respectively collected from the stilling basin on the left bank and the reservoir area on the right bank on 26 January 2019 and sent back to the laboratory for analysis. The results showed that the bromide ion concentration in the water of the reservoir on the right bank was about 0.3 ppm, while no bromide ion concentration was detected in the analysis of the water samples collected from the stilling basin on the left bank. Such results were same as the bromide ion concentration results measured on the left and right banks by TempHion ISE. Additionally, in this study, on 10 June 2019, water samples were collected again from the reservoir area on the right bank and the stilling basin on the left bank for testing. The results showed that the bromide ion concentration in the water of the reservoir on the right bank had significantly decreased to 0.03 ppm, while no bromide ion concentration was detected from the stilling basin on the left bank. Such results were similar to those of the first analysis, but after nearly 5 months, bromide ion concentration had significantly decreased. The tracer test results showed that no leakage was found in the dam spillway.
4.3. Supplementary Drilling Test Results and Analysis
Based on the field drilling data and laboratory test results, the soil layer distribution of all boreholes can be analyzed. The stratigraphic section changes of the four boreholes in the base mainly consist of three layers: hard reddish-brown sandy clay (CL), medium-dense yellowish-brown silty fine sand (SM) and medium-dense yellowish-brown and greyish-white clayey fine sand (SC), from the surface to the underground. According to the constant head permeability test in the field, the permeability coefficient K is about 2.3–4.3 × 10⁻⁴ cm/s, indicating a high permeability coefficient outside the dam.
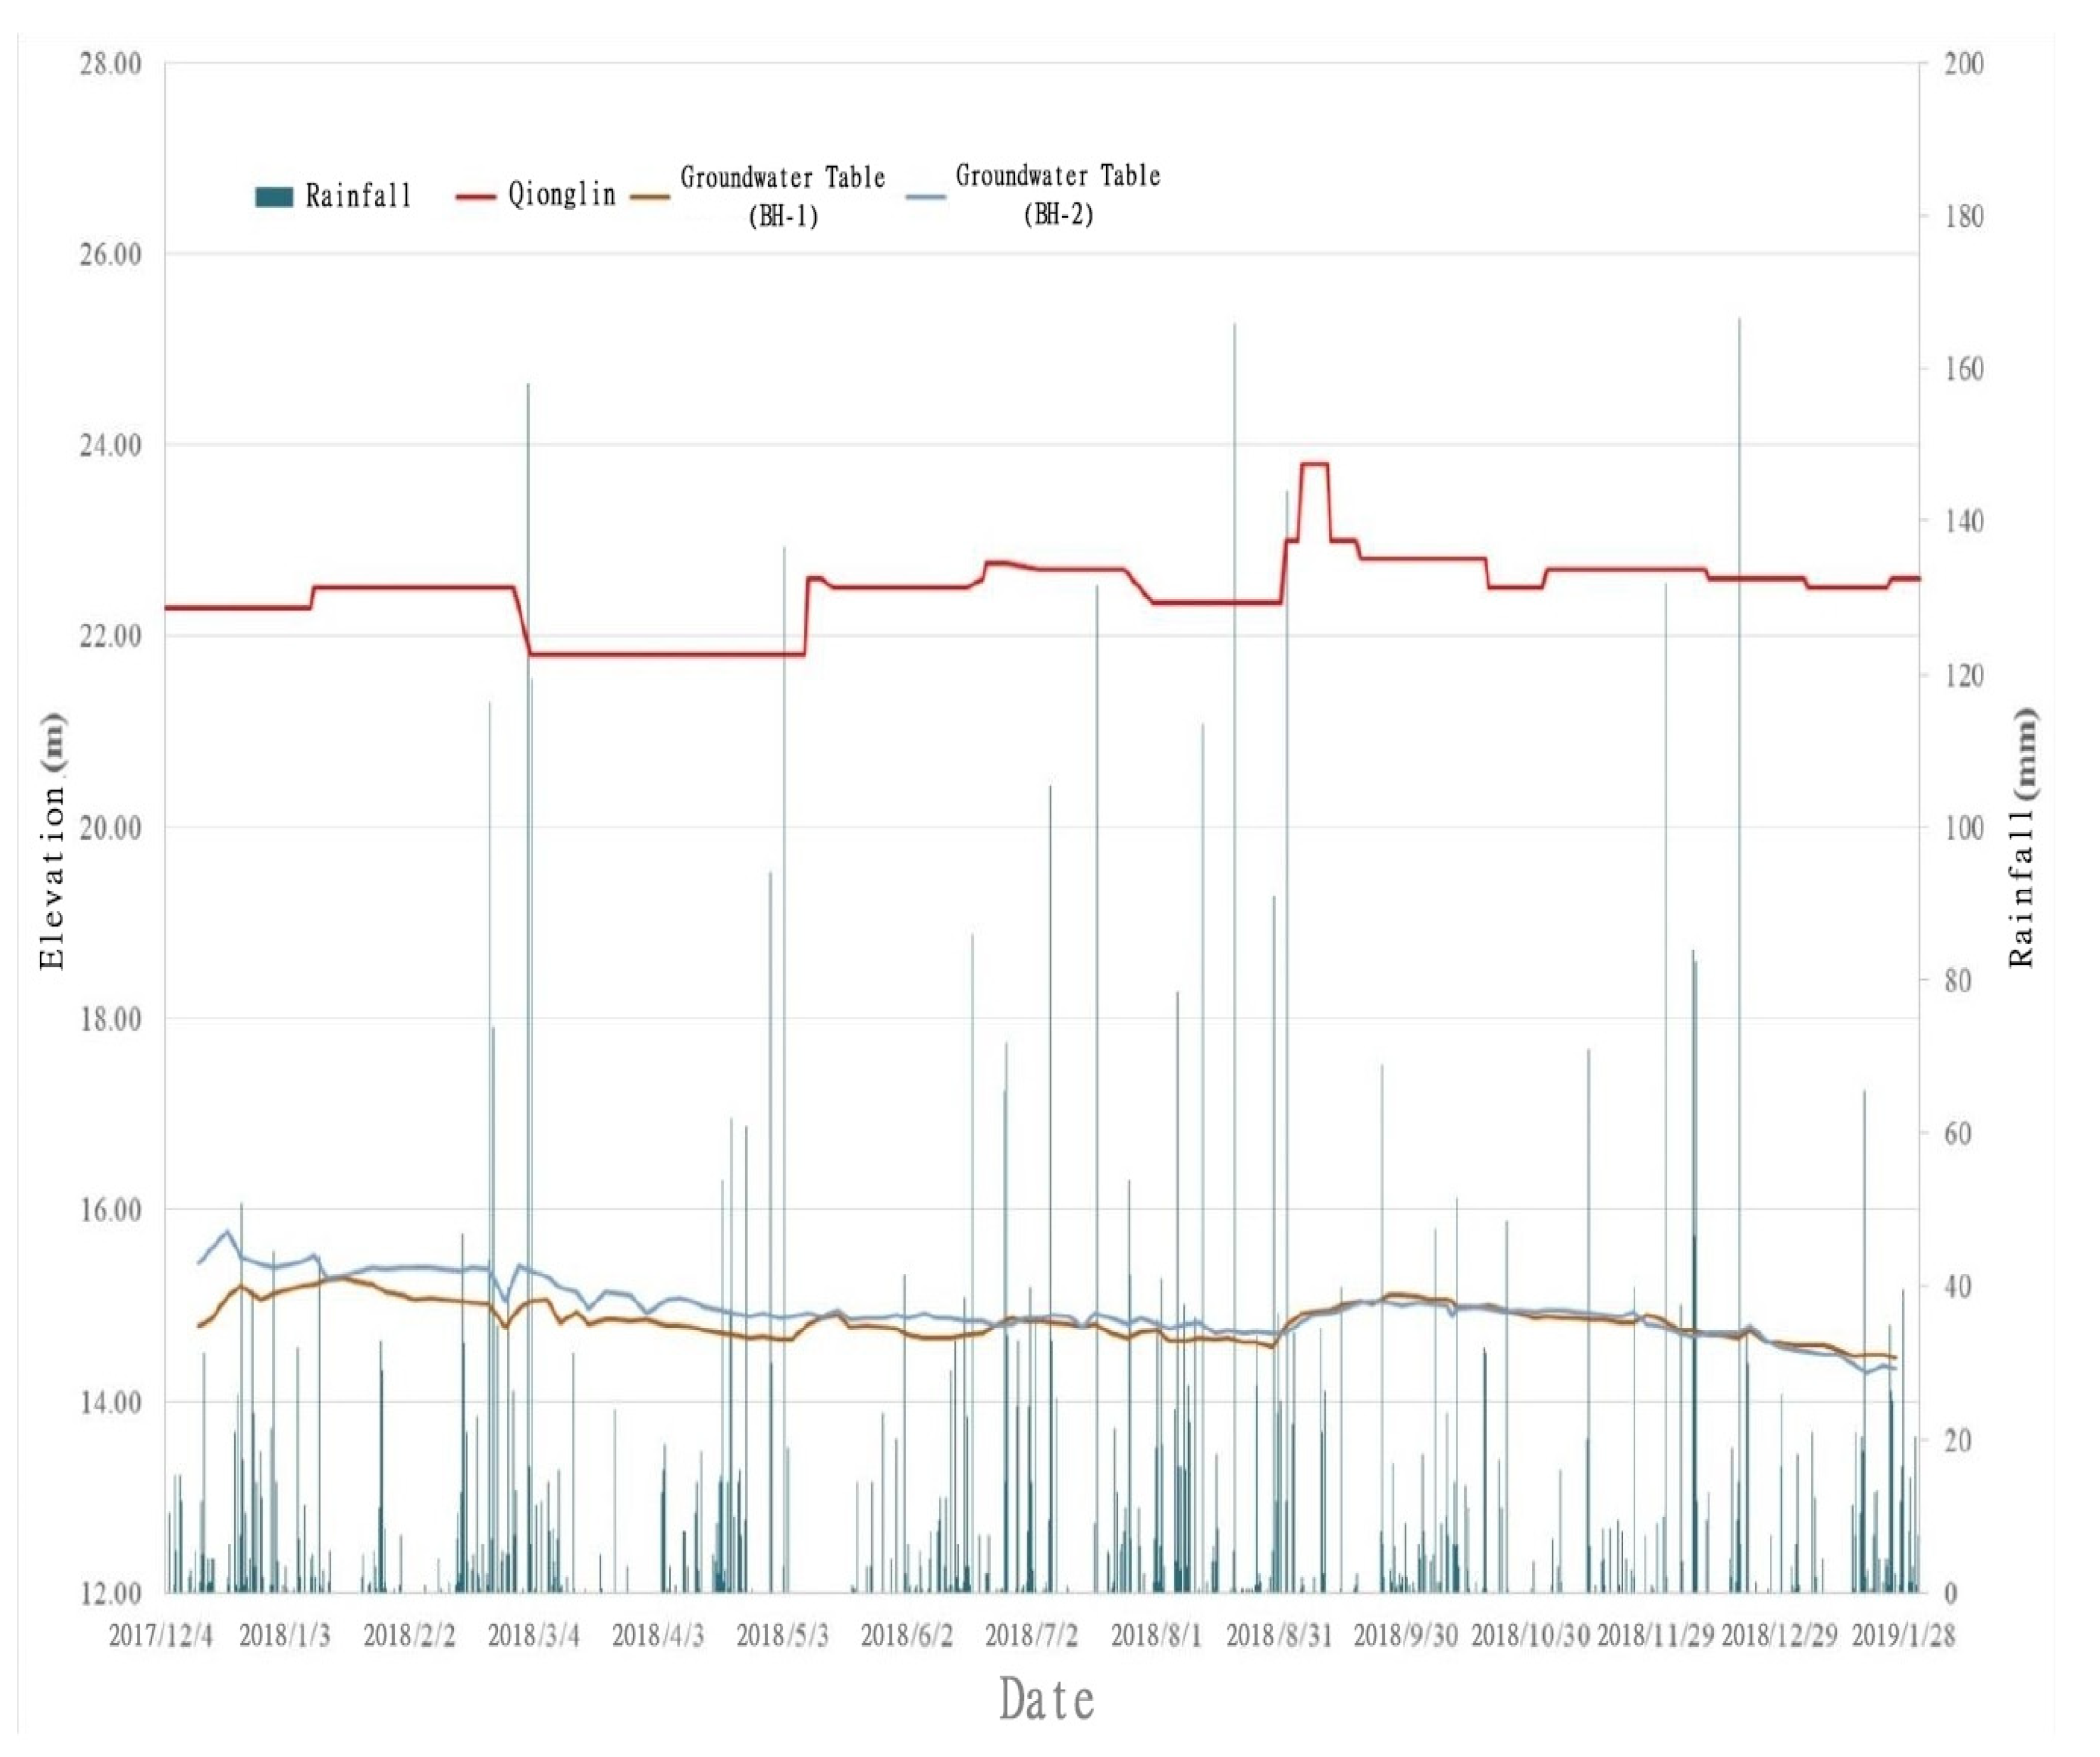
In order to understand the relationship among reservoir water level, rainfall and groundwater level, in this study, the two holes BH-1 and BH-2 were changed to be groundwater observation wells after drilling, to observe the changes of groundwater level around the reservoir. Figure 10 shows the groundwater level elevation changes. From December 2017 to January 2019, the groundwater level changed slightly, generally between EL 14.5 m and EL 15.5 m. The maximum and minimum groundwater levels of BH-1 were EL 15.28 m and EL 14.46 m, respectively. The maximum and minimum groundwater levels of BH-2 were EL 15.78 m and EL 14.30 m, respectively. According to Figure 10, the groundwater level did not immediately change with reservoir water level and rainfall, which only reflected the change trend.
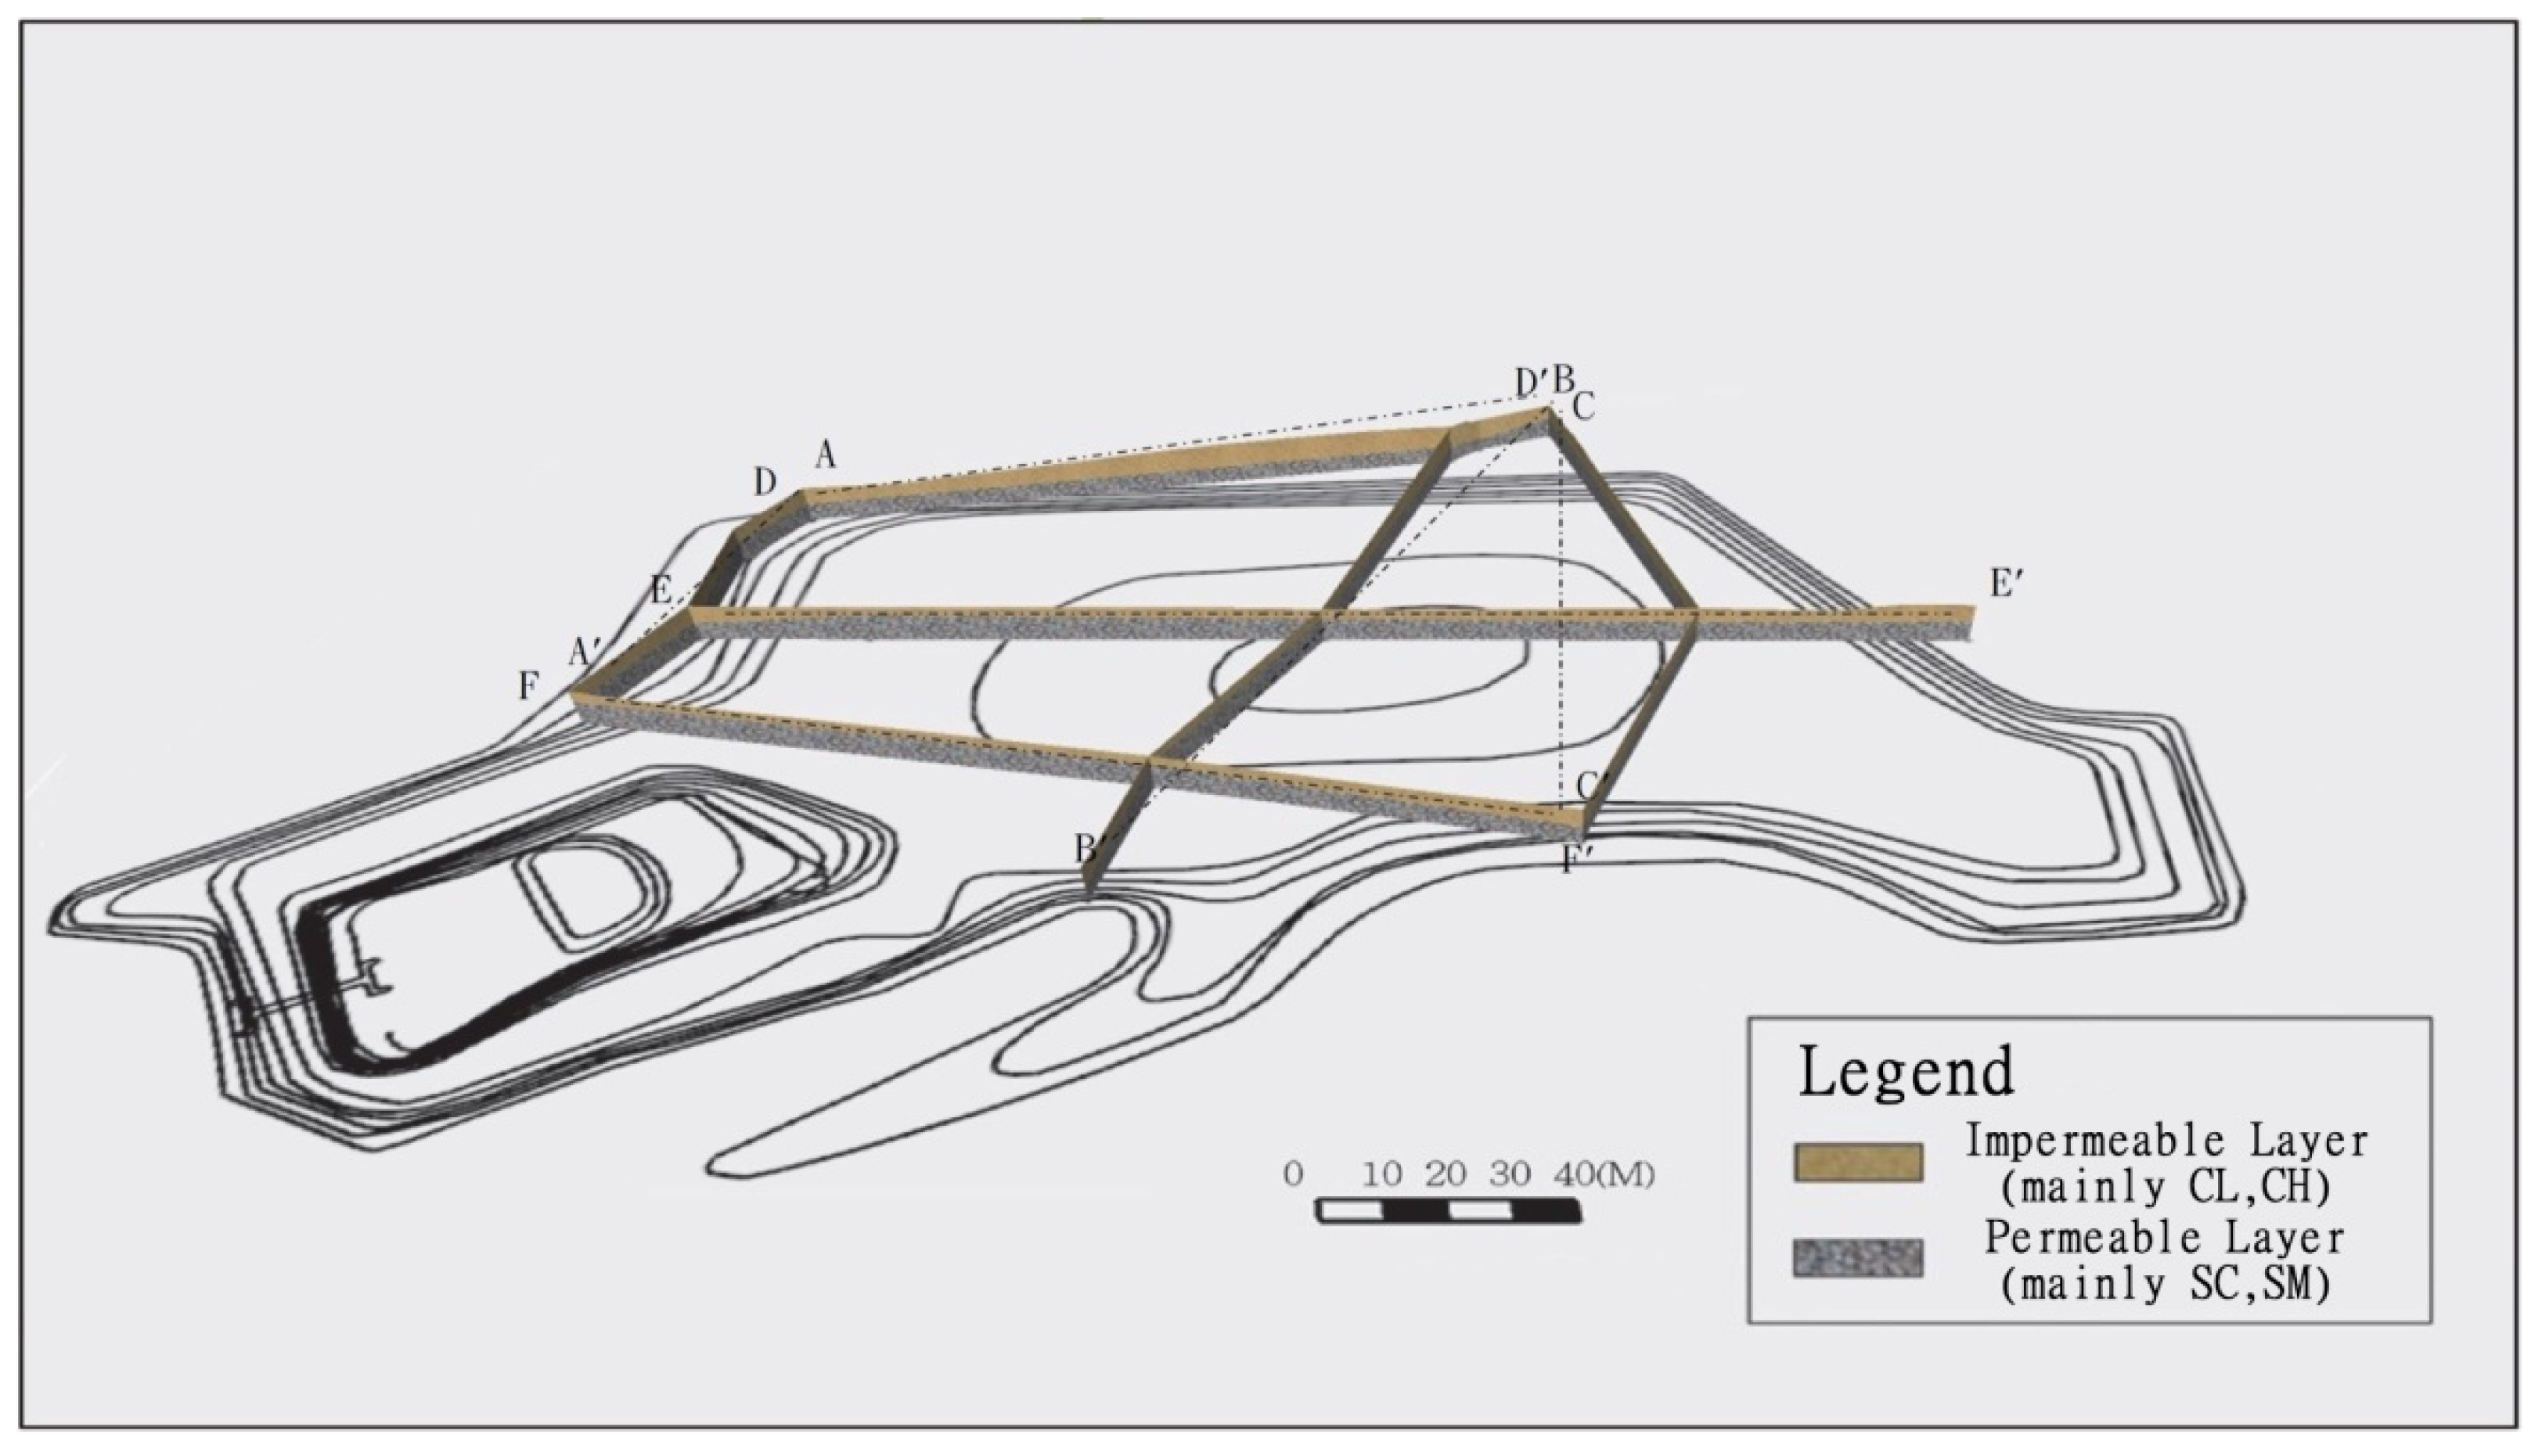
Based on the data from previous drilling, water permeability tests and test pits and the results of this drilling and water permeability test, the geological fence diagram of Qionglin Reservoir was drawn in this study, as shown in Figure 11. The analysis results are as follows:
- (1)
- According to the results of the manual test pits, the Relative Compaction (RC) of the dam is 93%, and the Relative Compaction (RC) of the dam bottom is 89–92%, which proves that it did meet the compaction density requirements and effectively reduce the water permeability when the reservoir bottom was backfilled.
- (2)
- According to the results of the water permeability test, the permeability coefficient of the dam bottom is low, meaning it does not easily leak water.
- (3)
- The borehole in this water permeability test is located outside the reservoir with a high permeability coefficient between 2.3 × 10⁻⁴ cm/s and 4.3 × 10⁻⁴ cm/s, indicating good permeability outside the reservoir.
- (4)
- The sedimentary layers of the geological section A–A’ are, from bottom to top, a permeable layer mainly comprised of SM and an impermeable layer mainly comprised of CL. The minimum elevation of the impermeable layer is 7 m, and the maximum elevation is 10 m.
- (5)
- The sedimentary layers of the geological section B–B’ are, from bottom to top, a permeable layer mainly comprised of SM and an impermeable layer comprised of CL and small amounts of SC and SM. The minimum elevation of the impermeable layer is 4.5 m, and the maximum elevation is 10 m.
- (6)
- The sedimentary layers of the geological section C–C’ are, from bottom to top, a permeable layer mainly comprised of SM and an impermeable layer mainly comprised of CL. The impermeable layer is about in a straight-line shape, with an elevation about 8 m.
- (7)
- The sedimentary layers of the geological section D–D’ are, from bottom to top, a permeable layer mainly comprised of SM and SC and an impermeable layer comprised of CH, CL and small amounts of SC and SM. The minimum elevation of the impermeable layer is 5.5 m, and the maximum elevation is 8 m.
- (8)
- The sedimentary layers of the geological section E–E’ are, from bottom to top, a permeable layer mainly comprised of SM and SC and an impermeable layer comprised of CL. The minimum elevation of the impermeable layer is 8 m, and the maximum elevation is 13 m.
- (9)
- The sedimentary layers of the geological section F–F’ are, from bottom to top, a permeable layer mainly comprised of SM and an impermeable layer comprised of CL and small amounts of SM. The minimum elevation of the impermeable layer is 8 m, and the maximum elevation is 10 m.
- (10)
- According to the geological drilling data and geological fence diagram, in the sedimentary layers inside and outside the dam and of the reservoir bottom, their impermeable layers cover their permeable layers. In addition, leakage improvement works have been carried out for the reservoir, and impermeable cloth has been laid throughout the reservoir area. Therefore, it is preliminarily concluded that Qionglin Reservoir shall have no serious leakage.
4.4. Long-Term Reservoir Water Level Observation Results and Analysis
In this study, the water level changes of Qionglin Reservoir were compared with those of other reservoirs in Kinmen Island to explore whether the water level changes of Qionglin Reservoir were reasonable and whether there was any significant leakage in the reservoir area. The water levels, rainfall and evaporation of 10 reservoirs in the island from 19 December 2011 to 4 June 2019 were collected in this study for comparison and analysis.
Figure 12 is the comparison between water levels and rainfall of 10 Reservoir in Kinmen Island from 19 December 2011 to 4 June 2019. The results showed that there was no abnormal change in the water level of Qionglin Reservoir, and the rate of decline from the high water level was not higher than that of other reservoirs (without considering the water intake from reservoirs). According to the data from the meteorological station of Kinmen County, the monthly evaporation of Kinmen is between 100 and 200 mm depending on the season, and the average daily evaporation is between 3 and 6 mm. Figure 12 showed that, from the end of October 2016 to the beginning of June 2017, the water level of Qionglin Reservoir steadily declined. After comparing the declining trend with the rainfall and evaporation, it was proved that the declining trend of reservoir water level is within a reasonable range. Based on the analysis of the above reservoir water level changes, Qionglin Reservoir should have no serious leakage.
4.5. Results and Analysis of the Catchment Area Investigation
In this study, an investigation was conducted to 54 detailed places in the catchment area of Qionglin Reservoir. According to the investigation results, this area was topographically rugged, and the ridge line in the original topographic map can no longer be used as the boundary of the catchment area. It was found that private excavations, such as structure construction, animal husbandry and fish farm digging, are constantly carried out in the catchment area, resulting in significant changes in the topography and landform.
An important catchment area is in the south of the reservoir, and the surface runoff is mainly channeled to Qionglin Reservoir through three drainage culverts. However, frequent private development in the area caused that a lot of water cannot flow into the three drainage culverts, and most of the surface runoff either seeps into the surface or forms a pool. Most obviously, some privately dug duck ponds have become pools, so that the runoff from surrounding areas concentrates and no longer flows into the drainage culverts or the reservoir. On the west side of the reservoir, the new road has blocked the runoff into the reservoir.
Within the range of investigation, there were many ditches, most of which have been in bad repair and overgrown with weeds, losing their guiding roles. In addition to that, too many development cases have prevented water from flowing through the area, leaving most ditches dry.
Therefore, according to the investigation results, much of the catchment area in the south of the reservoir was no longer capable of collecting water and guiding surface runoff. If the catchment area is to be used in the future, the topography and landform must be rearranged to facilitate drainage and create paths generating gravity flows. Conversely, water is collected and forcibly conveyed to Qionglin Reservoir by means of power.
The catchment area on the northwest side of the reservoir is the only ditch with runoff in this investigation, and its guiding function is still normal. As long as the path to the reservoir is organized and improved, the water in the catchment area on the northwest side of the reservoir can flow into the reservoir normally.
4.6. Results and Analysis of the Dam Investigation
According to the inspection on the reservoir structure in this study, there were problems, such as subsidence in some concrete slabs of the upstream slope, dislocation of and weed growth in some expansion joints of the upstream slope, weed growth in and local unevenness of the downstream slope, multiple cracks in the road on the dam crest, multiple cracks in the wall on the left side of the upstream spillway, multiple cracks in the wall on the right side of the upstream spillway, long-term water accumulation in the downstream channel of the spillway, serious sedimentation of and weed growth in the downstream channel of the spillway, apparent traces of water seepage in the cracks in the wall on the left side of the downstream spillway and apparent traces of water seepage in the cracks in the wall on the right side of the downstream spillway.
The pumping test of the spillway stilling basin was carried out on 21 February 2019. After the stilling basin was drained, the test showed that there was no significant water recovery in the stilling basin, and the impoundment was gradually restored to the state before pumping until the rainfall on 2 March 2019. According to the pumping test results, there was no significant leakage path in the cracks in the walls on the left and right sides of the stilling basin of the downstream spillway.
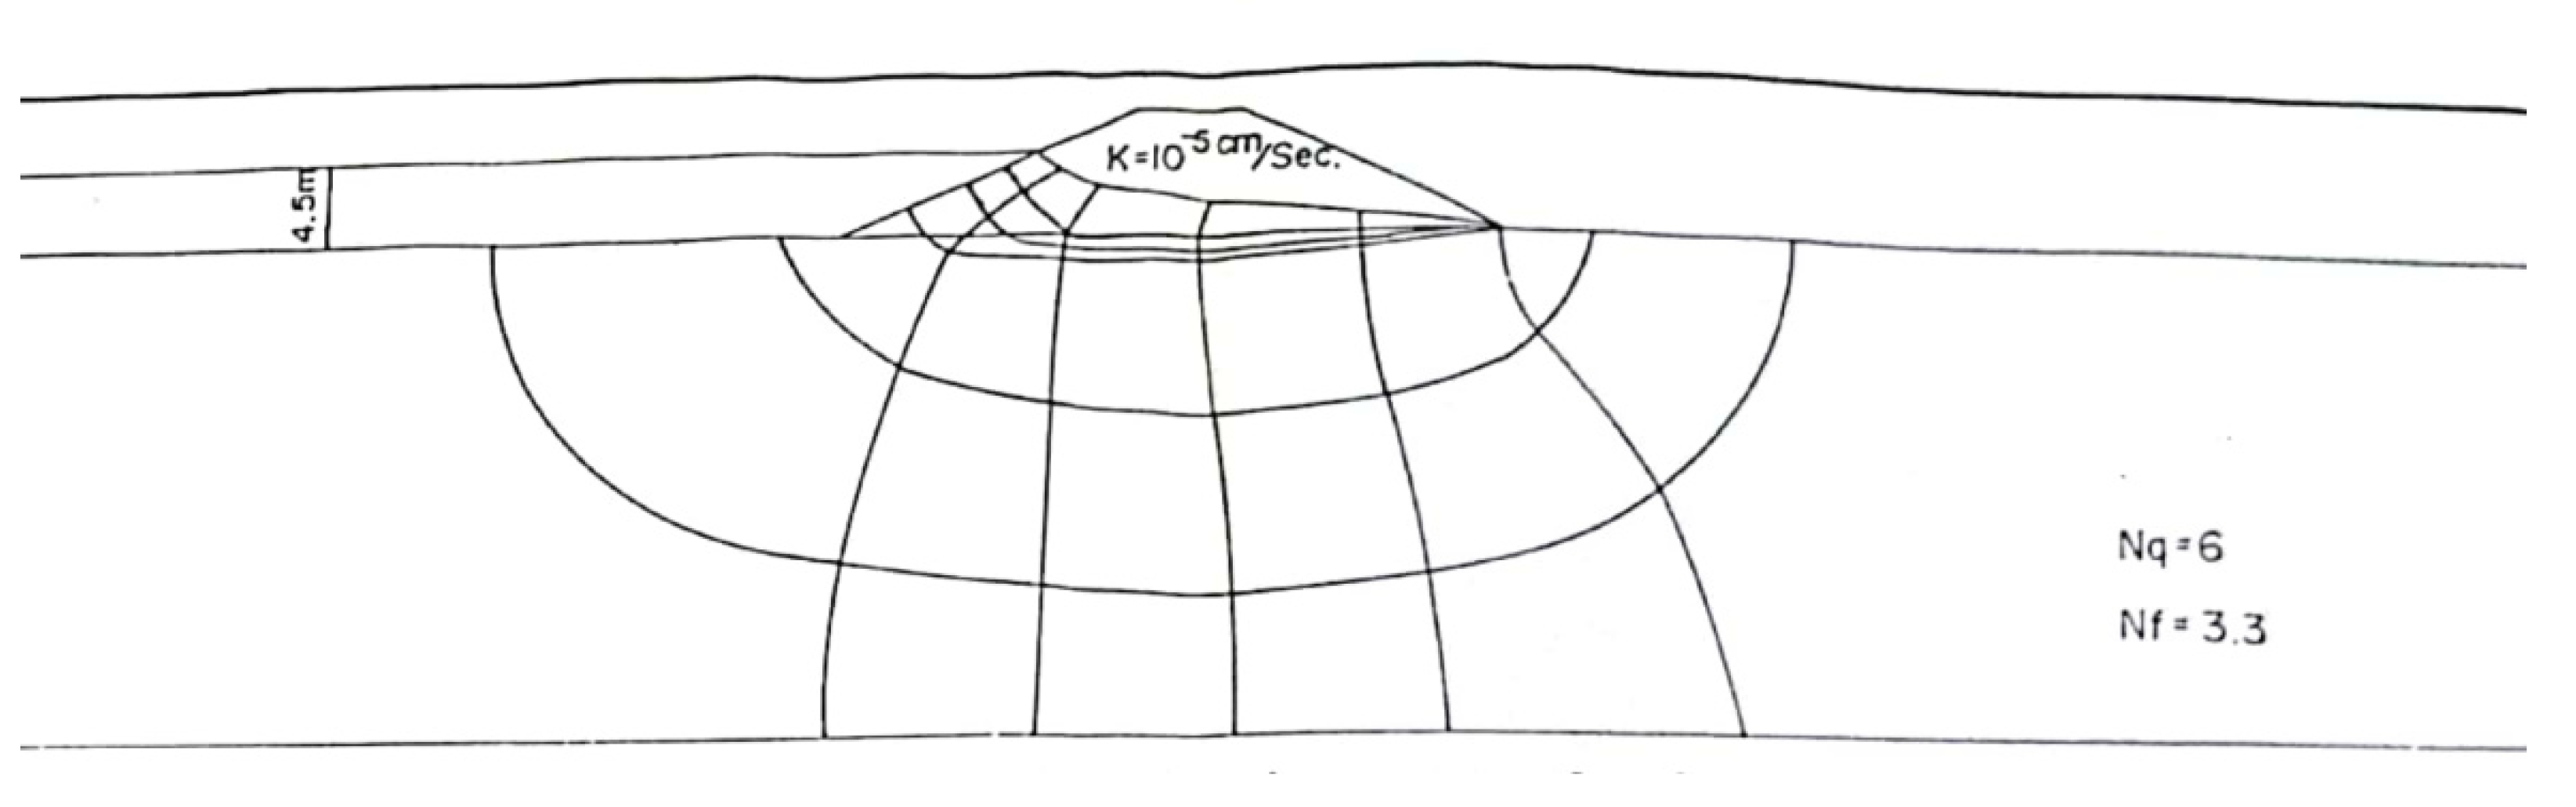
4.7. Leakage Analysis
The submerged area of the Qionglin Reservoir dam is placed on the soil foundation (multi-layer, CL). The drilling data in Section 4.3 and Figure 3 show that there is still a thin layer in front of the dam, which may cause leakage. Therefore, this article discusses the leakage analysis of the dam and the leakage analysis of the head difference (hydraulic gradient) caused by the groundwater level:
- Case 1:
- Analysis of dam leakage: when the reservoir water level is full (EL = 26.5m), leakage will occur due to the hydraulic gradient, and at this time, the groundwater level will raise and maintain at the bottom of the reservoir (EL = 21.5m).
The leakage analysis of the dam is as follows: the basic assumptions are as follows, and the flow net is shown in Figure 13.
- (1)
- The permeability coefficient of the reservoir bottom and the dam K = 1 × 10⁻⁵ cm/s.
- (2)
- The permeable layer at the bottom of the reservoir is assumed to be 30 m deep.
- (3)
- The dam leakage analysis width is 400 m.
- (4)
- Where I = hydraulic gradient, A = grid area, Nf = number of flow channel, Nq = number of potential drop, h = the difference between upstream and downstream heads, L = Seepage path length.
Nq = 6 Nf = 3.3 h = 4.5
Calculation the annual seepage volume, when the dam leakage width is set to be 400 m,
Q = 400 × 2.475 × 10−6 × 86,400 × 365 = 3.1 × 10⁴ m3/year = 31,000 m3/year
- Case 2:
- Leakage analysis at the bottom of the reservoir: if the reservoir does not have water all year round and the ground water recharge is insufficient, the groundwater level will not be maintained on the ground but will be located at between EL = 21.5–14.5m.
The leakage amount analysis of the reservoir bottom is as follows: the basic assumptions are as follows
- (1)
- Permeability coefficient of the reservoir bottom K = 1 × 10⁻⁵ cm/s
- (2)
- The average thickness of the impermeable layer (CL) at the bottom of the reservoir is 5 m
- (3)
- The average submerged area of the reservoir bottom is A = 51,371 m2 (where A = 3355 m2 (EL = 21.5), A = 99,387 m2 (EL = 26))
From the above calculation, it can be seen that when Qionglin Reservoir is full all year round, the annual leakage of the dam is 31,000 m3/year. However, when there is a small amount of water in the reservoir all the year round, leakage occurs due to the hydraulic gradient of groundwater, the annual leakage is 22,700 m3/year in the bottom of the reservoir. Although all the leakage is not large, the reservoir management unit must pay attention to this problem, such as by implementing the leakage prevention improvement project at the bottom of the reservoir.
5. Conclusions and Suggestions
5.1. Conclusions
In order to investigate whether there is any leakage and abnormal impoundment function in Qionglin Reservoir, a series of tests and investigations were conducted in this study, including electrical resistivity tomography, tracer leakage test, geological drilling test, long-term observation of reservoir water level and analysis, field investigation of the catchment area and dam of the reservoir, and pumping test of downstream stilling basin. The test results and investigation results showed that no leakage path and leakage were found. In this study, the earth resistance shows no significant leakage path in the dam; therefore, it was estimated that there should be no leakage in the dam. According to the tracer test, the dam and spillway structure was still in good condition, and there was no significant leakage path. By comparing the geological drilling data of four new holes with the existing drilling results, the soil distribution in strata is basically the same. According to relevant tests, there is a CL impermeable layer about 5 m thick at the bottom of the reservoir (permeability coefficient 10−5–10−6 cm/s), indicating that it did meet the compaction density requirements and effectively reduced the water permeability when the reservoir bottom was backfilled. In addition, large-scale leakage is less likely to happen after the leakage prevention and improvement works. Based on the long-term observation of the reservoir water level, it is estimated that the leakage loss of the reservoir is about 200–500 tons per day, in a reasonable evaporation range. According to the inspection of the existing concrete structure of the reservoir, there are significant leakage traces in the walls on the left and right sides of the downstream spillway, and water constantly accumulates in the stilling basin at the bottom of the spillway. Therefore, this study conducts a tracer test to determine whether there are some leakage paths and a pumping test to examine the leakage. According to the test results, at the current low water level, the spillway is still in good condition, and there is no significant leakage path. Based on the long-term observation of the reservoir water level, compared with the water level changes of other reservoirs in the island, the water level changes of Qionglin Reservoir are normal. Moreover, after comparing it with all reservoirs and comparing its declining trend with the precipitation and evaporation, the reservoir water level trend is within a reasonable range. Based on the above series of tests and investigations, Qionglin Reservoir has no serious leakage, the spillway and dam are in good condition, and no significant leakage path is found.
Although no significant leakage was found according to the test and investigation results, the field investigation in this study shows that the continuous human exploitation in the catchment area has greatly changed the topography and landform, and many ditches and low-lying lands in the catchment area have become dry. On the west side of the reservoir, the new built road has blocked the inflow of runoff. On the south side of the reservoir, due to the existing topographic changes, trench terrain destruction and discontinuous rainfall, it is difficult to create runoff to replenish the reservoir water level. In the catchment area on the south side of the reservoir, due to the lack of overall agricultural drain planning, water storage by farmers of some agricultural ponds for irrigation, it is difficult to replenish the water in the catchment area to the reservoir. At present, the catchment area is continuously reduced due to development behaviors, and the agricultural husbandry, farming and public works construction in the catchment area have negative influences on the runoff into the reservoir, and it may be difficult for the discontinuous rainfall to create the runoff to replenish the reservoir water level.
5.2. Suggestions
Leakage is the most serious problem in reservoir operation, because heavy leakage influences reservoir impoundment efficiency and even leads to a complete loss of reservoir functions. A reservoir leaks for complicated reasons. Once there is any leakage, a comprehensive and thorough inspection must be carried out for the reservoir, to find out the causes of leakage and to improve according to the causes of leakage. Wrong improvements which cannot solve leakage and waste a lot of money should be avoided.
Since its completion in 1982, Qionglin Reservoir has never been fully filled with water except in the spring of 1983 when it was full of water due to heavy rain. The reservoir management unit suspected that its side slopes, bottom or dam might leak and carried out a number of leakage prevention and improvement works, but all of them failed to fulfill the impoundment of the reservoir. Hence, through a series of tests and investigations, this study attempts to find out the reasons why the reservoir cannot impound water. According to the results of tests and the investigation, no leakage path and leakage have been found. By analysis, the reservoir has no serious leakage. The main reason for the failure of impoundment is the improper development of the catchment area, which influences the runoff flowing into the reservoir. Hence, it is suggested in this study that, the reservoir management unit should not spend a lot of money on leakage improvement, and improvements should be made in the future according to the reasons why the reservoir cannot impound, including the overall catchment project works in the catchment area, the water interception and diversion works planning to replenish the reservoir water and the reservoir structure crack reinforcement works. In the future, we can also try to investigate the interaction between Qionglin Reservoir and groundwater through numerical simulation [26,27]. When Qionglin Reservoir is full all year round or when there is a small amount of water in the reservoir all the year round, leakage occurs due to the hydraulic gradient of groundwater. Although all the leakage is not large, the reservoir management unit must pay attention to this problem, such as by implementing the leakage prevention improvement project at the bottom of the reservoir.
Author Contributions
Conceptualization, T.-T.C.; methodology, Y.-C.H.; modeling Y.-C.H.; software, T.-F.T. and H.-X.C.; data analysis Y.-C.H. and T.-T.C.; conclusions, T.-F.T. and Y.-C.H.; electrology consultation, T.-F.T. All authors have read and agreed to the published version of the manuscript.
Funding
This research received no external funding.
Institutional Review Board Statement
Not applicable.
Informed Consent Statement
Informed consent was obtained from all subjects.
Conflicts of Interest
The authors declare no conflict of interest.
References
- Abedian, H.; Karami, G.H.; Karimi, H. The effect of scale on the water leakage from the reservoir and abutment of Beheshtabad Dam. Bull. Int. Assoc. Eng. Geol. 2019, 78, 5569–5581. [Google Scholar] [CrossRef]
- Mozafari, M.; Raeisi, E.; Guerrero, J. Contribution of spectral coherency analysis and tracer test to study leakage at the Doosti Dam reservoir, Iran and Turkmenistan. Environ. Earth Sci. 2018, 77, 139. [Google Scholar] [CrossRef]
- Pan, K.L. General Theory of Engineering Geology; Wu Nan Books: Taipei, Taiwan, 2013. [Google Scholar]
- Lin, C.-H.; Lin, C.-P.; Hung, Y.-C.; Chung, C.-C.; Wu, P.-L.; Liu, H.-C. Application of geophysical methods in a dam project: Life cycle perspective and Taiwan experience. J. Appl. Geophys. 2018, 158, 82–92. [Google Scholar] [CrossRef]
- Adamo, N.; Al-Ansari, N.; Sissakian, V.; Laue, J.; Knutsson, S. Geophysical Methods and their Applications in Dam Safety Monitoring. J. Earth Sci. Geotech. Eng. 2021, 11, 291–345. [Google Scholar] [CrossRef]
- Song, S.-H.; Song, Y.; Kwon, B.-D. Application of hydrogeological and geophysical methods to delineate leakage pathways in an earth fill dam. Explor. Geophys. 2005, 36, 92–96. [Google Scholar] [CrossRef]
- Voronkov, O.K.; Kagan, A.A.; Krivonogova, V.B.; Prokopovich, V.S. Geophysical methods and identification of embankment damparameters. In Proceedings of the ISC-2 on Geotechnical and Geophysical Site Characterization, Porto, Portugal, 19–22 September 2004; pp. 593–599. [Google Scholar]
- Lin, C.-P.; Hung, Y.-C.; Yu, Z.-H. Investigation of Abnormal Seepages in an Earth Dam using Resistivity Tomography. J. Geoengin. 2013, 8, 61–70. [Google Scholar]
- Sill, W.R. Resistivity Measurements before and after Injection Test 5 at Raft River KGRA, Idaho; Final Report; Technical Information Center: Oak Ridge, TN, USA, 1983. [Google Scholar]
- Sailhac, P.; Marquis, G. Analytic potentials for the forward and inverse modeling of SP anomalies caused by subsurface fluid flow. Geophys. Res. Lett. 2001, 28, 1851–1854. [Google Scholar] [CrossRef] [Green Version]
- Danielsen, J.E.; Auken, E.; Jørgensen, F.; Søndergaard, V.; Sørensen, K.I. The application of the transient electromagnetic method in hydrogeophysical surveys. J. Appl. Geophys. 2003, 53, 181–198. [Google Scholar] [CrossRef]
- Chih-Hsin, H.; Sheng-Hsung, H.; Chih-Hsien, H.; Huang, J.K.; Lin, C.M. Application of Elastic Wave Tomography for Dam Safety. In Proceedings of the Symposium on the Application of Geophysics to Engineering and Environmental Problems 2012, Tucson, AZ, USA, 25–29 March 2012. [Google Scholar]
- Wang, H.; Hsieh, S.H.; Hu, C.H.; Tsai, Y.C. Tracing Developing Deterioration Zones in a Damaged Dam by Using Elastic Wave Tomography. IOP Conf. Ser. Mater. Sci. Eng. 2019, 615, 012077. [Google Scholar] [CrossRef]
- Netto, L.G.; Gandolfo, O.C.B.; Filho, W.M.; Dourado, J.C. Non-Destructive Investigation on Small Earth Dams Using Geophysical Methods: Seismic Surface Wave Multichannel Analysis (Masw) And S-Wave Refraction Seismic Methods. Braz. J. Geophys. 2020, 38, 5–19. [Google Scholar] [CrossRef]
- Oh, Y.C.; Jeong, H.S.; Lee, Y.K.; Shon, H. Safety evaluation of rock-fill dam by seismic (MASW) and resistivity method. In Proceedings of the 16th EEGS Symposium on the Application of Geophysics to Engineering and Environmental Problems, San Antonio, TX, USA, 6–10 April 2003; pp. 1377–1386. [Google Scholar]
- Aal, G.Z.A.; Ismail, A.M.; Anderson, N.L.; Atekwana, E.A. Geophysical investigation of seepage from an earth fill dam. J. Appl. Geophys. 2003, 44, 167–180. [Google Scholar]
- Lin, C.-P.; Hung, Y.-C.; Yu, Z.-H. Performance of 2D ERT in Investigation of Abnormal Seepage: A Case Study at the Hsin-Shan Earth Dam in Taiwan. J. Environ. Eng. Geophys. 2014, 9, 101–112. [Google Scholar] [CrossRef]
- Kass, W. Tracing Technique in Geohydrology; Balkema: Rotterdam, The Netherlands, 1998; p. 581. [Google Scholar]
- Ronchetti, F.; Piccinini, L.; Deiana, M.; Ciccarese, G.; Vincenzi, V.; Aguzzoli, A.; Malavasi, G.; Fabbri, P.; Corsini, A. Tracer test to assess flow and transport parameters of an earth slide: The Montecagno landslide case study (Italy). Eng. Geol. 2020, 275, 105749. [Google Scholar] [CrossRef]
- Stoeckl, L.; Pechstein, A.; Margane, A. Practice Guide for Tracer Tests in Groundwater; Technical Report No III; German-Vietnamese Technical Cooperation Project, Federal Institute for Geosciences and Natural Resources: Hannove, Germany, 2017. [Google Scholar]
- Divine, C.E.; Mcdonnell, J. The future of applied tracers in hydrogeology. Hydrogeol. J. 2005, 13, 255–258. [Google Scholar] [CrossRef]
- Chen, P.Y. Geological Manual of Kinmen Island and Lieyu Island; Work Report; Ministry of Economic Affairs: Taipei, Taiwan, 1970; pp. 7–19.
- Bowman, R.S. Evaluation of Some New Tracers for Soil Water Studies. Soil Sci. Soc. Am. J. 1984, 48, 987–993. [Google Scholar] [CrossRef]
- Whitmer, S.; Baker, L.; Wass, R. Loss of Bromide in a Wetland Tracer Experiment. J. Environ. Qual. 2000, 29, 2043–2045. [Google Scholar] [CrossRef]
- Flury, M.; Papritz, A. Bromide in the Natural Environment: Occurrence and Toxicity. J. Environ. Qual. 1993, 22, 747–758. [Google Scholar] [CrossRef]
- El-Zehairy, A.A.; Lubczynski, M.W.; Gurwin, J. Interactions of artificial lakes with groundwater applying an integrated MODFLOW solution. Hydrogeol. J. 2017, 26, 109–132. [Google Scholar] [CrossRef]
- Ala-Aho, P.; Rossi, P.M.; Isokangas, E.; Kløve, B. Fully integrated surface–subsurface flow modelling of groundwater–lake interaction in an esker aquifer: Model verification with stable isotopes and airborne thermal imaging. J. Hydrol. 2015, 522, 391–406. [Google Scholar] [CrossRef]
Figure 1.
(a) Location of Kinmen Island, (b) location of Qionglin Reservoir and (c) standard section of the dam.
Figure 1.
(a) Location of Kinmen Island, (b) location of Qionglin Reservoir and (c) standard section of the dam.

Figure 2.
Geological map of Qionglin Reservoir/Drilling locations of Qionglin Reservoir over the years.
Figure 2.
Geological map of Qionglin Reservoir/Drilling locations of Qionglin Reservoir over the years.

Figure 3.
A-A’ and F-F’ geologic cross-section of the dam of Qionglin Reservoir.

Figure 4.
Diagram of electrical resistivity tomography survey line layout. /Tracer application area, sampling points and Temphion smart sensor setting points.
Figure 4.
Diagram of electrical resistivity tomography survey line layout. /Tracer application area, sampling points and Temphion smart sensor setting points.

Figure 5.
Location of 10 reservoirs in Kinmen Island. /Catchment area of Qionglin Reservoir.

Figure 6.
Comparison between water levels and rainfall of Qionglin Reservoir.

Figure 7.
Results of line L1.

Figure 8.
Results of line L2.

Figure 9.
Diachronic diagram of bromide ion concentration on the left and right banks of the stilling basin by TempHion ISE.
Figure 9.
Diachronic diagram of bromide ion concentration on the left and right banks of the stilling basin by TempHion ISE.

Figure 10.
Groundwater level elevation changes.

Figure 11.
Geological fence diagram.

Figure 12.
Comparison between water levels and rainfall of 10 reservoirs in Kinmen Island.

Figure 13.
Seepage flow net diagram of dam and dam foundation of Qionglin Reservoir.

Publisher’s Note: MDPI stays neutral with regard to jurisdictional claims in published maps and institutional affiliations. |
© 2021 by the authors. Licensee MDPI, Basel, Switzerland. This article is an open access article distributed under the terms and conditions of the Creative Commons Attribution (CC BY) license (https://creativecommons.org/licenses/by/4.0/).
Share and Cite
MDPI and ACS Style
Hung, Y.-C.; Chen, T.-T.; Tsai, T.-F.; Chen, H.-X. A Comprehensive Investigation on Abnormal Impoundment of Reservoirs—A Case Study of Qionglin Reservoir in Kinmen Island. Water 2021, 13, 1463. https://doi.org/10.3390/w13111463
AMA Style
Hung Y-C, Chen T-T, Tsai T-F, Chen H-X. A Comprehensive Investigation on Abnormal Impoundment of Reservoirs—A Case Study of Qionglin Reservoir in Kinmen Island. Water. 2021; 13(11):1463. https://doi.org/10.3390/w13111463
Chicago/Turabian StyleHung, Yin-Chun, Tung-Tsan Chen, Tsai-Fu Tsai, and Hao-Xi Chen. 2021. "A Comprehensive Investigation on Abnormal Impoundment of Reservoirs—A Case Study of Qionglin Reservoir in Kinmen Island" Water 13, no. 11: 1463. https://doi.org/10.3390/w13111463
Note that from the first issue of 2016, this journal uses article numbers instead of page numbers. See further details here.