
Coastal Evolution in a Wetland Affected by Large Tsunamigenic Earthquakes in South-Central Chile: Criteria for Integrated Coastal Management

 , , , ,
Abstract
:1. Introduction
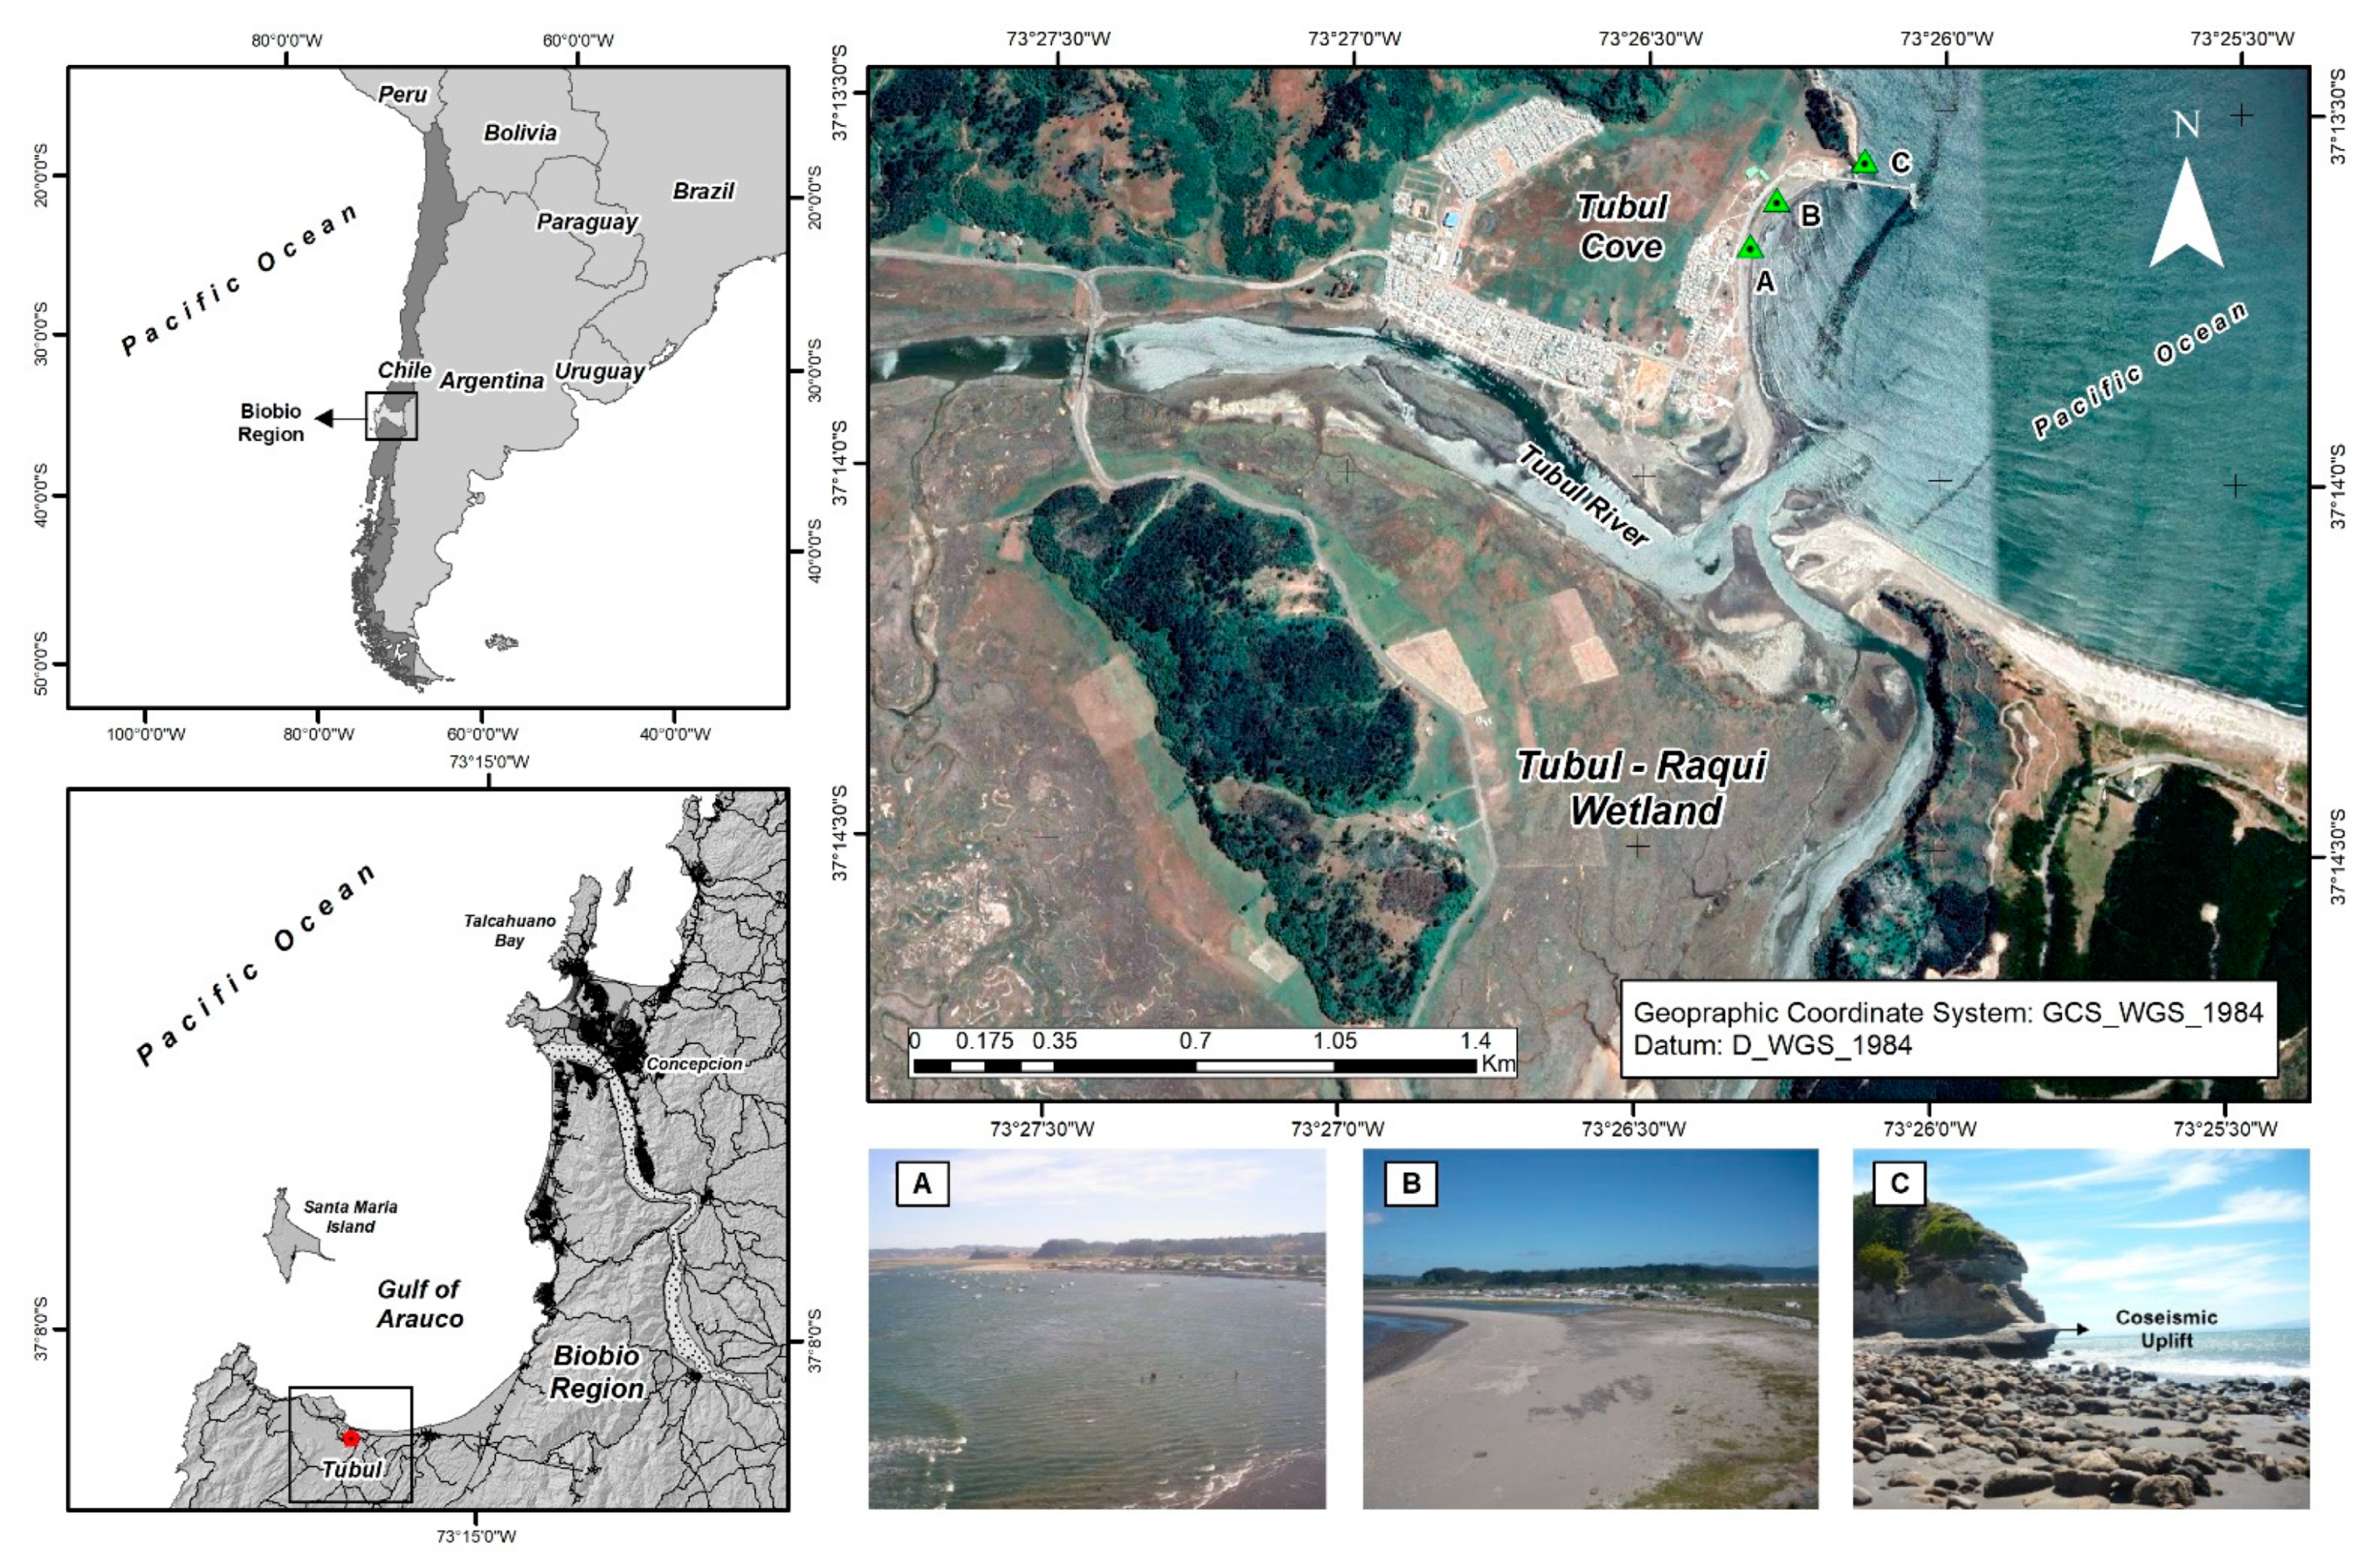
2. Geographical Context
3. Materials and Methods
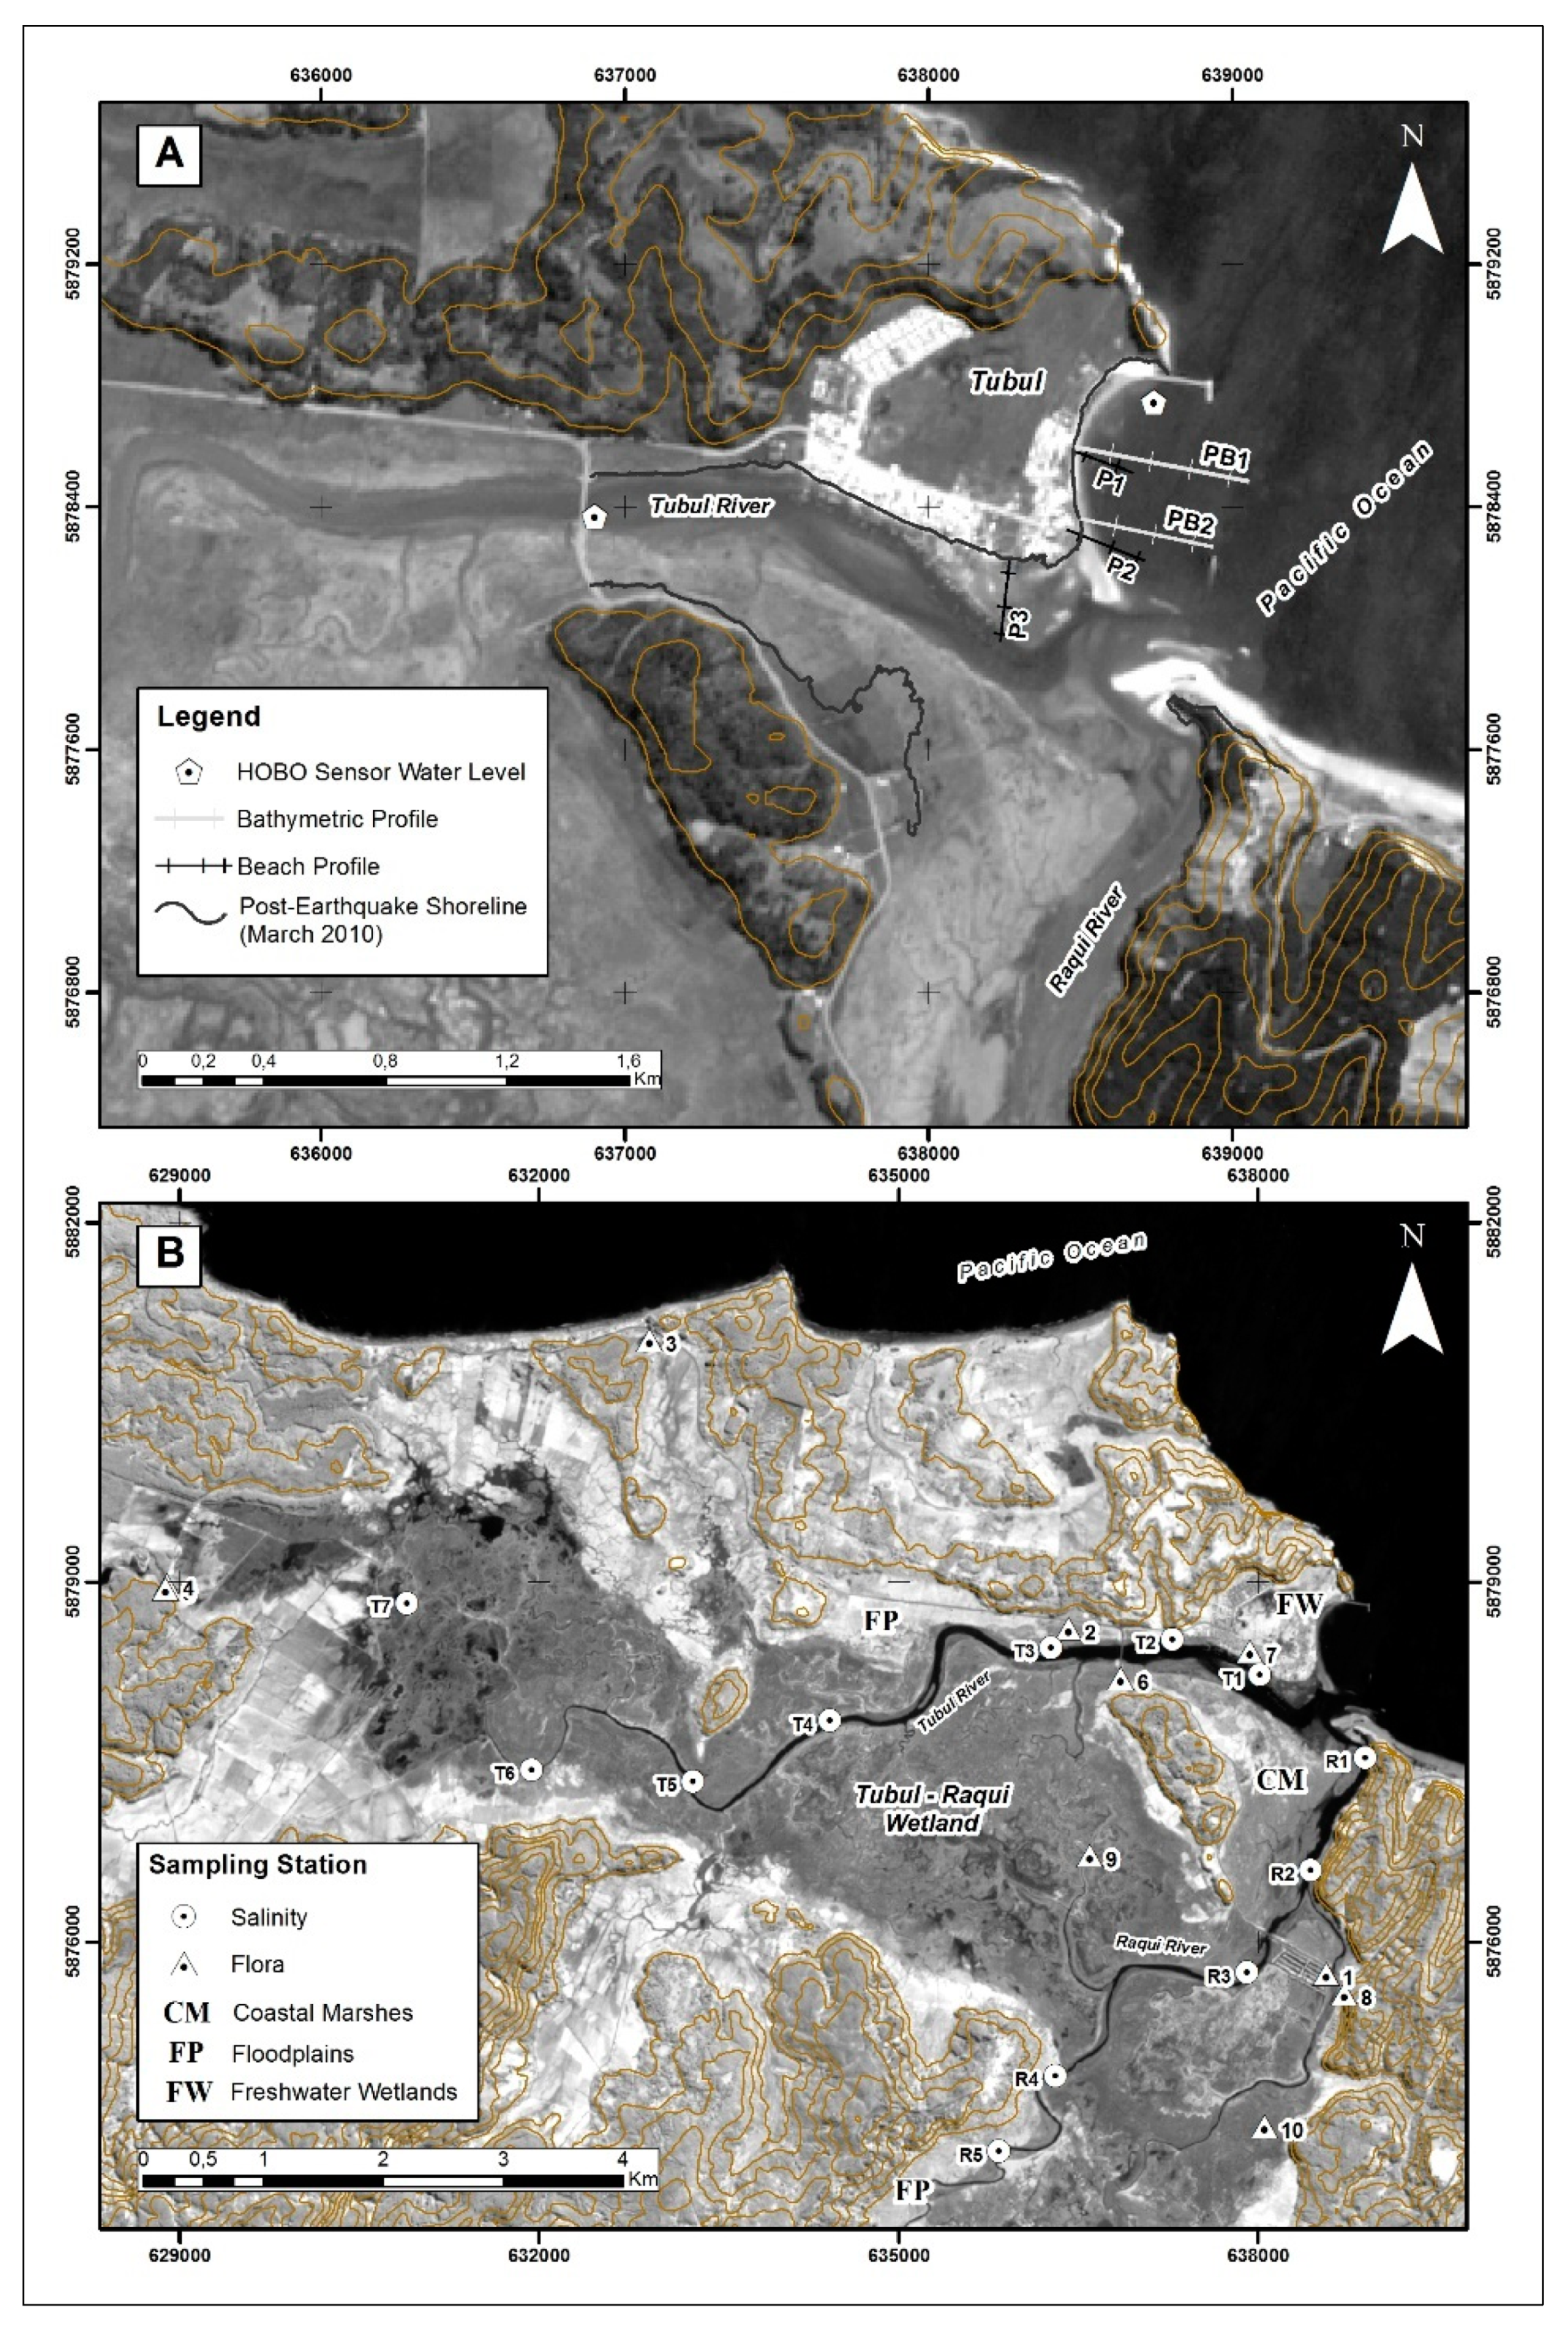
3.1. Field Data Collection
- (a)
- Morphological Changes
- (b)
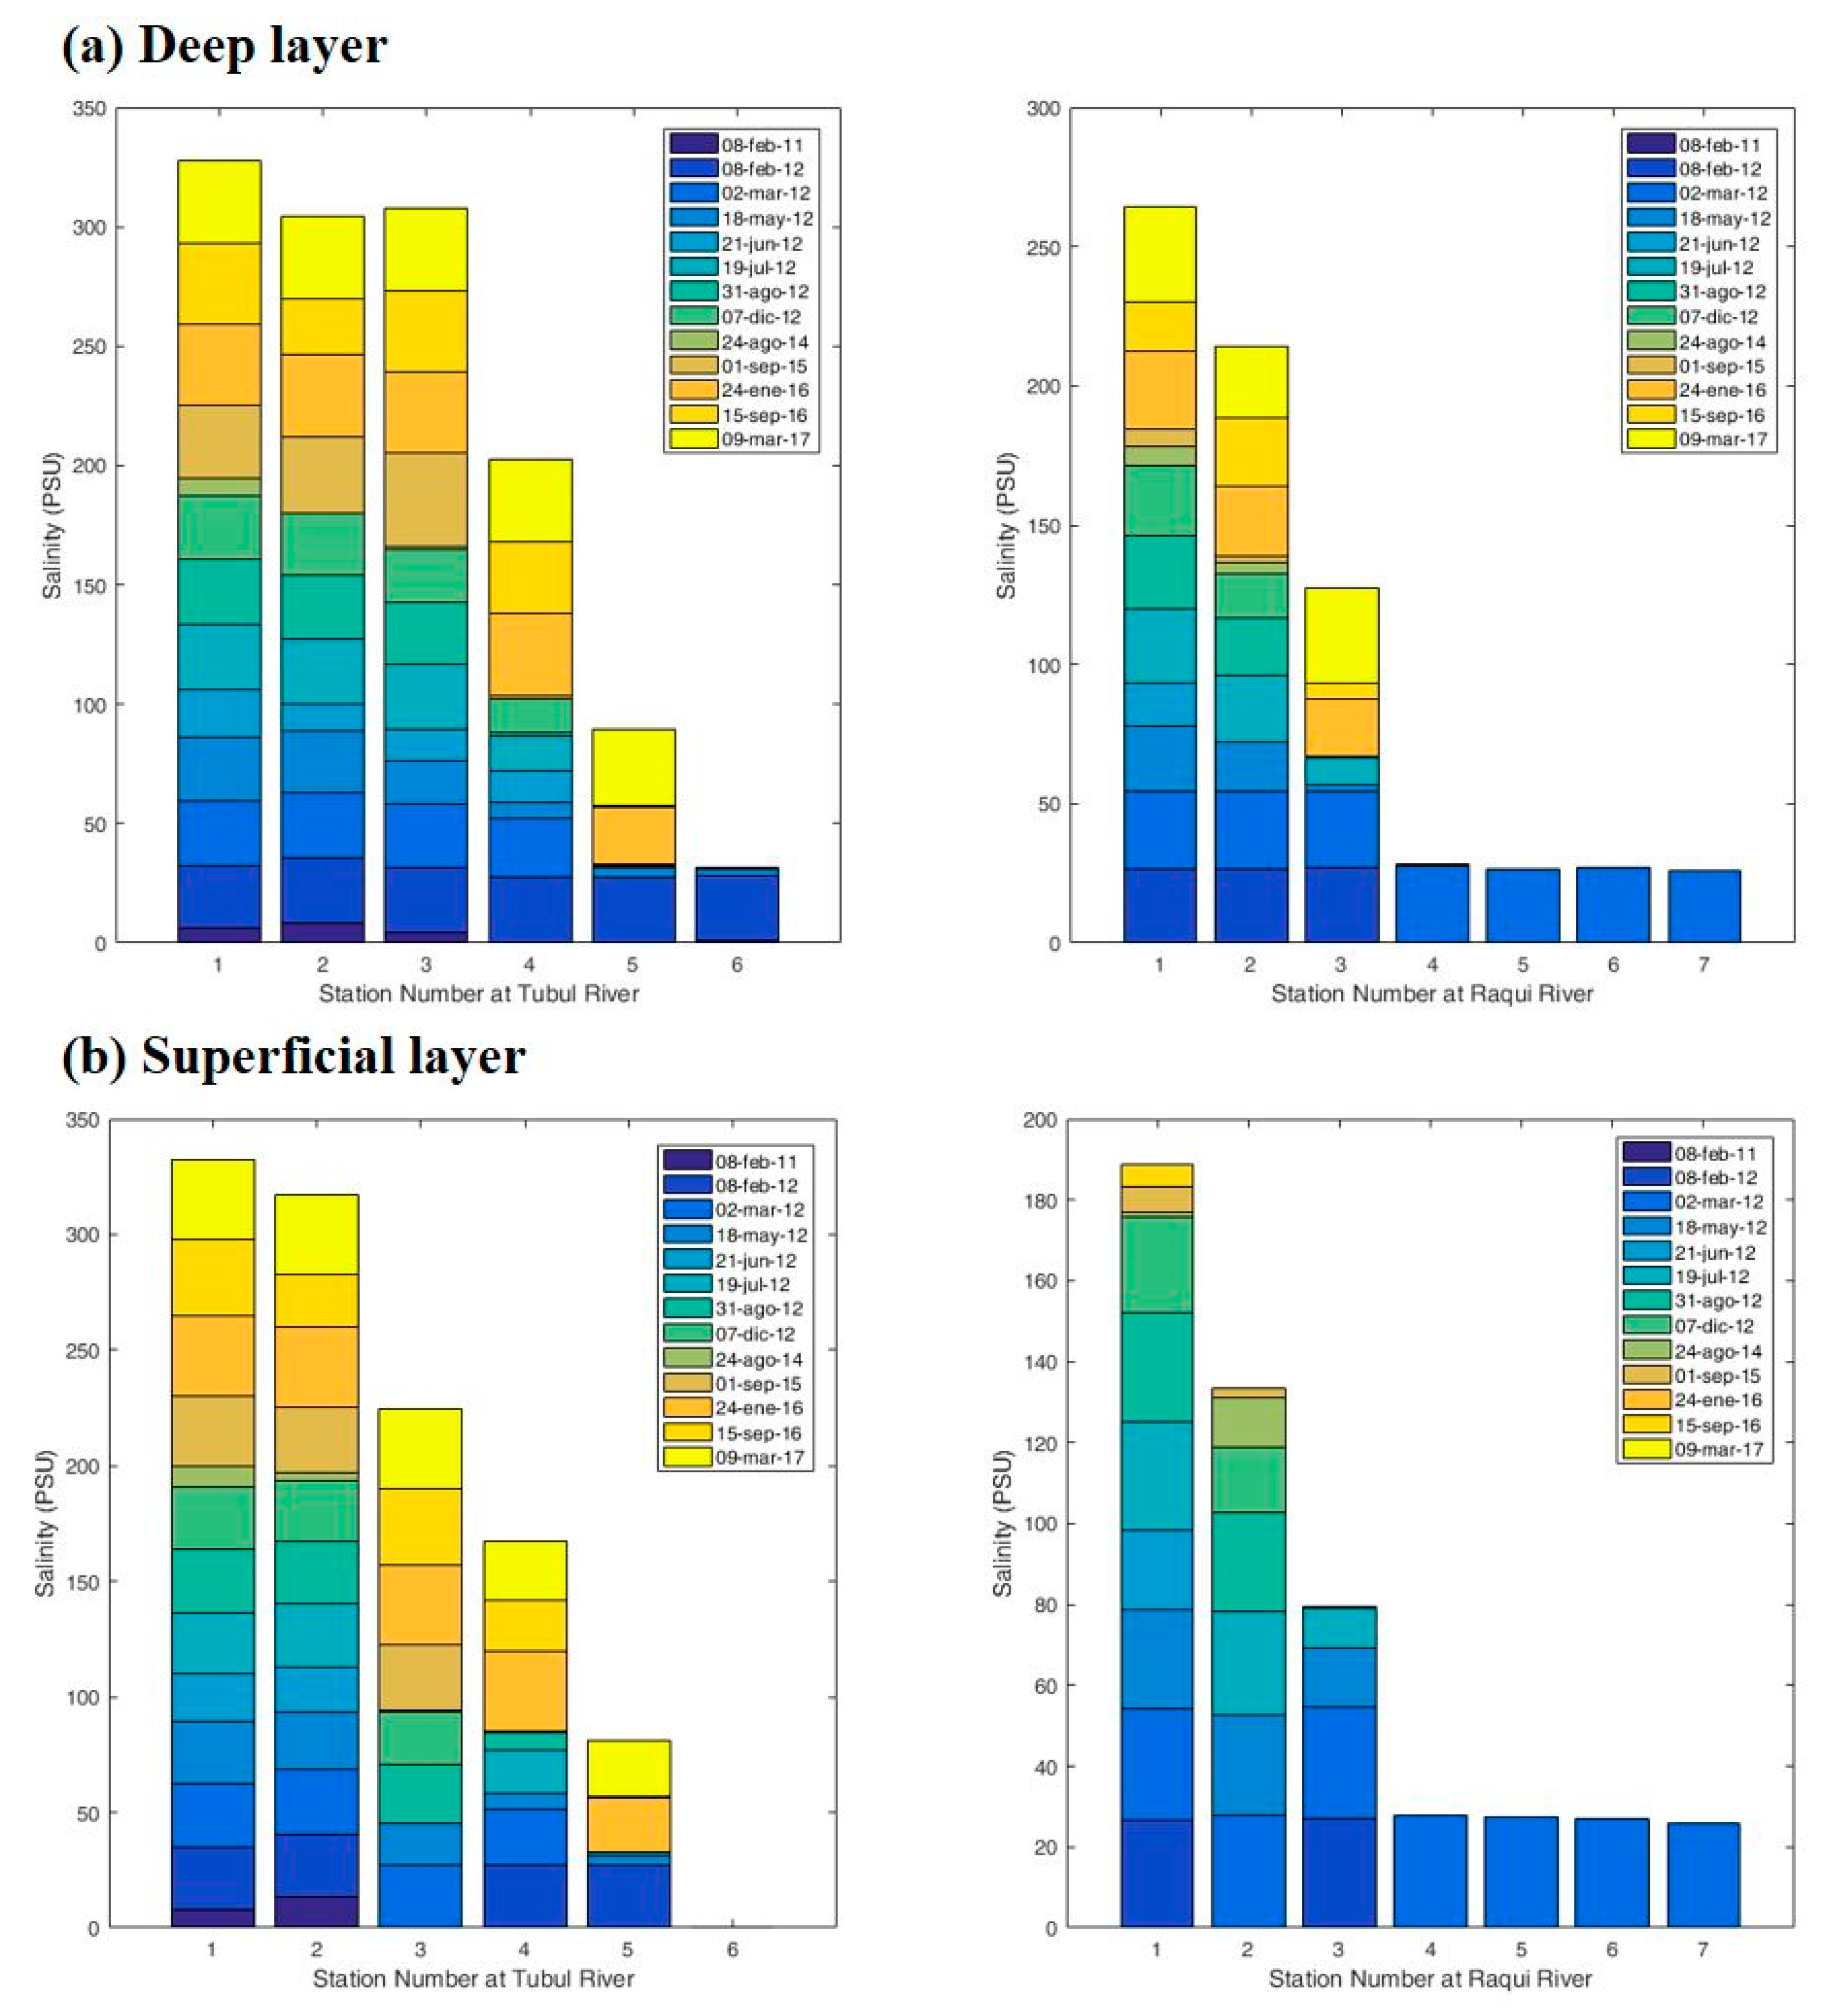
- Salinity and Recovery of Marine Intrusion
- (c)
- Floristic Studies
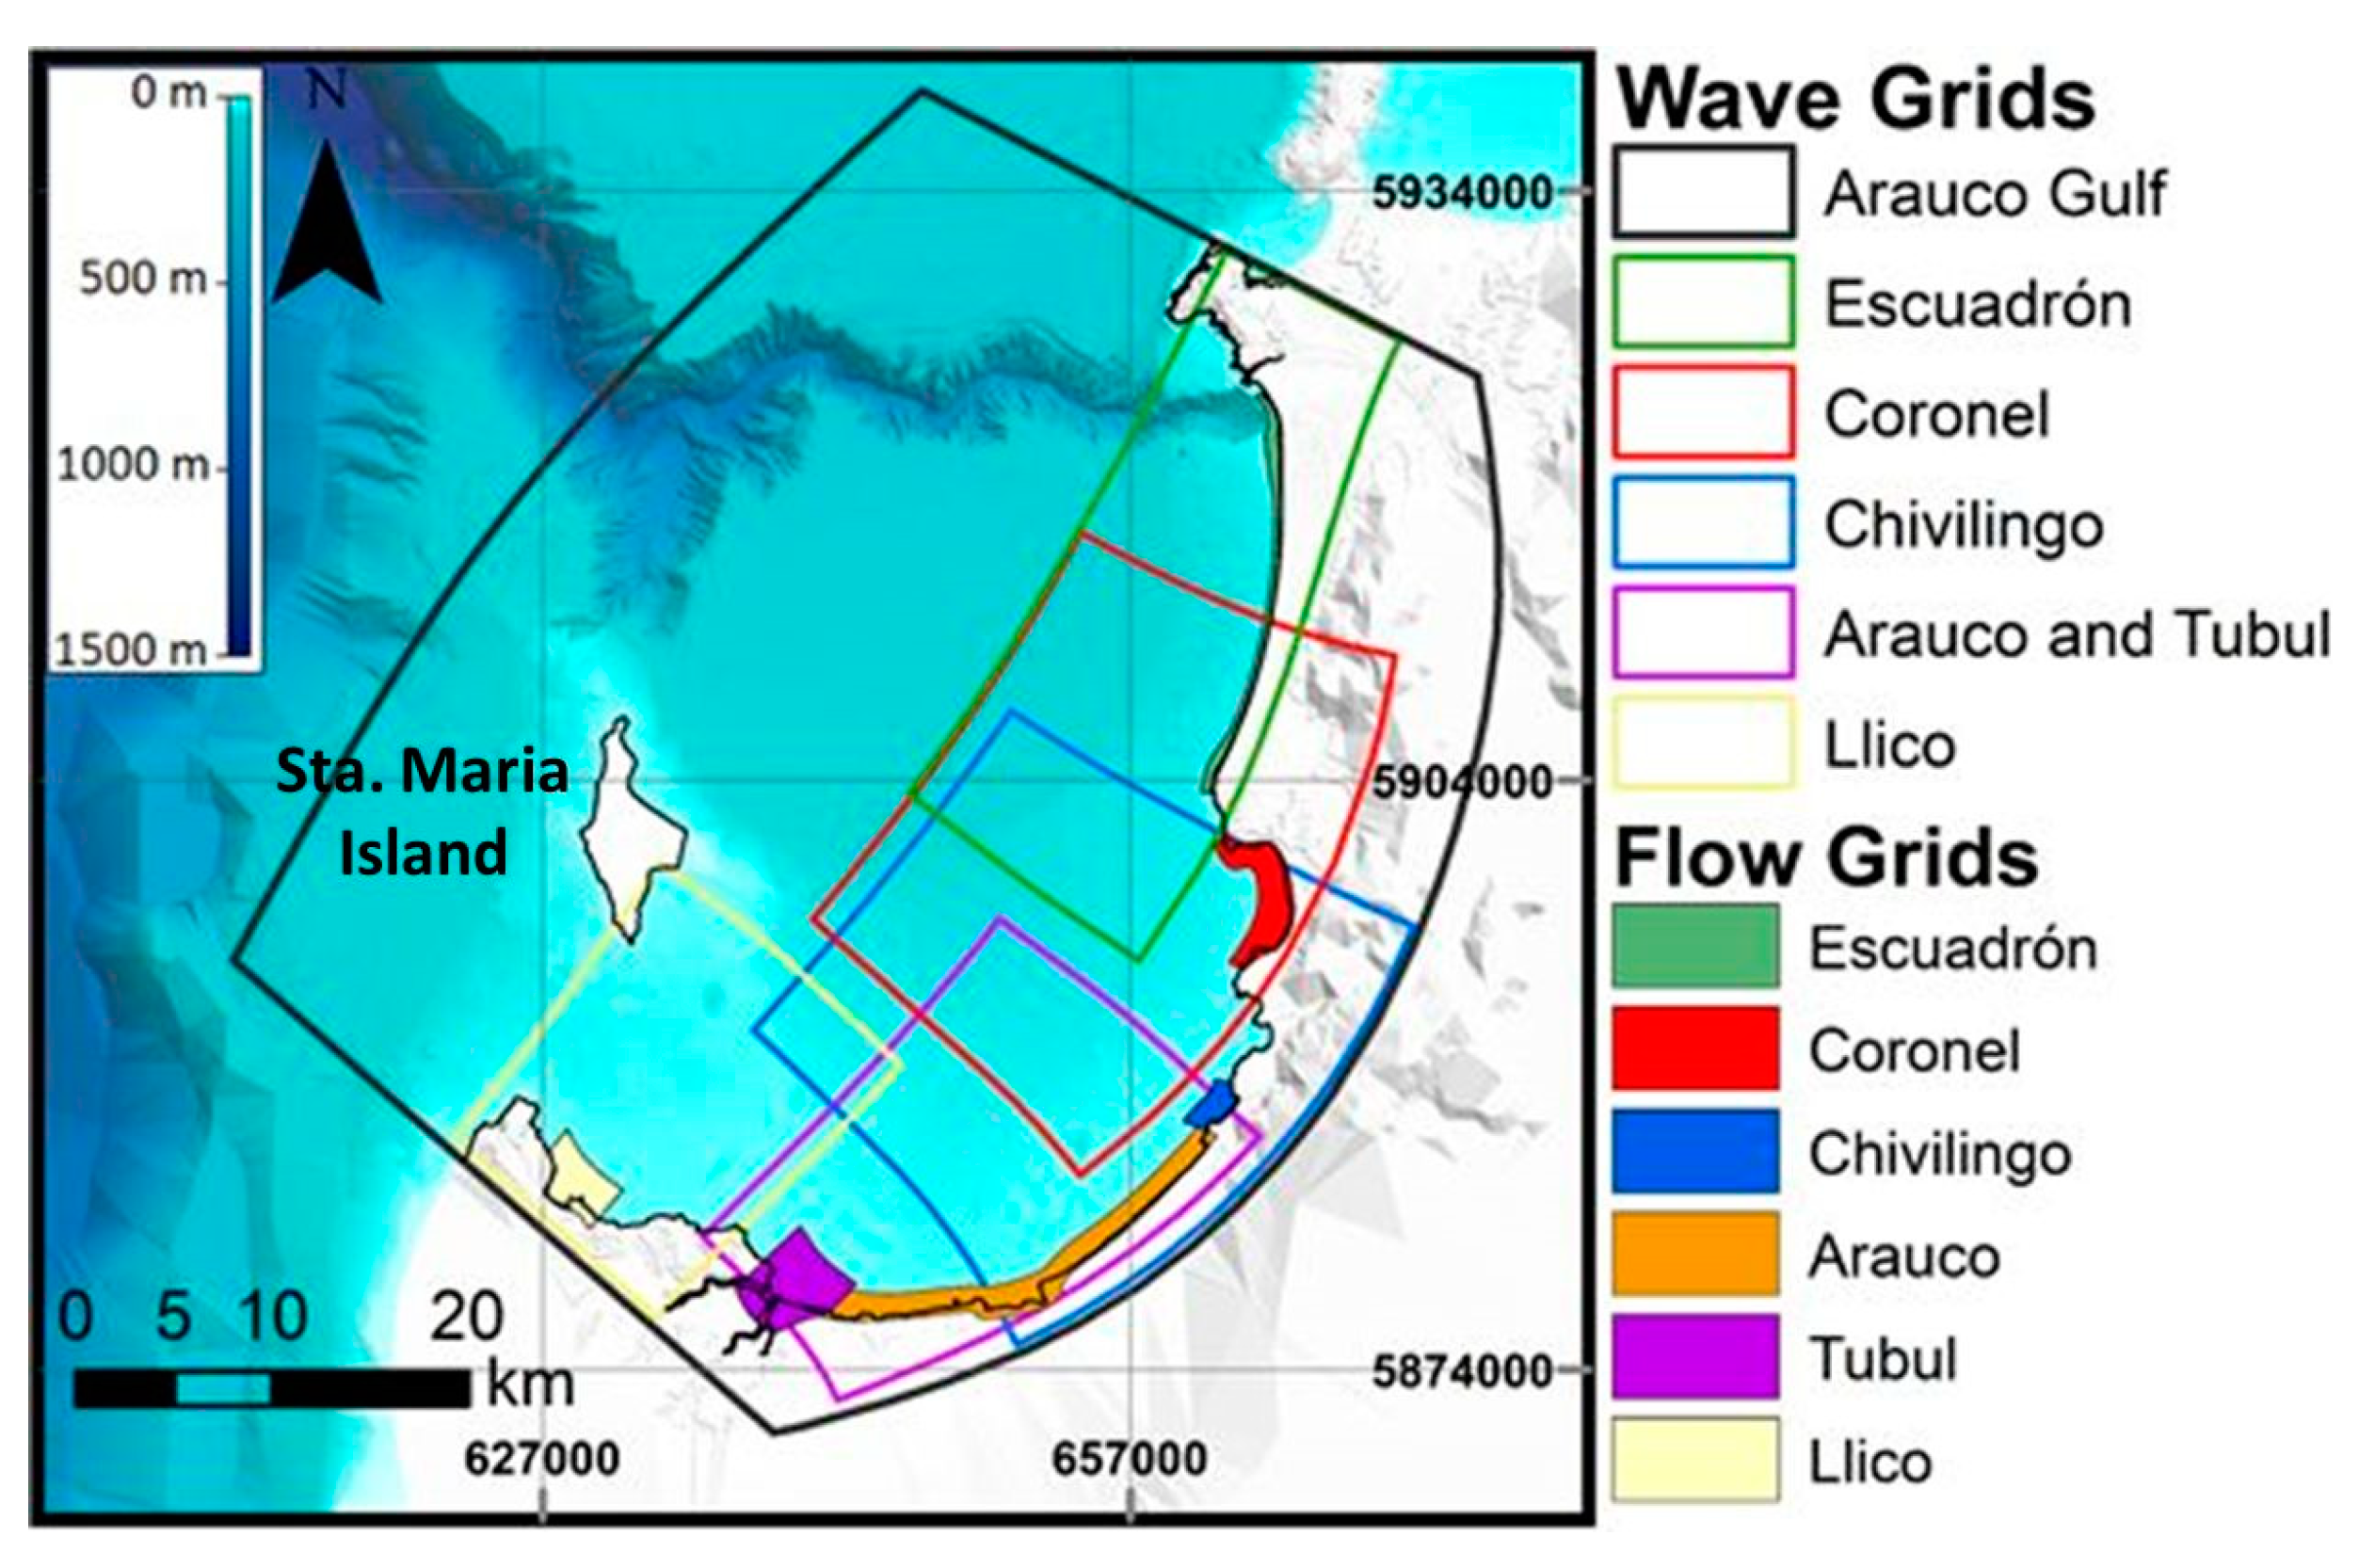
3.2. Numerical Modeling
4. Results
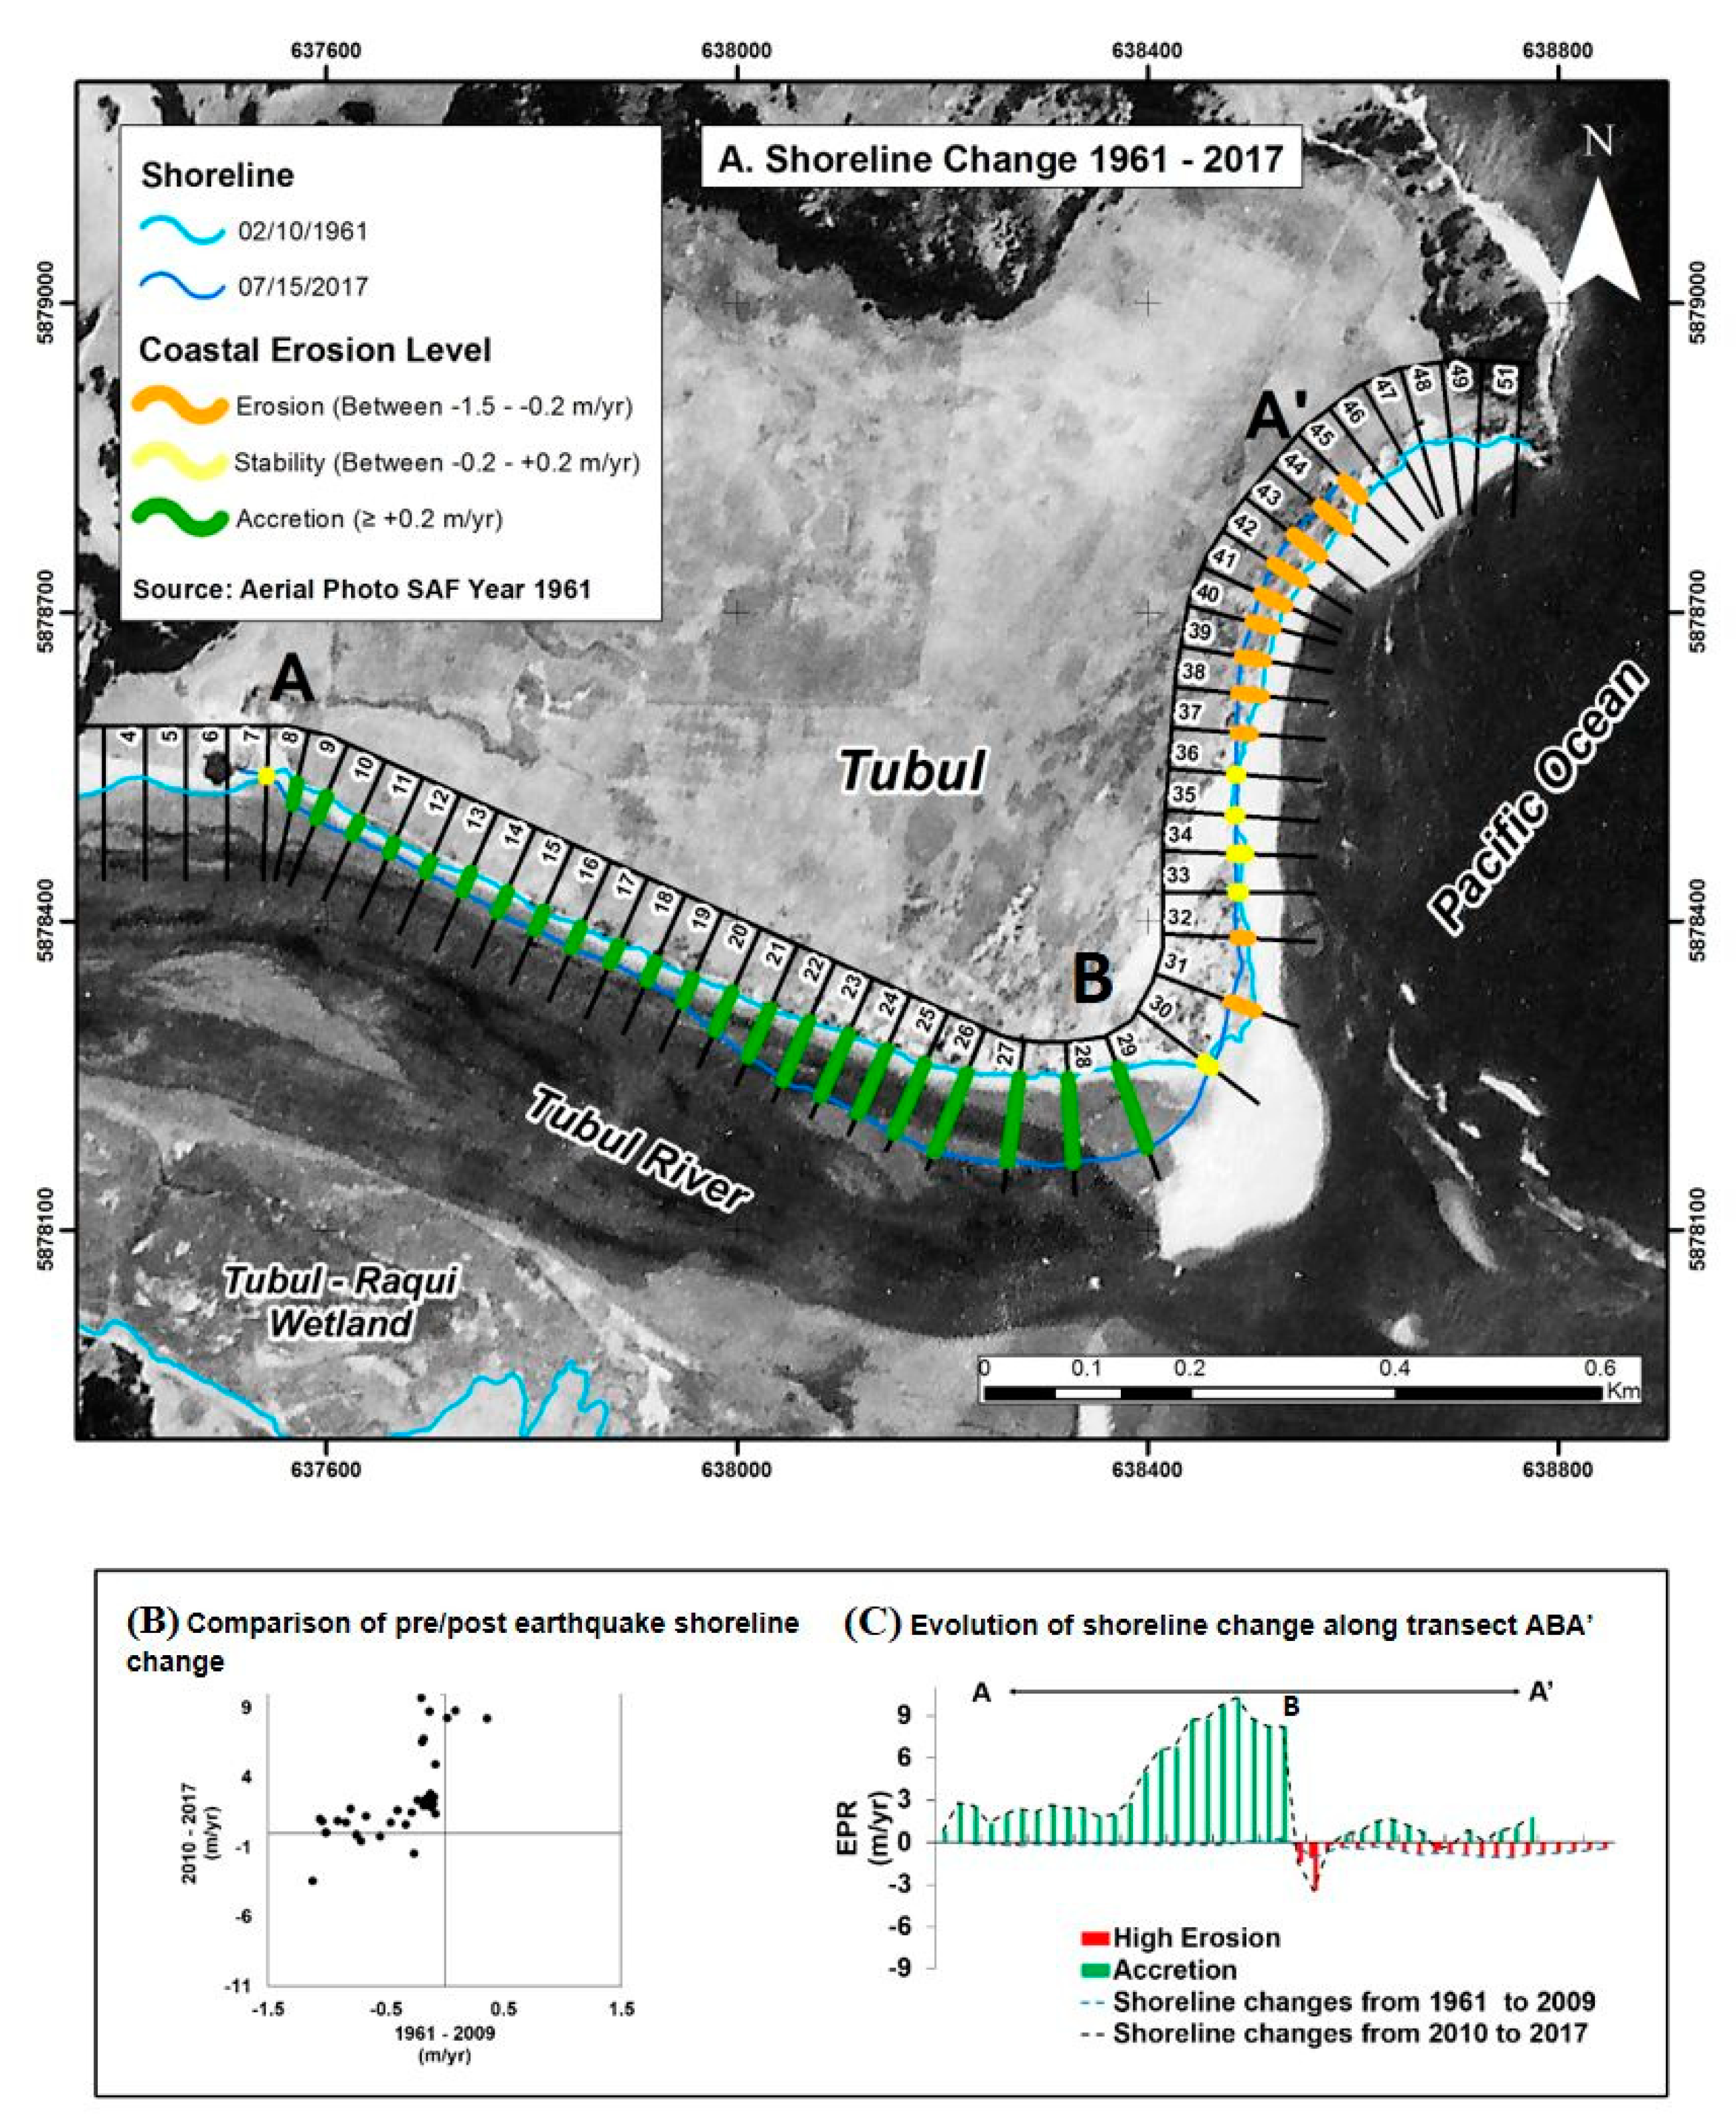
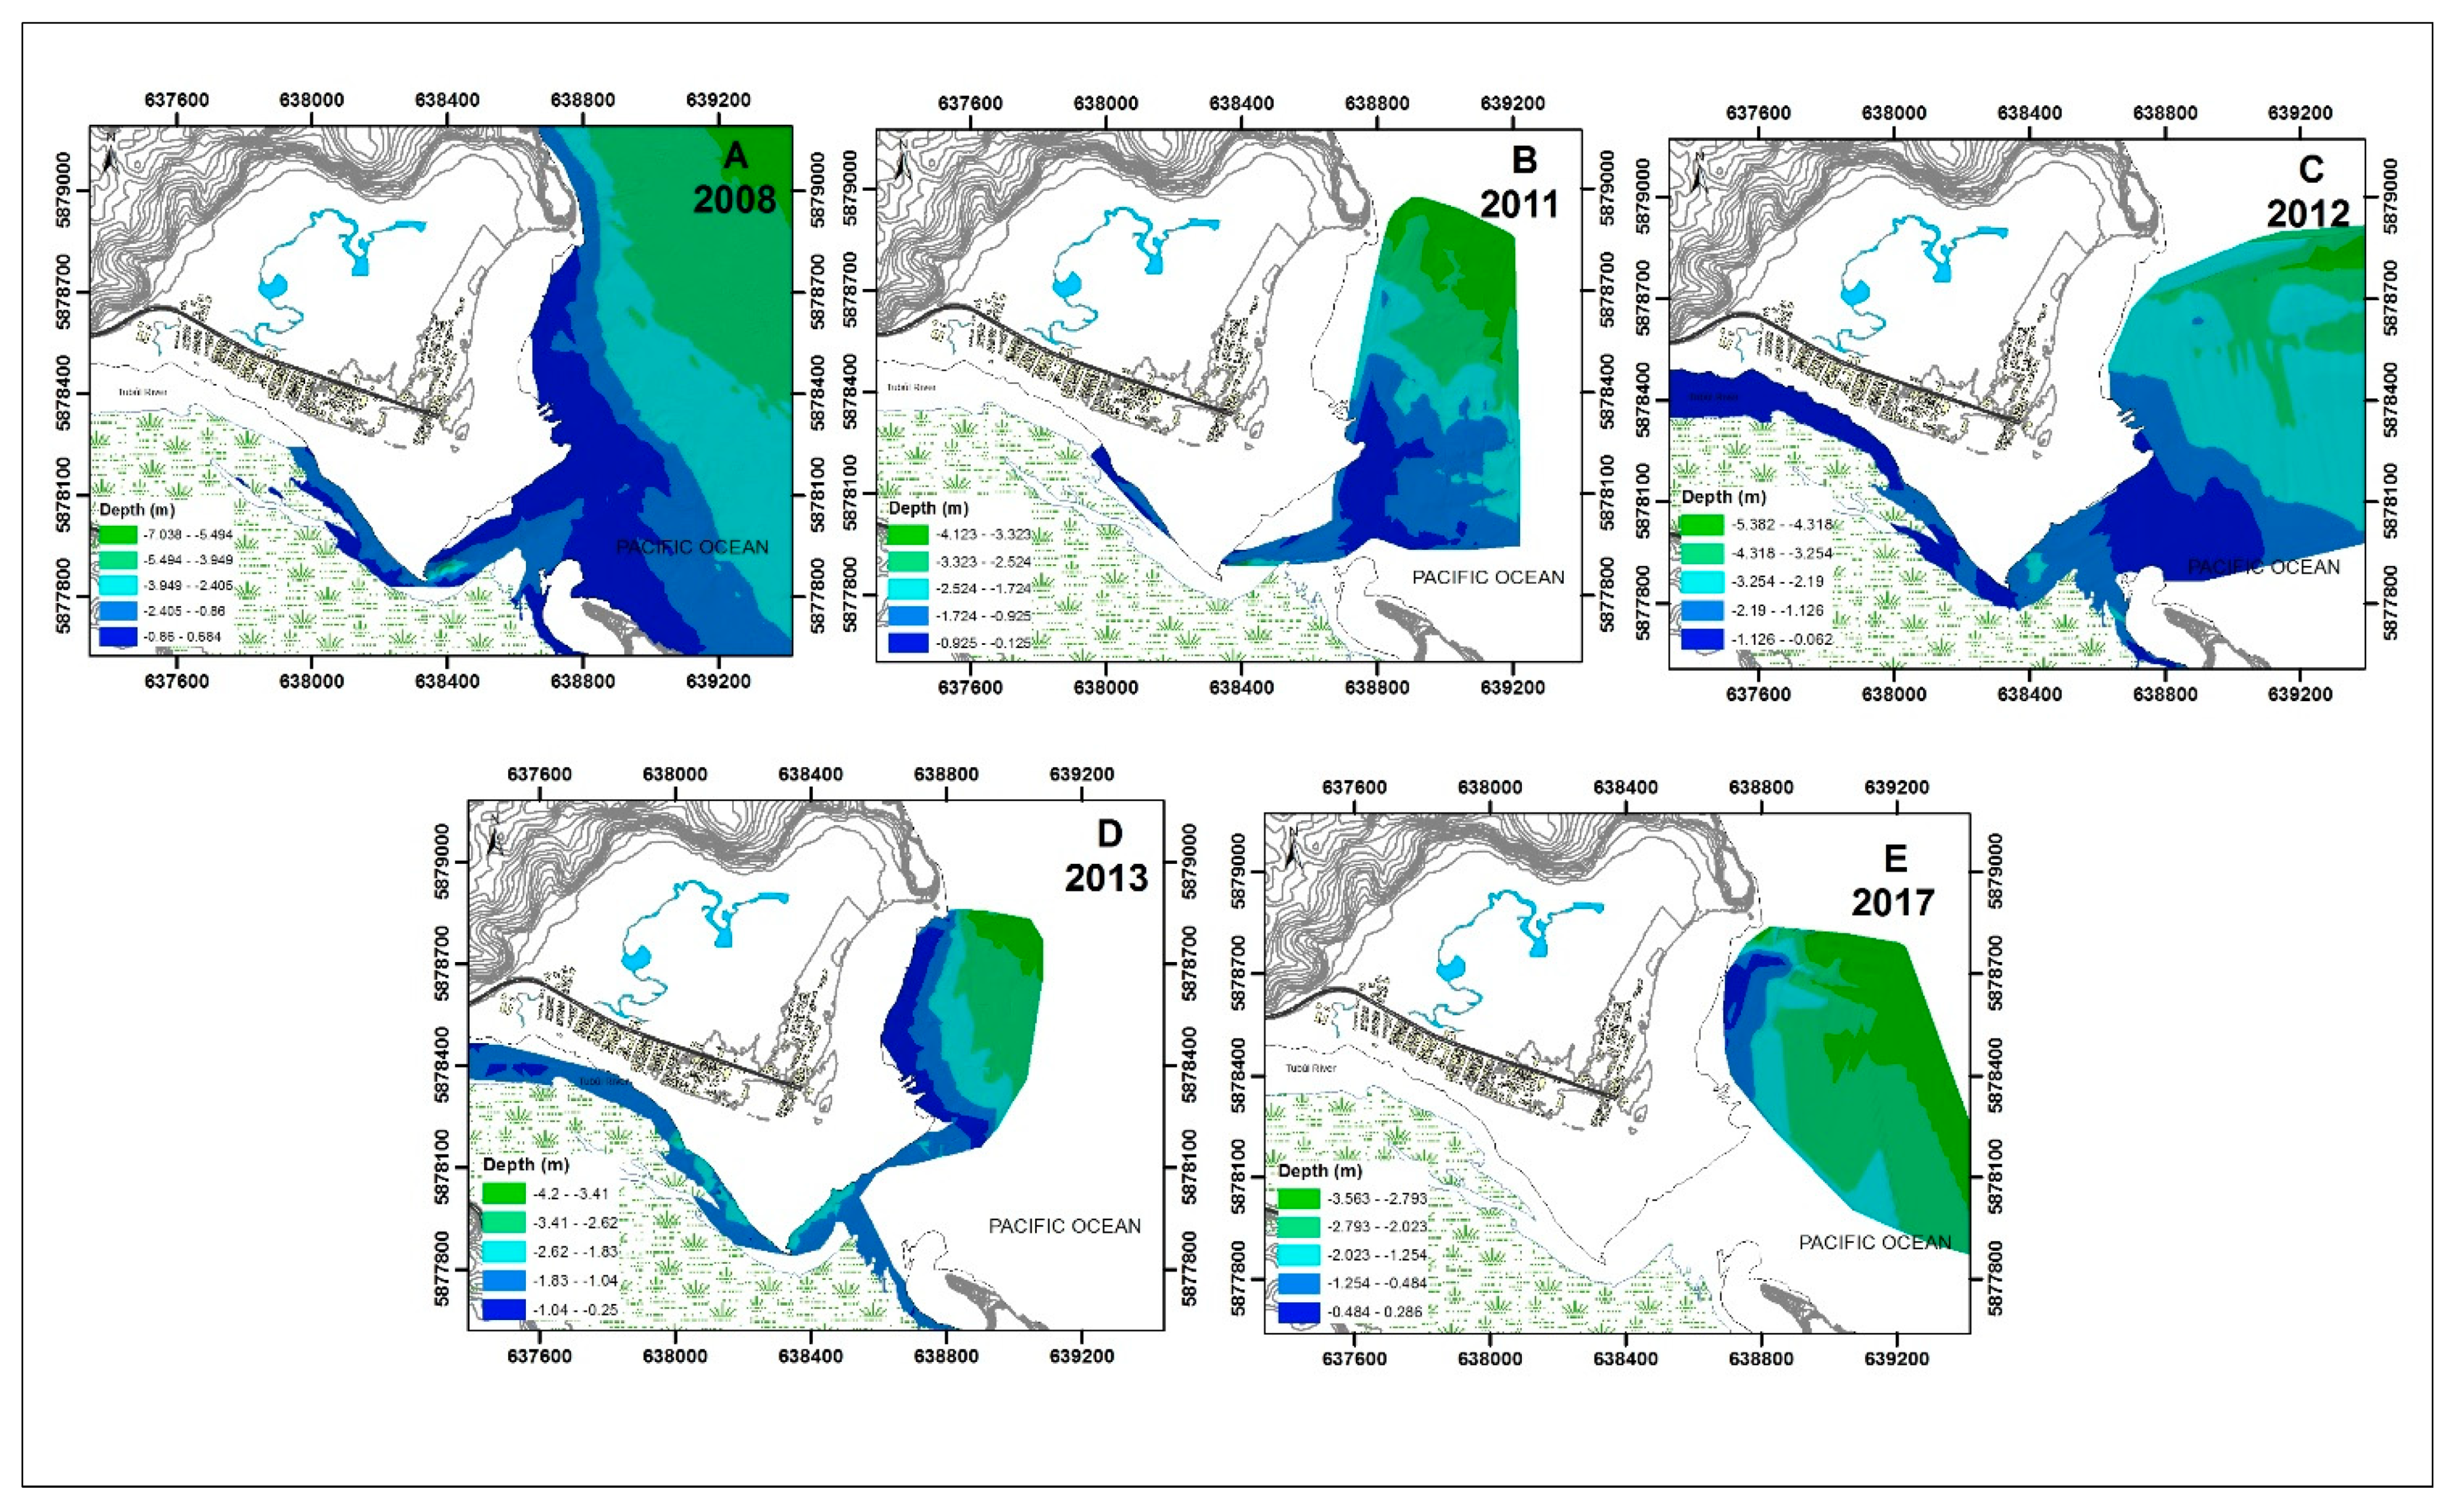
4.1. Pre- and Postearthquake Geomorphological Changes
4.2. Salinity and Recovery of Marine Intrusion
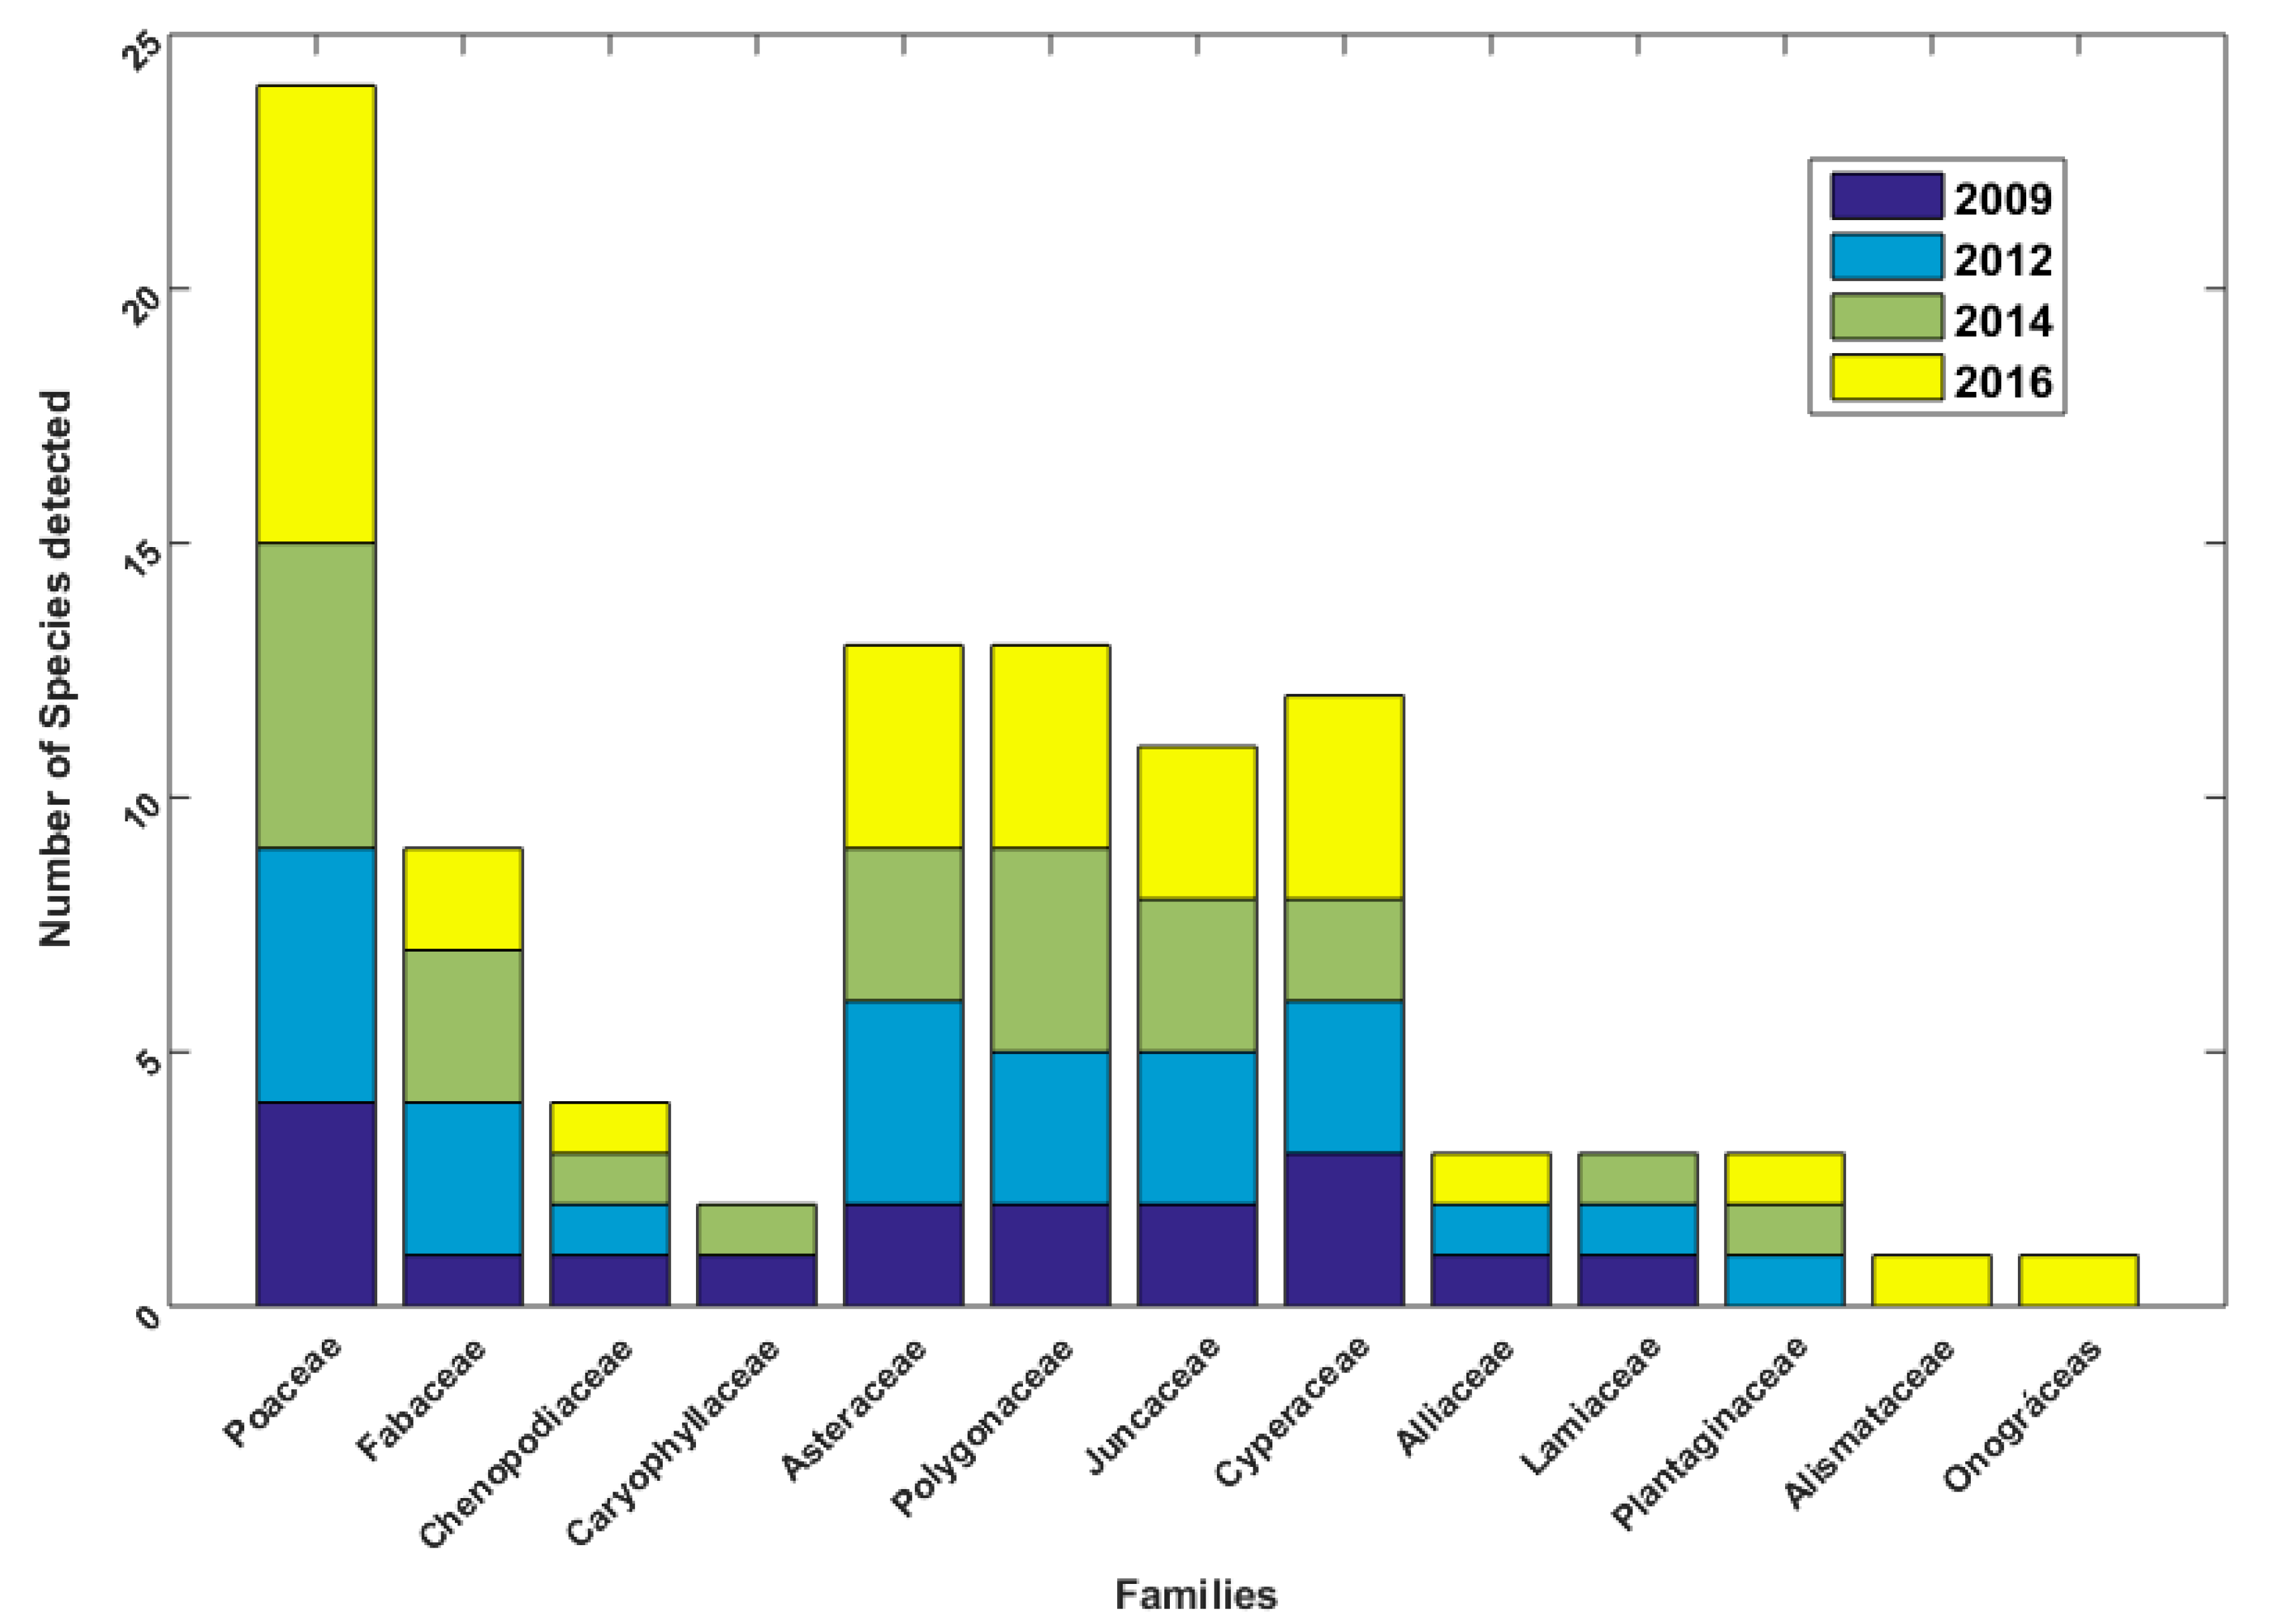
4.3. Floristic Studies
- (a)
- Floristic Composition
- (b)
- Vegetation Structure
- (c)
- Diversity
- (d)
- Conservation Status
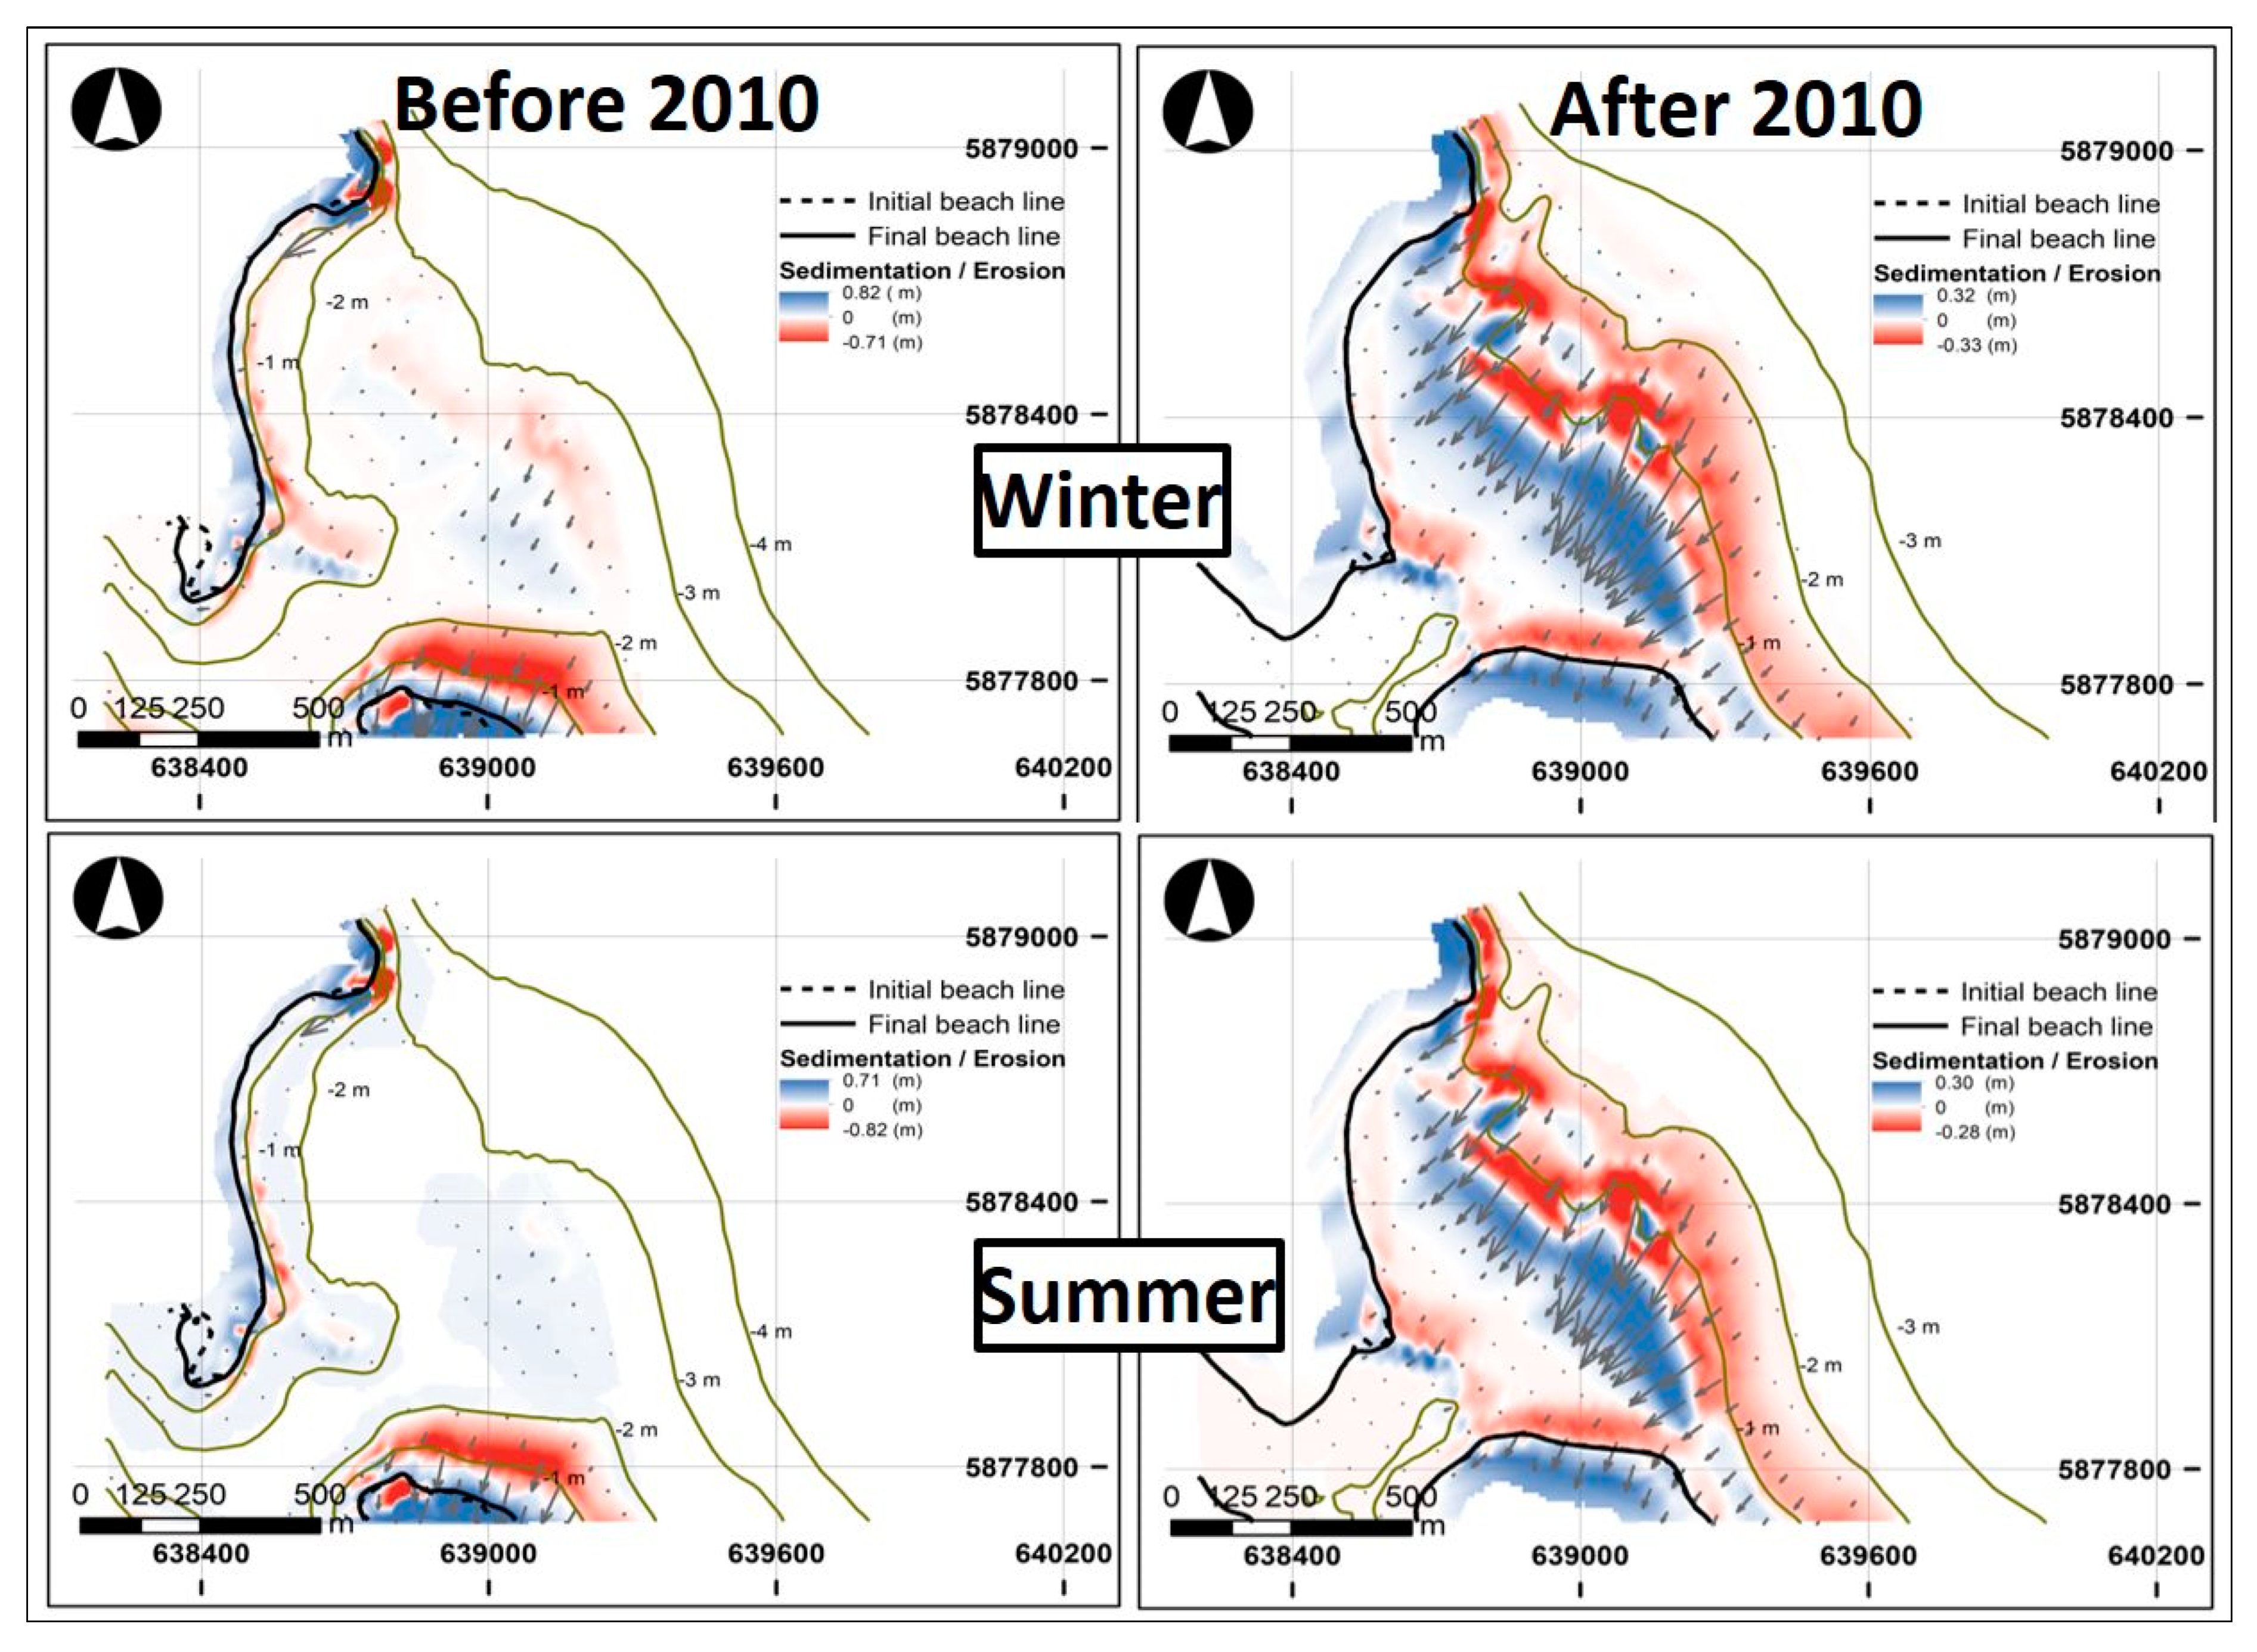
4.4. Numerical Modeling Results
- (a)
- Regular Waves
- (b)
- Storm waves
5. Discussion
- (a)
- Geomorphological Changes and Marine Intrusion Effects
- (b)
- Changes in Floristic Composition and Vegetation Structure
- (c)
- Changes in Morphological Response Induced by Subsidence
The Chilean Coast in Crisis: Guidelines for Integrated Management
6. Conclusions
Supplementary Materials
Author Contributions
Funding
Institutional Review Board Statement
Informed Consent Statement
Data Availability Statement
Conflicts of Interest
References
- Mitsch, W.; Gosselink, J. Wetlands, 3rd ed.; John Wiley & Sons, Inc.: New York, NY, USA, 2000. [Google Scholar]
- Wall, D.H.; Palmer, M.A.; Snelgrove, P.V.R. Biodiversity in critical transition zones between terrestrial, freshwater, and marine soils and sediments: Processes, linkages, and management implications. Ecosystems 2001, 4, 418–420. [Google Scholar] [CrossRef]
- Atwater, B.F. Evidence for Great Holocene earthquakes along the outer coast of Washington State. Science 1987, 236, 942–944. [Google Scholar] [CrossRef] [Green Version]
- Atwater, B.; Nunez, H.; Vita-Finzi, C. Net late Holocene emergence despite earthquake-induced submergence, South-central Chile. In Impacts of Tectonics on Quaternary Coastal Evolution, Quaternary International; Ota, Y., Nelson, A.R., Berryman, K.R., Eds.; Pergamon: Oxford, UK, 1992; Volume 15/16, pp. 77–85. [Google Scholar]
- Ota, Y.; Paskoff, F. Holocene deposits on the coast of the North-Central Chile: Radiocarbon ages and implications for coastal changes. Rev. Geol. Chile 1993, 20, 25–32. [Google Scholar]
- Clague, J.J.; Bobrowsky, P.T. Evidence for a large earthquake and tsunami 100–400 years ago on Western Vancouver Island, British Columbia. Quat. Res. 1994, 41, 176–184. [Google Scholar] [CrossRef]
- Hemphill-Haley, E. Diatom evidence for earthquake-induced subsidence and tsunami 300 yr ago in southern coastal Washington. Geol. Soc. Am. Bull. 1995, 107, 367–378. [Google Scholar] [CrossRef]
- Nelson, A.; Shennan, I.; Long, A. Identifying coseismic subsidence in tidal-wetland stratigraphical sequences at the Cascadia subduction zone of western North America. J. Geophys. Res. 1996, 101, 6115–6135. [Google Scholar] [CrossRef]
- Soter, S. Holocene uplift and subsidence in the Helike Delta, Gulf of Corinth, Greece. In Coastal Tectonics; Stewart, I.S., Vita-Finzi, C., Eds.; Geological Society Special Publications; Geological Society: London, UK, 1998; Volume 146, pp. 41–56. [Google Scholar]
- Peterson, C.D.; Doyle, D.L.; Barnett, E.T. Coastal flooding and beach retreat from coseismic subsidence in the central Cascadia margin, USA. Environ. Eng. Geosci. 2000, 6, 255–269. [Google Scholar] [CrossRef]
- Atwater, B.F.; Yamaguchi, D.K.; Bondevik, S.; Barnhardt, W.A.; Amidon, L.J.; Benson, B.E.; Skjerdal, G.; Shulene, J.A.; Nanayama, F. Rapid resetting of an estuarine recorder of the 1964 Alaska earthquake. GSA Bull. 2001, 113, 1193–1204. [Google Scholar] [CrossRef]
- Rhodes, B.P.; Kirby, M.E.; Jankaew, K.; Choowong, M. Evidence for a mid-Holocene tsunami deposit along the Andaman coast of Thailand preserved in a mangrove environment. Mar. Geol. 2011, 282, 255–267. [Google Scholar] [CrossRef]
- Troiani, B.; Simms, A.; DellaPenna, T.; Piper, E.; Yokoyama, Y. The importance of sea-level and climate change, including changing wind energy, on the evolution of a coastal estuary: Copano Bay, Texas. Mar. Geol. 2011, 280, 1–19. [Google Scholar] [CrossRef]
- Dura, T.; Cisternas, M.; Horton, B.P.; Ely, L.L.; Nelson, A.R.; Wesson, R.L.; Pilarczyk, J.E. Coastal evidence for Holocene subduction-zone earthquakes and tsunamis in central Chile. Quat. Sci. Rev. 2015, 113, 93–111. [Google Scholar] [CrossRef]
- Thilenius, J. Phytosociology and Succession on Earthquake-Uplifted Coastal Wetlands, Copper River Delta, Alaska; Gen. Tech. Rep. PNW-GTR-346; Department of Agriculture, Forest Service, Pacific Northwest Research Station: Portland, OR, USA, 1995; 58p.
- Paris, R.; Wassmer, P.; Sartohadi, J.; Lavigne, F.; Barthomeuf, B.; Desgages, E.; Grancher, D.; Baumert, P.; Vautier, F.; Brunstein, D.; et al. Tsunamis as geomorphic crises: Lessons from the December 26, 2004 tsunami in Lhok Nga, West Banda Aceh (Sumatra, Indonesia). Geomorphology 2009, 104, 59–72. [Google Scholar] [CrossRef]
- Reinhardt, E.; Nairn, R.; López, G.I. Recovery estimates for the Río Cruces after the May 1960 Chilean earthquake. Mar. Geol. 2010, 269, 18–33. [Google Scholar] [CrossRef]
- Kaminsky, G.M.; Ruggiero, P.; Buijsman, M.C.; McCandless, D.; Gelfenbaum, G. Historical evolution of the Columbia River littoral cell. Mar. Geol. 2010, 273, 96–126. [Google Scholar] [CrossRef]
- Martínez, C.; Rojas, D.; Quezada, M.; Quezada, J.; Oliva, R. Post-earthquake coastal evolution and recovery of an embayed beach in central-southern Chile. Geomorphology 2015, 250, 321–333. [Google Scholar] [CrossRef]
- Ioualalen, M.; Pelinovsky, E.; Asavanant, J.; Lipikorn, R.; Deschamps, A. On the weak impact of the 26 December Indian Ocean tsunami on the Bangladesh coast. Nat. Hazards Earth Syst. Sci. 2007, 7, 141–147. [Google Scholar] [CrossRef] [Green Version]
- Vita-Finzi, C. Neotectonics and the 2004 and 2005 earthquake sequences at Sumatra. Mar. Geol. 2008, 248, 47–52. [Google Scholar] [CrossRef]
- Jiménez, J.; Sancho-García, A.; Bosom, E.; Valdemoro, E.; Guillén, J. Storm-induced damages along the Catalan coast (NW Medi-terranean) during the period 1958–2008. Geomorphology 2012, 143, 24–33. [Google Scholar] [CrossRef]
- Løvholt, F.; Glimsdal, S.; Harbitz, C.B.; Horspool, N.; Smebye, H.; de Bono, A.; Nadim, F. Global tsunami hazard and exposure due to large co-seismic slip. Int. J. Disaster Risk Reduct. 2014, 10, 406–418. [Google Scholar] [CrossRef]
- Masselink, G.; Castelle, B.; Scott, T.; Dodet, G.; Suanez, S.; Jackson, D.; Floc’h, F. Extreme wave activity during 2013/2014 winter and morphological impacts along the Atlantic coast of Europe. Geophys. Res. Lett. 2016, 43, 2135–2143. [Google Scholar] [CrossRef]
- Carvajal, M.; Contreras-López, M.; Winckler, P.; Sepúlveda, I. Meteotsunamis occurring along the Southwest Coast of South America during an intense storm. Pure Appl. Geophys. 2017, 174, 3313–3323. [Google Scholar] [CrossRef]
- Valderrama-Landeros, L.H.; Martell-Dubois, R.; Ressl, R.; Silva-Casarín, R.; Cruz-Ramírez, C.J.; Muñoz-Pérez, J.J. Dynamics of coastline changes in Mexico. J. Geogr. Sci. 2019, 29, 1637–1654. [Google Scholar] [CrossRef] [Green Version]
- Masselink, G.; Lazarus, E.D. Defining coastal resilience. Water 2019, 11, 2587. [Google Scholar] [CrossRef] [Green Version]
- Khojasteh, D.; Glamore, W.; Heimhuber, V.; Felder, S. Sea level rise impacts on estuarine dynamics: A review. Sci. Total. Environ. 2021, 780, 146470. [Google Scholar] [CrossRef]
- San Martín, C.; Contreras, D.; San Martín, J.; Ramírez, C. Vegetación de las marismas del centro-sur de Chile. Rev. Chil. Hist. Nat. 1992, 65, 327–342. (In Spanish) [Google Scholar]
- Valdovinos, C. Caracterización ambiental del Estuario Lenga, VIII Región, Chile. In Planificación y Gestión de la Zona Costera; Análisis de un caso: Lenga Concepción; EULA-Universidad de Concepción: Concepción, Chile, 1993. (In Spanish) [Google Scholar]
- Quintana, V. Caracterización florística y faunística de un humedal costero de la VIII región, el caso del Estero Lenga. In Planifi-Cación y Gestión de la Zona Costera; Análisis de un caso: Lenga; Serie: Propuesta de Ordenamiento 8; Centro EULA-Universidad de Concepción: Concepción, Chile, 1993; pp. 41–56. (In Spanish) [Google Scholar]
- Ramírez, C.; San Martín, C.; Rubilar, H. Una propuesta para la clasificación de humedales chilenos. Rev. Geogr. Valpso. 2002, 32, 265–273. (In Spanish) [Google Scholar]
- Hauenstein, E.; Gonzalez, M.; Peña-Cortés, F.; Muñoz-Pedreros, A. Clasificacion y caracterizacion de la flora y vegetacion de los humedales de la Costa de Tolten (IX Region, Chile). Gayana. Bot. 2002, 59, 87–100. (In Spanish) [Google Scholar] [CrossRef] [Green Version]
- González, A.; Victoriano, P. Aves de los humedales costeros de la zona de Concepción y alrededores. In Historia, Biodiversidad y Ecología de los Bosques Costeros de Chile; Smith-Ramírez, C., Armesto, J., Valdovinos, C., Eds.; Editorial Universitaria: Santiago, Chile, 2005; pp. 485–497. (In Spanish) [Google Scholar]
- Hauenstein, E.; González, M.; Peña-Cortés, F.; Muñoz-Pedreros, A. Diversidad vegetal en humedales costeros de la región de la Araucanía. In Historia, Biodiversidad y Ecología de los Bosques Costeros de Chile; Smith-Ramírez, C., Armesto, J., Valdovinos, C., Eds.; Editorial Universitaria: Santiago, Chile, 2005; pp. 197–205. (In Spanish) [Google Scholar]
- Comisión Nacional de Medio Ambiente. Estrategia Para la Conservación y Uso Racional de los Humedales en Chile; CONAMA: Santiago, Chile, 2005. (In Spanish)
- Peña-Cortés, F.; Gutiérrez, P.; Rebolledo, G.; Escalona, M.; Hauenstein, E.E.; Bertrán, C.; Tapia, J. Determinación del nivel de antro-pización de humedales como criterio para la planificación ecológica de la cuenca del lago Budi, IX región de la Araucanía, Chile. Rev. Geogr. Norte Gd. 2006, 36, 75–91. (In Spanish) [Google Scholar]
- Villagrán, R.; Aguayo, M.; Parra, L.; González, A. Relación entre características del hábitat y estructura del ensamble de insectos en humedales palustres urbanos del centro-sur de Chile. Rev. Chil. Hist. Nat. 2006, 79, 195–211. (In Spanish) [Google Scholar] [CrossRef]
- Smith, P.; Romero, H. Efectos del crecimiento urbano del Área Metropolitana de Concepción sobre los humedales de Rocuant-Andalién, Los Batros y Lenga. Rev. Geogr. Norte Gd. 2009, 43, 81–93. (In Spanish) [Google Scholar]
- Sepúlveda, E.; Parra, L.; Benítez, H.; Rojas, C. Estados de naturalidad y heterogeneidad vegetacional de humedales palustres y su efecto sobre la diversidad de Macrolepidoptera (Insecta: Lepidoptera). SHILAP Rev. Lepidopterol. 2012, 40, 155–170. (In Spanish) [Google Scholar]
- Catálan, P.A.; Cienfuegos, R.; Villagran, M. Perspectives on the long-term equilibrium of a wave dominated coastal zone affected by tsunamis: The case of Central Chile. J. Coast. Res. 2014, 71, 55–61. [Google Scholar] [CrossRef]
- Marín, A.; Gelcich, S.; Araya, G.; Olea, G.; Espíndola, M.; Castilla, J.C. The 2010 tsunami in Chile: Devastation and survival of coastal small-scale fishing communities. Mar. Policy 2010, 34, 1381–1384. [Google Scholar] [CrossRef]
- Morton, R.A.; Gelfenbaum, G.; Buckley, M.L.; Richmond, B.M. Geological effects and implications of the 2010 tsunami along the central coast of Chile. Sediment. Geol. 2011, 242, 34–51. [Google Scholar] [CrossRef]
- Quezada, J.; Jaque, E.; Belmonte, A.; Fernández, A.; Vásquez, D.; Martínez, C. Movimientos cosísmicos verticales y cambios geo-morfológicos generados durante el terremoto Mw = 8,8 del 27 de Febrero de 2010 en el Centro-Sur de Chile. Rev. Geogr. Sur. 2010, 1, 11–45. (In Spanish) [Google Scholar]
- Farias, M.; Vargas, G.; Tassara, A.; Carretier, S.; Baize, S.; Melnick, D.; Bataille, K. Land-level changes produced by the 2010 Mw 8.8 Chile earthquake. Science 2010, 329, 916. [Google Scholar] [CrossRef] [PubMed]
- Fritz, H.; Petroff, C.; Catalan, P.; Cienfuegos, R.; Winckler, P.; Kalligeris, N.; Weiss, R.; Barrientos, S.; Meneses, G.; Valderas-Bermejo, C.; et al. Field survey on the 27 February 2010 Chilean Tsunami. Pure Appl. Geophys. 2011, 168, 1989–2010. [Google Scholar] [CrossRef]
- Martínez, C.; Rojas, O.; Jaque, E.; Quezada, J.; Vásquez, D.; Belmonte, A. Efectos territoriales del tsunami del 27 de Febrero de 2010 en la costa de la Región del Biobío. Rev. Geogr. Am. Cent. 2011, 2, 1–16. (In Spanish) [Google Scholar]
- Valdovinos, C.; Sandoval, N.; Vásquez, D.; Olmos, V. El humedal costero Tubul-Raqui: Un ecosistema chileno de alto valor de conservación severamente perturbado por el terremoto del 2010. In Humedales Costeros de Chile: Aportes Científicos a su Gestión Sustentable; Camaño, A., Fariña, J., Eds.; Ediciones Universidad Católica de Chile: Santiago, Chile, 2012; pp. 391–437. (In Spanish) [Google Scholar]
- Valdovinos, C.; Muñoz, M.; Sandoval, N.; Vásquez, D.; Olmos, V. Desastres naturales y biodiversidad: El caso del humedal costero Tubul-Raqui. Rev. Soc. Hoy 2010, 19, 33–51. (In Spanish) [Google Scholar]
- Martínez, C.; Quezada, M.; Rubio, P. Historical changes in the shoreline and littoral processes on a headland bay beach in central Chile. Geomorphology 2011, 135, 80–96. [Google Scholar] [CrossRef]
- Vargas, G.; Farías, M.; Carretier, S.; Tassara, A.; Baize, S.; Melnick, D. Coastal uplift and tsunami effects associated to the 2010 Mw 8.8 Maule earthquake in Central Chile. Andean Geol. 2011, 38, 219–238. [Google Scholar]
- Sandoval, N.; Valdovinos, C.; Oyanedel, J.P.; V’asquez, D. Impacts of coseismic uplift caused by the 2010 8.8 Mw earthquake on the macrobenthic community of the Tubul-Raqui Saltmarsh (Chile). Estuar. Coast. Shelf Sci. 2019, 226. [Google Scholar] [CrossRef]
- Valdovinos, C.; Sandoval, N.; Vasquez, D.; Olmos, V. The Tubul-Raqui coastal wetland: A Chilean ecosystem of high conservation value severely disturbed by the 2010 earthquake. In The Ecology and Natural History of Chilean Saltmarshes; Fariña, J., Camaño, A., Eds.; Springer: Cham, Switzerland, 2017. [Google Scholar]
- Vásquez, D.; Sandoval, N.; Fierro, P.; Valdovinos, C. Morphological impacts of the Chilean megathrust earthquake Mw 8.8 on coastal wetlands of high conservation value. Estuar. Coast. Shelf Sci. 2020, 245, 106922. [Google Scholar] [CrossRef]
- Hidalgo, R.; Zunino, H. La urbanización de las áreas periféricas en Santiago y Valparaíso: El papel de las relaciones de poder en el dibujo de la geografía socio-residencial. Rev. EURE 2011, 27, 79–105. (In Spanish) [Google Scholar] [CrossRef] [Green Version]
- Salinas, E.; Pérez, L. Procesos urbanos recientes en el Área Metropolitana de Concepción: Transformaciones morfológicas y tipologías de ocupación. Rev. Geogr. Norte Gd. 2011, 49, 79–97. (In Spanish) [Google Scholar] [CrossRef] [Green Version]
- Hunt, A.; Watkiss, P. Climate change impacts and adaptation in cities: A review of the literature. Clim. Chang. 2010, 104, 13–49. [Google Scholar] [CrossRef] [Green Version]
- Kombiadou, K.; Costas, S.; Carrasco, A.R.; Plomaritis, T.A.; Ferreira, O.; Matias, A. Bridging the gap between resilience and geomorphology of complex coastal systems. Earth-Sci. Rev. 2019, 198, 102934. [Google Scholar] [CrossRef]
- Rojas, O.; Saéz, K.; Martínez, C.; Jaque, E. Efectos socioambientales post-catástrofe en localidades costeras vulnerables afectadas por el tsunami del 27/02/2010 en Chile. Interciencia 2014, 39, 383–390. (In Spanish) [Google Scholar]
- Ramírez, C.; San Martín, C.; Contreras, D. Ecosociología de las marismas litorales del cetro-sur de Chile. Rev. Agro Sur 1990, 18, 104–112. (In Spanish) [Google Scholar]
- Constabel, S. Ambientes Sedimentarios de los Estuarios Tubul y Raqui, VIII Región, Chile. Ph.D. Thesis, Ciencias Ambientales, Universidad de Concepción, Concepción, Chile, 12 March 1993. Unpublished. (In Spanish). [Google Scholar]
- San Martín, C.; Subiabre, M.; Ramírez, Y. Estudio florístico y vegetacional de una gradiente latitudinal en marismas del Centro-Sur de Chile. Cienc. Investig. Agrar. 2006, 33, 37–45. (In Spanish) [Google Scholar]
- Sea Level Station Monitoring Facility. Available online: http://www.ioc-sealevelmonitoring.org/station.php?code=crnl2 (accessed on 15 May 2019).
- Devynck, J. Contribución al Estudio de la Circulación Atmosférica en Chile y el Clima de la Región del Biobío; Memoria de Título para optar al Título Meteorólogo, Universidad de Concepción: Concepción, Chile, 1970. Unpublished. (In Spanish) [Google Scholar]
- Pineda, V. Evolución Paleogeográfica de la Península de Arauco Durante el Cretácico Superior-terciario. Memoria de Título para optar al Título de Geólogo; Universidad de Concepción: Concepción, Chile, 1983. Unpublished. (In Spanish) [Google Scholar]
- Gelcich, S.; Castilla, J.C. Ecosystem services and abrupt transformations in a Coastal Wetland social-ecological system: Tubul-Raqui after the 2010 earthquake in Chile. Ecol. Soc. 2014, 19, 22. [Google Scholar] [CrossRef]
- Lesser, G.; Roelvink, J.; van Kester, J.; Stelling, G. Development and validation of a three-dimensional morphological model. Coast. Eng. 2004, 51, 883–915. [Google Scholar] [CrossRef]
- Booij, N.; Ris, R.C.; Holthuijsen, L.H. A third-generation wave model for coastal regions: 1. Model description and validation. J. Geophys. Res. Space Phys. 1999, 104, 7649–7666. [Google Scholar] [CrossRef] [Green Version]
- Martínez, C.; Quezada, M.; Quezada, J. Métodos para el análisis de cambios históricos de la línea litoral en playas de ensenada. Nuevos ejemplos en Chile. In II Manual de Métodos en Teledetección Aplicada a la Prevención de Riesgos Naturales en el Litoral; Alcántara-Carrió, J., Montoya, I., Correa, I., Eds.; Programa Iberoamericano de Ciencia y Tecnología para el Desarrollo (CYTED); CYTED: Cambridge, UK, 2013; pp. 259–300. (In Spanish) [Google Scholar]
- Syvitski, J.P.M. Principles, Methods, and Application of Particle Size Analysis; Cambridge University Press: New York, NY, USA, 1991; p. 368. [Google Scholar]
- Wentworth, C.K. A scale of grade and class terms for clastic sediments. J. Geol. 1922, 30, 377–392. [Google Scholar] [CrossRef]
- Folk, R.L.; Ward, W.C. Brazos River bar [Texas]; a study in the significance of grain size parameters. J. Sediment. Res. 1957, 27, 3–26. [Google Scholar] [CrossRef]
- Trask, P. Origin and Environment of Source Sediments of Petroleum; Gulf Publishing Company: Houston, TX, USA, 1932; p. 323. [Google Scholar]
- Pawlowicz, R.; Beardsley, B.; Lentz, S. Classical tidal harmonic analysis including error estimates in MATLAB using T_TIDE. Comput. Geosci. 2002, 28, 929–937. [Google Scholar] [CrossRef]
- Hidrotop Ingeniería Ltda. Topo-Batimetric Survey of Tubul; Tech Report; Prepared for MOP (Ministry of Public Works, Chile): Santiago, Chile, 2008; p. 29. [Google Scholar]
- Perillo, G.; Piccolo, M. Methodology to study estuarine cross-sections. Rev. Geofís. 1993, 38, 189–206. [Google Scholar]
- Madden, C.; Goodin, K.; Allee, R.; Bamford, D.; Kinkbeiner, M. Clasificación Ecológica Estandarizada Costera y Marina-Versión III: La Clasificación de Referencia para Hábitats Marinos para la Red Temática de Ecosistemas IABIN; Nature Serve: Arlington, VA, USA, 2008; p. 36. (In Spanish) [Google Scholar]
- Servicio Hidrográfico y Oceanográfico de la Armada de Chile (SHOA). Instrucciones Oceanográficas; No. 2; Armada de Chile: Edificio Armada de Chile: Valparaiso, Chile, 1999. (In Spanish) [Google Scholar]
- Shimwell, D. The Description and Classification of Vegetation; Sidewick & Jackson: London, UK, 1972. [Google Scholar]
- Matthei, O. Manual de las Malezas que Crecen en Chile; Alfabeta Impresores: Santiago, Chile, 1995; 545p. (In Spanish) [Google Scholar]
- Hoffmann, A. Flora Silvestre de Chile. Zona Central; Cuarta Edición; Ediciones Fundación Claudio Gay: Santiago, Chile, 1998; 254p. (In Spanish) [Google Scholar]
- Riedemann, P.; Aldunate, G. Flora Nativa De Valor Ornamental. Identificación y Propagación: Chile, Zona Sur; Editorial Andrés Bello: Santiago, Chile, 2003; 517p. (In Spanish) [Google Scholar]
- Riedemann, P.; Aldunate, G. Flora Nativa De Valor Ornamental. Identificación y Propagación: Chile, Zona Centro; Editorial Andrés Bello: Santiago, Chile, 2004; 567p. (In Spanish) [Google Scholar]
- Rodriguez, R.; Dellarosa, V. Plantas vasculares acuáticas en la región del Biobio; Editorial Universidad de Concepción: Concepción, Chile, 1998; p. 3. (In Spanish) [Google Scholar]
- Simpson, E. Measurement of diversity. Nature 1949, 163, 688. [Google Scholar] [CrossRef]
- Quinn, G.P.; Keough, M.J. Experimental Design and Data Analysis for Biologists; Cambridge University Press: Cambridge, UK, 2002; 557p. [Google Scholar]
- Pielou, E. Ecological Diversity; John Wiley: New York, NY, USA, 1975. [Google Scholar]
- Hammer, O.; Harper, D.; Ryan, P. PAST: Paleontological Statistics Software Package for Education and Data Analysis, Version 2.00. Palaeontol. Electrón. 2001, 4, 9. Available online: http://palaeoelectronica.org/2001_1/past/issue1_01.htm (accessed on 25 June 2020).
- Ris, R.; Booij, N.; Holthuijsen, L. A third-generation wave model for coastal regions, 2. Verification. J. Geophys. Res. 1999, 104, 7667–7681. [Google Scholar] [CrossRef]
- Van Rijn, L.C. Principles of Sediment Transport in Rivers, Estuaries and Coastal Seas; AQUA Publications: Blokzijl, The Netherlands, 1993. [Google Scholar]
- Stive, M.; Roelvink, J.; De Vriend, H. Large-Scale Coastal Evolution Concept. In Proceedings of the 22nd International Conference on Coastal Engineering; ASCE: New York, NY, USA, 1990. [Google Scholar]
- Roelvink, J. Coastal morphodynamic evolution techniques. Coast. Eng. 2006, 53, 277–287. [Google Scholar] [CrossRef]
- Gómez, M.; Villagrán, M.; Martínez, C.; Belmonte, A. Characterizing the longshore sediment transport pattern on beaches in the Gulf of Arauco, Chile, to assess morphological shoreline evolution. J. Coast. Res. 2018, 85, 656–660. [Google Scholar] [CrossRef]
- The WAVEWATCH III® Development Group (WW3DG). User Manual and System Documentation of WAVEWATCH III® Version 5.16; Tech. Note 329, NOAA/NWS/NCEP/MMAB; U. S. Department of Commerce, National Oceanic and Atmospheric Administration, National Weather Service, National Centers for Environmental Prediction: College Park, MD, USA, 2016; 326p.
- Quezada, J.; Jaque, E.; Fernández, A.; Vásquez, D. Cambios en el relieve generados como consecuencia del terremoto Mw = 8,8 del 27 de Febrero de 2010 en el Centro-sur de Chile. Rev. Geogr. Norte Gd. 2012, 53, 35–55. (In Spanish) [Google Scholar] [CrossRef] [Green Version]
- Lomnitz, C. Major earthquakes and tsunamis in Chile during the period 1535 to 1955. Soderdruck Geol. Rundsch. Band 1970, 59, 938–960. [Google Scholar] [CrossRef]
- Lagos, M. Tsunamis de origen cercano a las costas de Chile. Rev. Geogr. Norte Gd. 2000, 27, 93–102. (In Spanish) [Google Scholar]
- Cisternas, M.; Melnick, D.; Ely, L.; Wesson, R.; Norambuena, R. Similarities between the great Chilean earthquakes of 1835 and 2010. In Proceedings of the American Geophysical Union Chapman Conference, Valparaíso, Viña del Mar and Valdivia, Chile, 16–24 May 2010; p. 19. [Google Scholar]
- Palacios, A. Sismicidad Histórica de la Ciudad de Concepción Desde su Fundación en 1550 Hasta su Traslado en 1751; Boletín No. 64; Servicio Nacional de Geología y Minería: Santiago, Chile, 2012. (In Spanish) [Google Scholar]
- Vigny, C.; Socquet, A.; Peyrat, S.; Ruegg, J.-C.; Metois, M.; Madariaga, R.; Morvan, S.; Lancieri, M.; Lacassin, R.; Campos, J.; et al. The 2010 Mw 8.8 maule megathrust earthquake of Central Chile, Monitored by GPS. Science 2011, 332, 1417–1421. [Google Scholar] [CrossRef] [Green Version]
- Veyl, C. Los Fenómenos Volcánicos y Sísmicos de Fines de Mayo de 1960 en el Sur de Chile; Departamento de Geología y Mineralogía, Instituto Central de Química, Universidad de Concepción: Concepción, Chile, 1960; 42p. (In Spanish) [Google Scholar]
- Gallo, M.; Rodríguez, E. Caracterización de Paisajes y Ecosistemas: Proyecto Demostrativo Cuenca Baja del río Paz el Salvador-Guatemala; Proyecto Humedales y Medios de Vida; Wetlands International: Wageningen, The Netherlands, 2010; pp. 1–41. (In Spanish) [Google Scholar]
- Adam, P. Saltmarsh Ecology; Cambridge University Press: Cambridge, UK, 1990. [Google Scholar]
- Chapman, V.J. Salt marshes and salt deserts of the world. Ecol. Halophytes 1974, 79, 3–19. [Google Scholar]
- Figueroa, R.; Valdovinos, C. Productividad de pastizales salinos del estuario Lenga (Chile) a escala de paisaje ecológico: Análisis de imágenes Landsat TM y experimentos in situ. Bol. Soc. Biol. Concepción 1997, 68, 7–11. (In Spanish) [Google Scholar]
- Stuardo, J.; Valdovinos, C.; Figueroa, R.; Occhipinti, A. Ambientes costeros del Golfo de Arauco y áreas adyacentes. Publ. EU-LA-Chile. Ser. Mon. Cient. 1992, 9, 1–157. (In Spanish) [Google Scholar]
- Winckler, P.; Contreras-López, M.; Campos-Caba, R.; Beyá, J.F.; Molina, M. El temporal del 8 de agosto de 2015 en la región de Valparaíso, Chile Central. Lat. Am. J. Aquat. Res. 2017, 45, 622–648. (In Spanish) [Google Scholar] [CrossRef]
- Martínez, C.; Contreras-López, M.; Winckler, P.; Hidalgo, H.; Godoy, E.; Agredano, R. Coastal erosion in central Chile: A new hazard? Ocean Coast. Manag. 2018, 156, 141–155. [Google Scholar] [CrossRef]
- Martínez, C.; Martínez, I.; Paredes, C.; Cienfuegos, R. ¿Por qué Chile Necesita Una Ley de Costas? Hacia Nueva Gobernanza de la Costa Para el Siglo XXI. Serie Policy Papers CIGIDEN. 2020. Available online: https://www.cigiden.cl/wp-content/uploads/2020/01/Por-que-Chile-necesita-una-ley-de-costas-1.pdf (accessed on 11 February 2021). (In Spanish).
- Winckler, P.; Contreras-López, M.; Vicuña, S.; Larraguibel, C.; Mora, J.; Esparza, C.; Salcedo, J.; Gelcich, S.; Fariña, J.M.; Martínez, C.; et al. Amenazas en “Determinación del riesgo de los impactos del Cambio Climático en las costas de Chile”; Ministerio del Medio Ambiente: Santiago, Chile, 2019; Volume 1. (In Spanish)
- Aránguiz, R.; Martínez, C.; Rojas, O.; Hoffmann, C.; López, P. The generation of new tsunami risk areas due to an intentionally biased reconstruction process: Case study of llico after the 2010 Chile tsunami. Int. J. Disaster Risk Reduct. 2020, 50, 101727. [Google Scholar] [CrossRef]
- Martínez, C.; Rojas, O.; Villagra, P.; Aránguiz, R.; Sáez-Carrillo, K. Risk factors and perceived restoration in a town destroyed by the 2010 Chile tsunami. Nat. Hazards Earth Syst. Sci. 2017, 17, 721–734. [Google Scholar] [CrossRef] [Green Version]
- Rojas, C.; Munizaga, J.; Rojas, O.; Martínez, C.; Pino, J. Urban development versus wetland loss in a coastal Latin American city: Lessons for sustainable land use planning. Land Use Policy 2019, 80, 47–56. [Google Scholar] [CrossRef]
- Martínez, C.; López, P.; Rojas, C.; Qüense, J.; Hidalgo, R.; Arenas, F. A sustainability index for anthropized and urbanized coasts: The case of Concón Bay, central Chile. Appl. Geogr. 2020, 116, 102166. [Google Scholar] [CrossRef]
- Espejo, D.H. Noción y elementos de la justicia ambiental: Directrices para su aplicación en la planificación territorial y en la evaluación ambiental estratégica. Rev. Derecho 2010, 23, 9–36. (In Spanish) [Google Scholar] [CrossRef] [Green Version]
- Zhao, L.; Liu, F. Land-use planning adaptation in response to SLR based on a vulnerability analysis. Ocean Coast. Manag. 2020, 196, 105297. [Google Scholar] [CrossRef]


| Name | Year | Scale | CDP * | RMS/ |
|---|---|---|---|---|
| SAF CH-30 | 1979 | 1:30,000 | 0.38 | 0.46 |
| SAF CH-60 | 1983 | 1:60,000 | 0.64 | 0.47 |
| FONDEF | nov 1992 | 1:20,000 | 0.32 | 0.20 |
| MINVU | oct 1999 | 1:10,000 | 0.53 | 0.39 |
| SAF | mar 2010 | 1:20,000 | 0.21 | 0.28 |
| Wave Condition | Spectral Parameters | MORFAC | Modeling Time (Tidal Cycles) | ||
|---|---|---|---|---|---|
| Hs | Tp | Dp | |||
| Regular—winter | 3.03 m | 12.6 s | 233.1° | 30 | 2 |
| Regular–summer | 2.66 m | 12.3 s | 231.7° | 30 | 2 |
| Storm | 5.51 m | 10.9 s | 341.4° | 6 | 4 |
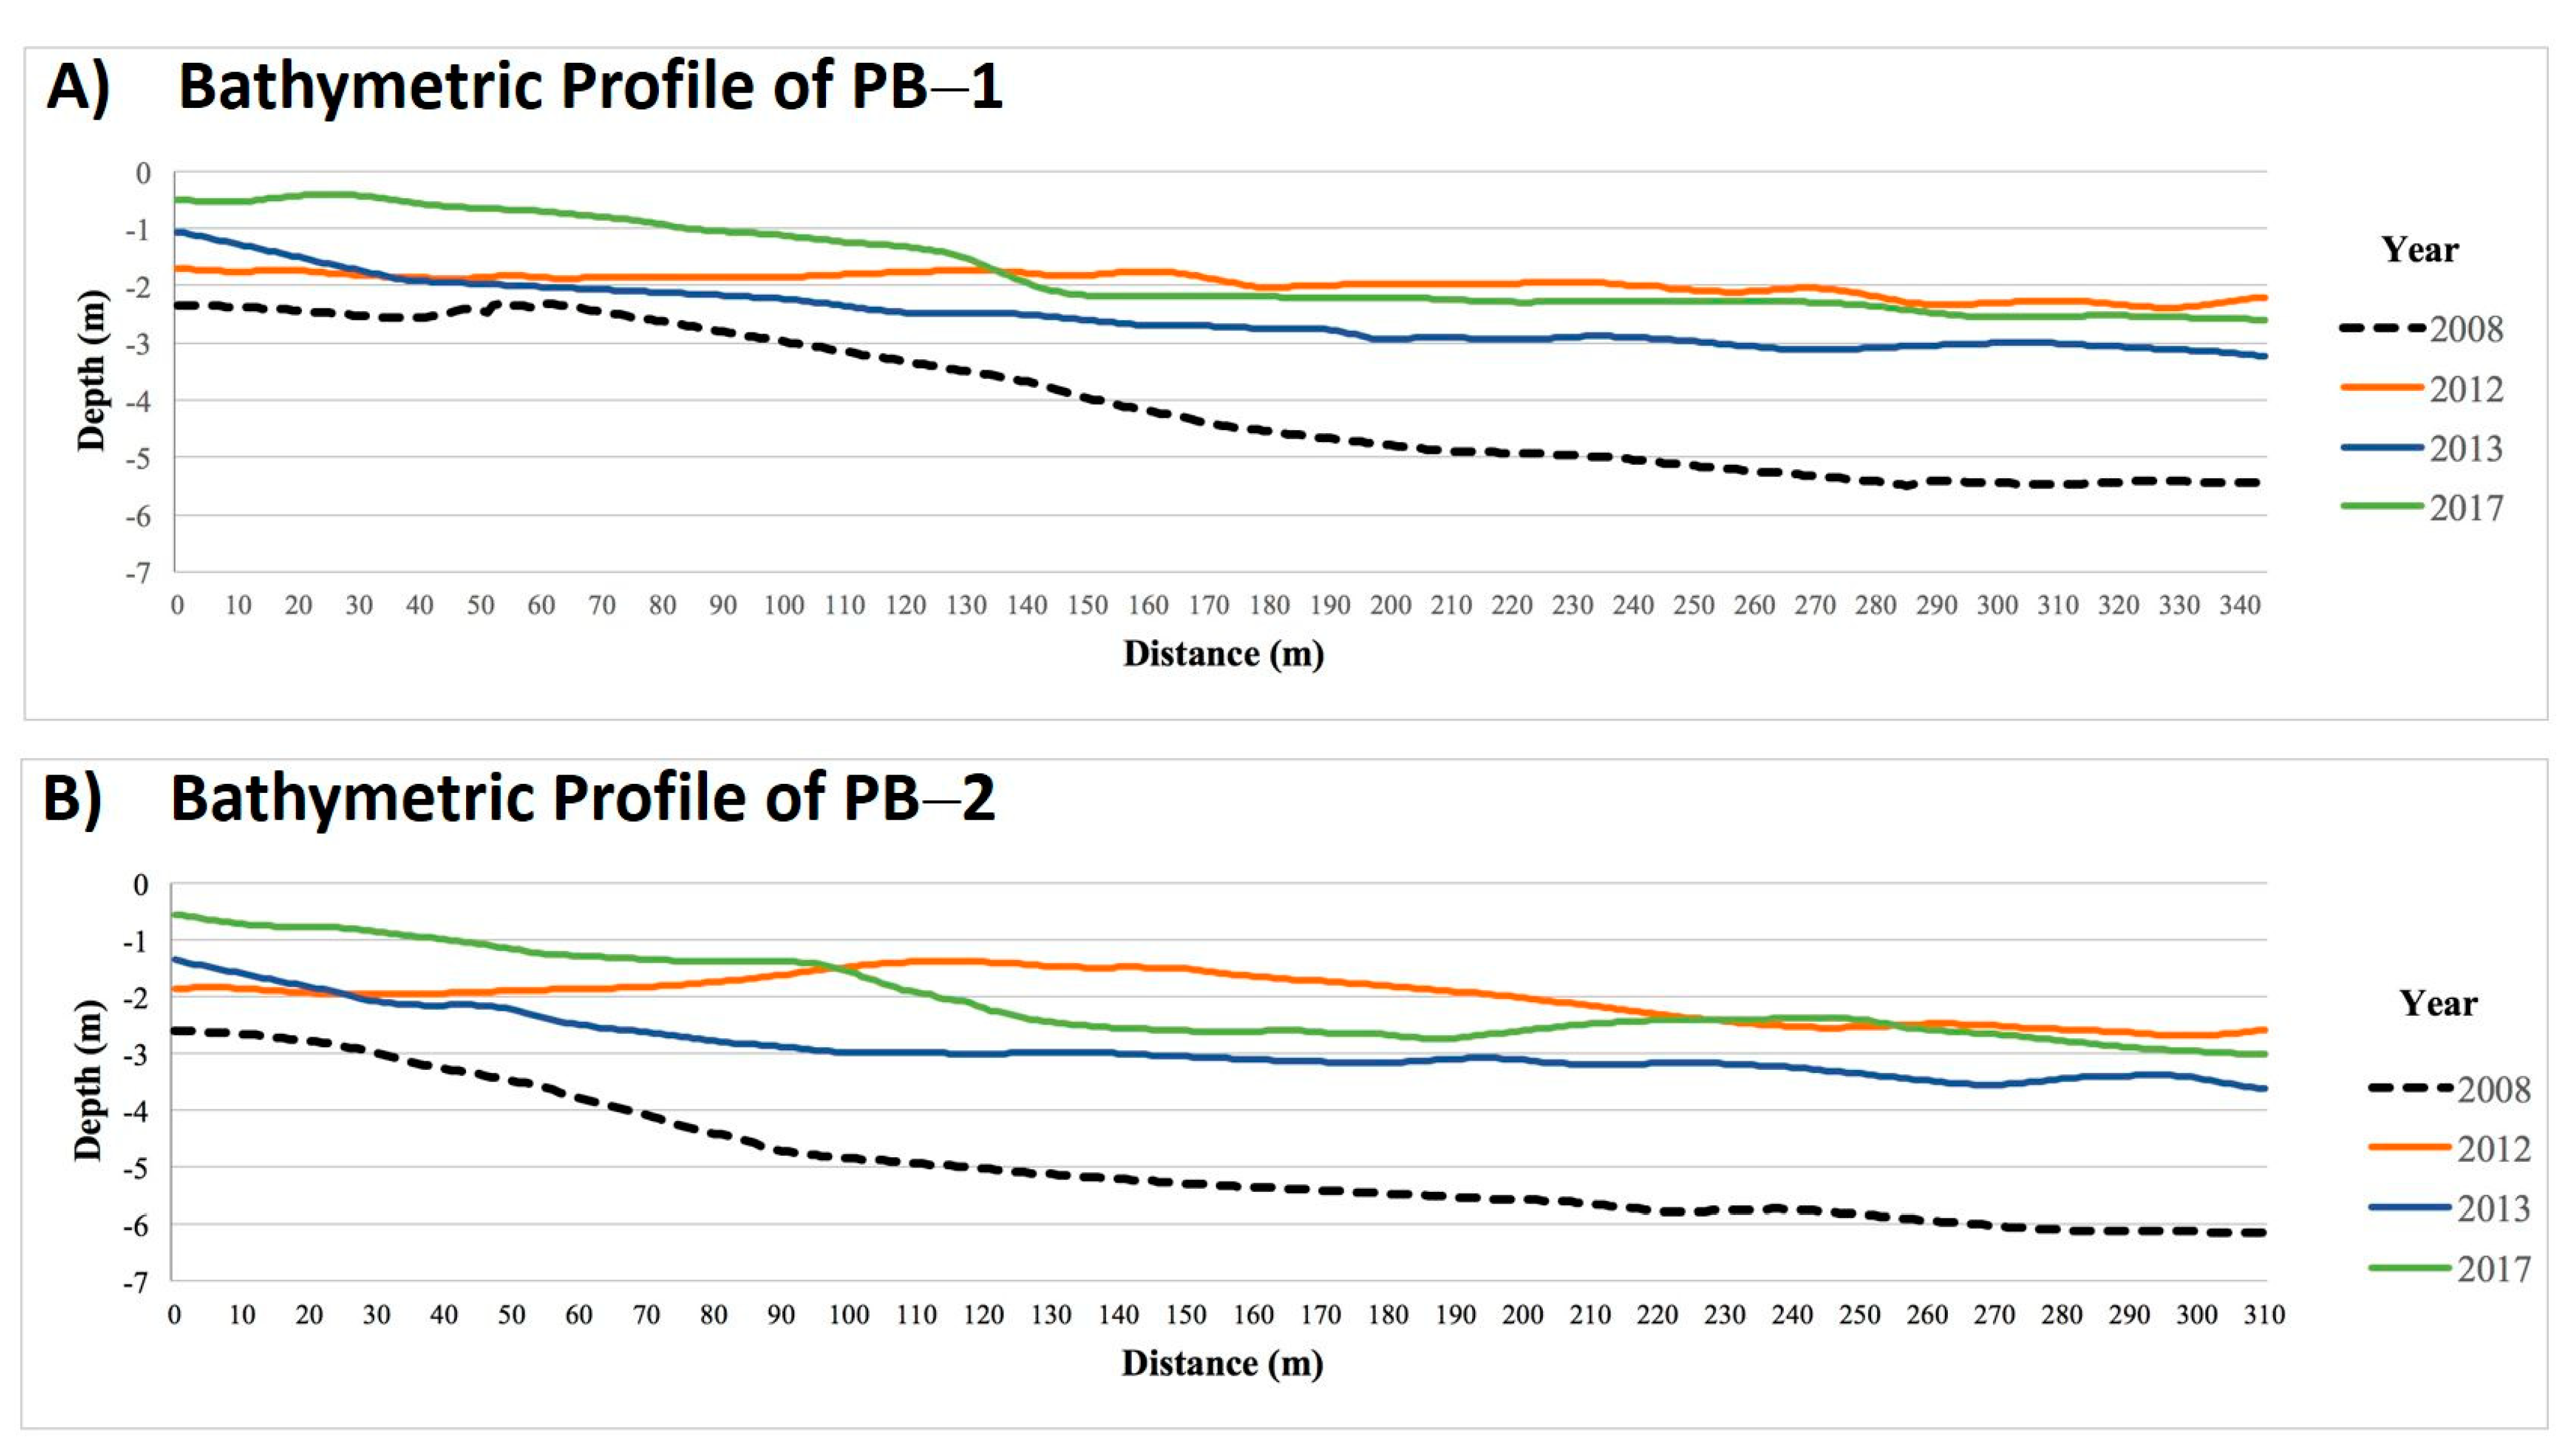
| Profile 1 | Year 2008 | Year 2011 | Year 2012 | Year 2013 |
|---|---|---|---|---|
| Average (m) | −3.512 | −3.085 | −3.368 | −3.062 |
| Difference (m) * | −0.426 | −0.144 | −0.45 | |
| Profile 2 | Year 2008 | Year 2011 | Year 2012 | Year 2013 |
| Average (m) | −2.586 | −2.532 | −3.023 | −2.601 |
| Difference (m) * | −0.054 | 0.436 | 0.014 |
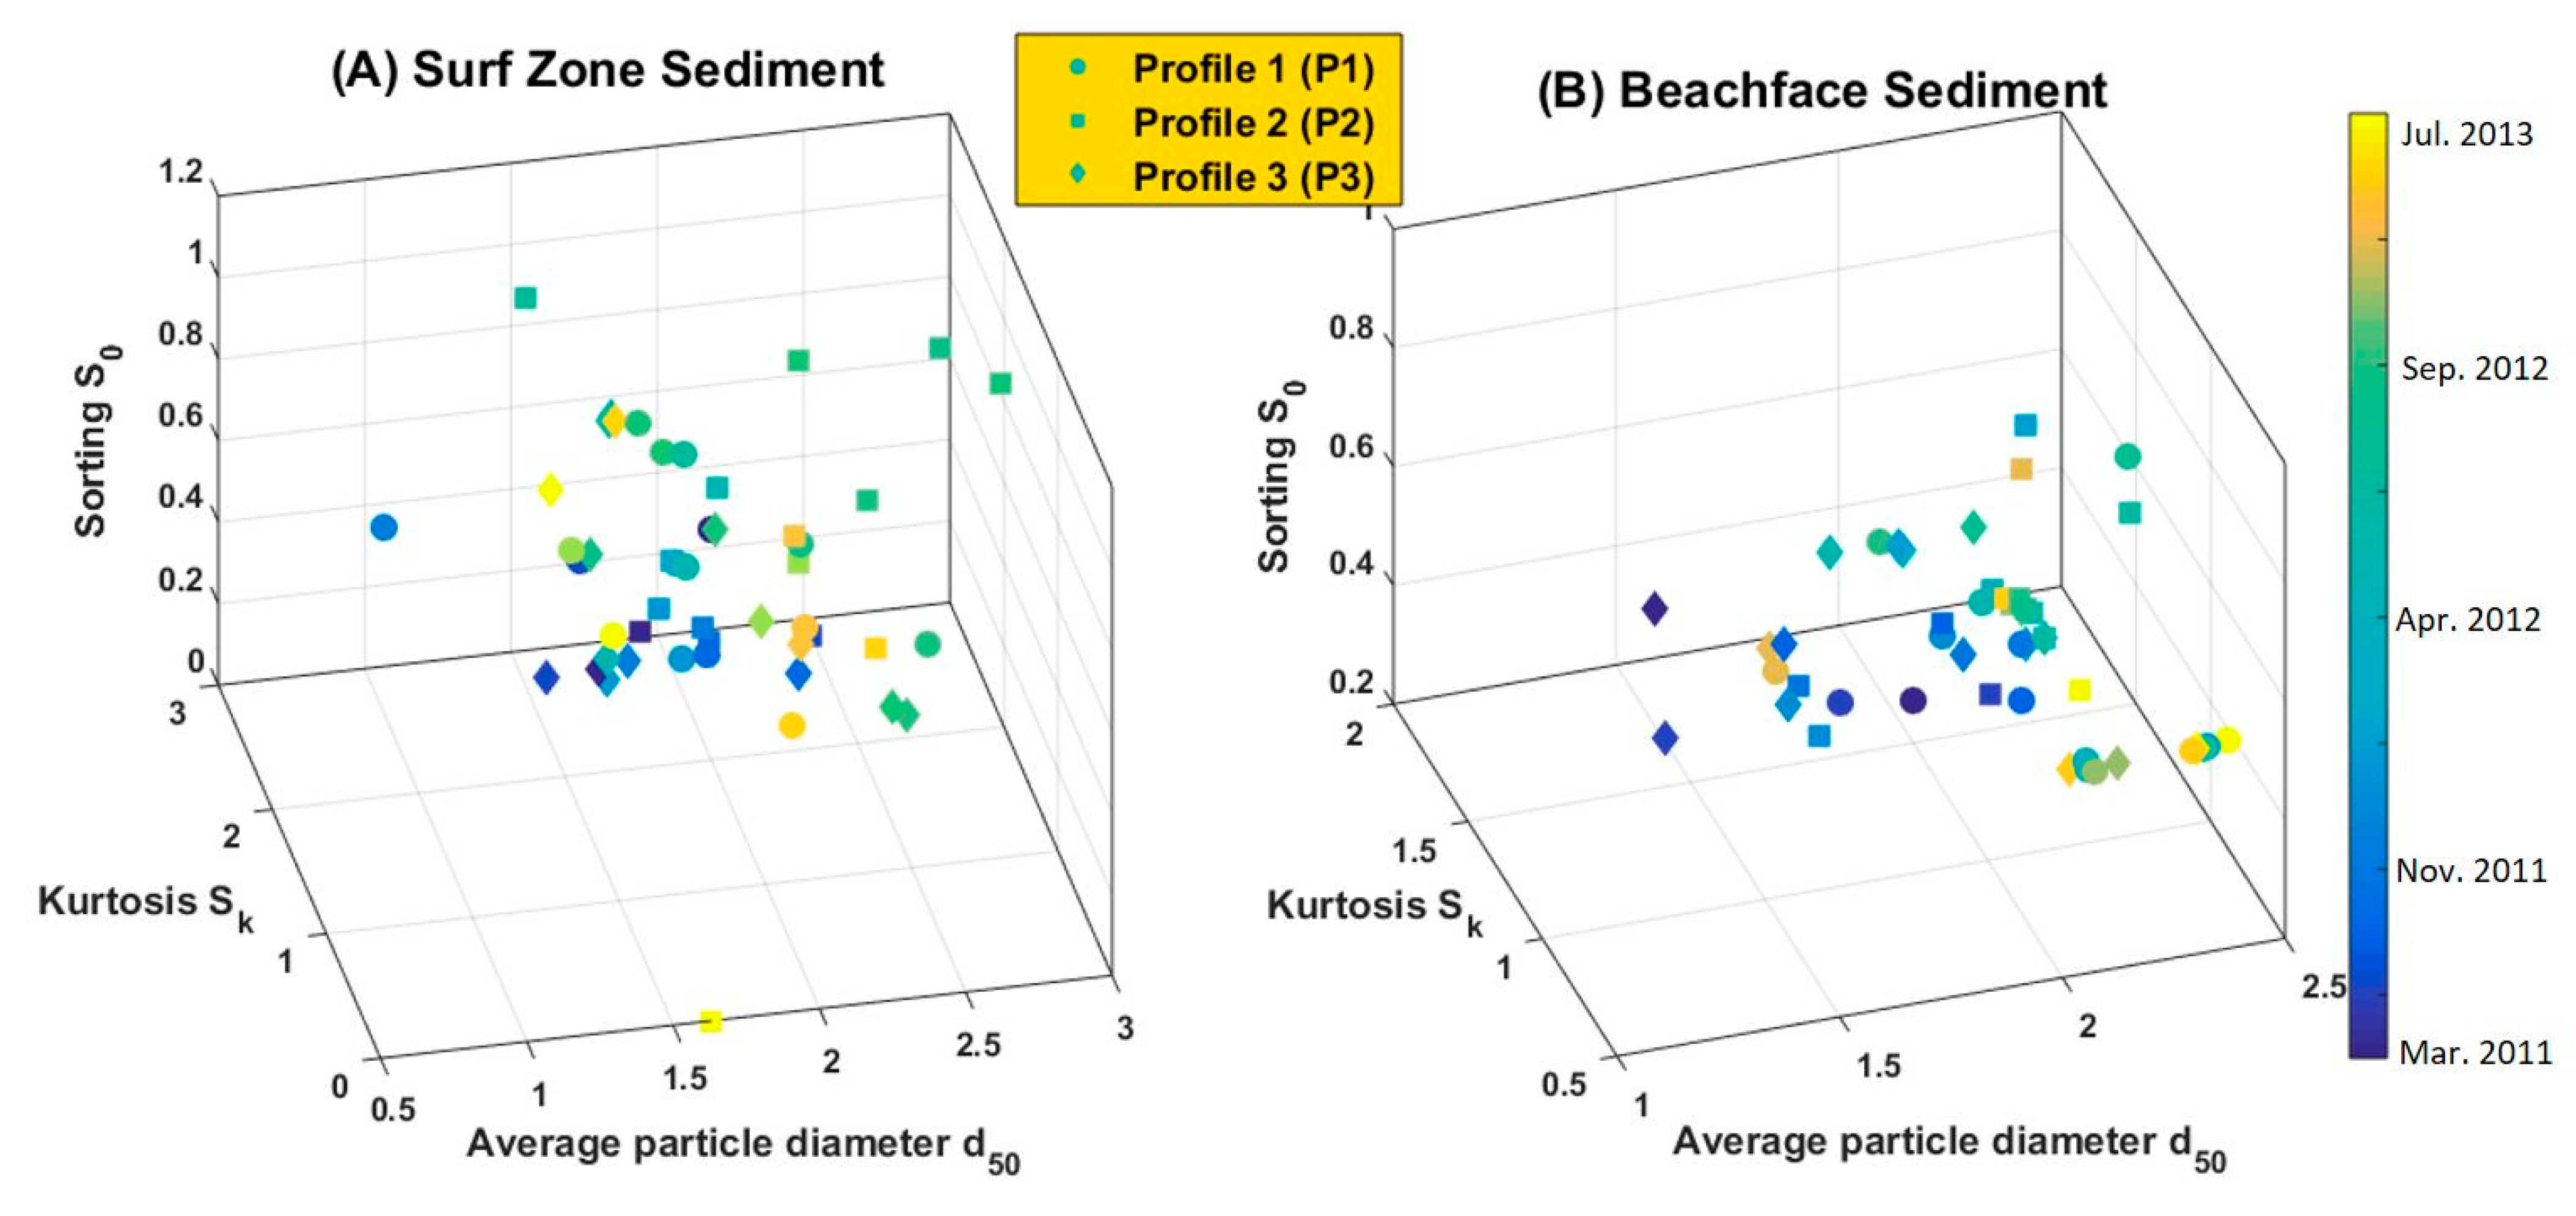
| Date | Average Size φ | Type | Kurtosis Sk | Sorting So | Average Size φ | Type | Kurtosis Sk | Sorting So | Average Size φ | Type | Kurtosis Sk | Sorting So |
|---|---|---|---|---|---|---|---|---|---|---|---|---|
| Profile N1 (P1) | Profile N2 (P2) | Profile N3 (P3) | ||||||||||
| Surfzone | 1.75 | Medium sand | 1.21 | 0.72 | 1.75 | Meddium sand | 1.28 | 0.64 | 2.03 | Fine sand | 1.31 | 0.78 |
| Beachface | 2.07 | Fine sand | 0.89 | 0.52 | 1.85 | Mediun sand | 1.02 | 0.57 | 2.01 | Fine sand | 0.95 | 0.63 |
Publisher’s Note: MDPI stays neutral with regard to jurisdictional claims in published maps and institutional affiliations. |
© 2021 by the authors. Licensee MDPI, Basel, Switzerland. This article is an open access article distributed under the terms and conditions of the Creative Commons Attribution (CC BY) license (https://creativecommons.org/licenses/by/4.0/).
Share and Cite
Martínez, C.; Sepúlveda-Zúñiga, E.; Villagrán, M.; Rojas, O.; Gómez, M.; López, P.; Rojas, C. Coastal Evolution in a Wetland Affected by Large Tsunamigenic Earthquakes in South-Central Chile: Criteria for Integrated Coastal Management. Water 2021, 13, 1467. https://doi.org/10.3390/w13111467
Martínez C, Sepúlveda-Zúñiga E, Villagrán M, Rojas O, Gómez M, López P, Rojas C. Coastal Evolution in a Wetland Affected by Large Tsunamigenic Earthquakes in South-Central Chile: Criteria for Integrated Coastal Management. Water. 2021; 13(11):1467. https://doi.org/10.3390/w13111467
Chicago/Turabian StyleMartínez, Carolina, Einer Sepúlveda-Zúñiga, Mauricio Villagrán, Octavio Rojas, Matías Gómez, Pablo López, and Carolina Rojas. 2021. "Coastal Evolution in a Wetland Affected by Large Tsunamigenic Earthquakes in South-Central Chile: Criteria for Integrated Coastal Management" Water 13, no. 11: 1467. https://doi.org/10.3390/w13111467