
Using Optimal Environmental DNA Method to Improve the Fish Diversity Survey—From Laboratory to Aquatic Life Reserve


1
China National Environmental Monitoring Centre, Beijing 100012, China
2
School of Environment, Beijing Normal University, Beijing 100875, China
*
Authors to whom correspondence should be addressed.
†
Co-first authors.
Water 2021, 13(11), 1468; https://doi.org/10.3390/w13111468
Submission received: 20 March 2021
/
Revised: 20 May 2021
/
Accepted: 21 May 2021
/
Published: 24 May 2021
(This article belongs to the Section Biodiversity and Functionality of Aquatic Ecosystems)
Abstract
:Conserving aquatic ecosystems requires efficient tools to accurately assess the biodiversity of aquatic species. However, existing knowledge is insufficient in terms of the reliability and the comparability of methods measuring fish diversity. Environmental DNA (eDNA), as a promising method, was used to detect fish taxa in this study. We optimized the eDNA method in the laboratory, and applied the optimal eDNA method to survey fish diversity in a natural aquatic life reserve. We simulated necessary steps of the eDNA method in the lab to increase the confidence of the field survey. Specifically, we compared different eDNA sampling, extraction, and sequencing strategies for accurately capturing fish species of the target area. We found that 1L water samples were sufficient for sampling eDNA information of the majority taxa. The filtration was more effective than the centrifugal precipitation for the eDNA extraction. The cloning sequencing was better than the high-throughput sequencing. The field survey showed that the Shannon–Wiener diversity index of fish taxa was the highest in Huairou Reservoir. The diversity index also showed seasonal changes. The accuracy rate of detecting fish taxa was positively correlated with the eDNA concentration. This study provides a scientific reference for an application of the eDNA method in terms of surveying and estimating the biodiversity of aquatic species.
1. Introduction
A sharp decline of biodiversity has been one of the most critical challenges all over the world since the 20th century [1]. Worldwide species extinction rate during this period exceeds that of prehuman periods [2,3]. This severely threatens the sustainability of ecosystems and human health [1,4]. Specifically, in aquatic ecosystems, a rapid decrease of fish diversity is one of the major problems in the management of fishery resources. The decrease is caused by overfishing, water pollution, habitat degradation, genetic pollution, climate change, and invasive species [5,6,7]. Therefore, it is necessary to take effective measures of fish protection. These measures are based on detailed information of fish distribution and population characteristics, as well as the physiological characteristics and ecological niche of different fish. However, due to the complexity of aquatic ecosystems and the diversity of fish migration routes [8], it is extremely difficult for an accurate assessment of fish diversity. Traditional methods of investigating fish diversity, such as trawling, seining, electric fishing [9], underwater acoustic [10], and visual methods, may underestimate fish diversity, since some rare fishes, e.g., endangered species and invasive taxa, are extremely difficult to detect [11,12].
In terms of the abovementioned issues, environmental DNA (eDNA) provides an alternative way of detecting various types of fish. The application of the eDNA method in freshwater ecosystems started in 2008, through the way of detecting the existence of American bullfrogs in a pond [13]. After that, the eDNA method was increasingly used for monitoring aquatic macro-organisms in both freshwater and marine environments [14]. This method is highly efficient, accurate, and nondestructive [12]. The eDNA method is defined as the sum of DNA fragments directly extracted from environmental components, like soil, sediments, or water. The DNA fragments contain the intracellular genetic material released into water by biological cells, and the extracellular DNA released into water after cell structure lysis or death [15]. The eDNA method is based on metagenomics and DNA sequencing technology. DNA fragments extracted from environmental components are identified by molecular biological means and specific gene detection of target fish species. This can be used to analyze the distributional characteristics of target fish species. The eDNA method has progressed in aspects of fish resource management, like gathering the information of endangered fish [16,17], investigating invasive species [18], and evaluating fish diversity [19] and fish prey diversity [20]. Despite advantages of the eDNA method compared to conventional fish survey methods, it should be very careful for an interpretation of eDNA data [21].
Until now, existing knowledge is still insufficient for examining the feasibility and the reliability of the eDNA method in terms of fish diversity survey. That is, what settings of the eDNA method are suitable for specific regions is still not clear. Different sampling methods, laboratory procedures, and bioinformatics were gradually improved to increase the accuracy of the eDNA method and to promote its application in ecology and environment [22]. Different eDNA extraction reagents result in various extraction effects and experimental costs. These may lead to differences in the extraction efficiency of DNA and a weak contrast among operations. The eDNA metabarcoding detected more fish species than that captured by traditional surveys, like electrofishing [23] and underwater visual censuses [24]. In addition, the eDNA metabarcoding was proved to be an efficient bio-monitoring tool for surveying fish diversity, especially in regions often ignored or difficult to access [25].
This study optimized the eDNA method through comparing different sampling amounts, pretreatment steps, DNA extraction, DNA primers, and DNA sequencing by controlled experiments in the laboratory. An optimized eDNA method was thereafter applied in an aquatic reserve to assess the fish diversity. The assessment of the fish diversity provides a scientific reference for improving the local species conservation list and monitoring invasive species. The following questions were addressed: (1) What are the optimal settings of the eDNA method in the laboratory? (2) How does the optimized eDNA method work for the fish diversity survey in the aquatic reserve?
2. Materials and Methods
2.1. Study Area
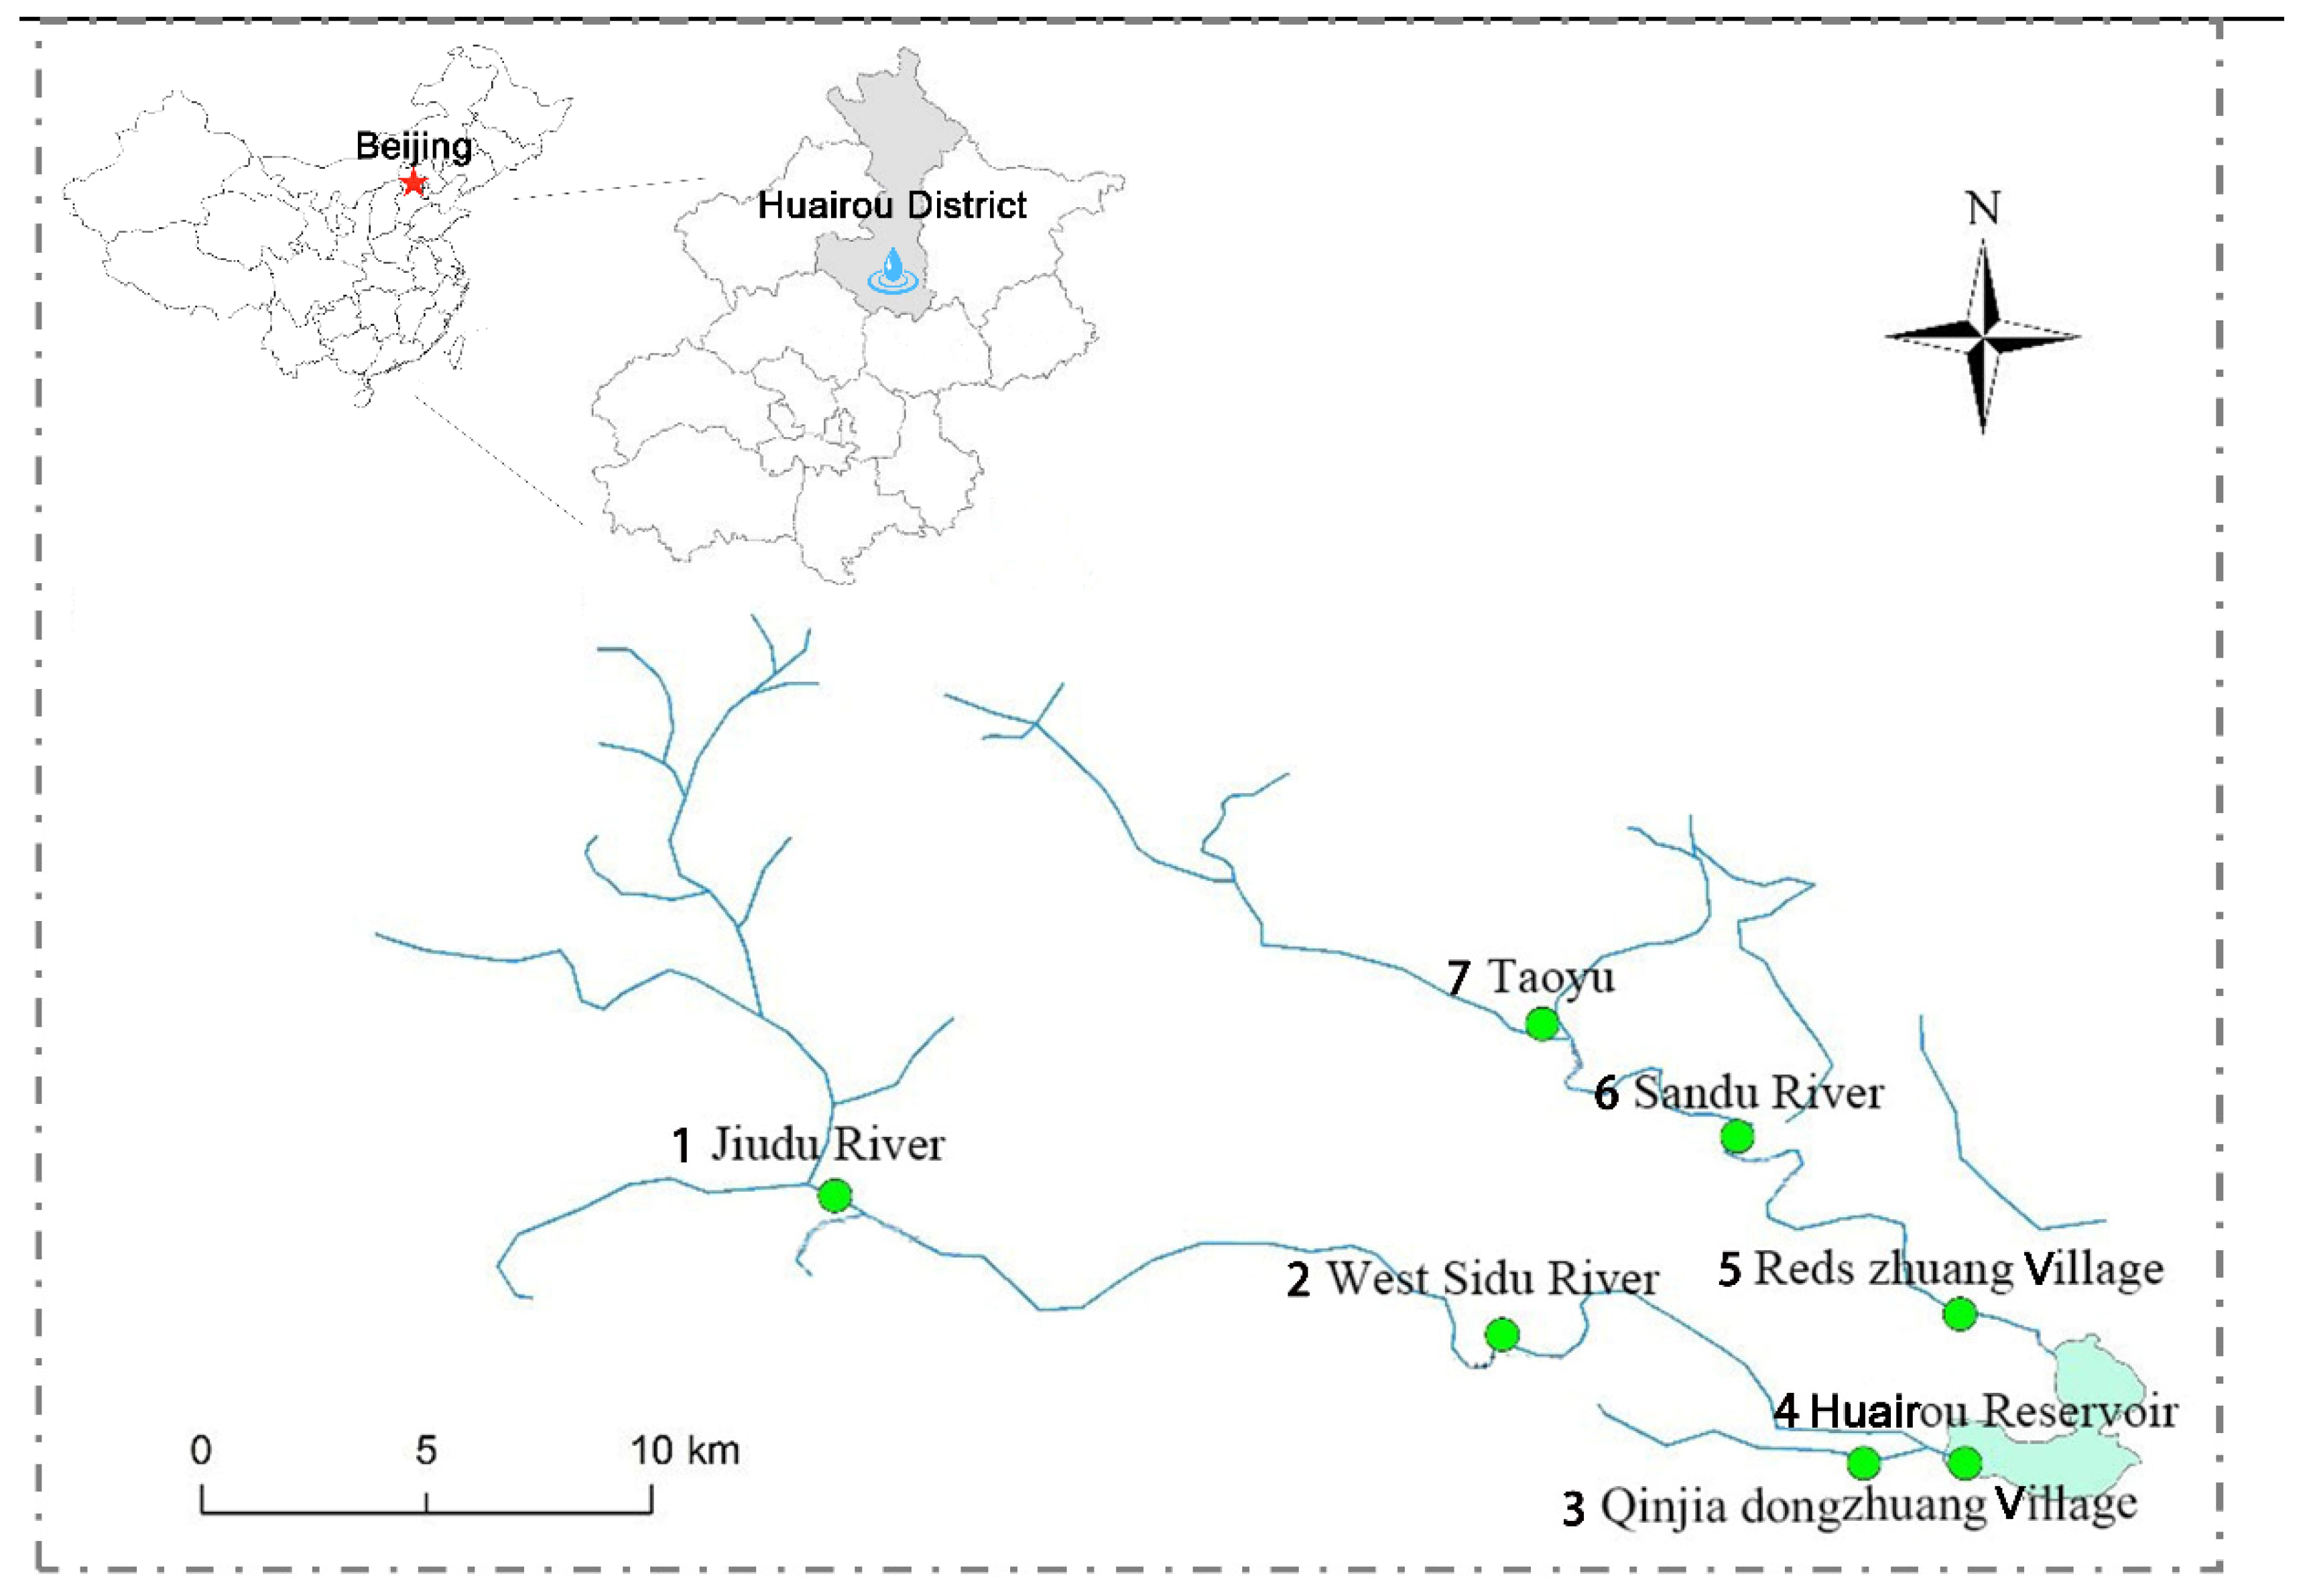
To accurately assess the fish diversity in natural water environments, we firstly needed to optimize the environmental DNA (eDNA) method in the laboratory. Thereafter, the optimized eDNA method was applied in an aquatic life reserve of Beijing. We selected the wild aquatic life reserve in Huairou district of Beijing to investigate the fish diversity. We selected seven sampling points in and around (the upstream and the downstream) the Huairou Reservoir (Figure 1).
2.2. Optimization of Environmental DNA Method in the Laboratory
2.2.1. Water Sample Collection and Processing
In order to eliminate the influence of environmental factors, such as temperature, pH, light, dissolved oxygen, etc., water samples were all collected from the laboratory aquarium. Before sampling, four juvenile crucian carp, commonly seen in Beijing, were raised in the aquarium. These carp were not fed during the experiment to ensure the purity of DNA. Meanwhile, it is necessary to keep the top of the laboratory aquariums sealed and to supply oxygen through an air pump to eliminate the interference of microorganisms and bacteria in the air. In addition, in order to maintain a certain concentration of DNA in the water, the water in the aquarium was not cleared or replaced during the experiment.
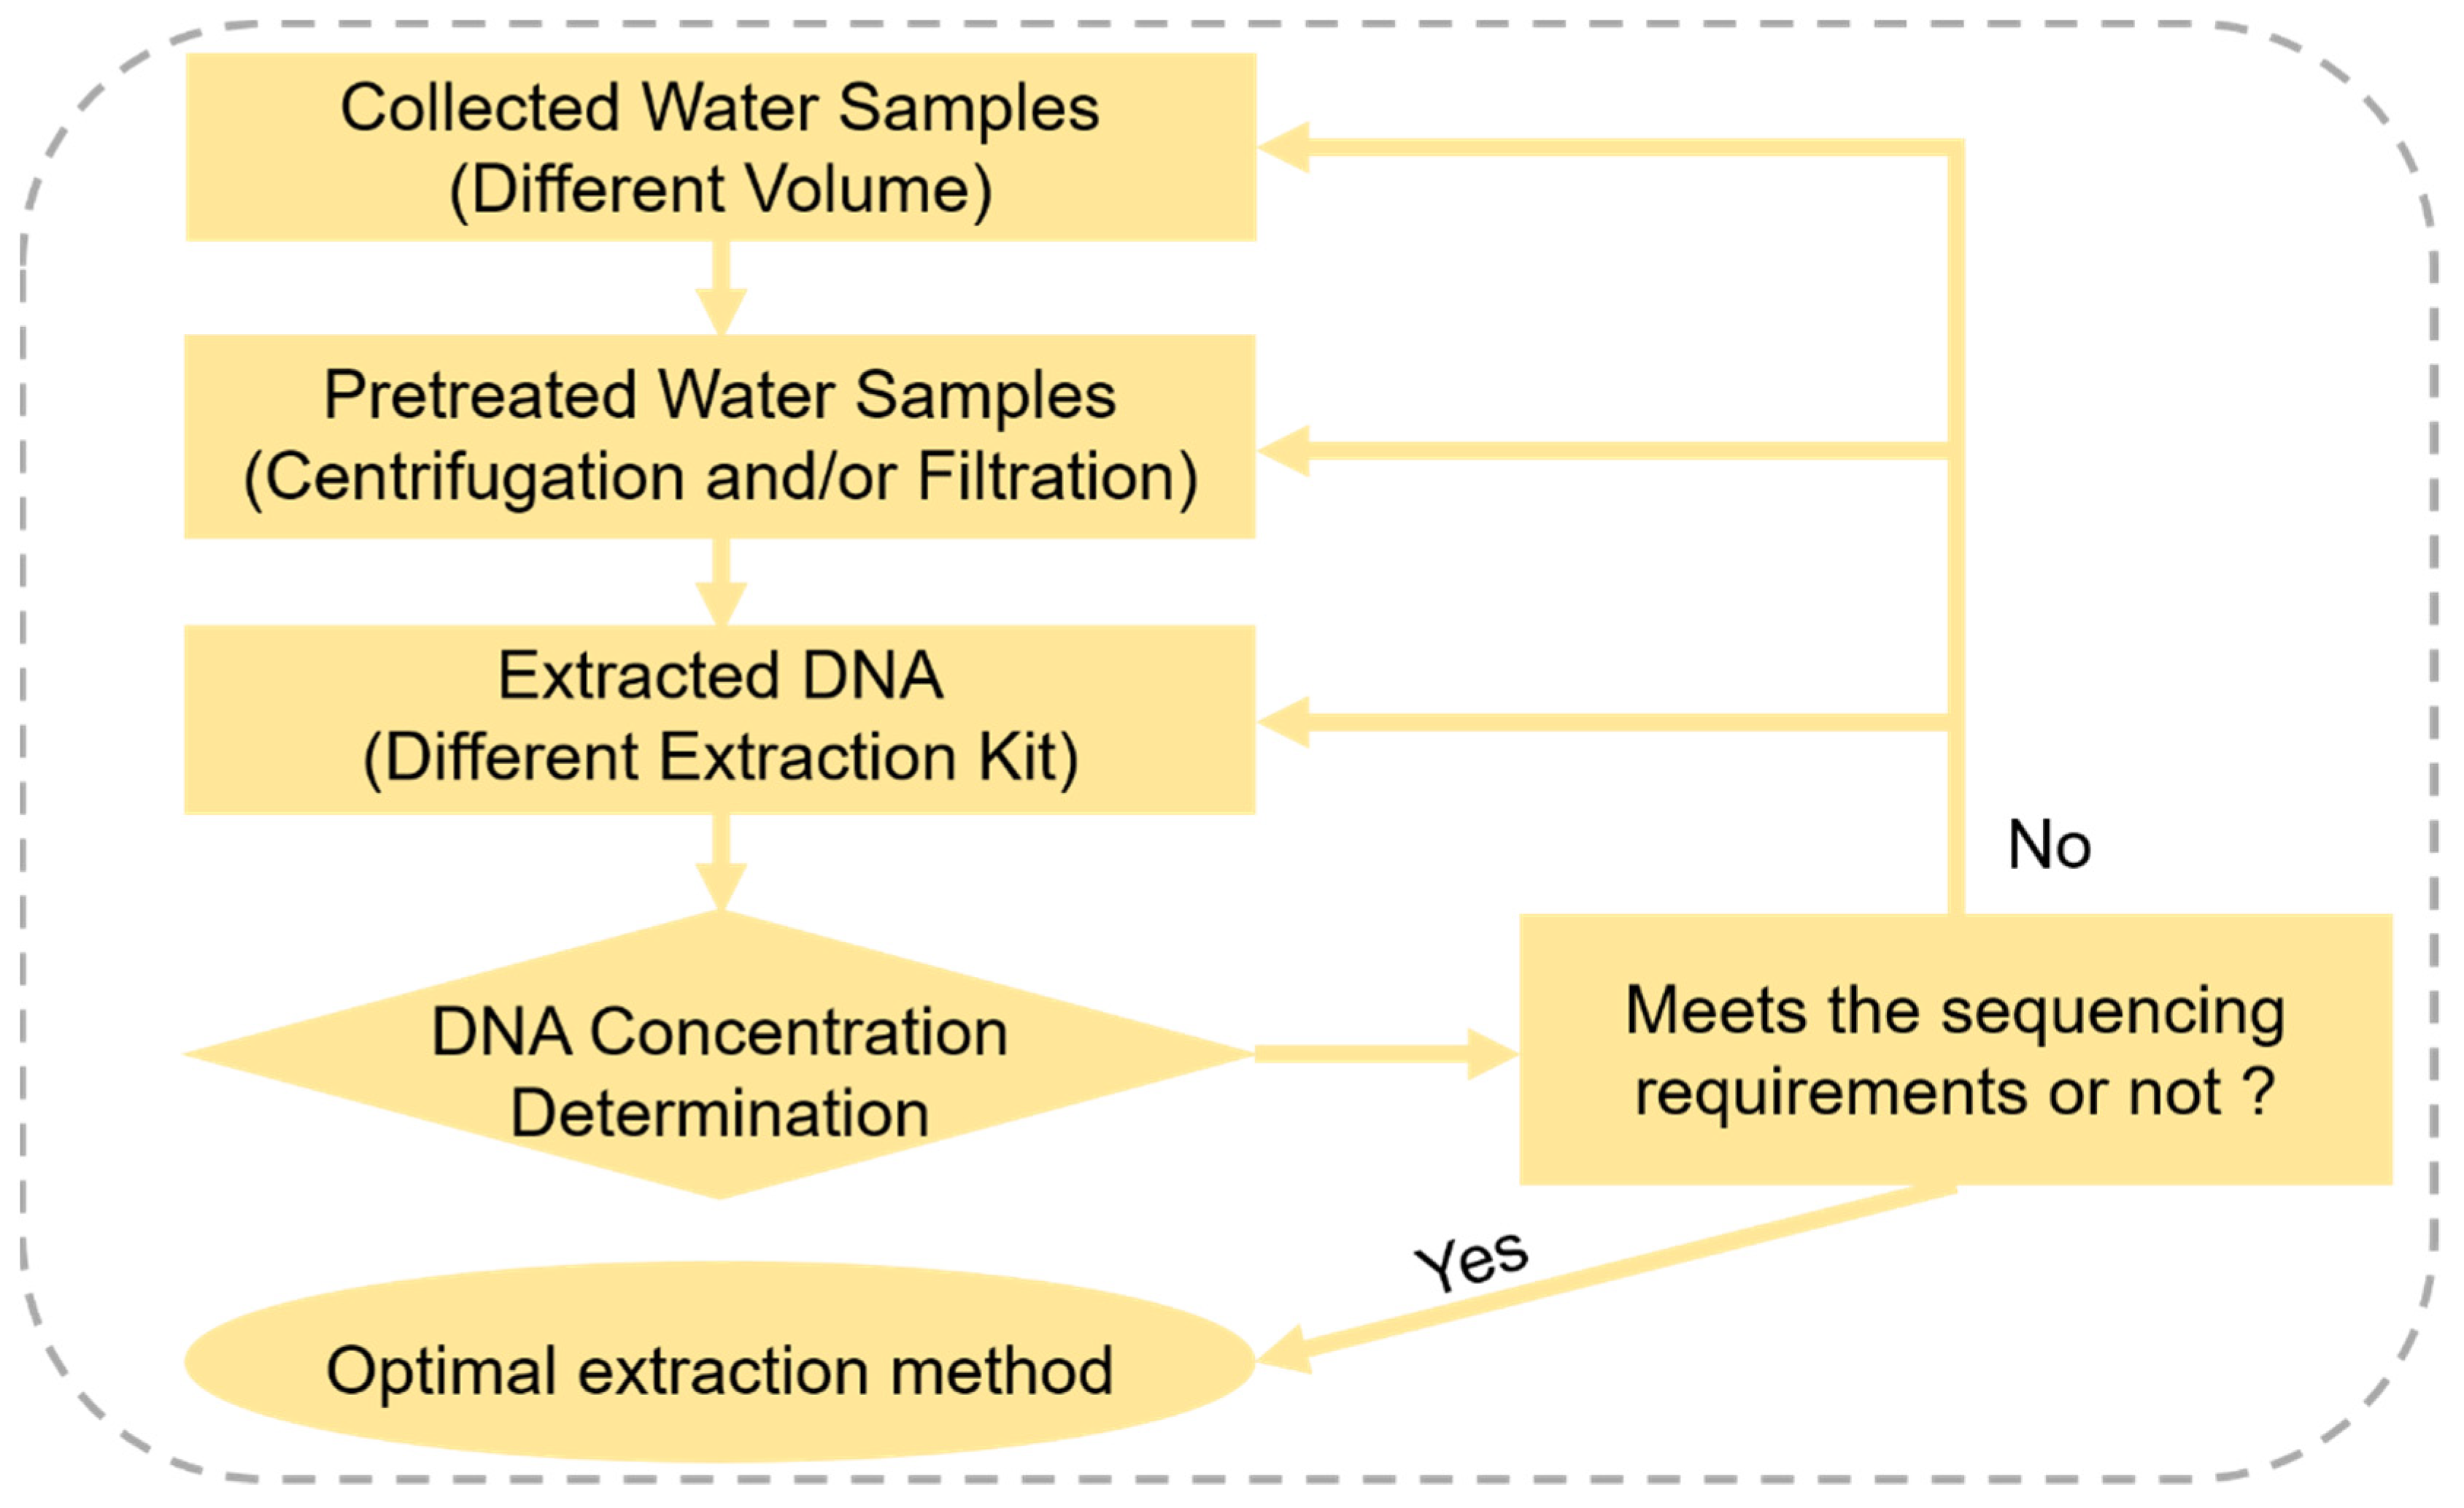
Polypropylene (PP) jars and centrifuge tubes with sterilization were used to collect water. Sample sizes were divided into 15 mL, 1 L, and 2 L, respectively. Among these, 15 mL samples were pretreated by the centrifugal precipitation method. Simultaneously, 1 L and 2 L samples were treated by the filtration method. Four parallel samples were collected to compare different extraction methods. All samples were stored on ice until subsequent processing. The following comparative experiments (Figure 2) were carried out under the premise of the same fish species, water quality conditions, sampling time, and sampling depth.
2.2.2. eDNA Extraction
Centrifugal precipitation method: In this experiment, the specific steps of centrifugal precipitation method are as: using 15 mL surface water from the aquarium and 1.5 mL of 3 M sodium acetate; 33 mL anhydrous ethanol was added before mixing them well; these were centrifuged under −20 °C (3000 r, 10 min), and DNA was extracted with different kits, respectively.
Filtration method: using samples of 1 L and 2 L water from the surface of the aquarium, we filtered and stored the filter membrane at −20 °C until DNA extraction was performed. Extraction experiments were completed within 24 h. We crushed the filter membrane under liquid nitrogen and poured all the debris into a 2 mL centrifuge tube for later use. We carried out the DNA extraction with different kits: MoBio Power Water DNA extraction kit (MoBio Laboratories, San Diego, CA, USA), QIAamp DNA Micro extraction kit (Qiagen, Hilden, Germany), DNeasy Tissue and Blood DNA extraction kit (Qiagen, Germany), Quick-gDNA spin-column kit (MoBio Laboratories, USA). Related operations were followed by the instructions of reagents. In order to obtain a higher DNA concentration, repeated elution was performed three times at the final elution.
The quality of each DNA extract was determined spectrophotometrically using a Nano Drop 2000 c microspectrophotometer (Thermo Fisher Scientific., Waltham, MA, USA). Both concentration and OD ratio were considered in the results.
2.2.3. Primer Comparison
Four pairs of primers (12s, CB, 16s and COI) were selected to find a more suitable DNA region for fish in Beijing area (Table 1 and Table A1 in Appendix A). The detailed information of primers can be found in the Appendix A. In this part, one testing site (Jiudu, in Figure 1) was selected and sampled. Water samples were extracted and sequenced by clone sequencing. Firstly, we took 2 µL purified PCR products connected with carrier pMD18-t, and transformed DH5a cells in constant 37 °C temperature overnight. After the cloning, we selected 50 single colonies and verified colonies PCR with the pairs of primers F and R. We confirmed the PCR products as the target bands by agarose gel electrophoresis and conducted subsequent experiments. We selected 30 single colonies for overnight expansion culture from each sample, then we extracted plasmids using TSINGKE plasmid extraction kit, and then we sequenced them by ABI 3730 XL (ABI).
2.3. Application of Optimized Environmental DNA Method in The Aquatic Reserve
2.3.1. Sampling and DNA Extraction Methods
Two parallel samples were collected at each sampling point, labeled 1-1, 1-2, 2-1, 2-2, 3-1, and 3-2, and so on. Then, the samples were filtered within 24 h through 0.45 µm membrane. After this, the membrane filter was placed in a 2 mL centrifuge tube, which had been sterilized, and was stored in a freezer at −20 °C. The Quick-gDNA spin-column kit [26] was used for extraction and the specific steps referred to reagent instructions.
2.3.2. DNA Amplification and Sequencing
The DNA extracted and a negative ddH2O in the previous step were amplified by PCR using 16s primer [27]. Amplicons were screened with 1% agarose gel, and the negatives showed no bands. Only samples were sequenced by clone sequencing. The detection results were compared with the NCBI database. PCR products were purified and recovered using OMEGA DNA Gel extraction kit. The CPR product was sequenced using clone sequencing as described above.
2.3.3. Quantitative Analysis of Target Fish eDNA
In order to understand the distribution and the demographic stages of fish populations in and around the Huairou Reservoir, it is helpful for us to estimate the biomass of different fish. To determine the relationship between detection time and biomass, Zacco platypus and Odontobutis potamophila were selected as target fish species, to test whether there is a correlation between the results of fluorescent quantitative PCR and check-out times of these two species. Zacco platypus is a protected species in Beijing. Odontobutis potamophila is considered as an invasive species. According to the results of the BLAST gene sequence, we downloaded the full genetic sequence of Zacco platypus and Odontobutis potamophila in the NCBI database. Primer 5.5 software was used for primers screening to obtain the upper and lower primer fragments of the target genes. Then, DNA extraction was conducted according to the instructions of the kit. Real-time PCR reaction system should be configured for DNA samples with three technical replicates (Table A2).
2.3.4. Calculation of Fish Diversity
To analyze fish diversity in the field aquatic reserve, samples were collected twice at seven sampling points in and around the Huairou Reservoir in July and November of 2017. We calculated the species richness and the diversity index. Species richness refers to the number of biological species in the area covered by the sampling sites. Shannon–Wiener index is widely used in the study of regional biodiversity, the calculation referred to Equation (1) [28]. We also calculated the evenness of fish species (Equation (2)). A large value of Shannon–Wiener diversity index indicates a high diversity level of the community and a healthy ecosystem.
H is Shannon–Wiener index, S is the total number of species in a community, and Pi is the biomass ratio of the species i to the total.
E is evenness index, H is Shannon–Wiener index, and S is the total number of species in a community.
3. Results and Discussion
3.1. Optimization of Environmental DNA in the Laboratory
3.1.1. DNA Concentration of Different Sampling Methods in Laboratory
As shown in Table 2, the sample obtained by the centrifugation method has high protein concentration and low nucleic acid concentration. Therefore, the centrifugation method is not suitable for DNA extraction. The sample obtained by DTK and QSK has a higher DNA concentration, while the RNA concentration of QDK and MPK is higher. Therefore, reagents DTK and QSK are the optimal extraction kits for DNA. In addition, DNA concentrations of both DTK and QSK are high. However, the DNA concentration of DTK is 60.7 ng/µL at the sampling of 1 L, which is close to the DNA concentration of QSK at the sampling of 2 L (66.4 ng/µL). Given the difficulty of DNA sample preservation, it is recommended to use QSK for sampling 2 L under laboratory conditions. However, DTK can be used for sampling of 1 L in the field.
3.1.2. Sequencing Results of Different DNA Primers
The amplification results of COI primers only include some bacterial types, which do not meet the purpose of the eDNA detection. Thus, the COI primer is inappropriate for the fish diversity survey in the field. Besides, most of the sequencing structures were heterozygous for CB primer. There is only one species (Epinephelus fuscoguttatus) in cloning sequencing by 12s primer (Table 3). Eight species were revealed by 16s primers with cloning sequencing. By comparing all four pairs of primers, the 16s primer is suitable to tackle this research question.
To sum up, the cloning sequencing meets the needs of assessing fish diversity in field with a low cost, but the high-throughput sequencing provides more possibilities for the detection of unknown fish species. In addition, in the comparison of four pairs of primers, the 16s primer was selected as the optimum DNA primer for the field study, since the 16s primer partially covers some microscopic vertebrates in water, excluding the fish.
Nondestructive biodiversity survey methods, such as eDNA, have significant advantages over traditional methods where the species have to be caught or to be disturbed to get an authentic identification. In order to understand the differences between the eDNA method and traditional methods, we compared the results of this study with that of Xing et al. [28]. The sampling sites and season almost overlapped between both studies. From March 2004 to February 2005, 10 species of the freshwater fish in Sidu River were identified, belonging to 10 genera, 5 families, and 3 orders [28]. This finding is consistent with that of our study. This further proves the reliability of the optimized eDNA method.
3.2. Application of Optimized Environmental DNA Method in the Aquatic Reserve
3.2.1. Fish Diversity from Trawling and eDNA Survey
In order to understand the differences between the eDNA method and trawling methods, we compared the results of this study with those of Xing et al. [28], and with a local record named Beijing Fish Record, published in 1984. The Beijing Fish Record was established based on the whole city trawling survey.
A total of 29 fish species were identified by the sequencing, based on the eDNA samples collected at seven sites in 2017. The record of fish species between 2017 and 2005 is dramatically different (Table 4). There are 16 species of Cypriniformes, accounting for half of the total number. The species of Perciformes, Acipenseriformes, and the catfish represent 18.75%, 12.5%, and 9.375% of the total number, respectively. There are two species of salmon, accounting for 6.25% of the overall number. At the level of family, the Cyprinidae accounts for the largest proportion with 14 species, accounting for 43.75% of all the families. Sturgeon is the second largest, accounting for 12.5% of the total species. For the species of Cyprinidae, gobio has the largest number of species, occupying 35.71%. In addition, Zacco platypus is the most frequently detected fish in the study area, with a detection number of 58. The species Odontobutis potamophila is detected for the first time in Beijing area and is classified as a suspected invasive species.
3.2.2. Fish Diversity
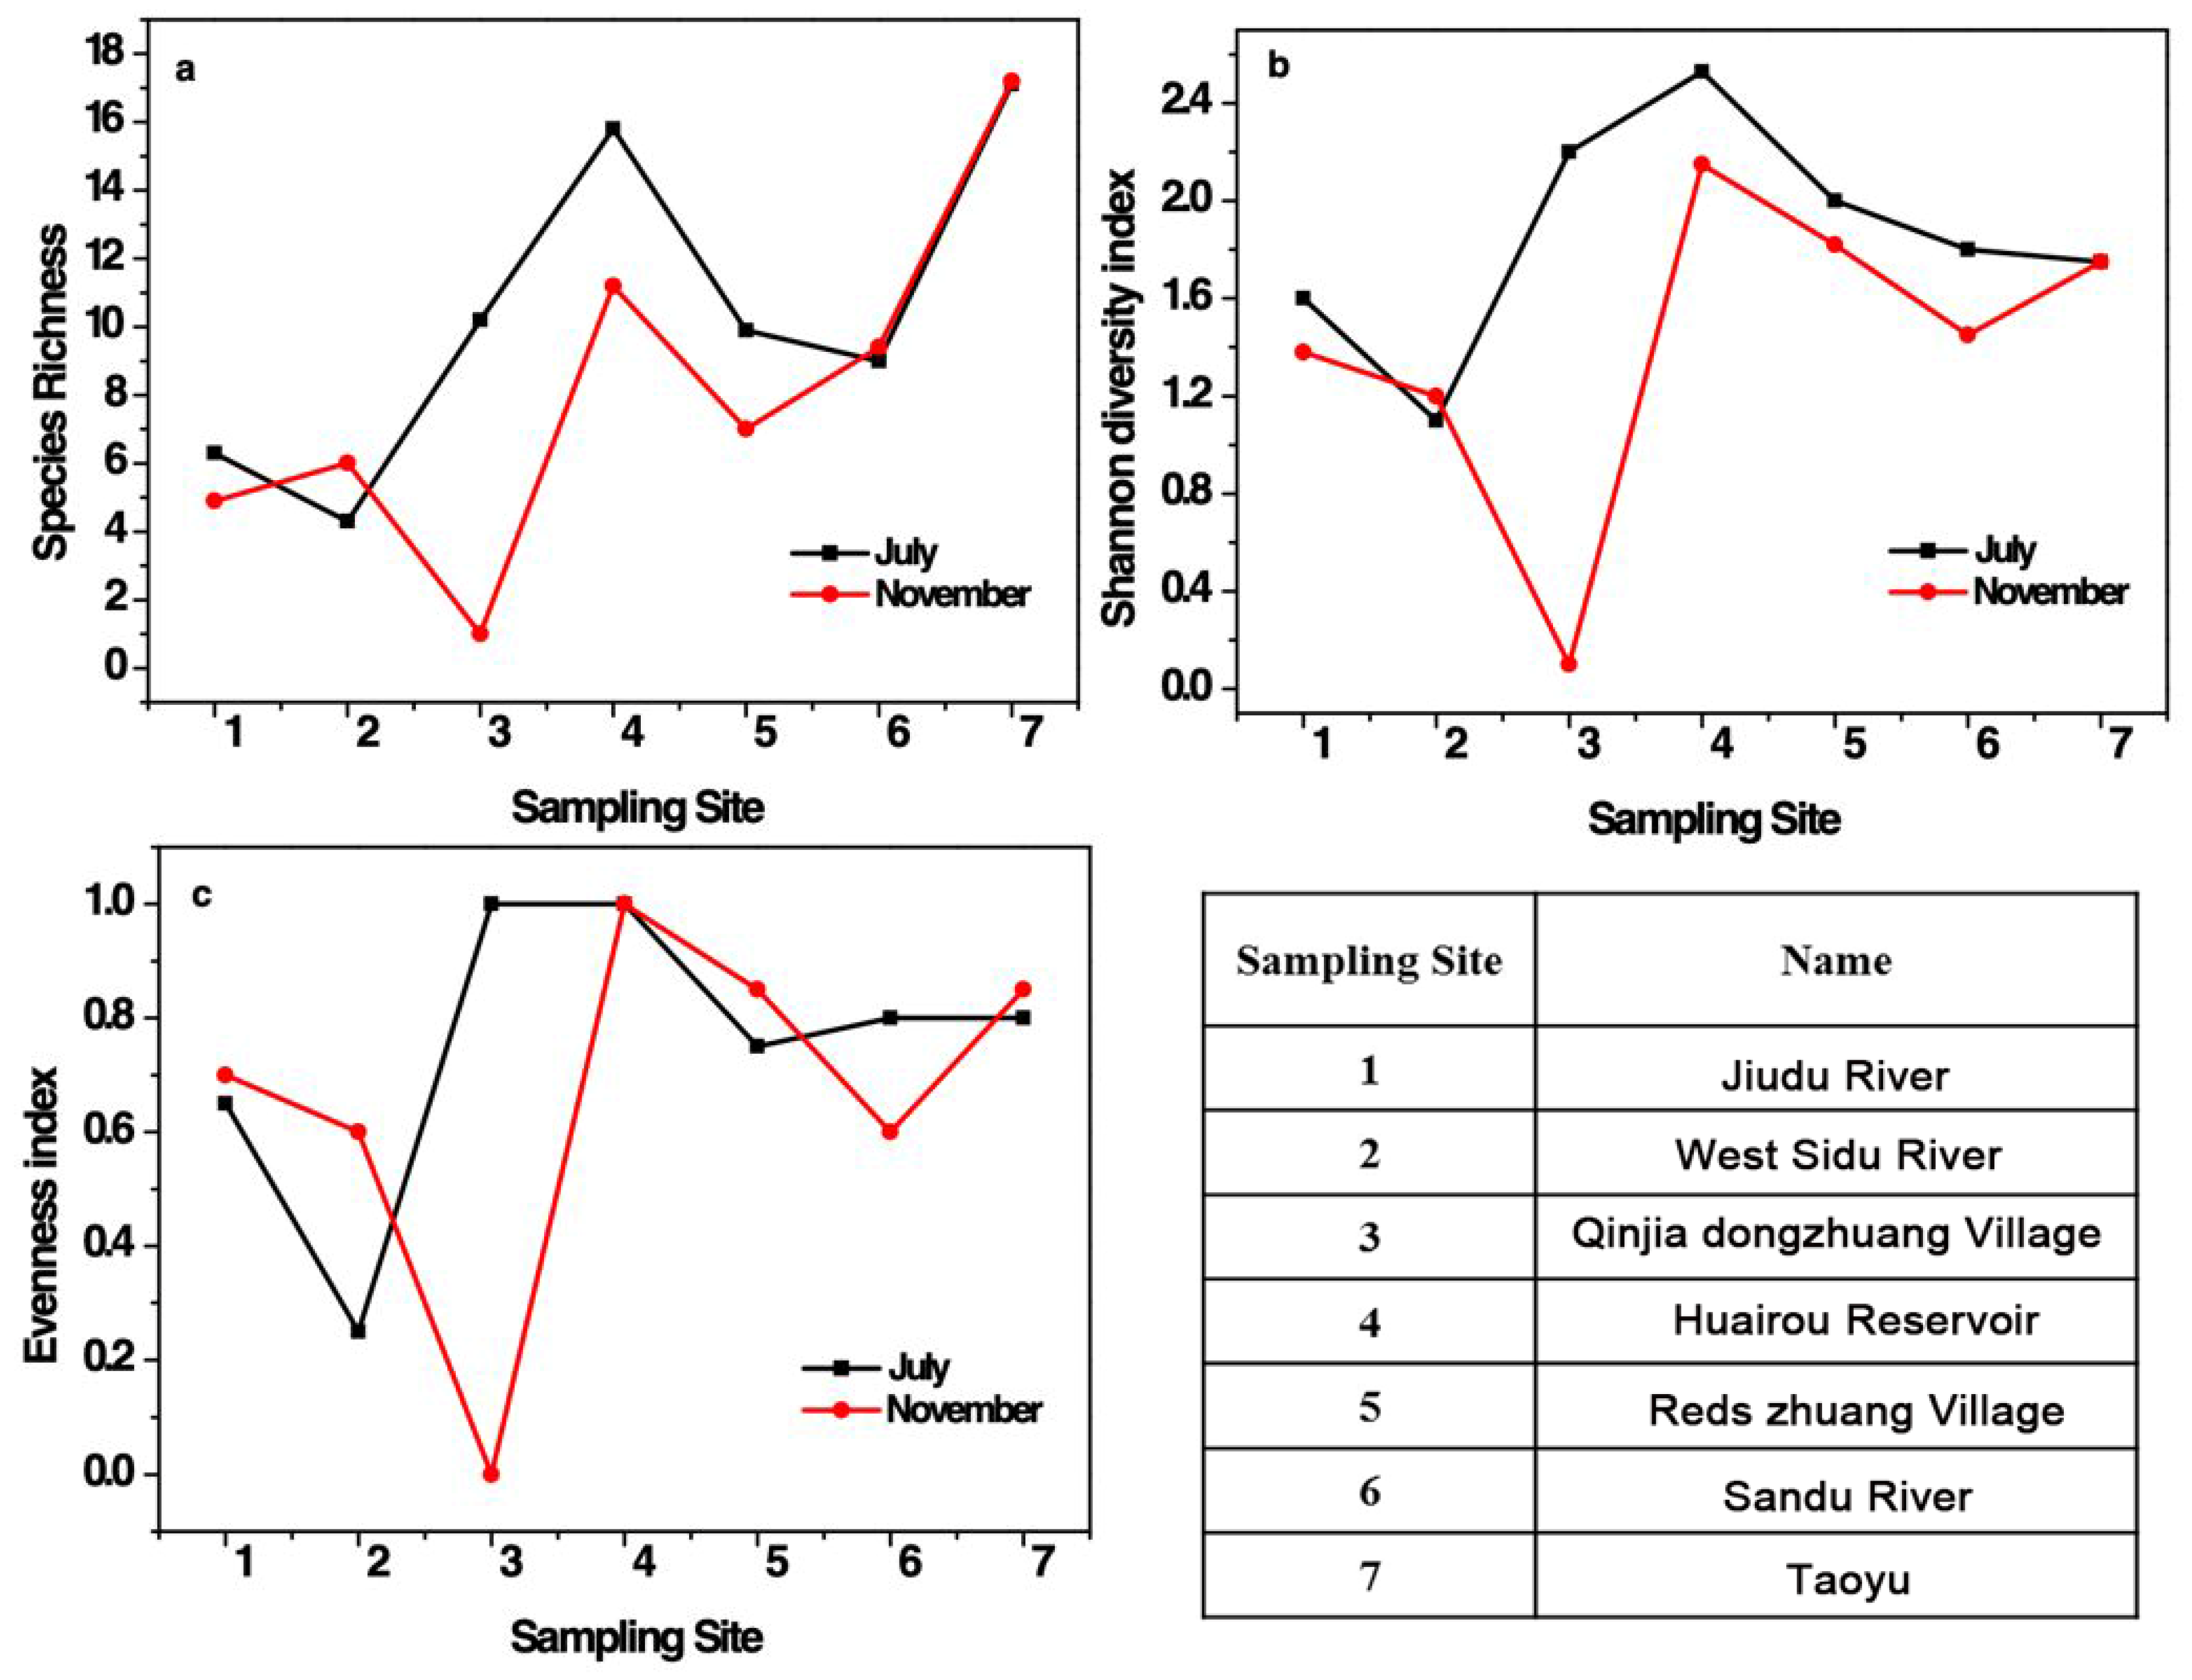
The species richness of fish in July is the highest in the site Taoyu, followed by Huairou Reservoir, Qinjia Dongzhuang Village, and Red’s Zhuang Village, and the lowest in the West Sidu River (Figure 3a). The species richness in November is still the highest in the site Taoyu, followed by Huairou Reservoir, and the lowest in Qinjia Dongzhuang Village. The species richness in July is significantly higher than that in November, except for West Sidu River. This is attributed to a migration of fish with a decreased temperature.
The Shannon–Wiener diversity index in July is higher than that in November, apart from in West Sidu River (Figure 3b). The highest value of the index in July is in Huairou Reservoir, with a value of 2.5, followed by Qinjia Dongzhuang Village and Red’s Zhuang Village near the entrance of the river, with the values of 2.2 and 2.0, respectively. The diversity index of Taoyu is 1.7, and the lowest value is 1.2 in West Sidu River. In November, the highest value of the diversity index appears in Huairou Reservoir, followed by Taoyu. The lowest value is in Qinjia Dongzhuang Village, since only one fish species was found near the entrance of the river and the diversity index is 0. In addition, the evenness index also shows seasonal variations (Figure 3c).
3.2.3. Quantitative Analysis of Target Fish eDNA
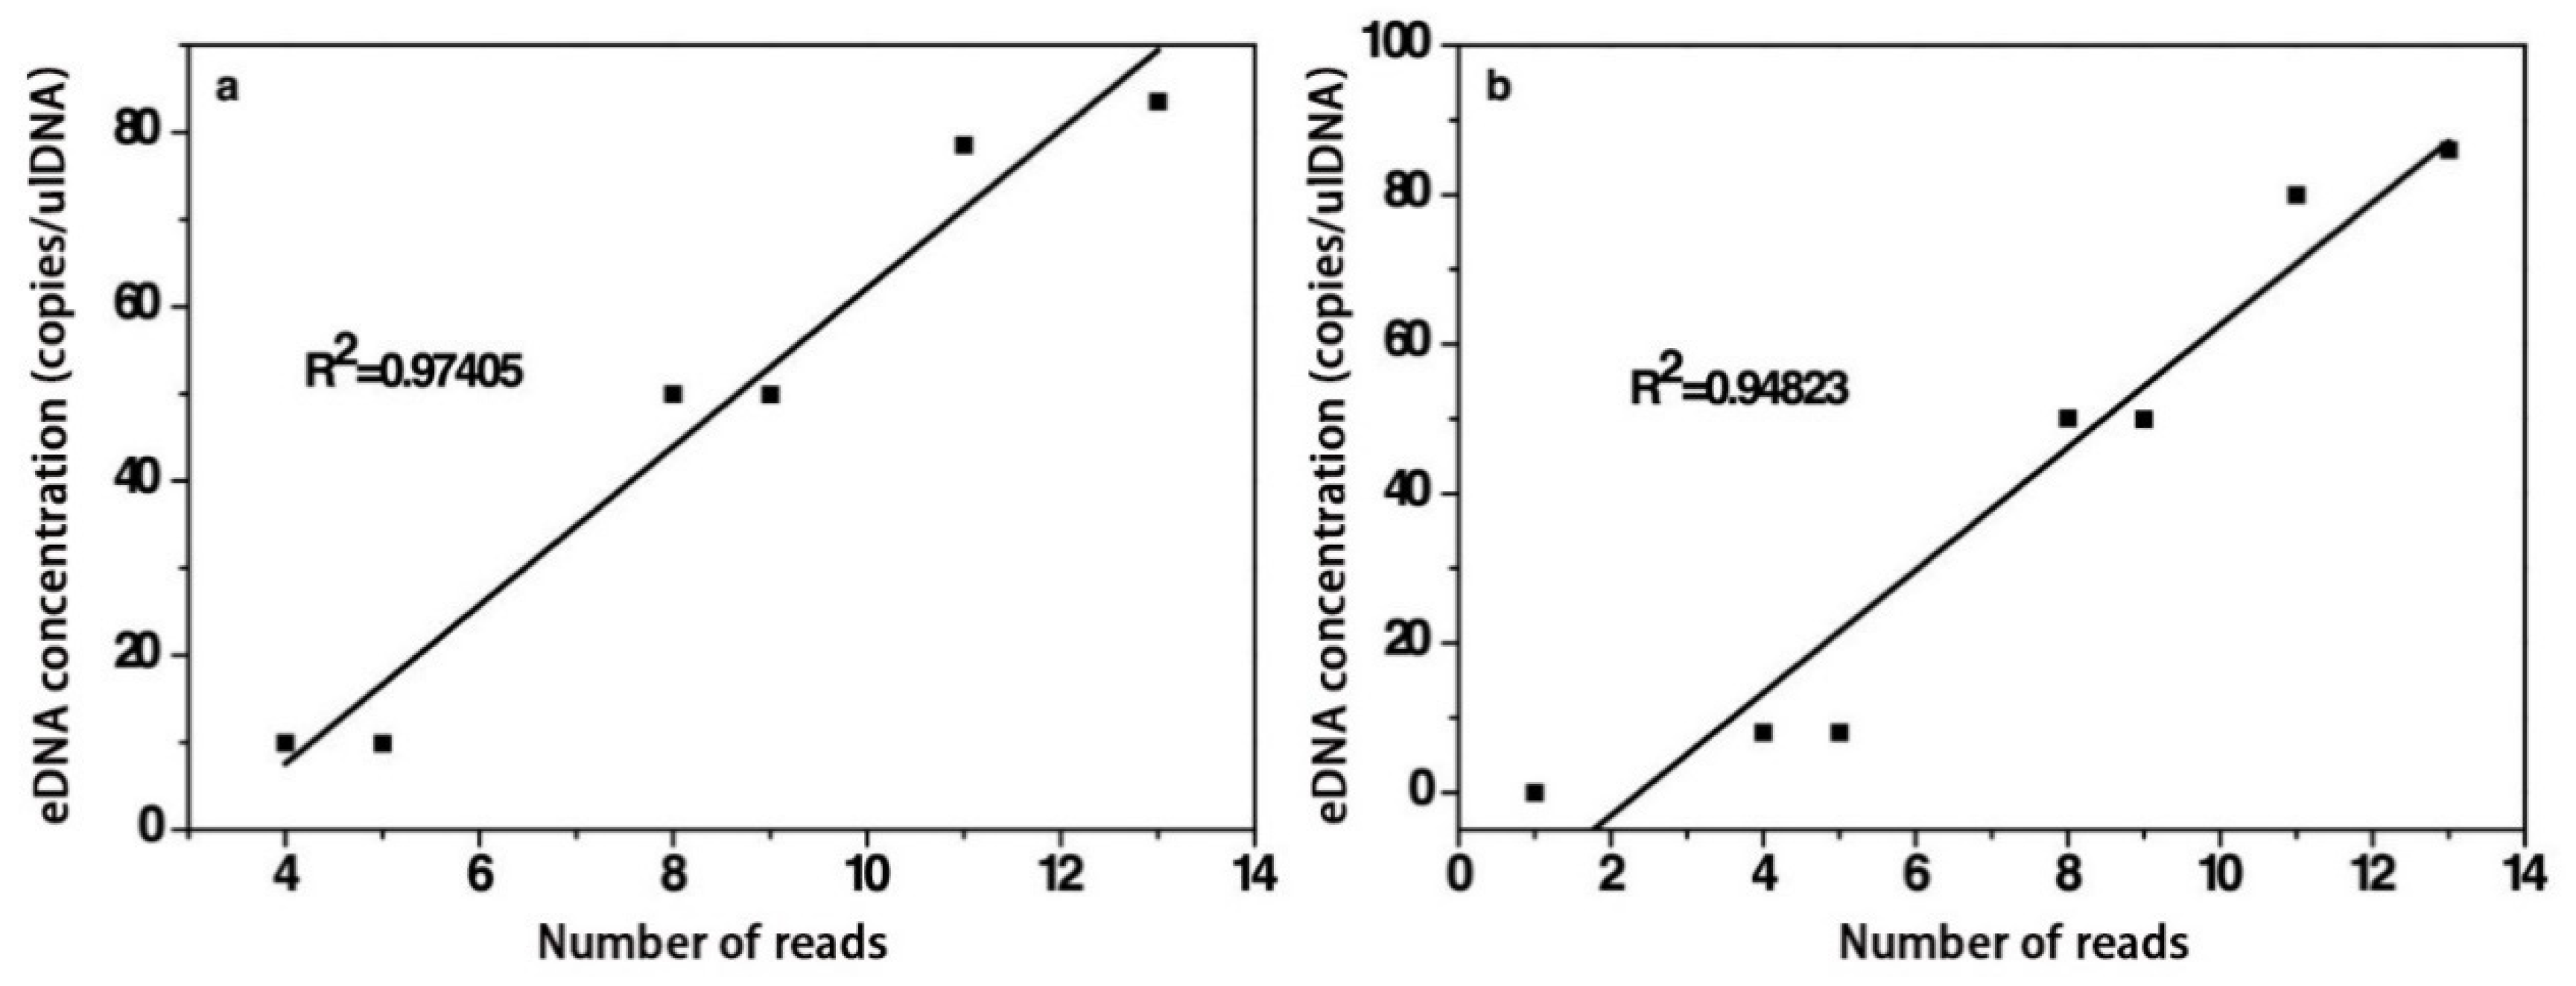
The relationship between eDNA concentrations and the detected reads of Zacco platypus by cloning sequencing is shown in Figure 4. The high coefficient (R2 = 0.97, p < 0.05) shows that eDNA concentrations correlate with reads of Zacco platypus. The coefficient R square of the fitted line is 0.95 (p < 0.05), indicating similar correlations appear in Odontobutis potamophila. It can be inferred that the number of reads is positively correlated to the DNA concentration of the species in water samples. However, due to fewer clones and without repeated experiments for a verification, a specific linear equation cannot be determined.
4. Conclusions
Adopting the environmental DNA (eDNA) method is beneficial for improving the reliability of fish diversity surveys. We firstly simulated necessary steps of the eDNA method in the laboratory through controlled experiments and obtained the optimized settings. Under the same extraction conditions, the DN easy Tissue and Blood DNA extraction kit has the highest concentration and purity of DNA. The DNA purity of the extracts obtained by the filtration method is higher than the centrifugal precipitation method. The sampling amount of 1 L is enough to capture eDNA information of the majority fish taxa. High-throughput sequencing provides more possibilities for the detection of unknown fish species, but clonal sequencing can meet the needs of fish diversity survey with low costs. The 16s primer was considered as the most effective primer for evaluating the fish diversity. These results highlight the necessity of optimizing the eDNA method based on regional characteristics and study objectives. However, data generated during the procedure of optimizing the eDNA method should be interpreted cautiously. Moreover, quantifying effects of environmental factors (e.g., temperature and water quality) on the optimization of the eDNA should be addressed in future researches. The optimized eDNA method was thereafter applied in an aquatic life reserve of Beijing. The results show that there are 29 fish species. The fish species are mainly composed of Cypriniformes and Perciformes. The Shannon–Wiener diversity index of the fish species is the highest in the Huairou Reservoir. Moreover, the diversity index shows seasonal changes. The accuracy rate of detecting fish taxa is positively correlated with the eDNA concentration, based on an evaluation of the fish species Zacco platypus and Odontobutis potamophila. This study provides valuable data for the local fish gene pool, and demonstrates the reliability and high efficiency of the eDNA method in surveying and estimating the biodiversity of aquatic species. In addition, we suggest that the eDNA method and traditional methods of fish survey should be complementary. This allows us to obtain detailed information about demographic and morphologic characteristic of fish species.
Author Contributions
Conceptualization, H.C. and X.X.; methodology, W.-P.L., Z.-F.L.; data curation, W.-P.L., Z.-F.L.; writing—original draft preparation, W.-P.L., Z.-F.L., H.C. and X.X.; writing—review and editing, T.G.; visualization, W.-P.L., Z.-F.L., T.G.; funding acquisition, H.C. All authors have read and agreed to the published version of the manuscript.
Funding
This research was funded by the National Key Research and Development Program of China (No.2017YFC0506603 and 2018YFC0406502).
Institutional Review Board Statement
Not applicable.
Informed Consent Statement
Not applicable.
Data Availability Statement
All data, models, and code generated or used during this study appear in the submitted article.
Conflicts of Interest
The authors declare no conflict of interest.
Appendix A

Table A1.
Primer pairs name, sequence, and amplicon length.
| Primer | Sequence | Fragment Length | Reference |
|---|---|---|---|
| 12S_30F | 5′-CACTGAAGMTGYTAAGAYG-3′ | 700 bp | [29] |
| 12S_1380R | 5′-CTKGCTAAATCATGATGC-3′ | ||
| Fish2degCBF | 5′-ACAACTTCACCCCTGCRAAY-3′ | 540 bp | [30] |
| Fish2CBR | 5′-GATGGCGTAGGCAAATAGGA-3′ | ||
| 16sF | 5′-CGCCTGTTTATCAAAAACAT-3′ | 600 bp | [31] |
| 16sR | 5′-CCGGTCTGAACTCAGATCACGT-3′ | ||
| COIF | 5′-TTCTCCACCAACCACAARGAYATYGG-3′ | 608 bp | [32] |
| COIR | 5′-CACCTCAGGGTGTCCGAARAAYCARAA-3′ |
Table A2.
The primers detected by real-time PCR.
| Primer | Primer Sequences (5′ to 3′) |
|---|---|
| AB741878.1 forward primer | AACATCGCCTCCTGCAAC |
| AB741878.1 reverse primer | GTTTAGCCATTCATACAGGTCTC |
| KF305680.1 forward primer | ATTGATCTACCCGTGCAGAAG |
| KF305680.1 reverse primer | AGGGTAACTCGGTCCGTTG |
References
- Pimm, S.L.; Jenkins, C.N.; Abell, R.; Brooks, T.; Gittleman, J.L.; Joppa, L.N.; Raven, P.H.; Roberts, C.M.; Sexton, J.O. The biodiversity of species and their rates of extinction, distribution, and protection. Science 2014, 344, 1246752. [Google Scholar] [CrossRef]
- Pimm, S.L.; Russell, G.J.; Gittleman, J.L.; Brooks, T. The Future of Biodiversity. Science 1995, 269, 347–350. [Google Scholar] [CrossRef] [Green Version]
- Barnosky, A.D.; Matzke, N.; Tomiya, S.; Wogan, G.O.U.; Swartz, B.; Quental, T.B.; Marshall, C.R.; McGuire, J.L.; Lindsey, E.L.; Maguire, K.C.; et al. Has the Earth’s sixth mass extinction already arrived? Nat. Cell Biol. 2011, 471, 51–57. [Google Scholar] [CrossRef] [PubMed]
- Yasuhara, M.; Wei, C.-L.; Kucera, M.; Costello, M.J.; Tittensor, D.P.; Kiessling, W.; Bonebrake, T.C.; Tabor, C.R.; Feng, R.; Baselga, A.; et al. Past and future decline of tropical pelagic biodiversity. Proc. Natl. Acad. Sci. USA 2020, 117, 12891–12896. [Google Scholar] [CrossRef] [PubMed]
- Trathan, P.N.; García-Borboroglu, P.; Boersma, D.; Bost, C.; Crawford, R.J.M.; Crossin, G.T.; Cuthbert, R.J.; Dann, P.; Davis, L.S.; De La Puente, S.; et al. Pollution, habitat loss, fishing, and climate change as critical threats to penguins. Conserv. Biol. 2015, 29, 31–41. [Google Scholar] [CrossRef] [PubMed]
- Stafford, R.; Jones, P.J. Viewpoint—Ocean plastic pollution: A convenient but distracting truth? Mar. Policy 2019, 103, 187–191. [Google Scholar] [CrossRef] [Green Version]
- Jackson, J.B.C.; Kirby, M.X.; Berger, W.H.; Bjorndal, K.A.; Botsford, L.W.; Bourque, B.J.; Bradbury, R.H.; Cooke, R.; Erlandson, J.; Estes, J.A.; et al. Historical Overfishing and the Recent Collapse of Coastal Ecosystems. Science 2001, 293, 629–637. [Google Scholar] [CrossRef] [PubMed] [Green Version]
- Kaimuddin, A.H.; Laë, R.; De Morais, L.T. Fish Species in a Changing World: The Route and Timing of Species Migration between Tropical and Temperate Ecosystems in Eastern Atlantic. Front. Mar. Sci. 2016, 3, 162. [Google Scholar] [CrossRef]
- Lapointe, N.W.R.; Corkum, L.D.; Mandrak, N.E. A Comparison of Methods for Sampling Fish Diversity in Shallow Offshore Waters of Large Rivers. N. Am. J. Fish. Manag. 2006, 26, 503–513. [Google Scholar] [CrossRef]
- Desiderà, E.; Guidetti, P.; Panzalis, P.; Navone, A.; Valentini-Poirrier, C.; Boissery, P.; Gervaise, C.; Di Iorio, L. Acoustic fish communities: Sound diversity of rocky habitats reflects fish species diversity. Mar. Ecol. Prog. Ser. 2019, 608, 183–197. [Google Scholar] [CrossRef] [Green Version]
- Lodge, D.M.; Williams, S.; MacIsaac, H.J.; Hayes, K.R.; Leung, B.; Reichard, S.; Mack, R.N.; Moyle, P.B.; Smith, M.; Andow, D.A.; et al. Biological invasions: Recommendations for U.S. policy and management. Ecol. Appl. 2006, 16, 2035–2054. [Google Scholar] [CrossRef] [Green Version]
- Jerde, C.L.; Mahon, A.R.; Chadderton, W.L.; Lodge, D.M. “Sight-unseen” detection of rare aquatic species using environmental DNA. Conserv. Lett. 2011, 4, 150–157. [Google Scholar] [CrossRef]
- Ficetola, G.F.; Miaud, C.; Pompanon, F.; Taberlet, P. Species detection using environmental DNA from water samples. Biol. Lett. 2008, 4, 423–425. [Google Scholar] [CrossRef] [PubMed] [Green Version]
- Hansen, B.K.; Jacobsen, M.W.; Middelboe, A.L.; Preston, C.M.; Marin, R.; Bekkevold, D.; Knudsen, S.W.; Møller, P.R.; Nielsen, E.E. Remote, autonomous real-time monitoring of environmental DNA from commercial fish. Sci. Rep. 2020, 10, 1–8. [Google Scholar] [CrossRef] [PubMed]
- Rees, H.C.; Maddison, B.C.; Middleditch, D.J.; Patmore, J.R.; Gough, K. REVIEW: The detection of aquatic animal species using environmental DNA—A review of eDNA as a survey tool in ecology. J. Appl. Ecol. 2014, 51, 1450–1459. [Google Scholar] [CrossRef]
- Laramie, M.B.; Pilliod, D.S.; Goldberg, C.S. Characterizing the distribution of an endangered salmonid using environmental DNA analysis. Biol. Conserv. 2015, 183, 29–37. [Google Scholar] [CrossRef] [Green Version]
- Xu, N.; Zhu, B.; Shi, F.; Shao, K.; Que, Y.; Li, W.; Li, W.; Jiao, W.; Tian, H.; Xu, D.; et al. Monitoring seasonal distribution of an endangered anadromous sturgeon in a large river using environmental DNA. Naturwissenschaften 2018, 105, 62. [Google Scholar] [CrossRef] [PubMed]
- Takahara, T.; Minamoto, T.; Doi, H. Using Environmental DNA to Estimate the Distribution of an Invasive Fish Species in Ponds. PLoS ONE 2013, 8, e56584. [Google Scholar] [CrossRef] [PubMed] [Green Version]
- Thomsen, P.F.; Willerslev, E. Environmental DNA—An emerging tool in conservation for monitoring past and present biodiversity. Biol. Conserv. 2015, 183, 4–18. [Google Scholar] [CrossRef]
- Qu, C.; Stewart, K.A.; Clemente-Carvalho, R.; Zheng, J.; Wang, Y.; Gong, C.; Ma, L.; Zhao, J.; Lougheed, S.C. Comparing fish prey diversity for a critically endangered aquatic mammal in a reserve and the wild using eDNA metabarcoding. Sci. Rep. 2020, 10, 1–16. [Google Scholar] [CrossRef] [PubMed]
- Shaw, J.L.; Clarke, L.J.; Wedderburn, S.D.; Barnes, T.C.; Weyrich, L.S.; Cooper, A. Comparison of environmental DNA metabarcoding and conventional fish survey methods in a river system. Biol. Conserv. 2016, 197, 131–138. [Google Scholar] [CrossRef]
- Wang, S.; Yan, Z.; Hänfling, B.; Zheng, X.; Wang, P.; Fan, J.; Li, J. Methodology of fish eDNA and its applications in ecology and environment. Sci. Total Environ. 2021, 755, 142622. [Google Scholar] [CrossRef]
- Muha, T.P.; Rodriguez-Barreto, D.; O’Rorke, R.; de Leaniz, C.G.; Consuegra, S. Using eDNA Metabarcoding to Monitor Changes in Fish Community Composition After Barrier Removal. Front. Ecol. Evol. 2021, 9, 28. [Google Scholar] [CrossRef]
- Valdivia-Carrillo, T.; Rocha-Olivares, A.; Reyes-Bonilla, H.; Domínguez-Contreras, J.F.; Munguia-Vega, A. Integrating eDNA metabarcoding and simultaneous underwater visual surveys to describe complex fish communities in a marine biodiversity hotspot. Mol. Ecol. Resour. 2021. [Google Scholar] [CrossRef] [PubMed]
- Sales, N.G.; Wangensteen, O.S.; Carvalho, D.C.; Deiner, K.; Præbel, K.; Coscia, I.; McDevitt, A.D.; Mariani, S. Space-time dynamics in monitoring neotropical fish communities using eDNA metabarcoding. Sci. Total Environ. 2021, 754, 142096. [Google Scholar] [CrossRef] [PubMed]
- Lahoz-Monfort, J.J.; Guillera-Arroita, G.; Tingley, R. Statistical approaches to account for false-positive errors in environmental DNA samples. Mol. Ecol. Resour. 2016, 16, 673–685. [Google Scholar] [CrossRef]
- Scott, K.M. Using BLAST to Teach “E-value-tionary” Concepts. PLoS Biol. 2011, 9, e1001014. [Google Scholar] [CrossRef] [Green Version]
- Xing, Y.; Zhao, Y.; Li, G.; Yang, Y.; Hu, Y. Fish species diversity and resource conservation in Huaisha-Huaijiuhe municipal aquatic wildlife reserve, Beijing. Chin. J. Zool. 2007, 42, 29–37. [Google Scholar] [CrossRef]
- Ficht, T.A.; Adams, G.L. Probes and Method for Identifying Species and Biovars of Brucella. U.S. Patent 5,348,857, 20 September 1994. [Google Scholar]
- Kyle, C.; Wilson, C. Mitochondrial DNA identification of game and harvested freshwater fish species. Forensic Sci. Int. 2007, 166, 68–76. [Google Scholar] [CrossRef]
- Palumbi, S.R. Nucleic Acids II: The Polymerase Chain Reaction. In Molecular Systematics, 2nd ed.; Hillis, D.M., Moritz, C., Mable, B.K., Eds.; Sinauer Associates: Sunderland, MA, USA, 1996; pp. 205–247. [Google Scholar]
- Ivanova, N.V.; Zemlak, T.S.; Hanner, R.H.; Hebert, P.D.N. Universal primer cocktails for fish DNA barcoding. Mol. Ecol. Notes 2007, 7, 544–548. [Google Scholar] [CrossRef]
Figure 1.
The location of sampling points in an aquatic life reserve of Huairou district, Beijing.

Figure 2.
The process of samples pretreatment and DNA extraction.

Figure 3.
Species richness (a), Shannon–Wiener diversity index (b) and evenness index (c) of fish species in July and in November.
Figure 3.
Species richness (a), Shannon–Wiener diversity index (b) and evenness index (c) of fish species in July and in November.

Figure 4.
The correlation between detected time using cloning sequencing and DNA copies of two species: (a) Zacco platypus; (b) Odontobutis potamophila.
Figure 4.
The correlation between detected time using cloning sequencing and DNA copies of two species: (a) Zacco platypus; (b) Odontobutis potamophila.

Table 1.
The sampling sites for DNA primer screening.
| Number | Site | Location |
|---|---|---|
| 1 | Yidu River | 40°20′1″ N, 116°29′7″ E |
| 2 | Sidu River | 40°20′3″ N, 116°28′4″ E |
| 3 | Jiudu River | 40°20′5″ N; 116°29′5″ E |
Table 2.
The concentration of nucleic acid and the value of OD.
| Number | Pretreated Method | Average Concentration of Nucleic Acid (ng/µL) | Average OD260/OD280 | Main Ingredients |
|---|---|---|---|---|
| 1 | 15 mL + Centrifugation + DTK | 21.1 | 1.52 < 1.60 | Protein |
| 2 | 15 mL + Centrifugation + QDK | 36.4 | 1.50 < 1.60 | Protein |
| 3 | 1 L + Filtration + DTK | 60.7 | 1.60 (1.60–1.90) | DNA |
| 4 | 1 L + Filtration + QDK | 79.3 | 1.96 ≥ 1.90 | RNA |
| 5 | 1 L + Filtration + MPK | 102.8 | 1.90 ≥ 1.90 | RNA |
| 6 | 1 L + Filtration + QSK | 43.4 | 1.61 (1.60–1.90) | DNA |
| 7 | 2 L + Filtration + DTK | 62.1 | 1.61 (1.60–1.90) | DNA |
| 8 | 2 L + Filtration + QDK | 100.2 | 1.93 ≥ 1.90 | RNA |
| 9 | 2 L + Filtration + MPK | 105.7 | 1.93 ≥ 1.90 | RNA |
| 10 | 2 L + Filtration + QSK | 66.4 | 1.60 (1.60–1.90) | DNA |
Table 3.
Sequencing results of COI, 12s, 16s primer from testing sites.
| Primers | Species | Number of Reads |
|---|---|---|
| COI | Ramlibacter tataouinensis TTB310 | 4 |
| Polaromonas sp. JS666 | 4 | |
| Acidovorax avenae subsp. ATCC 19860 | 11 | |
| 12s | Epinephelus fuscoguttatus | 2 |
| 16s | Rhodeus ocellatus | 2 |
| Carassius gibelio | 4 | |
| Corbicula colorata | 4 | |
| Tachysurus fulvidraco | 1 | |
| Pseudorasbora parva | 13 | |
| Sarcocheilichthys nigripinnis | 1 | |
| Micropterus salmoides | 1 | |
| Zacco platypus | 5 |
Table 4.
Species detected and recorded by eDNA in 2017, trawling survey in 2005, and Beijing Fish Record in 1984 (P is a positive record, N is a negative record). The list of fish species was created by combining the three resources. For eDNA survey, species were identified using BLAST.
Table 4.
Species detected and recorded by eDNA in 2017, trawling survey in 2005, and Beijing Fish Record in 1984 (P is a positive record, N is a negative record). The list of fish species was created by combining the three resources. For eDNA survey, species were identified using BLAST.
| Detected Species | eDNA (2017) | Trawling (2005) | Beijing Fish Record (1984) |
|---|---|---|---|
| Abbottina obtusirostris | 2 | P | N |
| Abbottina rivularis | 1 | P | P |
| Acheilognathus chankaensis | 2 | P | N |
| Acipenser gueldenstaedtii | 24 | N | N |
| Acipenser mikadoi | 2 | N | N |
| Acipenser fulvescens | 21 | N | N |
| Acipenser schrenckii | 11 | N | N |
| Carassius gibelio | 30 | N | P |
| Channa argus | 2 | N | P |
| Ctenopharyngodon idella | 1 | N | P |
| Culter erythropterus | 2 | N | P |
| Cyprinus carpio | 1 | N | P |
| Hypomesus olidus | 2 | P (identified in genus level) | N |
| Hypophthalmichthys sp. | 48 | N | P |
| Micropercops swinhonis | 8 | N | N |
| Misgurnus sp. | 5 | N | P |
| Misgurnus anguillicaudatus | 1 | P | P |
| Odontobutis potamophila | 4 | N | N |
| Oncorhynchus mykiss | 7 | P | P |
| Oreochromis aureus | 1 | N | P |
| Pelteobafrus fulvidraco | 1 | N | P |
| Pseudobagrus ussuriensis | 1 | N | N |
| Pseudorasbora parva | 15 | P | P |
| Rhinogobius giurinus | 4 | P | N |
| Rhodeus sp. | 11 | P | N |
| Sarcocheilichthys nigripinnis | 2 | P | P |
| Silurus sp. | 3 | N | N |
| Squalidus gracilis | 1 | N | N |
| Zacco platypus | 58 | P | N |
Publisher’s Note: MDPI stays neutral with regard to jurisdictional claims in published maps and institutional affiliations. |
© 2021 by the authors. Licensee MDPI, Basel, Switzerland. This article is an open access article distributed under the terms and conditions of the Creative Commons Attribution (CC BY) license (https://creativecommons.org/licenses/by/4.0/).
Share and Cite
MDPI and ACS Style
Li, W.-P.; Liu, Z.-F.; Guo, T.; Chen, H.; Xie, X. Using Optimal Environmental DNA Method to Improve the Fish Diversity Survey—From Laboratory to Aquatic Life Reserve. Water 2021, 13, 1468. https://doi.org/10.3390/w13111468
AMA Style
Li W-P, Liu Z-F, Guo T, Chen H, Xie X. Using Optimal Environmental DNA Method to Improve the Fish Diversity Survey—From Laboratory to Aquatic Life Reserve. Water. 2021; 13(11):1468. https://doi.org/10.3390/w13111468
Chicago/Turabian StyleLi, Wen-Pan, Zi-Fang Liu, Tong Guo, He Chen, and Xin Xie. 2021. "Using Optimal Environmental DNA Method to Improve the Fish Diversity Survey—From Laboratory to Aquatic Life Reserve" Water 13, no. 11: 1468. https://doi.org/10.3390/w13111468
Note that from the first issue of 2016, this journal uses article numbers instead of page numbers. See further details here.