
Spatiotemporal Evolution Trajectory of Channel Morphology and Controlling Factors of Yongding River, Beijing, China


School of Landscape Architecture, Beijing Forestry University, Beijing 100083, China
*
Author to whom correspondence should be addressed.
Water 2021, 13(11), 1489; https://doi.org/10.3390/w13111489
Submission received: 24 April 2021
/
Revised: 21 May 2021
/
Accepted: 25 May 2021
/
Published: 26 May 2021
(This article belongs to the Special Issue Fluvial Geomorphology and River Management)
Abstract
:It is necessary to understand the evolution of a river channel when reconstructing its evolution process and analyzing the controlling factors essential for river management and ecological restoration. In the past 50 years, the ecological environment around the Yongding River has deteriorated considerably, and the downstream has been completely cut off. Despite this, few have studied its morphology. In this study, we analyze the morphology of the Yongding River (Beijing, China) stretching for 92 km in four different periods between 1964 and 2018. A data treatment is carried out based on GIS, and the morphological evolution trajectory of the river channel at the overall and reach scales is reconstructed. The results show that the river morphology has undergone significant changes: the channel width has narrowed by 31%, and the temporal and spatial patterns show significant differences. By analyzing the impacts of human activities and climate change in various periods, we find human intervention to be the most important controlling factor. Based on our results, we proposed a set of river restoration strategies and protection measures for the Yongding River to guide watershed management and land planning.
1. Introduction
The morphological diversity of rivers is the core of ecosystem habitat and biological community [1]. The evolution of river morphology is of great significance to ecosystem functions and river dynamics [2].
The erosion, transport, and deposition of rivers change their stability and determine their morphological evolution [3]. Bank erosion is responsible, along with bank accretion, for the migration and growth of river meanders [4]. The factors driving channel migration include human activities, water conservancy projects, and changing climate [5,6,7]. The excessive intensity of the factors may destroy the stability of the river system. When it is broken, channel migration is aggravated, leading to accelerated changes in river morphology, soil erosion, increased flood risk, damage to the habitat and landscape structure of the river basin, and even threatening the safety of people’s lives and property [8,9,10].
Studying the historical evolution trajectory of river morphology is crucial for accurately interpreting the current state of rivers and predicting future trends [11,12]. However, rivers can have different channel evolution trajectories. To understand the channel evolution process of a river scientifically, it is necessary to reconstruct this process in detail, analyze the controlling factors quantitatively, and finally determine the relationship between the river evolution and the controlling factors [13]. Typically, channel evolution is not controlled by a single factor but by a combination of human and natural factors. Human activities, such as water conservancy construction [14,15,16,17], land use change and sediment mining [18,19], accelerate the morphological evolution of rivers. Natural factors, such as changes in flood frequency [20,21], sediment concentration [22], precipitation and temperature [23], also have a significant impact on channel morphology. In the process of channel evolution, the controlling factors may be different in different periods. If drastic changes occur in a relatively short period, the main controlling factors can be directly determined. On the contrary, in different scales, a series of factors may simultaneously affect the course of a river. The causal relationship between the river evolution trend and the controlling factors is complex [24,25].
The reconstruction of river morphological evolution requires multiple parameters associated with the river channel, such as the channel width, channel sinuosity, bend sharpness, bed level, and bed slope [4]. Typically, the determination of these parameters is based on existing data (obtained through field investigations, aerial imaging, topographic data, and data from survey stations), and thus, the time node of the evolutionary trajectory can be obtained. Nowadays, remote sensing imagery is a common method to study the evolution of rivers. The plane shape of a river can be determined quickly and accurately through remote sensing data. Remote sensing has advantages, such as a short repetition period, high resolution, and less work, for the monitoring of research areas on a large spatiotemporal scale [26]. Research on river evolution trajectories based on remote sensing images has been carried out since the early 1940s. Combined with historical hydrology, maps, surveys, and other data, the research time has been extended, allowing for long-term or even a hundred-year-scale river evolution analysis [27,28,29].
In this study, we selected the mainstream of the gorge section of the Yongding River as the study area. Yongding River played a key role in the history and urban development of Beijing, the capital of China. It was known as the mother river of Beijing. Its morphological evolution has not been studied thoroughly. This study aimed to: (1) reconstruct the morphological evolution trajectory of the study area on different spatial scales, and a conduct quantitative evaluation and analysis to clarify the characteristics of its spatial and temporal evolutions; (2) explore the different controlling factors to explain the spatial and temporal differences in the river morphological evolution in each period; (3) propose a set of river restoration strategies and protection measures for the Yongding River to guide sustainable watershed ecological management. We would like to add that this study can contribute to the knowledge of river morphology in China, expand the theory and measures of ecological restoration planning strategy, and promote interdisciplinary integration.
2. Study Area
2.1. General Features
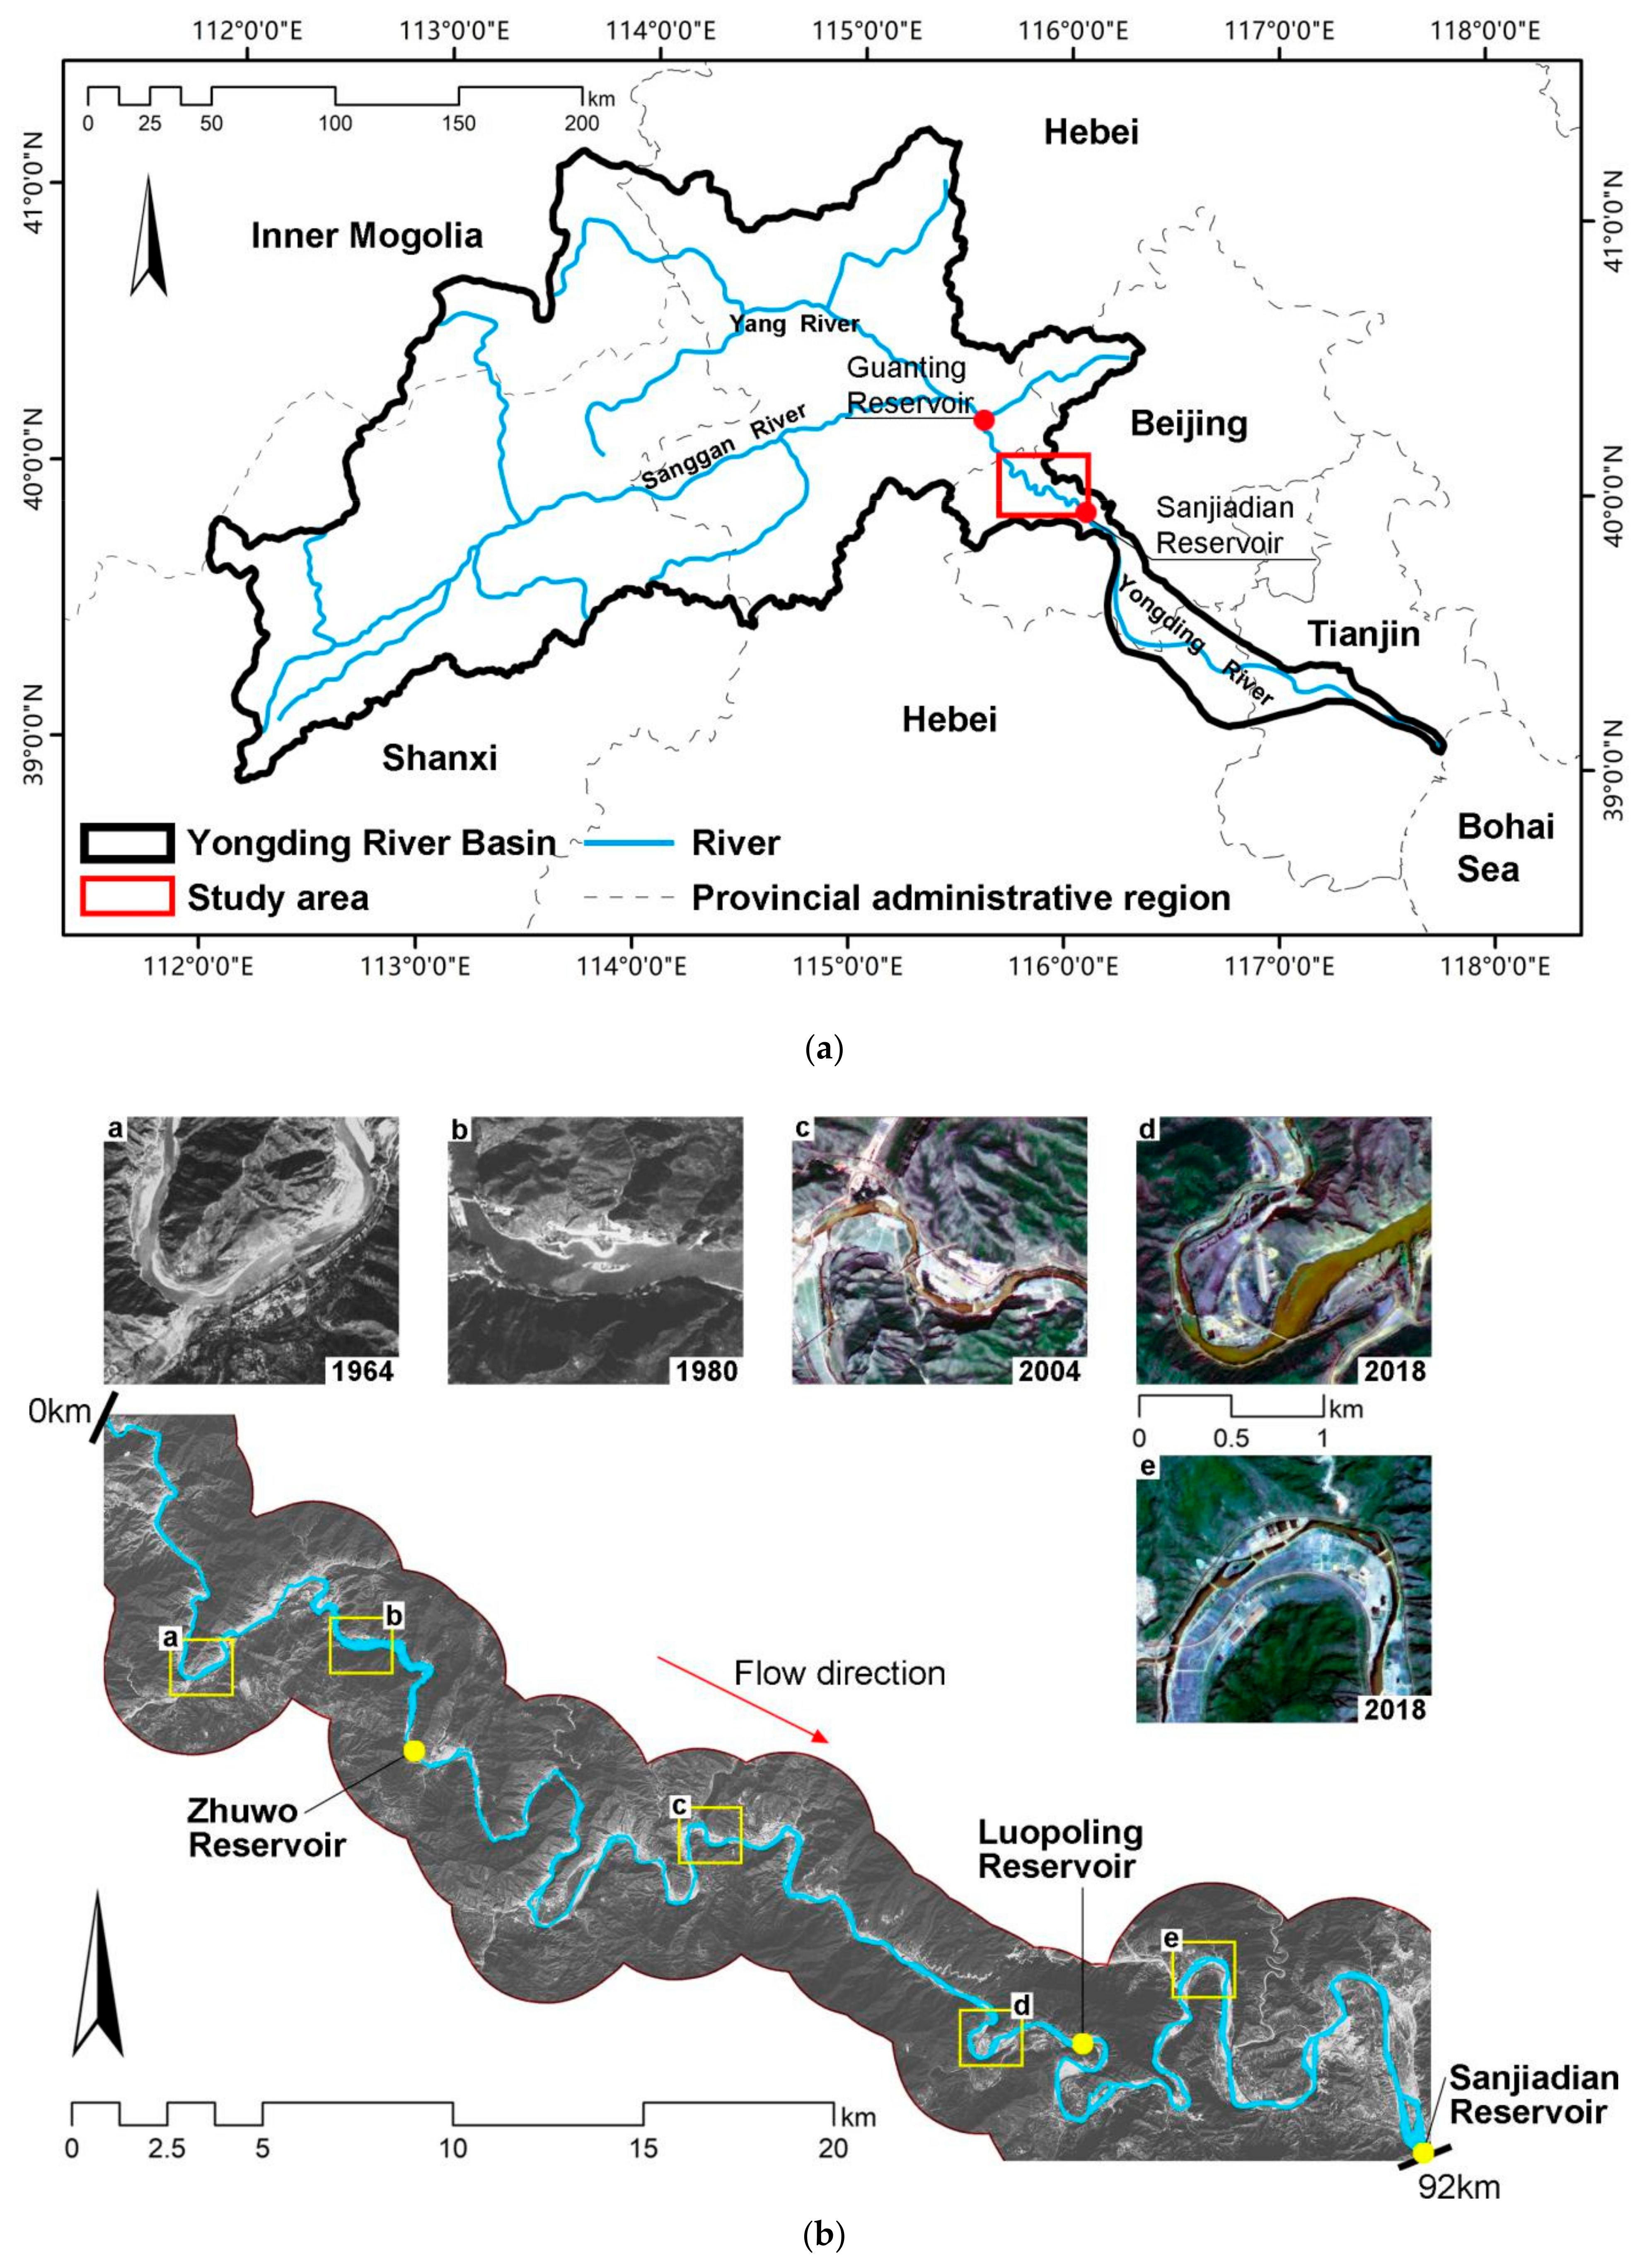
The Yongding River originates from Shanxi Province, flows through Inner Mongolia Autonomous Region and Hebei Province, enters Beijing through the Guanting Reservoir, and flows into the Bohai Sea after passing through Tianjin city, covering a total distance of 747 km, with a drainage area of 47,016 km2 (Figure 1a). The study area is the Beijing section of the Guanting Valley of the Yongding River, located within the administrative divisions of Mentougou District. The total length of the river is 92 km (Figure 1b). The geographical coordinates are in the ranges of 115°41′14″–116°5′32″ E and 39°57′33″–40°7′50″ N.
The Guanting Valley area stretches from the Guanting Reservoir dam to Sanjiadian, with a drainage area of 1645 km2, a channel length of 108.7 km from west to east, an elevation difference of 340 m, and an average longitudinal slope of 3.1‰. The landform of the Guanting Valley section is high and steep, and 80% of the slopes are greater than 25°; however, the slope near the river is low. The bedrock around the riparian zone is mostly exposed, and the vegetation coverage is less. The combination of these factors has led to severe soil erosion in the Guanting Valley section of the Yongding River.
Since the 1950s, human activities in the Yongding River Basin have gradually intensified, and the natural conditions have been altered, leading to significant changes in the ecological environment [30,31]. Scholars have conducted extensive and in-depth research on related issues such as runoff changes, water quality changes, land use changes, and ecosystem services. However, there are few detailed studies on river morphological dynamics.
2.2. Climate Variability
The climate in the Yongding River Basin is a typical warm temperate humid monsoon climate characterized by hot and rainy summers and cold and dry winters. Due to the barrier effect of the mountains, the precipitation varies significantly in the various regions.
The climate data [32,33] show that from 1957 to 1970, the annual precipitation in the Yongding River Basin exhibited a decreasing trend (Table 1), with a total decrease of 59 mm. From 1957 to 1980, the annual precipitation anomaly percentages were 7.78% and 3.07%, indicating a wet season for this period. On the contrary, from 1981 to 2010, the annual precipitation anomaly percentages were −3.07%, −4.48%, and −6.13%, indicating a dry season. In terms of the temperature, the annual average temperature exhibited an upward trend, particularly in the 1990s, when the temperature rose the most, and the annual average temperature increased by 0.9 °C.
2.3. Hydrological and Flood Features
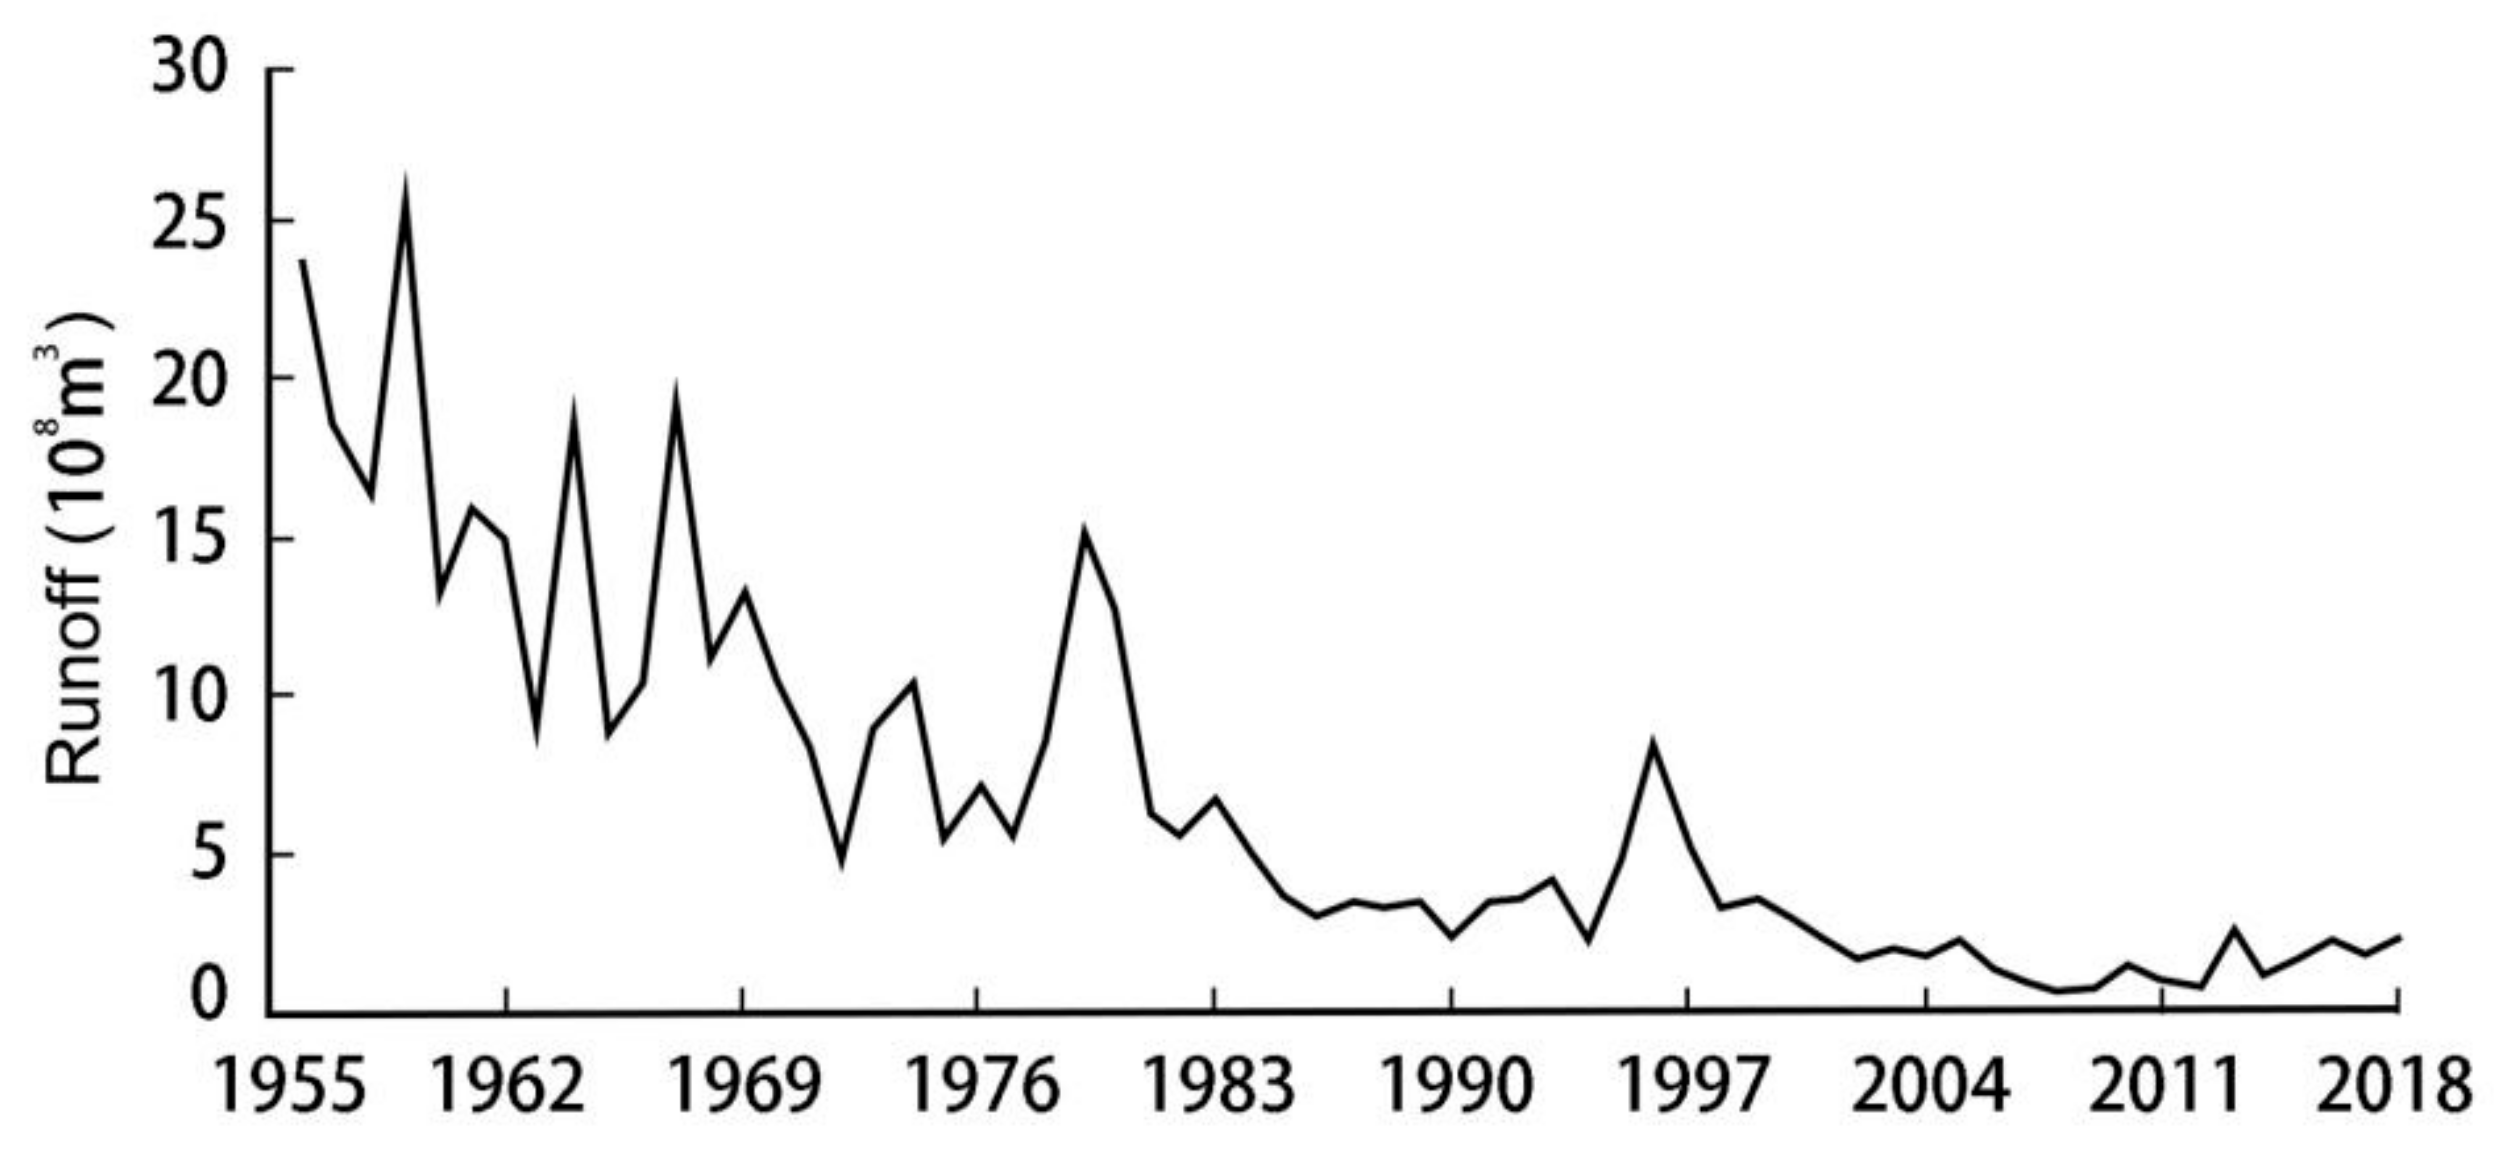
The frequent flooding of the Yongding River historically has caused massive disasters in its downstream areas. Since the 1950s, a series of water conservancy projects have been built to ensure the safety of the downstream areas. The hydrological data show that [34,35,36] the Guanting Reservoir runoff has decreased continuously (Figure 2), from 23.4 × 10⁸ m3 in 1956 to less than 2.1 × 10⁸ m3 in 2018, with the attenuation rate being as high as 90%. After 2000, the annual runoff decreased below 3.0 × 10⁸ m3, which is far from meeting the expected water level in the river. This has led to significant changes in the ecological environment around the Yongding River Basin. In the 1980s, the lower reaches of the Yongding River were completely cut off, and the ecological environment deteriorated considerably.
The records of the Sanjiadian Hydrological Station [37] from 1920 to 1957 show that there were 17 flood events with a volume rate of more than 1000 m3/s in the Guanting Valley, and only one flood event with a volume rate of more than 1000 m3/s since 1957. From 1950 to 1957, floods with a volume rate greater than 500 m3/s occurred 13 times, whereas from 1957 to 2002, such floods occurred only four times. After the construction of the reservoir, flooding in the Guanting Valley has been completely controlled.
3. Materials and Methods
3.1. Data Treatment
Based on the remote sensing images captured in four time periods, namely 1964, 1980, 2004, and 2018 (Table 2), the study conducted a spatiotemporal analysis of the river evolution spanning 54 years. The data recorded from May to September were selected given the ease of identifying water and plants during this period. The data treatment includes the geographic registration and orthorectification of each image, land use mapping, vectorization of the river banks and island boundaries, and parameter calculation.
Aerial images inevitably have spatial errors, resulting in inaccurate measurements of the lateral channel movement. Various authors have discussed the limitations of the channel digitization method, wherein the root mean square error (RMSE) is used as an error indicator for reconstructing channel variations using aerial images [38,39]. Using the ArcGIS 10.2 software for calibration, we selected 20–25 ground control points (GCPs) for each aerial image under the WGS 1984 Universal Transverse Mercator-UTM 50N reference system to obtain more accurate results. Locations with evident features were selected as GCPs, such as the corners of ground objects or intersection points of roads. Subsequently, through a second-order polynomial transformation, the RMSE of the entire dataset was found to be between 2.5 m and 6.2 m, with an average of 4.3 m.
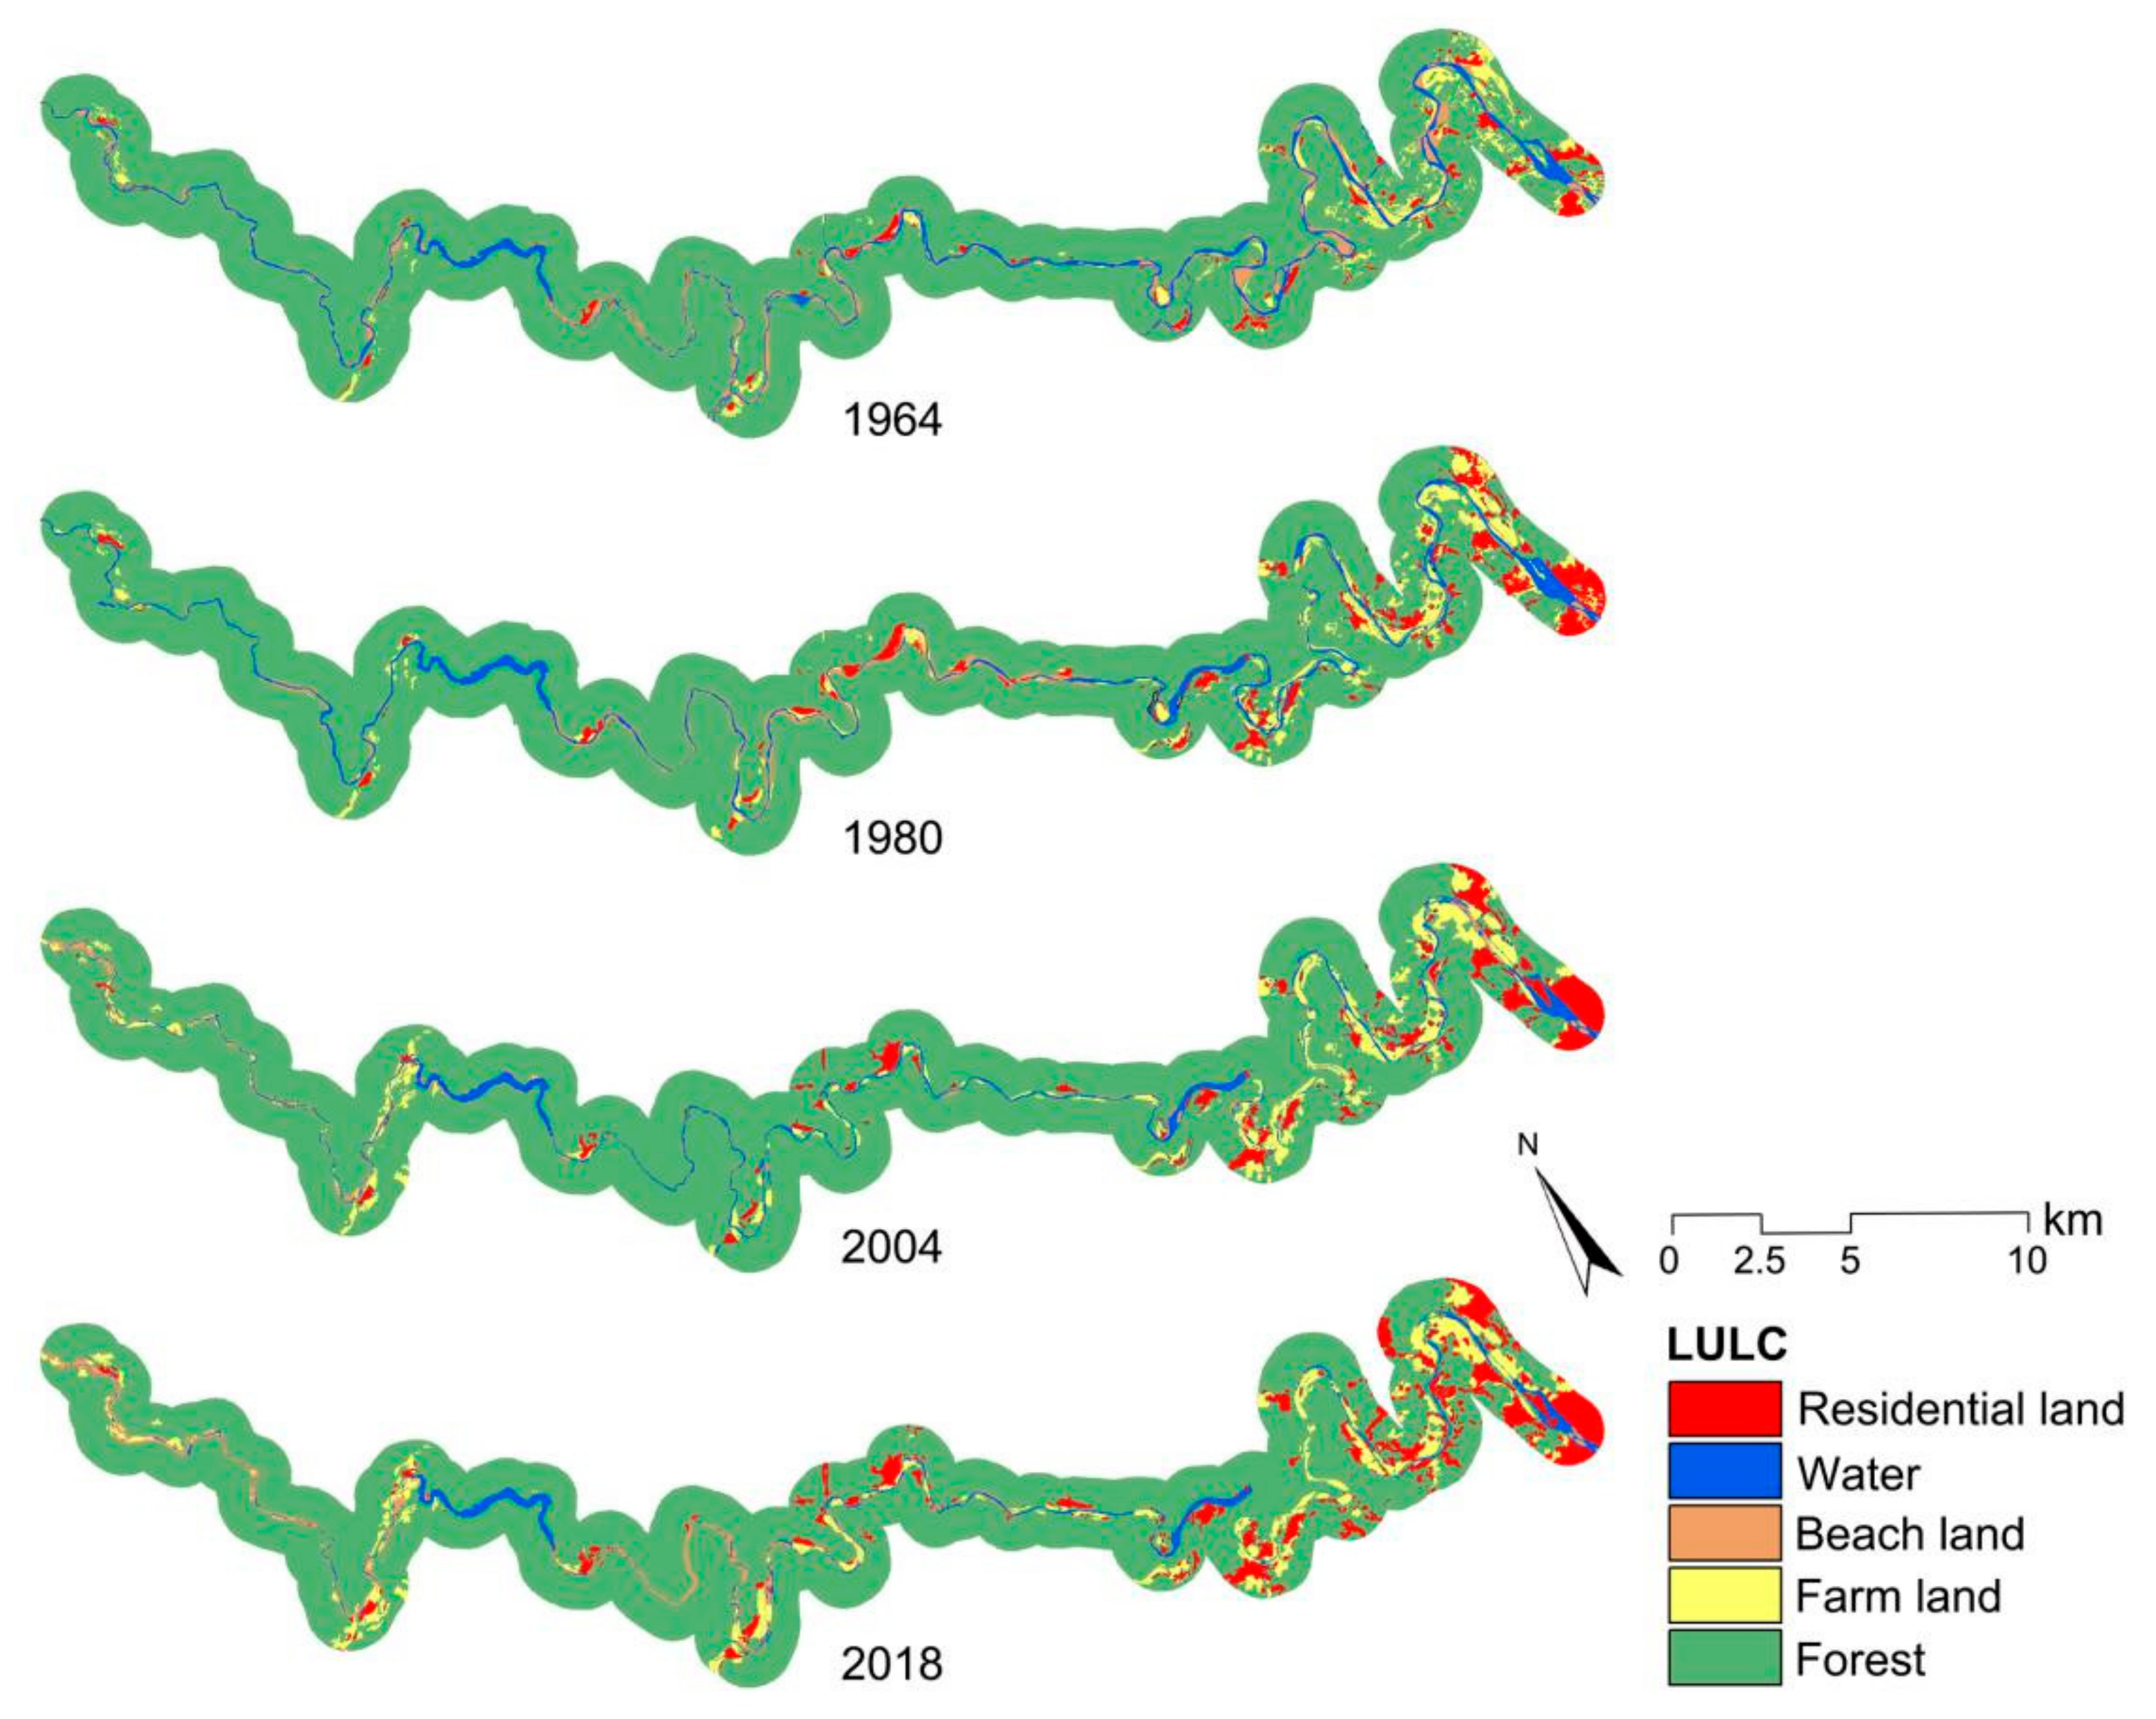
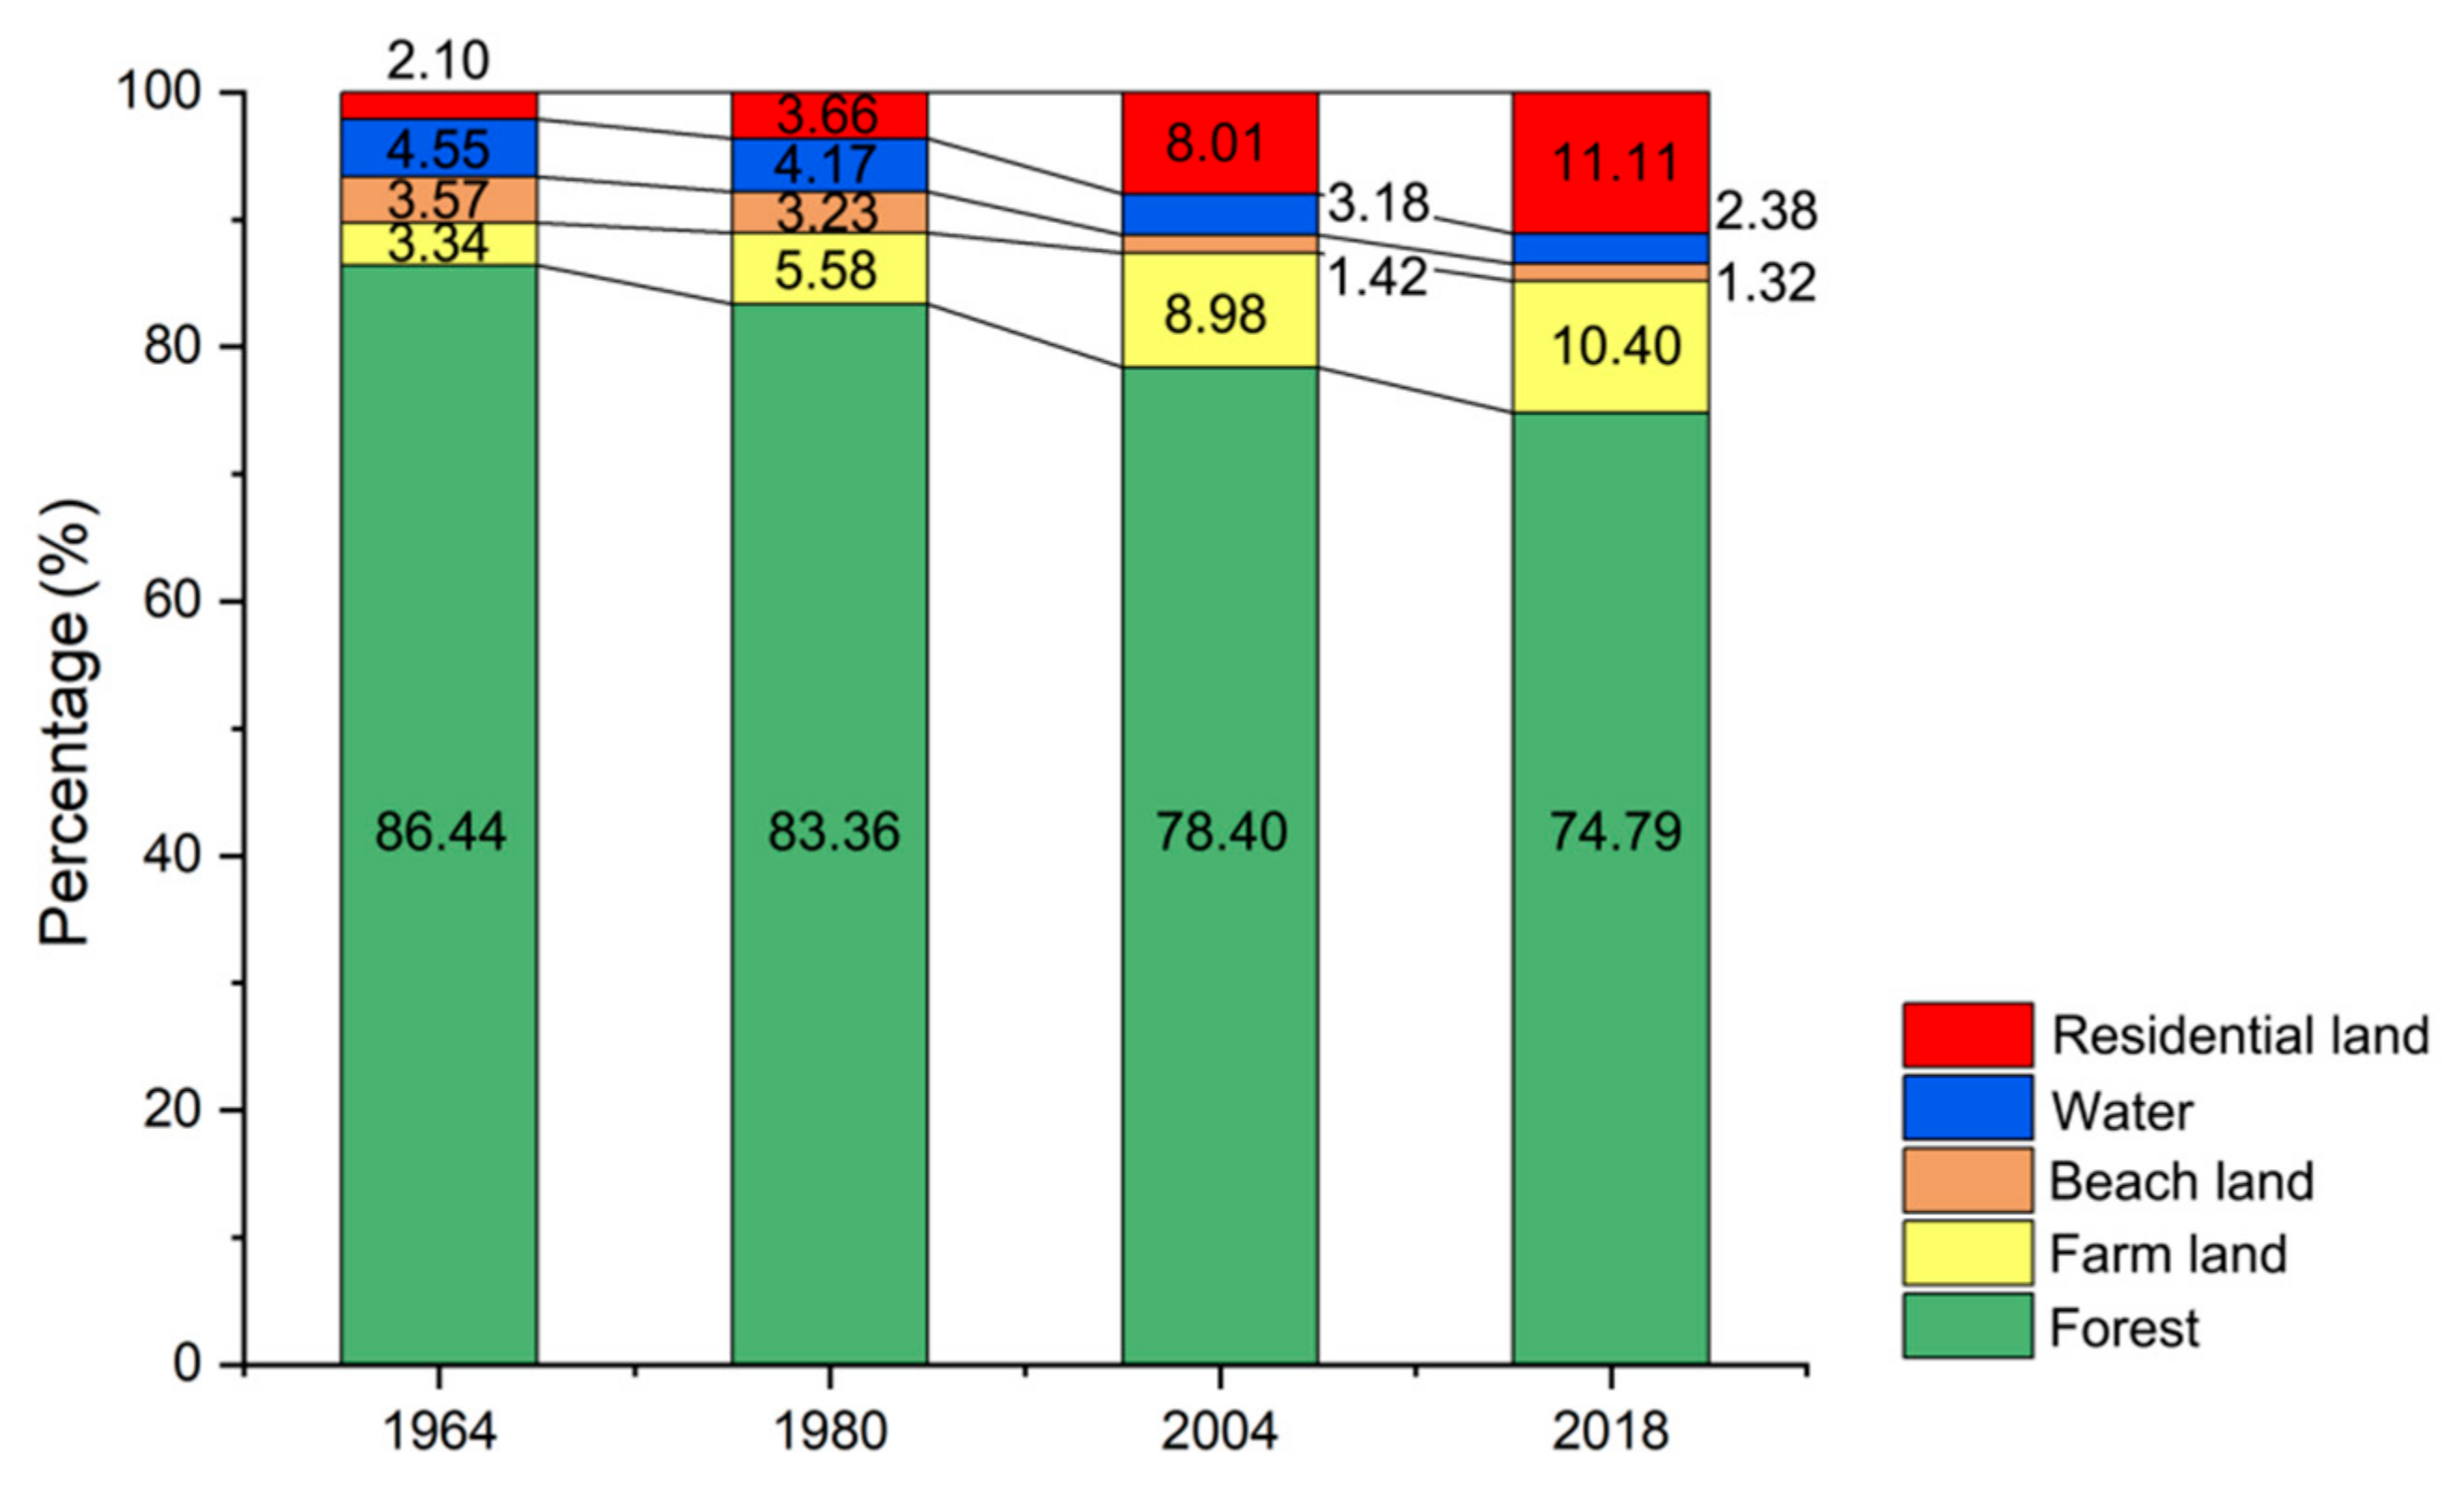
The remote sensing images were classified, and land-use and land-cover (LULC) maps were obtained using ENVI 5.3 software combined with supervised and unsupervised methods (Figure 3). The land use was classified into five types: residential land, water, beach land, farmland, and forest. We selected a 1 km buffer zone from the channel center line, because beyond this range, most of the land is forest, and the state is stable, which has little impact on the channel. These data were used to investigate the land use change (see Section 4.3.3 for more details).
3.2. Reach Segmentation
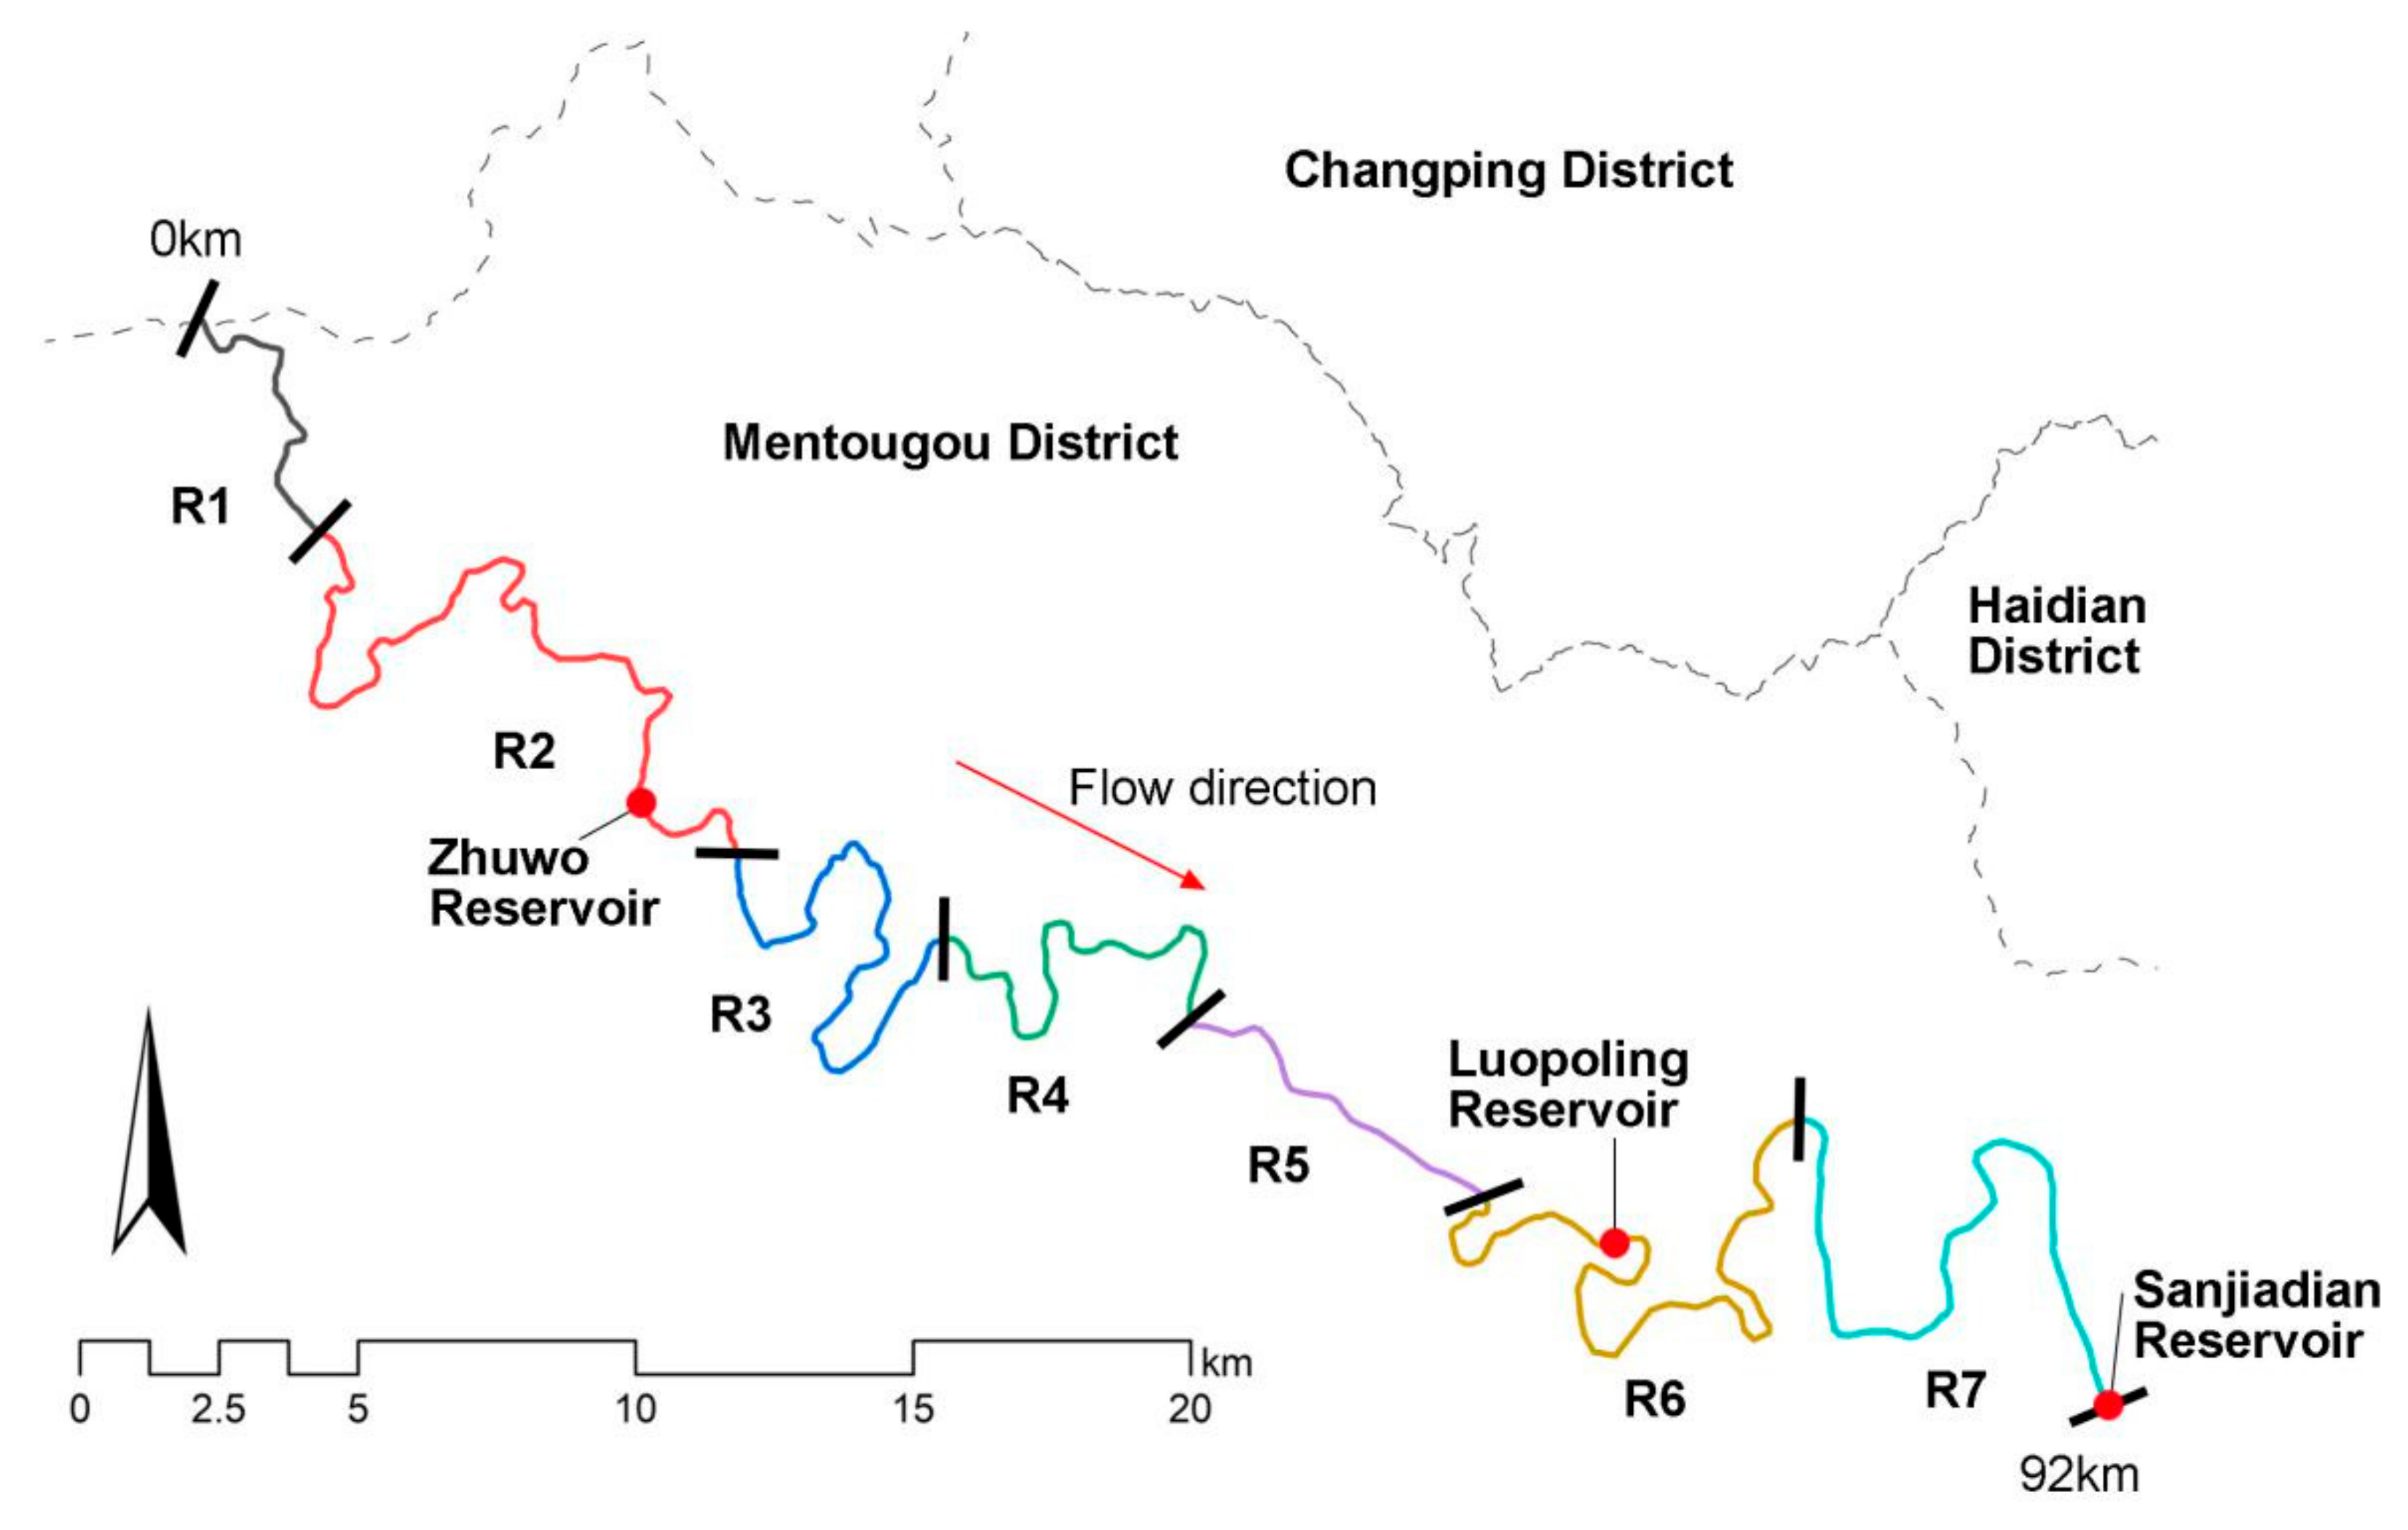
Based on the characteristics of the river morphology and the distribution of the surrounding villages and towns in 2018 (Table 3), the entire study area is further divided into seven continuous reaches (Figure 4). Thus, the evolution characteristics of the river morphology in each spatial section are discussed more clearly.
3.3. Parameter Calculation
The boundaries of the river bank and islands were manually vectorized at the 1:1000 scale, and the centerline of the river channel was derived from the river bank boundary. The channel cross-section orthogonal to the centerline was generated at a fixed interval of 100 m. Subsequently, the channel width of each cross-section was measured as the sum of the submerged channels and unvegetated or sparsely vegetated depositional bars [2]. The channel sinuosity was calculated as the ratio of the length of the river measured along its centerline to the valley length between the upstream and downstream sections [4,40]. Discharge stages could influence the area of mapped depositional forms. According to the discharge data of Sanjiadian gauging station (the end point of the study area), the mean annual discharge was 24.98 m3/s in 1964 and 16.42 m3/s in 1980. It dropped to 10.99 m3/s in 1996. Since 2000, the data showed that there was partial seasonal flow cut-off in the study area, which was also proved by our field survey in September 2018.
The continuous evolution of the river plane morphology is attributed to two processes, namely bank erosion and bank deposition, which lead to bank retreat and bank extension, respectively. Riverbank erosion is a process whereby the boundary of a river channel moves in a direction opposite to the centerline of the river channel, mainly occurring on the outer sides of the river bend. On the contrary, riverbank deposition is a process whereby the boundary of a river channel moves toward the channel centerline, mainly occurring on the inner sides of the river bend.
Based on the historical aerial images and digital channel data of the different periods, through a GIS analysis, the areas associated with riverbank erosion and deposition in each period were determined by quantifying the channel areas of two adjacent periods (Figure 5), and the change in the migration rate was obtained [41]. Thus, we reveal the dynamic trend and change mechanism of the river channel evolution.
4. Results
4.1. Channel Width and Sinuosity Variation
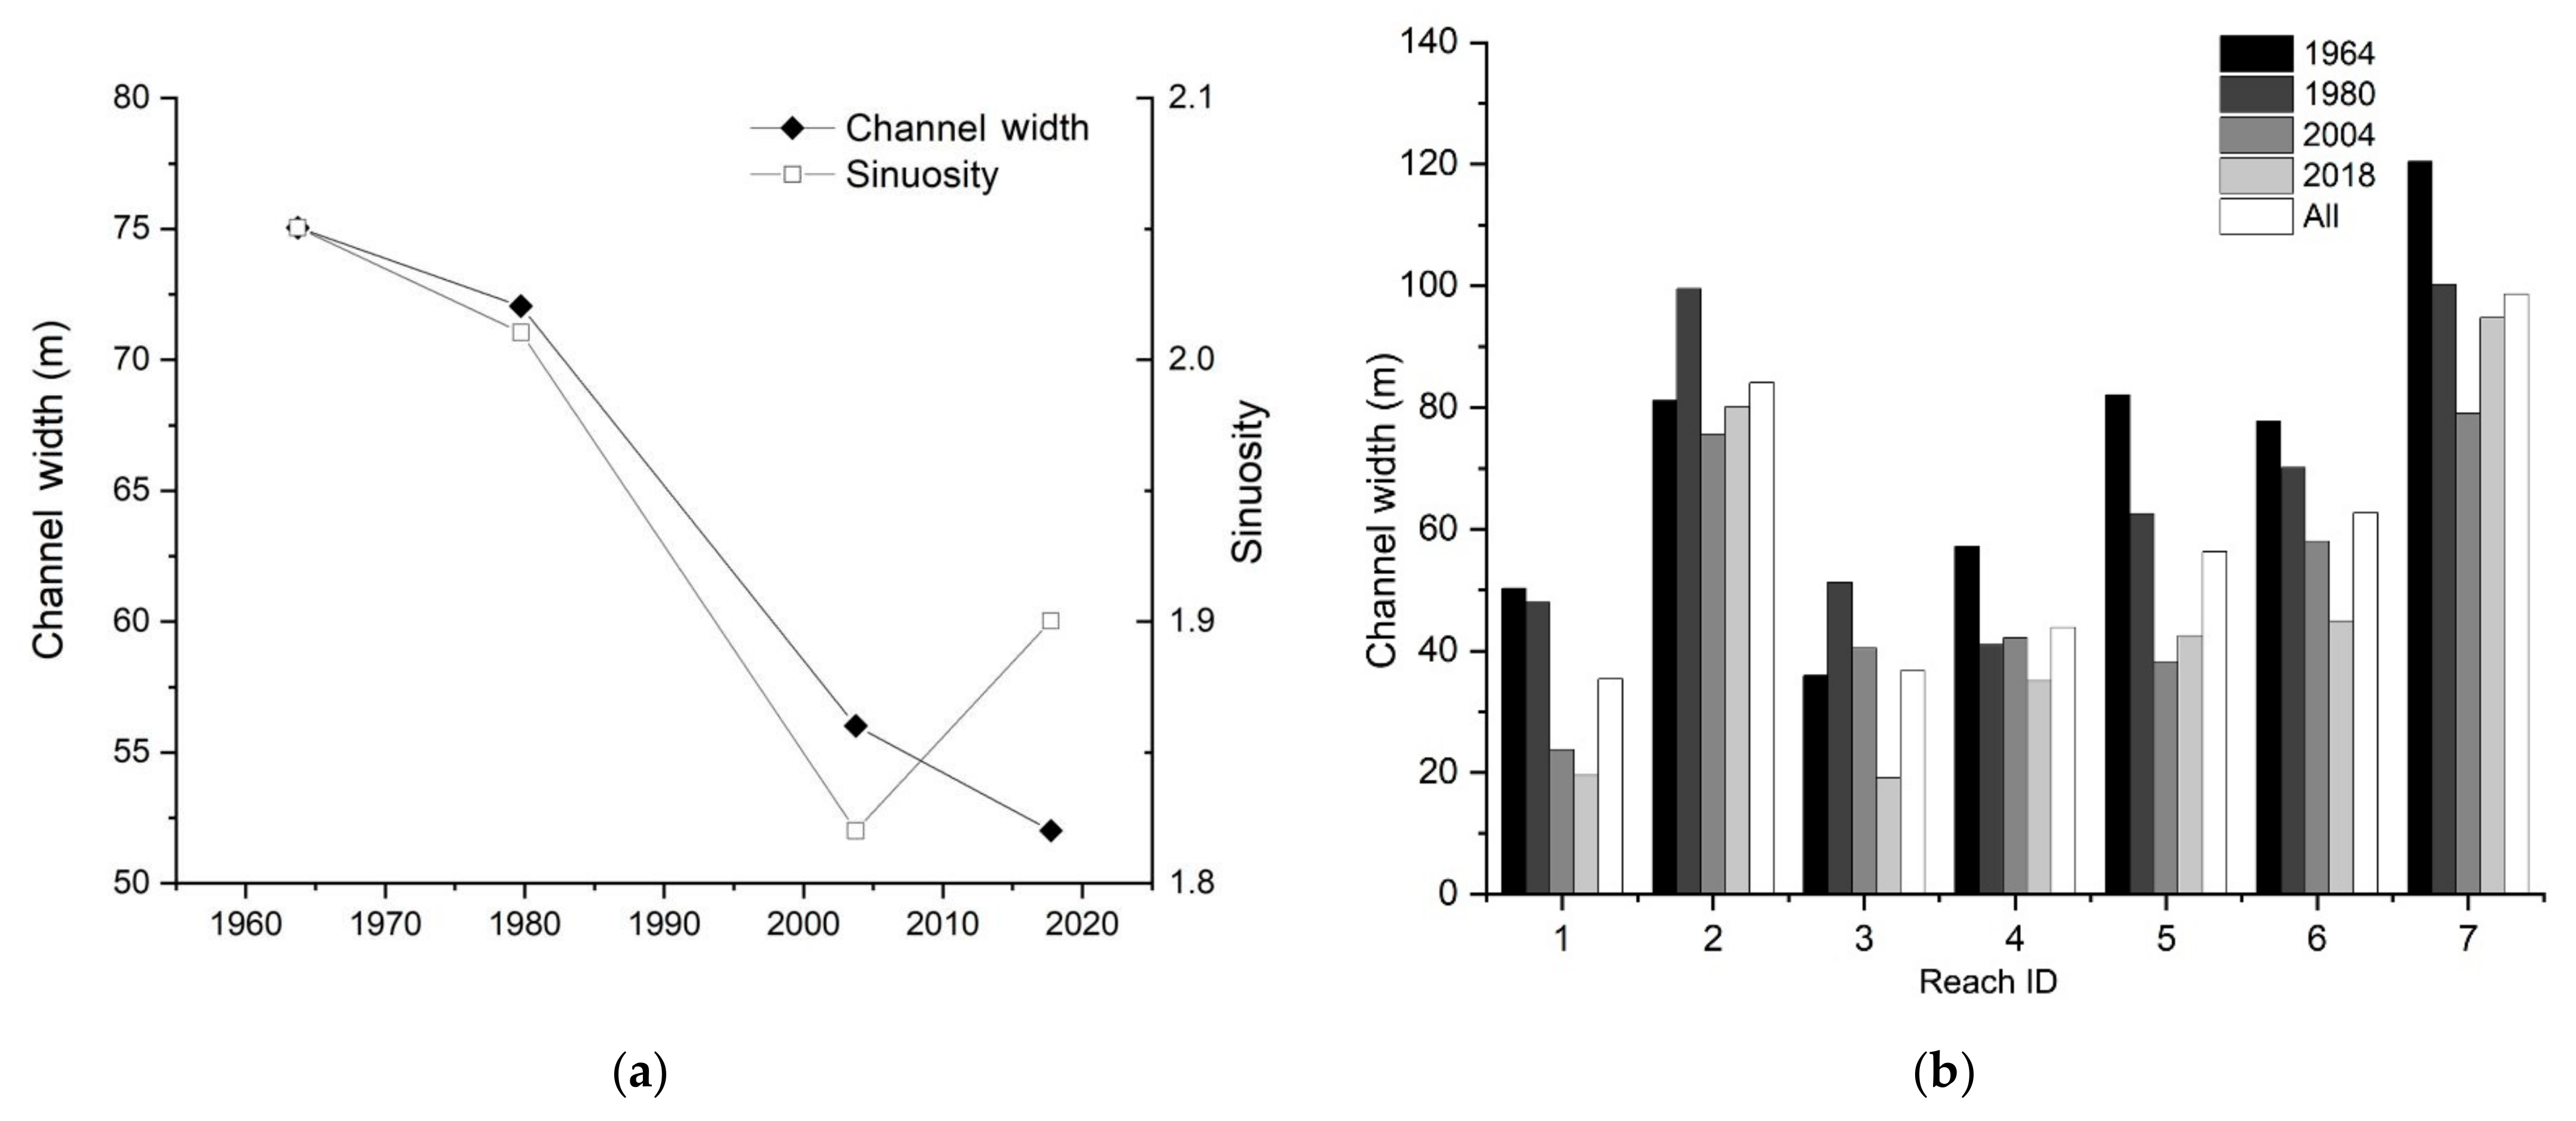
By analyzing the variation in the average channel width and sinuosity of the study area from 1964 to 2018 (Figure 6a), we find that, overall, the river width evidently narrowed, from 75 m in 1964 to 52 m in 2018, which is a 31% reduction. During the entire contraction process, the river width exhibits a dynamic change rate. In the first stage (1964–1980), the rate of contraction is relatively low, only 3%. Since 1980, the river contraction intensity increased significantly, reaching 0.67 m per year. Up to 2004, the channel width had shrunk by 25%. From 2004–2018, the river contraction rate decreased and returned to the level of the first stage, at 7%. Discharge is a direct force driving channel morphodynamics. As mentioned in Section 2.3, the discharge was greatly reduced after the establishment of Guanting Reservoir in 1955, which led to the decline of river width.
The channel sinuosity also decreased overall, with a slight decrease of 0.04 in the first stage and a significant decrease of 0.19 in the second stage (1980–2004), which is 4.75 times that in the previous stage. The change trends in the two periods are consistent with the river width. However, the difference is that, in the third stage (2004–2018), the channel sinuosity shows a trend opposite to that of the river width, rising by 0.08. In the 54-year study period, the river exhibited a strongly meandering characteristic (with a channel sinuosity greater than 1.5 [42]).
The statistics of the average width in the four periods (1964, 1980, 2004, and 2018) in the seven reaches (Figure 6b) show that the average width of R7 in 1964 is the highest, reaching 120 m. In particular, the area in front of Sanjiadian Reservoir is about 550 m. The second is R2 in 1980: 84 m. The average width of the sections R3−R6 gradually increases, and the average width of R1 is the smallest, only being 35 m. In the average width of the all period, R2, R3 and R7 are the top three. Coincidentally, there are reservoirs in all three areas. High channel width may be related to the water conservancy reservoirs. Furthermore, in R5, we found the most extensive overall average width range, i.e., 40 m, and in R2, we found the lowest variation, i.e., only 1 m. Obviously, the evolution trajectory of each reach is different and complex. Although R2 has the lowest variation from beginning to end, it does not indicate that it is a stable area.
We further analyzed the width evolution of each reach in each period (Figure 7). During 1964–2004, the overall trend of river width declined, which was determined by the establishment of four reservoirs. However, the channel width of R2 and R6 increased drastically, whereas that of R3 increased slightly, contrary to the change trend in the entire channel width. The position where R2 and R6 increase in width was, respectively, consistent with that of Zhuwo Reservoir and Luopoling Reservoir. We think this is because of the huge storage capacity of the new reservoir, which widens the width of the river channel where it is located, and the hardening of the river bank, which strengthens the widening effect.
From 2004 to 2018, the river was still narrowing. However, the areas with increased channel width had changed, mainly in R7, as R7 is one of the earliest areas of Yongding River basin management. The project carried out ecological management on the 10 km riverbank in the end town section and retreated many farmland and buildings that occupied the river.
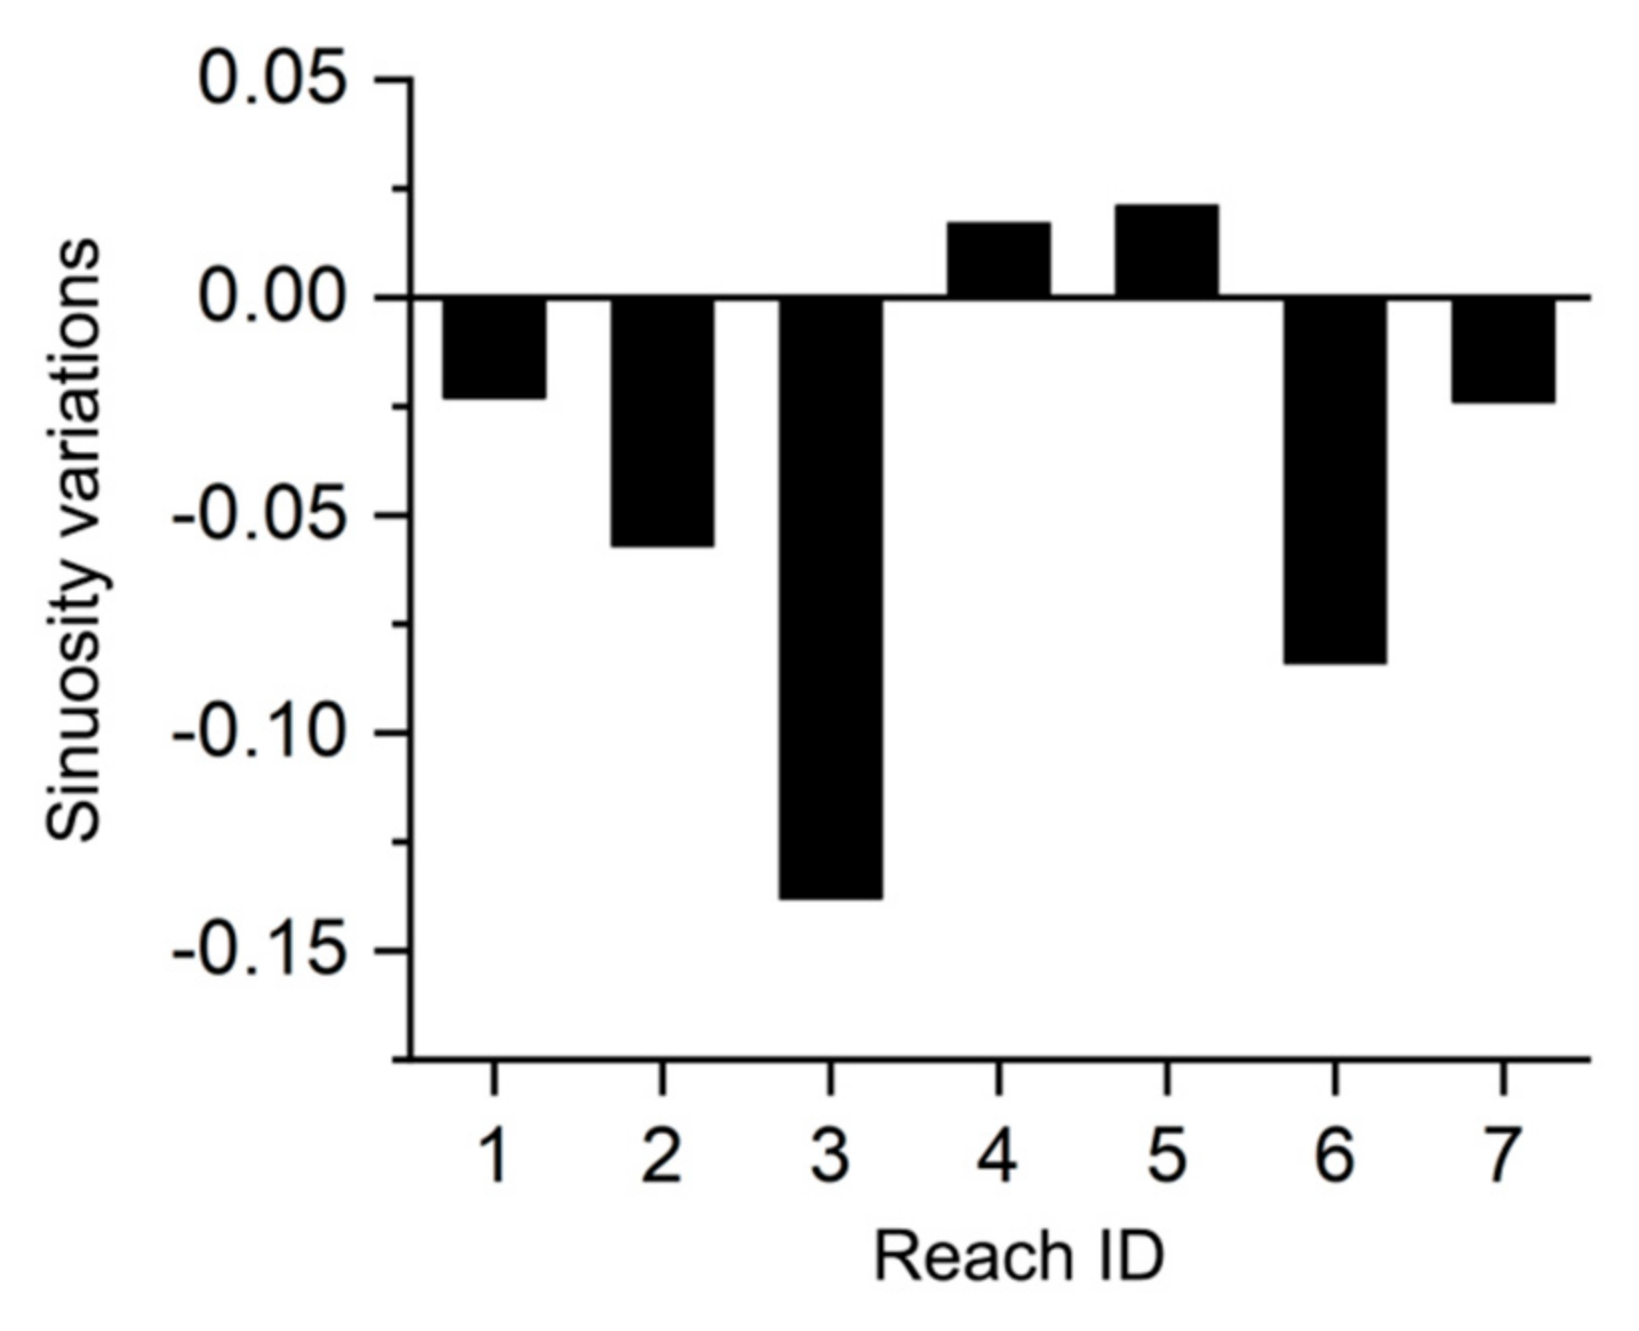
From the evolution data of the channel sinuosity in the different reaches (Table 4), in the first stage (1964–1980), the channel sinuosity of R1 and R7 increased, whereas those of R2−R6 decreased, particularly R5 and R6 (−1.83% and −2.29%, respectively). In the second stage (1980–2004), the channel sinuosity of R3 and R4 increased. Compared with the other reaches in the all stage, R3 exhibited the largest decline, reaching −3.79%. In the third stage (2004–2018), R1 exhibited a slight decrease, and the channel sinuosity of the reaches rebounded. The construction of a large-scale reservoir was basically completed in the first stage, but in the second stage, the channel sinuosity of the whole river decreases more greatly. This shows that this stage is controlled by some wider-range factors that can affect the whole basin. We consider it to be the result of climate change. The data of precipitation and temperature show that Yongding River Basin was in dry season during this period, which directly affects the reduction in discharge.
In the entire research period (Figure 8), the channel sinuosity largely declined, e.g., in R1–R3, R6, and R7, with R3 exhibiting the most significant degree of reduction (−0.14); the channel sinuosity increased only in R4 and R5. We tried to analyze this result from two aspects. First, R6 and R7 belong to town areas, and the intensity of river sediment mining and land use change are high. The deterioration of sediment conditions and the encroachment of buildings and farmland on rivers could lead to the degradation of river morphology. Second, although R3 belongs to a natural area, the change of sinuosity is the highest. We think this is due to the construction of Zhuwo Reservoir at the end of R2. In the analysis of river width, the reservoir is considered to increase the water surface width of the upstream range, and it would also lead to the deterioration of the downstream river morphology. This explains why R4 and R5 are also natural areas, as is R3, but its sinuosity rises slightly, because they are far away from the reservoir.
4.2. Channel Migration
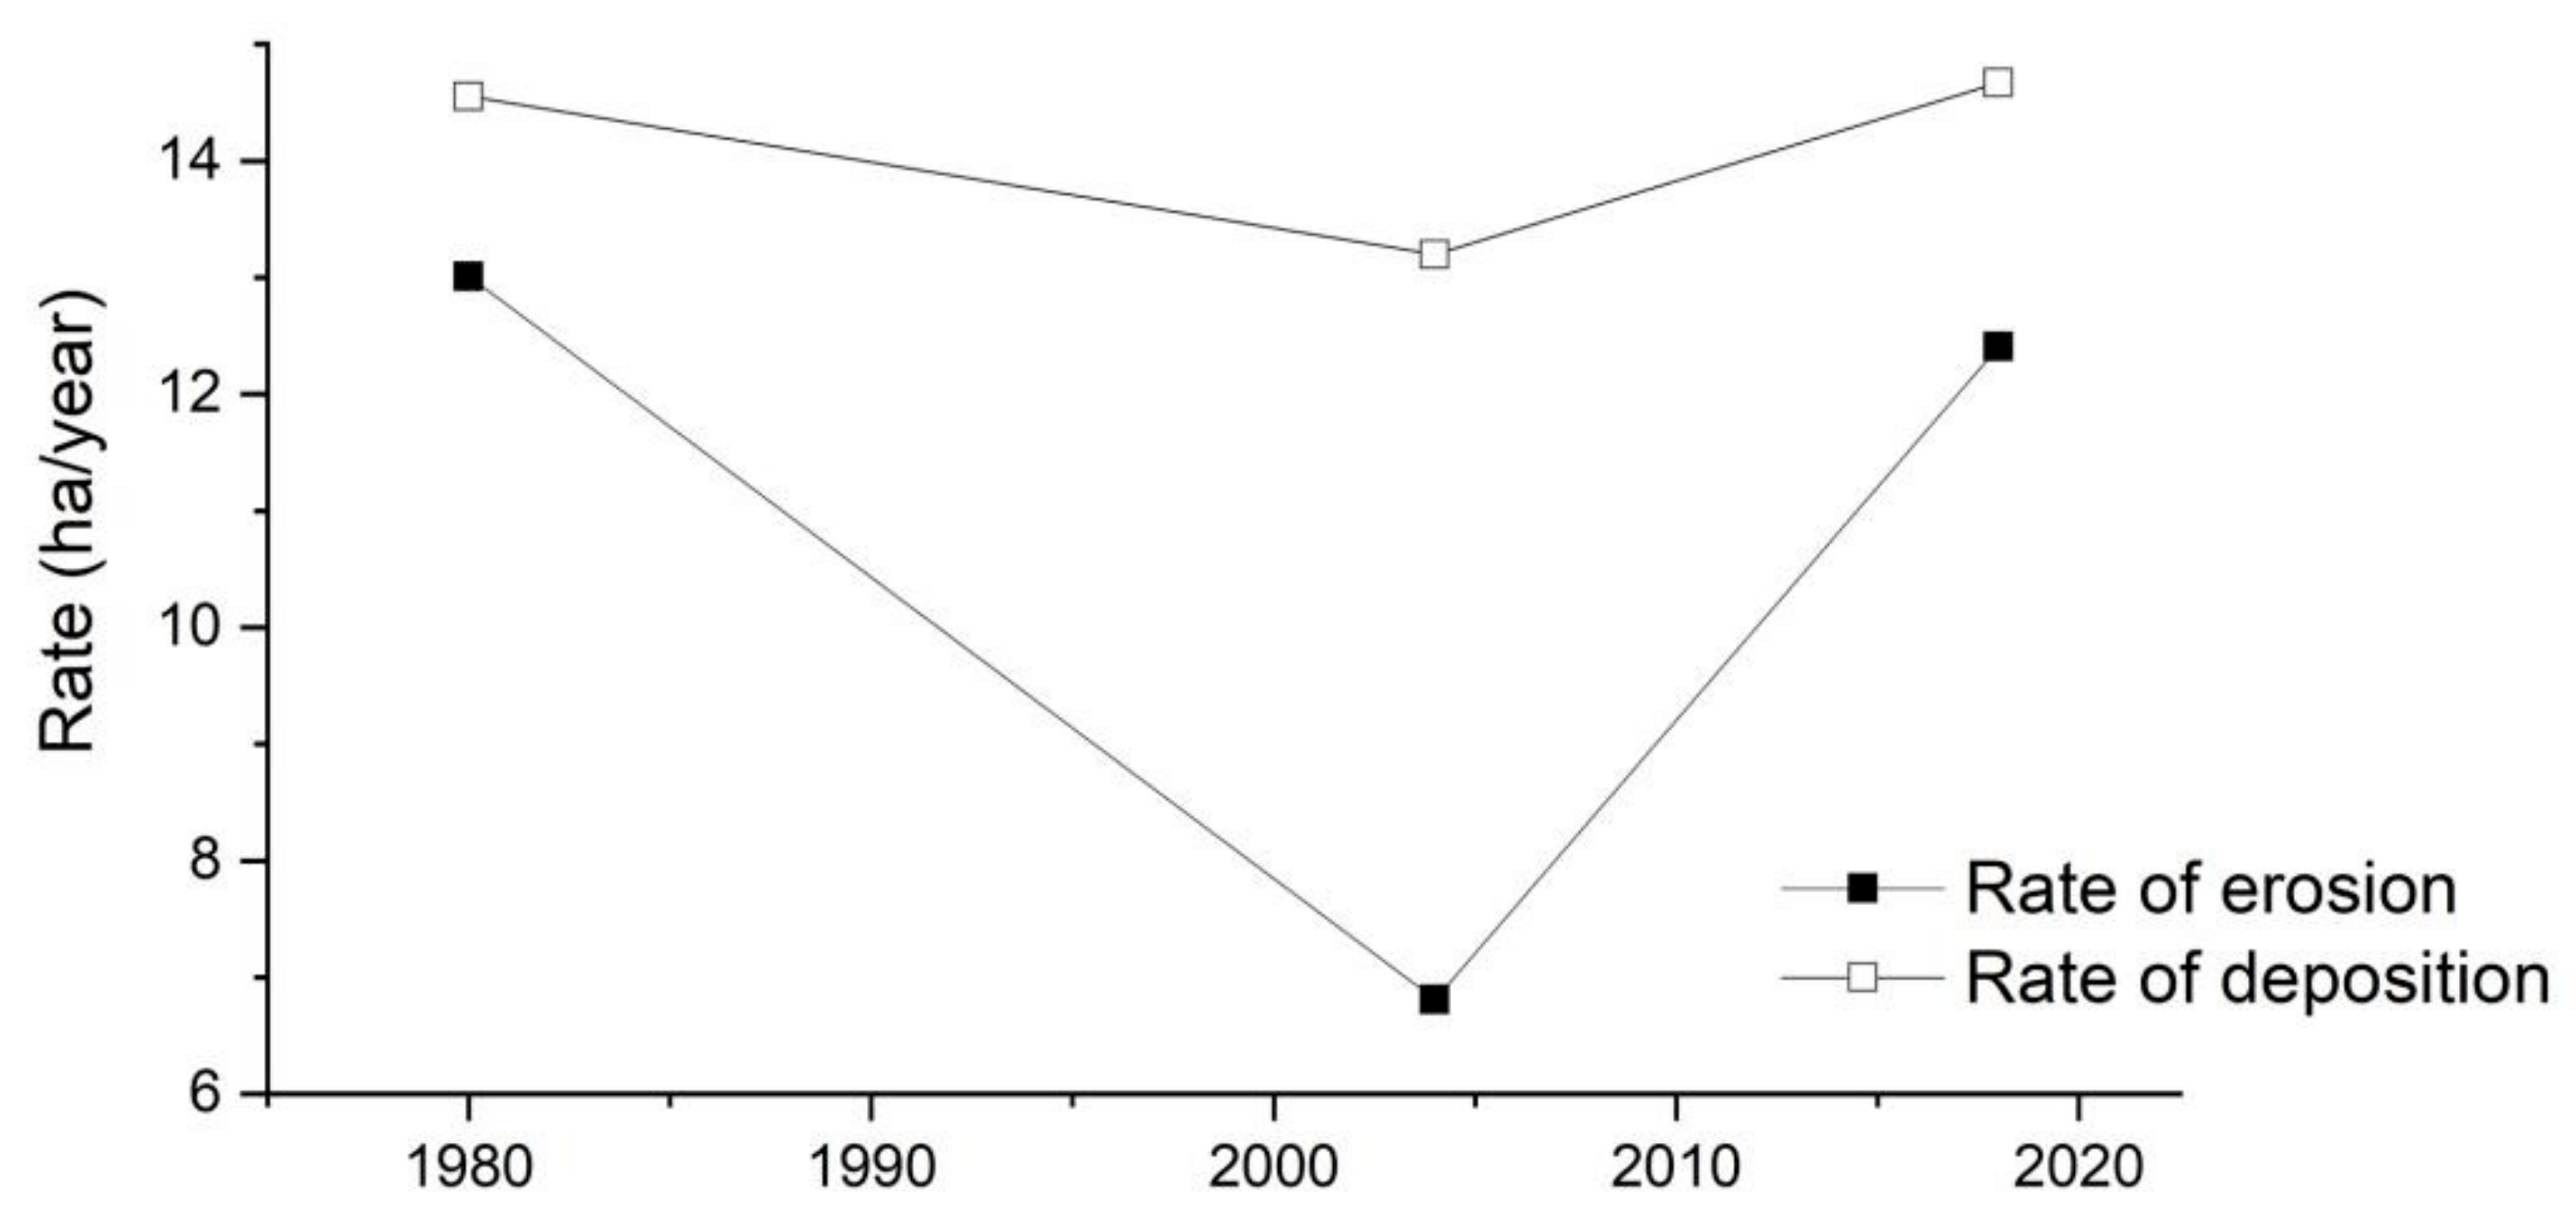
During the entire study period, the deposition process of the river bank was more dominant than the erosion process (Table 5 and Figure 9). Particularly during the period 1980–2004, the deposition area was approximately twice the erosion area. In the first stage, the rate of riverbank erosion was the highest, and it slowed down significantly in the second period, from 13.0 to 6.8, decreasing by 48%, and it returned to a higher rate in the third stage. The change in trend in the deposition process rate is consistent with the erosion process: first decreasing and then increasing. The difference is that in the second study period, the decrease in the deposition rate is low, being only 10%, and the deposition rate of the entire study area remained relatively stable.
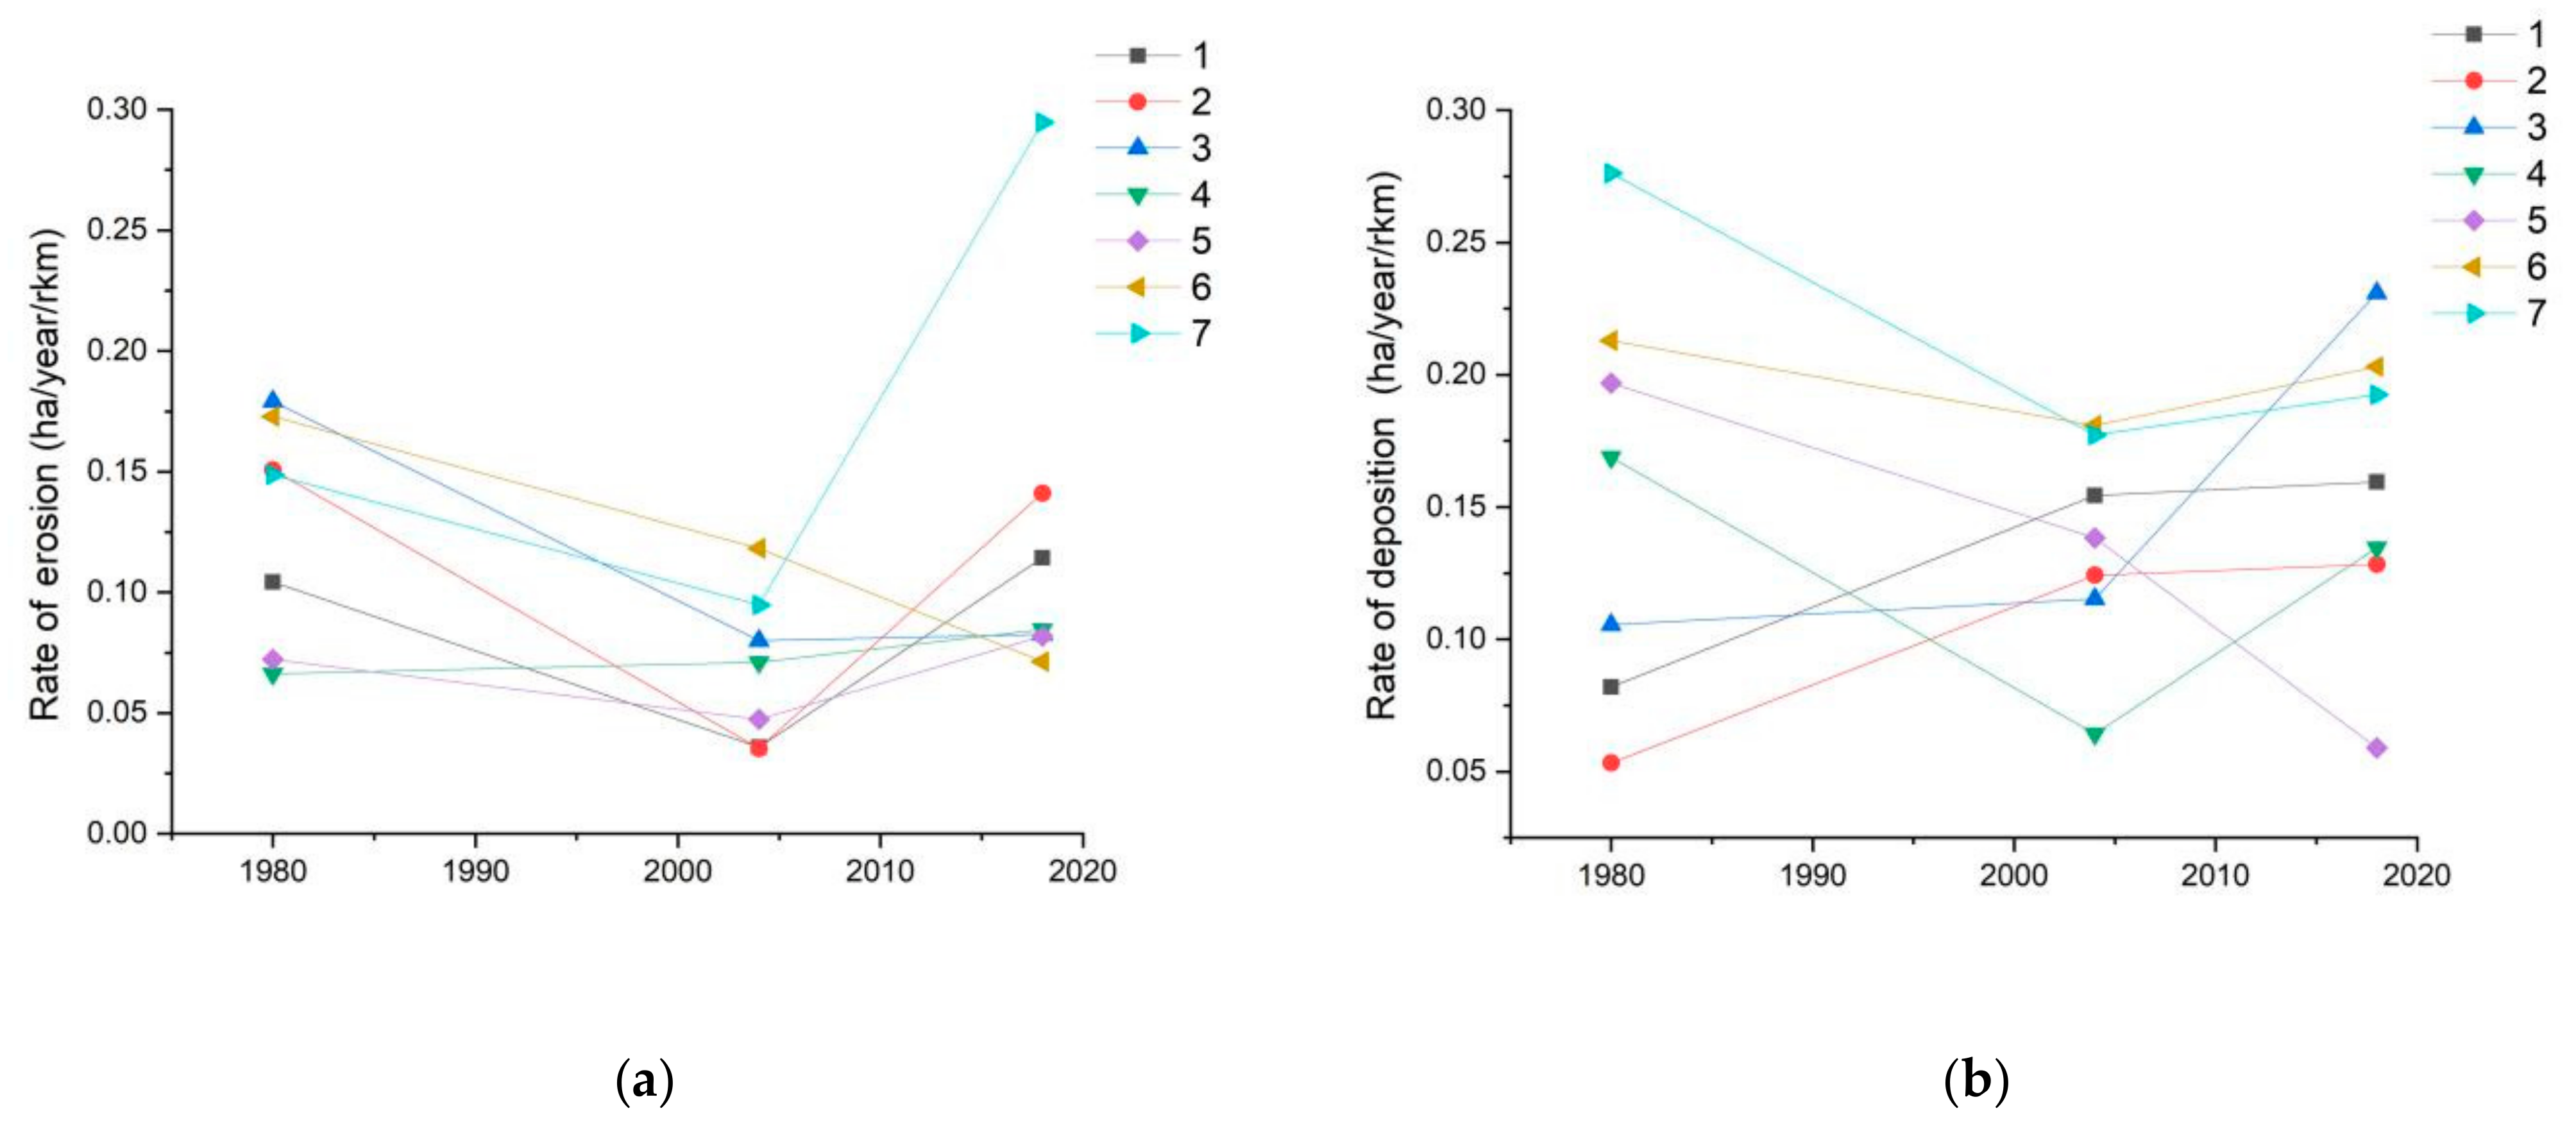
The riverbank erosion rate of the reaches showed a difference in terms of the spatial and temporal evolutions (Figure 10a). During the period 1980–2004, except for R4, the erosion rate of all the reaches decreased. During the period 2004–2018, except for R6, all the erosion rates increased, and R7 exhibited the highest rate, as high as 0.29, which is twice that of the second, R2. The reason for this phenomenon of R7 should be consistent with the increase in river width in the same period because this area was the first to implement the river restoration project. In terms of the changes in the deposition rate (Figure 10b), the rate of R7 was the highest in the first stage. The upstream and downstream reaches show apparent differences. The rates of the upstream reaches R1–R3 increased, whereas those of the middle and lower reaches R4–R7 decreased. This adjustment was due to the hydrological changes and sediment deficit caused by Zhuwo Reservoir.
4.3. Human Impacts
4.3.1. Water Projects and Ecological Restoration Projects
Historically, floods have occurred frequently in Yongding River. Since the 1950s, the state has built a series of reservoirs and hydropower projects to ensure urban safety in Beijing.
Construction on Guanting Reservoir in the upper reaches of the study area started in October 1951 and was completed in May 1954 [43]. It was the first large-scale reservoir built on the upper reaches of the Yongding River after the founding of the People’s Republic of China. It plays a key role in regulating and controlling the generation of cascade hydropower. In 1958, Zhuwo Reservoir was built in the lower reaches of Guanting Reservoir. Power generation began in January 1961, forming the second cascade hydropower station in the Yongding River. Subsequently, in the lower reaches of Zhuwo, construction was commenced on Luopoling Reservoir, forming the third cascade hydropower generation system in December 1975. Sanjiadian Reservoir, located at the end of the study area was completed in 1956 [44].
Since 2005, Beijing has implemented the “Abandoned Big Sand Pit Ecological Restoration Project (2006–2008)”, and the “Yongding River Basin Ecological Restoration Project (2007–2010)”. More than one hundred ecological restoration projects, including “Control Project (2006–2012)”, have been built along three ecological defense lines of “ecological governance, ecological restoration, and ecological protection,” with significant progress made in the ecological governance of the river basin [45] and in improving the increasingly degraded ecological environment.
4.3.2. Sediment Mining
Before the 1960s, although Yongding River had specialized sand and gravel mining sites, most of them were located in the upper reaches of Shijingshan. They were all manually or semi-mechanically mined. The total annual excavation was only in the range of 50,000–60,000 m3. After 1980, with the rapid urban construction in Beijing, the demand for sand and gravel increased accordingly.
Although the government has formulated a sand and gravel mining plan, and the mining organizations stated the mining scope and excavation depth in writing, some organizations have only considered current interests and largely neglected the conditions of the river after concluding their mining activities. Sediment mining activities on the banks of the Yongding River in the Mentougou area are frequent, and large-scale indiscriminate quarrying of the sand and gravel reached its peak around 1996 [46], causing serious damage to the ecology of the Yongding River.
4.3.3. Land Use Change
From 1964 to 2018 (Figure 11), areas of residential land and farmland gradually increased; the increase in the residential land has been particularly high, from 2.10% to 11.11%, an approximately five-fold increase in 50 years. However, the areas with the other three land use types showed a downward trend, with the highest reduction rate being 11.65%, and areas associated with water also decreased by 2.17%. In the second stage, i.e., from 1980 to 2004, the intensity of land use conversion was the highest, and the change rate of all land types was the highest among the three stages. Residential land and farmland increased by 4.36% and 3.40%, respectively, accounting for approximately half of the 50-year change rate (9.01% and 7.06%).
In general, the proportion of residential land and farmland increased significantly, whereas areas associated with forest and water decreased. The land use change indicates the effect of frequent human activities in the entire study area, closely related to the continuous degradation of river morphology. The land use change may also be one of the important controlling factors leading to the narrowing of the river in the second stage.
5. Discussion
5.1. Temporal Analysis
To discuss the river morphological changes over the last 54 years, we linked the evolution trajectory with possible human and climate controlling factors in the study area (Figure 12). Based on the available data and information, the study qualitatively classified the strength of the controlling factors.
In the first stage (1964–1980), the shrinkage of the channel width was closely related to the construction of water conservancy projects. The reduction in the Guanting Reservoir inflow runoff since the 1955 was the basic factor of overall degradation. Additionally, the three reservoirs followed in the study area strengthened the degrading trend and led to the difference in the evolution trajectory of each reach. Although the reservoir prevents downstream flooding by controlling the amount of water discharged, it dramatically reduces the flow and sediment content of the downstream section, aggravates the shrinkage of the channel width, and destroys the morphology and ecology of the downstream basin. Moreover, we think that the duration of this influence was not only limited to the first stage, but also a basic factor for the subsequent stage of river morphology change. There are new important controlling factors that aggravated or slowed down the trend of river degradation in the subsequent stage.
In the second stage (1980–2004), the channel width and sinuosity of the Yongding River declined drastically, likely because of multiple factors. Given the requirements of urban development and expansion, large-scale sand mining activities in the river channels commenced in the 1980s, reaching a peak at the end of the 20th century. Moreover, the intensity of land use change was highest in this period. The proportion of residential land and farmland increased significantly, whereas areas associated with forest and water decreased. According to the climatic data, the climate during this period was drought, and the intensity of rainfall reduction and temperature rise was high. The channel discharge also decreased and deterioration of the river morphology was aggravated. As for the relative importance of these three factors, their main impact scales are different: sediment mining and construction of residential land in R6 and R7, farmland increase in R2 and R4, while climate can affect the whole study area. Therefore, climate may control the trend of the whole trend, while sand mining and land use change aggravate the change in some areas.
In the third stage (2004–2018), the rate of river narrowing decreased, whereas the sinuosity increased. This is related to the end of sediment mining and the start of ecological restoration projects along the Yongding River. In 2021, the Yongding River carried out ecological water replenishment. Although it is unlikely to return to the good flow and sediment state in history, it can still improve the state of the river. We infer that the evolution of Yongding River’s morphology will be positive in the years to come. However, the response of each reach to ecological replenishment depends on the level of the energy system. For example, R2, R6 and R7 should have a higher sensitivity to changes and faster adjustments than R4 and R5, which have low human activity intensity [47].
5.2. Spatial Analysis
The river morphology in the different reaches varied during the 54-year period. The study combined the controlling factors and evolution trajectories along the river channel (Figure 13) to analyze their influence on the reach scale.
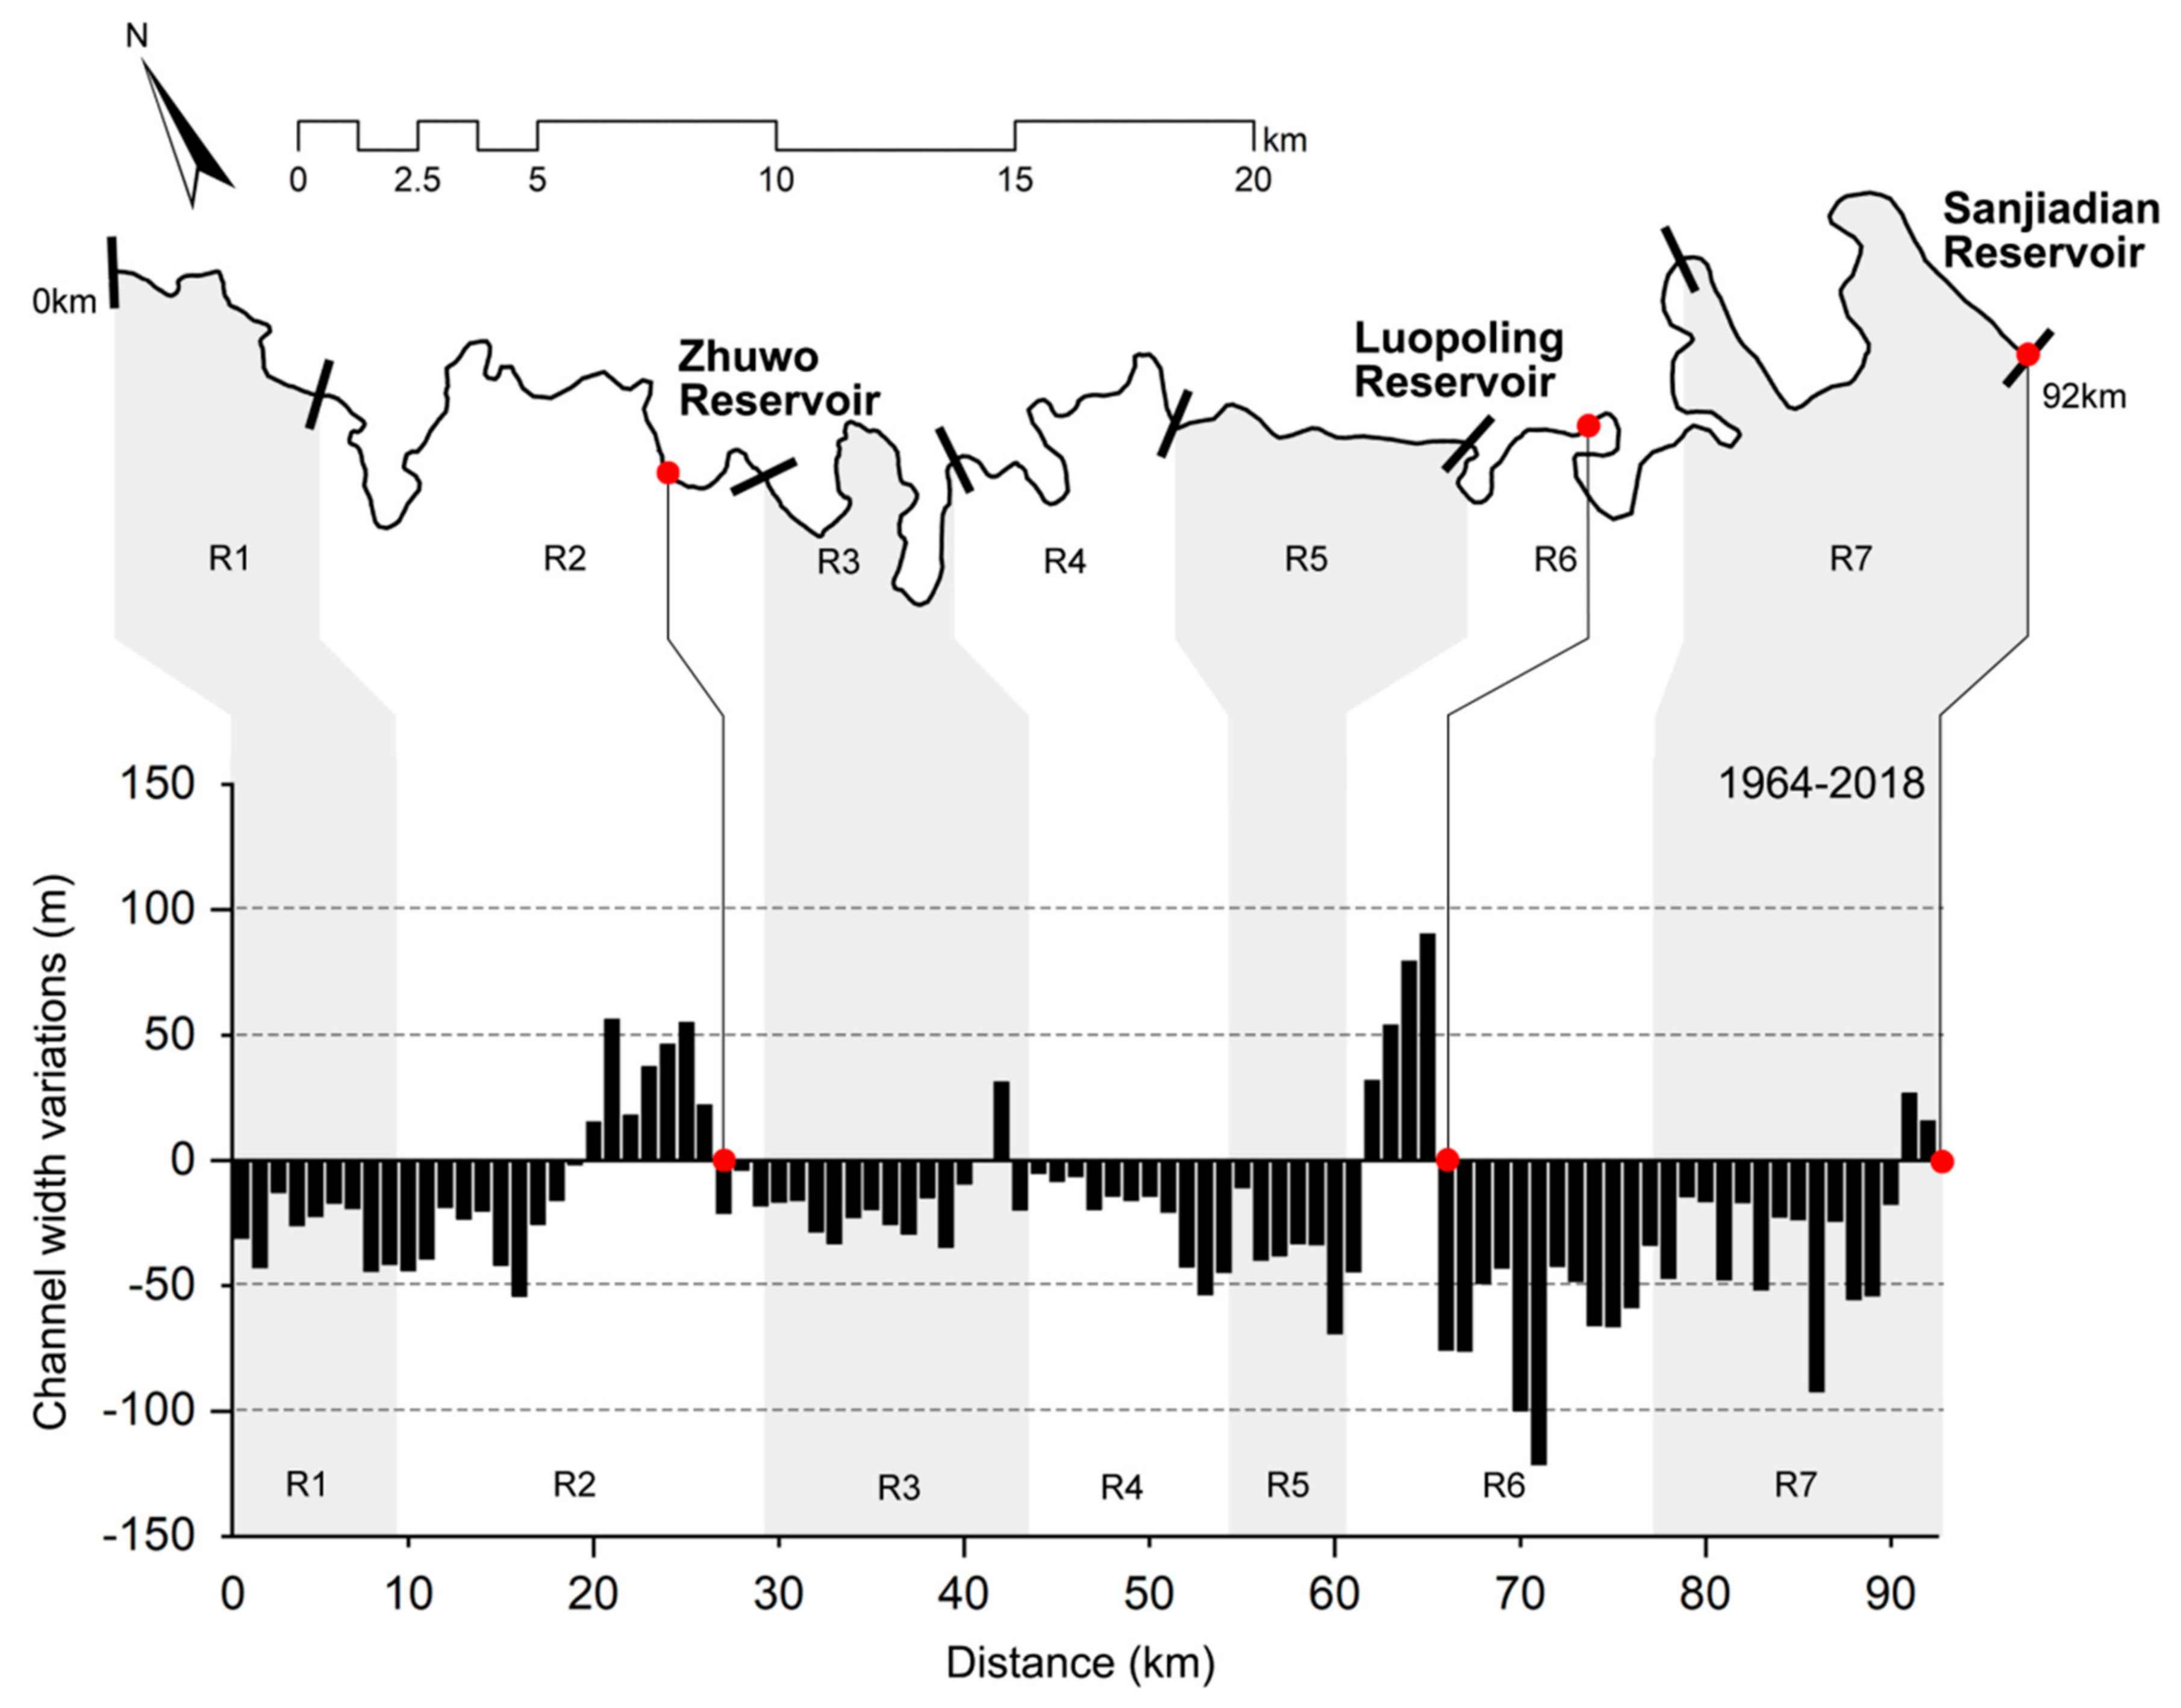
We considered that the reservoir played two roles in the evolution of Yongding River’s morphology. Firstly, reservoirs could greatly influence the flow regime and interrupt the sediment continuity entering a downstream river reach, which results in dramatic channel evolution. This also reasonably explained why the channel sinuosity in the R3 and middle section of R6 exhibited a significant reduction. Secondly, the channel width in front of the three reservoirs in the study area increased, in which the changes of Zhuwo Reservoir and Luopoling Reservoir are significant, and Sanjiadian Reservoir was slight. This trend was opposite to the downward trend of the entire river channel. Due to the construction of reservoirs, the bank was widened and hardened, and a large number of runoff was intercepted to block floods, thus increasing the width of the nearby upstream channel.
Large gravel pits caused by sediment mining in the river channels destroyed the natural morphology of the riverbed, making the river discontinuous and irregular. Historically, the distribution of sediment mining in the Mentougou District presented apparent characteristics, concentrated in R6 and R7. The channel width of these reaches significantly decreased and showed fragmentation characteristics. This has also caused unstable changes in the erosion rate of the R6 and R7 sections, which was different from the overall characteristics (R6 was the only section where the rate declined, whereas the rate in R7 increased significantly in the last stage). In addition to sediment mining, land use changes also caused damage to the river morphology of R6 and R7. Through our field survey in 2018, it was found that the rapid development of cities and towns made construction land and farmland occupy the river beach, reduced the resilience space of the river, and limited the natural swing and evolution of the river.
The evolution of Yongding River is similar to that of most rivers in Europe. Human intervention has a huge impact on river morphology, which are usually negative. In the case of Zhuwo Reservoir and Luopoling Reservoir in R2 and R6, flow alteration downstream of dams promotes channel narrowing because of the reduction in discharge. Previous studies also suggested that river channel morphology without human intervention tends to develop positively, although this change may not be obvious [48], such as the slight rise of R4 and R5 sinuosity in the study. Compared with other fluvial systems, the difference of the channel response of Yongding River is related to the diverse temporal and spatial combination of human disturbance. Reservoir construction, sand mining activities and land use change all profoundly control the river morphology. For climate variability (precipitation and temperature), it was also an important factor of basin scale, and it affected the evolution trend of the whole river. This is also different from many rivers, where the role of climate was not as evident [25].
The results of this study should be a warning for future human activities on the Yongding River, and even other rivers in China. Although the activity intensity of reservoir construction and sediment mining would be low in the future, their impact will be irreversible in a short time. We infer that with the development of towns, more river sections may be occupied by farmland and buildings. Additionally, the trend of climate deterioration will also aggravate the reduction in flow. This is a huge challenge for the river management of Yongding River. Therefore, we should understand the evolutionary trajectory and controlling factors of rivers. This is essential for scientific river management.
5.3. River Restoration Strategies
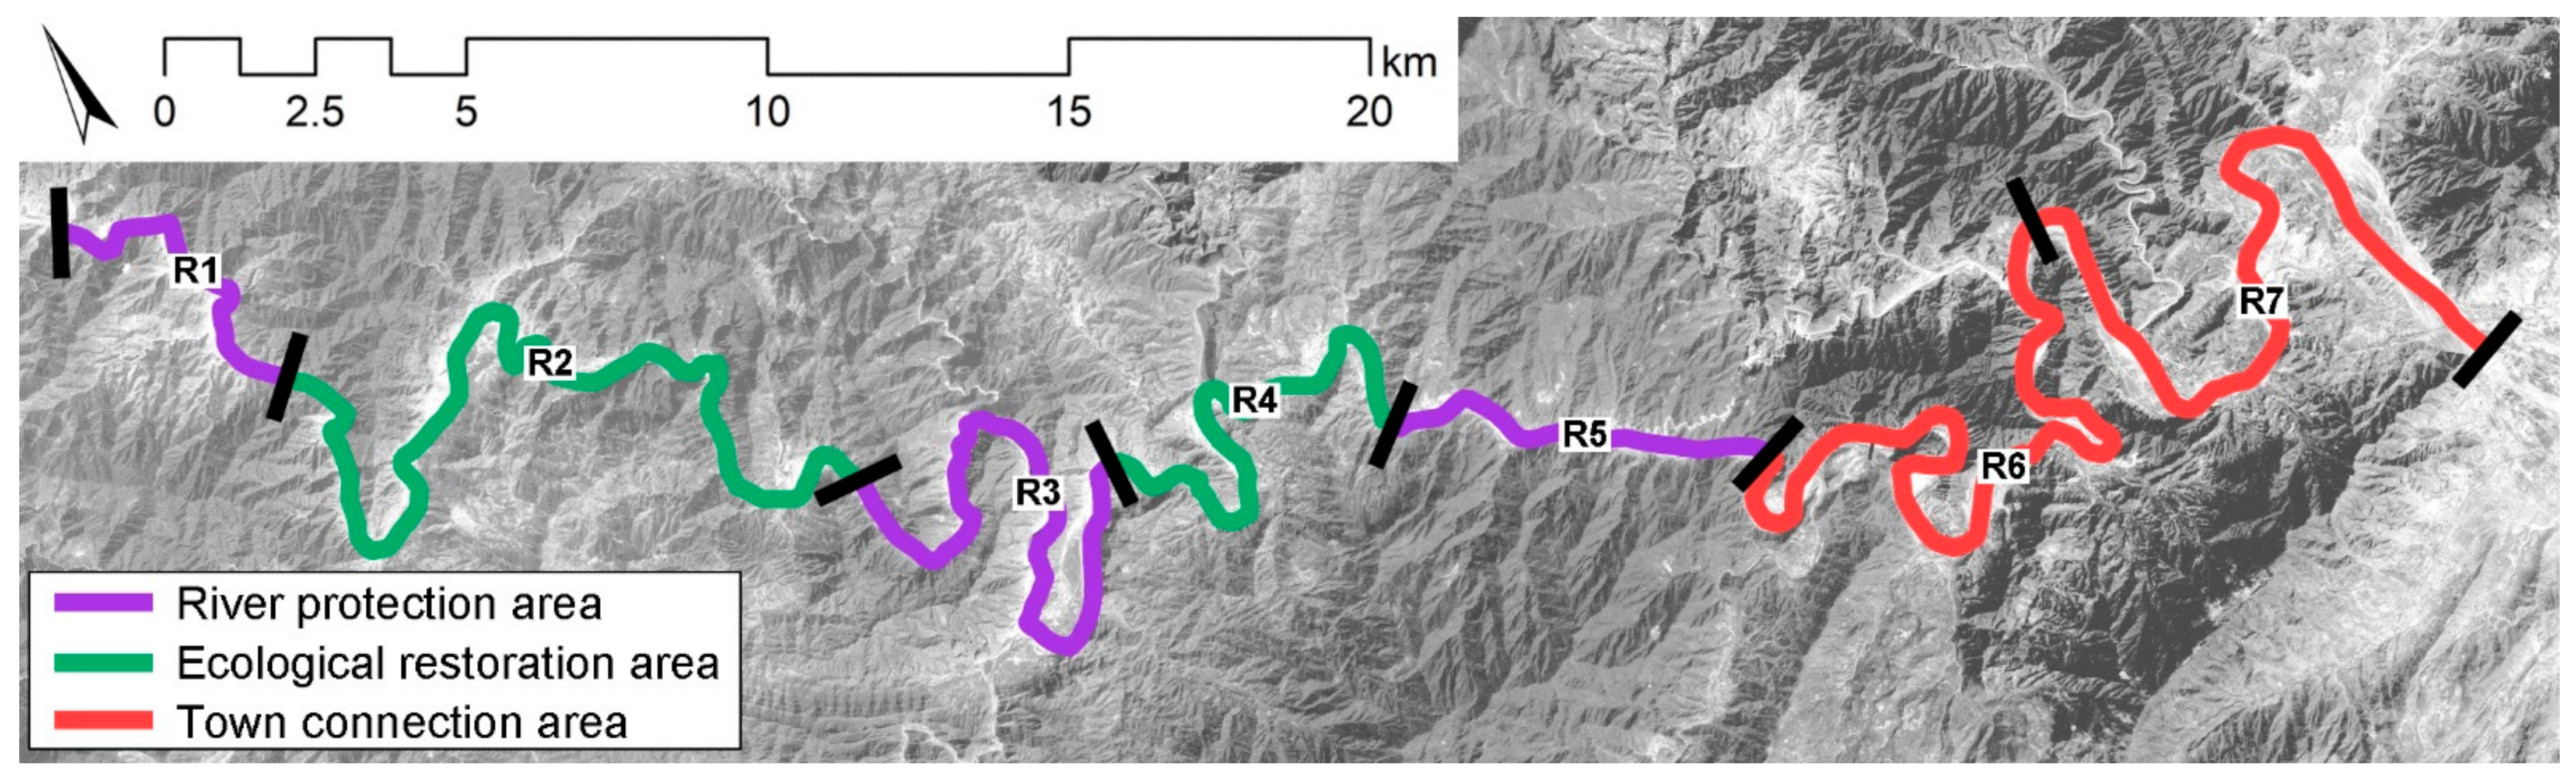
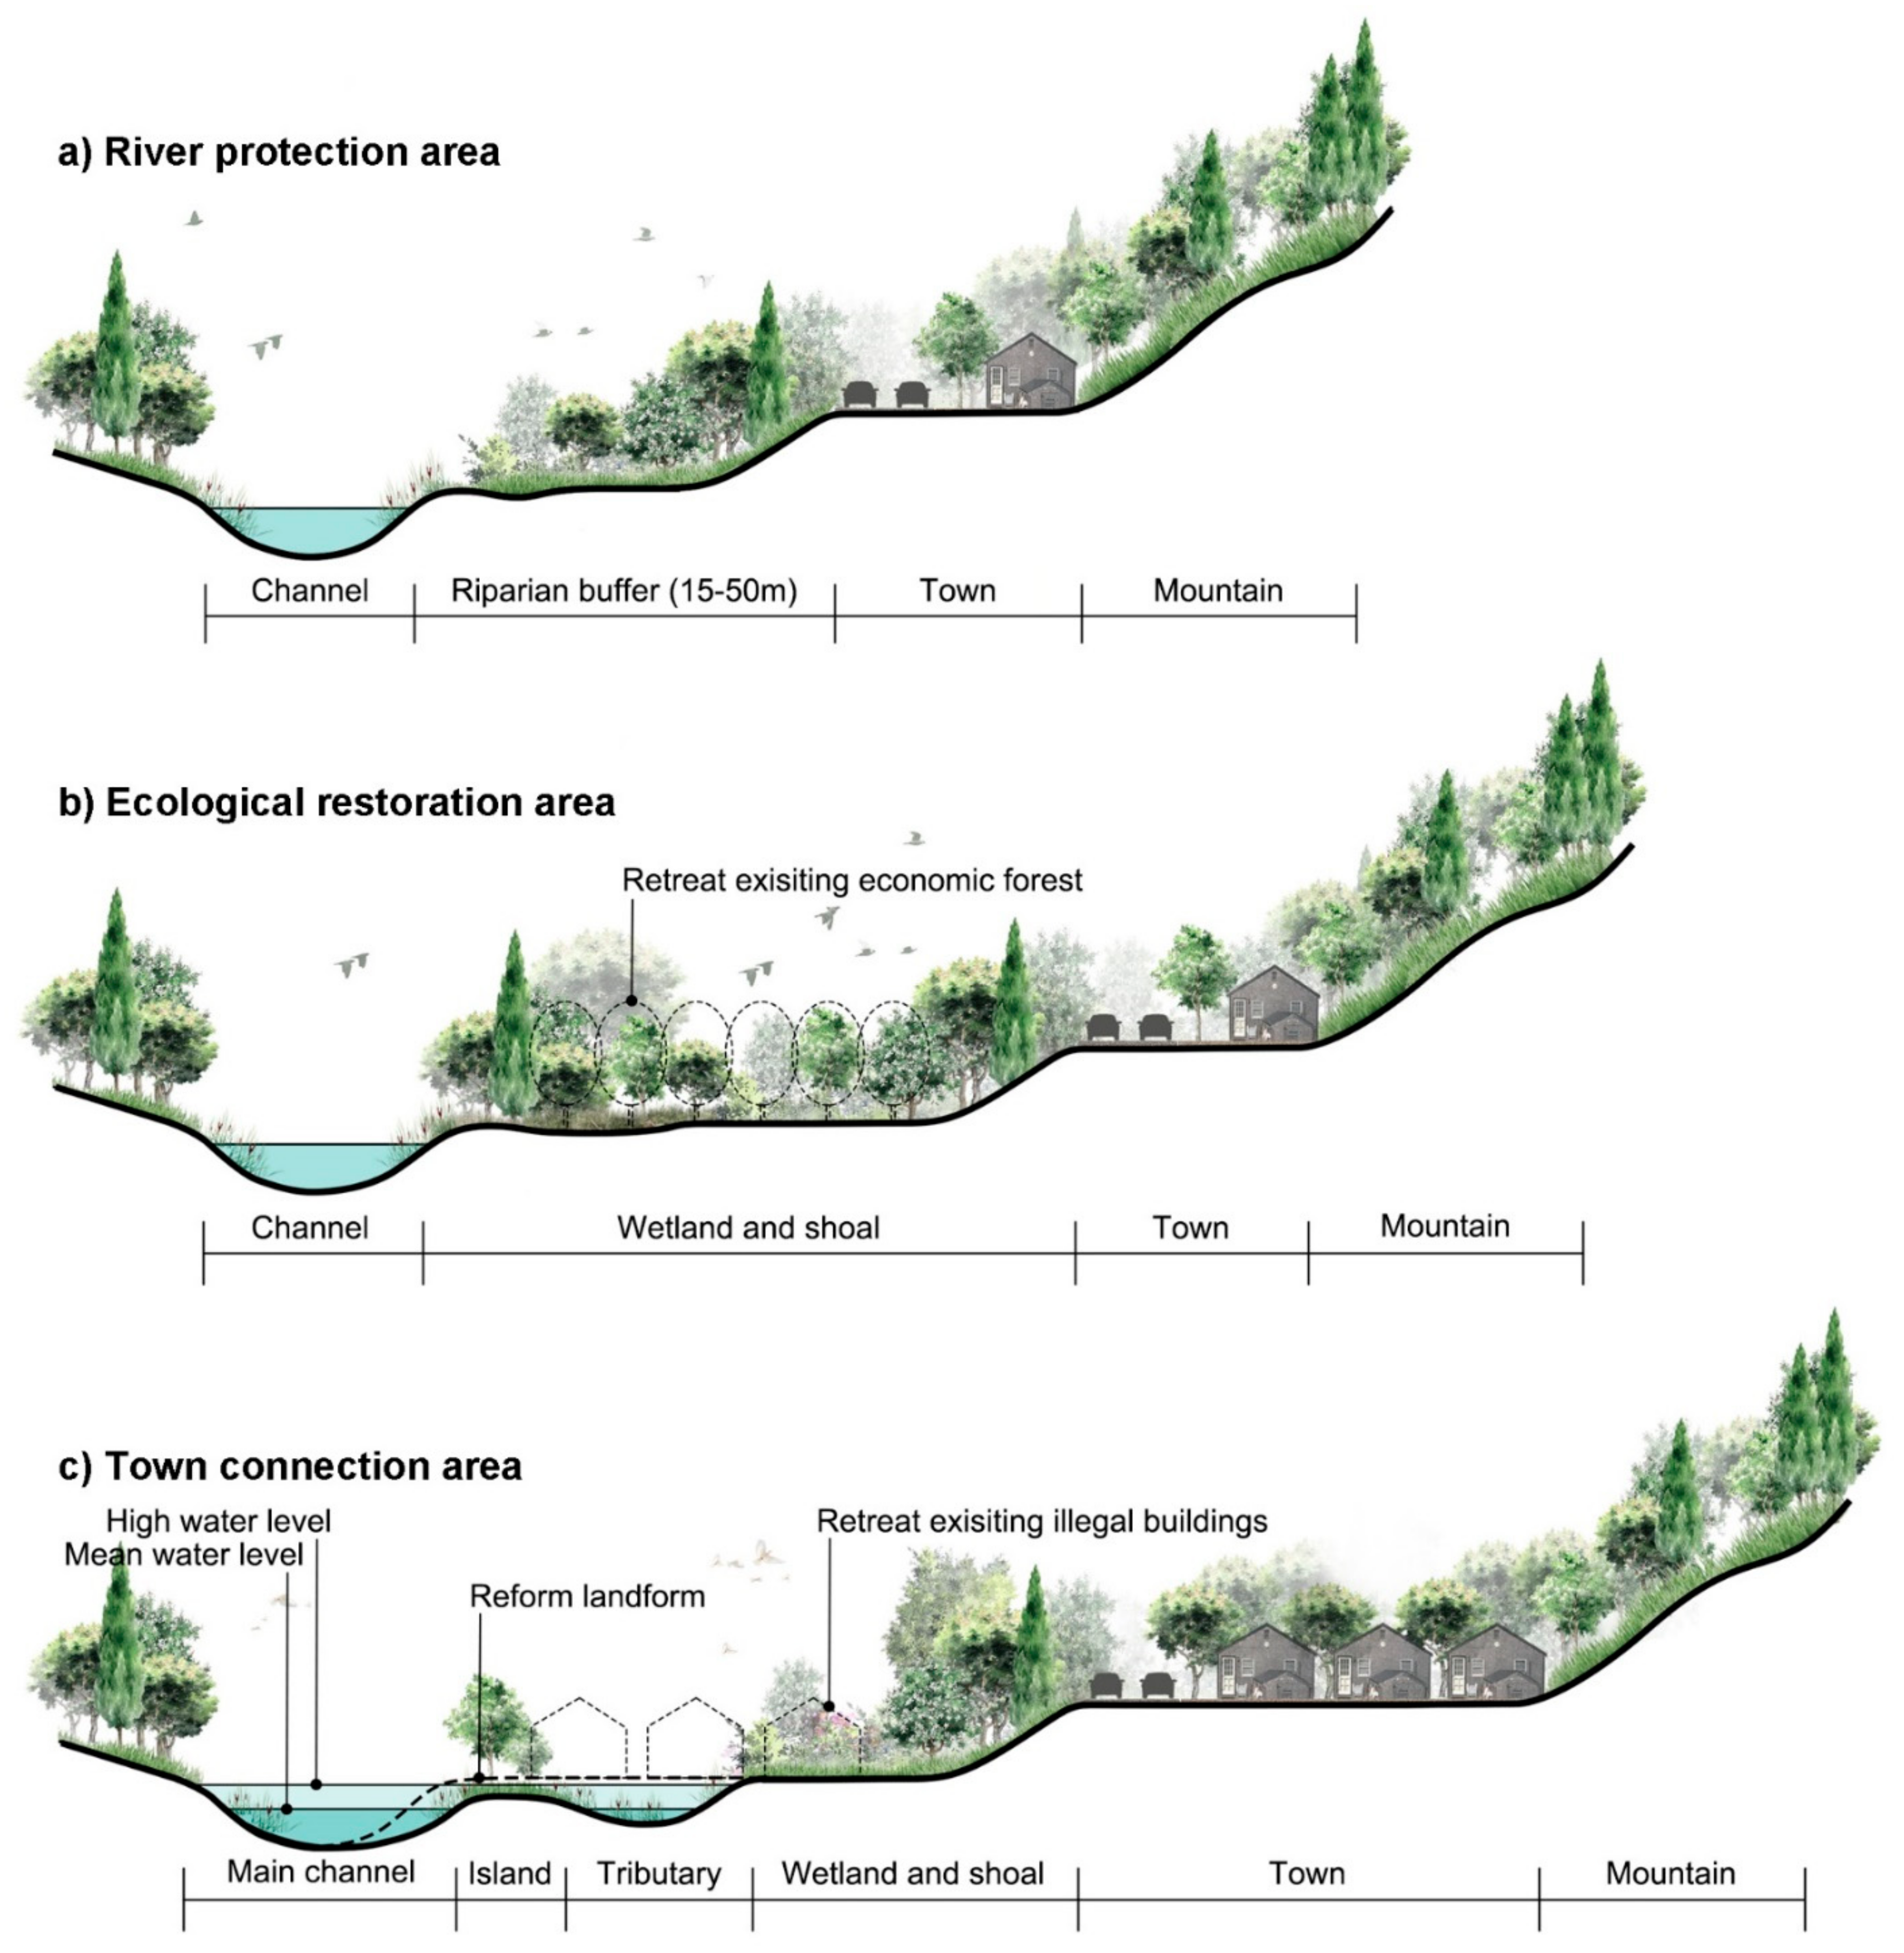
Based on the results, we proposed a set of river restoration strategies and protection measures for the Yongding River. The plan divided the seven sections of the study area into three types: different ecological restoration, river development and land use strategies were implemented (Figure 14). For each type, we designed a typical and representative section for reference (Figure 15).
(1) River protection area (R1, R3, R5): In this kind of near-natural area, development and construction on both sides of the river should be strictly prohibited, and the current natural river resources should be protected. According to the research of channel migration, the resilience space of the river channel should be reserved to form a 15–50 m [49] riparian buffer to protect diverse habitats and increase biodiversity (Figure 15a).
(2) Ecological restoration area (R2, R4): At present, a considerable area of economic forest (mainly jujube forest) is close to the waterfront, causing damage to the river. The scale of agricultural land should be strictly controlled. The farmland and fruit forest within 30 m along the river bank should be retreated to restore the natural community of floodplain plants and avoid soil erosion and water pollution (Figure 15b).
(3) Town connection area (R6, R7): There is a large amount of construction land and high-impact activities here, and illegal buildings occupying the river should be retreated. According to the river space, the complexity of the river morphology should be increased, and the single-channel river should be changed to a multi-channel river. The main channel should mainly be used for flood discharge, and the tributary should be used to improve the sediment transport capacity and the quality of habitat (Figure 15c).
6. Conclusions
We reconstructed the morphological evolution trajectory of the Beijing section of the Yongding River’s Guanting Valley, from 1964 to 2018. We found a significant change in its river morphology, showing an overall narrowing trend in the channel width and a decreasing channel sinuosity, along with an unstable state of the river. The temporal and spatial patterns also showed significant differences. The overall river width narrowed by 31%. In the first stage (1964–1980) and third stage (2004–2018), the channel width decreased at a relatively low rate. However, the width decreased in the second stage (1980–2004) by up to 23%, with the rate being as high as 1 m/year. By analyzing different controlling factors, we explained the morphological evolution mechanism of the river. We conclude that in the past 54 years, the main controlling factor for the study area is human intervention. The results give us a warning that we need to pay great attention to the impact of human activities on river health. Preliminary management strategies and recommendations for the Yongding River Basin are put forward in the study. In watershed management, multi-discipline collaboration makes water and land space play diverse benefits. The establishment of the morphological evolution trajectory of the river provides an essential reference for the future evolution trend and provides a theoretical support and basis for river management and ecological restoration projects. Today, an ecological restoration project is underway along the Yongding River and has achieved phased results. In the future, the research of river morphology monitoring and ecological restoration post evaluation needs to form a mature mechanism to guide the ecological restoration of rivers.
In addition, we recognize that this study has some limitations. It is necessary to improve the quantity and quality of the data and enhance the credibility of explaining channel changes and controlling factors. More research is required to evaluate the changes in the hydrological state and riverbed topography of the river in its natural state and the channelized river sections. This can help obtain a deeper understanding of the evolution of the river channel, prevent the degradation process of the river channel, and improve the ecological environment of the basin.
Author Contributions
Writing—original draft preparation, H.L.; writing—review and editing, Z.L., X.X. and M.W.; supervision, Z.L.; data curation H.L., X.X. and M.W.; funding acquisition, Z.L. and X.X. All authors have read and agreed to the published version of the manuscript.
Funding
This research was funded by National Science and Technology Major Project (No. 2018ZX07101005) and the World-Class Discipline Construction and Characteristic Development Guidance Funds for Beijing Forestry University (No. 2019XKJS0318).
Institutional Review Board Statement
Not applicable.
Informed Consent Statement
Not applicable.
Data Availability Statement
The data presented in this study are available on request from the corresponding author.
Acknowledgments
We thank the editors and reviewers for the useful comments and suggestions which greatly helped in improving the manuscript.
Conflicts of Interest
The authors declare no conflict of interest.
References
- Dong, Z.R. Diversity of river morphology and diversity of bio-communities. J. Hydraul. Eng. 2003, 11, 1–6. [Google Scholar]
- Bollati, I.M.; Pellegrini, L.; Rinaldi, M.; Duci, G.; Pelfini, M. Reach-scale morphological adjustments and stages of channel evolution: The case of the Trebbia River (northern Italy). Geomorphology 2014, 221, 176–186. [Google Scholar] [CrossRef] [Green Version]
- Yin, X.L.; Li, G.C.; Liu, K.; Zhong, Y.J. Progress on Urban Stream Transformation of Critical Forms and Stability Relationships. Prog. Geogr. 2012, 31, 837–845. [Google Scholar]
- Alessandra, C. Analysis and Modelling of River Meandering, 1st ed.; IOS Press: Amsterdam, The Netherlands, 2008; pp. 22–24. [Google Scholar]
- Bertalan, L.; Rodrigo-Comino, J.; Surian, N.; Sulc Michalkova, M.; Kovacs, Z.; Szabo, S.; Szabo, G.; Hooke, J. Detailed assessment of spatial and temporal variations in river channel changes and meander evolution as a preliminary work for effective floodplain management. The example of Sajo River, Hungary. J. Environ. Manag. 2019, 248, 109277. [Google Scholar] [CrossRef]
- Michalková, M.; Piégay, H.; Kondolf, G.M.; Greco, S.E. Lateral erosion of the Sacramento River, California (1942-1999), and responses of channel and floodplain lake to human influences. Earth Surf. Process. Landf. 2011, 36, 257–272. [Google Scholar] [CrossRef]
- Ta, W.Q.; Jia, X.P.; Wang, H.B. Channel deposition induced by bank erosion in response to decreased flows in the sand-banked reach of the upstream Yellow River. Catena 2013, 105, 62–68. [Google Scholar] [CrossRef]
- Das, A.K.; Sah, R.K.; Hazarika, N. Bankline change and the facets of riverine hazards in the floodplain of Subansiri-Ranganadi Doab, Brahmaputra Valley, India. Nat. Hazards 2012, 64, 1015–1028. [Google Scholar] [CrossRef]
- Gurnell, A.M. Channel change on the River Dee meanders, 1946–1992, from the analysis of air photographs. Regul. Rivers Res. Manag. 1997, 13, 13–26. [Google Scholar] [CrossRef]
- Konsuer, K.M.; Rhoads, B.L.; Langendoen, E.J.; Best, J.L.; Ursic, M.E.; Abad, J.D.; Garcia, M.H. Spatial variability in bank resistance to erosion on a large meandering, mixed bedrock-alluvial river. Geomorphology 2016, 252, 80–97. [Google Scholar] [CrossRef]
- Piégay, H.; Grant, G.; Nakamura, F.; Trustrum, N. Braided River Management: From Assessment of River Behaviour to Improved Sustainable Development, 1st ed.; Blackwell Science: Oxford, UK, 2006; pp. 257–275. [Google Scholar]
- Brierley, G.J.; Fryirs, K.; Outhet, D.; Massey, C. Application of the River Styles framework as a basis for river management in New South Wales, Australia. Appl. Geogr. 2002, 22, 91–122. [Google Scholar] [CrossRef]
- Ziliani, L.; Surian, N. Evolutionary trajectory of channel morphology and controlling factors in a large gravel-bed river. Geomorphology 2012, 173, 104–117. [Google Scholar] [CrossRef]
- Gordon, E.; Meentemeyer, R.K.J.G. Effects of dam operation and land use on stream channel morphology and riparian vegetation. Geomorphology 2006, 82, 412–429. [Google Scholar] [CrossRef]
- Kiss, T.; Fiala, K.; Sipos, G.; Szatmári, G. Long-term hydrological changes after various river regulation measures: Are we responsible for flow extremes? Hydrol. Res. 2019, 50, 417–430. [Google Scholar] [CrossRef] [Green Version]
- Zhou, M.; Xia, J.; Lu, J.; Deng, S.; Lin, F. Morphological adjustments in a meandering reach of the middle Yangtze River caused by severe human activities. Geomorphology 2017, 285, 325–332. [Google Scholar] [CrossRef]
- Malik, S.; Pal, S.C. Is the construction of Groynes accelerating the degradation of channel morphology and paved the way for human encroachment in The Bengal Basin? Adv. Space Res. 2019, 64, 1549–1576. [Google Scholar] [CrossRef]
- Preciso, E.; Salemi, E.; Billi, P. Land use changes, torrent control works and sediment mining: Effects on channel morphology and sediment flux, case study of the Reno River (Northern Italy). Hydrol. Process. 2012, 26, 1134–1148. [Google Scholar] [CrossRef]
- Marston, R.A.; Bravard, J.P.; Green, T. Impacts of reforestation and gravel mining on the Malnant River, Haute-Savoie, French Alps. Geomorphology 2003, 55, 65–74. [Google Scholar] [CrossRef]
- Hajdukiewicz, H.; Wyżga, B.; Mikuś, P.; Zawiejska, J.; Radecki-Pawlik, A. Impact of a large flood on mountain river habitats, channel morphology, and valley infrastructure. Geomorphology 2016, 272, 55–67. [Google Scholar] [CrossRef]
- Yousefi, S.; Mirzaee, S.; Keesstra, S.; Surian, N.; Pourghasemi, H.R.; Zakizadeh, H.R.; Tabibian, S. Effects of an extreme flood on river morphology (case study: Karoon River, Iran). Geomorphology 2018, 304, 30–39. [Google Scholar] [CrossRef]
- Simon, A.; Thorne, C.R. Channel adjustment of an unstable coarse-grained stream: Opposing trends of boundary and critical shear stress and the applicability of extremal hypotheses. Earth Surf. Process. Landf. 1996, 21, 155–180. [Google Scholar] [CrossRef]
- Amsler, M.L.; Ramonell, C.G.; Toniolo, H.A. Morphologic changes in the Paraná River channel (Argentina) in the light of the climate variability during the 20th century. Geomorphology 2005, 70, 257–278. [Google Scholar] [CrossRef]
- Luchi, R.; Hooke, J.M.; Zolezzi, G.; Bertoldi, W. Width variations and mid-channel bar inception in meanders: River Bollin (UK). Geomorphology 2010, 119, 1–8. [Google Scholar] [CrossRef]
- Baena-Escudero, R.; Rinaldi, M.; García-Martínez, B.; Guerrero-Amador, I.C.; Nardi, L. Channel adjustments in the lower Guadalquivir River (southern Spain) over the last 250 years. Geomorphology 2019, 337, 15–30. [Google Scholar] [CrossRef]
- Musso, N.M.D.; Capolongo, D.; Caldara, M.; Surian, N.; Pennetta, L. Channel Changes and Controlling Factors over the Past 150 Years in the Basento River (Southern Italy). Water 2020, 12, 307. [Google Scholar] [CrossRef] [Green Version]
- Dai, H.L.; Dai, J.B.; Shu, A.P.; Zhang, K.L. Review of River Bank Erosion Research. Adv. Earth Sci. 2013, 28, 988–996. [Google Scholar]
- Uribelarrea, D.; Perez-Gonzalez, A.; Benito, G. Channel changes in the Jarama and Tagus rivers (central Spain) over the past 500 years. Quat. Sci. Rev. 2003, 22, 2209–2221. [Google Scholar] [CrossRef]
- Morais, E.S.; Rocha, P.C.; Hooke, J. Spatiotemporal variations in channel changes caused by cumulative factors in a meandering river: The lower Peixe River, Brazil. Geomorphology 2016, 273, 348–360. [Google Scholar] [CrossRef] [Green Version]
- Garófano-Gómez, V.; Martínez-Capel, F.; Bertoldi, W.; Gurnell, A.; Estornell, J.; Segura-Beltrán, F. Six decades of changes in the riparian corridor of a Mediterranean river: A synthetic analysis based on historical data sources. Ecohydrology 2013, 6, 536–553. [Google Scholar] [CrossRef]
- Yu, M.; Wei, Y.S.; Liu, J.G.; Liu, P.B.; Zhang, Z.M.; Wei, W.; Wang, Y.W.; Zhong, J.; Yang, Y.; Xiao, Q.C.; et al. Impact of socioeconomic development on water resource and water environment of Yongding River in Beijing. Acta Sci. Circumst. 2011, 31, 1817–1825. [Google Scholar]
- Zhang, L.W.; Zhang, L. The Ecological Environment Succession and Management of Yongding River in Beijing. J. Beijing Union Univ. (Humanit. Soc. Sci.) 2017, 15, 118–124. [Google Scholar]
- Zhang, L.P.; Yu, S.Y.; Duan, Y.B.; Shan, L.J.; Chen, X.C.; Xu, Z.X. Quantitative Assessment of the Effects of Climate Change and Human Activities on Runoff in the Yongding River Basin. Clim. Chang. Res. 2013, 9, 391–397. [Google Scholar]
- Zhang, W.L. Effects of Climate Change and Human Activities on Runoff in the Yongding River Basin. Yellow River 2015, 37, 27–30. [Google Scholar]
- Wei, J.; Pan, X.Y.; Kong, G.; Bai, T.; Huang, Q.; Li, B.; Ma, P.P. Study on ecological restoration of water-deficient rivers based on ecological water supplement method. J. Water Resour. Water Eng. 2020, 31, 64–69+76. [Google Scholar]
- Ding, A.Z.; Zhao, Y.J.; Hao, D.; Zhang, S.R.; Qiao, G.J. Analysis of Variation Characteristics of Runoff and Their Influencing Factors in the Yongding River Basin. South-North Water Transf. Water Sci. Technol. 2013, 11, 17–22. [Google Scholar]
- Pan, W.; Xiao, L.B.; Yan, F.F. The Study for Relationship between PDO and the streamflow of Yongdinghe River (Lugouqiao) since 1766AD. J. Chin. Hist. Geogr. 2013, 28, 127–133. [Google Scholar]
- Wang, Y.; Xue, Y.; Du, L.G. Analysis on the flood characteristics in Guanting Valley of Yongding River. Beijing Water 2003, 03, 27–28. [Google Scholar]
- Hughes, M.L.; McDowell, P.F.; Marcus, W.A. Accuracy assessment of georectified aerial photographs: Implications for measuring lateral channel movement in a GIS. Geomorphology 2006, 74, 1–16. [Google Scholar] [CrossRef]
- Mount, N.J.; Louis, J.; Teeuw, R.M.; Zukowskyj, P.M.; Stott, T. Estimation of error in bankfull width comparisons from temporally sequenced raw and corrected aerial photographs. Geomorphology 2003, 56, 65–77. [Google Scholar] [CrossRef]
- Rust, B.R. A classification of alluvial channel systems. Can. Soc. Pet. Geol. Mem. 1978, 5, 605–625. [Google Scholar]
- Piégay, H.; Darby, S.E.; Mosselman, E.; Surian, N. A review of techniques available for delimiting the erodible river corridor: A sustainable approach to managing bank erosion. River Res. Appl. 2005, 21, 773–789. [Google Scholar] [CrossRef]
- Rosgen, D.L. A Classification of Natural Rivers. Catena 1994, 22, 169–199. [Google Scholar] [CrossRef] [Green Version]
- Editorial Board of Beijing Water Conservancy. Local Records of Water Conservancy in Beijing; China Water & Power Press: Beijing, China, 1989; Volume 3, pp. 234–235. [Google Scholar]
- Zhai, X.D. Discussion on flow regulation of Sanjiadian diversion project in new period. Beijing Water 2018, 4, 41–44. [Google Scholar] [CrossRef]
- Ma, S.P. Study on Ecological Restoration Comprehensive Evaluation Benefit in Mentougou District of Beijing. Master’s Thesis, Beijing Forestry University, Beijing, China, 2011. [Google Scholar]
- Scorpio, V.; Rosskopf, C.M.J.G. Channel adjustments in a Mediterranean river over the last 150 years in the context of anthropic and natural controls. Geomorphology 2016, 275, 90–104. [Google Scholar] [CrossRef]
- Dragićević, S.; Pripužić, M.; Živković, N.; Novković, I.; Kostadinov, S.; Langović, M.; Milojković, B.; Čvorović, Z. Spatial and Temporal Variability of Bank Erosion during the Period 1930–2016: Case Study—Kolubara River Basin (Serbia). Water 2017, 9, 748. [Google Scholar] [CrossRef] [Green Version]
- Lowrance, R.; Williams, R.G.; Inamdar, S.P.; Bosch, D.D.; Sheridan, J.M. Evaluation of coastal plain conservation buffers using the riparian ecosystem management model1. Jawra J. Am. Water Resour. Assoc. 2001, 37, 1445–1455. [Google Scholar] [CrossRef]
Figure 1.
(a) Location of the Yongding River basin and study area; (b) channel patterns of the study area in different periods.
Figure 1.
(a) Location of the Yongding River basin and study area; (b) channel patterns of the study area in different periods.

Figure 2.
Guanting Reservoir inflow runoff in the period of 1956–2018 [34].
Figure 2.
Guanting Reservoir inflow runoff in the period of 1956–2018 [34].

Figure 3.
LULC maps of 1964, 1980, 2004, and 2018.

Figure 4.
Delineated reach segments of study area.

Figure 5.
Determination of erosion/deposition area by overlaying two channel positions.

Figure 6.
(a) Variations in the channel width and sinuosity of the study area in the period of 1964–2018; (b) bar graph of the channel width with respect to seven reaches in the period of 1964–2018.
Figure 6.
(a) Variations in the channel width and sinuosity of the study area in the period of 1964–2018; (b) bar graph of the channel width with respect to seven reaches in the period of 1964–2018.

Figure 7.
Variation in the channel width in the period 1964–2018.

Figure 8.
Changes in the channel sinuosity from 1964–2018.

Figure 9.
Rate of erosion/deposition of the study area in the period 1964–2018.

Figure 10.
(a) Rate of erosion measured in the different reaches; (b) rate of deposition measured in the different reaches.
Figure 10.
(a) Rate of erosion measured in the different reaches; (b) rate of deposition measured in the different reaches.

Figure 11.
Proportion of area covered by each land use type during the period 1964–2018.

Figure 12.
Evolution trajectory of channel morphology and controlling factors over the last 54 years. The different colors indicate the intensity of the controlling factors and the relative influence of each factor on the channel dynamics.
Figure 12.
Evolution trajectory of channel morphology and controlling factors over the last 54 years. The different colors indicate the intensity of the controlling factors and the relative influence of each factor on the channel dynamics.

Figure 13.
Combined map of reservoir location in the study area and change in channel width. The x-axis represents the curvilinear distance.
Figure 13.
Combined map of reservoir location in the study area and change in channel width. The x-axis represents the curvilinear distance.

Figure 14.
River restoration strategy planning of the study area.

Figure 15.
Typical sections of (a) river protection area, (b) ecological restoration area and (c) town connection area.
Figure 15.
Typical sections of (a) river protection area, (b) ecological restoration area and (c) town connection area.


Table 1.
Precipitation and temperature in the Yongding River Basin over the last 50 years.
| Year | Precipitation | Temperature | ||
|---|---|---|---|---|
| Annual Mean (mm) | Anomaly Percentage (%) | Annual Mean (°C) | Anomaly (°C) | |
| 1957–1970 | 457 | 7.78 | 4.7 | −0.8 |
| 1971–1980 | 437 | 3.07 | 5.0 | −0.5 |
| 1981–1990 | 411 | −3.07 | 5.2 | −0.3 |
| 1991–2000 | 405 | −4.48 | 6.1 | 0.6 |
| 2001–2010 | 398 | −6.13 | 6.9 | 1.4 |
Table 2.
Aerial datasets used in the GIS analysis: BW—black and white image; C—colored image.
| Time | Remote Sensing Satellite | Type | Resolution (m) | RMSE (m) |
|---|---|---|---|---|
| 1964–09 | Keyhole-4A | Aerial image, BW | 2.0 | Reference map |
| 1980–07 | Keyhole-9 | Aerial image, BW | 5.0 | 6.2 |
| 2004–05 | SPOT-5 | Aerial image, C | 2.5 | 4.1 |
| 2018–07 | GF-1 | Aerial image, C | 2.0 | 2.5 |
Table 3.
Segmentation of the study area based on different river characteristics in 2018.
| Reach ID | Channel Length (km) | Number of Bends | Longitudinal Slope Ratio of the River Bed (m/km) | Channel Sinuosity | Degree of Human Activity | Number of Surrounding Towns and Villages | Tributaries |
|---|---|---|---|---|---|---|---|
| R1 | 8.7 | 17 | 4.86 | 1.37 | low | 1 | 0 |
| R2 | 19.2 | 37 | 5.26 | 1.93 | medium | 4 | 1 |
| R3 | 13.3 | 44 | 8.42 | 3.08 | low | 2 | 4 |
| R4 | 10.3 | 26 | 1.46 | 2.23 | medium | 5 | 2 |
| R5 | 6.7 | 11 | 5.97 | 1.10 | low | 1 | 1 |
| R6 | 18.1 | 46 | 2.60 | 2.98 | high | 9 | 4 |
| R7 | 15.6 | 32 | 3.85 | 2.05 | high | 8 | 2 |
Table 4.
Variation in the channel sinuosity in the seven reaches.
| 1964 | 1980 | 2004 | 2018 | Mean | 1964–1980 (%) | 1980–2004 (%) | 2004–2018 (%) | |
|---|---|---|---|---|---|---|---|---|
| R1 | 1.38 | 1.40 | 1.36 | 1.37 | 1.38 | 1.45 | −2.86 | −0.74 |
| R2 | 1.99 | 1.97 | 1.91 | 1.93 | 1.95 | −1.01 | −3.05 | 1.05 |
| R3 | 3.22 | 3.17 | 3.05 | 3.08 | 3.10 | −1.55 | −3.79 | 0.98 |
| R4 | 2.21 | 2.19 | 2.20 | 2.22 | 2.21 | −0.90 | 0.46 | 0.91 |
| R5 | 1.09 | 1.06 | 1.09 | 1.10 | 1.08 | −1.83 | 1.87 | 0.92 |
| R6 | 3.06 | 2.99 | 2.96 | 2.98 | 3.00 | −2.29 | −1.02 | 0.68 |
| R7 | 2.07 | 2.08 | 2.04 | 2.05 | 2.06 | 0.48 | −1.92 | 0.49 |
Table 5.
Area and rate of erosion/deposition in the period 1964–2018.
| Year | Erosion | Deposition | ||
|---|---|---|---|---|
| Area (ha) | Rate (ha/year) | Area (ha) | Rate (ha/year) | |
| 1964–1980 | 208 | 13.0 | 233 | 14.6 |
| 1980–2004 | 163 | 6.8 | 317 | 13.2 |
| 2004–2018 | 174 | 12.4 | 205 | 14.6 |
Publisher’s Note: MDPI stays neutral with regard to jurisdictional claims in published maps and institutional affiliations. |
© 2021 by the authors. Licensee MDPI, Basel, Switzerland. This article is an open access article distributed under the terms and conditions of the Creative Commons Attribution (CC BY) license (https://creativecommons.org/licenses/by/4.0/).
Share and Cite
MDPI and ACS Style
Li, H.; Xu, X.; Wu, M.; Liu, Z. Spatiotemporal Evolution Trajectory of Channel Morphology and Controlling Factors of Yongding River, Beijing, China. Water 2021, 13, 1489. https://doi.org/10.3390/w13111489
AMA Style
Li H, Xu X, Wu M, Liu Z. Spatiotemporal Evolution Trajectory of Channel Morphology and Controlling Factors of Yongding River, Beijing, China. Water. 2021; 13(11):1489. https://doi.org/10.3390/w13111489
Chicago/Turabian StyleLi, Hao, Xiaoming Xu, Minghao Wu, and Zhicheng Liu. 2021. "Spatiotemporal Evolution Trajectory of Channel Morphology and Controlling Factors of Yongding River, Beijing, China" Water 13, no. 11: 1489. https://doi.org/10.3390/w13111489
Note that from the first issue of 2016, this journal uses article numbers instead of page numbers. See further details here.