
Diversity and Distribution of Sabellida (Annelida) under Protection Regimes


Laboratorio di Zoologia e Biologia Marina, CoNISMa, DiSTeBA, Universita del Salento, 73100 Lecce, Italy
*
Author to whom correspondence should be addressed.
Water 2021, 13(11), 1491; https://doi.org/10.3390/w13111491
Submission received: 19 April 2021
/
Revised: 24 May 2021
/
Accepted: 25 May 2021
/
Published: 26 May 2021
(This article belongs to the Special Issue Implementation of Biodiversity and Ecosystem Services in Marine Ecosystem Management)
Abstract
:Sabellida are widespread, diverse and abundant in marine benthic habitats. Their distribution patterns on hard-bottom substrates are poorly studied so far. Little is known about the factors influencing their distribution, including the protection regimes that are known to affect assemblage diversity. We analyzed hard-bottom Sabellida at 1.5 and 5 m depths at the Torre Guaceto Marine Protected Area (MPA) (SE Italy) to describe diversity and distribution patterns, and to identify potential factors influencing their distribution. The Sabellida diversity varied significantly among stations and was higher at 5 m depth. No relation with the protection regime was found. Among environmental variables, only sedimentation appeared related, suggesting that local trophic features might have influenced the observed pattern. Among habitat formers, only the macroalga Halimeda tuna significantly explained part of the observed variation, probably due to its role as a basibiont for some Sabellida taxa. Other predictor variables of Sabellida distribution were the abundances of some invertebrate taxa, especially Syllidae and some filter feeders such as Sabellariida and Cirripedia, probably due to shared ecological requirements, rather than a direct effect on Sabellida distribution. The relation with the Syllidae remains obscure so far, albeit some kind of interaction (including predator/prey interactions) between these two taxa cannot be excluded. Sabellida should be taken into account when analyzing patterns of biodiversity of hard-bottom environments.
1. Introduction
Sabellida (Annelida), known also as fanworms, are diverse and widespread sedentary polychaetes, including about 1200 benthic species living from the intertidal to deep-sea habitats, from the tropical to Arctic and Antarctic regions [1].
Sabellida include Sabellidae Latreille, 1825, Fabriciidae Rioja, 1923, and Serpulidae Rafinesque, 1815, mostly represented by small-sized species, except for some Sabellidae [1]. The impressive review on the past and present knowledge on phylogeny, distribution and taxonomy by Capa et al. [1] evidences the poorly existing information on the ecology of its species, which are abundant in a large array of environments, being among the dominant taxa [2]. Particularly, some species of Serpulidae and Sabellidae are considered habitat formers [1,3], playing a key role in ecosystem functioning [4]. Fanworms are mainly sessile tubicolous and filter feeders using a branchial crown for feeding and respiration. Most species inhabit littoral hard substrates, living among algae, associated to sponges, mollusks, and ascidians, or among coral crevices, but they also occur in acidified areas, hydrothermal vents and deep Antarctic areas [5,6,7]. They are also typical foulers in marinas, harbors and/or other sheltered areas, where they can reach very high densities [6,8,9,10,11,12]. Several species have been unintentionally introduced through ships’ hulls, ballast waters or with maricultured species, even becoming non-indigenous species generating local negative ecological and economic impacts [6,12,13,14,15].
Some species inhabit soft-bottoms, where they also exert a key role in benthic pelagic coupling as basal components of the trophic web. As a consequence, they are considered bioindicators in ecological monitoring (e.g., genera within the Chonea group sensu Cochrane [16], which includes species difficult to identify but widespread in soft-bottom habitats and relevant in monitoring studies). In turn, hard-bottom Sabellida have seldom been the main focus of ecological surveys.
Shallow water, hard-bottom polychaetes often show alongshore horizontal distribution patterns responding to local conditions [17,18,19,20,21], but mainly varying along bathymetric gradients, and with hydrodynamics being a driving factor of the assemblage structure [2,18,22,23,24,25]. Syllidae are often the dominant family in abundance and species richness, therefore driving the general patterns of polychaete assemblages [20,25], which are related with abiotic (e.g., sedimentation, temperature, salinity, level of protection) and biotic (e.g., abundance of habitat formers, abundance of other benthic taxa) variables [7,21,25]. In the case of Syllidae, the co-variation of their distribution patterns with other taxa (including sabellids) suggests that interspecific interactions may contribute to determine their diversity and abundance [2]. In the case of Sabellida, their distribution patterns remain poorly studied, despite that their sedentary habit and trophic requirements suggest that their abundance and distribution may be determined by particular biotic and abiotic conditions, including hydrodynamics and anthropogenic stress [26,27].
Marine protected areas (MPAs) are particularly suitable to investigate the influence of these different variables on polychaetes (including Sabellida) distribution [2,25]. Thus, we analyzed the distribution patterns of hard-bottom Sabellida in the shallow subtidal zone of the Torre Guaceto MPA (Italy, South Adriatic Sea) to: (1) quantify assemblage diversity and abundance, (2) describe their horizontal distribution patterns and assess their consistency between 1.5 and 5 m depth and (3) analyze the assemblage variation in relation to the most relevant abiotic biotic variables, including protection regimes.
2. Materials and Methods
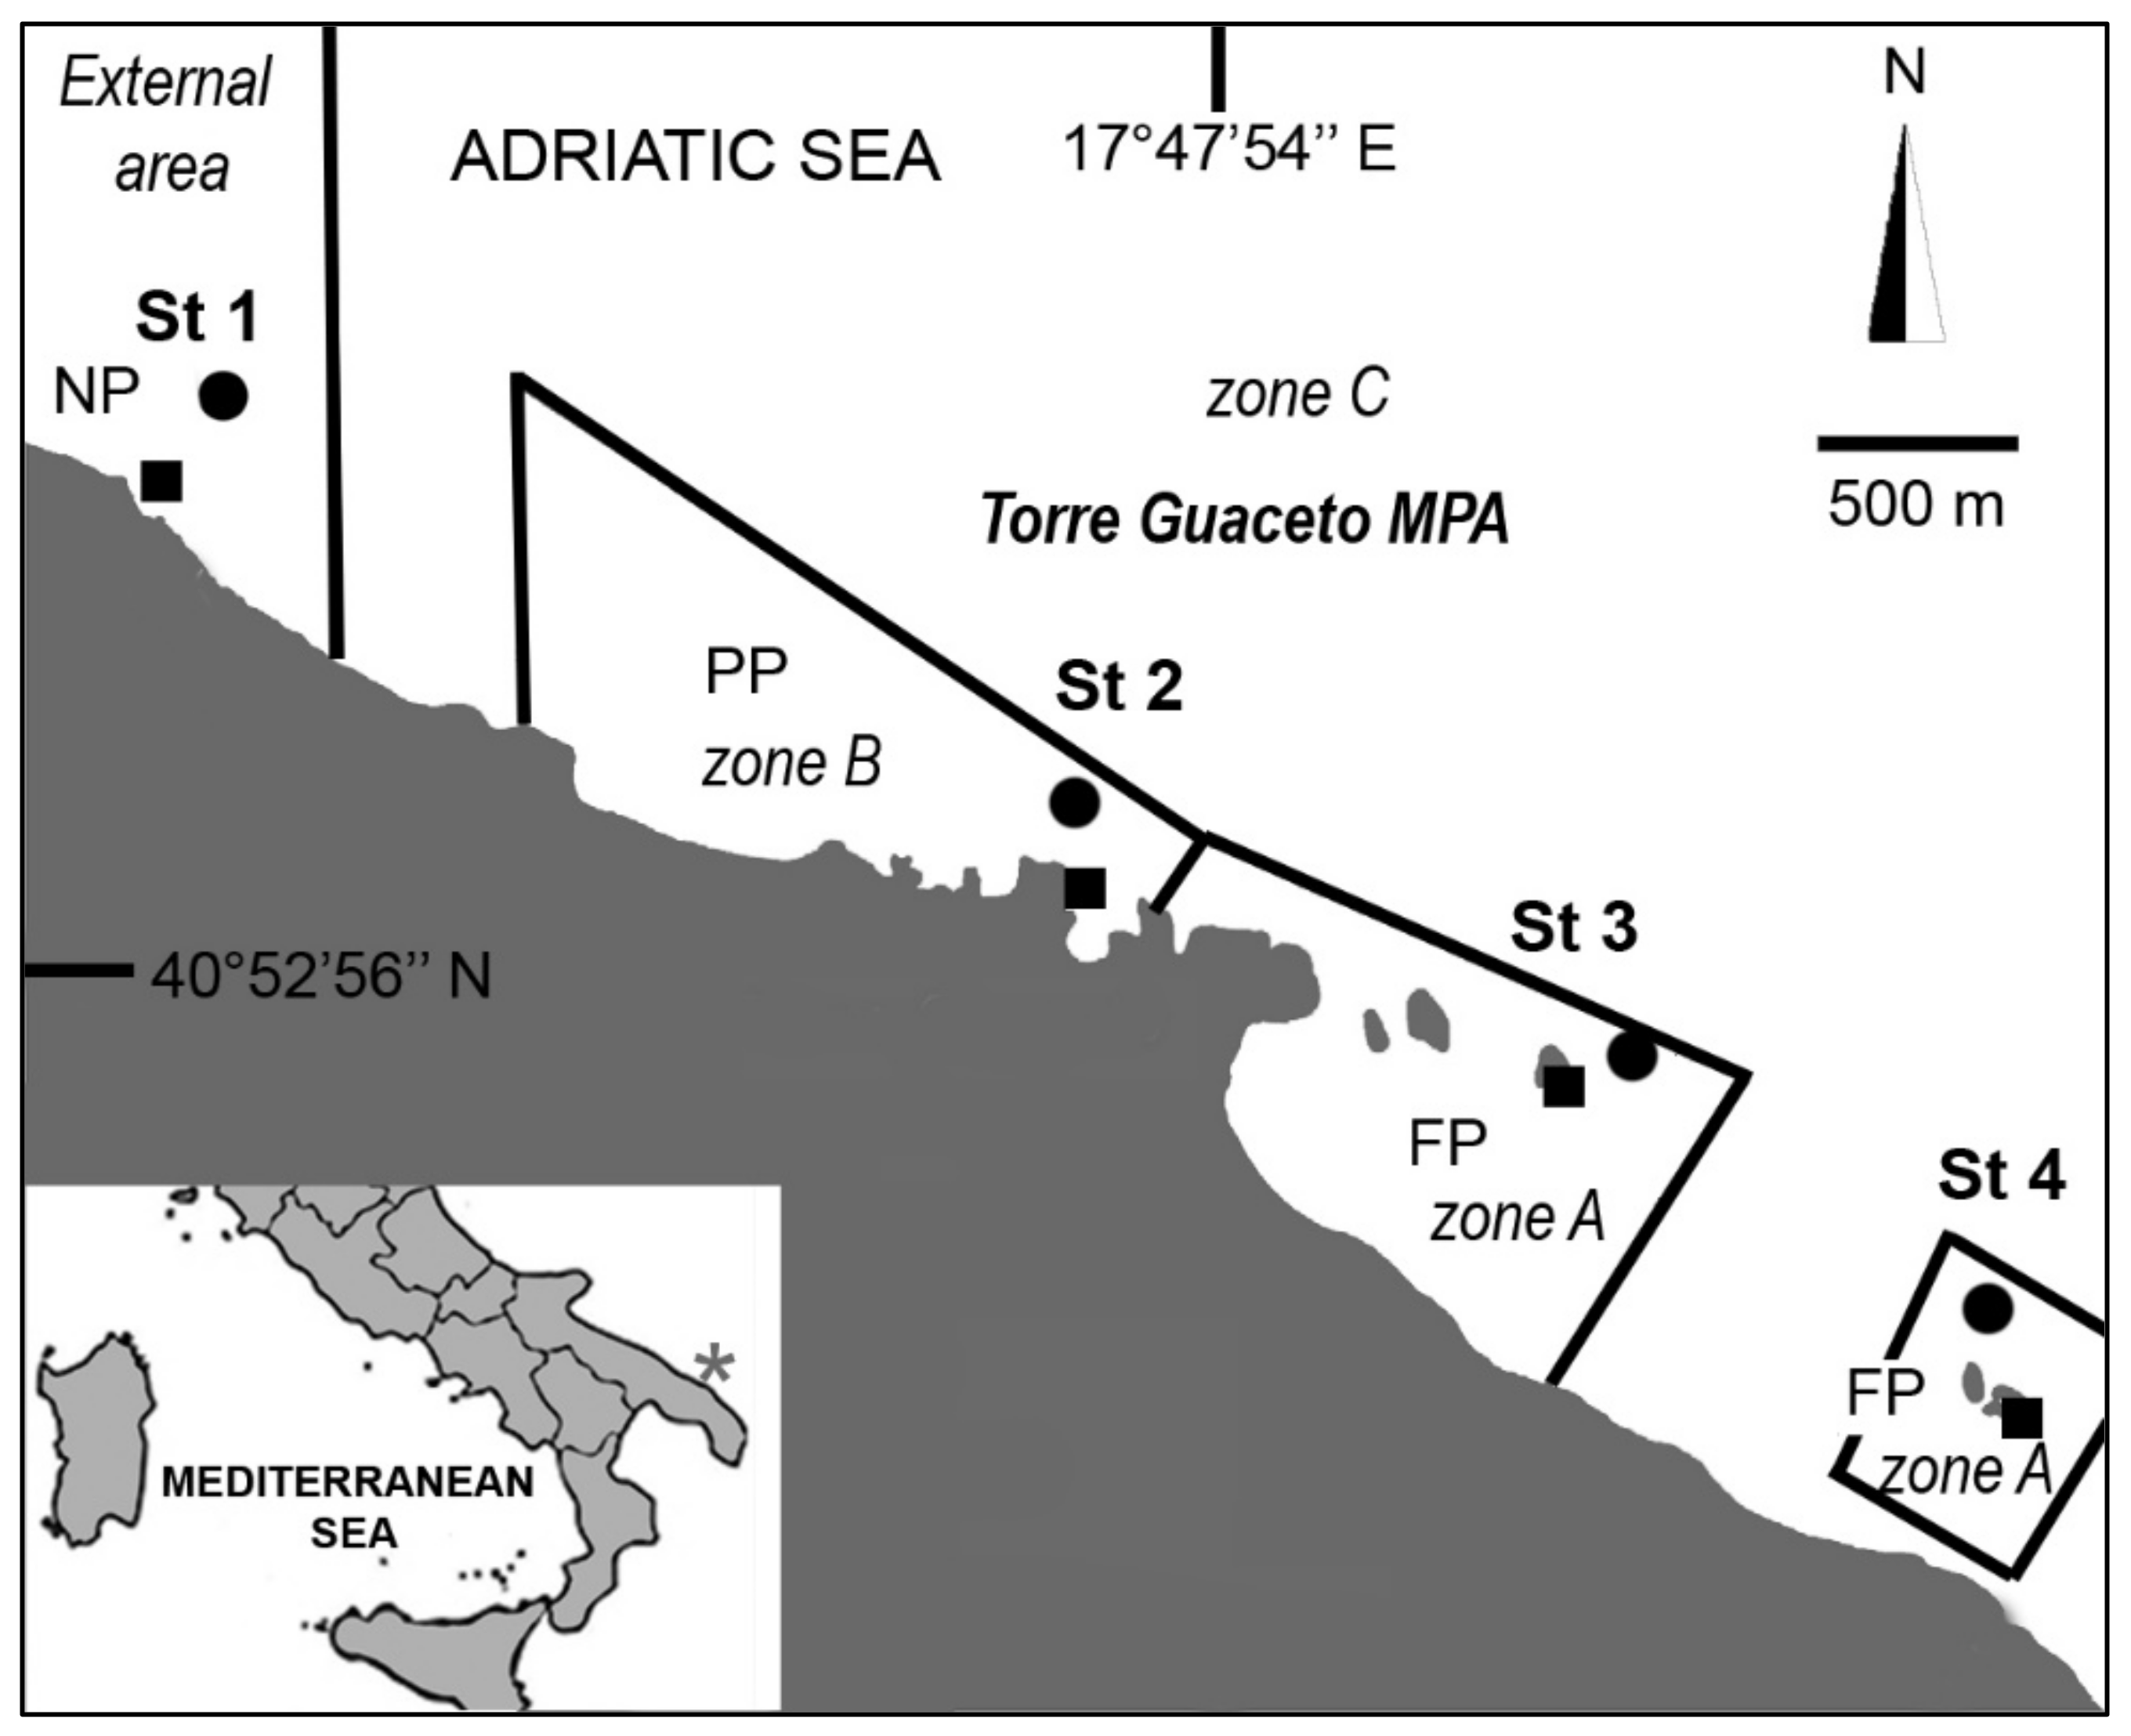
The study area mostly overlaps the Torre Guaceto MPA, corresponding to about 8 km in the Apulian region (South East Italy) (Figure 1), a low-lying coastline including clay cliffs to the south, a rocky shore in the central part and sandy beaches to the north that alternate with rocky coves and rocky plateaus further north. Rocky islets also occur in the central and southern parts. The rocky plateau shows a gentle to medium slope until 10 m depth (Figure 1). Very shallow algal assemblages are dominated by turf species (both fleshy and calcareous), with sparse canopy algae (Cystoseira spp.). Moving deeper, Acetabularia acetabulum (Linnaeus) P.C.Silva, 1952, Halimeda tuna (J.Ellis & Solander) J.V.Lamouroux, 1816, Padina pavonica (Linnaeus) Thivy, 1960, Dictyotales and Amphiroa rigida J.V.Lamouroux, 1816, become dominant. Barren areas dominated by calcareous algae, and the sponge Chondrilla nucula Schmidt, 1862, occur sporadically [2]. Following the Italian legislation, the MPA is formally divided into three zones with different levels of effective and well-implemented protection [28], that partly corresponds to the international subdivision of MPAs into ‘no-take zone’ (i.e., our A zone) and ‘buffer zone’ (i.e., our B and C zones). During our sampling campaign, the entire MPA was a no-take zone: human activities, apart from scientific research, were banned from the A zone (hereafter indicated as fully protected, FP), and recreational activities were allowed in the B and C zones (hereafter indicated as partially protected, PP) [2]. The area outside the MPA was non-protected (NP).
In August 2006, four sampling stations were randomly selected 1000 to 2500 m apart following the 5 m isobath (Figure 1). At each station, two sites at 1.5 and 5 m were sampled by SCUBA diving, scraping off 10 × 10 cm squares on hard, vertical rocky substrates, and 100 cm2 samples were used aiming at minimizing destructive sampling impacts [2]. At each site, three replicates (1 m apart from each other) were collected using a hammer and specially designed box-chisel [2], deposited into plastic bags and fixed with a 10% formalin seawater solution. Temperature and salinity were also measured.
In the laboratory, the samples were sieved trough 0.5 mm mesh and transferred to 70% ethanol. An indirect measure of the sedimentation regime at each site was estimated as the volume of sieved material using 100 mL graduated glass cylinders.
Sorting and counting of macrofauna were performed under a stereomicroscope. The habitat former taxa (algae and sponges), hereafter named structuring macrobenthos, were identified at the lowest taxonomic level possible and weighted after drying at 60 °C for 48 h (Appendix A, Table A1). Sabellida were identified at the lowest taxonomic level possible, while the other macrofauna was identified at higher taxonomic levels (Appendix A, Table A2).
The experimental design consisted of two orthogonal factors: “station” (St, four levels, random) and “depth” (De, two levels, fixed) for the analysis of the vertical and the horizontal patterns of Sabellida distribution.
Differences in abundance (as number of individuals per sample) and species richness were assessed by two-way analysis of variance (ANOVA), while differences in the structure of multivariate assemblages were tested by permutational multivariate analysis of variance (PERMANOVA) [29]. Bray–Curtis similarity matrices based on the original, non-transformed data matrices were used for testing differences in abundance, species richness and patterns of assemblage distribution. The Jaccard similarity matrix was used for testing differences in species presence/absence. Each term in the analyses was tested using 9999 random permutations of the appropriate units. When the number of possible permutations resulted low, significance was obtained by Monte Carlo sampling [29]. The SIMPER (similarity percentage) routine was performed to detect the species responsible for differences among stations and depths [29].
The distance-based multivariate analysis for a linear model procedure (DISTLM) [29] was used to identify potential drivers of variation in the assemblages, and covariates included temperature, salinity, depth, sediment volume, level of protection (as calculated by Musco [2]), dry weight of each structuring macrobenthic taxon (cut-off 5‰ of the total dry weight) and the abundance of other macrofaunal taxa (cut-off 5‰ of the total abundance). The analysis was based on Bray–Curtis dissimilarity, with a forward selection of the predictor variables in a linear regression model with tests by permutation (9999). Results of the forward selection procedure with the sequential tests (i.e., fitting each variable one at a time, conditional on the variables that are already included in the model) were reported. Analyses were performed using PRIMER v6 including the add-on package PERMANOVA+ [29].
3. Results
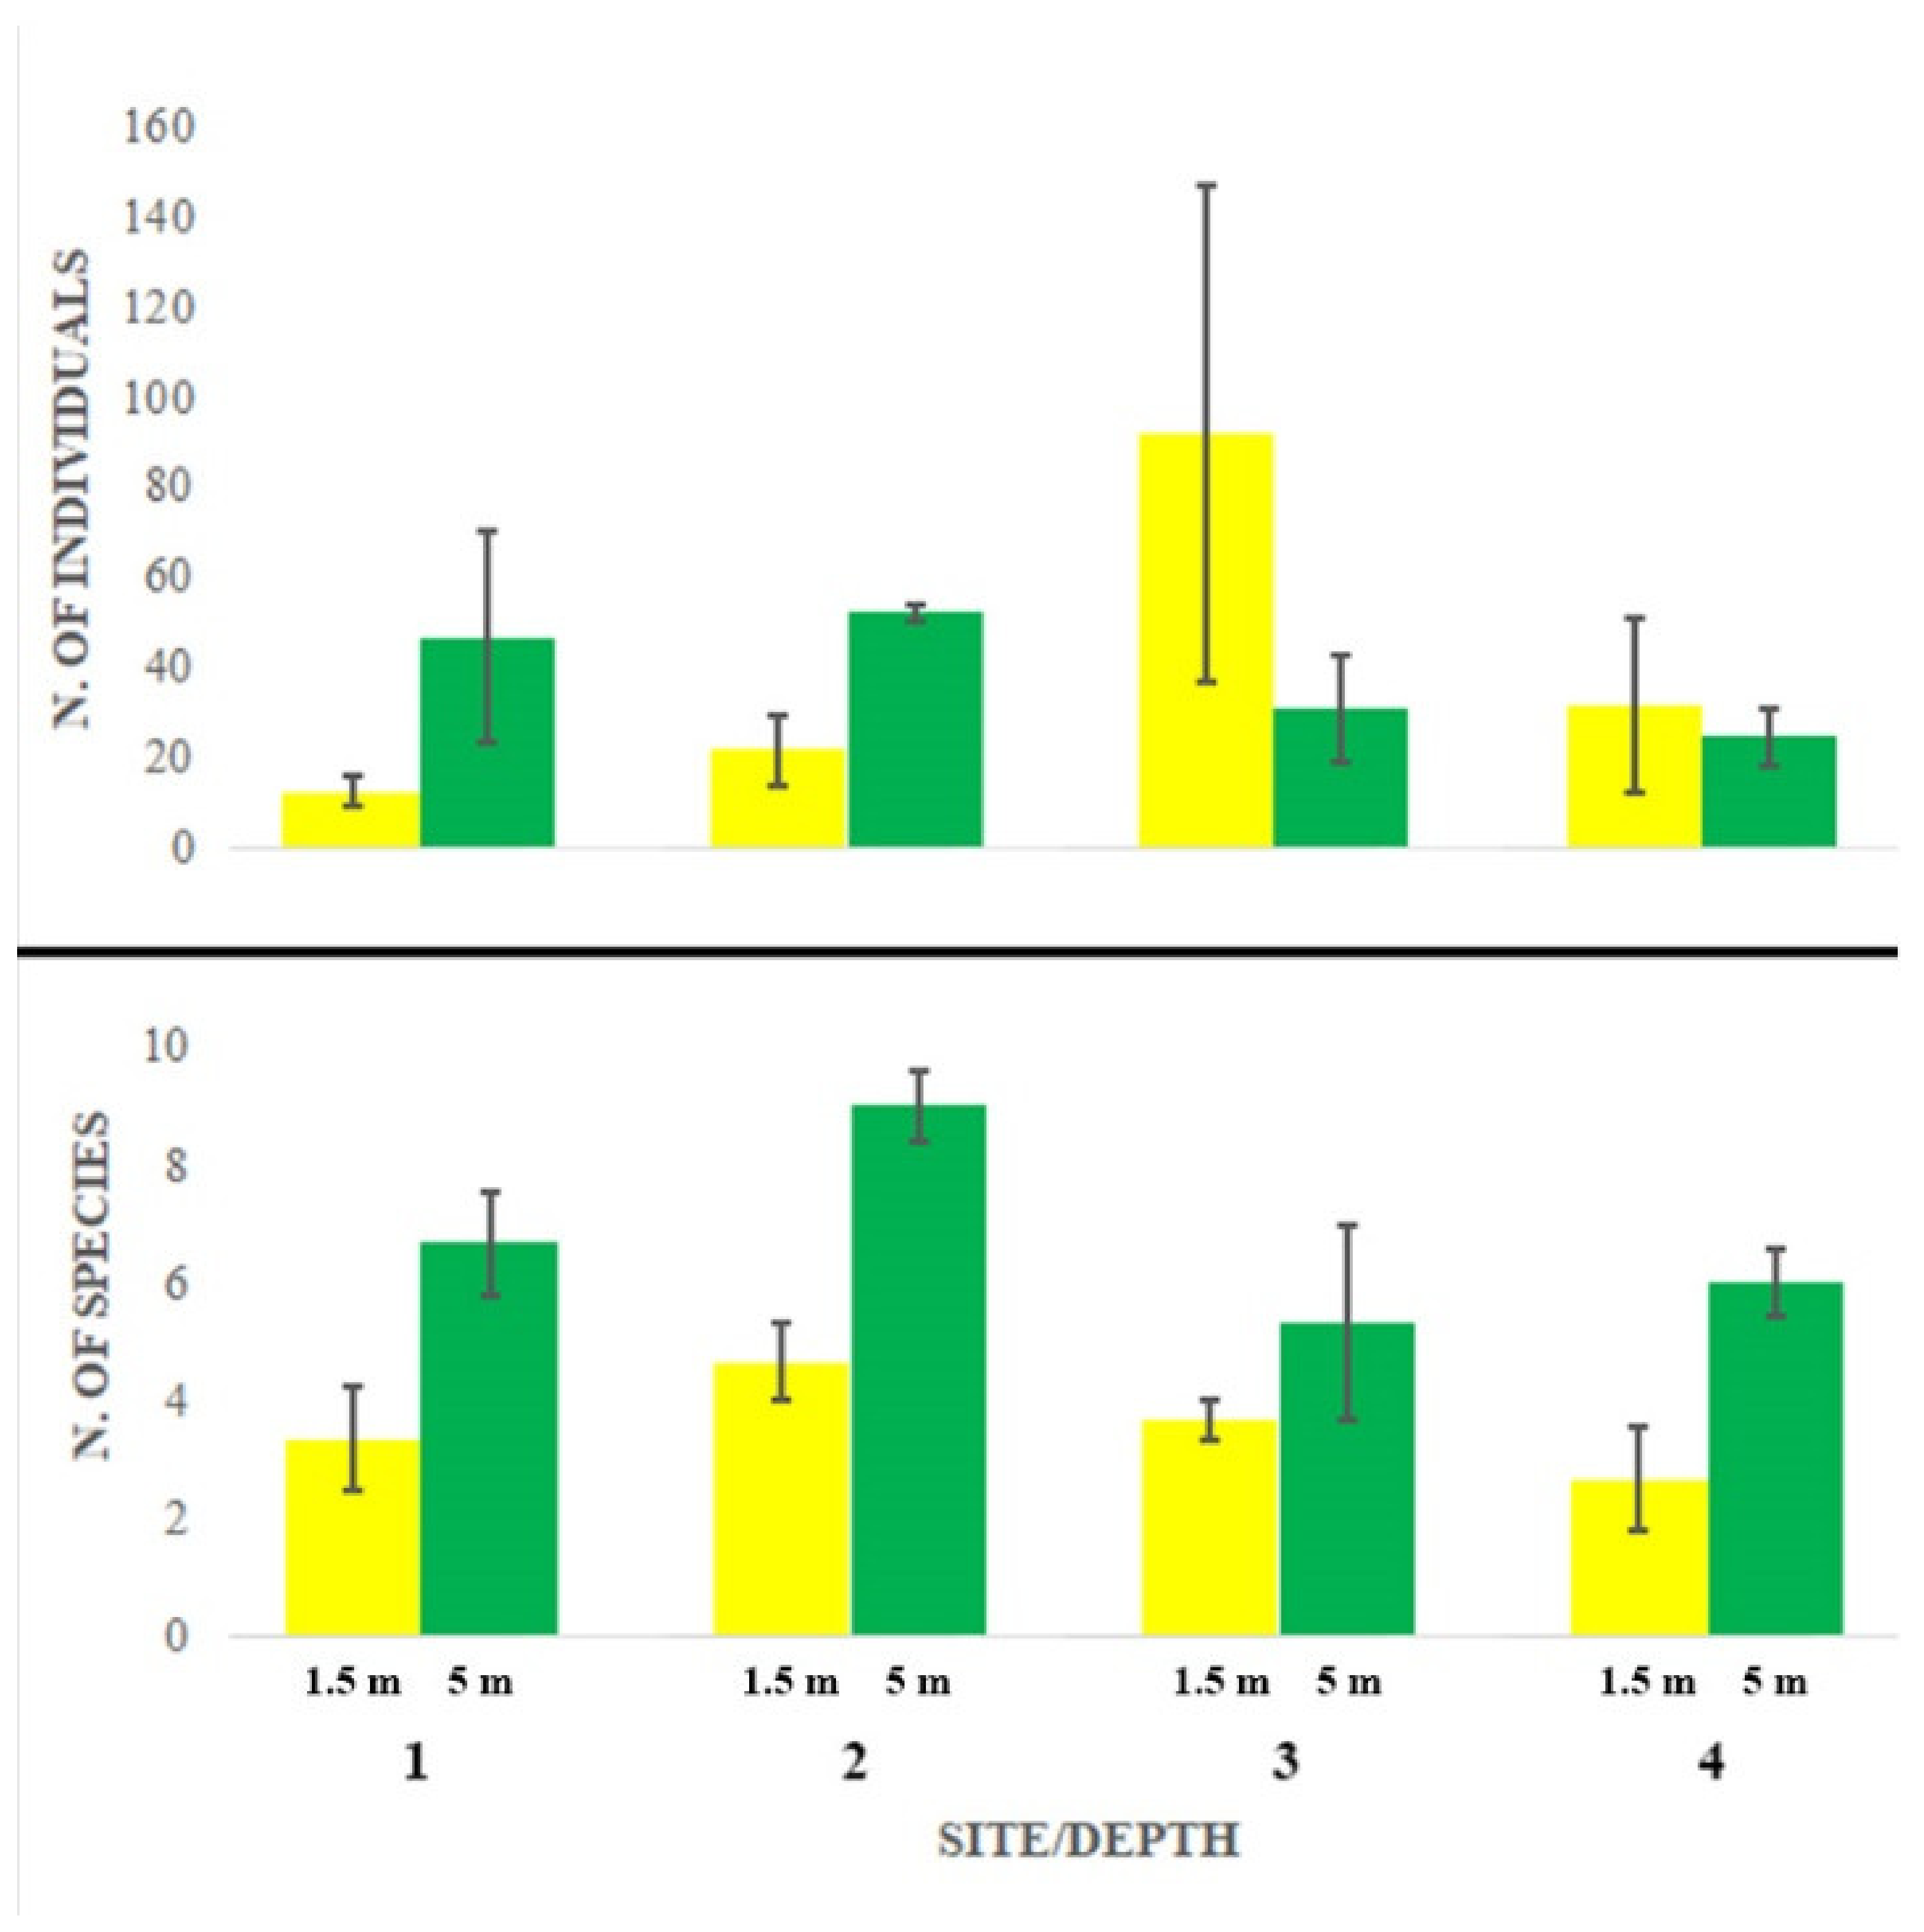
As regards Sabellida, we collected 932 individuals from 23 taxa (Table 1). Amphiglena spp. was the most abundant taxon everywhere, especially at station 3, followed by an undetermined species of Hydroides (Hydroides ind.), Hydroides pseudouncinata Zibrowius, 1968, Pseudopotamilla saxicava (Quatrefages, 1866), Amphicorina eimeri (Langerhans, 1880) (only at station 4 and especially at 1.5 m depth), Amphicorina armandi (Claparède, 1864) and Janua heterostropha (Montagu, 1803) (only present in station 1 at 5 m depth). Most remaining species were represented by few individuals scattered within the sampled area.
Abundance largely varied among sites and depths without showing any significant pattern (Figure 2, Table 2a). Station 3 at 1.5 m depth showed the maximum abundance and the largest variation, while species richness appeared consistently and significantly higher at 5 m depth at all stations, particularly at station 2 (Figure 2, Table 2b).
There were no significant differences in assemblages’ distribution patterns neither along shore nor between depths (Table 3a). Considering species presence/absence, there were significant differences in faunal composition among stations but no difference between the two depths (Table 3b).
The SIMPER analysis based on species presence/absence revealed higher dissimilarity at small scale (i.e., among replicates of each site), rather than among stations. In fact, few species contributed to between-station dissimilarity being absent in one of the two (Table 4). Station 4 showed the highest dissimilarity with the other three stations, especially with station 3, while stations 1 and 2 resulted the most similar (Table 4).
Only six predictor variables significantly explained the observed distribution pattern (Table 5). Among them, sample sediment explained ca. 10% of the observed variation, while the other predicting variables were the abundances of other macrofaunal groups (Syllidae, Sabellariidae, Cirripedia and Tanaidacea) and that of H. tuna. Altogether, they explained ca. 55% of the observed variation.
4. Discussion
The analysis of the distribution of Sabellida in the Torre Guaceto MPA revealed high diversity and abundance. Contrary to the surrounding areas, the MPA has been protected from anthropogenic impacts, including overfishing, harvesting and mass tourism [28]. In particular, there is no date mussel (Lithophaga lithophaga (Linnaeus, 1758)) harvesting, which is known to dramatically impact the Apulian benthic assemblages, leading to a permanent barren state in local rocky shores [30]. Protection regimes explained part of the alongshore variation in assemblage structure of Syllidae, albeit it was mostly related to depth, but also to the distribution of other macrofaunal taxa and, to a lesser extent, to the abundance of habitat-forming algae [2]. Contrary to the Syllidae, the alongshore and bathymetric distribution of Sabellida assemblages resulted homogeneous, being driven by the abundance of the dominant taxa (e.g., Amphiglena spp.). In fact, no differences in the abundance were detected, whilst species richness significantly varied among stations and between depths, being consistently higher at 5 m depth. This suggests that the harsher environmental conditions typical of shallower waters select few resistant and dominant species of Sabellida, as already observed for other polychaetes [2,22,23,24,25]. Moreover, the faunal composition of the assemblages varied mostly at the small scale (i.e., among replicates at each station) rather than among stations, since only few species contributed to the between-station dissimilarity being present in only one. The highest dissimilarity was observed between stations 1 and 4, which also showed the most marked difference in protection regime. The observed differences in the distribution pattern of Sabellida, however, were not related to the protection regime, contrary to the Syllidae [2], but, partly, to the sediment contents (i.e., a proxy of the trophic status of the area). The abundance of H. tuna also played a significant predicting role, likely as habitat and typical basibiont for serpulids and spirorbids. The largest part of the observed variation, however, appeared related to the abundance of other macrobenthic taxa, particularly Syllidae. As previously postulated [2], this relationship may partly be explained by predator/prey interactions, since some Syllidae species are able to prey upon small sabellids [2,31], albeit it is more likely due to an unchecked driver of change similarly influencing the distribution of these two taxa. On the other hand, the relation with sabellariids and barnacles might depend on shared trophic requirements, as all of them are suspensivors, while that with tanaids needs further investigation.
Sabellida was revealed to be less sensitive than other polychaete taxa, such as Syllidae, in depicting alongshore and bathymetric environmental variation, and changes in protection regimes [2,32,33]. Hard-bottom polychaete assemblages are considered environmental indicators in biomonitoring [27], since changes along environmental gradients determine variation of faunal composition, diversity and abundance [1,2,7,18,19,20,21,22,23,24,25,34]. Our results suggest that this may not apply to Sabellida when analyzed apart, probably due to their low diversity compared to other polychaete taxa, such as the Syllidae [18,19,20,25,27,32,34]. However, the actual species richness of Sabellida could have been underestimated. For instance, the most abundant taxon, Amphiglena spp., may include several species, possibly having different ecological requirements [35]. Unfortunately, our specimens, initially identified as Amphiglena mediterranea (Leydig, 1851), were not properly preserved, thus preventing re-examination in light of the most recent extensive review of the Mediterranean Amphiglena describing several new species previously misidentified as A. mediterranea [35]. Further studies are needed to exhaustively assess the actual diversity of Sabellida and, consequently, to better understand their ecology.
Author Contributions
Conceptualization, L.M.; methodology, L.M.; formal analysis, L.M., M.L. and A.G.; investigation, L.M., M.L. and A.G.; data curation, L.M.; writing—original draft preparation, L.M. and A.G.; writing—review and editing, L.M., M.L. and A.G.; project administration, L.M. All authors have read and agreed to the published version of the manuscript.
Funding
This research received no external funding.
Institutional Review Board Statement
Not applicable.
Informed Consent Statement
Not applicable.
Data Availability Statement
All data and data analyses are available by contacting the corresponding author.
Conflicts of Interest
The authors declare no conflict of interest.
Appendix A

Table A1.
Abundance (dry weight in grams) of structuring macrobenthos taxa collected at Torre Guaceto MPA.
Table A1.
Abundance (dry weight in grams) of structuring macrobenthos taxa collected at Torre Guaceto MPA.
| Station 1 | Station 2 | Station 3 | Station 4 | Total | |||||
|---|---|---|---|---|---|---|---|---|---|
| 1.5 m | 5 m | 1.5 m | 5 m | 1.5 m | 5 m | 1.5 m | 5 m | ||
| Rhodophyta | |||||||||
| Amphiroa sp. | 38.245 | - | 22.831 | - | 38.41 | - | 9.209 | - | 108.695 |
| Peysonnelia sp. | - | 2.388 | - | 4.707 | 0.535 | 3.752 | - | 0.484 | 11.866 |
| Pseudolithophyllum sp. | 0.241 | - | 1.989 | 1.475 | 0.638 | - | - | 0.337 | 4.68 |
| Laurencia obtusa (Hudson) J.V.Lamouroux | - | - | - | - | - | - | 2.485 | - | 2.485 |
| Lithophyllum sp. | - | - | 2.409 | - | - | - | - | - | 2.409 |
| Chlorophyta | |||||||||
| Halimeda tuna (J.Ellis & Solander) J.V.Lamouroux, 1816 | 2.259 | 5.307 | 10.775 | 4.469 | 1.261 | 2.71 | 3.901 | 6.24 | 36.922 |
| Udotea petiolata (Turra) Børgesen 1925 | - | 0.471 | - | 0.994 | 0.055 | 1.47 | - | 1.209 | 4.199 |
| Ochrophyta | |||||||||
| Dictyota dichotoma (Hudson) J.V.Lamouroux | 0.069 | 0.469 | 0.656 | 0.382 | 0.081 | 0.986 | 0.029 | - | 2.672 |
| Porifera | |||||||||
| Sarcotragus sp. | - | 1.365 | 0.115 | 1.932 | 0.03 | 10.238 | - | 2.492 | 16.172 |
| Chondrilla nucula Schmidt, 1862 | - | - | 0.318 | 0.341 | - | - | 1.978 | 2.637 | |
| Petrosia sp. | - | - | - | 1.078 | - | - | - | - | 1.078 |
Table A2.
Abundance (number of individuals) of macrobenthic taxa other than Sabellida collected at Torre Guaceto MPA.
Table A2.
Abundance (number of individuals) of macrobenthic taxa other than Sabellida collected at Torre Guaceto MPA.
| Station 1 | Station 2 | Station 3 | Station 4 | Total | |||||
|---|---|---|---|---|---|---|---|---|---|
| 1.5 m | 5 m | 1.5 m | 5 m | 1.5 m | 5 m | 1.5 m | 5 m | ||
| Annelida | |||||||||
| Syllidae | 95 | 254 | 113 | 222 | 265 | 144 | 89 | 90 | 1272 |
| Cirratulidae | 31 | 4 | 17 | 4 | 191 | 10 | 22 | 10 | 289 |
| Nereididae | 84 | 58 | 13 | 15 | 57 | 13 | 10 | 11 | 261 |
| Eunicidae | 20 | 35 | 20 | 42 | 53 | 35 | 6 | 19 | 230 |
| Lumbrineridae | 25 | 9 | 20 | 26 | 43 | 10 | 8 | 9 | 150 |
| Ophelidae | 8 | 14 | 24 | 24 | 20 | 29 | 6 | 19 | 144 |
| Sipunculidae | 4 | 7 | - | 35 | 61 | 15 | - | 9 | 131 |
| Terebellidae | 9 | 16 | 17 | 29 | 17 | 14 | 13 | 16 | 131 |
| Sabellariidae | 8 | 18 | 7 | 19 | 12 | 4 | 2 | 10 | 80 |
| Capitellidae | 3 | 5 | 2 | 8 | 8 | 15 | 8 | 7 | 56 |
| Spionidae | - | 10 | 2 | 17 | 6 | 8 | 5 | 1 | 49 |
| Hesionidae | - | 2 | - | 7 | 2 | 20 | 2 | 9 | 42 |
| Mollusca | |||||||||
| Gastropoda (Prosobranchia) | 23 | 82 | 75 | 80 | 62 | 49 | 63 | 67 | 501 |
| Bivalvia | 237 | 62 | 49 | 40 | 42 | 42 | 15 | 11 | 498 |
| Polyplacophora | 41 | 15 | 71 | 5 | 70 | - | 27 | 1 | 230 |
| Gastropoda (Vermicularidae) | 36 | - | 40 | - | 13 | - | - | - | 89 |
| Arthropoda | |||||||||
| Amphipoda | 369 | 127 | 364 | 180 | 592 | 192 | 281 | 108 | 2213 |
| Tanaidacea | 30 | 40 | 174 | 29 | 178 | 54 | 121 | 19 | 645 |
| Isopoda | 72 | 17 | 79 | 5 | 77 | 26 | 23 | 3 | 302 |
| Decapoda | 29 | 9 | 10 | 13 | 20 | 19 | 3 | 11 | 114 |
| Insecta (Diptera, Chironomidae) | 6 | - | 25 | - | 62 | - | - | - | 93 |
| Cirripedia | 22 | 33 | 15 | - | 1 | 3 | - | - | 74 |
| Nematoda | 36 | 48 | 77 | 91 | 377 | 47 | 63 | 48 | 787 |
| Nemertea | - | - | 29 | - | 15 | - | 4 | - | 48 |
References
- Capa, M.; Kupriyanova, E.; Nogueira, J.M.D.M.; Bick, A.; Tovar-Hernández, M.A. Fanworms: Yesterday, Today and Tomorrow. Diversity 2021, 13, 130. [Google Scholar] [CrossRef]
- Musco, L. Ecology and diversity of Mediterranean hard bottom Syllidae (Annelida): A community-level approach. Mar. Ecol. Prog. Ser. 2012, 461, 107–119. [Google Scholar] [CrossRef] [Green Version]
- Giangrande, A.; Pierri, C.; Arduini, D.; Borghese, J.; Licciano, M.; Trani, R.; Corriero, G.; Basile, G.; Cecere, E.; Petrocelli, A. An innovative IMTA System: Polychaetes, sponges and macroalgae co-cultured in a southern Italian in-shore mariculture plant (Ionian Sea). J. Mar. Sci. Eng. 2020, 8, 733. [Google Scholar] [CrossRef]
- Ingrosso, G.; Abbiati, M.; Badalamenti, F.; Bavestrello, G.; Belmonte, G.; Cannas, R.; Benedetti-Cecchi, L.; Bertolino, M.; Bevilacqua, S.; Bianchi, C.N.; et al. Mediterranean Bioconstructions Along the Italian Coast. Adv. Mar. Biol. 2018, 79, 61–136. [Google Scholar]
- Tovar-Hernández, M.A.; Yáñez-Rivera, B.; Giangrande, A.; Gambi, M.C. Notes on the species of Perkinsiana (Polychaeta: Sabellidae) from Antarctica with the description of P. brigittae sp. nov. Zootaxa 2012, 3485, 56–68. [Google Scholar] [CrossRef]
- Capa, M.; Nishi, E.; Tanaka, K.; Fujikura, K. First record of a Bispira species (Sabellidae: Polychaeta) from a hydrothermal vent. Mar. Biodivers. Rec. 2013, 6, e68. [Google Scholar] [CrossRef]
- Gambi, M.C.; Musco, L.; Giangrande, A.; Badalamenti, F.; Micheli, F.; Kroeker, K.J. Distribution and functional traits of polychaetes in a CO2 vent system: Winners and losers among closely related species. Mar. Ecol. Prog. Ser. 2016, 550, 121–134. [Google Scholar] [CrossRef] [Green Version]
- Stabili, L.; Licciano, M.; Giangrande, A.; Fanelli, G.; Cavallo, R.A. Sabella spallanzanii filter-feeding on bacterial community: Ecological implications and applications. Mar. Environ. Res. 2006, 61, 74–92. [Google Scholar] [CrossRef] [PubMed]
- Stabili, L.; Schirosi, R.; Licciano, M.; Giangrande, A. The mucus of Sabella spallanzanii (Annelida, Polychaeta): Its involvement in chemical defence and fertilization success. J. Exp. Mar. Biol. Ecol. 2009, 374, 144–149. [Google Scholar] [CrossRef]
- Licciano, M.; Stabili, L.; Giangrande, A. Clearance rates of Sabella spallanzanii and Branchiomma luctuosum (Annelida: Polychaeta) on a pure culture of Vibrio alginolyticus. Water Res. 2005, 39, 4375–4384. [Google Scholar] [CrossRef]
- Licciano, M.; Stabili, L.; Giangrande, A.; Cavallo, R.A. Bacterial accumulation by Branchiomma luctuosum (Annelida: Polychaeta): A tool for biomonitoring marine systems and restoring polluted waters. Mar. Environ. Res. 2007, 63, 291–302. [Google Scholar] [CrossRef] [PubMed] [Green Version]
- Tovar-Hernández, M.A.; Méndez, N.; Villalobos-Guerrero, T.F. Fouling polychaete worms from the Southern Gulf of California: Sabellidae and Serpulidae. Syst. Biodivers. 2009, 7, 319–336. [Google Scholar] [CrossRef]
- Clapin, G.; Evans, D.R. The Status of the Introduced Marine Fan Worm, Sabella spallanzanii, in Western Australia: A Preliminary Investigation; Technical report N. 2; CSIRO Division of Fisheries, Centre for Research into Marine Species: Clayton, Australia, 1995. [Google Scholar]
- Patti, F.; Gambi, M. Phylogeography of the invasive polychaete Sabella spallanzanii (Sabellidae) based on the nucleotide sequence of internal transcribed spacer 2 (ITS2) of nuclear rDNA. Mar. Ecol. Prog. Ser. 2001, 215, 169–177. [Google Scholar] [CrossRef] [Green Version]
- Read, G.; Inglis, G.; Stratford, P.; Ahyong, S. Arrival of the alien fanworm Sabella spallanzanii (Gmelin, 1791) (Polychaeta: Sabellidae) in two New Zealand harbours. Aquat. Invasions 2011, 6, 273–279. [Google Scholar] [CrossRef]
- Cochrane, S.J. Snowflakes and feather-dusters—Some challenges for soft-bottom fanworm systematics. Hydrobiologia 2003, 496, 49–62. [Google Scholar] [CrossRef]
- Fraschetti, S.; Giangrande, A.; Terlizzi, A.; Della Tommasa, L.; Miglietta, M.P.; Boero, F. Spatio-temporal variation of hydroids and polychaetes associated to Cystoseira amentacea (Fucales, Phaeophyceae): A regional scale approach. Mar. Biol. 2002, 140, 949–957. [Google Scholar]
- Giangrande, A.; Delos, A.L.; Fraschetti, S.; Musco, L.; Licciano, M.; Terlizzi, A. Polychaete assemblages along a rocky shore on the South Adriatic coast (Mediterranean Sea): Patterns of spatial distribution. Mar. Biol. 2003, 143, 1109–1116. [Google Scholar] [CrossRef]
- Giangrande, A.; Delos, A.L.; Musco, L.; Licciano, M.; Pierri, C. Polychaete assemblages of rocky shore along the South Adriatic coast (Mediterranean Sea). Cah. Biol. Mar. 2004, 45, 85–95. [Google Scholar]
- Musco, L.; Terlizzi, A.; Licciano, M.; Giangrande, A. Taxonomic structure and the effectiveness of surrogates in environmental monitoring: A lesson from polychaetes. Mar. Ecol. Prog. Ser. 2009, 383, 199–210. [Google Scholar] [CrossRef] [Green Version]
- Dorgham, M.M.; Hamdy, R.; El-Rashidy, H.H.; Atta, M.M.; Musco, L. Distribution patterns of shallow water polychaetes (Annelida) along the coast of Alexandria, Egypt (eastern Mediterranean). Mediterr. Mar. Sci. 2014, 15, 635–649. [Google Scholar] [CrossRef] [Green Version]
- Fresi, E.; Colognola, R.; Gambi, M.C.; Giangrande, A.; Scardi, M. Ricerche sui popolamenti bentonici di substrato duro del Porto di Ischia. Infralitorale fotofilo: Policheti. Cah. Biol. Mar. 1983, 24, 1–19. [Google Scholar]
- Fresi, E.; Colognola, R.; Gambi, M.C.; Giangrande, A.; Scardi, M. Ricerche sui popolamenti bentonici di substrato duro del Porto di Ischia. Infralitorale fotofilo: Policheti (II). Cah. Biol. Mar. 1984, 25, 33–47. [Google Scholar]
- Giangrande, A. Polychaete zonation and its relation to algal distribution down a vertical cliff in the western Mediterranean (Italy): A structural analysis. J. Exp. Mar. Biol. Ecol. 1988, 120, 263–276. [Google Scholar] [CrossRef]
- Mikac, B.; Licciano, M.; Jaklin, A.; Iveša, L.; Giangrande, A.; Musco, L. Diversity and distribution patterns of hard bottom polychaete assemblages in the North Adriatic Sea (Mediterranean). Diversity 2020, 12, 408. [Google Scholar] [CrossRef]
- Witman, J.D.; Dayton, P.K. Rocky Subtidal Communities. In Marine Community Ecology; Bertness, M.D., Gaines, S.D., Hay, M.E., Eds.; Sinauer Associates: Sunderland, MA, USA, 2001; pp. 339–366. [Google Scholar]
- Giangrande, A.; Licciano, M.; Musco, L. Polychaetes as environmental indicators revisited. Mar. Pollut. Bull. 2005, 50, 1153–1162. [Google Scholar] [CrossRef]
- Guidetti, P. Marine reserves reestablish lost predatory interactions and cause community changes in rocky reefs. Ecol. Appl. 2006, 16, 963–976. [Google Scholar] [CrossRef]
- Anderson, M.J.; Gorley, R.N.; Clarke, K.R. PERMANOVA+ for PRIMER: Guide to Software and Statistical Methods; PRIMER-E: Plymouth, UK, 2008. [Google Scholar]
- Colletti, A.; Savinelli, B.; Di Muzio, G.; Rizzo, L.; Tamburello, L.; Fraschetti, S.; Musco, L.; Danovaro, R. The date mussel Lithophaga lithophaga: Biology, ecology and the multiple impacts of its illegal fishery. Sci. Total Environ. 2020, 744, 140866. [Google Scholar] [CrossRef]
- Lepore, E.; Sciscioli, M.; Mastrodonato, M.; Gherardi, M.; Giangrande, A.; Musco, L. Sperm ultra-structure and spermiogenesis in Syllis krohni (Polychaeta: Syllidae), with some observations on its reproductive biology. Sci. Mar. 2006, 70, 585–592. [Google Scholar]
- Çinar, M.E.; Ergen, Z. Faunistic analysis of Syllidae (Polychaeta: Annelida) from the Aegean Sea. Cah. Biol. Mar. 2002, 43, 171–176. [Google Scholar]
- Serrano, A.; San Martín, G.; López, E. Ecology of Syllidae (Annelida: Polychaeta) from shallow rocky environments in the Cantabrian Sea (South Bay of Biscay). Sci. Mar. 2005, 70, 225–235. [Google Scholar] [CrossRef]
- Çinar, M.E.; Gönlügür-Demirci, G. Polychaete assemblages on shallow-water benthic habitats along the Sinop Peninsula (Black Sea, Turkey). Cah. Biol. Mar. 2005, 4, 253–263. [Google Scholar]
- Giangrande, A.; Putignano, M.; Licciano, M.; Gambi, M.C. The Pandora’s box: Morphological diversity within the genus Amphiglena Claparède, 1864 (Sabellidae, Annelida) in the Mediterranean Sea, with description of nine new species. Zootaxa 2021, 4949, 201–239. [Google Scholar] [CrossRef] [PubMed]
Figure 1.
Marine protected area (MPA) of Torre Guaceto (Italy). MPA’s geographic location indicated with an asterisk on the map, NP = non-protected, (PP) = partially protected, (FP) = fully protected. Squares = sites at 1.5 m depth, circles = sites at 5 m depth.
Figure 1.
Marine protected area (MPA) of Torre Guaceto (Italy). MPA’s geographic location indicated with an asterisk on the map, NP = non-protected, (PP) = partially protected, (FP) = fully protected. Squares = sites at 1.5 m depth, circles = sites at 5 m depth.

Figure 2.
Abundance (number of individuals, mean + SE) and species richness (number of species, mean + SE).
Figure 2.
Abundance (number of individuals, mean + SE) and species richness (number of species, mean + SE).

Table 1.
Abundance of the species of Sabellida collected at Torre Guaceto MPA.
| Taxon | Station 1 | Station 2 | Station 3 | Station 4 | Total | ||||
|---|---|---|---|---|---|---|---|---|---|
| 1.5 m | 5 m | 1.5 m | 5 m | 1.5 m | 5 m | 1.5 m | 5 m | ||
| Sabellidae | |||||||||
| Amphicorina armandi (Claparède, 1864) | - | 2 | - | 5 | - | 3 | 5 | 5 | 20 |
| Amphicorina armandi (Claparède, 1864) | - | - | - | - | - | - | 20 | 1 | 21 |
| Amphiglena spp. | 28 | 54 | 20 | 82 | 224 | 61 | 59 | 50 | 578 |
| Branchiomma bombyx (Dalyell, 1853) | - | - | - | 2 | - | - | - | 1 | 3 |
| Chone collaris Langerhans, 1881 | - | - | - | - | - | 10 | - | 3 | 13 |
| Parasabella saxicola (Grube, 1861) | - | - | - | - | - | 1 | - | - | 1 |
| Parasabella langerhansi (Knight-Jones, 1983) | - | 1 | - | 3 | - | 4 | - | 1 | 9 |
| Parasabella tenuicollaris (Grube, 1861) | 1 | 2 | - | 2 | - | - | - | - | 5 |
| Laonome sp. | - | - | - | - | - | 1 | - | - | 1 |
| Perkinsiana socialis (Langerhans, 1884) | - | - | - | - | - | - | 9 | 2 | 11 |
| Pseudopotamilla saxicava (Quatrefages, 1866) | 1 | - | 1 | 11 | 7 | 7 | - | - | 27 |
| Fabriciidae | |||||||||
| Fabricia sabella (Ehrenberg, 1836) | - | - | - | - | - | 1 | - | - | 1 |
| Novafabricia posidoniae Licciano & Giangrande, 2006 | - | 1 | - | - | 7 | - | 1 | - | 9 |
| Serpulidae | |||||||||
| Hydroides elegans (Haswell, 1883) | - | - | - | - | - | 1 | - | - | 1 |
| Hydroides nigra Zibrowius, 1971 | 2 | 2 | 2 | 3 | - | - | - | - | 9 |
| Hydroides pseudouncinata Zibrowius, 1968 | 3 | 12 | 6 | 9 | 1 | - | - | 2 | 33 |
| Hydroides ind. | - | 38 | 33 | 30 | 35 | 2 | - | 5 | 143 |
| Janua heterostropha (Montagu, 1803) | - | 18 | - | - | - | - | - | - | 18 |
| Serpula concharum Langerhans, 1880 | 1 | 4 | - | - | - | 1 | - | - | 6 |
| Spirobranchus polytrema (Philippi, 1844) | 1 | 3 | - | - | - | - | - | 2 | 6 |
| Vermiliopsis striaticeps (Grube, 1862) | - | 3 | 2 | 4 | 2 | - | - | 1 | 12 |
| Spirorbidae ind. | - | - | - | 5 | - | - | - | - | 5 |
Table 2.
ANOVA testing differences among stations and between depths in abundance (a) and species richness (b). st = station, de = depth, df = degrees of freedom, MS = mean squares, Pseudo-F = statistics, P (perm) = p-values calculated by permutations, P(MC) = p-values calculated by Monte Carlo sampling, U.P. = unique perms, Res = residuals.
| df | MS | Pseudo-F | P(perm) | U.P. | P(MC) | |
|---|---|---|---|---|---|---|
| (a) | ||||||
| st | 3 | 1438.1 | 0.90797 | 0.4929 | 9958 | 0.4519 |
| de | 1 | 4.1667 | 1.4059 × 10⁻³ | 0.9151 | 425 | 0.9734 |
| st × de | 3 | 2963.6 | 1.8711 | 0.1407 | 9953 | 0.1714 |
| Res | 16 | 1583.9 | ||||
| (b) | ||||||
| st | 3 | 7.8889 | 3.3216 | 0.0431 | 9917 | 0.0478 |
| de | 1 | 60.167 | 32.818 | 0.0313 | 113 | 0.0091 |
| st × de | 3 | 1.8333 | 0.77193 | 0.5344 | 9877 | 0.522 |
| Res | 16 | 2.375 | ||||
Table 3.
PERMANOVA testing differences in assemblages’ distribution patterns among stations and between depths. Analyses carried out on the original data matrix (a) and the presence/absence matrix (b) st = station, de = depth, df = degrees of freedom, MS = mean squares, Pseudo-F = statistics, P (perm) = p-values calculated by permutations, P(MC) = p-values calculated by Monte Carlo sampling, U.P. = unique perms, Res = residuals.
| df | MS | Pseudo-F | P(perm) | U.P. | P(MC) | |
|---|---|---|---|---|---|---|
| (a) | ||||||
| st | 3 | 2508.6 | 1.6939 | 0.055 | 9910 | 0.074 |
| de | 1 | 2624.6 | 1.1371 | 0.3891 | 424 | 0.3772 |
| st × de | 3 | 2308.1 | 1.5585 | 0.1099 | 9925 | 0.124 |
| Res | 16 | 1480.9 | ||||
| (b) | ||||||
| st | 3 | 3756.4 | 3.3305 | 0.0001 | 9935 | 0.0011 |
| de | 1 | 4554.7 | 2.4863 | 0.1547 | 425 | 0.1065 |
| st × de | 3 | 1831.9 | 1.6242 | 0.09 | 9947 | 0.1136 |
| Res | 16 | 1127.9 | ||||
Table 4.
SIMPER analysis based on species presence/absence, showing the species mostly contributing to faunal dissimilarity between stations (cut-off 70%). The species absent in one of the compared stations are given in bold. Av.Abund = average abundance, Av. Diss = average dissimilarity, Diss/SD = dissimilarity/standard deviation, Contib% = percentage contribution to dissimilarity, Cum% = cumulative percentage contribution to dissimilarity.
| Stations 1 and 2. Average Dissimilarity = 46.45 | ||||||
| Stat 1 | Stat 2 | |||||
| Species | Av.Abund | Av.Abund | Av.Diss | Diss/SD | Contrib% | Cum.% |
| Vermiliopsis striaticeps | 0.17 | 0.83 | 6.51 | 1.41 | 14.02 | 14.02 |
| Spirobranchus polytrema | 0.50 | 1.00 | 5.30 | 0.91 | 11.41 | 25.43 |
| Pseudopotamilla saxicava | 0.17 | 0.67 | 5.03 | 1.11 | 10.82 | 36.26 |
| Hydroides nigra | 0.50 | 0.67 | 4.78 | 0.91 | 10.29 | 46.55 |
| Hydroides ind. | 0.50 | 0.00 | 4.18 | 0.94 | 8.99 | 55.53 |
| Parasabella langerhansi | 0.17 | 0.50 | 3.84 | 0.97 | 8.26 | 63.80 |
| Parasabella tenuicollaris | 0.33 | 0.33 | 3.75 | 0.84 | 8.07 | 71.87 |
| Stations 1 and 3. Average Dissimilarity = 61.47 | ||||||
| Stat 1 | Stat 3 | |||||
| Species | Av.Abund | Av.Abund | Av.Diss | Diss/SD | Contrib% | Cum.% |
| Hydroides pseudouncinata | 0.83 | 0.17 | 8.49 | 1.28 | 13.82 | 13.82 |
| Spirobranchus polytrema | 0.50 | 0.67 | 6.12 | 0.91 | 9.95 | 23.77 |
| Hydroides ind. | 0.50 | 0.00 | 5.14 | 0.95 | 8.36 | 32.13 |
| Hydroides nigra | 0.50 | 0.00 | 4.68 | 0.94 | 7.61 | 39.74 |
| Serpula concharum | 0.33 | 0.17 | 4.47 | 0.69 | 7.27 | 47.01 |
| Pseudopotamilla saxicava | 0.17 | 0.33 | 4.41 | 0.72 | 7.18 | 54.18 |
| Novafabricia posidoniae | 0.17 | 0.33 | 4.40 | 0.74 | 7.16 | 61.34 |
| Parasabella tenuicollaris | 0.33 | 0.00 | 3.65 | 0.68 | 5.94 | 67.28 |
| Amphicorina armandi | 0.17 | 0.33 | 3.56 | 0.77 | 5.79 | 73.07 |
| Stations 2 and 3. Average Dissimilarity = 55.57 | ||||||
| Stat 2 | Stat 3 | |||||
| Species | Av.Abund | Av.Abund | Av.Diss | Diss/SD | Contrib% | Cum.% |
| Hydroides pseudouncinata | 1.00 | 0.17 | 7.93 | 1.75 | 14.28 | 14.28 |
| Vermiliopsis striaticeps | 0.83 | 0.17 | 6.48 | 1.38 | 11.67 | 25.94 |
| Hydroides nigra | 0.67 | 0.00 | 6.23 | 1.25 | 11.21 | 37.15 |
| Pseudopotamilla saxicava | 0.67 | 0.33 | 4.97 | 1.05 | 8.95 | 46.10 |
| Parasabella langerhansi | 0.50 | 0.33 | 4.18 | 0.98 | 7.53 | 53.63 |
| Amphicorina armandi | 0.33 | 0.33 | 3.56 | 0.87 | 6.41 | 60.04 |
| Spirobranchus polytrema | 1.00 | 0.67 | 3.28 | 0.64 | 5.90 | 65.93 |
| Novafabricia posidoniae | 0.00 | 0.33 | 3.23 | 0.67 | 5.82 | 71.75 |
| Stations 1 and 4. Average Dissimilarity = 62.07 | ||||||
| Stat 1 | Stat 4 | |||||
| Species | Av.Abund | Av.Abund | Av.Diss | Diss/SD | Contrib% | Cum.% |
| Hydroides pseudouncinata | 0.83 | 0.33 | 8.02 | 0.98 | 12.92 | 12.92 |
| Perkinsiana socialis | 0.00 | 0.67 | 7.21 | 1.23 | 11.62 | 24.54 |
| Hydroides ind. | 0.50 | 0.50 | 5.54 | 0.95 | 8.92 | 33.46 |
| Spirobranchus politrema | 0.50 | 0.17 | 5.39 | 0.93 | 8.69 | 42.14 |
| Amphicorina armandi | 0.17 | 0.50 | 5.39 | 0.91 | 8.68 | 50.83 |
| Hydroides nigra | 0.50 | 0.00 | 4.79 | 0.93 | 7.72 | 58.55 |
| Parasabella tenuicollaris | 0.33 | 0.00 | 3.76 | 0.67 | 6.06 | 64.61 |
| Amphicorina eimeri | 0.00 | 0.33 | 3.39 | 0.66 | 5.47 | 70.07 |
| Stations 2 and 4. Average Dissimilarity = 60.34 | ||||||
| Stat 2 | Stat 4 | |||||
| Species | Av.Abund | Av.Abund | Av.Diss | Diss/SD | Contrib% | Cum.% |
| Hydroides pseudouncinata | 1.00 | 0.33 | 7.00 | 1.19 | 11.61 | 11.61 |
| Vermiliopsis striaticeps | 0.83 | 0.17 | 6.89 | 1.36 | 11.42 | 23.02 |
| Hydroides nigra | 0.67 | 0.00 | 6.40 | 1.21 | 10.60 | 33.62 |
| Perkinsiana socialis | 0.00 | 0.67 | 6.00 | 1.27 | 9.95 | 43.57 |
| Hydroides ind. | 1.00 | 0.50 | 5.76 | 0.90 | 9.55 | 53.12 |
| Pseudopotamilla saxicava | 0.67 | 0.00 | 5.54 | 1.30 | 9.18 | 62.30 |
| Amphicorina armandi | 0.33 | 0.50 | 4.57 | 0.93 | 7.57 | 69.87 |
| Parasabella langerhansi | 0.50 | 0.17 | 4.13 | 0.95 | 6.84 | 76.72 |
| Stations 3 and 4. Average Dissimilarity = 60.09 | ||||||
| Stat 3 | Stat 4 | |||||
| Species | Av.Abund | Av.Abund | Av.Diss | Diss/SD | Contrib% | Cum.% |
| Perkinsiana socialis | 0.00 | 0.67 | 7.55 | 1.25 | 12.57 | 12.57 |
| Spirobranchus polytrema | 0.67 | 0.50 | 6.73 | 0.89 | 11.20 | 23.77 |
| Amphicorina armandi | 0.33 | 0.50 | 5.78 | 0.92 | 9.61 | 33.38 |
| Novafabricia posidoniae | 0.33 | 0.17 | 4.95 | 0.73 | 8.23 | 41.61 |
| Hydroides pseudouncinata | 0.17 | 0.33 | 4.43 | 0.74 | 7.37 | 48.98 |
| Chone collaris | 0.33 | 0.17 | 3.94 | 0.76 | 6.56 | 55.54 |
| Parasabella langerhansi | 0.33 | 0.17 | 3.94 | 0.76 | 6.56 | 62.10 |
| Pseudopotamilla saxicava | 0.33 | 0.00 | 3.66 | 0.65 | 6.09 | 68.19 |
| Amphicorina eimeri | 0.00 | 0.33 | 3.55 | 0.66 | 5.90 | 74.09 |
Table 5.
DISTLM-forward analysis. Only predictor variables significantly related to the assemblages in the sequential test are reported. SS(trace) = Sums of squares, Pseudo-F = statistics, p = significance, Prop = significant proportion of explained variation, Cumul = cumulative proportion of explained variation.
| Variable | SS(Trace) | Pseudo-F | p | Prop. | Cumul. |
|---|---|---|---|---|---|
| Syllidae | 7039.8 | 45.916 | 0.0014 | 0.17267 | 0.17267 |
| sediment | 3718.1 | 26.016 | 0.0269 | 0.091198 | 0.26387 |
| Sabellariidae | 3925.7 | 30.098 | 0.0097 | 0.09629 | 0.36016 |
| Cirripedia | 2657.7 | 21.554 | 0.041 | 0.065189 | 0.42535 |
| Tanaidacea | 2769.0 | 24.125 | 0.0137 | 0.067917 | 0.49327 |
| Halimeda tuna | 2289.1 | 21.183 | 0.0404 | 0.056146 | 0.54941 |
Publisher’s Note: MDPI stays neutral with regard to jurisdictional claims in published maps and institutional affiliations. |
© 2021 by the authors. Licensee MDPI, Basel, Switzerland. This article is an open access article distributed under the terms and conditions of the Creative Commons Attribution (CC BY) license (https://creativecommons.org/licenses/by/4.0/).
Share and Cite
MDPI and ACS Style
Musco, L.; Licciano, M.; Giangrande, A. Diversity and Distribution of Sabellida (Annelida) under Protection Regimes. Water 2021, 13, 1491. https://doi.org/10.3390/w13111491
AMA Style
Musco L, Licciano M, Giangrande A. Diversity and Distribution of Sabellida (Annelida) under Protection Regimes. Water. 2021; 13(11):1491. https://doi.org/10.3390/w13111491
Chicago/Turabian StyleMusco, Luigi, Margherita Licciano, and Adriana Giangrande. 2021. "Diversity and Distribution of Sabellida (Annelida) under Protection Regimes" Water 13, no. 11: 1491. https://doi.org/10.3390/w13111491
Note that from the first issue of 2016, this journal uses article numbers instead of page numbers. See further details here.