
Water Use Efficiencies of Different Maturity Group Soybean Cultivars in the Humid Mississippi Delta
by
Srinivasa R. Pinnamaneni
1, 
Saseendran S. Anapalli
1,*,
Daniel K. Fisher
1 and
Krishna N. Reddy
2 1
USDA-ARS, Sustainable Water Management Research Unit, P.O. Box 127, Stoneville, MS 38776, USA
2
USDA-ARS, Crop Production Systems Research Unit, P.O. Box 350, Stoneville, MS 38776, USA
*
Author to whom correspondence should be addressed.
Water 2021, 13(11), 1496; https://doi.org/10.3390/w13111496
Submission received: 9 April 2021
/
Revised: 18 May 2021
/
Accepted: 25 May 2021
/
Published: 27 May 2021
(This article belongs to the Special Issue Optimization of Water Use in Agricultural Systems)
Abstract
:Introducing alternative cultivars with enhanced water use efficiencies can help alleviate pressure on groundwater for crop irrigations in Mississippi (MS) Delta. A two-year field study was conducted in 2019–2020 to compare the water use efficiencies (WUE) of recently released and pre-released soybean {Glycine max (L.) Merr.} cultivars in maturity group (MG) III (‘P37A78’, ‘LG03-4561-14’), IV (‘Dyna-gro 4516x’, ‘DS25-1, DT97-4290’), and V (‘S12-1362’, ‘S14-16306’) in the MS Delta. The experimental design was a split-plot with cultivar as the first factor and the second factor was water variant irrigation (IR) and no irrigation (RF, rainfed), replicated three times. The MG IV cultivar Dyna-gro 4516x recorded the highest grain yield and WUE: grain yields were 4.58 Mg ha−1 and 3.89 Mg ha−1 under IR and RF, respectively in 2019, and 4.74 Mg ha−1 and 4.35 Mg ha−1 in 2020. The WUE were 7.2 and 6.9 kg ha−1 mm−1, respectively, in 2019 under IR and RF, and 13.4 and 16.9 kg ha−1 mm−1 in 2020. The data reveals that ‘Dyna-gro 4516x’ (MG IV), ‘LG03-4561-14’ (MG III), and ‘P37A78’ (MG III) are best adapted to the early soybean production system (ESPS) in MS Delta region for sustainable production for conserving water resources.
1. Introduction
Globally, soybean (Glycine max (L.) Merr.) is the most widely grown legume and a major protein source for humans and animals. It was grown on 125.5 Mha with a production of 358 Mtons during 2018–2019 [1]. The United States had 35.45 Mha acreage with 120 Mtons in 2019 [1]. However, the crop’s sustainable production is significantly impacted by abiotic stresses such as moisture deficit, elevated temperature, and flooding or waterlogging and biotic stresses such as anthracnose, bacterial blight, and charcoal rot diseases [2]. In some areas in the lower Mississippi (MS) Delta of the US, flooding is a major constraint limiting the productivity and yield stability of soybean, with many field studies reporting yield declines between 24% and 50% [3].
Crop cultivars and their agronomic practices change over time, potentially affecting landscape water and energy balances. An earlier production system in MS Delta consisted f sowing MG VI and VII cultivars in May and June that mature in October and November and prone to terminal moisture deficit stress that typically occurred in August and September. The early soybean production system (ESPS), which was developed to escape the terminal (late season) drought in August and September, is popular in the MS Delta now [4]. The ESPS primarily involves sowing early maturing cultivars falling under the maturity group (MG) III, IV, and V in April or May that mature in August or September [2].
The precipitation pattern in the lower MS Delta is characterized by large inter- and intra-seasonal variabilities in amounts and temporal distributions in rainwater supplies for crop growth leading to unstable yield returns [5]. Hence, about 60% of the soybean planted area in this region is under irrigation using the water pumped out of the underlying Mississippi River Valley Alluvial Aquifer (MRVAA)—a lifeline of irrigated agriculture in the MS Delta [6]. However, the MRVAA is being depleted fast due to unscientific overdraft of the aquifer, estimated to be about 370 million cubic meters per year [6]. Hence sustainable soybean production in the region calls for growing water use efficient cultivars that were bred both for high grain yield and lower water use. Water use efficiency (WUE), the amount of yield returned per unit of water consumed, is a concept describing the association between plant productivity and water use [7]. Developing high-yielding lines with enhanced WUE is challenging in multiple ways, as lower water consumption often leads to poor grain yield [8,9]. Many breeders tend to increase WUE successfully only if associated with high yield, rather than reducing consumptive water use [10]. If drought stress occurs during the vegetative stage, soybean leaves either curl or drop, leading to reduced plant growth and yield reduction. The crop is highly susceptible to moisture-deficit stress injury during the reproductive stages. Drought can cause up to 40% yield losses in soybean-based on timing and intensity of occurrence [10], and these losses worsen when moisture deficit stress occurs during both the vegetative and the reproductive stages. Under moisture deficit stress, soybeans in the early reproductive stages have increased flower and pod abortion; in later stages, prolonged stress results in small pods having fewer, smaller, and more shriveled seeds with lower test weight [11]. Among the abiotic stresses, flooding ranks second after drought, causing the greatest economic losses to soybean growers [12]. The saturated hydraulic conductivity of clay soils commonly found in MS Delta is low; hence excess springtime rains and rainfall after irrigation often lead to flooding and water logging [13,14,15]. Flooding stress creates an anaerobic or hypoxic environment in the root environment affecting soybean root respiration, nutrient uptake, root growth, nodulation, and nitrogen fixation, finally resulting in a significant reduction in photosynthesis and yield loss and sometimes death of the plants [16]. Waterlogging in soybean during early vegetative or reproductive growth, for periods as short as two days in clay soil, has been shown to reduce yield by as much as 27% [17]. Exposure of soybean to flooding stress for about a week is sufficient to reduce leaf nitrogen content at early vegetative stages [18]. Low seed germination and poor seed quality are important problems for producers in the MS Delta and other production environments with high temperatures (mean daily highs greater than 33 °C) [2]. Charcoal rot is a soilborne root and stems disease of soybean that develops in the mid to late summer when plants are under stress occurs throughout the north-central and southern regions of the United States as well as in tropical and subtropical regions of the world [19].
There is a lack of study which presents production and WUE of variable maturing (MG III, IV, and V) soybean cultivars bred for different biotic and abiotic stress tolerances suitable for the ESPS production system under rainfed and irrigated environments. In this study, we evaluated the WUE and grain yield returns of seven such soybean cultivars grown under rainfed (RF) and irrigated (IR) water management scenarios.
2. Materials and Methods
Experiments involving seven cultivars including both released and pre-released lines bred for flood, drought, and heat stress tolerances, charcoal rot resistance, as well as herbicide tolerance (Table 1) were conducted on a Dundee silt loam (fine silty, mixed, active, thermic Typic Endoaqualfs) at the USDA-ARS Crop Production Systems Research farm located at Stoneville, MS, USA (33°42′ N, 90°55′ W, elevation: 32 m above mean sea level) in 2019 and 2020. The experimental field soil was characterized with 21.54% sand, 57.62% silt, and 21.04% clay (Table 2). Bulk density of the soil, averaged across 60 cm soil depth, was 1.36 g cm−3, and field-saturated hydraulic conductivity (Kfs) measured with Saturo Infiltrometer (Meter Group Inc., Pullman, WA, USA) ranged between 0.36 and 0.59 cm h−1. Field preparation consisted of one or two deep tillage events to break clay pans and overturn soils, burying crop residue, and killing weeds, followed by a disc-tillage to generate furrows and ridges (102 cm row spacing) for sowing soybean seeds and to facilitate furrow irrigations, conducted in the fall season after harvesting the previous crop (2018 crop in the experimental site was corn). The raised-ridge seedbeds were re-hipped during the spring season, and the tops of the seedbeds were flattened before sowing with Almaco cone plot planter (Allen Machine Company, Nevada, IA, USA). Each plot consisted of 10 m in length and four rows spaced at 102 cm apart. Seeding depth was adjusted to place the seed approximately 2.5 cm deep in the soil. The planter was set to achieve an overall plant population density of approximately 336,000 plants ha−1. Currently, the Mississippi State University recommends a seeding rate of 345,800 seeds ha−1 for an MG IV soybean planted in April to May on clay soil [20]. Achieved plant populations were estimated at harvest by counting plants in 1 m2 area in the two center rows at three randomly selected locations in each plot. Plots were maintained weed-free using both preemergence and postemergence herbicide programs. Weed control was accomplished with a pre-plant application of glyphosate at 1.12 kg active ingredient (a.i.) ha−1 1–2 weeks before soybean sowing to kill existing weeds. After sowing, S-metolachlor at 1.12 kg a.i. ha−1 plus pendimethalin at 1.12 kg a.i. ha–1 was applied preemergence to ensure early-season weed control. Glyphosate at 1.12 kg a.i. ha−1 plus metolachlor at 1.12 kg a.i. ha−1 were applied postemergence. Any escaped weeds were hand-hoed as needed. A basal dose of 100 Kgha−1 K2O was applied and no nitrogenous fertilizer was applied.
Two MG III (cv. P37A78 and LG03-4561-14), three MG IV (cv. Dyna-gro 4516x, DS25-1, and DT97-4290), and two MG V (cv. S12-1362 and S14-16306) cultivars were planted in a split-plot design with three replicates (Table 2). The main plots were two irrigation regimes: IR and RF, and subplots consisted of the seven varieties. The amount of irrigation water applied in each plot was measured using a flow meter. Soybean seeds were planted on 30 April 2019, and 2 May 2020. Each plot consisted of four rows and was 10 m long. Sensors for measuring soil-matrix water potential (Irrometer Inc. Riverside, CA, USA) were installed at depths of 15, 30, and 60 cm in selected representative plots in 2019. Irrigations were applied based on a soil matrix potential of about −90 kPa at 45 cm soil depths recommended by Plumblee et al. (2019) [21]. In 2019, a total of 7.3 cm of water were applied in the irrigated plots in two irrigation events through every furrow on 28 June and 29 July. In 2020, total irrigation applied was 9.8 cm, in two irrigation events of 4.9 cm each on 18 June and 4 August. Irrigation was stopped at the R6 stage of growth of pod development in both years. Weather data were collected from the Mid-South Agricultural Weather Service, Delta Research and Extension Center, Stoneville, MS, located within a mile from the experimental fields. The growing degree days (°C, GDD) were calculated using a base temperature () of 10 °C [22]:
Soybean yields from the two middle plot rows were harvested with a small-plot combine at crop maturity, and yields were adjusted to 13% moisture content. Plant height, the number of nodes, number of pods per node, and number of seeds per node at harvest were recorded. An AccuPar model LP-80 PAR/LAI(photosynthetically active radiation/leaf area index) Ceptometer sensor (Decagon Devices, Inc., Pullman, WA, USA) was used to measure LAI, as described in [14]. All plant measurements were replicated at five random locations in the plot and used to calculate the standard error (SE) of measurements. WUE for grains or biomass (kg ha−1 mm−1 of water applied) was calculated as:
where Yi and Yr are seed or biomass yield in the irrigated and rainfed (kg ha−1) treatments, respectively. P is precipitation, and I is irrigation applied during the crop growth season (mm).
3. Statistical Analysis
The analysis of variance (ANOVA) for agronomic variables and yield components was performed using JMP Pro v. 14.1.0 software (SAS Institute, Cary, NC, USA) using the PROC MIXED model. The statistical analysis was done separately by year due to significant inter-seasonal variability. Within the year, irrigation, cultivars, and their interactions as fixed effects and replication and whole plot (irrigation) as random effects. Random effects used in this model for the comparison across years were irrigation X year, cultivar X year, and irrigation X cultivar X year. Treatment means were separated at the 5% level of significance using Fisher’s protected least significant difference (LSD) test.
4. Results and Discussion
4.1. Weather
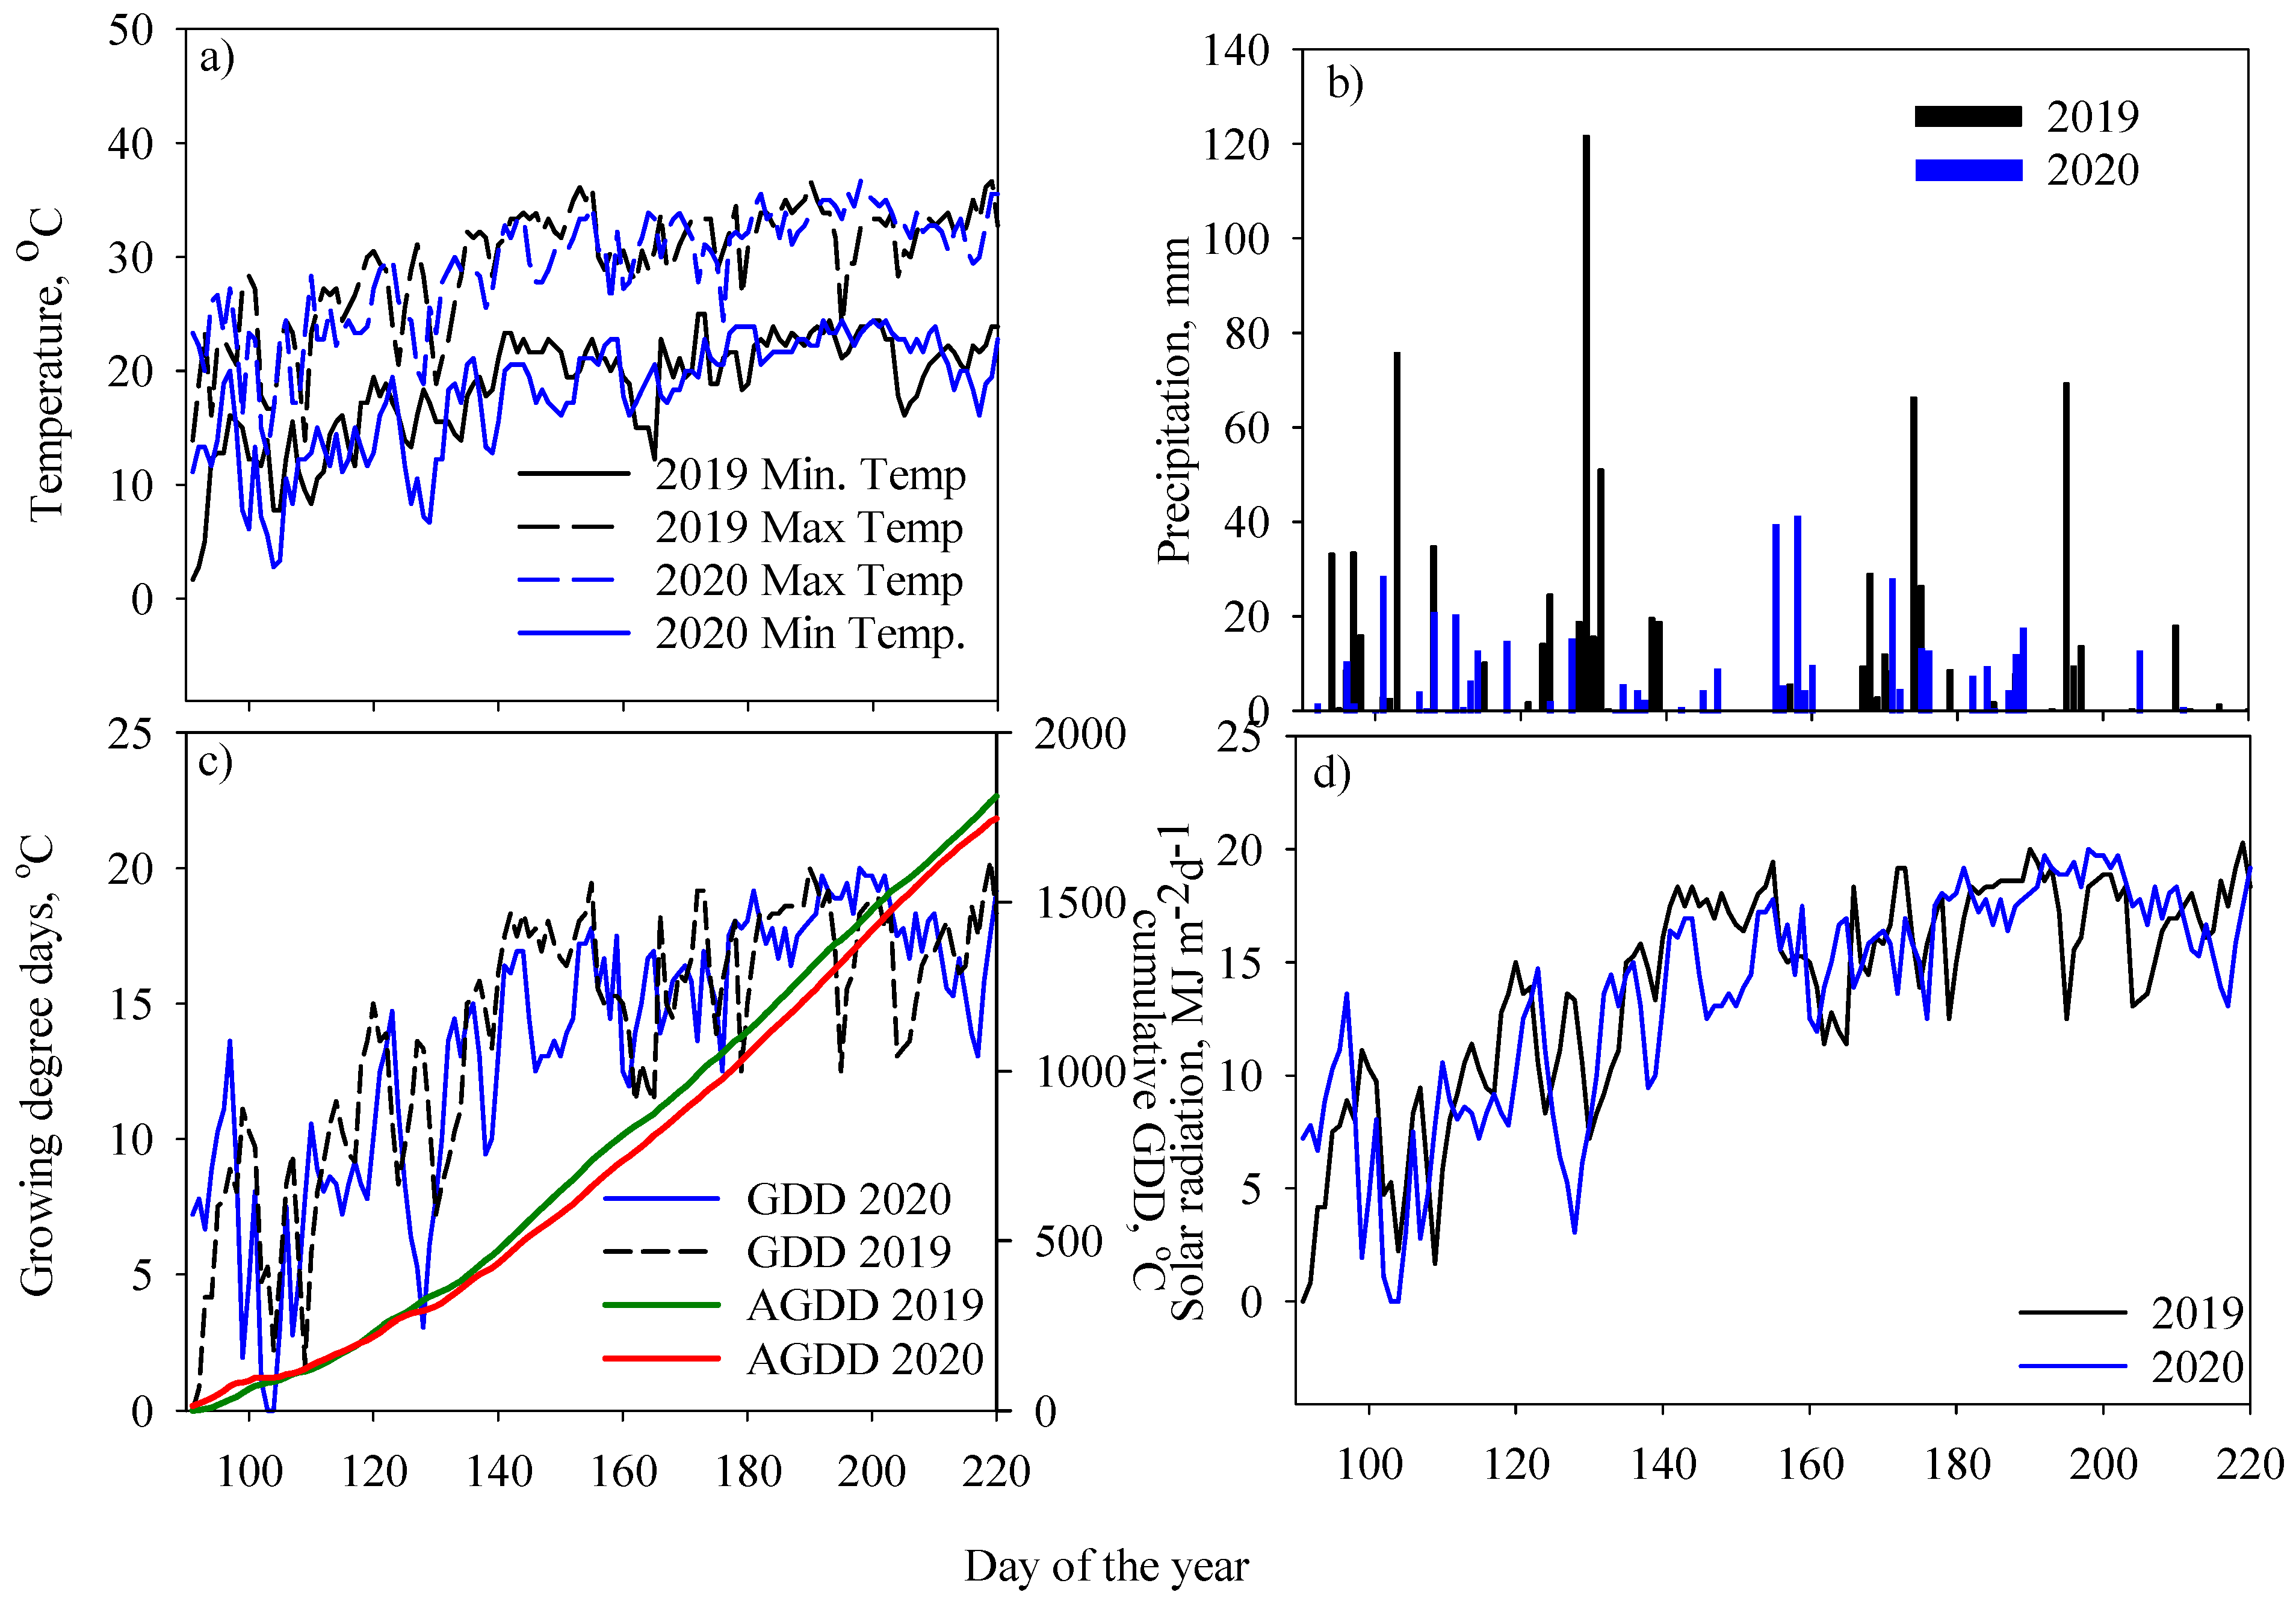
Considerable differences in observed weather were noted during the two cropping seasons in 2019 and 2020 (Figure 1). The 2019 active soybean crop season (May–August) received 638 mm, and a similar period in 2020 received only 272 mm (135% lower) of rainfall. Contrasting temporal distribution patterns were observed with heavy rainfalls coinciding with reproductive growth in 2020. Still, in the 2019 crop season, significant rainfall amounts were recorded mainly during vegetative and early reproductive growth stages. The heavy rainfalls led to four flooding events during the 2019 crop season, which spread across both the vegetative and reproductive phases. Two flooding events were observed due to excessive rains in 2020, coinciding with the reproductive phase. The growth period (June–August) in 2019 had 41 GDD more than that of 2020. Similarly, in the case of maximum temperatures, during the May–August, 2020 crop season recorded 26% higher average daily maximum air temperatures (32.2 °C in 2020 and 25.42 °C in 2019) and 47% higher average daily minimum air temperatures (21.28 °C in 2020 and 14.41 °C in 2019). Most of the days in 2020 had lower solar radiation than those of the 2019 season (cumulative solar radiation in 2019: 3711 vs. 3660 MJm−2 in 2020). These differences in weather during the two crop seasons were reflected in the cultivar performance for seed yield and related traits in those years, as revealed in the analysis of variance (ANOVA) tests (Table 3).
4.2. Phenology
Knowledge of crop phenology is useful for efficient crop management. Previous studies observed a significant influence of environmental factors such as temperature, photoperiod, soil moisture, and soil fertility on crop phenology [14,23]. The spectrum of variability for the seven cultivars’ phenological stages from emergence (VE) to physiological maturity (R8) is presented in Table 3. There were no significant differences in observed phenological events across the irrigation treatments, so data were not presented. However, the comparison between the two crop seasons revealed that the transition between different vegetative stages took a greater number of calendar days in 2019 than that of 2020 due to 47% lower average minimum air temperatures and 26% lower average maximum air temperatures during V4 to R6 phenological stages of crop development in 2019 season. The window between the two phenological stages is wider for MG V varieties S14-16306 and S1-1362, while the window is relatively narrow for MG III and MG IV cultivars. In the case of DS 25-1, the days to maturity are similar despite the wide range of variability in precipitation and temperature differences during the crop season. This could result from prevailing lower temperatures coinciding with the vegetative phase in 2019 (Figure 1a). The cumulative GDD (from emergence to maturity) in 2019 was 1812 °C, while it was 1747 °C in 2020, which was similar to the earlier reports for an MG IV cultivar in humid climates ranging between 1881 and 2482 °C [23,24].
4.3. Leaf Area Index (LAI) of Cultivars
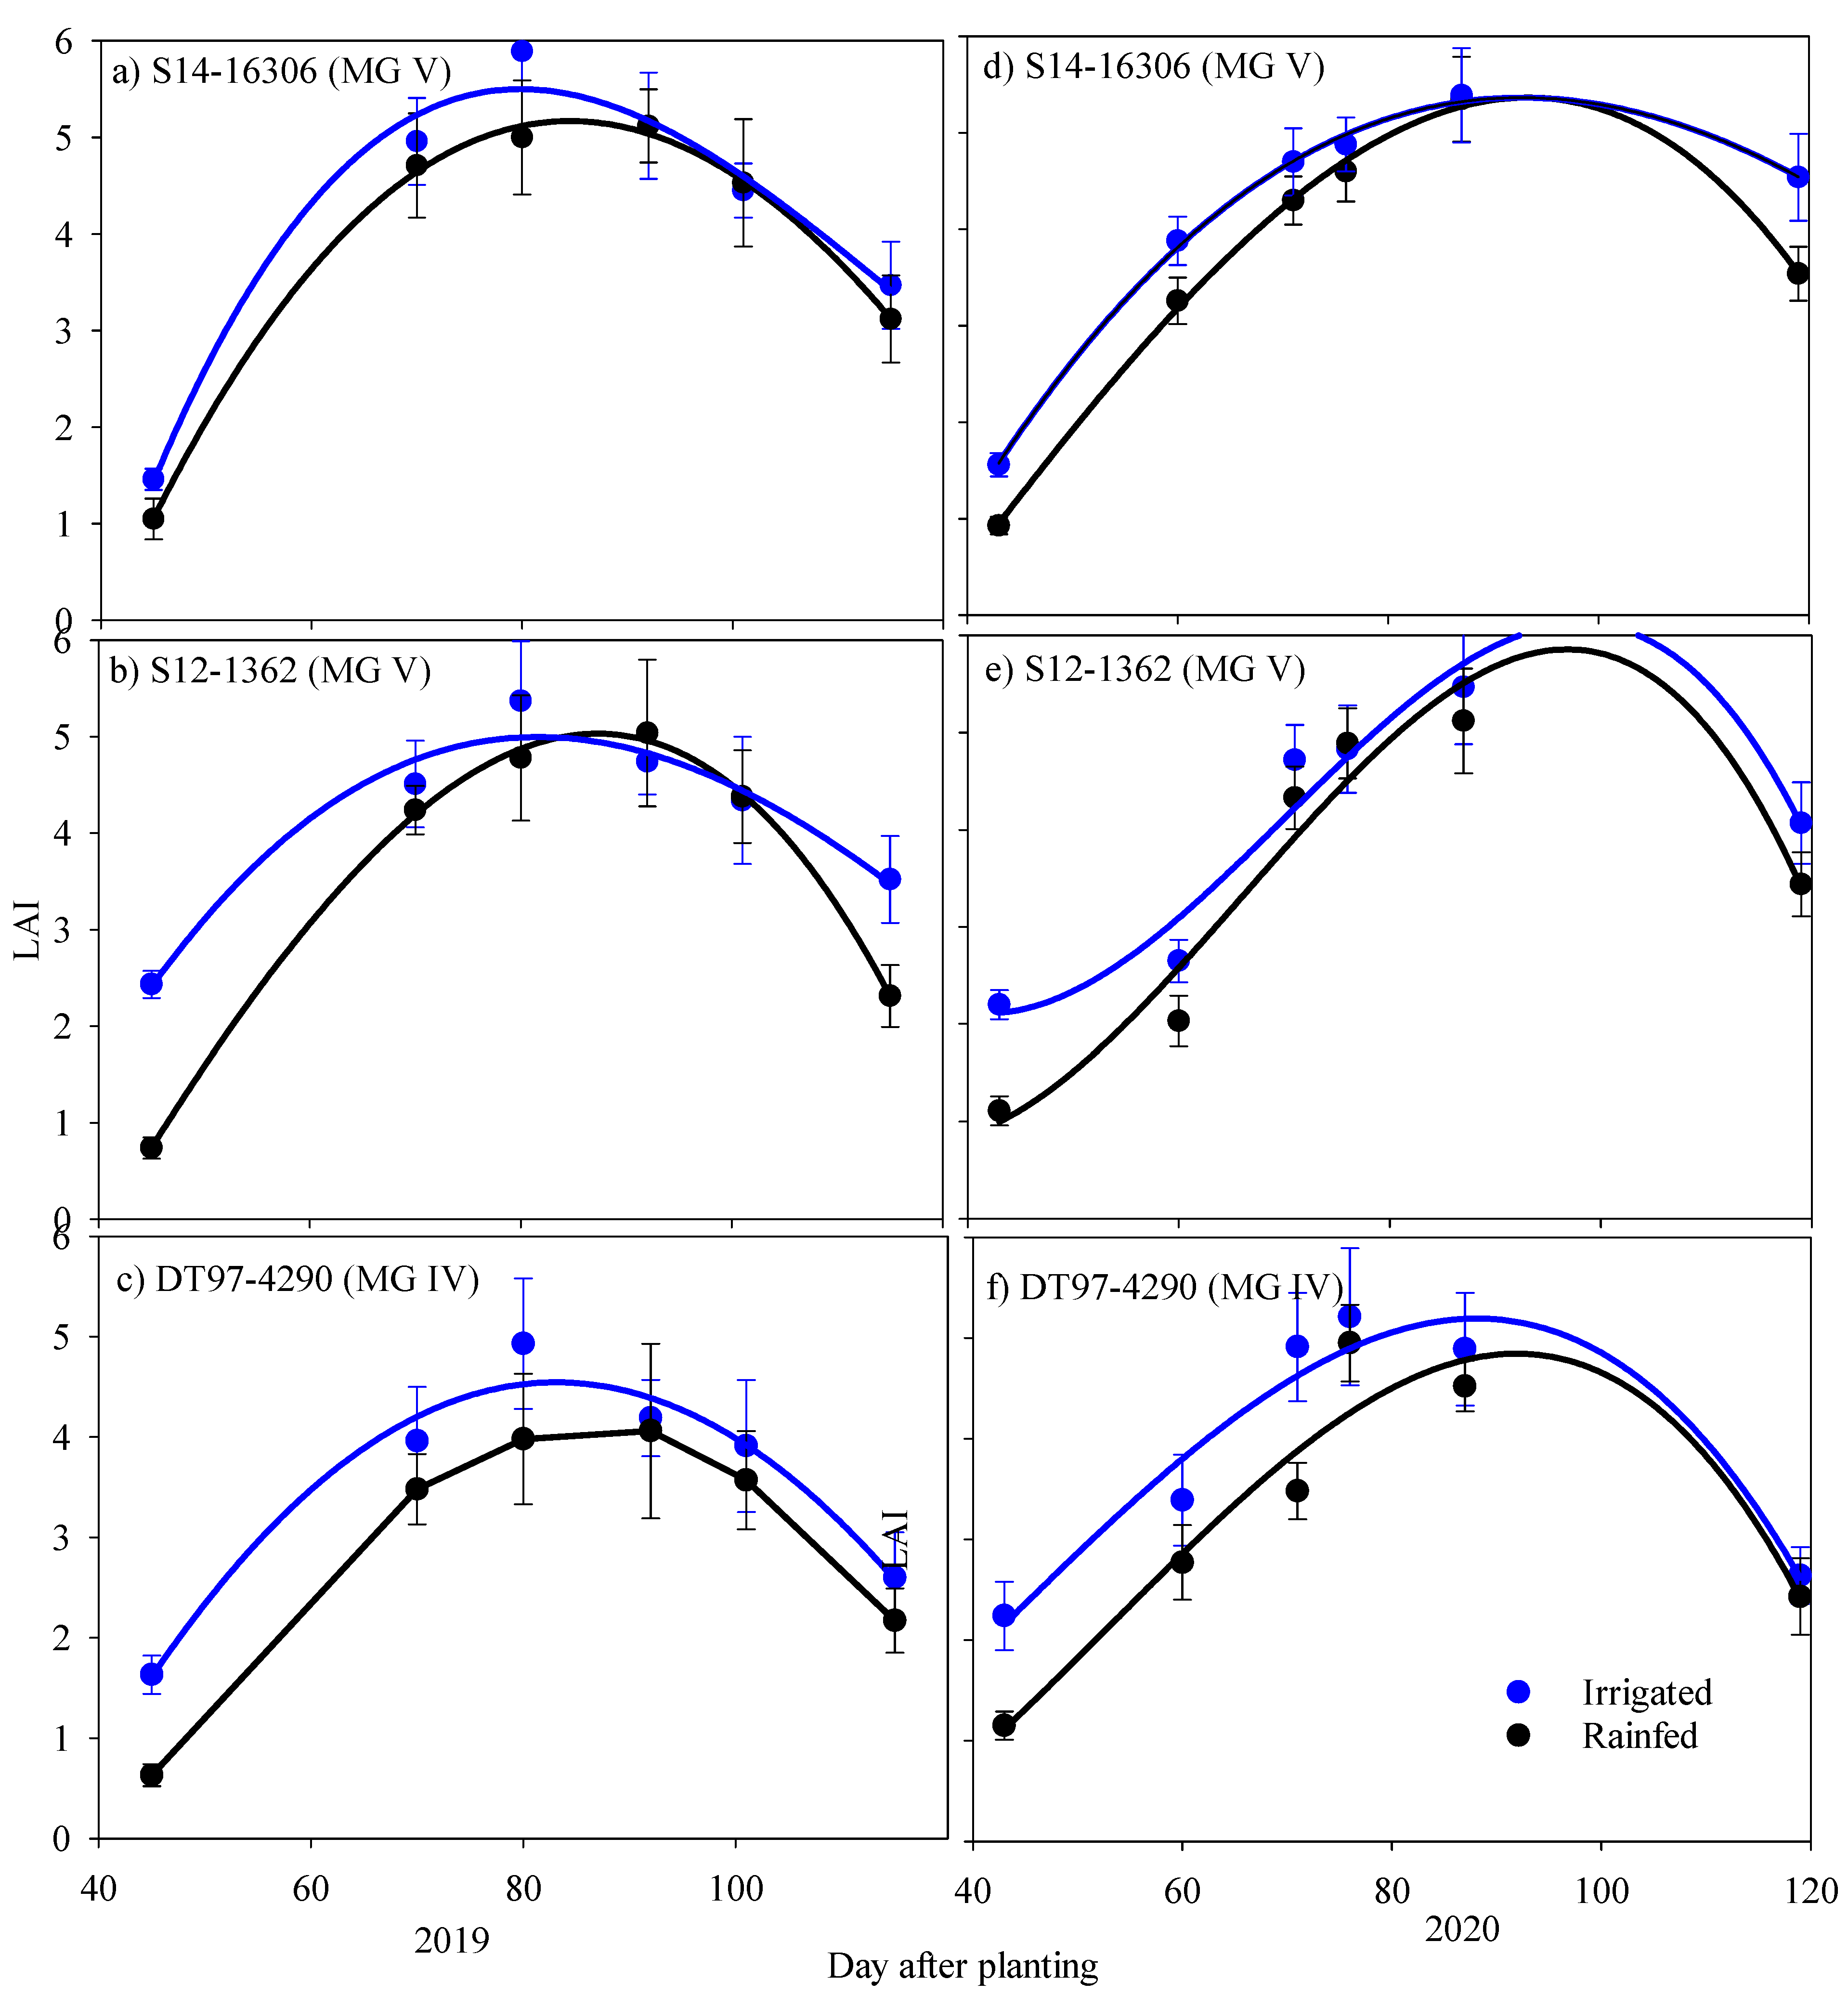
The LAI data for all the seven cultivars for both seasons are presented in Figure 2 and Figure 3. In the case of S14-16306 in 2019 and 2020, and S12-1362 in 2019, between the rainfed and irrigated treatments, the LAIs were similar up to about the V6 stage. Still, differences narrowed down after about the R2 stage, probably due to the plants’ ability under the rainfed treatments to recoup fast when sufficient rains were received, relieving the water stress (Figure 2a–f). The maximum LAI measured was between 64–70 days after sowing (DAP) in the MG III cultivar plots, while it was between 75–80 DAP for MG IV cultivars and 80–86 DAP in the case of MG V cultivars. The IR plants have recorded significantly higher LAI than RF plants for all the cultivars in both years, and the maximum LAI was reached 4–10 days earlier.
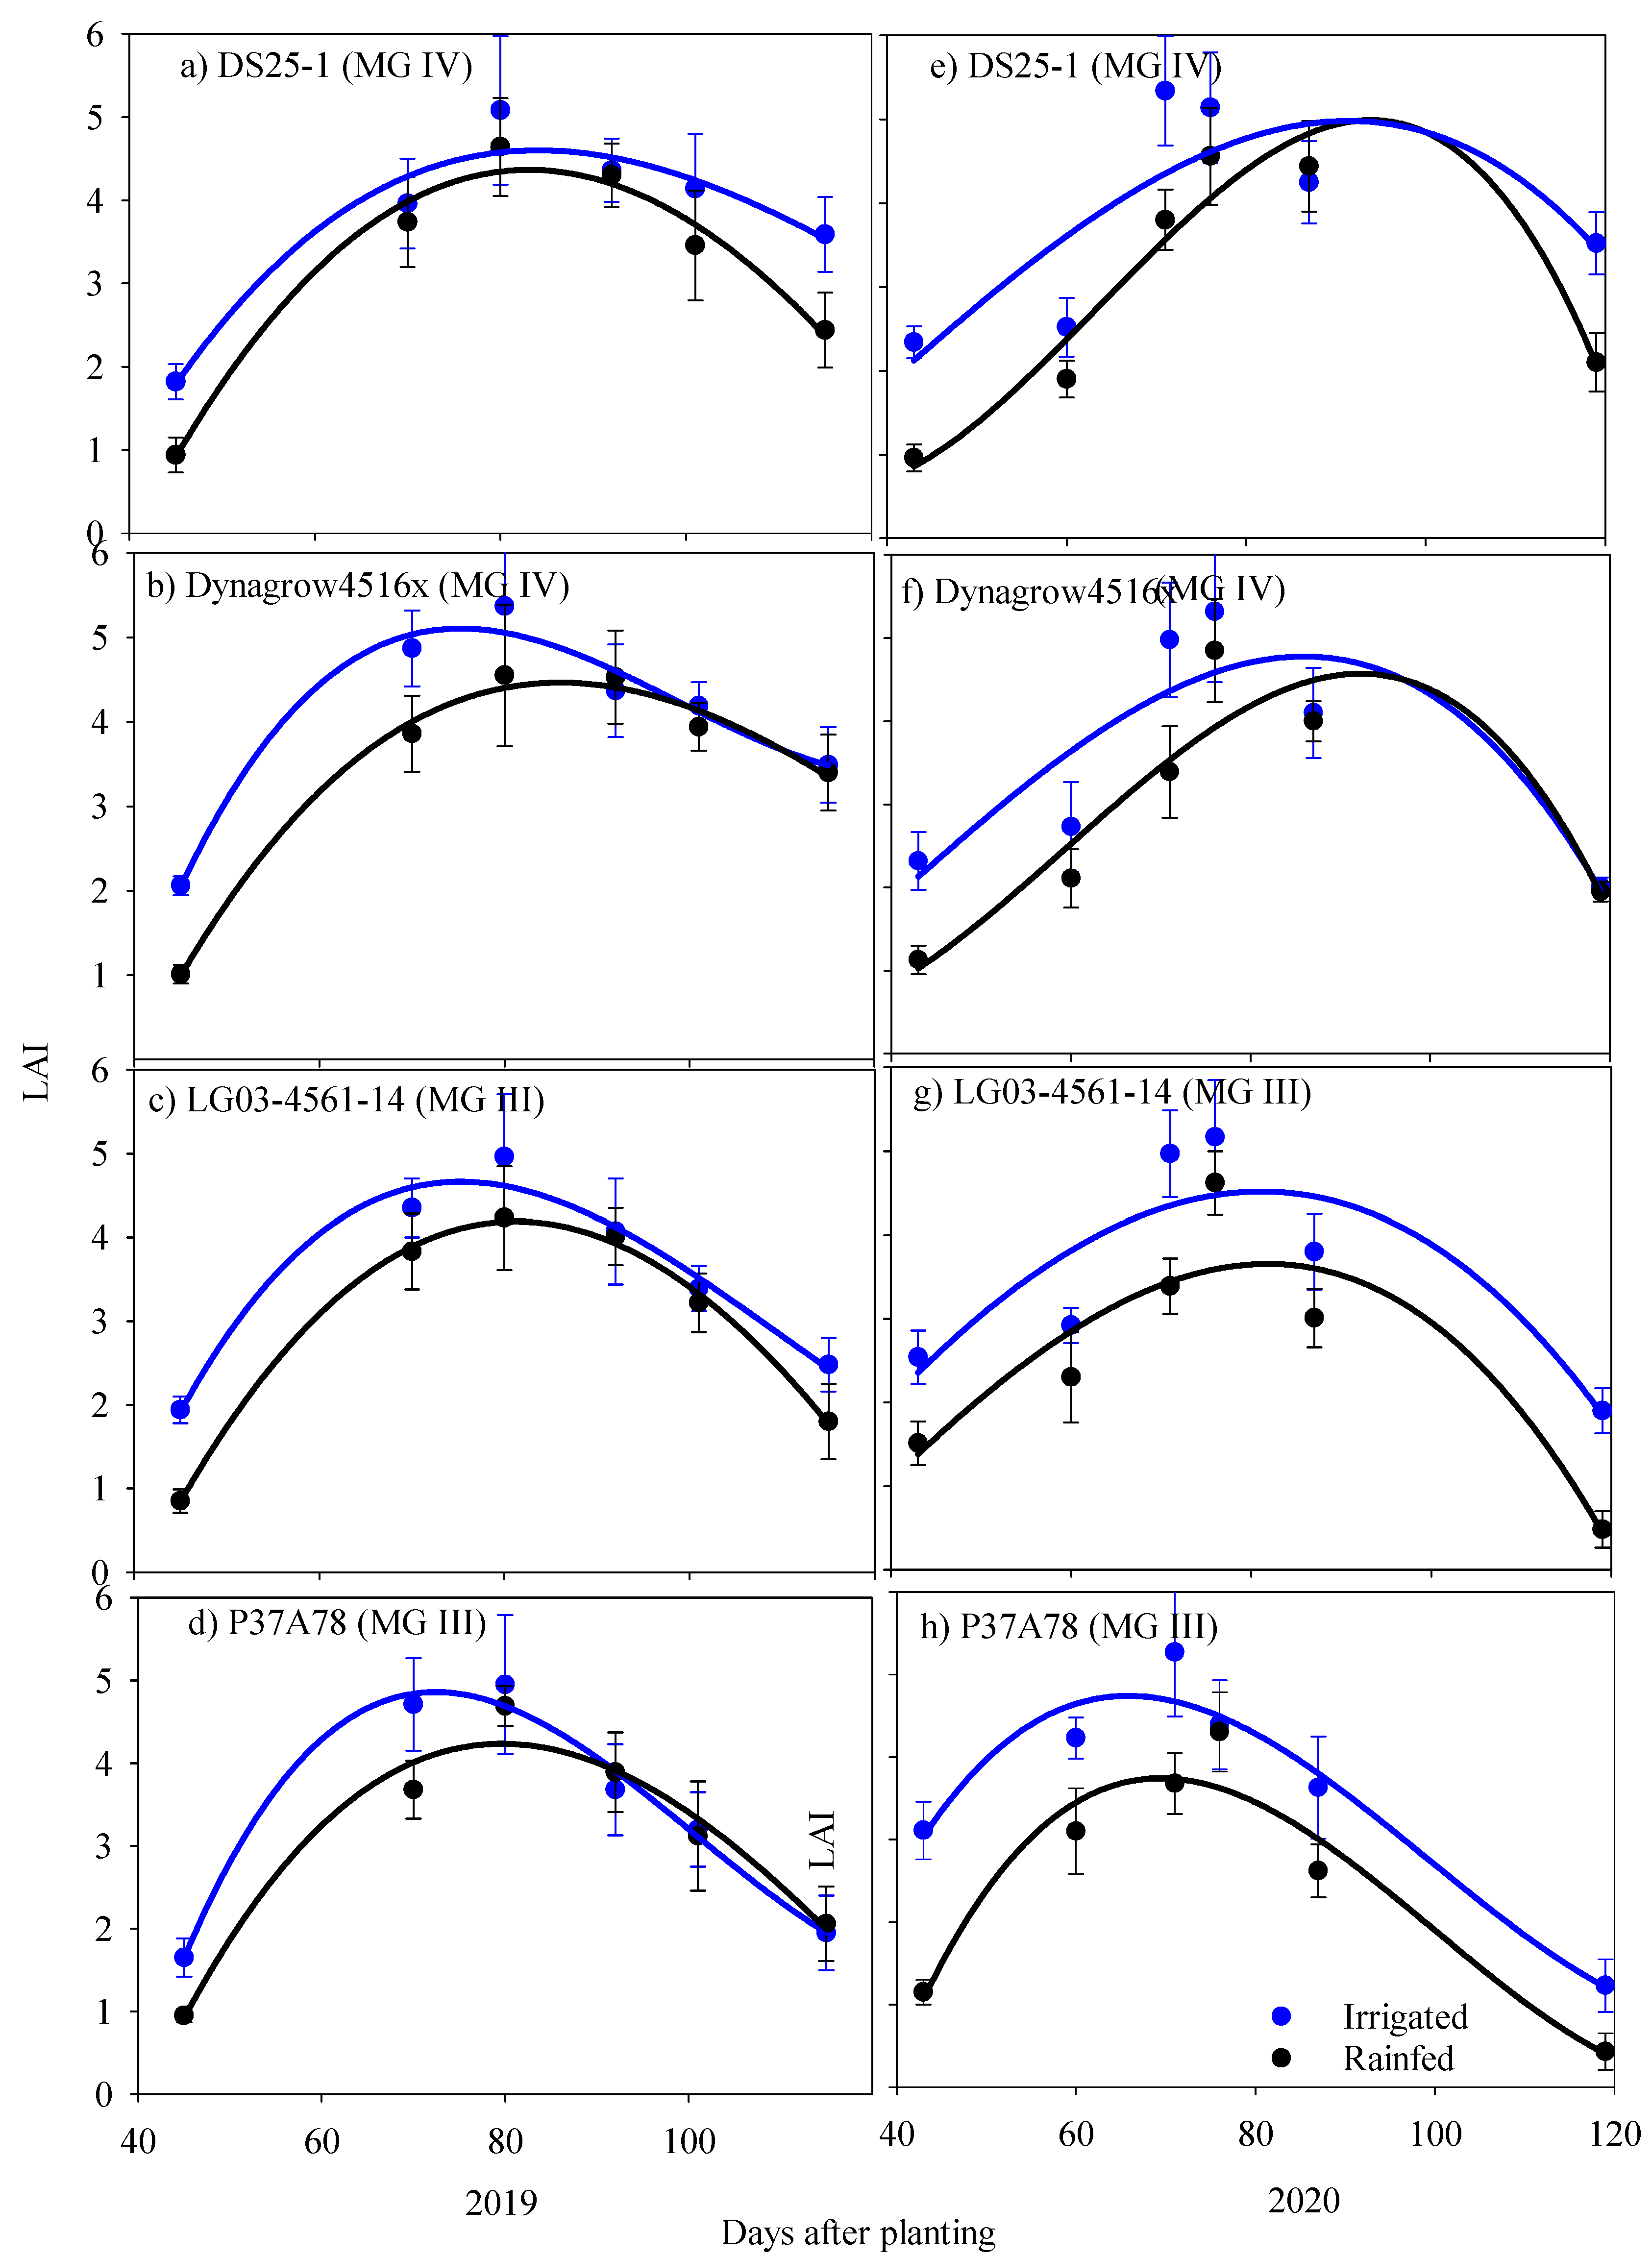
Furthermore, it was observed that there is a sharp decline in LAI in MG III cultivars 90 days after sowing due to leaf senescence (Figure 3a–h). This wide gap is due to their differences in days to maturity. The crop growth rate is primarily determined by the amount of solar radiation intercepted by the crop canopy and air temperature and CO2 concentration, besides the cultivar’s genetic characteristics. Higher LAI probably contributed to suppression weeds and higher photosynthetically active radiation (PAR) interception leading to more photosynthates assimilation, ultimately resulting in higher grain yields and biomass discussed below. Similar results were reported, where higher LAI in IR soybean was associated with enhanced grain yield in a humid subtropical environment due to high interception of PAR and weed suppression than the soybean under RF condition [14,25].
4.4. Cultivar Agronomic Performance
The analysis of variance (ANOVA) revealed significant differences in seed yield and related traits: number of pods per plant, number of pod bearing nodes per plant, number of seeds per pod, and 100-seed weight (Table 4). Although the population per square meter didn’t differ in the 2019 season (range: 19–22), significant differences were observed in the 2020 crop season (range: 16–22) among the cultivars, probably due to contrasting precipitation patterns. Most of the cultivars had recorded a significantly lower population under RF, similar to the findings of earlier studies in this region [14,15,26]. Significant differences in plant height were observed in both crop seasons for all the cultivars, ranging from 72.8 to 128 cm in 2019 and 83.8 to 136.3 cm during the 2020 season. The number of nodes per plant ranged from 11.7 to 17.0 in 2019, while 12.5 to 17.0 in 2020 (Table 5). Significant differences were found among the cultivars of MG III (‘LG03-4561-14’, ‘P37A78’), IV (‘DT97-4290’, ‘DS25-1’, ‘Dyna-gro 4516x’), and V (‘S14-16306’, ‘S12-1362’) in number of pods per plant in both seasons (between 59.3 and 122.0 in 2019, between 55 and 98 in 2020). The number of seeds for the soybean plants was determined gradually from the beginning of flowering to a few days after seed filling when chances for further seed abortions ceased [27]. The test weight in 2019 ranged between 16.1 and 20.9 g, while it varied between 15.9 and 20.9 g in 2020. Cultivars in the irrigated treatment recorded significantly higher test weight than the RF ones, similar to earlier studies [10,28]. The biomass (above ground including grains) yield at physiological maturity ranged between 6.7 and 9.2 Mg ha−1 in 2019, while it ranged between 5.6 and 8.7 Mg ha−1 during 2020. In 2019, the cultivar ‘LG03-4561-14’ (MG III) recorded the highest biomass: between 7.6 and 9.2 Mg ha−1, and ‘Dyna-gro 4516x’ yielded the highest in 2020 and between 8.3 and 8.7 Mg ha−1 in 2020 under IR and RF, respectively. It was reported earlier that high biomass accumulation by the R5 stage impacts seed-set efficiency [29]. In this study, there was also a strong positive correlation between the quantum of biomass produced per ha and the grain yield realized (0.73 in 2019 and 0.62 in 2020) in conformity with the earlier observations [30].
Significant differences in seed yield among the cultivars were observed for both seasons in both RF and IR treatments. The seed yield varied between 3.01 and 4.58 Mg ha−1 in 2019, and it ranged from 2.72 Mg ha−1 to 4.74 Mg ha−1 in 2020 (Table 5). The cultivar, ‘Dyna-gro 4516x’ (MG IV), recorded the highest yield in both years. In 2019, it produced 4.58 Mg ha-1 under the IR treatment and 3.89 Mg ha−1 under the RF treatment. In 2020, grain yields were 4.74 Mg ha−1 and 4.35 Mg ha−1 under IR and RF treatments, respectively. The seed yield for flood-tolerant lines, falling under MG V, ranged from 3.01 to 3.73 Mg ha−1 in 2019 while it varied between 2.72 and 3.18 Mg ha−1 during 2020, probably due to their indeterminate flowering coinciding with high precipitation events in 2020. These results are similar to an earlier study [16].
Seed yields of the MG III cultivars, ‘P37A78’ and ‘LG03-4561-14’, ranged between 3.81 and 4.42 Mg ha−1 in 2019, and between 3.75 and 4.46 Mg ha−1 in 2020. These results are comparable with the many popular MG IV cultivars grown in this region [2,14,31]. The heat-tolerant cultivar ‘DS 25-1’ (MG IV) had a similar range of seed yield in both seasons ranging between 4.01 and 4.31 Mg ha−1 in 2019, and between 3.64 and 3.93 Mg ha−1 in 2020. In both the crop seasons, despite recording over 36 °C for some days in July coinciding with the beginning pod to full pod stages (R3-R4), the yield levels in heat-tolerant cultivar DS 25-1 (MG IV) were not affected. These yield levels were similar to those in cultivar screening trials conducted previously in Stoneville, MS [32]. It is well known that the harvest index (HI) and biomass were the two major factors affecting grain yield [14,16,28]. Increased seed yield in soybean can be achieved either by increasing the aboveground biomass amount with a constant harvest index (HI) or increasing the HI with constant aboveground biomass. The HI ranged from 0.38 to 0.56 in 2019 and between 0.51 and 0.57 in 2020. There is no specific identifiable trend of HI vis-a-vis irrigation among the cultivars, which differ in specific traits besides maturity. The MG V flood-tolerant lines ‘S14-16306’ and ‘S12-1362’ had lower HI than all the MG III and IV cultivars. This could probably be because the primary yield benefits result from the increased biomass under irrigation rather than increased HI, as evidenced in this study. In other MG cultivars, it appears both HI and biomass yield had a role in realizing higher yields due to irrigation.
4.5. Water Use efficiency (WUE) of Cultivars
The data in Table 6 indicates that the WUE for grain yields was significantly lower in irrigated treatments than RF. The WUE ranged from 4.5 to 7.2 kg ha−1 mm−1 in 2019, while it varied between 8.3 and 16.9 kg ha−1 mm−1 in 2020. This could be due to differences in precipitation levels during the vegetative phase and reproductive development, which in turn affects the yield contributing factors like test weight, number of pods per plant, and number of pod bearing nodes/plant. These findings were similar to earlier reports [7,14,33]. This is evident in yield response to irrigations, which varied between 5.90 and 17.74% in 2019, while the range for 2020 is from 7.97 to 16.53% (Table 6). The MG III cultivars have consistently recorded higher yield response levels due to irrigation, indicating that a smaller number of precipitation events and amounts occurred during their critical stages for irrigation. In flood-tolerant cultivars falling under MG V, inconsistent yield response to irrigations was noticed: from 7.3 to 7.8% in 2019, and from 10.4 to 12.5% in 2020. In the case of WUE for biomass (WUEb), the cultivar ‘LG03-4561-14’ (MG III) recorded the highest, 14.5 kg ha−1 mm−1 in 2019, while ‘Dyna-gro 4516x’, an MG IV cultivar, recorded a much higher WUEb of 32.3 kg ha−1 mm−1 in 2020 (Table 6). The data further revealed that the flood-tolerant MG V cultivars, ‘S14-16306’ and ‘S12-1362’, had consistently recorded lower WUE compared to MG III and V cultivars (Table 6), highlighting that the flooding rainfall events of 2019–2020 seasons (2 events each of 60 mm per day above during early reproductive phase; 2 events each of over 100 mm d−1 in late reproductive phase) were not detrimental for seed production. Furthermore, as the field was precision leveled to introduce a 1% slope for facilitating water drainage and irrigations, during periods of high precipitation, there were fewer chances for water stagnating in the plant-rootzones for long enough to cause root damages.
5. Conclusions
Introducing alternative cultivars with enhanced irrigation water use efficiencies can help ease some pressure on the MRVAA aquifer for supporting irrigated crop production in the region. This study investigated the WUE of cultivars for assessing their suitability for cultivation in the region for conserving water resources. The study brought to light the significant differences in WUE between cultivars falling under MG III, IV, and V. In 2019 and 2020 crop seasons, rainfed treatment recorded higher WUE for grain yield and biomass than irrigated treatments. However, the irrigated plots had about a 15% grain yield advantage over the rainfed treatments. The cultivars ‘Dyna-gro 4516x’ (MG IV), ‘LG03-4561-14’ (MG III), and ‘P37A78’ (MG III) are suitable for the existing ESPS system in the MS Delta for higher grain yields and WUE and conserving the water resources in the region.
Author Contributions
S.R.P. participated in the collection of the data, data analysis, and manuscript preparation. S.S.A., D.K.F. and K.N.R. contributed to designing the experiment and manuscript editing. All authors have read and agreed to the published version of the manuscript.
Funding
USDA, USA Govt. in-house project—no external funding.
Informed Consent Statement
Not applicable.
Data Availability Statement
Review of data is available and there are no competing interests. All data presented within is the corresponding authors’ data and is available upon request.
Acknowledgments
We thank Rusty Smith, USDA-ARS, Stoneville, for sharing MG III and MG IV cultivars and Pengyin Chen and Ali, Fisher Delta Research Center in Portageville, the University of Missouri, for sharing flood-tolerant cultivars and Russel Coleman USDA-ARS, Stoneville for technical support.
Conflicts of Interest
None of the authors have any competing interests within the scope of this experiment and its publication.
Ethics Approval and Consent to Participate
Not applicable.
Consent for Publication
All authors have provided ethical approval and consent to participate as well as consent for publication.
References
- USDA-FAS. World Agricultural Outlook. 2020. Available online: https://downloads.usda.library.cornell.edu/usda-esmis/files/5q47rn72z/cr56ns297/00000r529/production.pdf (accessed on 2 February 2021).
- Smith, J.R.; Gillen, A.M.; Nelson, R.L.; Bruns, A.; Mengistu, A.; Li, S.; Bellaloui, N. Registration of High-Yielding Exotically Derived Soybean Germplasm Line LG03-4561-14. J. Plant Regist. 2019, 13, 237–244. [Google Scholar] [CrossRef]
- Frederick, J.R.; Camp, C.R.; Bauer, P.J. Drought-stress effects on branch and mainstem seed yield and yield components of determinate soybean. Crop Sci. 2001, 41, 759–763. [Google Scholar] [CrossRef]
- Heatherly, L.G.; Elmore, R.W. Managing Inputs for Peak Production. In Soybeans: Improvement, Production and Uses; Boerma, H.R., Specht, E.J., Eds.; American Society of Agronomy: Madison, WI, USA, 2004; pp. 451–536. [Google Scholar]
- Anapalli, S.S.; Fisher, D.K.; Reddy, K.N.; Krutz, J.L.; Pinnamaneni, S.R.; Sui, R. Quantifying water and CO2 fluxes and water use efficiencies across irrigated C 3 and C 4 crops in a humid climate. Sci. Total Environ. 2019, 663, 338–350. [Google Scholar] [CrossRef]
- Kebede, H.; Fisher, D.K.; Sui, R.; Reddy, K.N. Irrigation Methods and Scheduling in the Delta Region of Mississippi: Current Status and Strategies to Improve Irrigation Efficiency. Am. J. Plant Sci. 2014, 5, 2917–2928. [Google Scholar] [CrossRef] [Green Version]
- Casson, S.A.; Cushman, J.C.; Yoo, C.Y.; Hatfield, J.L.; Dold, C. Water-Use Efficiency: Advances and Challenges in a Changing Climate. Front. Plant Sci. 2019. [Google Scholar] [CrossRef] [Green Version]
- Blum, A. Drought resistance, water-use efficiency, and yield potential—Are they compatible, dissonant, or mutually exclusive? Aust. J. Agric. Res. 2005, 56, 1159–1168. [Google Scholar] [CrossRef]
- Specht, J.E.; Williams, J.H.; Weidenbenner, C.J. Differential responses of soybean genotypes subjected to a seasonal soil water gradient 1. Crop Sci. 1986, 26, 922–934. [Google Scholar] [CrossRef]
- Specht, J.E.; Hume, D.J.; Kumudini, S. V Soybean yield potential—A genetic and physiological perspective. Crop Sci. 1999, 39, 1560–1570. [Google Scholar] [CrossRef]
- Boyer, J.S.; Byrne, P.; Cassman, K.G.; Cooper, M.; Delmer, D.; Greene, T.; Gruis, F.; Habben, J.; Hausmann, N.; Kenny, N. The US drought of 2012 in perspective: A call to action. Glob. Food Sec. 2013, 2, 139–143. [Google Scholar] [CrossRef]
- Valliyodan, B.; Van Toai, T.T.; Alves, J.D.; De Fátima, P.; Goulart, P.; Lee, J.D.; Fritschi, F.B.; Rahman, M.A.; Islam, R.; Shannon, J.G.; et al. Expression of root-related transcription factors associated with flooding tolerance of soybean (Glycine max). Int. J. Mol. Sci. 2014, 15, 17622–17643. [Google Scholar] [CrossRef] [Green Version]
- Pinnamaneni, S.; Anapalli, S.S.; Fisher, D.K.; Reddy, K.N. Irrigation and Planting Geometry Effects on Cotton (Gossypium hirsutum L.) Yield and Water Use. J. Cotton Sci. 2020, 24, 87–96. [Google Scholar]
- Pinnamaneni, S.R.; Anapalli, S.S.; Reddy, K.N.; Fisher, D.K.; Quintana-Ashwell, N.E. Assessing irrigation water use efficiency and economy of twin-row soybean in the Mississippi Delta. Agron. J. 2020, 112, 4219–4231. [Google Scholar] [CrossRef]
- Pinnamaneni, S.R.; Anapalli, S.S.; Sui, R.; Bellaloui, N.; Reddy, K.N. Effects of irrigation and planting geometry on cotton (Gossypium hirsutum L.) fiber quality and seed composition. J. Cott. Res. 2021, 4, 2. [Google Scholar] [CrossRef]
- Wu, C.; Zeng, A.; Chen, P.; Hummer, W.; Mokua, J.; Shannon, J.G.; Nguyen, H.T. Evaluation and development of flood-tolerant soybean cultivars. Plant Breed. 2017, 136, 913–923. [Google Scholar] [CrossRef]
- Tamang, B.G.; Magliozzi, J.O.; Maroof, M.A.S.; Fukao, T. Physiological and transcriptomic characterization of submergence and reoxygenation responses in soybean seedlings. Plant. Cell Environ. 2014, 37, 2350–2365. [Google Scholar] [CrossRef] [PubMed] [Green Version]
- Sullivan, M.; VanToai, T.; Fausey, N.; Beuerlein, J.; Parkinson, R.; Soboyejo, A. Evaluating on-farm flooding impacts on soybean. Crop Sci. 2001, 41, 93–100. [Google Scholar] [CrossRef] [Green Version]
- Smith, G.S.; Wyllie, T.D.; Hartmann, G.L.; Sinclair, J.B.; Rupe, J.C. (Eds.) Compendium of Soybean Diseases, 4th ed.; American Phytopathological Society Press: St. Paul, MN, USA, 1999; pp. 29–31. [Google Scholar]
- Smith, R.M.; Kaur, G.; Orlowski, J.M.; Singh, G.; Chastain, D.; Irby, T.; Krutz, L.J.; Falconer, L.; Smith, D.R.C. Narrow-Row Production System for Soybeans in Mississippi Delta. Crop. Forage Turfgrass Manag. 2019, 5. [Google Scholar] [CrossRef] [Green Version]
- Plumblee, M.T.; Dodds, D.M.; Krutz, L.J.; Catchot Jr, A.L.; Irby, J.T.; Jenkins, J.N. Determining the optimum irrigation schedule in furrow irrigated cotton using soil moisture sensors. Crop. Forage Turfgrass Manag. 2019, 5, 1–6. [Google Scholar] [CrossRef]
- Pettigrew, W.T. Twin-row production of cotton genotypes varying in leaf shape. J. Cotton Sci. 2015, 19, 319–327. [Google Scholar]
- Desclaux, D.; Roumet, P. Impact of drought stress on the phenology of two soybean (Glycine max L. Merr) cultivars. Field Crops Res. 1996, 46, 61–70. [Google Scholar] [CrossRef]
- Kukal, M.S.; Irmak, S.U.S. Agro-Climate in 20th Century: Growing Degree Days, First and Last Frost, Growing Season Length, and Impacts on Crop Yields. Sci. Rep. 2018, 8. [Google Scholar] [CrossRef]
- Müller, M.; Rakocevic, M.; Caverzan, A.; Chavarria, G. Grain Yield Differences of Soybean Cultivars Due to Solar Radiation Interception. Am. J. Plant Sci. 2017, 8, 2795–2810. [Google Scholar] [CrossRef] [Green Version]
- Mengistu, A. Seasonal Progress of Phomopsis longicolla Infection on Soybean Plant Parts and Its Relationship to Seed Quality. Plant Dis. 2009, 93, 1009–1018. [Google Scholar] [CrossRef] [Green Version]
- Bellaloui, N.; Smith, J.R.; Ray, J.D.; Gillen, A.M. Effect of maturity on seed composition in the early soybean production system as measured on near-isogenic soybean lines. Crop Sci. 2009, 49, 608–620. [Google Scholar] [CrossRef] [Green Version]
- He, J.; Jin, Y.; Turner, N.C.; Li, F.-M. Irrigation during flowering improves subsoil water uptake and grain yield in rainfed soybean. Agronomy 2020, 10, 120. [Google Scholar] [CrossRef] [Green Version]
- Wang, X.; Wu, X.; Ding, G.; Yang, F.; Yong, T.; Wang, X.; Yang, W. Analysis of Grain Yield Differences among Soybean Cultivars under Maize–Soybean Intercropping. Agronomy 2020, 10, 110. [Google Scholar] [CrossRef] [Green Version]
- Sampaio Ferreira, A.; Antonio Balbinot Junior, A.; Werner, F.; Zucareli, C. Yield performance of soybean cultivars with indeterminate growth habits in response to plant spatial arrangement Desempenho produtivo de cultivares de soja de crescimento indeterminado em resposta a arranjos espaciais de plantas. Embrapa Soja-Artigo em Periódico Indexado 2019, 40, 2905–2916. [Google Scholar] [CrossRef]
- Thompson, N.M.; Larson, J.A.; Lambert, D.M.; Roberts, R.K.; Mengistu, A.; Bellaloui, N.; Walker, E.R. Mid-south soybean yield and net return as affected by plant population and row spacing. Agron. J. 2015, 107, 979–989. [Google Scholar] [CrossRef]
- Smith, J.R.; Mengistu, A.; Nelson, R.L.; Paris, R.L. Identification of soybean accessions with high germinability in high-temperature environments. Crop Sci. 2008, 48, 2279–2288. [Google Scholar] [CrossRef]
- Aydinsakir, K. Yield and quality characteristics of drip-irrigated soybean under different irrigation levels. Agron. J. 2018, 110, 1473–1481. [Google Scholar] [CrossRef]
Figure 1.
Measured (a) air temperature, (b) precipitation, (c) daily and cumulative growing degree days (GDD), and (d) solar radiation for 2019 and 2020 soybean growing seasons at Stoneville, MS. AGDD = Aggregate GDD over a crop season.
Figure 1.
Measured (a) air temperature, (b) precipitation, (c) daily and cumulative growing degree days (GDD), and (d) solar radiation for 2019 and 2020 soybean growing seasons at Stoneville, MS. AGDD = Aggregate GDD over a crop season.

Figure 2.
Leaf area index variability in the three cultivars viz., S14-16306, S12-1362, and DT97-4290 in rainfed and irrigated conditions during 2019 and 2020. Each data point represents five readings and three replications. A global curve was fitted to the measured LAI using Sigma Plot v14.
Figure 2.
Leaf area index variability in the three cultivars viz., S14-16306, S12-1362, and DT97-4290 in rainfed and irrigated conditions during 2019 and 2020. Each data point represents five readings and three replications. A global curve was fitted to the measured LAI using Sigma Plot v14.

Figure 3.
Leaf area index variability in the four soybean cultivars viz., DS25-1, Dyna-gro 4516x, LG03-4561-14, and P37A78 in rainfed and irrigated conditions during 2019 and 2020. Each data point represents five readings and three replications. A global curve was fitted to the measured LAI using Sigma Plot v14.


Table 1.
Key characteristics of the soybean cultivars and their maturity groups used in the study.
| S. No. | Maturity Group | Genotype | Important Trait(s) | Source |
|---|---|---|---|---|
| 1 | III | LG03-4561-14 | High temperature stress tolerance | USDA-ARS |
| 2 | P37A78 | Roundup ready hybrid | Pioneer | |
| 3 | IV | DT97-4290 | Charcoal rot tolerance | USDA-ARS |
| 4 | DS25-1 | Drought tolerance | USDA-ARS | |
| 5 | Dyna-gro 4516x | Popular cultivar in MS Delta | Loveland Inc (Dyna-gro Seed) | |
| 6 | V | S14-16306 * | Flood tolerance | University of Missouri |
| 7 | S12-1362 * | Flood tolerance | University of Missouri |
* Not released.
Table 2.
Selected soil (Dundee silt loam) physical and chemical properties of the experimental site in Stoneville, MS, in 2019 and 2020.
Table 2.
Selected soil (Dundee silt loam) physical and chemical properties of the experimental site in Stoneville, MS, in 2019 and 2020.
| Crop Season | Soil Depth, cm | Soil Texture | pH | Organic Matter, % | CEC, Meq 100 g−1 | Mehlich-3 Extractable Nutrients, mg Kg−1 | ||||||
|---|---|---|---|---|---|---|---|---|---|---|---|---|
| P | K | Ca | Mg | Zn | S | Cu | ||||||
| 2019 | 0–15 | Clay | 7.22 | 1.88 | 24.6 | 68 | 288 | 6677 | 1245 | 2.5 | 9.9 | 3.8 |
| 15–30 | Clay | 6.98 | 1.85 | 26.6 | 49 | 406 | 7185 | 1221 | 2.9 | 11.3 | 5.4 | |
| 30–45 | Clay | 6.88 | 1.47 | 25.3 | 28 | 242 | 4122 | 669 | 2.2 | 20.1 | 4.2 | |
| 2020 | 0–15 | Clay | 7.12 | 1.96 | 24.8 | 55 | 384 | 1636 | 1155 | 2.4 | 9.5 | 4.0 |
| 15–30 | Clay | 6.93 | 1.83 | 25.8 | 44 | 252 | 4243 | 938 | 2.5 | 6.8 | 5.2 | |
| 30–45 | Clay | 6.85 | 1.52 | 25.7 | 30 | 241 | 3865 | 902 | 2.0 | 18.6 | 3.9 | |
Table 3.
Phenology of the maturity group III, IV, and V improved soybean cultivars during 2019–2020 crop seasons at Stoneville MS.
Table 3.
Phenology of the maturity group III, IV, and V improved soybean cultivars during 2019–2020 crop seasons at Stoneville MS.
| Phenological Stage | MG III | MG IV | MG V | |||||||||||
|---|---|---|---|---|---|---|---|---|---|---|---|---|---|---|
| LG03-4561-14 | P37A78 | DT97-4290 | DS25-1 | Dyna-Gro 4516x | S14-16306 | S12-1362 | ||||||||
| 2019 | 2020 | 2019 | 2020 | 2019 | 2020 | 2019 | 2020 | 2019 | 2020 | 2019 | 2020 | 2019 | 2020 | |
| VE | 4 | 4 | 4 | 4 | 4 | 5 | 5 | 4 | 4 | 4 | 5 | 5 | 5 | 5 |
| VC | 12 | 10 | 12 | 10 | 12 | 11 | 11 | 12 | 12 | 11 | 13 | 11 | 13 | 11 |
| V1 | 16 | 14 | 16 | 14 | 16 | 16 | 16 | 16 | 16 | 16 | 17 | 16 | 17 | 16 |
| V2 | 20 | 18 | 20 | 18 | 20 | 21 | 21 | 20 | 20 | 20 | 20 | 21 | 20 | 21 |
| V3 | 25 | 22 | 25 | 22 | 26 | 26 | 26 | 26 | 26 | 25 | 27 | 26 | 27 | 26 |
| V4 | 31 | 25 | 31 | 25 | 33 | 29 | 29 | 32 | 32 | 28 | 33 | 32 | 33 | 32 |
| V5 | 40 | 31 | 40 | 31 | 44 | 37 | 37 | 42 | 42 | 35 | 44 | 40 | 44 | 40 |
| V6 | 43 | 37 | 43 | 37 | 47 | 43 | 43 | 45 | 45 | 41 | 48 | 47 | 48 | 47 |
| R1 | 48 | 42 | 48 | 42 | 52 | 49 | 49 | 48 | 48 | 46 | 53 | 53 | 53 | 53 |
| R2 | 53 | 46 | 53 | 46 | 57 | 54 | 54 | 55 | 55 | 49 | 58 | 54 | 58 | 54 |
| R3 | 56 | 50 | 56 | 50 | 61 | 57 | 57 | 58 | 58 | 51 | 62 | 61 | 62 | 61 |
| R4 | 59 | 54 | 59 | 54 | 65 | 63 | 61 | 62 | 62 | 58 | 66 | 68 | 66 | 68 |
| R5 | 62 | 66 | 62 | 66 | 68 | 73 | 70 | 64 | 64 | 61 | 72 | 78 | 69 | 78 |
| R6 | 66 | 62 | 66 | 62 | 72 | 79 | 76 | 69 | 69 | 71 | 81 | 85 | 78 | 85 |
| R7 | 75 | 72 | 75 | 71 | 81 | 94 | 89 | 78 | 78 | 83 | 95 | 102 | 88 | 101 |
| R8 | 96 | 92 | 95 | 90 | 107 | 105 | 102 | 101 | 101 | 97 | 128 | 118 | 124 | 115 |
V = vegetative stage numbered from 1 and 10; R = reproductive stage numbered between 1 and 8; Days taken after sowing were given for each stage.
Table 4.
Significance of the main effects of cultivars, irrigation regimes, and year, and their interactions.
Table 4.
Significance of the main effects of cultivars, irrigation regimes, and year, and their interactions.
| Source of Variance | df | Population (no. m−2) | Plant Height | Nodes per Plant | Pods per Plant | Lodging Score | Biomass | Seed Yield | Test Weight | Harvest Index |
|---|---|---|---|---|---|---|---|---|---|---|
| Cultivars | 6 | 0.254 | 0.001 * | <0.001 * | <0.001 * | <0.001 * | 0.005 * | 0.001 * | <0.001 * | 0.045 * |
| Irrigation level | 1 | 0.289 | 0.002 * | <0.001 * | <0.001 * | <0.001 * | <0.002 * | <0.001 * | <0.001 * | 0.001 * |
| Year | 1 | 0.0004 * | 0.015 * | 1.004 | 0.059 | 0.0825 | <0.001 * | 0.004 * | 0.0482 * | 0.045 * |
| Cultivars | 6 | 0.0002 * | 0.002 * | 0.015 * | <0.001 * | 0.0042 * | 0.611 | 0.976 | 0.007 * | 0.652 |
| Cultivars X Year | 6 | 0.0038 * | 0.086 | 0.915 | 1.005 | 0.247 | 0.003 | 0.0519 | 0.691 | 0.983 |
| Irrigation level X Year | 1 | 0.070 | 0.598 | 1.421 | 1.214 | 0.0874 | 0.516 | 0.001 * | 0.961 | 0.946 |
| Cultivar X Irrigation level X Year | 6 | 0.541 | 1.287 | 1.000 | 1.221 | 0.252 | 0.335 | 0.001 * | 0.586 | 0.754 |
* Significantly different at p ≤ 0.05 level.
Table 5.
Soybean cultivar population, above ground biomass, grain yield components, plant height, and harvest index grown in Dundee silt loam under irrigated (IR) and rainfed (RF) conditions.
Table 5.
Soybean cultivar population, above ground biomass, grain yield components, plant height, and harvest index grown in Dundee silt loam under irrigated (IR) and rainfed (RF) conditions.
| Genotype | Irrigation Level | Population, (No. m−2) | Plant Height, (cm) | Nodes per Plant | Pods per Plant | Biomass, (Mg ha−1) | Seed Yield, (Mg ha−1) | Test Weight, (g) | Harvest Index | ||||||||
|---|---|---|---|---|---|---|---|---|---|---|---|---|---|---|---|---|---|
| 2019 | 2020 | 2019 | 2020 | 2019 | 2020 | 2019 | 2020 | 2019 | 2020 | 2019 | 2020 | 2019 | 2020 | 2019 | 2020 | ||
| S14-16306 (MG V) | IR | 22.5 a | 19.0 b | 72.8 d | 88.9 d | 13.3 c | 14.0c | 87.0 b | 82.2 b | 7.5b | 7.9 b | 3.23 d | 3.06 d | 17.1 c | 17.0 d | 0.43 b | 0.40 d |
| RF | 22.0 a | 20.0 a | 74.5 d | 85.5 d | 11.7 d | 12.5d | 68.7 d | 68.4 c | 7.1b | 6.7 c | 3.01 d | 2.72 d | 16.9 d | 16.7 d | 0.42 b | 0.41 d | |
| S12-1362 (MG V) | IR | 20.7 a | 19.3 b | 128.8 a | 159.2 a | 15.3 b | 15.0b | 72 d | 71.6 c | 7.7b | 8.3 b | 3.73 b | 3.18 c | 18.9 c | 17.5 d | 0.48 b | 0.45 c |
| RF | 19.0 a | 20.7 a | 81.4 c | 136.3 a | 14.0 c | 14.6c | 65.0 d | 66.6 c | 6.7d | 6.1 b | 3.46 c | 2.88 b | 16.1 d | 15.9 e | 0.47 b | 0.43 d | |
| DT97-4290 (MG III) | IR | 19.5 a | 18.7 b | 112.2 ab | 104.1 b | 16.7 a | 17.0a | 70.3 d | 85.7 b | 8.0b | 6.8 c | 3.87 b | 3.67 c | 19.1 b | 18.7 c | 0.51 a | 0.54 a |
| RF | 20.3 a | 21.0 a | 107.1 ab | 105.0 b | 15.3 b | 16.3a | 80.3 c | 81.5 b | 7.1c | 5.6 d | 3.55 c | 3.31 c | 18.4 c | 18.2 c | 0.48 a | 0.59 a | |
| DS25-1 (MG IV) | IR | 21.0 a | 17.0 c | 90.8 bc | 136.3 a | 16.0 a | 16.5a | 122 a | 86.6 b | 9.1a | 7.3 b | 4.31 a | 3.93 b | 18.9 c | 18.8 c | 0.47 a | 0.52 b |
| RF | 19.3 a | 17.3 c | 88.2 c | 109.2 b | 14.3 b | 14.6c | 70.7 d | 98 a | 8.3b | 6.9 c | 4.07 a | 3.64 c | 18.6 c | 18.3 c | 0.52 a | 0.50 b | |
| Dyna-gro 4516X (MG III) | IR | 19.3 a | 16.3 c | 96.8 b | 105.8 b | 16.0 a | 16.5a | 89.2 b | 66.8 c | 8.3b | 8.7 a | 4.58 a | 4.74 a | 20.9 a | 20.8 a | 0.55 a | 0.54 a |
| RF | 19.3 a | 17.0 c | 79.7 c | 104.1 b | 16.7 a | 16.1a | 69.0 d | 55 d | 7.1c | 8.3 b | 3.89 b | 4.35 a | 20.7 a | 20.4 a | 0.55 a | 0.53 b | |
| LG03-4561-14 (MG IV) | IR | 19.0 a | 18.7 b | 90.0 bc | 86.4 d | 16.7 a | 16.0a | 85.3 b | 88.4 b | 9.2a | 7.8 b | 4.42 a | 4.37 a | 19.7 b | 19.8 b | 0.51 a | 0.56 a |
| RF | 19.2 a | 17.3 c | 92.5 bc | 83.8 d | 14.3 b | 14.5c | 59.3 e | 63.2 c | 7.6b | 7.0 c | 3.91 b | 3.75 b | 19.5 b | 19.3 b | 0.48 a | 0.54 a | |
| P37A78 (MG III) | IR | 21.3 a | 21.7 a | 108.8 ab | 110.9 b | 17.0 a | 16.8a | 98.5 b | 69.7 c | 7.6b | 8.2 b | 4.25 a | 4.46 a | 20.8 a | 20.9 a | 0.56 a | 0.54 a |
| RF | 19.3 a | 20.3 a | 100.2 ab | 97.4 c | 15.0 b | 15.5b | 84.7 b | 64.5 c | 7.1c | 7.5 b | 3.81 b | 4.01 b | 20.1 b | 19.9 b | 0.54 a | 0.53 a | |
Means followed by the same letter or letters are not statistically different by LSD means (p ≤ 0.05).
Table 6.
Water use efficiency (WUE) for seed yield and aboveground biomass of maturity group III, IV, and V soybean cultivars in irrigated and rainfed treatments. Precipitation recorded in 2019 active crop season was 638 mm, and 2020 was 272 mm.
Table 6.
Water use efficiency (WUE) for seed yield and aboveground biomass of maturity group III, IV, and V soybean cultivars in irrigated and rainfed treatments. Precipitation recorded in 2019 active crop season was 638 mm, and 2020 was 272 mm.
| Maturity Group | Cultivar | Irrigation Level | Seed Yield (Mg ha−1) | Irrigation Water Applied (mm) | WUEg (kg ha−1 mm−1) | WUEb (kg ha−1 mm−1) | Yield Increase by Irrigation (%) | |||||
|---|---|---|---|---|---|---|---|---|---|---|---|---|
| 2019 | 2020 | 2019 | 2020 | 2019 | 2020 | 2019 | 2020 | 2020 | 2020 | |||
| V | S14-16306 | IR | 3.23 | 3.06 | 73 | 98 | 4.5e | 8.3e | 12.0b | 21.4d | 7.31d | 12.50b |
| RF | 3.01 | 2.72 | 4.7e | 10.0d | 12.7b | 24.6c | ||||||
| V | S12-1362 | IR | 3.73 | 3.18 | 73 | 98 | 5.3d | 8.6e | 10.9c | 22.6c | 7.80d | 10.42c |
| RF | 3.46 | 2.88 | 5.4d | 10.7d | 10.6c | 30.0a | ||||||
| IV | DT97-4290 | IR | 3.87 | 3.67 | 73 | 98 | 5.9c | 10.3d | 12.3b | 19.2d | 9.01d | 10.88b |
| RF | 3.55 | 3.31 | 6.1c | 12.9c | 12.2b | 21.8d | ||||||
| IV | DS25-1 | IR | 4.31 | 3.93 | 73 | 98 | 6.6b | 11.1c | 13.9a | 20.6d | 5.90e | 7.97d |
| RF | 4.07 | 3.64 | 7.0a | 14.2b | 14.3a | 23.0c | ||||||
| IV | Dyna-gro 4516x | IR | 4.58 | 4.74 | 73 | 98 | 7.2a | 13.4b | 13.0b | 24.5c | 17.74a | 8.97d |
| RF | 3.89 | 4.35 | 6.9a | 16.9a | 12.6b | 32.3a | ||||||
| III | LG03-4561-14 | IR | 4.42 | 4.37 | 73 | 98 | 6.9a | 12.3c | 14.5a | 22.0c | 13.04b | 16.53a |
| RF | 3.91 | 3.75 | 6.9a | 14.6b | 13.5a | 27.2b | ||||||
| III | P37A78 | IR | 4.25 | 4.46 | 73 | 98 | 6.7b | 12.6c | 11.9b | 23.1c | 11.55c | 11.22b |
| RF | 3.81 | 4.01 | 6.8b | 15.6a | 12.6b | 29.2b | ||||||
WEUg: Water use efficiency for grain yield; WEUb: Water use efficiency for biomass yield; IR: irrigated; RF: rainfed.
Publisher’s Note: MDPI stays neutral with regard to jurisdictional claims in published maps and institutional affiliations. |
© 2021 by the authors. Licensee MDPI, Basel, Switzerland. This article is an open access article distributed under the terms and conditions of the Creative Commons Attribution (CC BY) license (https://creativecommons.org/licenses/by/4.0/).
Share and Cite
MDPI and ACS Style
Pinnamaneni, S.R.; Anapalli, S.S.; Fisher, D.K.; Reddy, K.N. Water Use Efficiencies of Different Maturity Group Soybean Cultivars in the Humid Mississippi Delta. Water 2021, 13, 1496. https://doi.org/10.3390/w13111496
AMA Style
Pinnamaneni SR, Anapalli SS, Fisher DK, Reddy KN. Water Use Efficiencies of Different Maturity Group Soybean Cultivars in the Humid Mississippi Delta. Water. 2021; 13(11):1496. https://doi.org/10.3390/w13111496
Chicago/Turabian StylePinnamaneni, Srinivasa R., Saseendran S. Anapalli, Daniel K. Fisher, and Krishna N. Reddy. 2021. "Water Use Efficiencies of Different Maturity Group Soybean Cultivars in the Humid Mississippi Delta" Water 13, no. 11: 1496. https://doi.org/10.3390/w13111496
Note that from the first issue of 2016, this journal uses article numbers instead of page numbers. See further details here.