
Assessing the Impact of Operating Conditions on the Energy and Exergy Efficiency for Multi-Effect Vacuum Membrane Distillation Systems


1
Mechanical Engineering Department, King Saud University, Riyadh 11451, Saudi Arabia
2
Chemical Engineering Department, King Saud University, Riyadh 11451, Saudi Arabia
*
Author to whom correspondence should be addressed.
†
KA.CARE Energy Research and Innovation Center at Riyadh, Riyadh 11451, Saudi Arabia.
Water 2021, 13(11), 1500; https://doi.org/10.3390/w13111500
Submission received: 21 April 2021
/
Revised: 18 May 2021
/
Accepted: 20 May 2021
/
Published: 27 May 2021
(This article belongs to the Section Wastewater Treatment and Reuse)
Abstract
:A comprehensive study was conducted to elucidate the effect of operating conditions on the performance of a multi-effect vacuum membrane distillation pilot plant. A theoretical assessment of the energy and exergy efficiency of the process was achieved using a mathematical model based on heat and mass transfer, which was calibrated using experimental data obtained from the pilot plant. The pilot plant was a solar vacuum multi-effect membrane distillation (V-MEMD) module comprising five stages. It was found that a maximal permeate mass flux of 17.2 kg/m2·h, a recovery ratio of 47.6%, and a performance ratio of 5.38% may be achieved. The resulting gain output ratio (GOR) under these conditions was 5.05, which is comparable to previously reported values. Furthermore, the present work systematically evaluated not only the specific thermal energy consumption (STEC), but also the specific electrical energy consumption (SEEC), which has been generally neglected in previous studies. We show that STEC and SEEC may reach 166 kWh/m3 and 4.5 kWh/m3, respectively. We also observed that increasing the feed flow rate has a positive impact on the process performance, particularly when the feed temperature is higher than 65 °C. Under ideal operational conditions, the exergetic efficiency reached 21.1%, and the maximum fraction of exergy destruction was localized in the condenser compartment. Variation of the inlet hot and cold temperatures at a constant differential showed an interesting and variable impact on the performance indicators of the V-MEMD unit. The difference with the lowest inlet temperatures exhibited the most negative impact on the system performance.
1. Introduction
The demand for freshwater is becoming a central issue for several countries worldwide. Desalination represents a viable solution to provide potable water from a variety of available sources; however, the use of conventional desalination technologies powered by fossil fuels results in high energy consumption and negative environmental impacts. Therefore, there is a high degree of interest in the development of efficient water purification systems with low energy requirements and reduced environmental impacts. Attempts to couple sustainable energy sources (i.e., solar energy, geothermal energy, and waste energy) to desalination systems are increasing. Solar desalination has been identified as an attractive example of renewable energy integrated to drive desalination processes. Toward this goal, several experimental and theoretical studies have been conducted on various aspects of solar desalination [1].
Membrane distillation (MD), a trans-membrane evaporation process used to purify water, is a hybrid of thermally-driven desalination processes and membrane separation processes [2]. The driving force for the MD separation process is the vapor pressure gradient across the membrane, as opposed to the total pressure, as is the case for reverse osmosis processes [3,4]. In the last few decades, MD has gained growing attention, as indicated by numerous theoretical, experimental, and field studies showing, for example, its potential to purify concentrated brines at a low energy cost [4]. However, the process still has major limitations impeding its development and industrial progress [3,5]. Current limitations are generally related to the high specific energy consumption, low recovery ratio, and low production rate for single-stage structures [3,4]. To address such issues, several attempts have been recently made to incorporate energy recovery devices, employ novel membranes and configurations/geometries, control membrane wetting and fouling, and utilize renewable energy and waste heat sources [3,4].
Several pilot systems have been designed and constructed for membrane distillation powered by solar energy. Data and results reflecting the performance of MD systems in terms of production recovery ratio and energy efficiency under various operating conditions have been analyzed [5,6,7,8]. Bouguecha et al. [5] investigated the performance and the thermal energy efficiency of a direct contact membrane distillation system (DCMD) integrated with solar collectors. The DCMD plant includes four units: solar collectors with a total area of 20 m2, PV panels with a peak output of 1.48 kWpeak, three DCMD modules with a total area of 3.39 m2, and a thermal sink with a cooling water capacity of 103 L/h. The impact of adding a heat recovery device (HRD) on the solar desalination performance was investigated. When the HRD was used, the distillate flow rate per module increased from 3.31 L/h to 4.59 L/h while the minimum specific thermal energy consumption (STEC) decreased from 2342 kW/m3 to 1609 kW/m3. Lee et al. [6] simulated the monthly average daily and hourly performances of a solar multi-stage direct contact membrane distillation (SM-DCMD) system under the weather conditions of Busan, South Korea. The simulations were conducted with energy recovery, and under steady-state and dynamic regimes. The results highlight the benefit of implementing a dynamic operation procedure for the unit. For instance, the monthly average daily water production for December increases from 0.37 to 0.40 m3/day and the thermal efficiency from 31% to 45% when the dynamic operation mode is used compared to the steady-state mode. Najib et al. [7] conducted a detailed experimental investigation on a direct contact membrane distillation (DCMD) unit with/without heat recovery (HR). In this study, they evaluated the specific energy consumption (SEC) and the specific exergy consumption (SXC) for the evaporator and the condenser under various experimental conditions to demonstrate the benefits of heat recovery. Importantly, it was found that the specific energy consumption and the specific exergy consumption do not exceed 300 kWh/m3 and 12 kWh/m3, respectively, when the hot feed temperature is 80 °C, the feed flow rate is 300 L/h, and the heat recovery is active. Ong et al. [8] conducted an experimental and theoretical study on the performance of a multi-effect vacuum membrane distillation system (V-MEMD) driven by waste heat recycled from a concentrated photovoltaic system. The electric power and water cogeneration system was found to convert 85% of the solar irradiation into useful energy. A solar-driven multi-effect V-MD called Memsys was proposed and experimentally evaluated by Zhao et al. [9]. The results showed the temporal variation of temperature, pressure, and distillate rate within the module as well as its energy efficiency under various hot, cold, and feed conditions.
The high level of energy consumption inherent to MD systems represents significant weaknesses for these separation technologies. Zaragoza et al. [10] evaluated a series of prototypes of different MD systems such as air gap MD, permeate gap MD, and multi-effect V-MD technologies with flat plate and spiral wound membranes. Systematic experiments have been conducted to evaluate and compare the distillate production and thermal energy efficiency of the majority of systems powered by solar thermal energy. Despite the fact that the specific thermal energy consumption (STEC) of the V-MEMD and Permeate Gap MD (PGMD) modules reach relatively low values of 200 kWh/m3, additional efforts toward optimal energy management and utilization within the modules are necessary to make these systems competitive.
The V-MEMD process has received increased attention from several research teams, and experimental studies have been recently conducted under indoor and outdoor conditions [11,12]. Mohamed et al. [13] investigated the performance of a V-MEMD system based on outdoor conditions of Athens. The evaluation of the main performance indicators shows that the system performance ratio ranges between 0.4 and 0.9 kg/MJ, the specific thermal energy consumption varies between 300 and 700 kWh/m3, and the gain output ratio recorded ranges between 1 to 2.2. A detailed theoretical study based on a rigorous mathematical model for heat and mass transfer in various parts of the V-MEMD unit has been proposed by Boutikos et al. [14]. The results show the effect of design parameters, membrane properties, and operating conditions on relevant performance indicators. Notably, the comparison between the predicted values from [15] and the experimental data obtained in [12] for distillate flux show minor deviations for tap water as the feed solution, but higher deviations (22%) for seawater.
Andrea-Manas et al. [11] examined a modified version of the V-MEMD-Memsys module using feed seawater to cool the condenser, obtaining slightly higher performance over earlier V-MEMD versions. Additionally, the use of a thermal storage system to minimize disturbances related to variable solar radiation assisted in the delivery of a stable temperature profile. However, a decline in performance for the average distillate rate (4 kg/h/m2) and STEC value (750 kWh/m3) was obtained. Najib et al. [12] experimentally investigated the performance of the V-MEMD unit operated by solar thermal collectors and photovoltage panels (PV) in Riyadh. Solar thermal collectors are utilized to heat the freshwater inside a thermal storage tank which supplies the V-MEMD unit with heat via a plate heat exchanger. The purpose of the PV panels is to provide the V-MEMD unit electrical energy. In the summer season, a high steam raiser temperature can be achieved, which supports increasing the productivity of the V-MEMD unit. The optimum values of the system performance indicators such as the productivity (Vd), permeate mass flux (J), recovery ratio (R), gain output ratio (GOR), specific thermal energy consumption (STEC), and specific electrical energy consumption for the V-MEMD unit reached 31.8 L/h, 12.2 kg/m2·h, 36.8%, 4.25, 150.9 kWh/m3, and 6.3 kWh/m3, respectively. Khayet [1] presented a comprehensive and critical review of energy consumption and water cost for solar desalination using membrane distillation. It was reported that the energy consumption per volumetric water production can change from 1 to about 9000 kWh/m3 for several MD systems. Furthermore, Zaragoza et al. [10] suggested energy consumption and prohibitive cost were the main barriers hindering membrane distillation from attaining a widespread commercial breakthrough. These indications demand a serious and critical examination of the actual energy requirement for MD-based desalination systems. Thus, it remains paramount to conduct further studies to assess MD performance in terms of production recovery ratio and energy efficiency.
Table 1 presents an updated summary of similar desalination units. It gathers useful information and data on V-MEMD unit performance parameters including water production, permeate mass flux, recovery ratio, gain output ratio, specific electrical energy consumption, and specific thermal energy consumption.
Based on the above-reviewed studies, one can conclude the following:
- Vacuum MD (VMD)has higher performance with respect to increased permeate mass flux and lower thermal losses [16].
- More work should be conducted to optimize the internal design of the VMD components and the energy use/recovery inside the module under various operating conditions.
- Significant dispersion within the specific energy consumption for desalinated water is observed and reported in various studies [1]. Therefore, a systematic evaluation of the energy consumption for solar VMD systems is required. Additionally, exergy should be also investigated to provide a more application-specific measure of the energy expended.
The present work aims to elucidate the energy use and efficiency in a Vacuum Multi-Effect Membrane Distillation unit. We outline a detailed theoretical analysis to characterize the behavior of the desalination system in terms of the energy and exergy expended under various operating conditions. The developed model, which is based on the conservation of mass and energy as well as the second law of thermodynamics, is validated using experimental data from a solar pilot unit located in Riyadh. The results of this study will permit a more straightforward evaluation of the behavior of V-MEMD systems through key indicators defined in terms of variation of the permeate mass flux, recovery ratio, gained output ratio, performance ratio, specific thermal energy consumption, specific electrical energy consumption, specific thermal exergy consumption, and exergetic efficiency. The rates and locations of the major points of irreversibility within the components of the desalination system are identified and discussed. A new parameter, the specific exergy efficiency, is introduced and explored. Additionally, this work specifically emphasizes the effects of various input parameters on the performance indicators, illuminating the favorable operation domain for the V-MEMD system.
2. Basic Principles of Multi-Effect Vacuum Membrane Distillation
Multi-effect membrane distillation combines the advantages of conventional multi-effect distillation (MED) processes with membrane separation processes in a compact, modular configuration under vacuum to provide potable water with minimal energy requirements. Basically, MD technologies are based on a non-isothermal process in which the driving force is the partial pressure gradient across a hydrophobic membrane. Heat is provided to the feed solution to achieve the latent heat needed for evaporation. Therefore, the heat and mass transfer processes are related in MD and occur in the same direction from the hot feed side to the cold (permeate) side. MD has major advantages that include its capability to treat highly concentrated waters, to be operated at low and moderate temperature and pressure and to have high-quality products. MD process is implemented under various configurations such as Direct Contact Membrane Distillation (DCMD), Air Gap Membrane Distillation (AGMD), Vacuum Membrane Distillation (VMD), and sweeping gas MD (SGMD). Other configurations recently proposed and investigated include Permeate Gap MD (PGMD) and Material Gap MD (MGMD). For the VMD configuration, a negative pressure (vacuum) is applied at the permeate side that is below the equilibrium vapor pressure. This negative pressure increases the vapor pressure difference across the membrane already present due to the temperature gradient, which results in additional permeate mass flux.
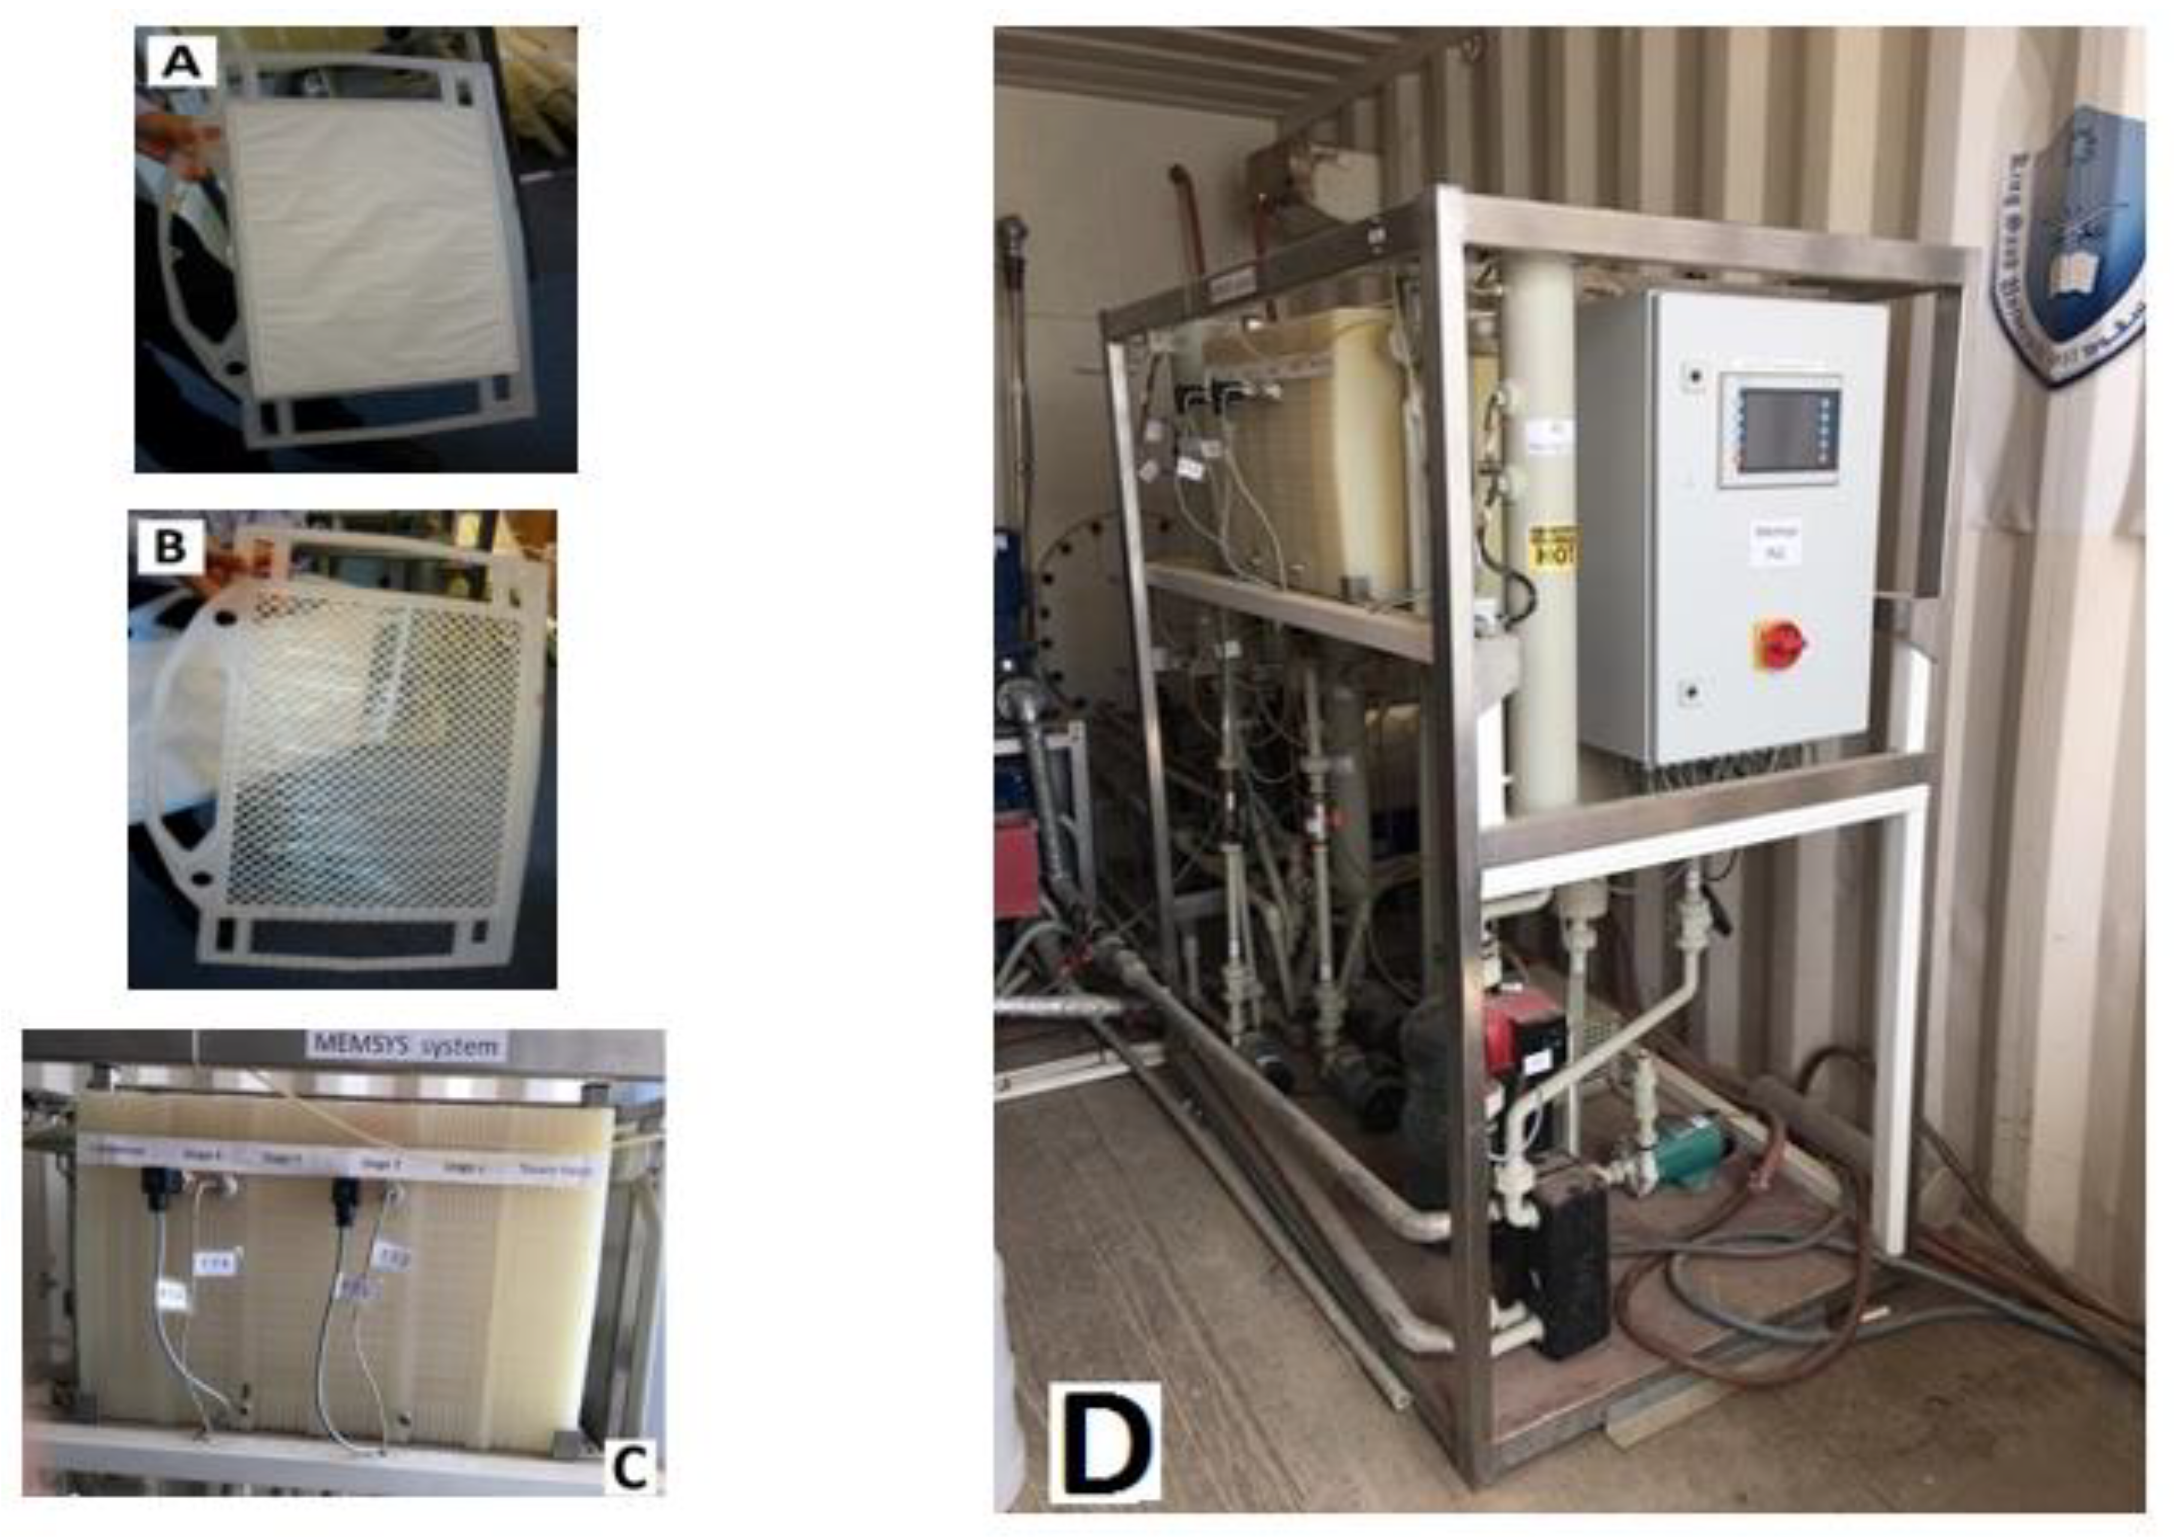
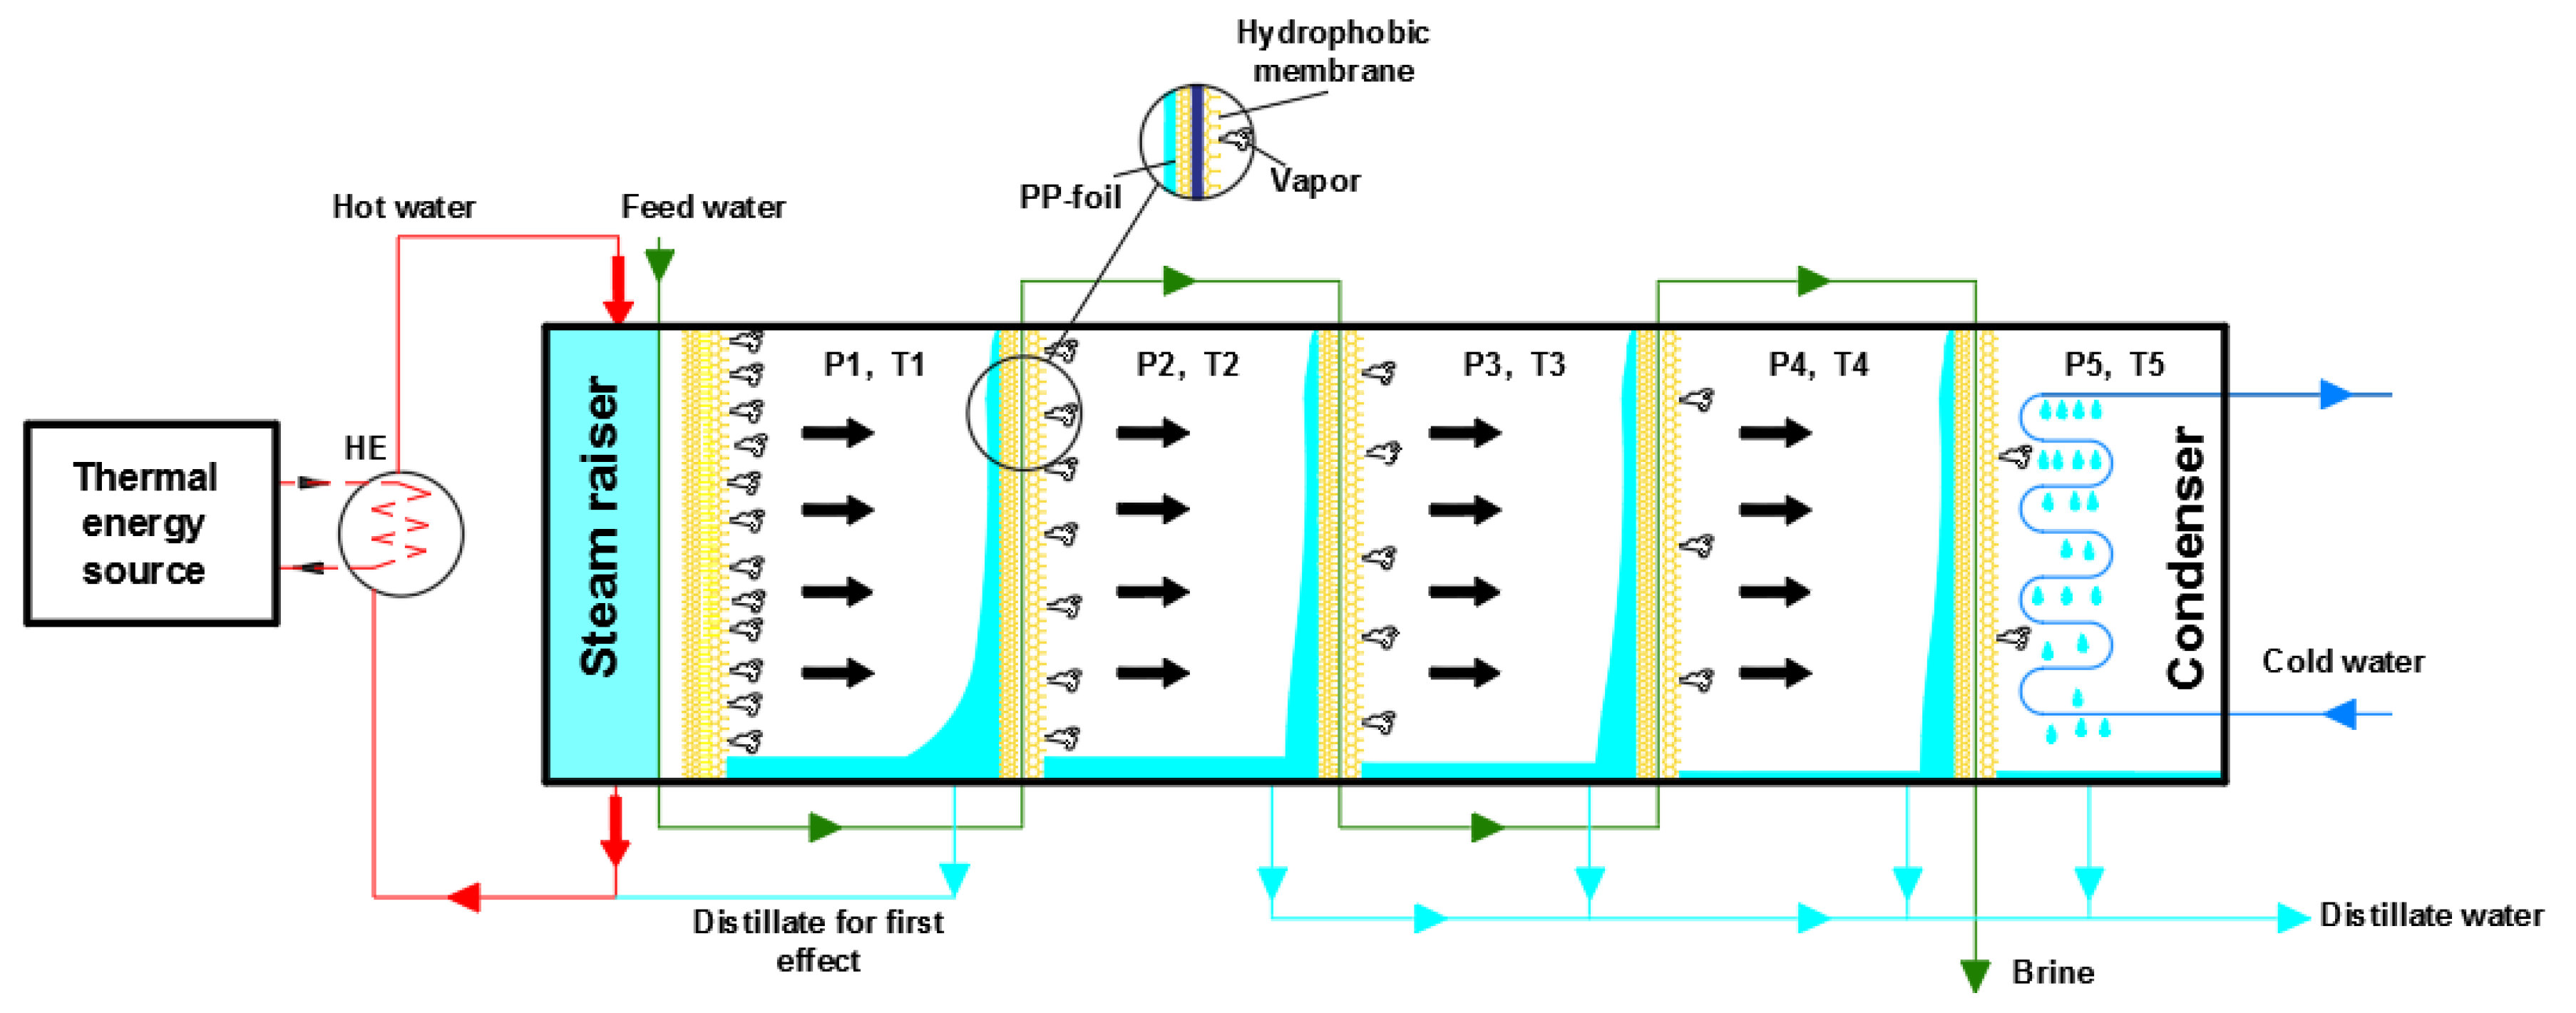
Figure 1 shows the major components of the vacuum multi-effect membrane distillation (V-MEMD) pilot module. The membrane and foil frames shown in Figure 1A,B refer to the stages of the module. Table 2 summarizes the main characteristics and specifications of the MD unit. Importantly, this specific V-MEMD module was employed to generate the necessary experimental data for validating the theoretical models. Figure 2 illustrates the working principles of V-MEMD. One may notice three main parts, namely, a steam raiser (evaporator), multiple effect stages (evaporation–condensation), and a condenser (Figure 1C). The steam raiser, which provides the thermal energy to the VMD module, is composed of several membrane frames and installed prior to the first stage. A plate heat exchanger is used to transfer the heat from the thermal storage tank to the steam raiser. The hot water in the steam raiser evaporates at low pressure (e.g., <200 mbar), and the produced steam is transmitted to the first stage of the MD unit. The V-MEMD system used in this work is composed of four stages (evaporation–condensation), where each stage recovers the latent condensation heat for the evaporation process at the next stage. This process is repeated in subsequent stages at decreasing temperatures. In a similar manner to the conventional thermal desalination processes, the number of stages defines the thermal efficiency of the process. The condenser, responsible for the condensation of the vapor formed in the final stage, is made of various foil frames.
3. Mathematical Modeling
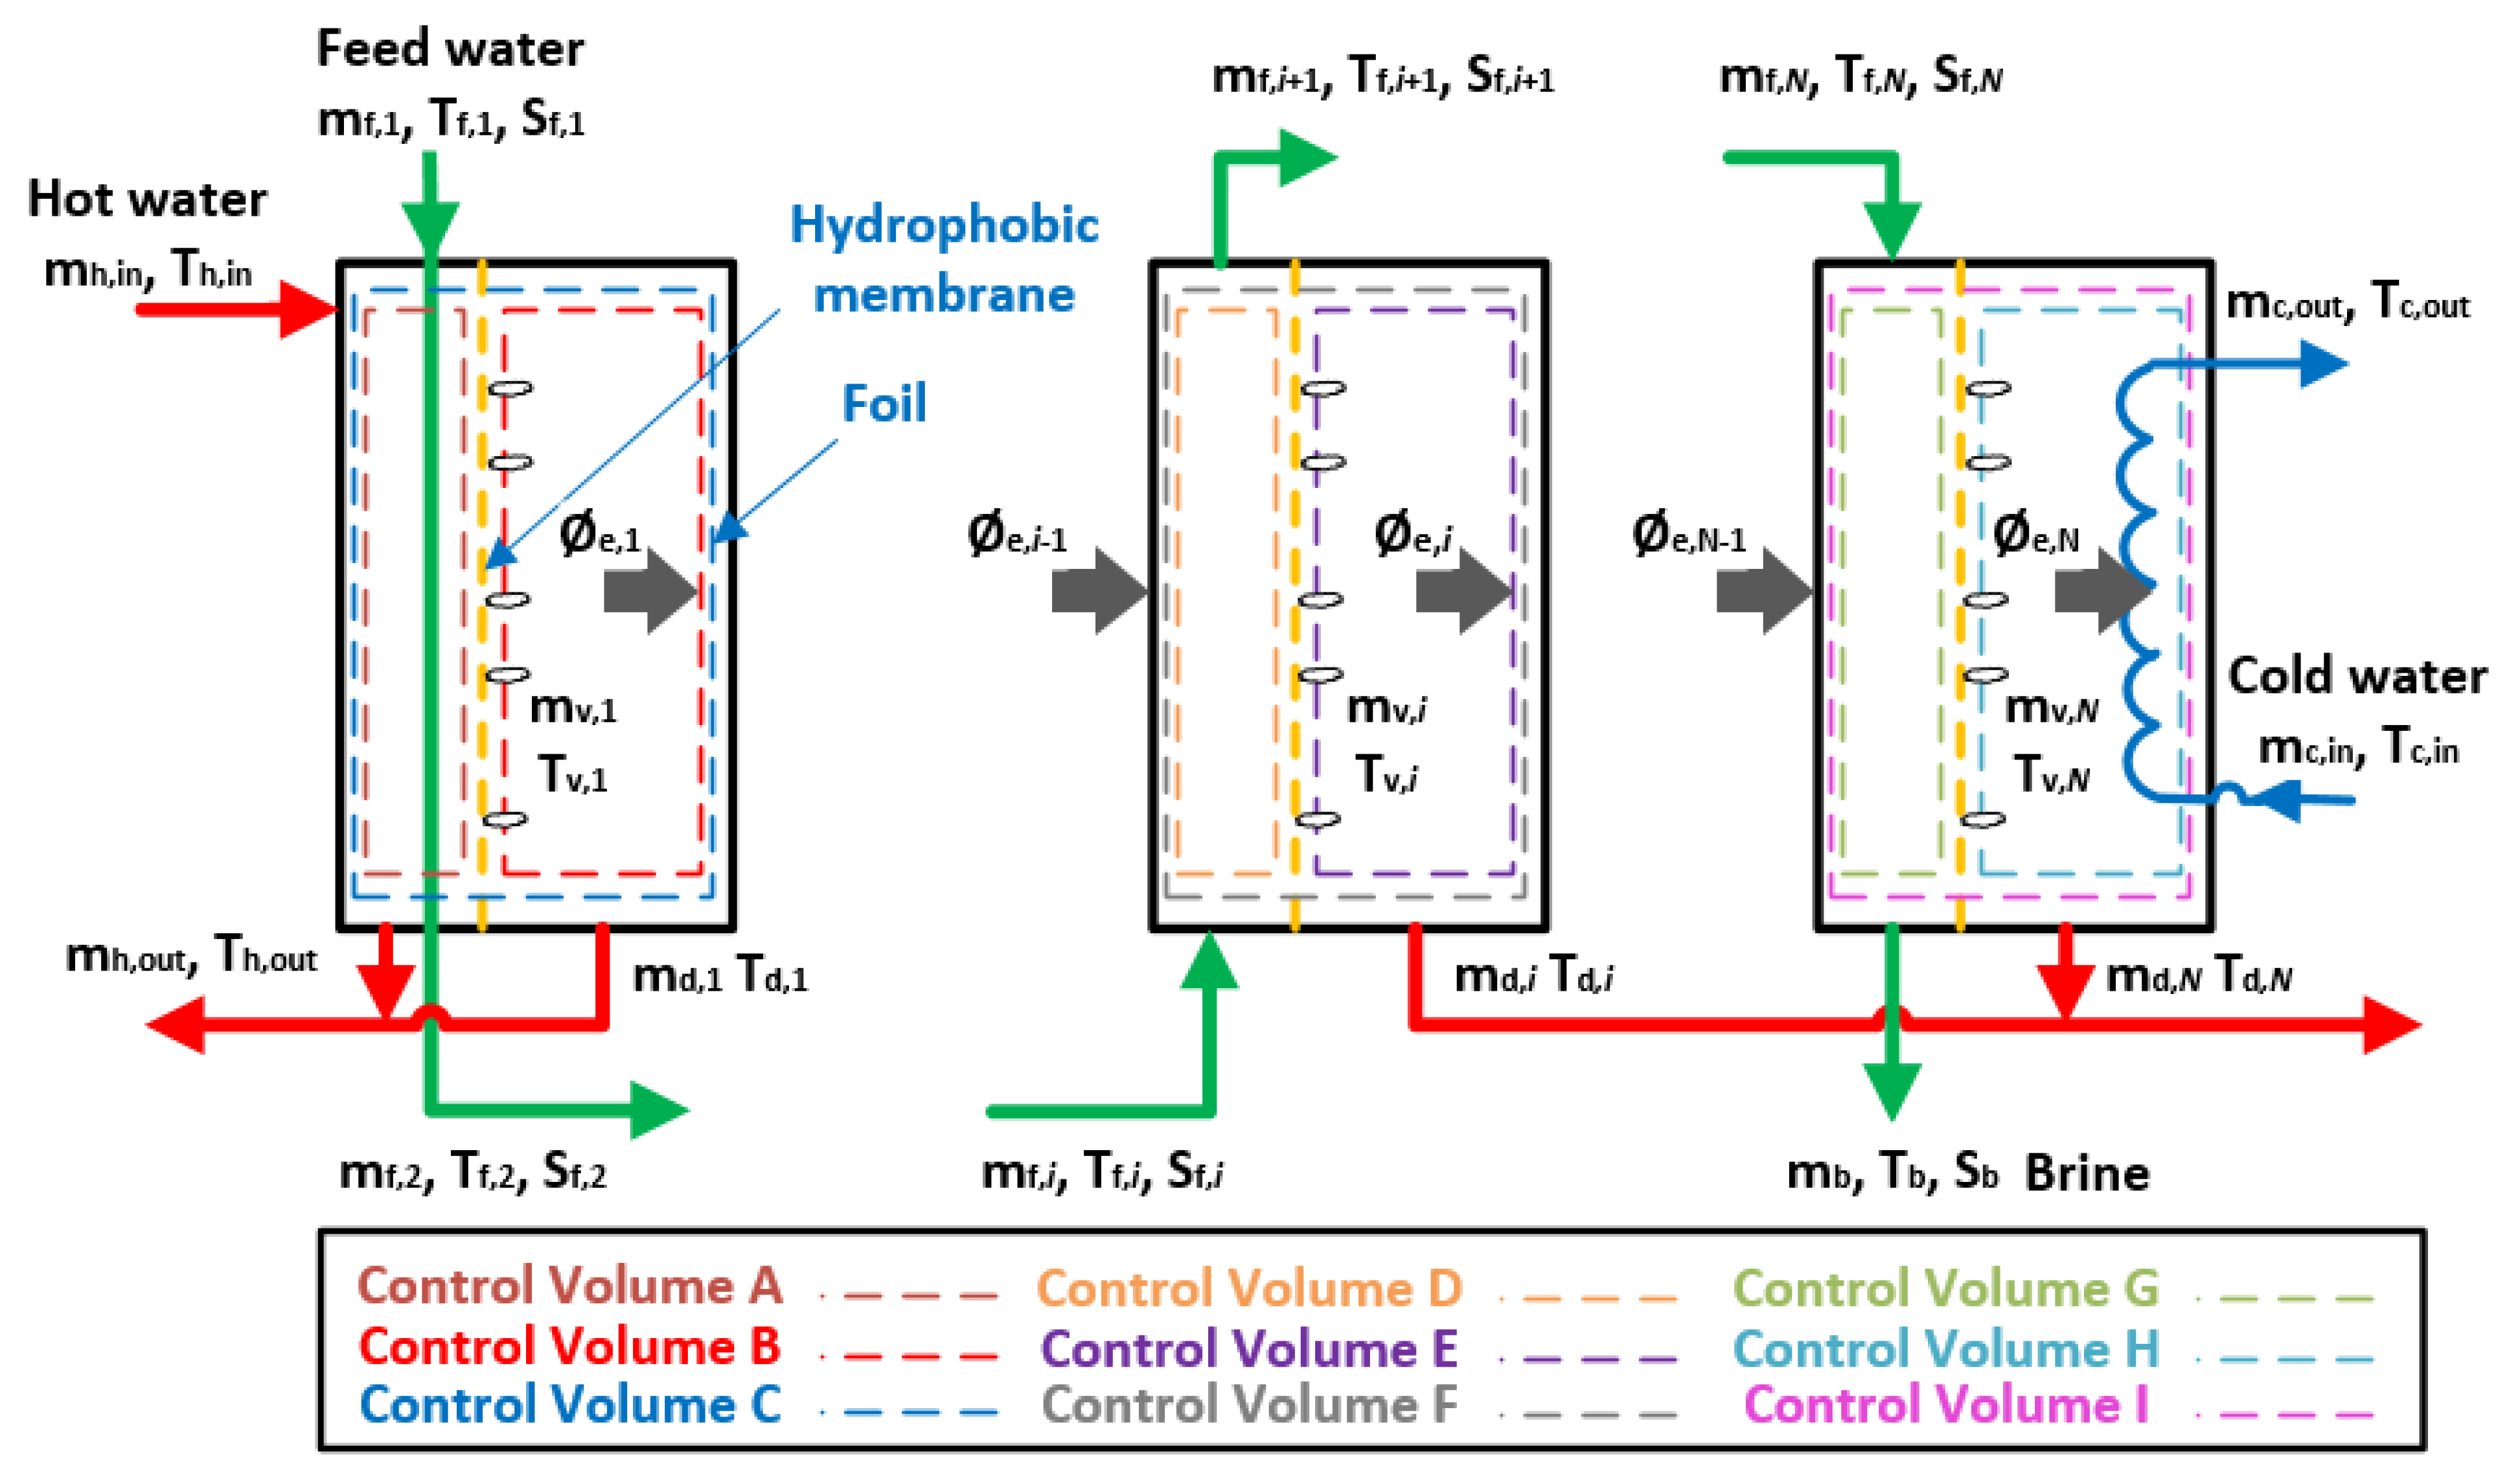
A theoretical model for the system described in Figure 1 and Figure 2 is built using the mass, energy, and entropy balances in each component of the V-MEMD system. Figure 3 shows a simplified schematic diagram and control volumes of the V-MEMD process for different streams and layers. The various streams are entering and leaving the steam raiser, the effects, and the condenser. The subscripts h, f, d, and c stand for hot water in the steam raiser, feed water, formed vapor, and cold water in the condenser, respectively. The following typical assumptions are made [16,20,21]:
- Flow, heat transfer, and mass transfer are assumed to be one-dimensional and stable throughout the V-MEMD system
- Kinetic and potential energy contributions are neglected
- The membrane is assumed to be homogeneous (i.e., uniform)
- Thermal terminal difference (TTD) in the steam raiser is taken as zero
- Viscous diffusion through the membrane is negligible
- The V-MEMD system is adiabatic, rigid, and does not exhibit fluid leakage
- All fluids properties are uniform across the effective area
- No chemical reactions are involved
- Homogeneity and thermal equilibrium are assumed in both effects and channels
- Pressure drop of feed flow is neglected
- Complete condensation is assumed
- Spacer-filled channel
3.1. Mass, Energy, and Entropy Balances
The conservation equations and the second law of thermodynamics under the above-mentioned assumptions have been developed using various control volumes of the V-MEMD system as shown in Figure 3. One can observe that the control volumes A, B, and C refer to the steam raiser, the control volumes D, E, and F to a typical effect, i, while control volumes G, H, and I stand for the condenser. Control volume (C) refers to the hot stream and the feed stream in the first compartment steam raiser (evaporator), as described in Figure 3. Through this control volume, the conservation equations and the second law of thermodynamics can be written as follows:
From control volume (A), one can write:
While from control volume (B), one obtains:
where and are the inlet and the outlet hot water flow rates, respectively. is the water feed rate. is the evaporated water rate across the membrane. and refer to the specific enthalpy of the hot water at the inlet and outlet of the steam raiser, respectively. and refer to the saturated liquid and saturated vapor enthalpies of distillate water, respectively. is the latent heat associated with the evaporated water, mv. stands for the entropy generation, and are the specific entropy of the hot water at the inlet and outlet of the steam raiser, respectively, and is the saturated liquid specific entropy.
It is of interest to check that when adding Equations (4) and (6), Equation (1) is obtained and when adding Equations (5) and (7), Equation (2) is obtained.
Using control volume F (Figure 3), similar mass, energy, and entropy balance equations for a typical effect, i, can be derived:
where the subscript i represents the effect number and is the temperature of foil. Thermodynamics properties were evaluated at the foil temperature and bulk salinity of the inlet feed stream.
Regarding the condenser compartment, there are slight differences in the balance equations due to the cold water stream. Therefore, one can write the corresponding balance equations as:
Writing the energy conservation equation using control volume H provides the link between the feed water of the upstream effects and the cold water stream:
This may be expressed accordingly as:
where is the cold water flow rate and is its specific heat. and are the cold water inlet and outlet temperature, respectively.
Since only water vapor molecules migrate through the membrane pores, the salt remains in the feed channel. Therefore, the salt balance equation may be written as follows:
where w refers to the salinity.
3.2. Mass and Heat Transfer
The mass transport mechanism through the membrane pores is characterized by three primary mechanisms known as Knudsen-diffusion (K), Molecular-diffusion (M), or a combination of these two giving what is known as the “transition mechanism” [22,23]. The Knudsen number, a key parameter in the mass transfer mechanisms within the membrane, is defined as:
where is the mean pore size of the membrane and is the mean free path of the molecules defined by [24]:
where is the Boltzman constant (1.380622 × 10⁻²³ J/K), and refer to the collision diameters for water vapor (2.641 × 10⁻¹⁰ m) and air (3.711 × 10⁻¹⁰ m) respectively [25], is the atmospheric pressure and and are the molecular weights of water and air. At a typical membrane temperature of 60 °C, the mean free path of the water vapor in the membrane pores is 0.11 µm.
, , and are the membrane mass flux coefficients for the Knudsen mechanism, molecular diffusion mechanism, and Knudsen-Molecular diffusion mechanism, respectively. and are the porosity and tortuosity of the membrane. stands for the mean pore radius and is the universal gas constant. The diffusivity of water vapor (A) relative to air (B), , is expressed using the following empirical formula for the temperature range of 273–373 K [24]:
The mass transport through the porous membranes in MD is expressed by Darcy’s law as [24]:
where is the permeate mass flux for each effect, is the dominant membrane coefficient depending on the value of Kn [10], P(Tm,i) and Pv are the vapor pressures at Tm,i and cold-side absolute pressure, respectively. is defined as the interfacial temperature between the feed solution and the hydrophobic membrane, which is lower than the feed temperature. This differential represents a temperature gradient, which results in a heat transfer process to the surface of the hydrophobic membrane, thus sustaining the evaporative process. The heat transfer rate is given by:
where λi is the heat transfer coefficient. A spacer-filled channel has been used in the V-MEMD system as shown in Figure 1B to enhance the heat transfer mechanism. To evaluate the heat transfer coefficient, λi, for a spacer-filled channel, we employed the correlation developed for ultrafiltration by Costa et al. [21]:
where is the hydraulic diameter for the spacer-filled channel, is the feed flow thermal conductivity, and are the feed flow Reynold’s and Prandtl numbers, respectively. refers to the mesh size. is the correction factor for the spacer-filled geometry defined as:
where stands for the filament size, is the spacer thickness, and is the spacer void fraction. is the hydrodynamics angle. All characteristics appearing in Equations (26) and (27) are related to the type of spacer. Phattaranawik et al. [20] reported a full study on typical coarse and fine spacers and their specifications (Table 3).
The Reynolds number for a spacer-filled channel can be expressed as follows [16]:
The liquid film composed of condensate water on the plastic foil layer generates resistance to heat flow from the channel. We denote the interfacial temperature between the film condensate and the plastic foil Tfoil. The film condensate thickness is expressed as [16]:
where and refer to the dynamic viscosity and density of the condensate, respectively, stands for the plastic foil height, g is the gravitational constant, and is the density of the vapor.
3.3. Performance Indicators
The performance of the V-MEMD system may be expressed as a function of key indicators. The primary performance indicator, the recovery ratio (R), gives the ratio of the cumulatively produced freshwater to the raw water feeding the V-MEMD system:
The gain output ratio (GOR) is a standard performance indicator to express the maximum heat requirement for the desalination process. It is commonly defined [7] as follows:
The performance ratio constitutes another prominent indicator. Due to variable, and sometimes unclear, expression of the performance ratio within the literature, it is sometimes confused with the GOR. In this work, we define the performance ratio as the ratio of the total production rate to the supplied heated flow rate [27]:
The specific electrical energy consumption, which reports the amount of electrical energy required to produce one cubic meter of distillate water, is often neglected in studies examining MD systems:
where E represents the rate of electrical energy consumption.
Similarly, the specific thermal energy consumption (STEC) requires the evaluation of the total thermal energy supplied to the V-MEMD system, , which can be calculated using an energy balance on the steam raiser compartment [12]:
The specific thermal energy consumption (STEC) is defined as:
Regarding the second law analysis, the use of the exergy concept is important based on its relation to the entropy generation rate. The total exergy of a system may be divided into two components: thermo-mechanical exergy, and chemical exergy. The latter is zero for a single component system, but must be considered for a multi-component system.
The subscripts k and o refer to the actual and dead state, respectively. is the flow exergy of a system for an actual state. and mf refer to the chemical potential and mass fraction, respectively.
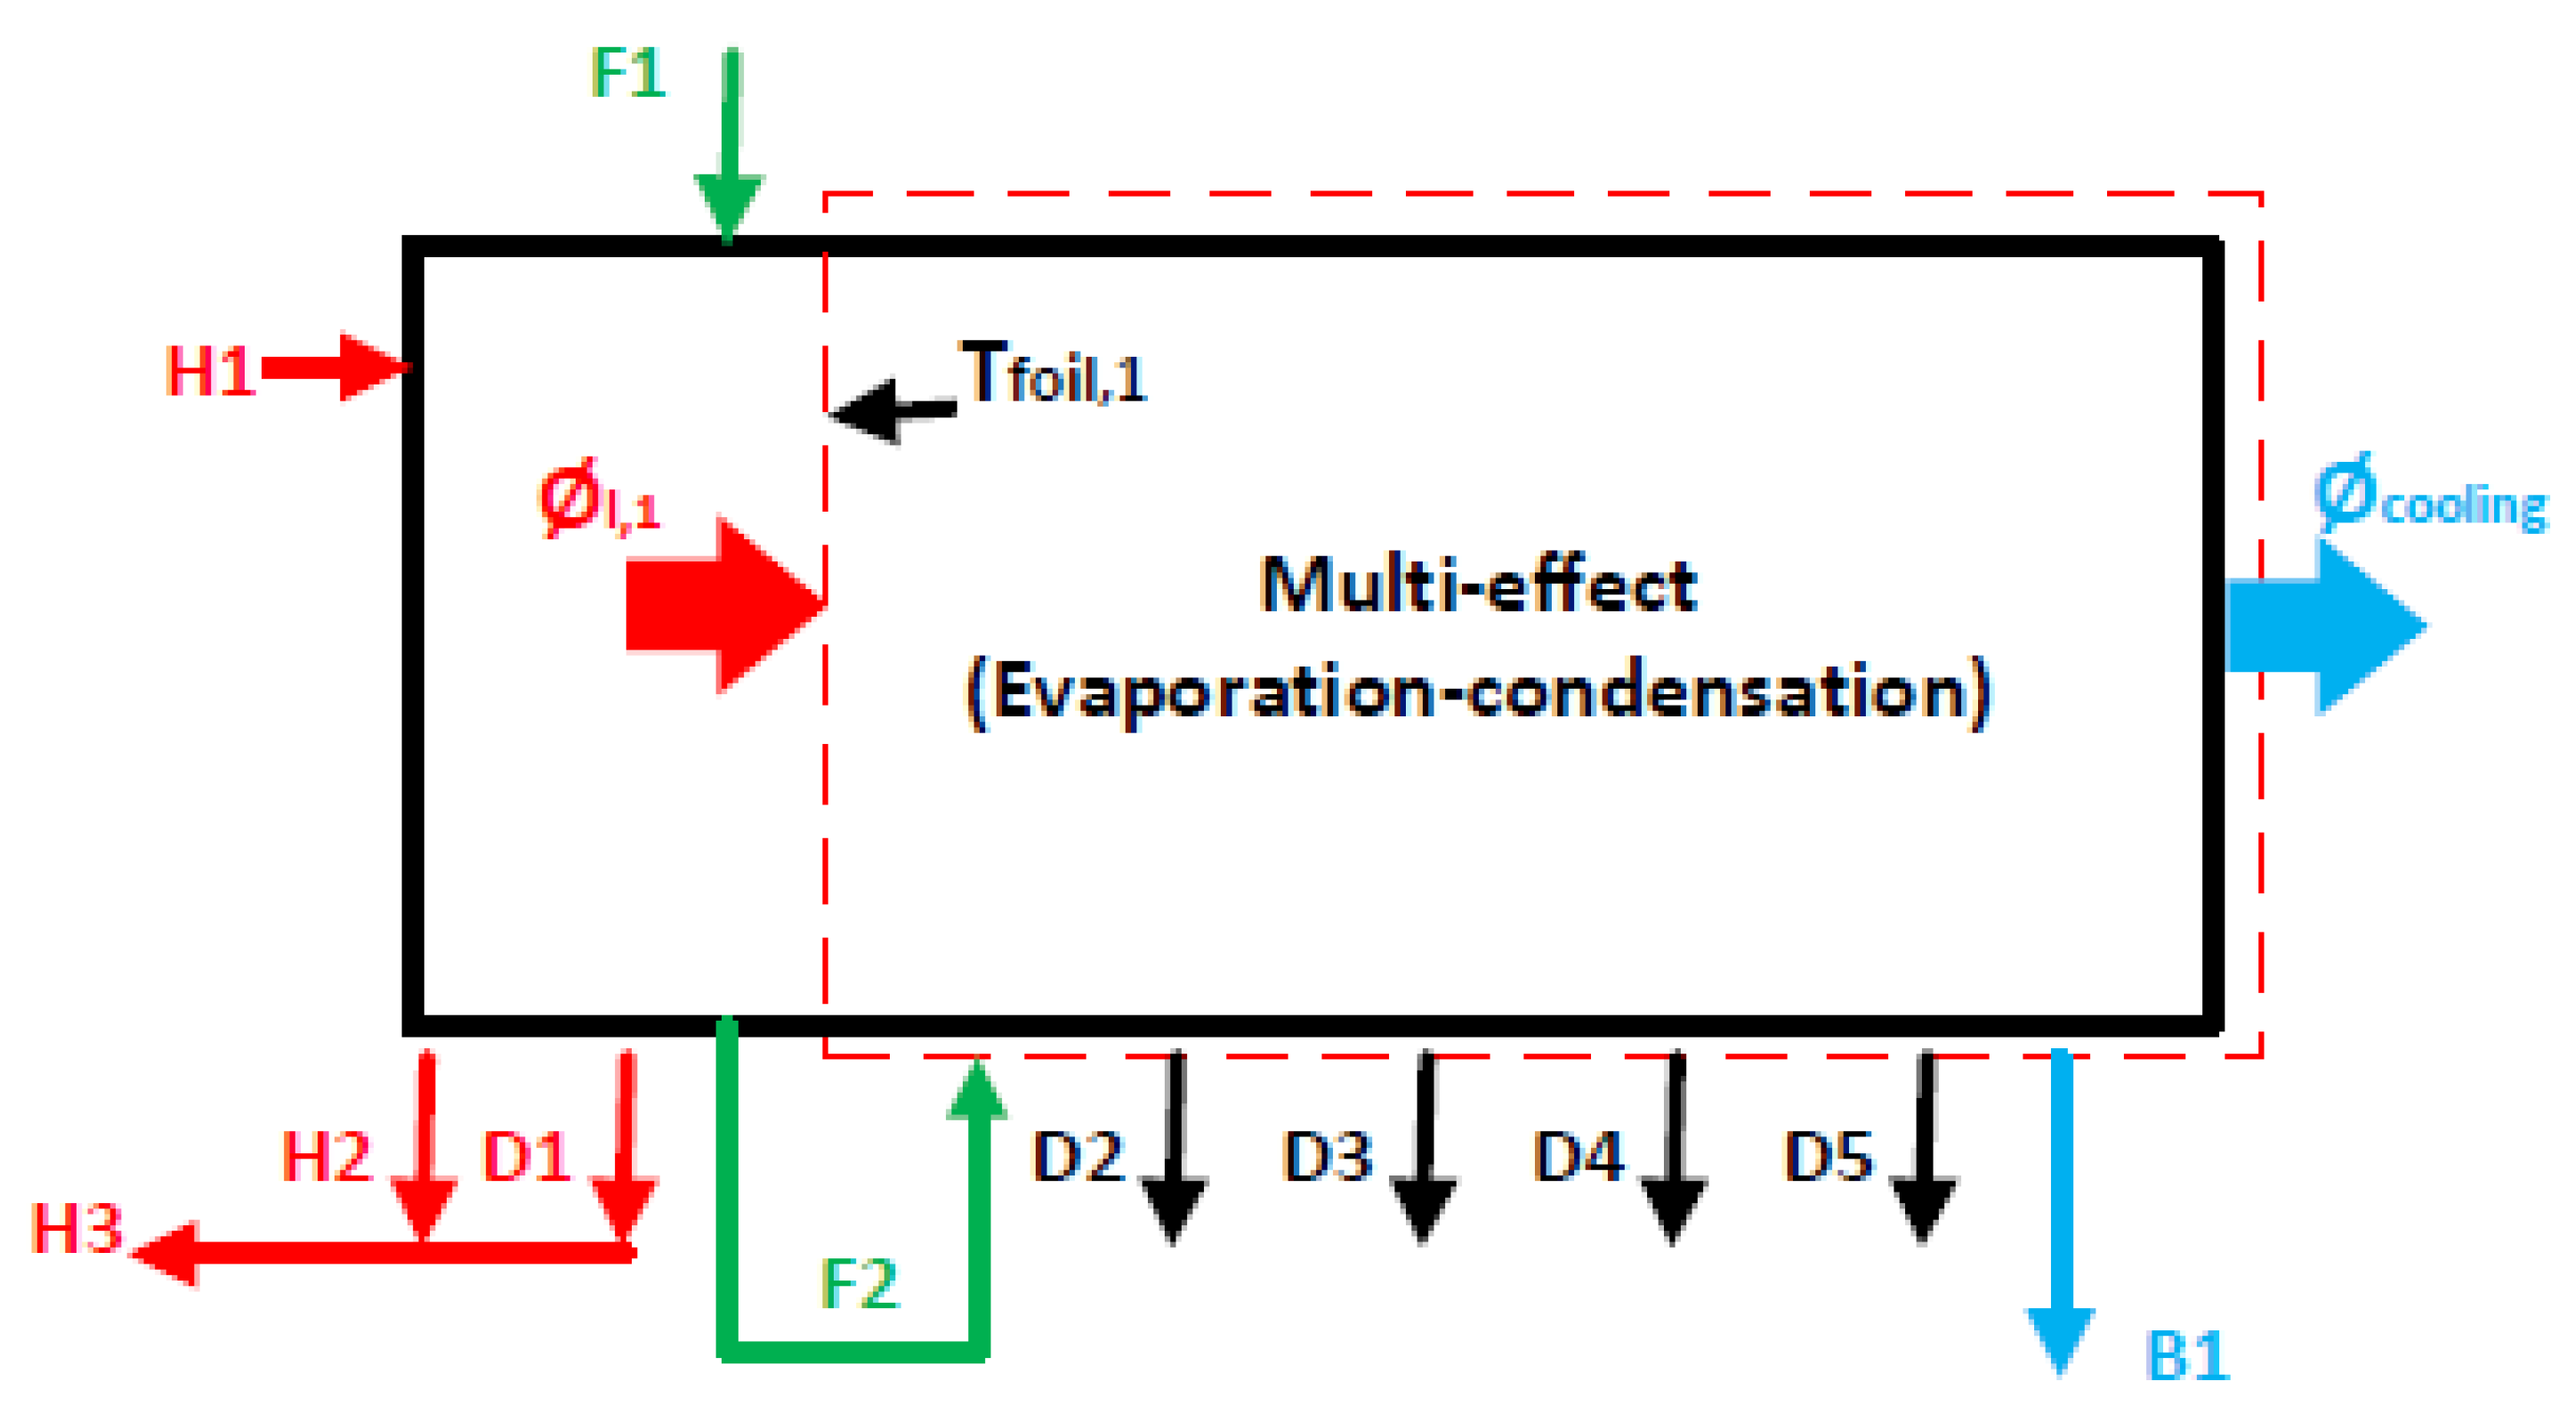
The minimum work required to drive a desalination process may be obtained by applying an exergy balance on a control volume of an ideal desalination unit. The work requirement may be defined as the difference between the exergies of brine, distillate, and feed flow (Figure 4):
The conceptual exergetic efficiency of the V-MEMD system is defined as the ratio of the minimum work input to the latent heat transfer to the first foil layer, as shown in Figure 4, and it may be expressed as:
The exergy destruction is directly related to the entropy generation resulting from process irreversibility in the V-MEMD system; however, it can also be appraised as a ratio to the total exergy destruction of the V-MEMD system. the destruction exergy for each effect and its ratio are defined as follows:
Similarly, the specific thermal exergy consumption (STXC) has become an essential performance indicator for desalination systems. For a given V-MEMD unit, the STXC may be defined as follows [7]:
The exergy analysis is based on the dead state at temperature of Ti = 20 °C, salinity of w = 0 ppm, and pressure of Pi = 180 mbar.
3.4. Solution Algorithm
The above presented mathematical model is solved using an iterative method as described in the flowchart in Figure 5. The solution algorithm starts with an initial guess for Ts,1, the average bulk temperature of the steam raiser compartment. Using the initial guess, the algorithm calculates the evaporation energy in the steam raiser compartment and raises the average bulk temperature of the feed flow to make Ts,1 = Tf,2. At this point, values for the variables related to temperature, salinity, and flow rate in this effect are acquired to evaluate their resulting coefficients and parameters. Consequently, the mass, energy, and entropy generation equations may be calculated. Finally, the temperature for the next effect will be determined. The above procedure is repeated in each effect as well as the condenser chamber. If the total mass and energy balances meet the predefined tolerance, and the total entropy generation is greater than zero, the iteration stops. Otherwise, the average bulk temperature is adjusted, and the procedure is repeated. The mass and energy tolerances were set equal to 10−8. Once the solution converges, the system performance indicators may be calculated.
4. Results and Discussion
4.1. Model Validation
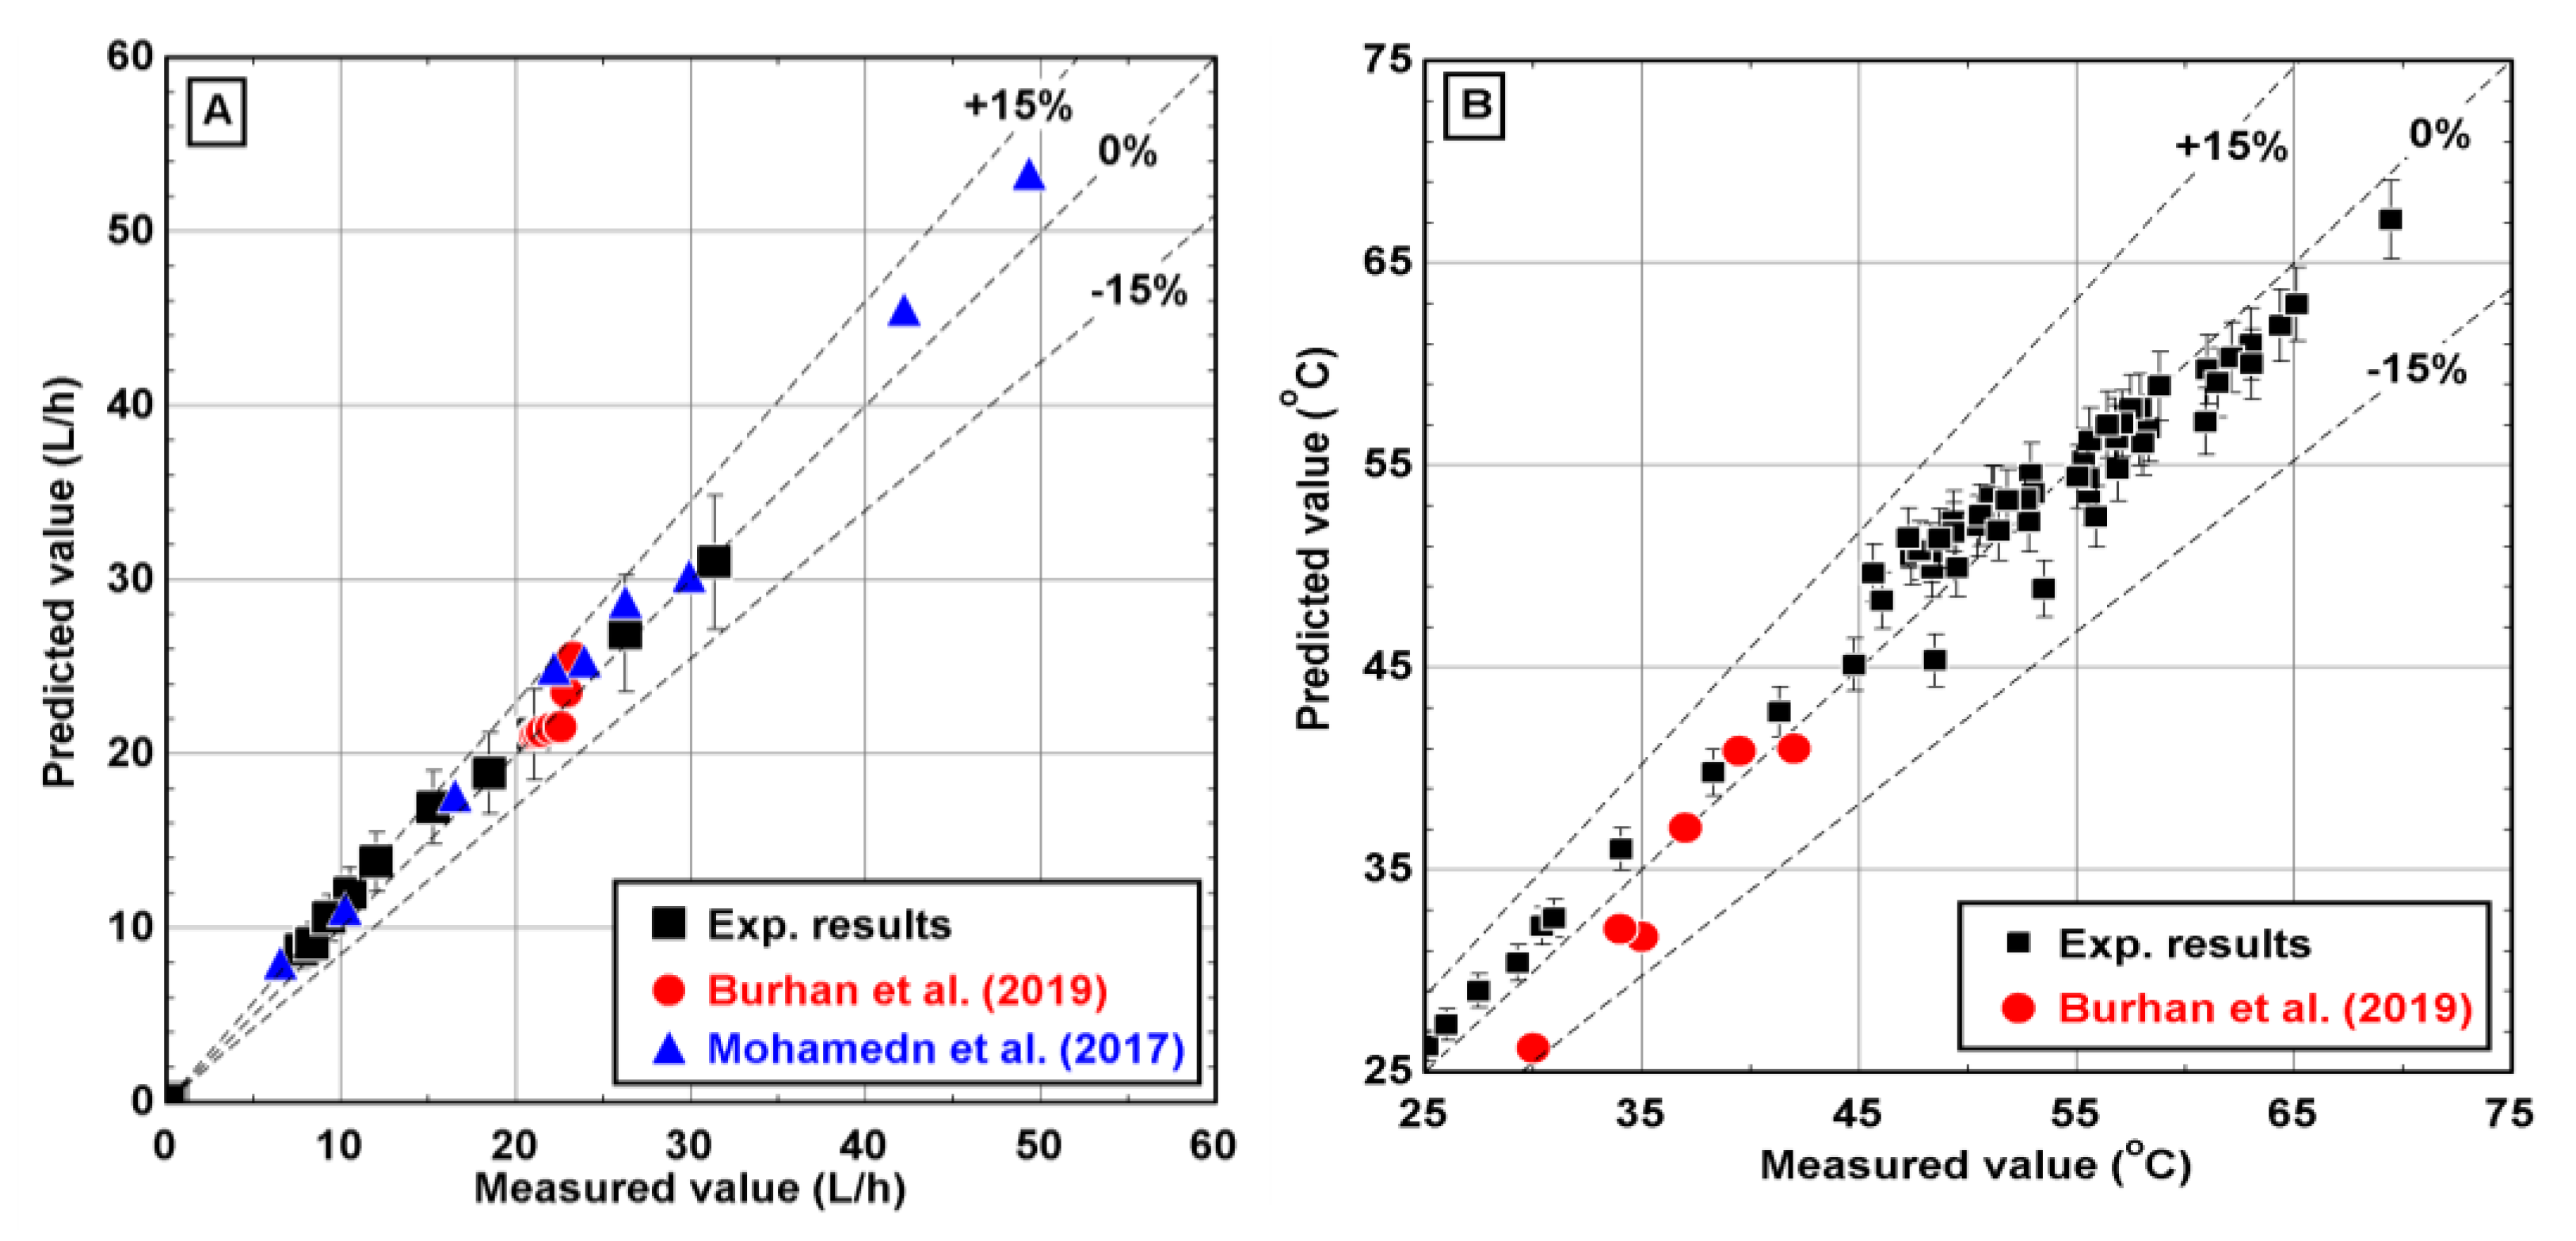
The experimental data obtained from the V-MEME unit was used to validate the mathematical and numerical models. The comparison encompasses a wide range of operating conditions, all of which are summarized with their maximum uncertainties in Table 4. The BnR PLC was used to control the V-MEME system and record all parameter values except for inlet salinity, which was manually measured using a HANNA portable device. Further details on BnR PlC can be found in Chafidz et al. [19]. Figure 6 shows a comparison between the experimental measurements and numerically predicted values of the mathematical model which was developed using MATLAB® software. Therefore, each data point indicates a unique operating condition specified in Table 4. Moreover, the results of the mathematical model were also compared with those of Burhan et al. [29] and Mohamed et al. [13]. Generally, a good model–plant agreement was obtained. The model-predicted distillate production rate over the entire operating conditions was within a deviation band of ±15% of the experimental results (Figure 6A). We observed excellent agreement between the experimental and predicted values for high distillate rates and over a wide range of temperatures. The deviation band is simply the standard deviation of the error. This means the average model–plant discrepancy does not exceed ±15%, as described in Figure 6B. The observed discrepancies shown in Figure 6 may be attributed to three main reasons: (i) knowledge of the mass and heat transfer processes in the spacer-filled channels, (ii) modeling assumptions, (iii) fluctuation of recording parameters.
4.2. Performance Evaluation
4.2.1. Energetic Analysis
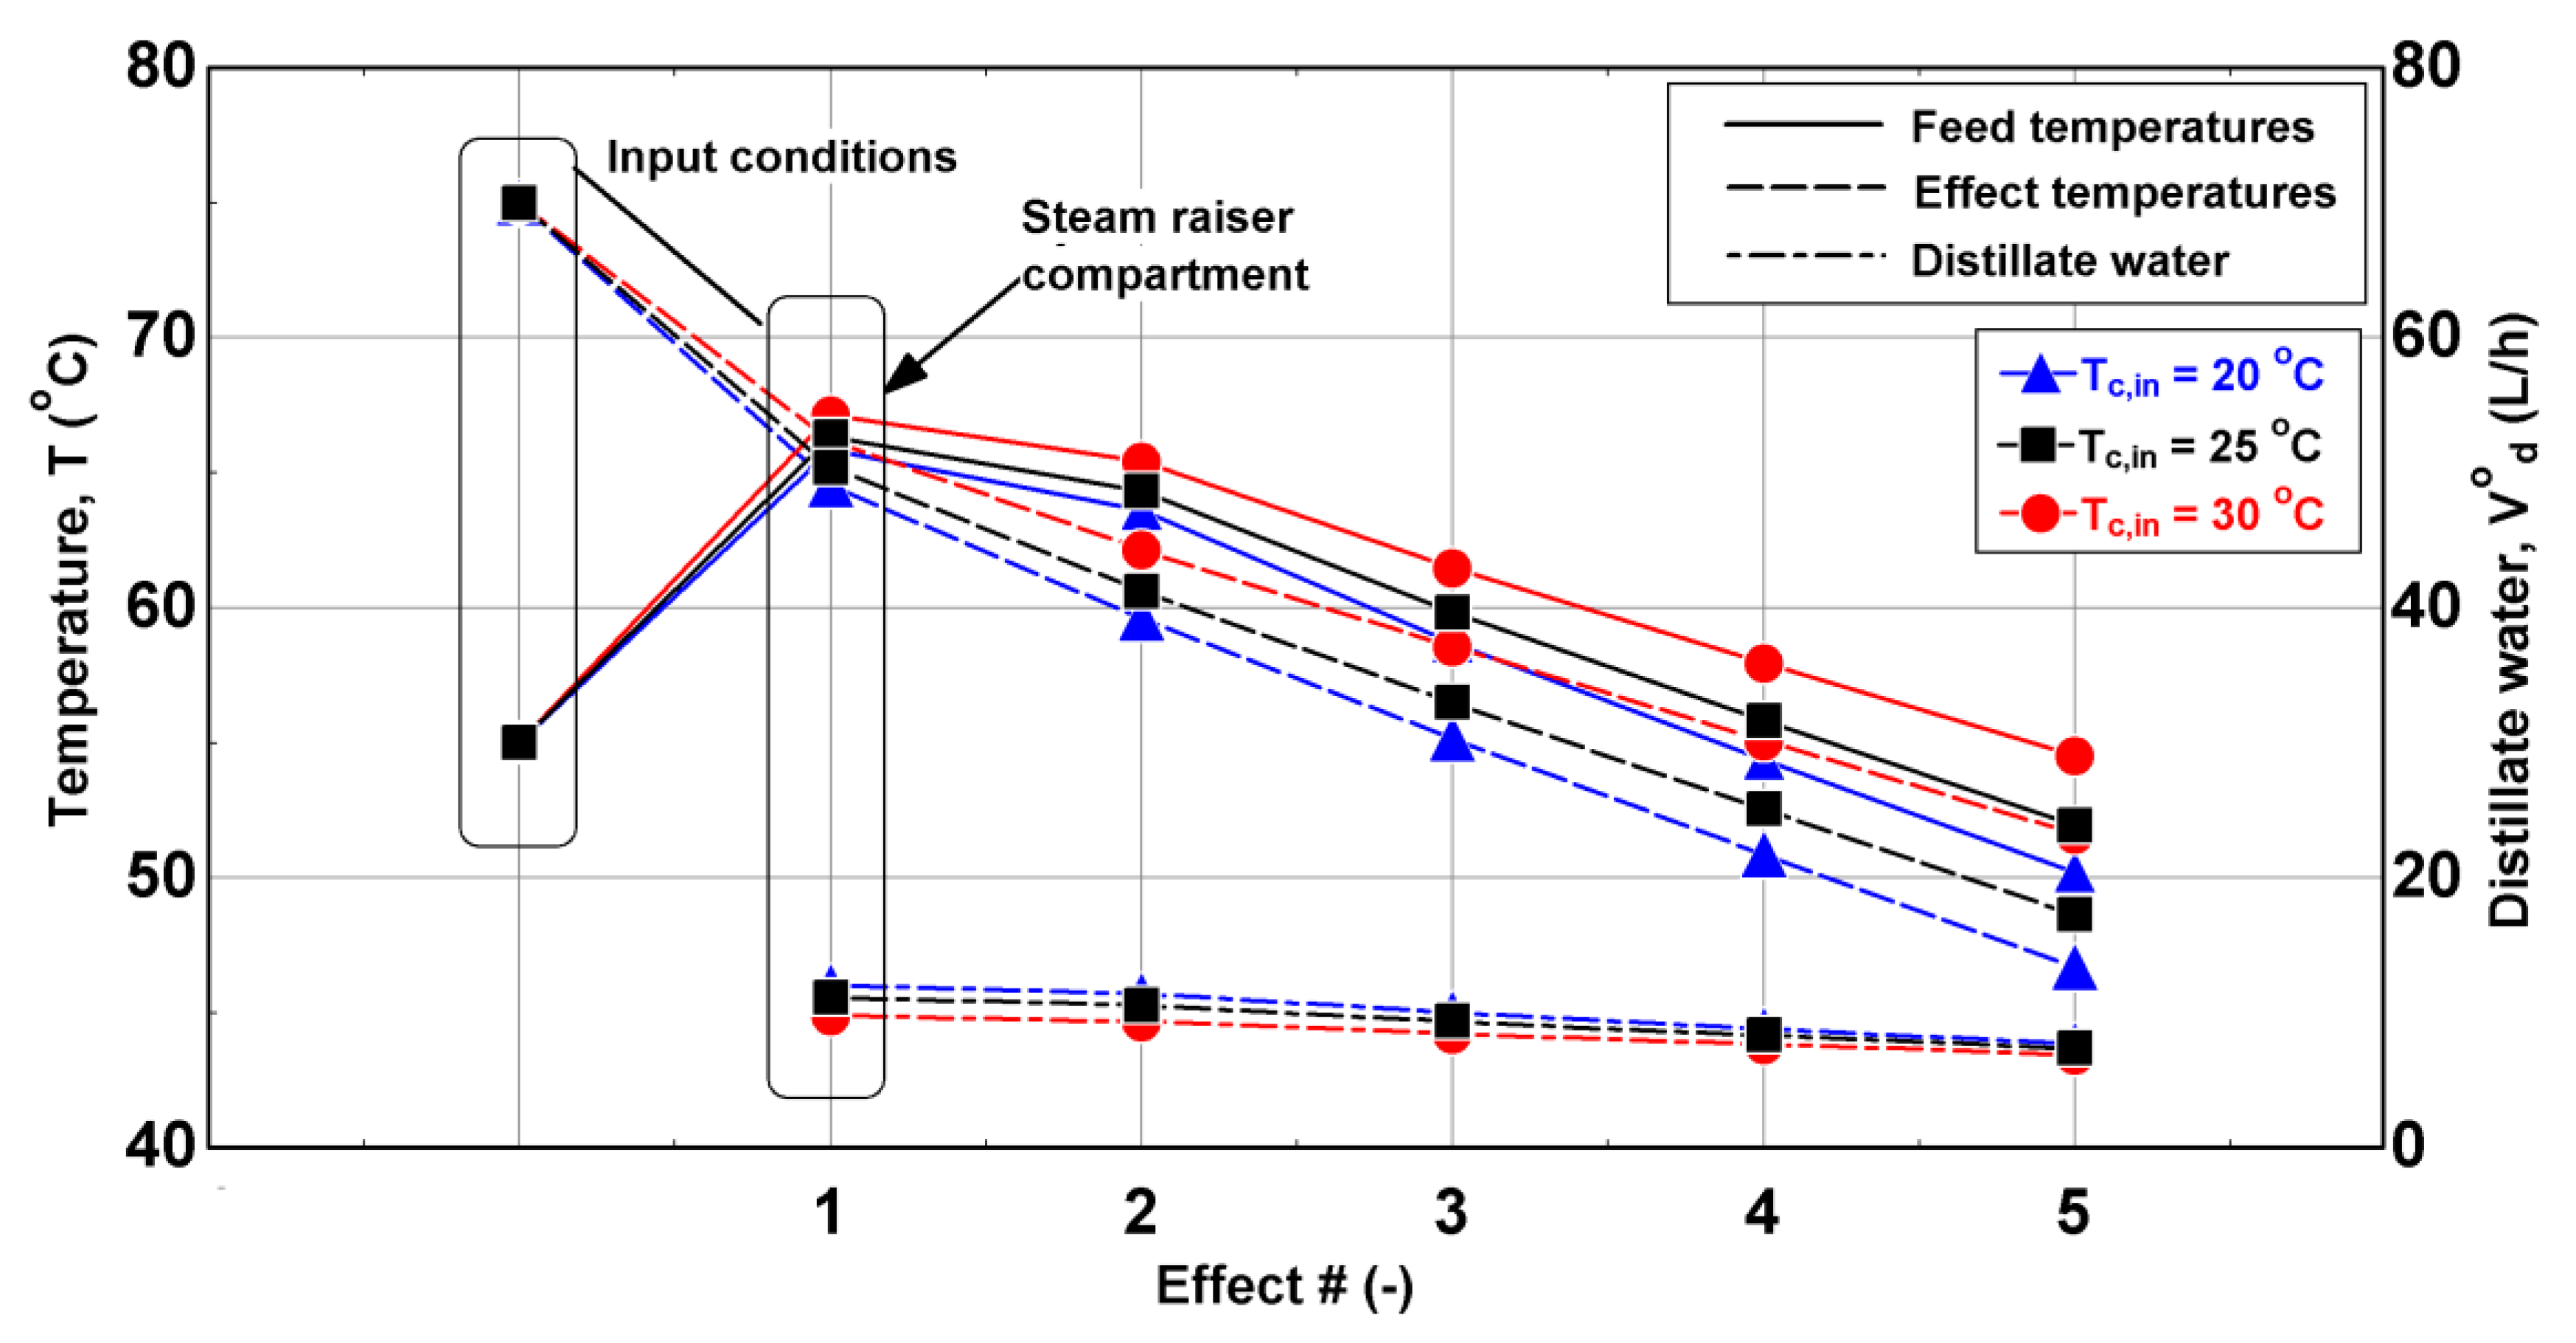
A comprehensive performance study of the V-MEMD system over a wide range of operating conditions was conducted using the validated model. Brackish water and seawater with 1260 and 45,900 ppm feed salinity, respectively, were used for the simulations. Generally, performance indicators are enhanced at elevated hot water temperatures, prompting us to consider Tf,in = 55 °C for the inlet feed water temperature. The other input conditions were kept constant during our study. For example, the hot water flow of the heating loop, v0h, was fixed at 840 L/h, the cold water flow of the cooling loop, v0c, was fixed at 405 L/h, and the feed water flow, V0f, was set equal to 87 L/h. Figure 7 shows the variation in effect temperature, feed temperature, and distillate water for different inlet cold water temperatures (e.g., Tc,in = 20, 25 and 30 °C) with a constant hot water temperature of Th,in = 75 °C. It is apparent that the low cold water temperature contributes to the enhancement of the vacuum level by reducing the cold-side absolute pressure and, thus, produces an increase in the evaporation energy associated with the feed water flow. This increase in evaporation energy is evidenced by a significant decline in the effect and feed water temperatures, resulting in an increased distillate water production. At Tc,in = 20 °C, the distillate water production grows by 6.3% and 18% compared to a cold water temperature of 25 °C and 30 °C, respectively. The effect of the feed water temperature on the process performance was investigated in Figure 8. At high feed water temperatures, the vapor pressure of the feed water increases accordingly, which enhances the driving force between the two sides of the membrane. Moreover, the higher vapor pressure results in increased evaporation energy, which also promotes the production of distillate water. Alteration of the feed water temperature by ±20 °C from the nominal feed temperature (Tf,in = 55 °C) was also studied. A high feed temperature (Tf,in = 75 °C) resulted in increased productivity of 9.1% compared to the feed temperature of 55 °C. Conversely, a low feed water temperature of 35 °C resulted in a significant reduction in the productivity of distillate water by 10% compared to that for the feed water temperature of 55 °C (Figure 8).
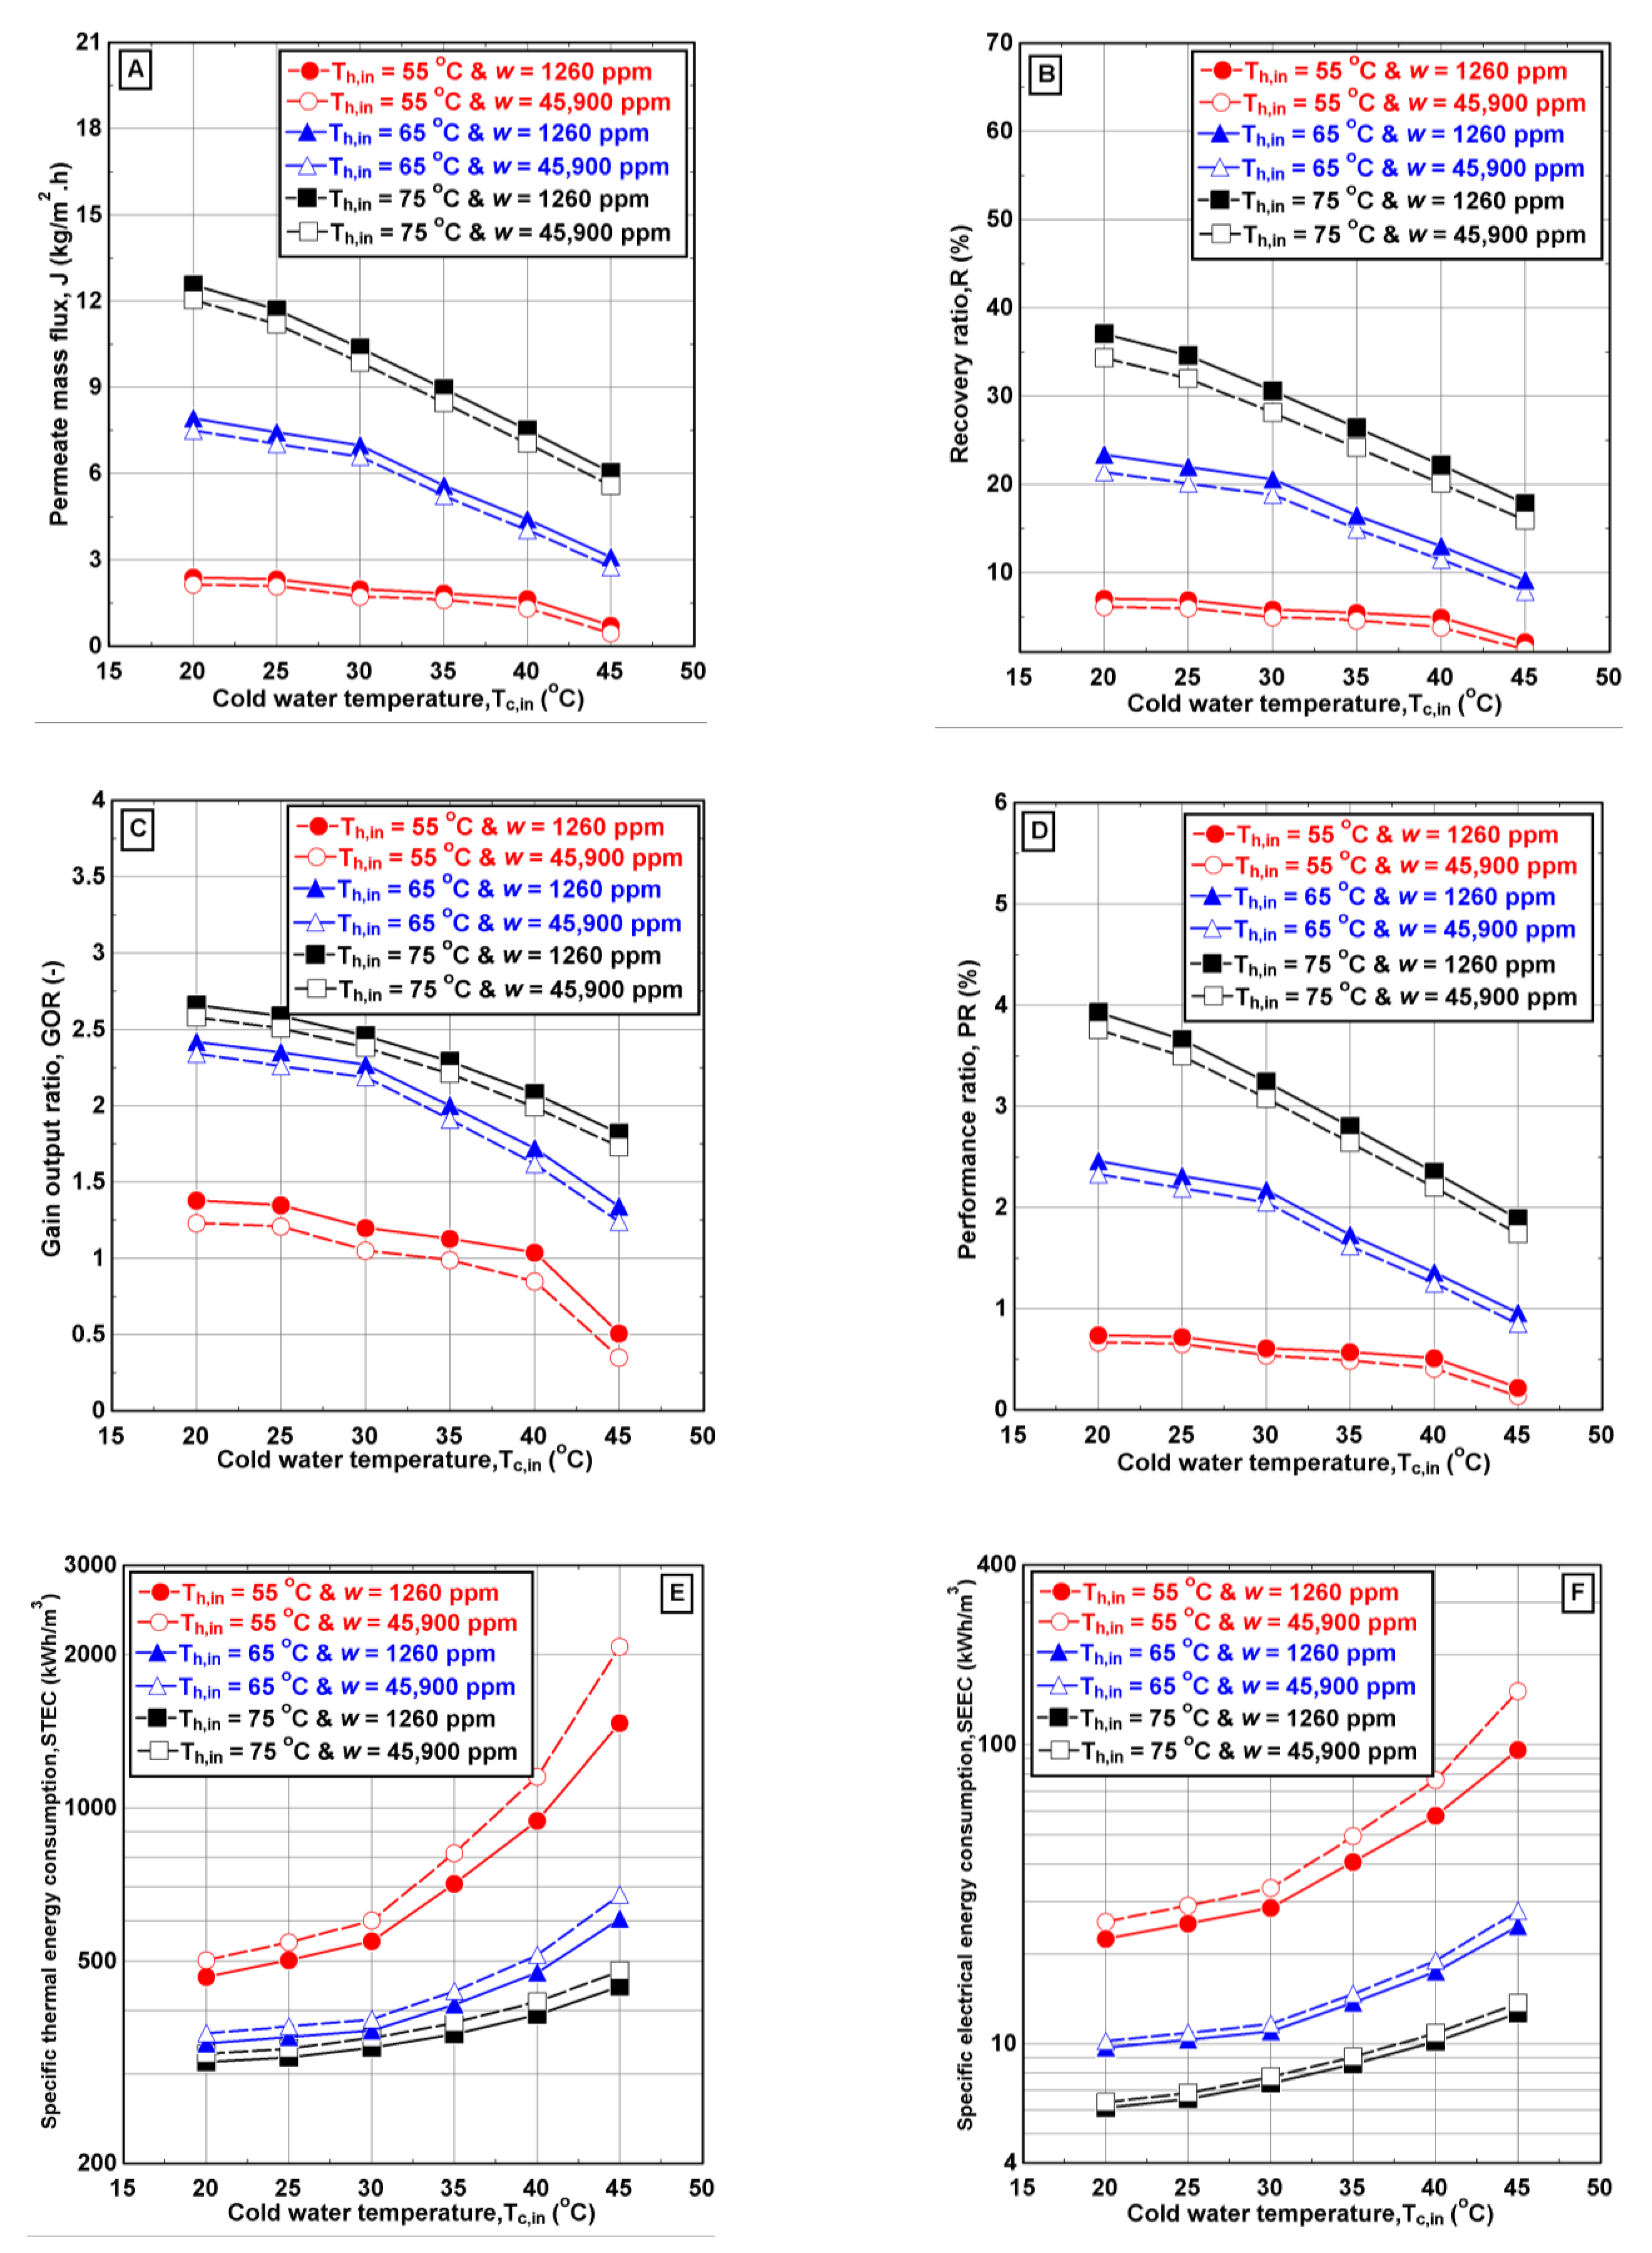
Figure 9 illustrates the effect of the cold water flow temperature (at different inlet hot water temperatures and salinities on the performance indicators. Incrementation of the inlet cold water temperature drastically influences the performance indicators. At the maximum inlet hot water temperature (Th,in = 75 °C), the permeate mass flux, J, recovery ratio, R, and performance ratio, PR, decrease by 52%, 51.8%, and 51.7%, respectively, when the inlet cold water temperature was increased from 20 °C to 45 °C. For the gain output ratio, GOR, the percent reduction was more apparent at low hot water temperatures (Th,in = 55 °C) due to the variation of the vaporization enthalpy (hfg), resulting in a reduction of around 64% over the range of inlet cold water temperatures. Additionally, increasing the salinity to 45,900 ppm leads to a slight decrease in the performance indicators. The reduction in permeate mass flux, J, recovery ratio, R, gain output ratio, GOR, and performance ratio, PR, between brackish and seawater was 4.2%, 7.4%, 3.3%, and 4.3%, respectively. These results underscore MD’s potential to treat highly saline waters. However, it was clear that increasing the feed salinity slightly reduced the production rate and recovery ratio. Additionally, the specific thermal and electrical energy consumptions exhibited an exponential dependence on the cold water temperature, especially when operating at minimum inlet hot water temperature. Therefore, from an energetic point of view, it is preferable to operate the V-MEMD system at the maximum inlet hot water temperature and the minimum inlet cold water temperature to permit thermal energy expansion throughout the effects. The maximum values for the specific thermal and electrical energy consumptions when using Th,in = 75 °C do not exceed 478 kWh/m3 and 6.1 kWh/m3, respectively. When the temperature of inlet hot water is less than 75 °C, the maximum specific thermal and electrical energy consumptions are in the range of 606–2076 kWh/m3 and 24.8–137.4 kWh/m3, respectively (Figure 9E,F). Notably, the effect of salinity on the various performance indicators becomes larger when the MD system operates at higher temperatures. Within the range of the operating temperatures considered in this section, the simulations show that distillate flux, GOR, and recovery ratio values of 12 kg/m2h, 2.7, and 36% may be achieved, indicating a higher performance compared to similar V-MEMD systems [10,11,12,13,14,29].
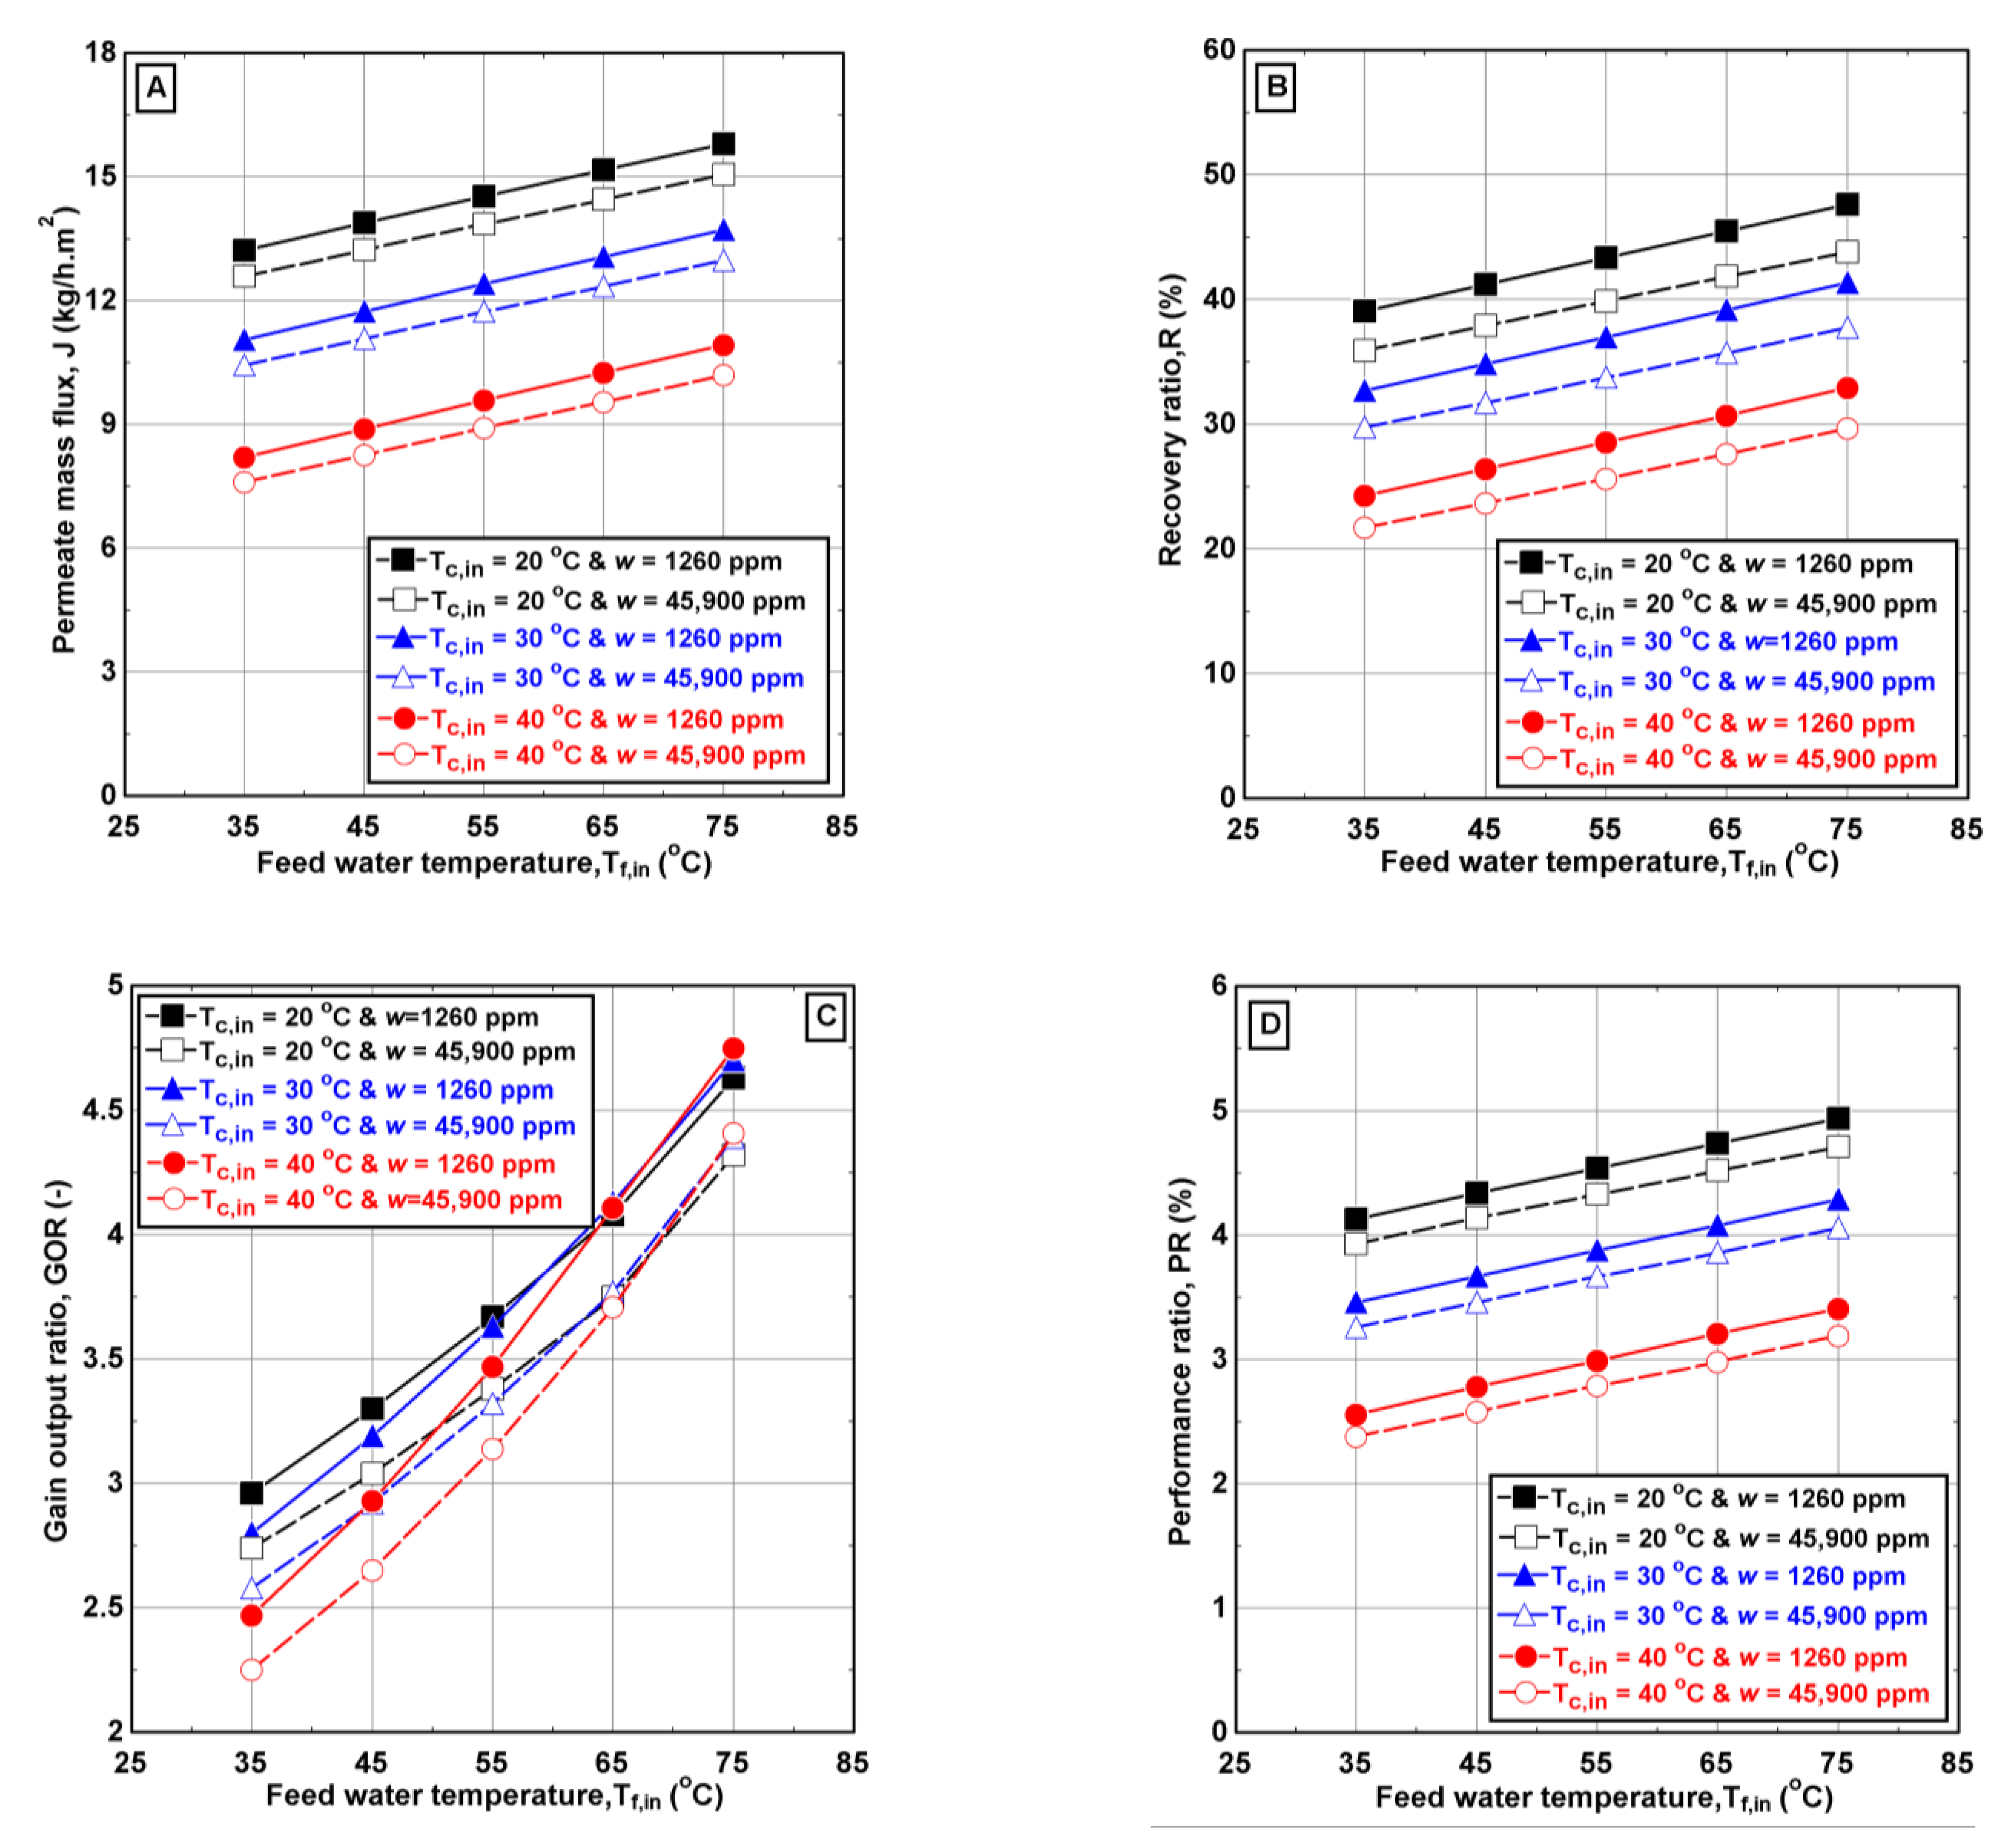
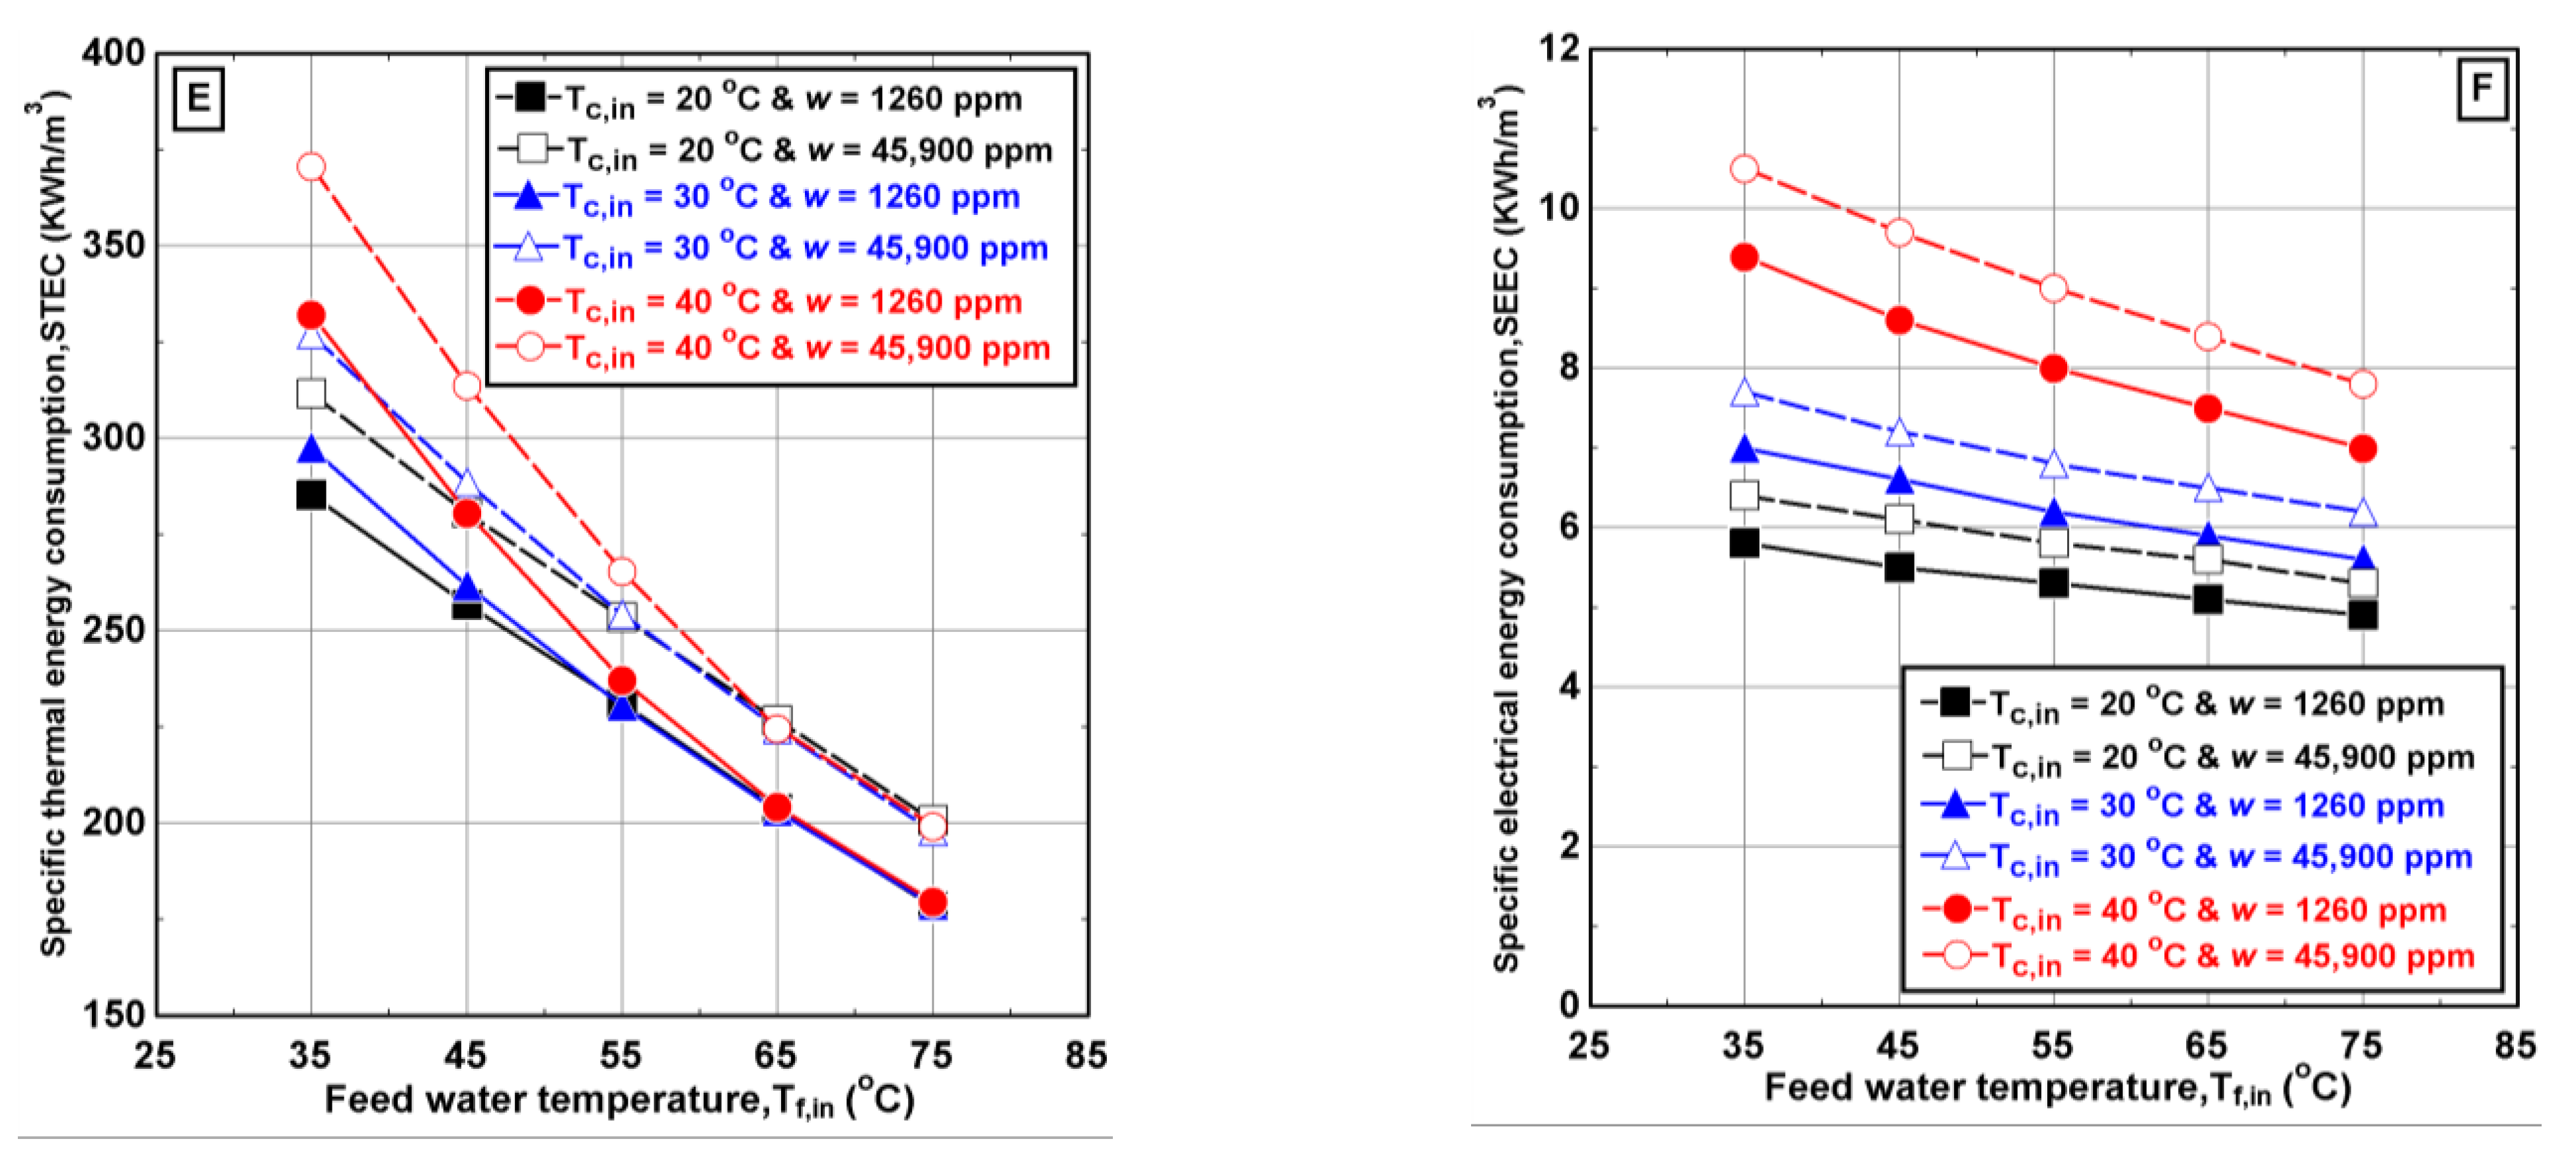
Figure 10 illustrates the influence of feed water temperatures on the performance indicators for different inlet cold water temperatures and feed salinities. The permeate mass flux, R, and PR showed a linear positive relationship with feed water temperature, while the GOR, STEC, and SEEC showed a nonlinear relationship. The feed water temperature exhibited a positive effect on the GOR and STEC, especially when Tf,in exceeded 65 °C, over all the operating salinities and inlet cold water temperatures (Figure 10C,E). At the maximum feed temperature of Tf,in = 75 °C, the enhancement in J, R, and PR, over the entire range of cold water temperatures reached 19.6%, 22.2%, and 20.6%, respectively. Additionally, the effects of the feed water temperature on the GOR, STEC, and SEEC were evident at the lowest inlet hot water temperature (Th,in = 55 °C). This was due to the enhanced potential of the latent heat transmitted through the effects. Changing the feed salinity from 1260 to 45,900 ppm caused a decrease in the process performance. Accordingly, the percentage change in mass flux, R, GOR, PR, STEC, and SEEC were 4.6–7.2%, 7.9–10.5%, 6.5–9.8%, 4.6–7.2%, 9.2–12.6%, and 8.1–12.8%, respectively.
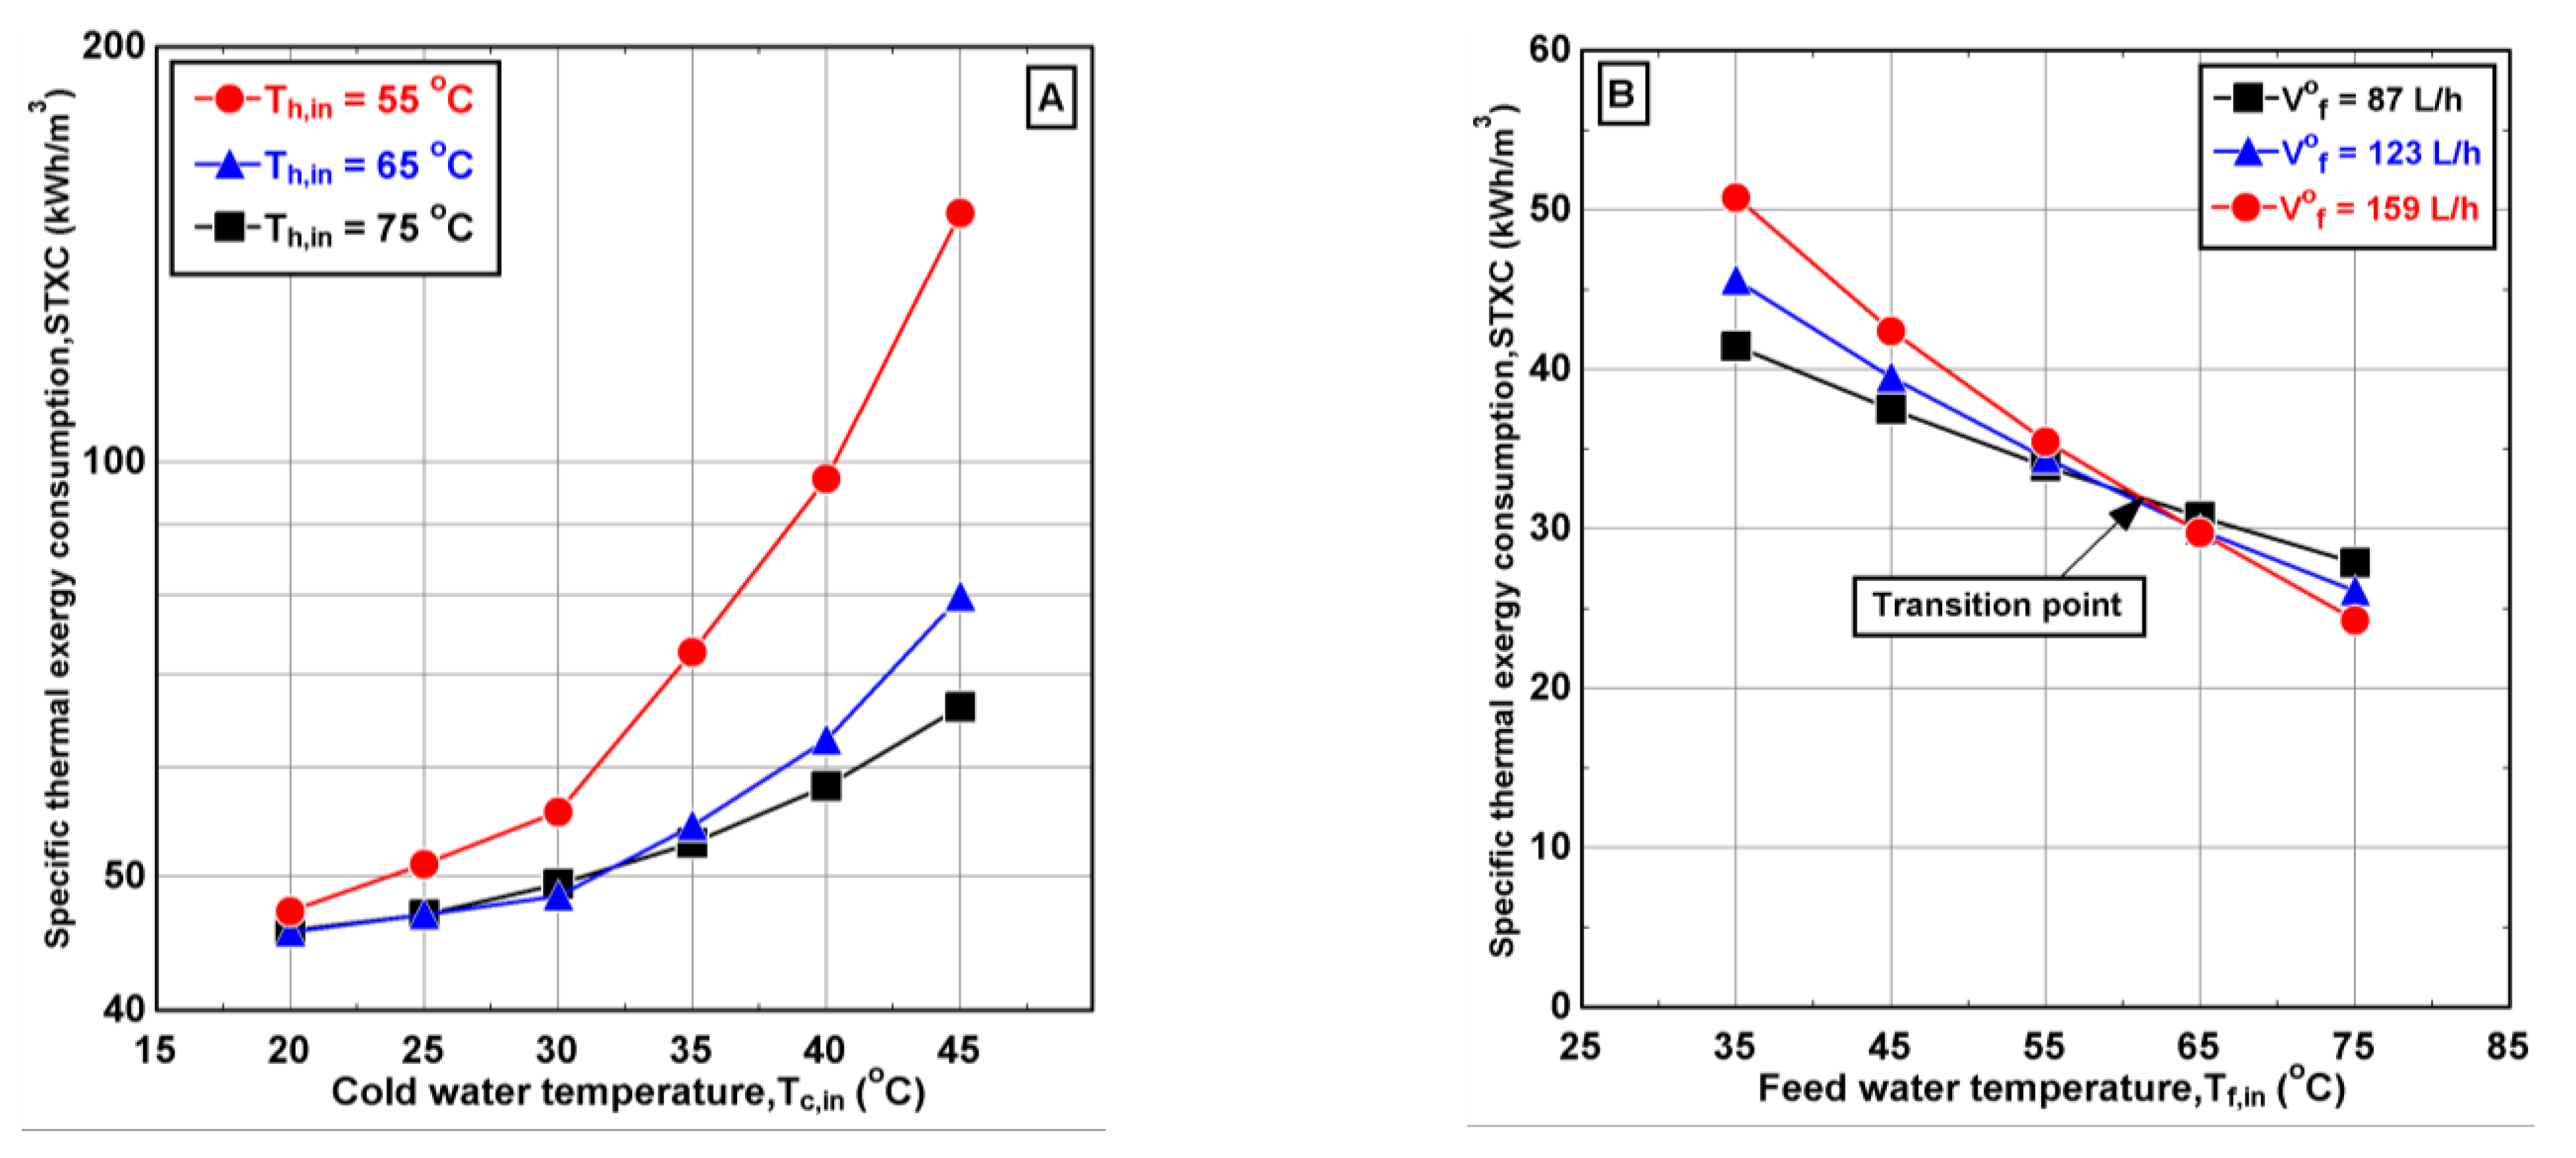
The feed water flow rate and temperature also affect the behavior of the desalination unit. Figure 11 highlights the significant impact of the feed properties on the performance of the V-MEMD desalination system. Figure 11 shows that increasing the feed water flow rate negatively impacted the V-MEMD system, especially at low feed water temperatures. Interestingly, higher feed water rates have a positive impact at high temperatures, especially when the feed water temperature becomes greater than 55 °C. The temperature at which these trends converge is called the transition point. Wang et al. [30] performed a study similar to ours, but did not observe such a phenomenon. Importantly, the V-MEMD system utilized in this work is significantly different from the system used by Wang et al. [30]. Unlike Wang et al. [30], the heat supplied in our study originates from the storage tank, and is used to heat the feed to drive water vapor through the hydrophobic membrane. At low temperatures, the feed water stream absorbs a significant portion of the heat energy from the steam raiser (evaporator), reducing the latent heat migrating throughout the effects and, thus, decreasing the values of the performance indicators. For example, using Tf,in = 35 °C and different feed water flow rates resulted in a decrease of 3.9–8.8%, 10.4–20.3%, 3.9–8.8%, 11–19.3%, and 4.1–10.3% for mass flux, GOR, PR, STEC, and SEEC, respectively. Conversely, the feed water flow rate at high temperatures enhanced the transfer of the latent heat throughout the effects and resulted in increased values for the performance indicators. These studies showed the J, GOR, PR, STEC, and SEEC increased by 3.6–9.3%, 3.6–8.9%, 4.0–8.9%, 5.4–11.1%, and 4.1–6.2% respectively, at Tf,in = 75 °C. We observed that the particular feed temperature for which the change of behavior in the performance criteria occurs (i.e., the transition point) is about 55–65 °C, and the corresponding J, GOR, PR, STEC, and SEEC values are 14.5 kg/m2·h, 3.9, 4.54%, 240 kWh/m3 and 5.3 kWh/m3, respectively. Naturally, the feed flow has a profound impact on the recovery ratio, as expected.
Based on the above parametric analysis, one can draw the following points:
The performance of the V-MEMD is sensitive to various operating conditions such as the cold water temperature, the hot water temperature, and the feed water temperature/flow rate. Salinity has a negligible impact on low hot water temperatures. This impact increases for higher hot water temperatures.
Cold water temperatures higher than 38 °C result in a significant deterioration in unit performance associated with an increase in the specific thermal/electrical energy consumption and a decrease of the GOR, PR and permeate mass flux.
Overall, the simulations indicate the optimal performance of this V-MEMD configuration reflected in a high GOR, high permeate mass flux, high recovery ratio, and high performance ratio. However, the specific thermal energy consumption remains too high.
4.2.2. Exergetic Analysis
Several scenarios with various input conditions were selected for the exergy analysis of the V-MEMD system (Table 5).
The main equations for the exergy analysis, Equations (36)–(41), are applied to the V-MEMD system using the conditions in Table 5. The results for Case-A are shown in Table 6. The obtained exergetic efficiency is considered extremely high compared to the results of Miladi et al. [28], as they reported exergy efficiency values of 2.3~3.25%. Our enhanced exergy efficiency could stem from a variety of parameters including the assumptions used in the mathematical models, the relatively better thermal separation process in the V-MEMD system, the fact that the dissipations of heat transfer throughout layers and effects were not significant, and the small heat supply by the hot water stream. Additionally, the STXC is reasonable compared to the total specific exergy consumption predicted by Najib et al. [7].
We further analyzed the effect of the specific operating conditions on system performance using the exergy analysis. As shown in Figure 12A, the STXC increased significantly with increasing cold water temperature. This improvement reached nearly twice the original value at the highest inlet hot water temperatures (i.e., 65 °C and 75 °C). Moreover, the cold water temperature effect was more pronounced at the lowest inlet hot water temperature (55 °C), where the STXC increased threefold at cold water temperature, Tc,in, transitions from 20 °C to 45 °C. The effect of increasing the inlet hot water temperatures from 65 °C to 75 °C on STXC was virtually negligible, especially when the inlet cold water temperature was less than 35 °C. Figure 12B shows the effect of raising both the feed temperature and feed flow rate on STXC. For a fixed feed water flow rate, the STXC values drop as the feed water temperature increases. The specific exergy consumption at a feed water temperature of 75 °C reaches minimum values of 27.7, 26.1 and 24.8 kWh/m3 corresponding to the three tested feed water flow rates. As the feed water flow rate increases, the effect of feed water temperature becomes less important. Therefore, at high feed water flow rates, the specific thermal exergy consumption becomes insensitive to the variation of the feed water temperature. Such behavior leads to a special phenomenon characterized by the presence of a particular point, the transition point, which is around Tf,in = 60 °C. These findings are in agreement with the previously presented energy efficiency results (Figure 11C,E,F). The feed water temperature at the transition point was found to be slightly lower (between 55 to 65 °C).
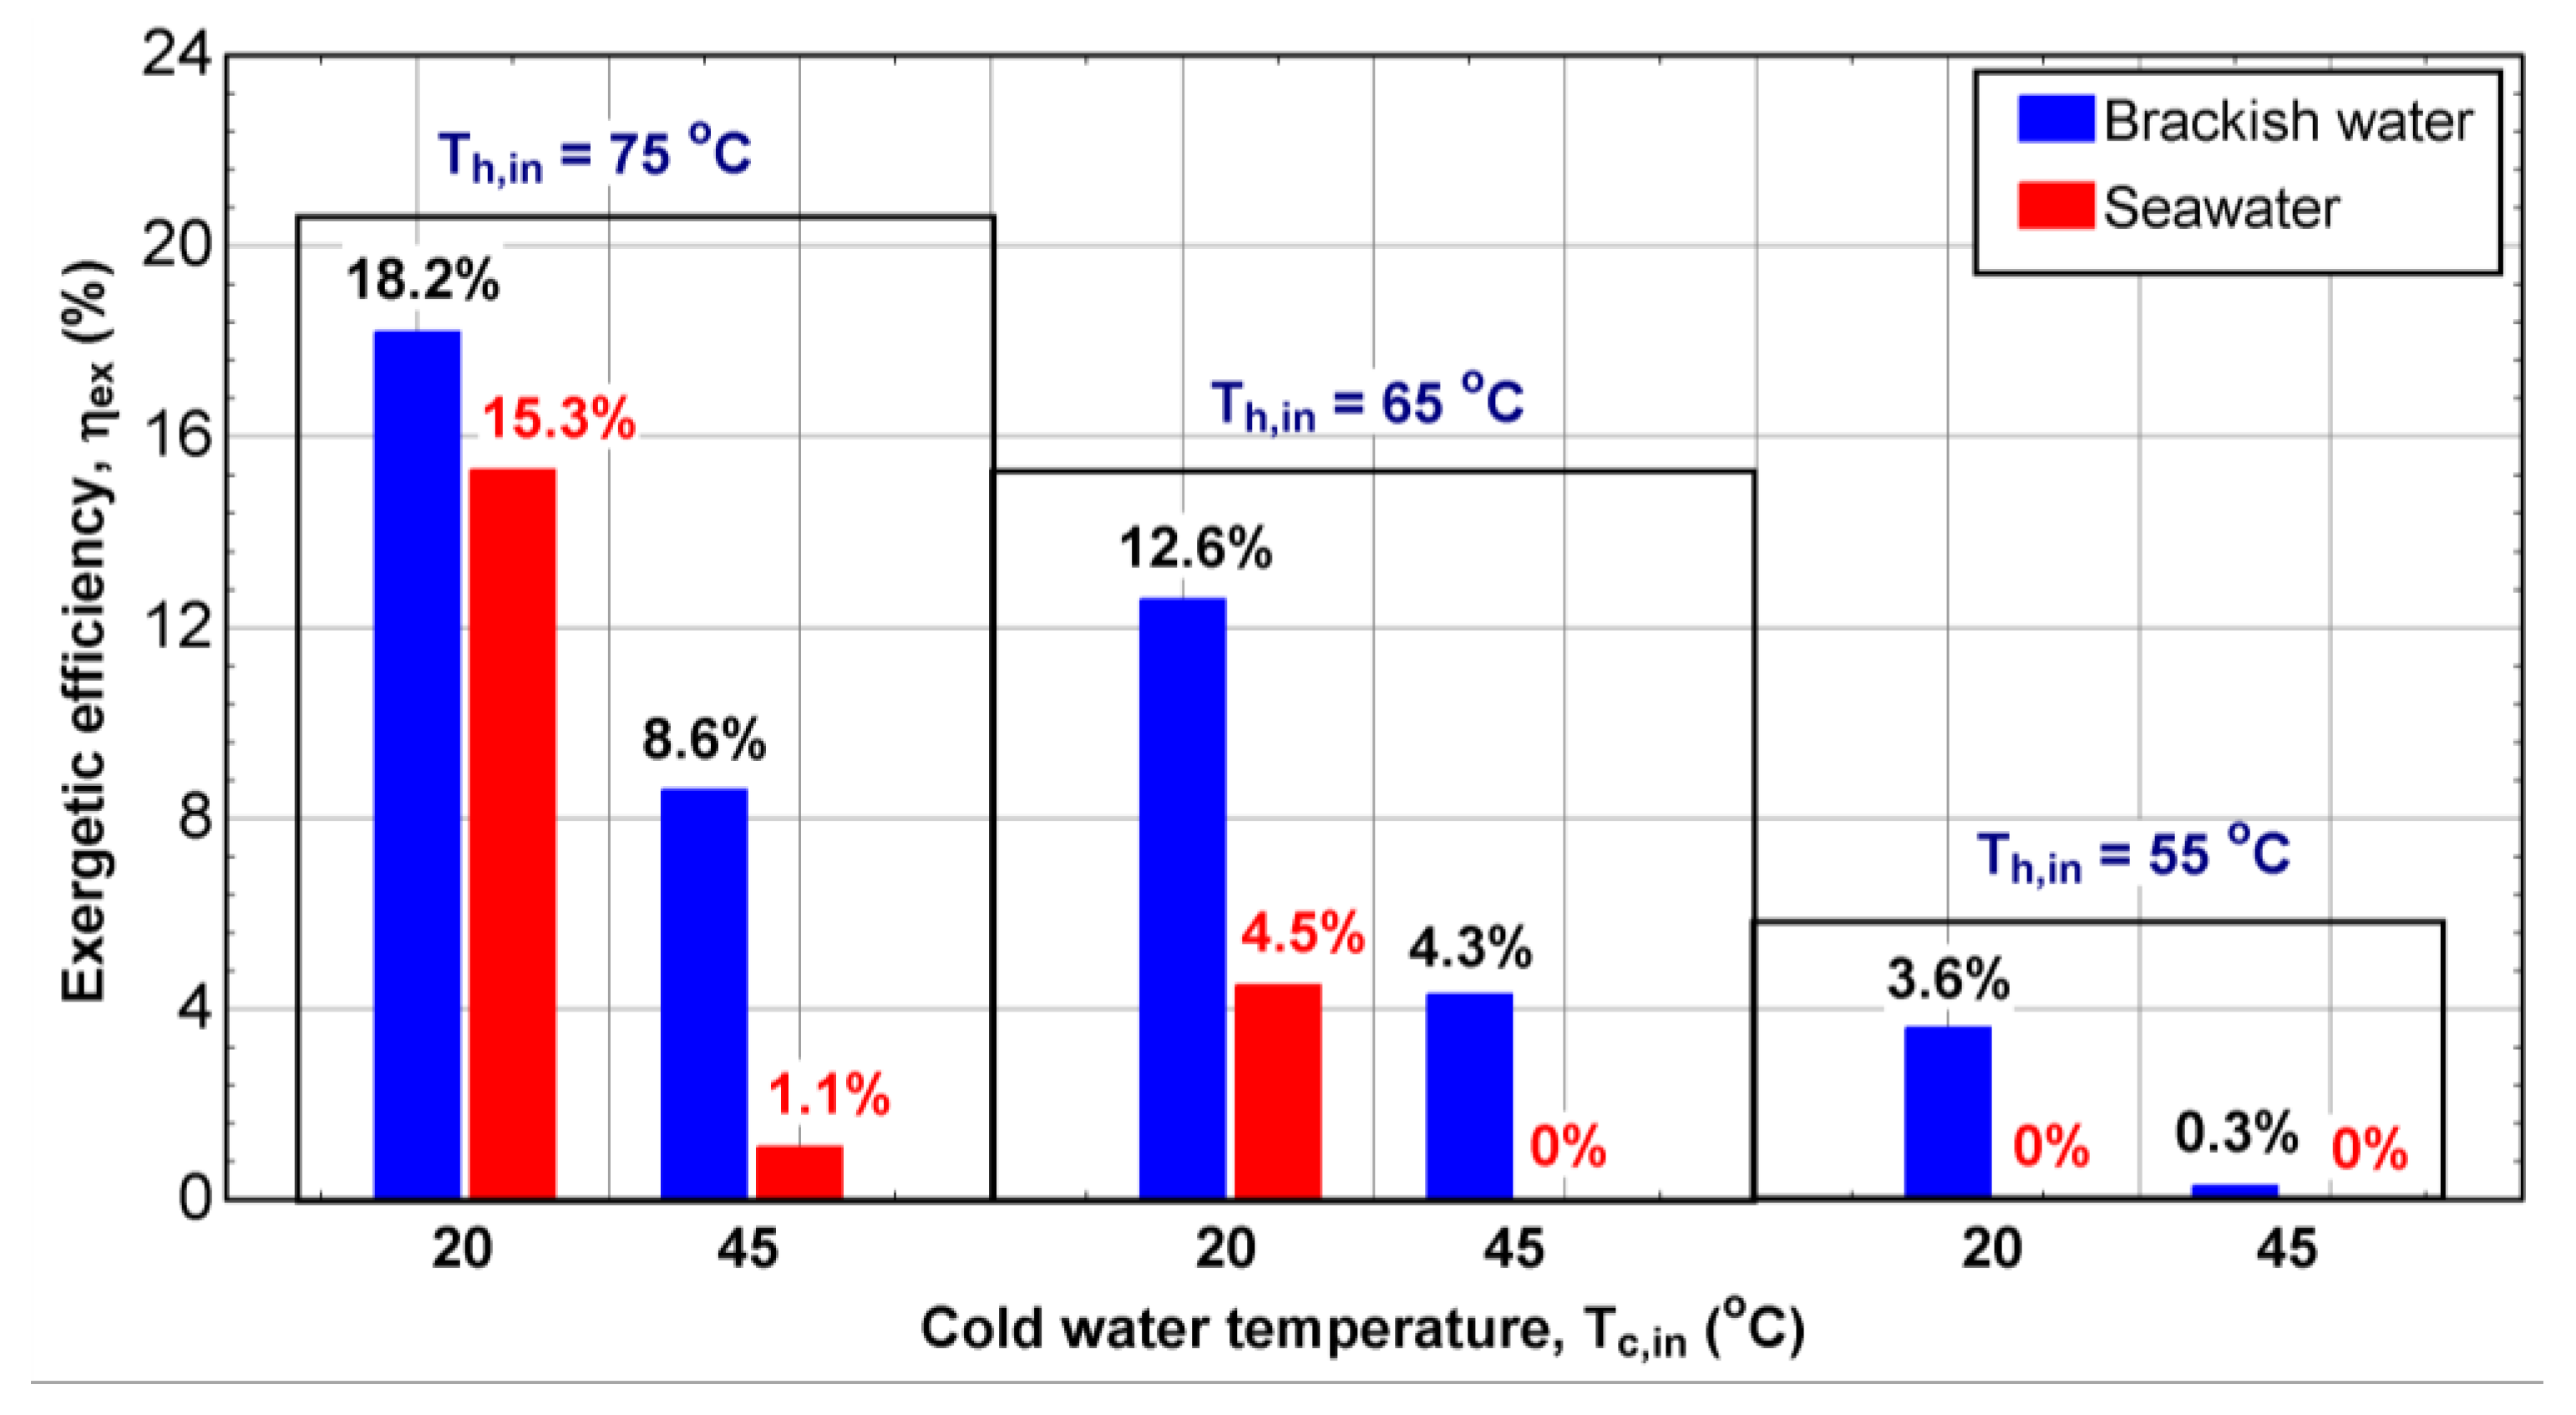
Figure 13 shows the exergetic efficiency of the V-MEMD unit under various operating conditions of inlet hot and cold water temperatures for both sea water and brackish water. The maximum values of the exergetic efficiency are expected at the highest inlet hot water temperature and the lowest inlet cold water temperature, and approach 18.2% for brackish water, and 15.3% for seawater. The exergy efficiency diminishes dramatically to a minimum value for both salinities as the inlet hot water temperature decreases. Similarly, the exergetic efficiency of the seawater desalination by VMD is very low when the inlet cold water temperature rests at a moderate value (45 °C), even when the inlet hot water temperature is high (75 °C). A significant difference in the exergetic efficiency between the seawater and brackish water at the lowest inlet hot water temperature is notable. These results indicate the important contribution of the chemical exergy associated with non-uniformity within the flow salinity. Therefore, the chemical exergy should be considered when evaluating the total exergy of saline waters.
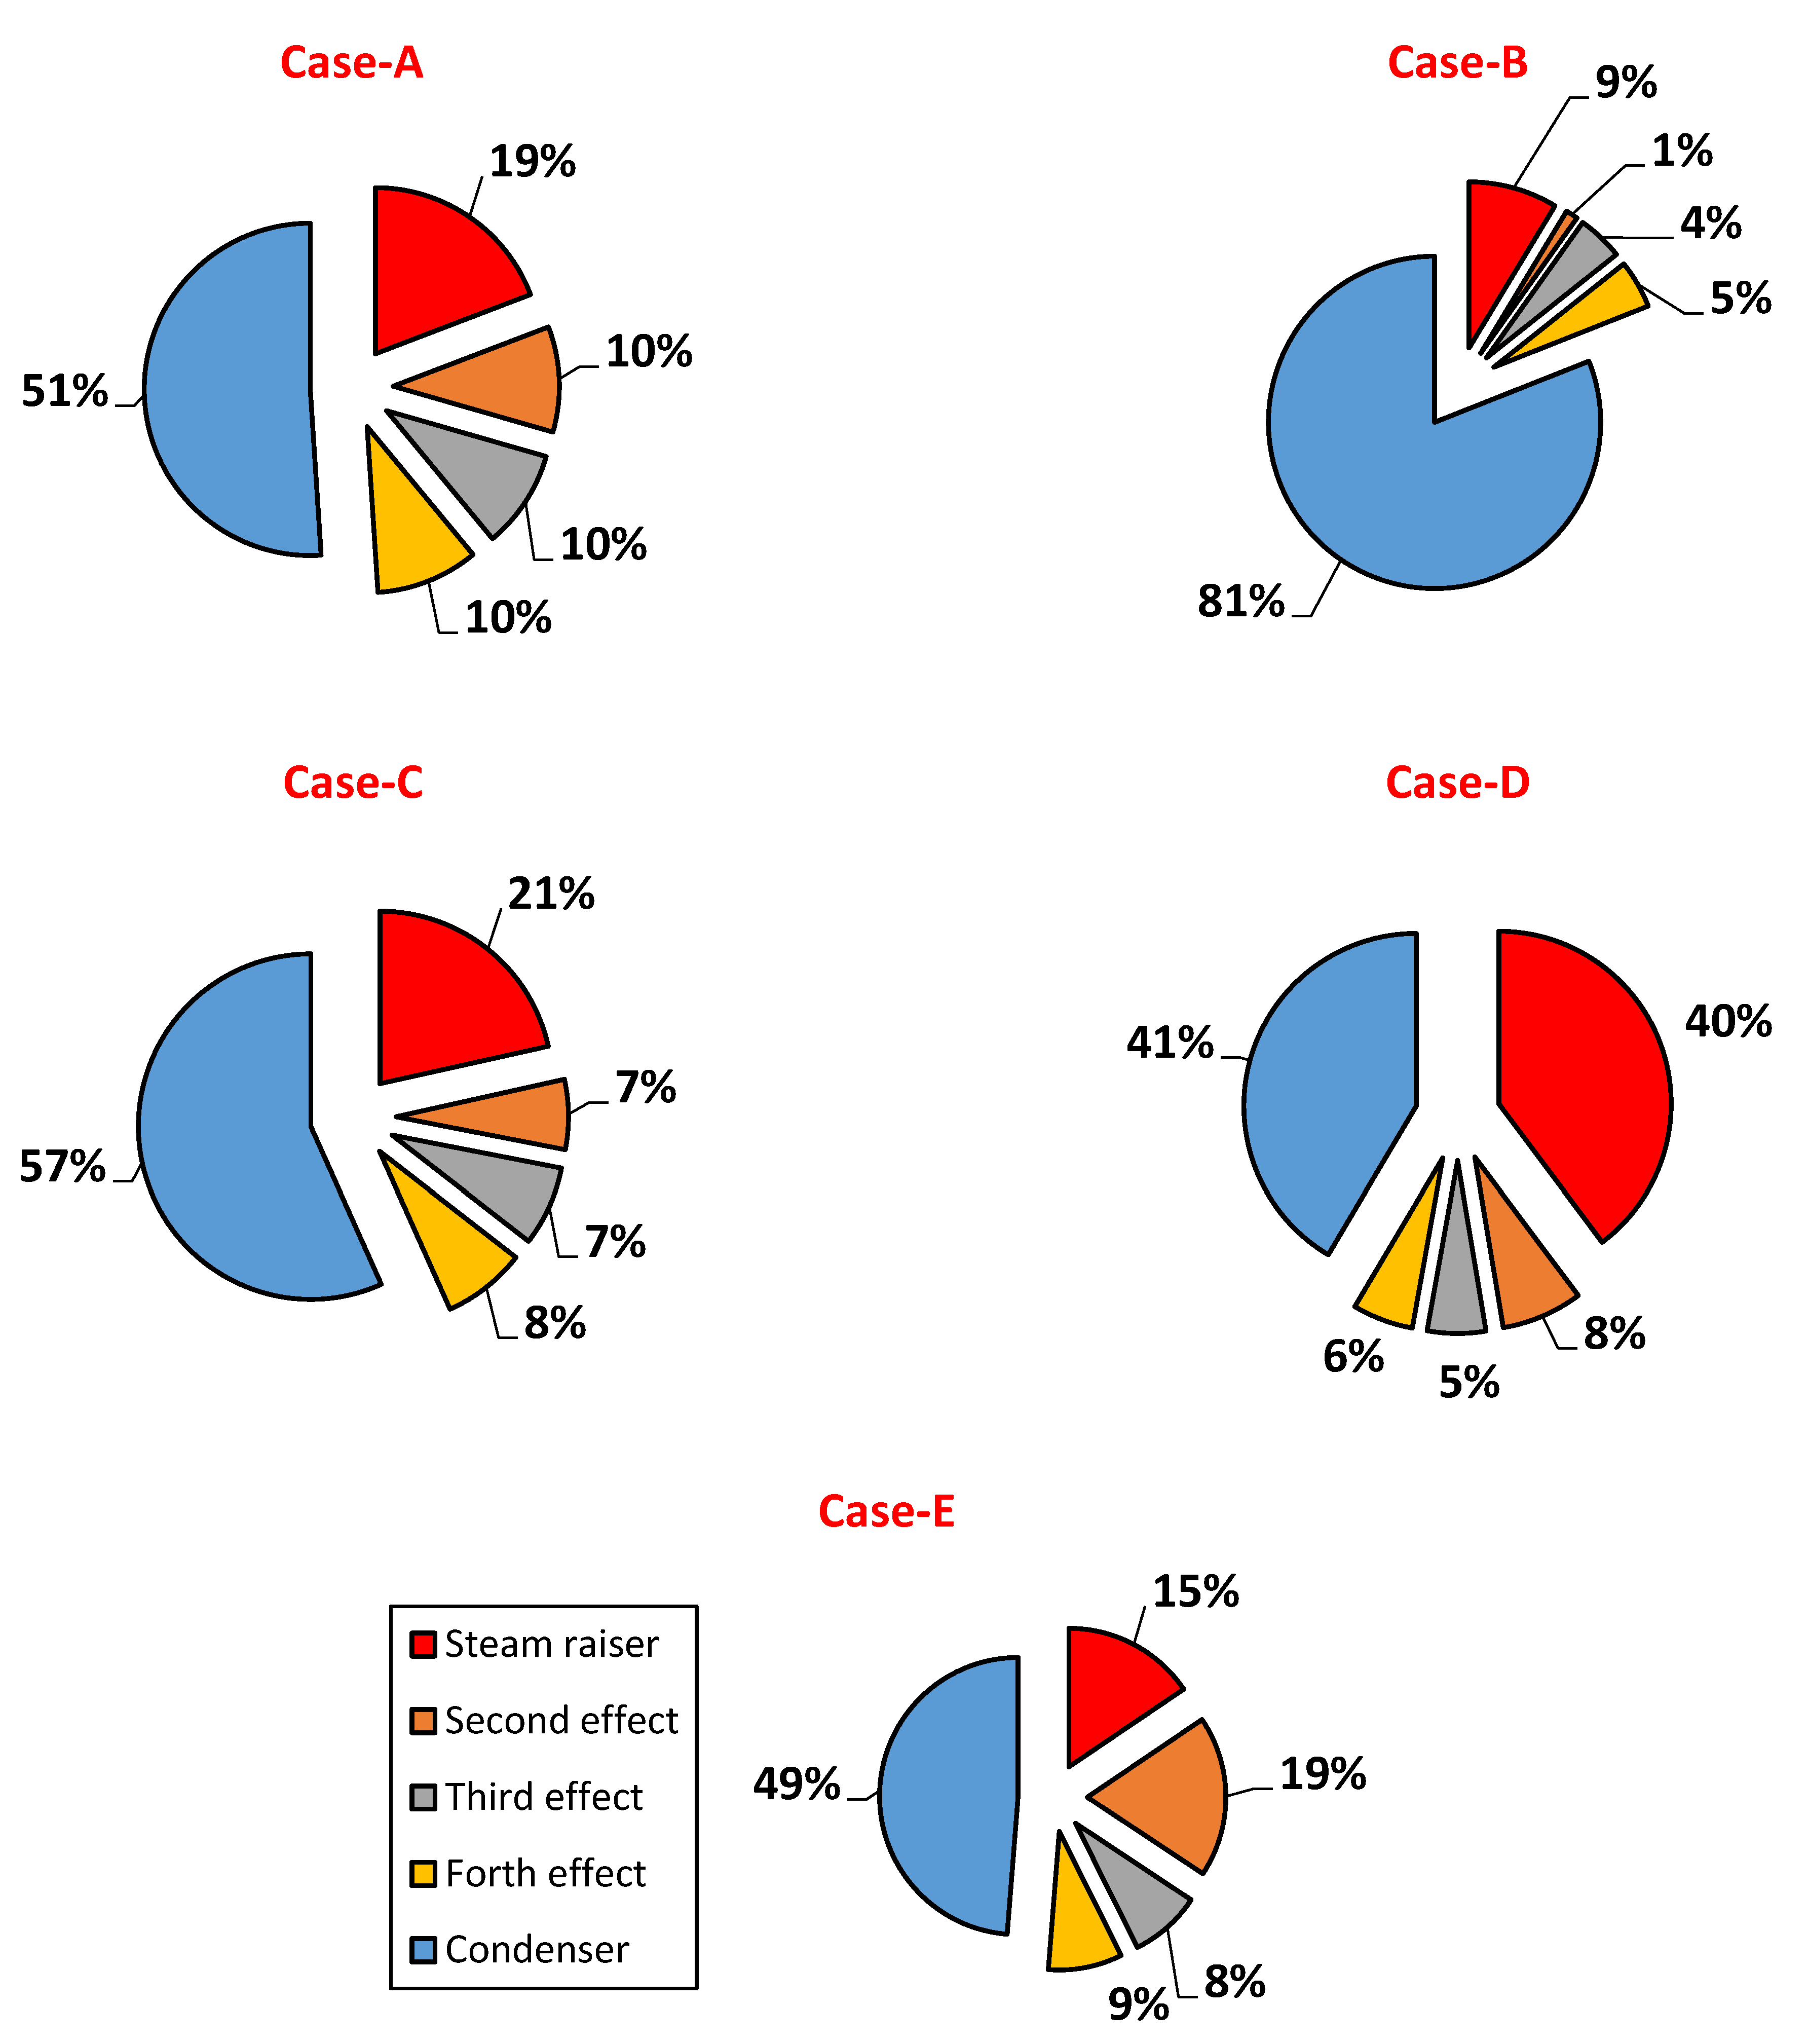
The evaluation of the exergy destruction in each component of V-MEMD system for the different cases listed in Table 5 is essential, as it indicates the location of the largest rates of irreversibility within the desalination unit. In the following section, Case-A was considered as the reference case. For Case-A, the highest percentage of exergy destruction was located in the condenser, which accounted for 51% (Figure 14). This portion may be ascribed to the absorption of the exergy through the cooling coil. In comparison, the remaining percentage was distributed evenly by 10% for each effect, except the steam raiser, which accounted for 19% due to the preheating step for the feed stream. In Case-B, the high convergence temperatures between the hot and feed water streams minimized the percentage of exergy destruction to 9% compared to the reference case (Case-A) in the steam raiser compartment. In contrast, it was observed that the minimum percentages of exergy destruction for each effect did not exceed 5%. This may be attributed to the minimal separation and low-temperature differences that occur in these effects. As discussed previously, an increase of the feed water flow at low temperature led to augmented thermal energy absorption, contextualizing the rise in exergy destruction by 21% and 57% in the steam raiser and condenser compartment, respectively. The maximum exergy destruction in the effects does not exceed 8% in Case-C. In Case-D, a low-temperature feed flow was injected into the V-MEMD system, causing the consumption of a large amount of the heating energy in the steam raiser compartment and, consequently, reducing the transfer of the latent heat to cascade effects. Thus, Case-D showed a lower percentage of exergy destruction compared to the reference case (Case-A). With regards to Case-E, the increase of the salinity in the feed flow did not result in a significant impact on the percentage of exergy destruction for the steam raiser, third compartment, fourth compartment, and the condenser compared to the reference case (Case-A). However, the second effect showed a high percentage of exergy destruction (19%) to the increasing amount of evaporation.
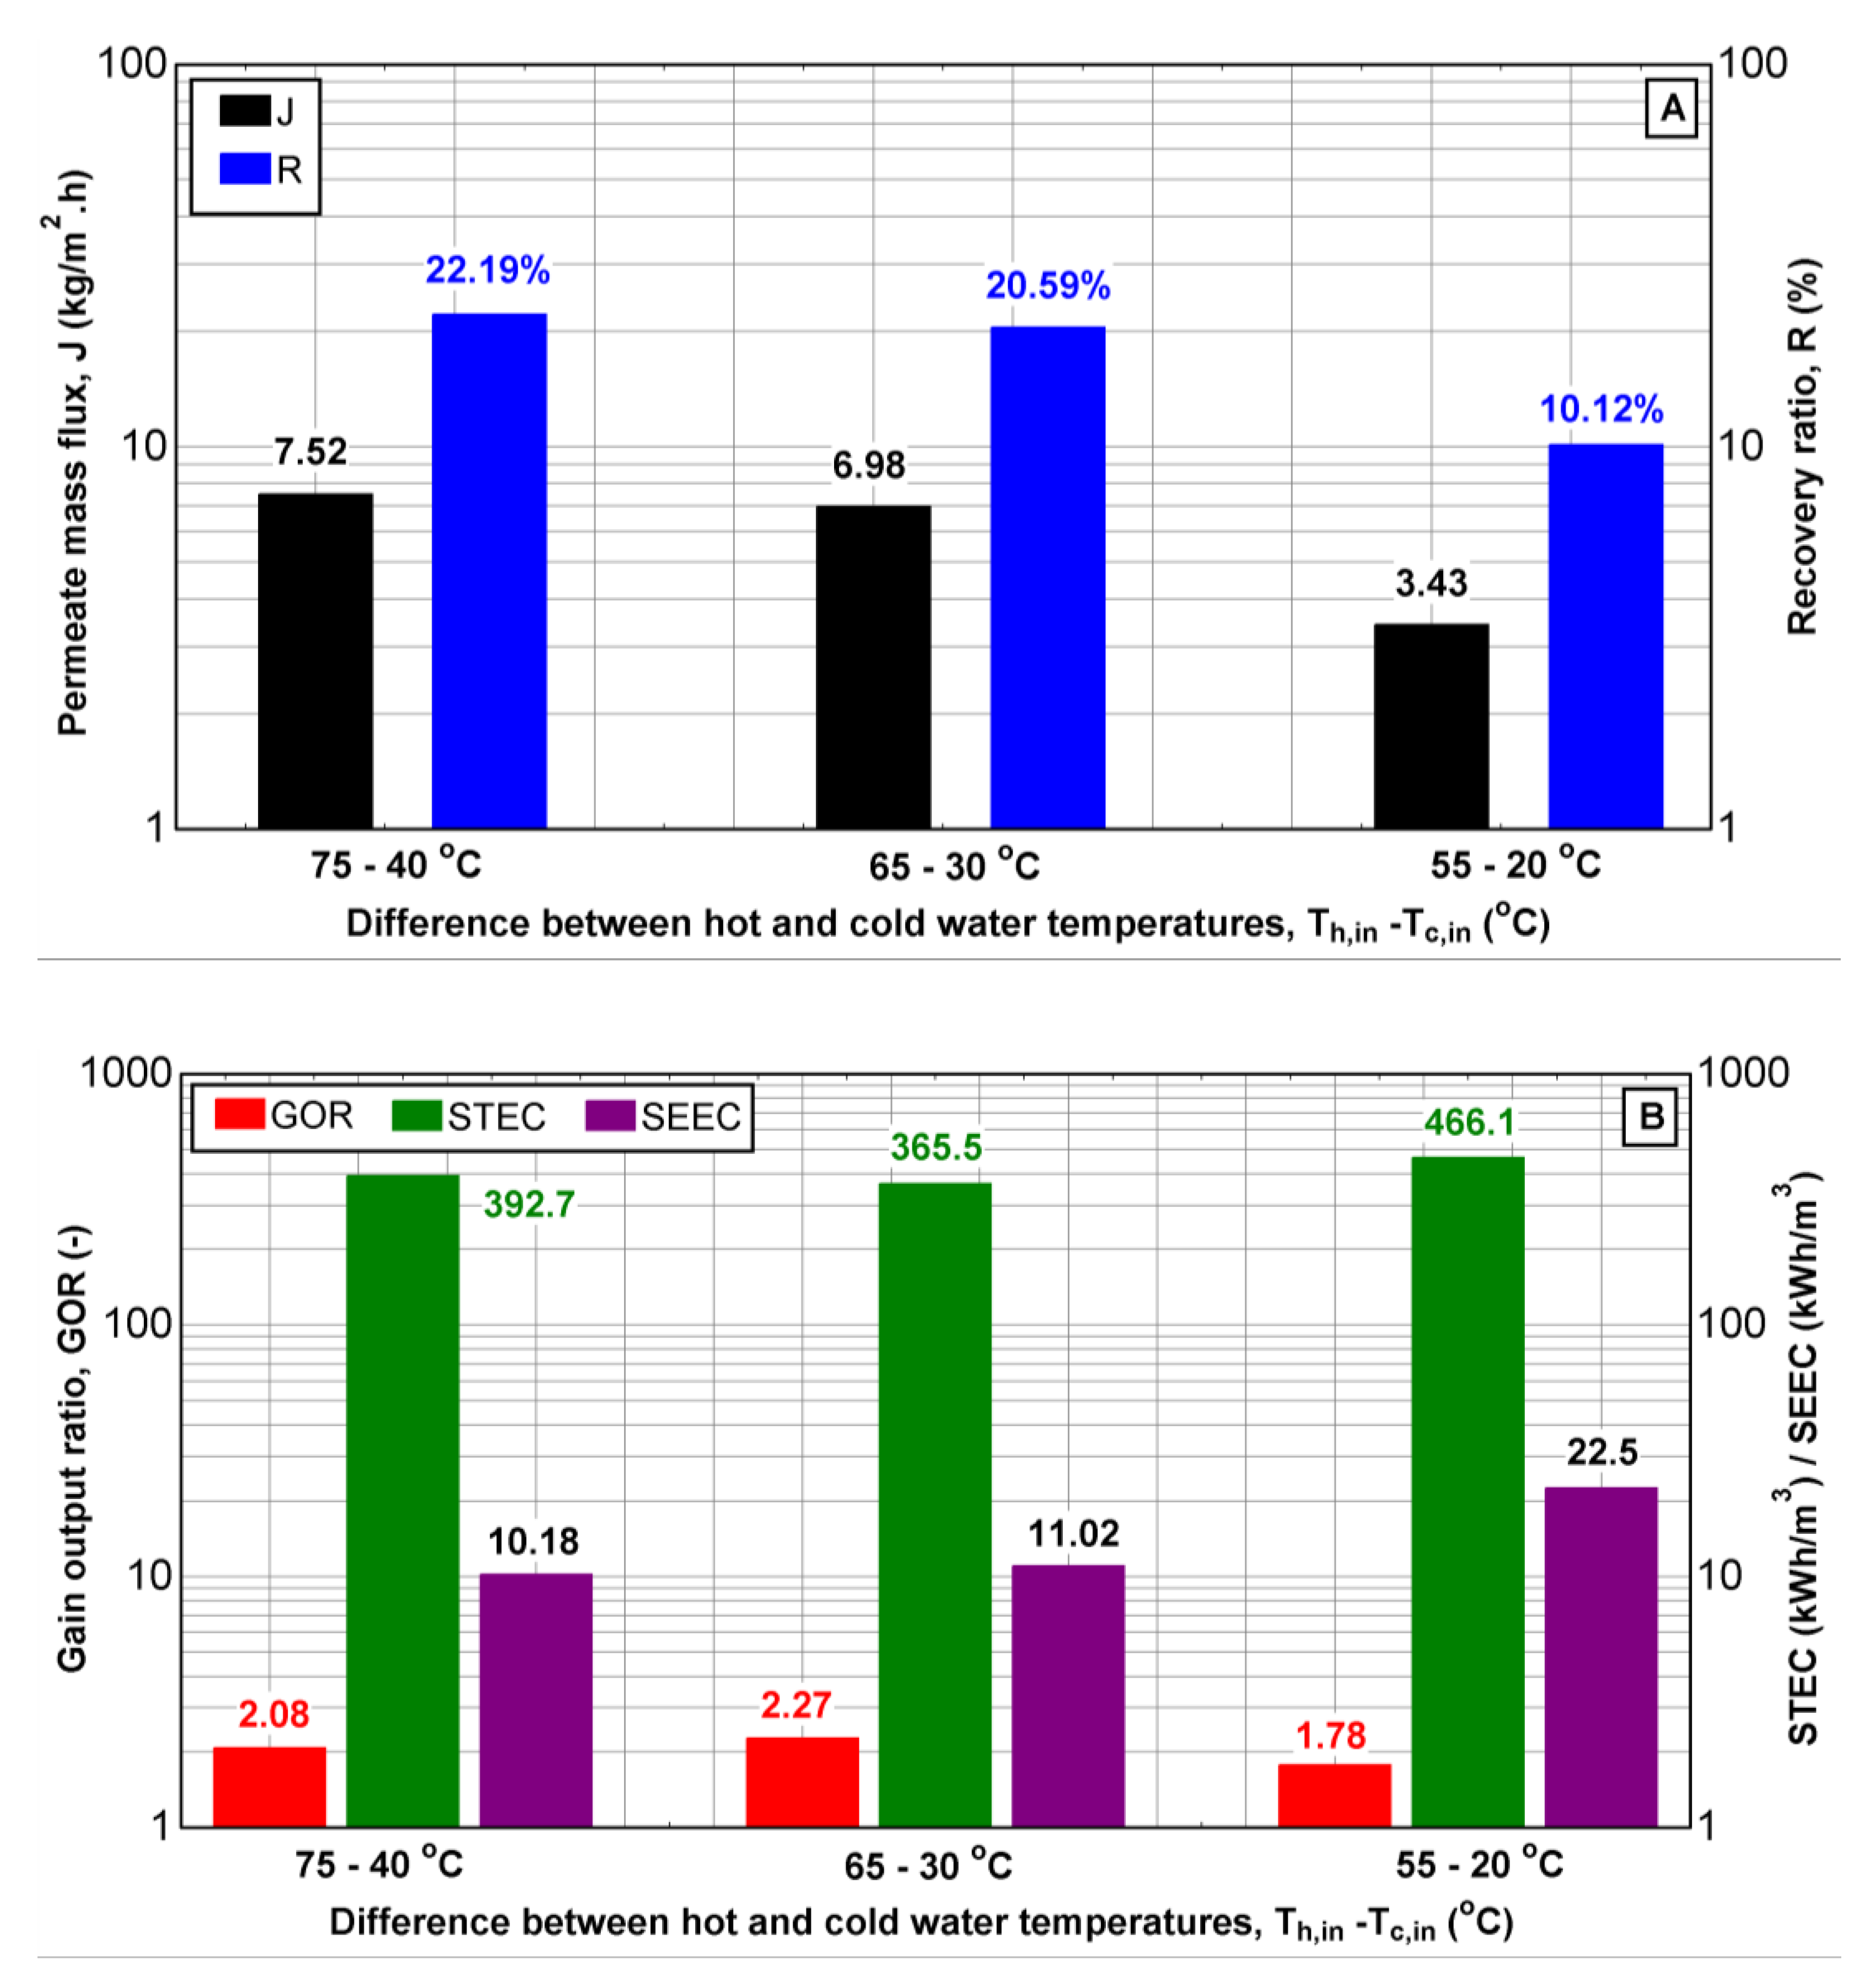
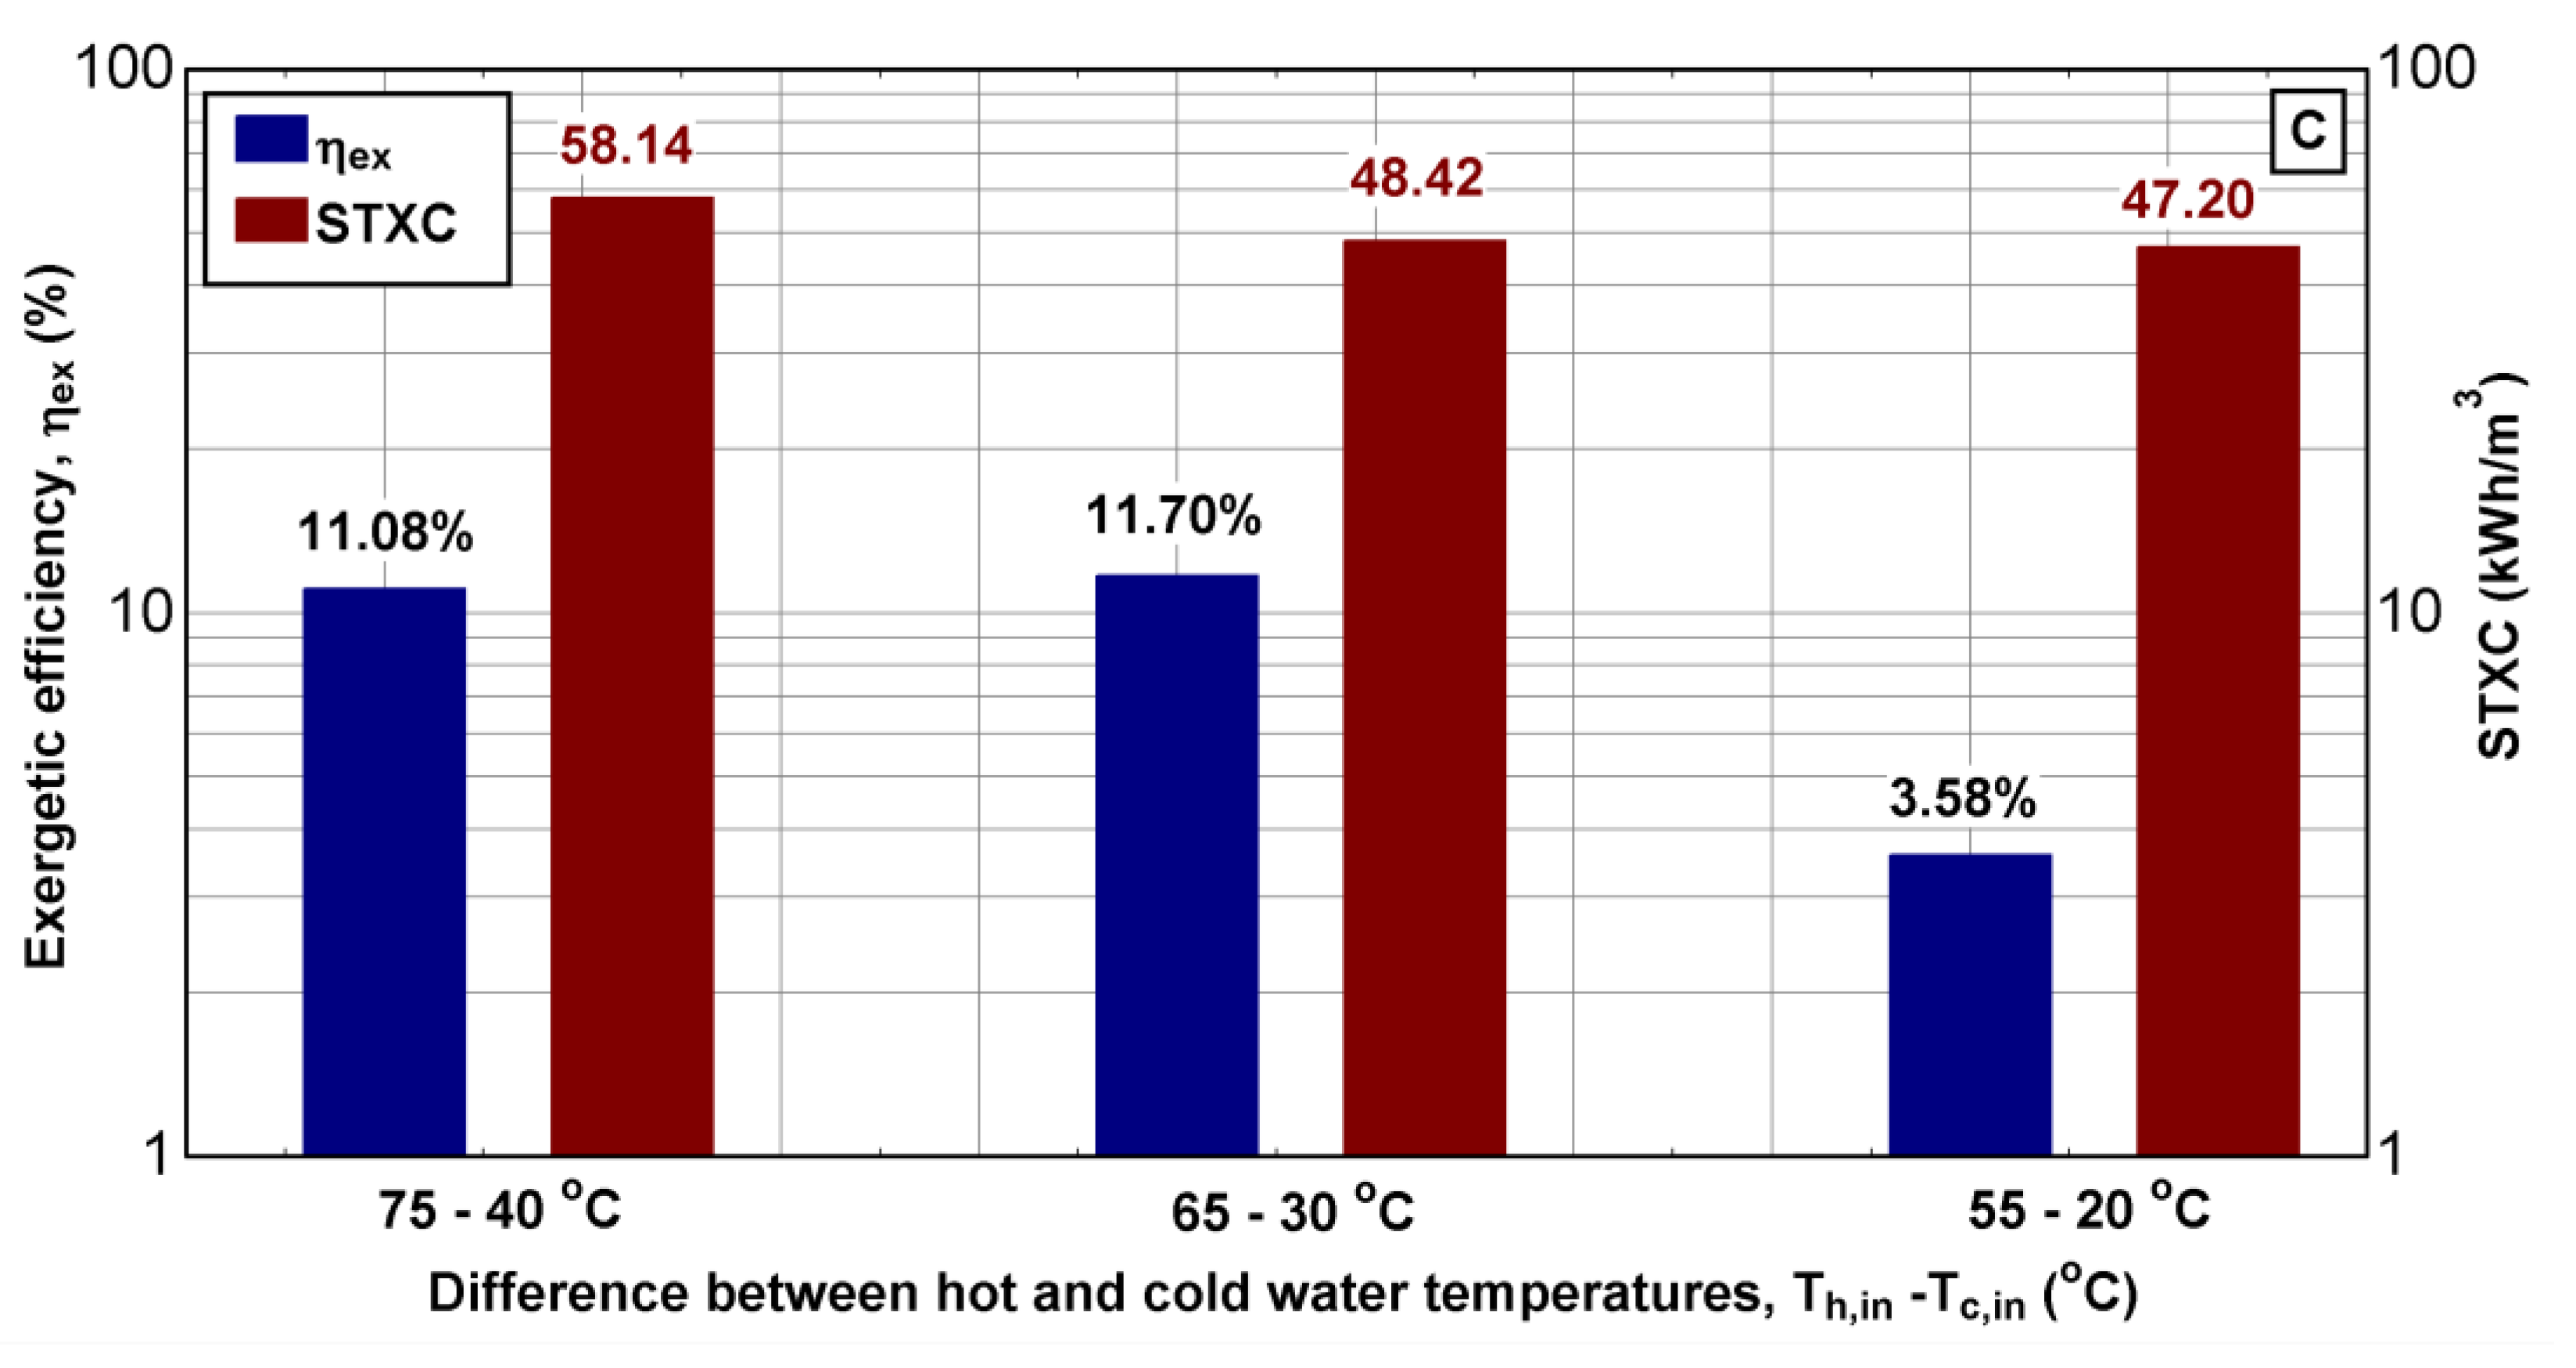
Figure 13 and Figure 14 reveal that the exergy parameters strongly depend not only on the difference between the hot and cold water temperatures, but also on the specific values of these temperatures. In the following section, we further clarify the impact of the inlet hot and cold water temperatures. The differential between the inlet hot and inlet cold water temperatures was maintained at 35 °C while the following pairs of inlet hot and cold water temperatures were varied as follows: Δ1 = 75–40 °C, Δ2 = 65–30 °C, and Δ3 = 55–20 °C. The results on the performance indicators of the V-MEMD unit are shown in Figure 15. The third difference (Δ3 = 55–20 °C) renders the least optimal results. Therefore, investing in lowering the inlet cold water temperature to obtain expansion between the steam raiser and the condenser may prove useless. This conclusion is supported by the fact that the productivity of Δ3 was less than that of Δ1 and Δ2 by 50–55%, as shown in Figure 15A. Likewise, its performance indicators (GOR and STEC) were 14–22% lower when compared to the others. Additionally, the SEEC was 51–55% lower than the others, as shown in Figure 15B. However, the specific thermal exergy consumption was slightly better than the others by 2–19%. Still, the exergetic efficiency of the V-MEMD unit under this difference condition lagged behind the others by almost ~69%, as shown in Figure 15C. Comparing the exergy parameters of the second difference (Δ2 = 65–30 °C) to the first (Δ1 = 75–40 °C), shows a slight discrepancy in terms of exergy efficiency, not exceeding 9%, but displays a larger discrepancy in terms of STXC, which is around 17%.
5. Conclusions
A multi-effect vacuum membrane distillation system was described and studied as a potential optimized desalination platform. A comprehensive study was conducted regarding the impact of input operating conditions on the performance indicators to better understand and operate such systems. The input parameters examined were the inlet hot water temperature, the inlet cold water temperature, feed water temperature, feed salinity, and feed water flow rates. The studied performance indicators were permeate mass flux, recovery ratio, gain output ratio, performance ratio, specific thermal energy consumption (STEC), specific electrical energy consumption (SEEC), exergetic efficiency ) specific electrical exergy consumption (STXC), and exergy destruction ).
This study revealed that optimal performance may be achieved at the highest hot water inlet temperature of Th,in = 75 °C, the lowest inlet cold water temperature of Tc,in = 20 °C, the highest feed water temperature of Tf,in = 75 °C, the lowest salinity 1260 ppm, and the highest feed water flow rate of 159 L/h when other input operating conditions were kept constant. Under these conditions, a maximum permeate mass flux of 17.2 kg/m2·h corresponding to a recovery ratio of 28.4% may be obtained. The corresponding performance ratio can reach 5.38% due to the thermal energy exchanged between the hot water stream and the V-MEMD system, a process based on the large amount of hot water mass compared to the temperature drop between the inlet and outlet hot water streams. The obtained GOR under these conditions was 5.05, which was slightly higher than other reported values for V-MEMD systems. The specific thermal energy consumption and specific electrical energy consumption reach 166 kWh/m3 and 4.5 kWh/m3, respectively. The highest feed water flow rate had a positive impact on the performance, especially when the feed water temperature was higher than 65 °C. This is attributed to the latent heat released from the steam raiser (evaporator). The highest achievable exergetic efficiency of the V-MEMD system was determined to be 21.1% when optimum input operating conditions were employed. This results from the enhancement of thermal energy recycling by increasing the number of effects. Additionally, the maximum percentage of exergy destruction (process irreversibility) was found in the condenser compartment due to energy absorbed by the cold stream.
Furthermore, interesting results were obtained from an evaluation of variable inlet hot and inlet cold water temperatures while maintaining constant differential. It was found that the lowest inlet cold water temperatures were not practical, and that STXC may be enhanced for larger inlet temperatures at the same fixed differential.
Author Contributions
Conceptualization, J.O. and H.A.; methodology, J.O.; software, A.N.; validation, A.N., E.A. and J.O.; formal analysis, J.O.; investigation, A.N.; resources, H.A.; data curation, A.N.; writing—original draft preparation, A.N.; writing—review and editing, J.O., E.A.; visualization, E.A.; supervision, J.O.; project administration, H.A.; funding acquisition, H.A. All authors have read and agreed to the published version of the manuscript.
Funding
This research was funded by King Saud University, Deanship of Scientific Research, Research Group no (RG-VPP 091).
Institutional Review Board Statement
Not applicable.
Informed Consent Statement
Not applicable.
Data Availability Statement
The study does not report any data.
Acknowledgments
The project was supported by King Saud University, Deanship of Scientific Research, Research Group no (RG-VPP 091).
Conflicts of Interest
The authors declare no conflict of interest.
Nomenclature
| A | Total surface area, m2 |
| Cm | Membrane mass flux coefficient, kg/m2 Pa h |
| dp | Mean pore diameter, m |
| dh,s | Hydraulic diameter of spacer-filled channel, m |
| df | Filament size, m |
| E0 | Electric energy, W |
| Gain output ratio | |
| hsp | Spacer thickness, m |
| Latent heat, J/kg | |
| Specific enthalpy of outlet hot water, J/kg | |
| Specific enthalpy of inlet hot water, J/kg | |
| Permeate mass flux, kg/m2 h | |
| Kn | Knudsen number |
| kB | Boltzman constant, J/K |
| kf | Feed water conductivity, W/m K |
| Kd,c | Correction factor |
| l | Mean free path, |
| lm | Mesh size, m |
| Mwater | Molecular weight of water, kg/kmol |
| Mair | Molecular weight of air, kg/kmol |
| m | Mass flow rate, kg/s |
| Mass flow rate of outlet hot water, kg/s | |
| Mass flow rate of inlet hot water, kg/s | |
| Nusselt number | |
| Atmosphere pressure, mbar | |
| Pressure of inlet hot water, mbar | |
| Vapor pressure of feed, mbar | |
| Cold-side absolute pressure, mbar | |
| Prandtl number | |
| Recovery ratio,% | |
| Performance ratio, % | |
| Reynold’s number | |
| Entropy generation, W/K | |
| Specific entropy of outlet hot water, J/kg K | |
| Specific entropy of inlet hot water, J/kg K | |
| Specific electrical energy consumption, kWh/m3 | |
| Specific thermal energy consumption, kWh/m3 | |
| Specific thermal exergy consumption, kWh/m3 | |
| Atmosphere temperature, °C | |
| Dead state temperature, °C | |
| Average interface temperatures, °C | |
| Distillate temperature, °C | |
| Inlet hot water temperature, °C | |
| Outlet hot water temperature, °C | |
| Inlet cold water temperature, °C | |
| Outlet cold water temperature, °C | |
| Steam temperature, °C | |
| Feed water temperature, °C | |
| Interface between feed and membrane temperature, °C | |
| Foil temperature, °C | |
| w | Feed salinity, ppm |
| Width of effect, m | |
| Minimum work, W | |
| Volume flow rate, L/h | |
| Distillate flow rate, L/h | |
| Hot water flow rate, L/h | |
| Feed water flow rate, L/h | |
| Cold water flow rate, L/h | |
| Greek | |
| Porosity | |
| Tortuosity | |
| Membrane thickness, m | |
| ρ | Density, kg/m3 |
| µ | Viscosity, kg/m s |
| Heat, W | |
| Film condensate thickness, m | |
| Efficiency, % | |
| Heat transfer coefficient, W/m2 K | |
| Polarization concentration factor | |
| Collision diameter of water vapor, m | |
| Collision diameter of air, m | |
| Hydrodynamics angle | |
| Exergy flow, W | |
| Subscript | |
| h | Hot water |
| c | cold water |
| f | Feed water |
| d | Distillate water |
| b | Brine |
| e | effect |
| i | ith effect |
| N | Number of effects |
| ex | exergy |
| l | latent |
| m | Membrane |
| s | Bulk |
| v | Vapor water |
References
- Khayet, M. Solar desalination by membrane distillation: Dispersion in energy consumption analysis and water production costs (a review). Desalination 2013, 308, 89–101. [Google Scholar] [CrossRef]
- Qtaishat, M.R.; Banat, F. Desalination by solar powered membrane distillation systems. Desalination 2013, 308, 186–197. [Google Scholar] [CrossRef]
- Meindersma, G.; Guijt, C.; De Haan, A. Desalination and water recycling by air gap membrane distillation. Desalination 2006, 187, 291–301. [Google Scholar] [CrossRef]
- Mericq, J.-P.; Laborie, S.; Cabassud, C. Vacuum membrane distillation of seawater reverse osmosis brines. Water Res. 2010, 44, 5260–5273. [Google Scholar] [CrossRef] [PubMed]
- Bouguecha, S.T.; Aly, S.E.; Al-Beirutty, M.H.; Hamdi, M.M.; Boubakri, A. Solar driven DCMD: Performance evaluation and thermal energy efficiency. Chem. Eng. Res. Des. 2015, 100, 331–340. [Google Scholar] [CrossRef]
- Lee, J.-G.; Kim, W.-S.; Choi, J.-S.; Ghaffour, N.; Kim, Y.-D. Dynamic solar-powered multi-stage direct contact membrane distillation system: Concept design, modeling and simulation. Desalination 2018, 435, 278–292. [Google Scholar] [CrossRef]
- Najib, A.; Orfi, J.; Ali, E.; Saleh, J. Thermodynamics analysis of a direct contact membrane distillation with/without heat recovery based on experimental data. Desalination 2019, 466, 52–67. [Google Scholar] [CrossRef]
- Ong, C.L.; Escher, W.; Paredes, S.; Khalil, A.; Michel, B. A novel concept of energy reuse from high concentration photovoltaic thermal (HCPVT) system for desalination. Desalination 2012, 295, 70–81. [Google Scholar] [CrossRef]
- Zhao, K.; Heinzl, W.; Wenzel, M.; Büttner, S.; Bollen, F.; Lange, G.; Heinzl, S.; Sarda, N. Experimental study of the memsys vacuum-multi-effect-membrane-distillation (V-MEMD) module. Desalination 2013, 323, 150–160. [Google Scholar] [CrossRef]
- Zaragoza, G.; Ruiz-Aguirre, A.; Guillén-Burrieza, E. Efficiency in the use of solar thermal energy of small membrane desalination systems for decentralized water production. Appl. Energy 2014, 130, 491–499. [Google Scholar] [CrossRef]
- Andrés-Mañas, J.; Ruiz-Aguirre, A.; Acién, F.; Zaragoza, G. Assessment of a pilot system for seawater desalination based on vacuum multi-effect membrane distillation with enhanced heat recovery. Desalination 2018, 443, 110–121. [Google Scholar] [CrossRef]
- Najib, A.; Orfi, J.; Alansary, H.; Ali, E.; Abdulwahed, Z.; Alzahrani, S.; Chafidz, A. An experimental investigation of a solar-driven desalination system based on multi-effect membrane distillation. Desalin. Water Treat. 2020, 198, 1–18. [Google Scholar] [CrossRef]
- Mohamed, E.S.; Boutikos, P.; Mathioulakis, E.; Belessiotis, V. Experimental evaluation of the performance and energy efficiency of a Vacuum Multi-Effect Membrane Distillation system. Desalination 2017, 408, 70–80. [Google Scholar] [CrossRef]
- Boutikos, P.; Mohamed, E.S.; Mathioulakis, E.; Belessiotis, V. A theoretical approach of a vacuum multi-effect membrane distillation system. Desalination 2017, 422, 25–41. [Google Scholar] [CrossRef]
- He, F.; Gilron, J.; Sirkar, K.K. High water recovery in direct contact membrane distillation using a series of cascades. Desalination 2013, 323, 48–54. [Google Scholar] [CrossRef]
- Chen, Q.; Ja, M.K.; Li, Y.; Chua, K. Thermodynamic optimization of a vacuum multi-effect membrane distillation system for liquid desiccant regeneration. Appl. Energy 2018, 230, 960–973. [Google Scholar] [CrossRef]
- Koschikowski, J.; Wieghaus, M.; Rommel, M. Solar thermal-driven desalination plants based on membrane distillation. Desalination 2003, 156, 295–304. [Google Scholar] [CrossRef]
- Najib, A.; Orfi, J.; Ali, E.; Ajbar, A.; Boumaaza, M.; Alhumaizi, K. Performance analysis of cascaded membrane distillation arrangements for desalination of brackish water. Desalin. Water Treat. 2017, 76, 19–29. [Google Scholar] [CrossRef]
- Chafidz, A.; Al-Zahrani, S.; Al-Otaibi, M.; Hoong, C.; Lai, T.; Prabu, M. Portable and integrated solar-driven desalination system using membrane distillation for arid remote areas in Saudi Arabia. Desalination 2014, 345, 36–49. [Google Scholar] [CrossRef]
- Phattaranawik, J.; Jiraratananon, R.; Fane, A.; Halim, C. Mass flux enhancement using spacer filled channels in direct contact membrane distillation. J. Membr. Sci. 2001, 187, 193–201. [Google Scholar] [CrossRef]
- Da Costa, A.; Fane, A.; Wiley, D. Spacer characterization and pressure drop modelling in spacer-filled channels for ultrafiltration. J. Membr. Sci. 1994, 87, 79–98. [Google Scholar] [CrossRef]
- Lei, Z.; Chen, B.; Ding, Z. Special Distillation Processes; Elsevier: Amsterdam, The Netherlands, 2005. [Google Scholar]
- Kast, W.; Hohenthanner, C.-R. Mass transfer within the gas-phase of porous media. Int. J. Heat Mass Transf. 2000, 43, 807–823. [Google Scholar] [CrossRef]
- Andrjesdóttir, Ó.; Ong, C.L.; Nabavi, M.; Paredes, S.; Khalil, A.; Michel, B.; Poulikakos, D. An experimentally optimized model for heat and mass transfer in direct contact membrane distillation. Int. J. Heat Mass Transf. 2013, 66, 855–867. [Google Scholar] [CrossRef]
- Cussler, E.L. Diffusion: Mass Transfer in Fluid Systems; Cambridge University Press: Cambridge, UK, 2009. [Google Scholar]
- Nakoa, K.; Date, A.; Akbarzadeh, A. A research on water desalination using membrane distillation. Desalin. Water Treat. 2015, 56, 2618–2630. [Google Scholar] [CrossRef]
- Luo, A.; Lior, N. Critical review of membrane distillation performance criteria. Desalin. Water Treat. 2016, 57, 20093–20140. [Google Scholar] [CrossRef]
- Miladi, R.; Frikha, N.; Gabsi, S. Exergy analysis of a solar-powered vacuum membrane distillation unit using two models. Energy 2017, 120, 872–883. [Google Scholar] [CrossRef]
- Burhan, M.; Shahzad, M.W.; Ybyraiymkul, D.; Oh, S.J.; Ghaffour, N.; Ng, K.C. Performance investigation of MEMSYS vacuum membrane distillation system in single effect and multi-effect mode. Sustain. Energy Technol. Assess. 2019, 34, 9–15. [Google Scholar] [CrossRef]
- Wang, Y.; Xu, Z.; Lior, N.; Zeng, H. An experimental study of solar thermal vacuum membrane distillation desalination. Desalin. Water Treat. 2015, 53, 887–897. [Google Scholar] [CrossRef]
Figure 1.
Photographs of pilot plant facilities (A) PP foil [19], (B) The hydrophobic membrane (PTFE) [19], (C) MD module, and (D) The V-MEMD unit.

Figure 2.
Schematic diagram showing the principle of V-MEMD.

Figure 3.
Simplified schematic diagram and control volumes of the V-MEMD system including the stream raiser, a typical effect, and the condenser.
Figure 3.
Simplified schematic diagram and control volumes of the V-MEMD system including the stream raiser, a typical effect, and the condenser.

Figure 4.
Conceptual scheme for the determination of the exergetic efficiency.

Figure 5.
Solution algorithm.

Figure 6.
Comparison between experiment measurements and numerical predicted values for (A) distillate water flowrates and (B) temperatures.
Figure 6.
Comparison between experiment measurements and numerical predicted values for (A) distillate water flowrates and (B) temperatures.

Figure 7.
Numerical results of feed water temperatures, effect temperatures and distillate water throughout effects for different cold water temperatures.
Figure 7.
Numerical results of feed water temperatures, effect temperatures and distillate water throughout effects for different cold water temperatures.

Figure 8.
Numerical results of feed water temperatures, effect temperatures and distillate water throughout effects for different feed water temperatures (Tc,in = 25 °C).
Figure 8.
Numerical results of feed water temperatures, effect temperatures and distillate water throughout effects for different feed water temperatures (Tc,in = 25 °C).

Figure 9.
Effect of cold water temperature, Tc,in, on (A) permeate mass flux, (B) recovery ratio, (C) gain output ratio, (D) performance ratio, (E) specific thermal energy consumption, and (F) specific electrical energy consumption for different hot water temperatures and salinities ( = 840 L/h, = 405 L/h, = 87 L/h, Tf,in = 25 °C, and Pa,vac = 115 mbar).

Figure 10.
Effect of feed water temperature Tf,in on (A) permeate mass flux, (B) recovery ratio, (C) gain output ratio, (D) performance ratio, (E) specific thermal energy consumption, and (F) specific electrical energy consumption for different cold water temperatures and salinities ( = 840 L/h, Th,in = 75 °C, = 405 L/h, = 87 L/h, and Pa,vac = 115 mbar).


Figure 11.
Effect of feed water temperature Tf,in on (A) permeate mass flux, (B) recovery ratio, (C) gain output ratio, (D) performance ratio, (E) specific thermal energy consumption, and (F) specific electrical energy consumption for different feed water flowrates ( = 840 L/h, Th,in = 75 °C, = 405 L/h, Tc,in = 20 °C, w = 1260 ppm, and Pa,vac = 115 mbar).

Figure 12.
Variation of the specific thermal exergy consumption (STXC) with (A) inlet cold water temperature for different inlet hot water temperatures, and (B) feed water temperature for different feed water flow rates ( = 840 L/h, = 405 L/h, w = 1260 ppm, and Pa,vac = 115 mbar).
Figure 12.
Variation of the specific thermal exergy consumption (STXC) with (A) inlet cold water temperature for different inlet hot water temperatures, and (B) feed water temperature for different feed water flow rates ( = 840 L/h, = 405 L/h, w = 1260 ppm, and Pa,vac = 115 mbar).

Figure 13.
Variation of the exergetic efficiency for different inlet hot and cold water temperatures for brackish and sea waters ( = 840 L/h, = 405 L/h, = 87 L/h, Tf,in = 25 °C, and Pa,vac = 115 mbar).
Figure 13.
Variation of the exergetic efficiency for different inlet hot and cold water temperatures for brackish and sea waters ( = 840 L/h, = 405 L/h, = 87 L/h, Tf,in = 25 °C, and Pa,vac = 115 mbar).

Figure 14.
Exergy destruction for the various components of the V-MEMD system under the input conditions specified in Table 5. (Case-A): reference case; (Case-B): ; (Case-C): ; (Case-D): ; (Case-E): .
Figure 14.
Exergy destruction for the various components of the V-MEMD system under the input conditions specified in Table 5. (Case-A): reference case; (Case-B): ; (Case-C): ; (Case-D): ; (Case-E): .

Figure 15.
Effect of the difference between hot and cold water temperatures on (A) permeate flux and recovery ratio, (B) gain output ratio, specific thermal energy consumption, and specific electrical energy consumption, (C) exergetic efficiency, and specific thermal exergy consumption ( = 840 L/h, = 405 L/h, = 87 L/h, Tf,in = 25 °C, w = 1260 ppm, and Pa,vac = 115 mbar).


| Reference Number | Ong et al. [8] | Zaragoza et al. [10] | Boutikos et al. [14] | Najib et al. [12] | Andres-Manas et al. [11] |
|---|---|---|---|---|---|
| Membrane area (m2) | 15.2 | 5.76 | 6.3 | 5.12 | 6.4 |
| Feed-water type | Saline water and brackish water | Seawater and brackish water | Tap water and saline water | Brackish water | Seawater |
| Hot water temperature (°C) | approximately 75–80 | 85 | 50–90 | 55–75 | 60–80 |
| Feed-flow rate (L/min) | 1.9–5.6 | approximately 1.17 | 1–1.33 | 1.45–2.32 | 1.5–3 |
| feed-water type | Saline and brackish water | Seawater and brackish water | Tap water and saline water | Brackish water | Seawater |
| Distillate conductivity (µS/cm) | N/A | 4–6 | N/A | <10 | approximately 3–35 |
| Water output (L/h) | 125 | N/A | 10–32 | 0–31.8 | approximately 15–55 b |
| Permeate mass flux (kg/m2·h) | 16.4 b | approximately 14 b | 3.2–10.2 b | 0–12.24 | 2.4–8.5 |
| Recovery ratio (%) | approximately 39–47 | 58–59 | 12.5–40 | 0–36.8 | 8.5–40.3 |
| GOR (-) | approximately 3.8–4.3 | N/A | 2.46–2.63 | 0–4.25 | 1.7–3.2 |
| Specific electrical-energy consumption (kWh/m3) | 70.2 b | 18–20 | N/A | 6.3–47.6 | 5–20 |
| Specific thermal-energy consumption (kWh/m3) | approximately 128.1 b | 200–400 | 252–273.8 | 150.9–674.5 | 200–207.7 |
N/A: Not available. b Values calculated using the reported data.
Table 2.
Characteristics and specifications of the VMD unit.
| Character of Layer | Detail |
|---|---|
| Hydrophobic membrane | Polytetrafluoroethylene (PTFE) |
| Foil | Polypropylene (PP) |
| Dimension | 335 mm × 475 mm |
| Effective area of one effect | 0.64 m2 |
| Membrane thickness | 0.12–0.2 mm |
| Porosity | 75% |
| Tortuosity | ~1.33 |
| Mean pore size | ~0.2 µm |
Table 3.
Characteristics of coarse and fine spacers.
| Spacer | hsp × 103 (m) | df × 103 (m) | lm × 103 (m) | dh × 103 (m) | (o) | |
|---|---|---|---|---|---|---|
| Coarse | 2.1 | 1.15 | 4.85 | 0.796 | 1.92 | 80 |
| Fine | 1.15 | 0.55 | 2.8 | 0.852 | 1.21 | 90 |
Table 4.
Range of operating conditions for the experimental trials.
| Input Condition | Range | Maximum Uncertainty (%) |
|---|---|---|
| Hot water flow rate, (L/h) | 574.8–902.4 | ±2.74 |
| Hot water temperature, (°C) | 54.5–75.03 | ±0.96 |
| Feed water flow rate, (L/h) | 59.4–154.2 | ±3.05 |
| Feed water temperature, (°C) | 24–59.4 | ±2.12 |
| Cold water flow rate, (L/h) | 249.6–863.4 | ±2.99 |
| Cold water temperature, (°C) | 17.7–41 | ±2.88 |
| Brackish water salinity, (ppm) | 1260 | ±2.00 |
| Vacuum pressure, (mbar) | 98.2–220 | ±1.27 |
Table 5.
Several scenarios of input conditions considered for the exergy analysis.
| Case | (L/h) | (°C) | (L/h) | (°C) | (ppm) | (L/h) | (°C) | (mbar) |
|---|---|---|---|---|---|---|---|---|
| A | 840 | 75 | 87 | 55 | 1260 | 405 | 20 | 115 |
| B | 840 | 55 | 87 | 55 | 1260 | 405 | 20 | 115 |
| C | 840 | 75 | 159 | 55 | 1260 | 405 | 20 | 115 |
| D | 840 | 75 | 87 | 25 | 1260 | 405 | 20 | 115 |
| E | 840 | 75 | 87 | 55 | 45,900 | 405 | 20 | 115 |
Table 6.
Case study of the exergy analysis for the V-MEMD system.
| Description | Equations | Result | Unit |
|---|---|---|---|
| Total exergy input, | 992.6 | W | |
| Minimum work input, | 37 | 209.7 | W |
| Exergetic efficiency, | 38 | 21.1 | % |
| 39 | 850 | W | |
| Specific thermal exergy consumption, STXC | 41 | 33.7 | kWh/m3 |
Publisher’s Note: MDPI stays neutral with regard to jurisdictional claims in published maps and institutional affiliations. |
© 2021 by the authors. Licensee MDPI, Basel, Switzerland. This article is an open access article distributed under the terms and conditions of the Creative Commons Attribution (CC BY) license (https://creativecommons.org/licenses/by/4.0/).
Share and Cite
MDPI and ACS Style
Najib, A.; Orfi, J.; Alansary, H.; Ali, E. Assessing the Impact of Operating Conditions on the Energy and Exergy Efficiency for Multi-Effect Vacuum Membrane Distillation Systems. Water 2021, 13, 1500. https://doi.org/10.3390/w13111500
AMA Style
Najib A, Orfi J, Alansary H, Ali E. Assessing the Impact of Operating Conditions on the Energy and Exergy Efficiency for Multi-Effect Vacuum Membrane Distillation Systems. Water. 2021; 13(11):1500. https://doi.org/10.3390/w13111500
Chicago/Turabian StyleNajib, A., J. Orfi, H. Alansary, and E. Ali. 2021. "Assessing the Impact of Operating Conditions on the Energy and Exergy Efficiency for Multi-Effect Vacuum Membrane Distillation Systems" Water 13, no. 11: 1500. https://doi.org/10.3390/w13111500
Note that from the first issue of 2016, this journal uses article numbers instead of page numbers. See further details here.