Article

The Variation of Water Quality in Three Land Use Types in U Minh Ha National Park, Ca Mau Province, Vietnam Using Multivariate Statistical Approaches

College of Environment and Natural Resources, Can Tho University, Can Tho 900000, Vietnam
*
Author to whom correspondence should be addressed.
Water 2021, 13(11), 1501; https://doi.org/10.3390/w13111501
Submission received: 19 April 2021 / Revised: 22 May 2021 / Accepted: 25 May 2021 / Published: 27 May 2021
(This article belongs to the Section Water Quality and Contamination)

Abstract

:
This study was conducted to assess the water quality affected by different land use patterns in U Minh Ha National Park, Ca Mau, Vietnam. This study determined the water quality characteristics in three land use types (Acacia hybrid, planted melaleuca cajuputi, and natural melaleuca cajuputi) at different plant ages on two acid sulfate soil layers in the rainy season (8/2018) and dry season (4/2019) using nine water quality parameters. Multivariate statistical analyses were applied to evaluate the correlation and spatial and temporal variations in the water quality. The study results showed that the water quality in S-ASS was more polluted than that in D-ASS, characterized by low pH; the EC, organic matters (BOD and COD), nutrients (N-NH4+ and N-NO3), and metal ions (Al3+ and Fe3+) were high; and the EC, BOD, COD, Al3+, and N-NO3 were determined high in D-ASS. The NMC area was noted to have high concentrations of organic matters and nutrients, while the factors specific to acidic soil were found to be higher in the AH and PMC areas. The water quality in the rainy season tended to be more polluted than that in the dry season. The cluster analysis grouped the land use patterns on S-ASS and D-ASS in both seasons into four groups, with a clear similarity between the wet and dry seasons in the areas at various plant ages. The seasonal variations of the water quality of the three land use types were distinguished by the main parameters, including pH, EC, BOD, N-NO3, and Al3+ (S-ASS) and EC, BOD, N-NO3, N-NH4+, and Fe3+ (D-ASS). Therefore, there is a need for better water management measures in the rainy season and focus on the key parameters causing water quality variations in each area. The findings in this study provided important information for the future water quality monitoring for both agricultural production and conservation in the national park.

1. Introduction

Wetlands play an important role in the biodiversity and function of ecosystems. A wetland ecosystem is very useful in regulating the climate, filtering harmful substances, ensuring biodiversity, food sources, and creating a livelihood for the surrounding communities [1,2,3,4]. However, social and economic developments have put pressure on wetland ecosystems [4,5]. This has resulted in the total wetland area in the world rapidly decreasing [6]. The decline is noted due to increased shrimp farming, the conversion of wetlands to agricultural and construction land, and excessive fuel logging [7,8,9]. At the same time, these impacts deteriorate the water quality and adversely affect the ecosystem functions and services, which have also been reported in other wetlands in the world [7,10]. Wetland ecosystems are susceptible to pollution sources and can be easily destroyed when exposed to impacts [11]. The water quality in wetland ecosystems is considered the major determinant of the habitats of various wetland organisms. Therefore, the water quality in wetlands has been of interest to scientific researchers [7,12,13,14]. Water quality monitoring in wetland environments can be measuring the physical and chemical water quality parameters, evaluating the eutrophication, and using biological parameters [15]. In particular, water quality monitoring by physical and chemical parameters is frequently used or/and several statistical approaches have been applied for processing the physical and chemical datasets. For examples, Pearson’s correlation, cluster analysis (CA), and discriminant analysis (DA) are efficiently used in spatial and temporal analyses and correlations among water quality parameters. The former studies have shown that these methods are appropriate in determining the spatial and temporal variations of water quality influenced by different natural and human factors [16,17]. This research was carried out to elaborate the land use activities in wetland areas, resulting in physical and chemical water quality changes.
In the Vietnamese Mekong Delta, the central wetlands are melaleuca forest ecosystems on acid sulfate soils (ASS), typically Tram Chim National Park, U Minh Thuong National Park, U Minh Ha National Park, and Lung Ngoc Hoang Nature Reserve. However, the areas dominated by Melaleuca cajuputi have been significantly disturbed by human activities and are the most vulnerable to climate change [2,18]. Previously, several studies have been carried out in U Minh Ha National Park, mainly focused on vegetation covers, biodiversity, and peat soils [19,20,21,22]. In addition, several studies have also studied the water environment characteristics in wetland areas [23,24]. However, the link between water quality and land use types has not been studied in U Minh Ha National Park, Ca Mau province, Vietnam. Meanwhile, the influence of land use patterns on the water quality has also been found in a previous study by Giao et al. (2021) [25]. Therefore, this study was conducted to monitor the water quality in disturbed (Acacia hybrid—AH and planted Melaleuca cajuputi—PMC) and undisturbed areas (natural Melaleuca cajuputi—NMC) (1) to assess the water quality characteristics in areas with different land use patterns, (2) to analyze the correlation among the water quality parameters, (3) to assess the similarity of the water quality among land use patterns, and (4) to identify key water parameters resulting in seasonal variations of the water quality in the study area. The study results could be useful for water quality monitoring strategies in U Minh Ha National Park.

2. Materials and Methods

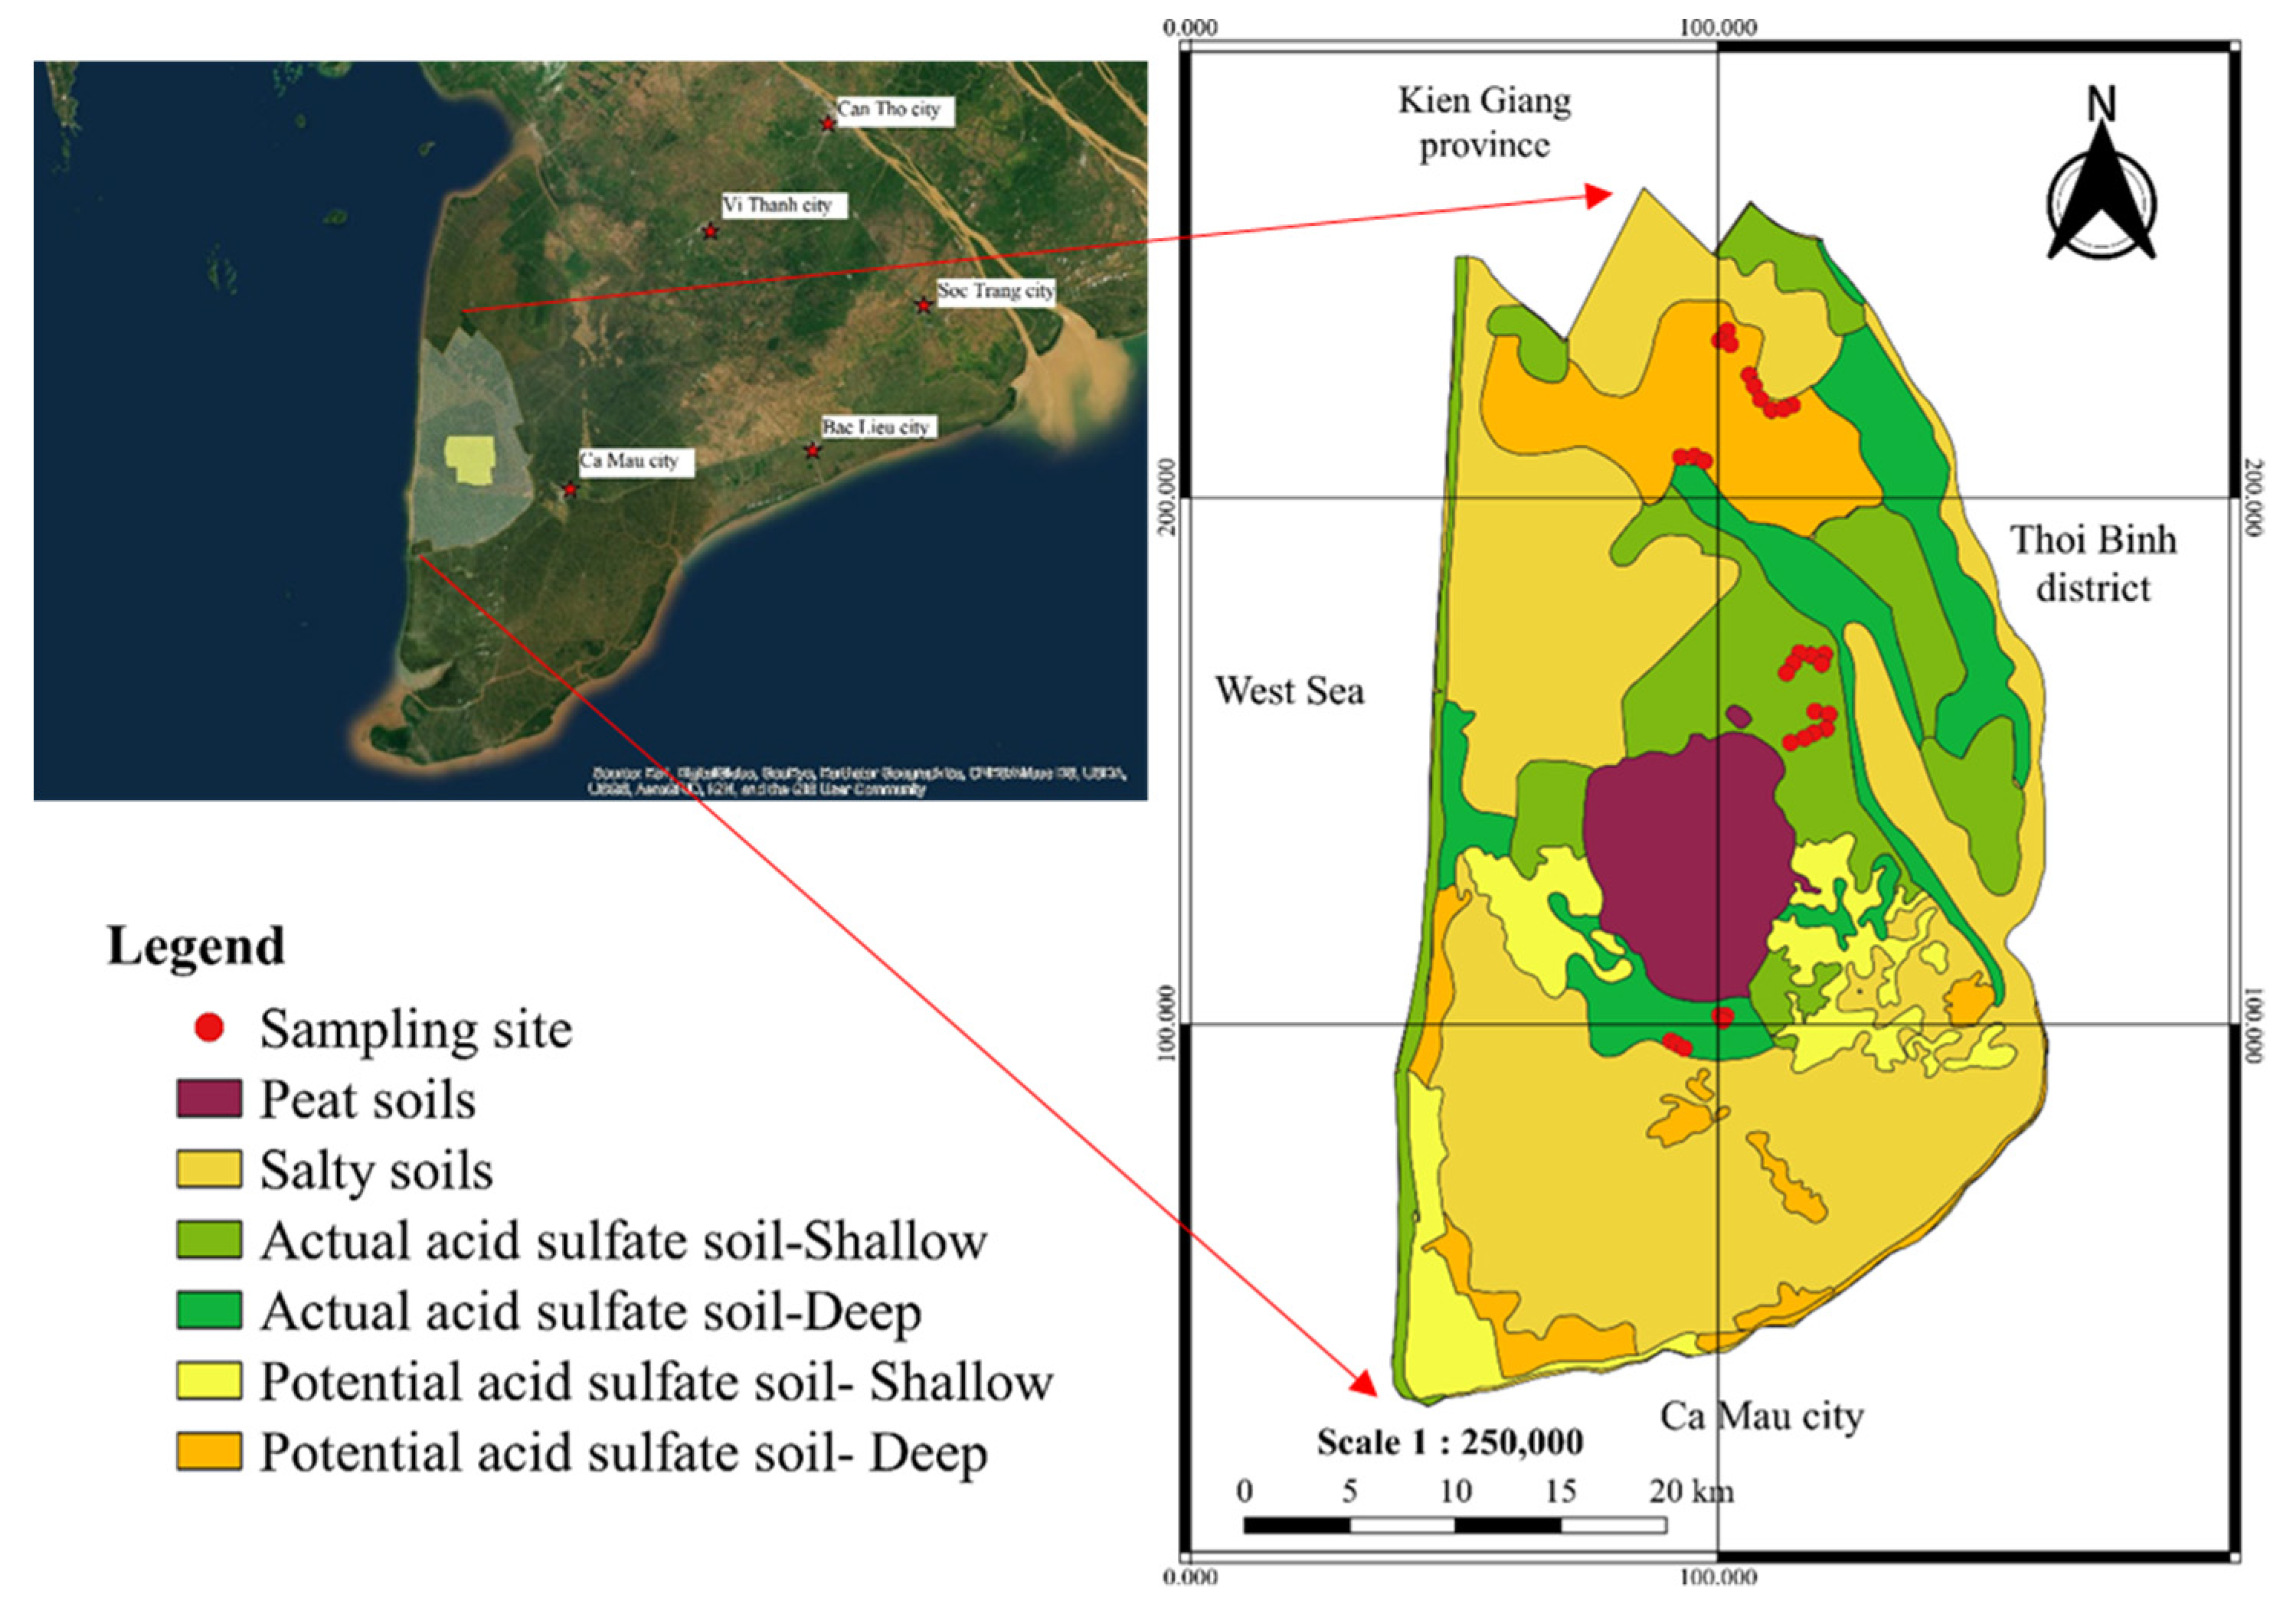
2.1. Study Area Description

U Minh Ha National Park is a seasonal wetland in the lower Mekong River, within the core zone of the Ca Mau Cape Biosphere Reserve, the 2088 Ramsar site in the world, the 5th in Vietnam, and 2nd of the Vietnamese Mekong Delta region. The total area is 8528 ha, of which the forest area is 7639 ha. The terrain is relatively flat, and the average altitude is 1.5–2.0 m above sea level, gradually lower from the northwest to the southeast. Typical ecosystems are forests on peat and acid sulfate soils [19]. The wetlands are influenced by the Asian monsoon system, with an average temperature of 26.5 °C, annual rainfall of about 2360 mm, and average humidity of 85.6% and characterized by the dry season from November to April and the rainy season from May to October, in which 90% of the precipitation occurs. Due to dike construction, the study area is only flooded for 4–6 months in the rainy season. This area is also surrounded by agricultural land and habitats, including mixed Melaleuca forest, grassland, and open swamp. Melaleuca cajuputi and Acacia hybrid, the dominant plant species of U Minh Ha national Park, are common plants in the Mekong Delta. Melaleuca cajuputi is not only economic revenue for native people but, also, the habitat for all the species in U Minh Ha National Park [2,26]. Melaleuca forest is planted on 7051 ha of ASS and NMC on peatland covering an area of 1289.6 ha [26]. Melaleuca cajuputi can grow in a wetland if the water depth is not high and the waterlogged duration is not long-lasting. In contrast, Acacia hybrid does not tolerate submerged conditions, so it is necessary to raise up the soil before the planting. In fact, with the policies aimed at increasing the efficiency of land use, the introduction of Acacia hybrid in production forest land has a significant impact on indigenous trees (Melaleuca) due to its rapid biomass-forming capacity and short harvest cycle (4 to 5 years) [27]. In addition, a change in the land use pattern can have impacts on the water quality where the soil is disturbed from the cultivation practices. Therefore, the selection of plant species in the study area was based on its representation, character, and trend in the national park.

2.2. Water Sampling and Analysis

This study was conducted in the rainy/wet season (August 2018) and dry season (April 2019) in U Minh Ha National Park, Ca Mau Province, Vietnam. The water samples were collected and analyzed based on the tree ages and depth of ASS, which were divided into 3 land use types (Acacia hybrid, planted melaleuca cajuputi, and natural melaleuca cajuputi) and two main acid sulfate soil layers: shallow acid sulfate soil—S-ASS: 25–45 cm and deep acid sulfate soil—D-ASS: 60–65 cm. The sampling sites were distributed in the following land use types: (1) Acacia hybrid (AH) was collected at two tree age levels (>3 years old and <3 years old) in two layers of ASS. This means that the sample size in the hybrid acacia area was 3 water samples × 2 age levels × 2 layers of ASS. Similarly, for the planted melaleuca cajuputi (PMC) area, the samples were also collected at two levels of tree age >5 years old and <5 years old in two layers of ASS (3 water samples × 2 years old × 2 layers of ASS). Finally, 3 samples of water in the S-ASS and D-ASS were collected in the natural melaleuca cajuputi (NMC) area (>10 years old). The three water samples at three different sites in each area were repeated to ensure the representativeness of the sample collected at each age and acid sulfate soil layer. Water samples were collected in the surface water layer (30–50 cm) of the area in both dry and rainy seasons. Therefore, 60 samples were collected during two seasons (30 samples in the rainy season and 30 samples in the dry season). The collected samples were stored in 4 °C ice boxes and transported to the laboratory; they were preserved for 24 h for biochemical oxygen demand (BOD) and nitrate (N-NO3) or 1 month for chemical oxygen demand (COD), ammonium (N-NH4+), and heavy metals prior to analysis [28]. Figure 1 depicts the geographic distribution of the 30 sampling sites in the study area.
The water quality parameters were used to evaluate the water quality properties in the study, including pH, conductivity (EC, µS cm−1), aluminum (Al3+, mg L−1), iron (Fe3+, mg L−1), dissolved oxygen (DO, mg L−1), biochemical oxygen demand (BOD, mg L−1), chemical oxygen demand (COD, mg L−1), ammonium (N-NH4+, mg L−1), and nitrate (N-NO3, mg L−1). The pH, EC, Al3+, and Fe3+ are characteristic evaluation factors for acidic soils; meanwhile, DO, BOD, COD, N-NH4+, and N-NO3 are the parameters used to evaluate the content of organic matters and nutrients in the water bodies. The pH, DO, and EC were observed onsite, respectively, by WQC-22A (ToaDkk, Tokyo, Japan) multiparameter water quality meters calibrated before each measurement. Other water quality parameters were analyzed in the laboratory according to the standard methods, namely the 5-Day BOD Test (SMEWW 5210B:2012), Closed Reflux-Titrimetric Method (SMEWW 5220C:2012), Phenate Method (SMEWW 4500-NH3-F:2012), Cadmium Reduction Method (SMEWW 4500-NO3-E:2012), Spectrometric method using 1,10-phenanthroline (SMEWW 3500-Fe:2012), and Eriochrome Cyanine R Method (SMEWW 3500-Al:2012) [29].

2.3. Data Analysis

The results after the laboratory analysis were stored in Microsoft Excel software version 2016 (Microsoft Crop., Washington, WA, USA), which facilitated the statistical analysis. Water chemistry data was compared and analyzed separately by tree types and seasons due to the large variations in rainfall during the study. Duncan’s test (in a one-way ANOVA analysis) was used to determine the significant differences in water quality between three plant ages on the same ASS layer in both the wet and dry seasons with a 95% confidence level (significance level p < 0.05). Independent samples t-test was used to assess the differences in the water quality parameters between the wet and dry seasons. The correlation between the water quality parameters across land use patterns was evaluated using Pearson’s correlation analysis. Correlations are considered significant when p < 0.05, and the correlation coefficient (r) indicates the correlation levels of the parameters.
The assessment of the similarity in water quality at different tree ages in the rainy and dry seasons in the S-ASS and D-ASS areas was performed using cluster analysis (CA). A congruence matrix was computed from mean values via the Euclidean distance scale [30]. Water quality of the various factors (specifically, AH < 3 years old_Dry, AH < 3 years old_ Wet, AH > 3 years old_Dry, AH> 3 years old_Wet, PMC < 5 years old_Dry, PMC < 5 years old_Wet, PMC > 5 years old_Dry, PMC > 5 years old_Wet, NMC > 10 years old_Dry, and NMC > 10 years old_Wet) was grouped based on the value of the Euclidean-bonding distance. For the S-ASS, the land use types with high similarities in the water quality would form the same cluster, while the land use patterns with high heterogeneity would form another cluster [17]. A similar analytical procedure in the similarity analysis was performed for the case of water samples collected in D-ASS. In addition, a discriminant analysis (DA) was applied to determine the most significant water parameters contributing to seasonal variations of the water quality in the three land use types [31]. The rainy and dry season water quality data in three land use types on S-ASS and D-ASS were the subjects for the analyses. Three land use types at different tree age levels and 9 water quality parameters were assigned as the dependent variables and the independent and equivalent variables, respectively. DA revealed the ranking of the water quality parameters for the differences between the two seasons [31]. All statistical analyses were performed using copyrighted software Primer version 5 (Primer-E Ltd., Plymouth, UK) and SPSS version 20 (IBM Crop., Armonk, NY, USA).

3. Results

3.1. Water Quality Characteristics in Various Types of Land Use

The changes in the water quality between the land use patterns in the two ASS layers in the wet and dry seasons are shown in Table 1. In D-ASS, the pH value was neutral (for AH) and acidic (for PMC). The S-ASS planted with Acacia hybrid and Melaleuca cajuputi were both identified as acidic, which was lower than that of the D-ASS in both areas. In stark contrast, the pH values in the NMC area remained stable at two ASS layers in both the wet and dry seasons. Moreover, the ANOVA analysis also showed significant differences between the AH and PMC areas compared with that in the NMC at the S-ASS layer in both seasons (p < 0.05); however, no statistically significant difference was recorded between AH and PMC (p > 0.05). In the rainy season, the pH value tended to be higher than that in the dry season. The independent samples t-test analysis only showed that the difference was statistically significant on S-ASS (p < 0.05).
The EC values in areas AH and PMC in the rainy season on two acid sulphate soil layers were relatively high compared to that in NMC area, and the difference was statistically significant (p < 0.05) (Table 1). The EC in the dry season was also determined to have a difference between the land use types similar to that in the rainy season. However, there was a tendency to significantly decrease the EC values in the water. The DO concentration was not significant difference compared to that in the S-ASS. There was a statistically significant difference between the two seasons on both the ASS layers for the EC and DO values.
However, the BOD fluctuated greatly and tended to be high in the rainy season during the study periods. The BOD values were significant differences at the land use types of AH and PMC compared to that of the NMC land use type (p < 0.05) in the rainy season. However, the study only recorded the differences in the BOD concentrations in the water bodies between the land use types of AH and NMC (p < 0.05) in the dry season. In addition, the COD concentrations also varied significantly between the wet and dry seasons and between the AH and PMC areas compared to that in the NMC land use type in both the rainy and dry seasons (p < 0.05) (Table 1). The increase in COD was clearly observed in the rainy season in the NMC area in both soil types, which demonstrated the long-term accumulation of pollutants in the water bodies. Nevertheless, the COD concentration was only statistically significant between two seasons for S-ASS, while the differences in the concentrations of BOD were statistically significant in both the D-ASS and S-ASS (p < 0.05).
The concentration of N-NH4+ tended to be high in the rainy season and lower in the dry season on both soil types (except for PMC and NMC on S-ASS) (Table 1). The concentration of N-NH4+ in the water bodies in D-ASS in areas AH and PMC in the rainy season were both found to be lower than that in the NMC area. Meanwhile, on S-ASS, a higher N-NH4+ concentration was detected in the AH and PMC areas. In contrast, the highest concentration of N-NO3 in the dry season was recorded in the NMC area and lowest in the Melaleuca growing area. Otherwise, the N-NO3 concentration in S-ASS in the dry season was also determined to have the opposite variation in compared to that in the D-ASS, gradually increasing from AH to NMC. The results of N-NO3 were consistent with the above analysis of N-NH4+. However, the N-NH4+ concentration in the PMC area on S-ASS tended to be the opposite, having a higher value in the dry season due to a low waterflow.
The analysis of Fe3+ in the water bodies showed that there was a statistically significant difference between the PMC area and NMC (rainy season) and areas of AH and PMC with NMC (dry season) on D-ASS (p < 0.05). Specifically, the concentration of Fe3+ in the NMC area was lower than that of AH and PMC on both soil types, and Fe3+ in the water bodies in D-ASS was lower than that in S-ASS. On the other hand, on D-ASS, Fe3+ lower concentrations were found in the dry season. S-ASS was also recorded with similar seasonal variations but with higher concentrations by 1.2–74 times (dry season) and 1.1–20 times (rainy season) and statistically different values (p < 0.05). Through the analysis results in Table 1, the concentration of Al3+ in the AH area was lower than that of the NMC area on D-ASS; in contrast, on S-ASS, the AH was significantly higher. However, there was no statistically significant differences of Al3+ in the three land use types.

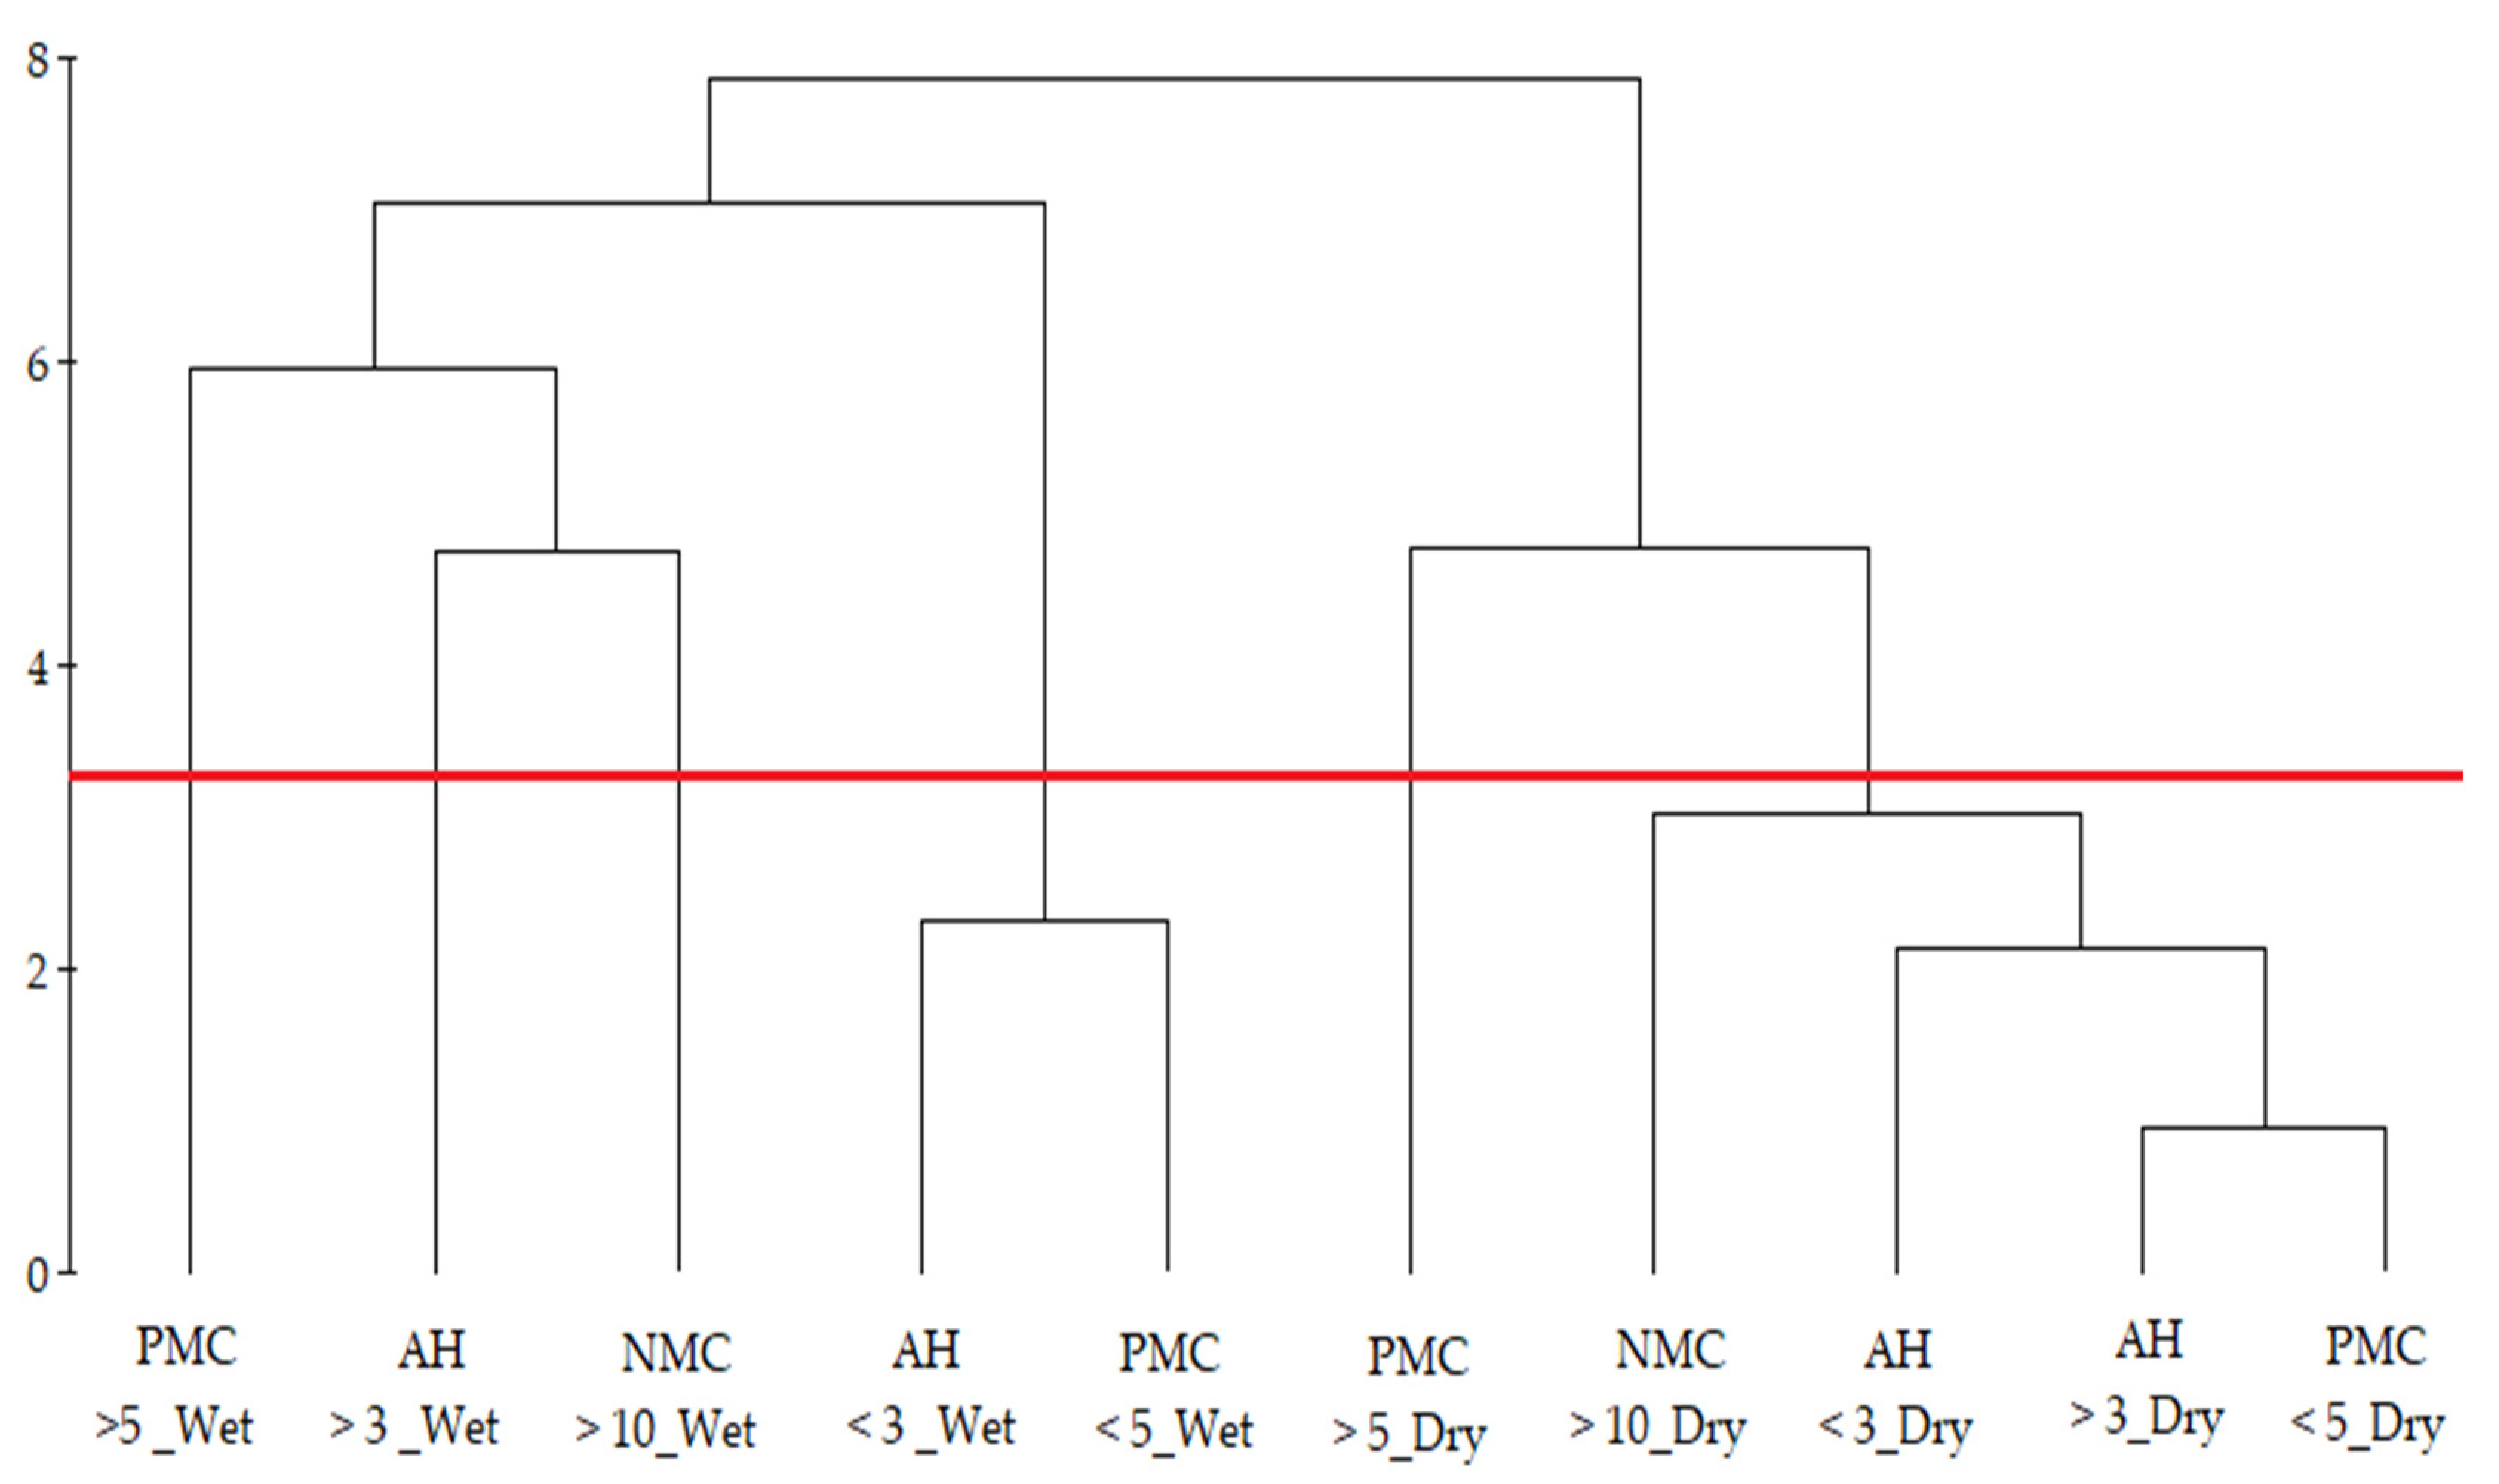
3.2. Seasonal Variation of Water Quality in Various Land Use Types

The land use types belonging to each group were considered for similarity based on 10 water quality parameters. In S-ASS, the CA analysis showed that the similarity of the areas was higher than that of D-ASS, with Euclidean distances ≤5.65 and ≤7.86, respectively. The number of clusters was considered based on the land use types, tree age levels, and seasons. Therefore, a total of five land use types belonging to two seasons per layer of S-ASS and D-ASS were divided into four groups by the red line (Figure 2 and Figure 3), which had Euclidean distances of values less than 4.
On S-ASS, cluster 1 and cluster 2 were formed by only one land use type, including NMC > 10_Wet and PMC < 5_Dry. On the other hand, the water qualities at AH < 3_Wet, AH > 3_Wet, PMC < 5_Wet, and PMC > 5_Wet were arranged in one cluster (cluster 3). Meanwhile, cluster 4 clearly dominated land use types in the dry season (AH < 3_Dry, AH > 3_Dry, PMC > 5_Dry, and NMC > 10_Dry).
In the areas of D-ASS, it is worth noting that PMC > 5_Wet is noted with no similarity with the water qualities in other land use types (cluster 1). This is in contrast to the results found in the S-ASS when PMC > 5_Wet was collected together with cluster of AH < 3_Wet, AH > 3_Wet, and PMC < 5_Wet. Cluster 2 corresponded to the area with and without soil disturbances observed in the rainy season, including two land use types (AH > 3_Wet and NMC > 10_Wet). Cluster 3 included two land use types of Acacia hybrid and Melaleuca cajuputi (AH < 3_Wet and PMC < 5_Wet). Meanwhile, cluster 4 was formed by AH < 3_Dry, AH > 3_Dry, PMC > 5_Dry, PMC < 5_Dry, and NMC > 10_Dry.

3.3. Parameters Resulting Seasonal Changes in Water Quality

The results of testing the reliability and the coefficient of differentiation of the parameters in the seasonal variations are presented in Table 2. The results indicated that a discriminant analysis is effective based on the ability to explain the seasonal variation of the water quality parameters statistically significantly, with a 5% significance level (Sig. < 0.05). Five parameters were identified as statistically significant variables (Sig. < 0.05) in the variation in the water quality the between rainy and dry seasons in the three land use types on D-ASS (Table 2a). The pH, EC, BOD, N-NO3, and Al3+ were recorded to be the discriminant water quality parameters on the S-ASS; meanwhile, the EC, BOD, N-NO3, N-NH4+, and Fe3+ were the discriminant factors on the D-ASS (p < 0.05).
In addition, Table 2b showed that the Wilks’ Lambda values of the DF function on the S-ASS and D-ASS were 0.01 (Sig. = 0.00 < 0.05) and 0.04 (Sig. = 0.00 < 0.05), respectively. These values indicated that DFs functions were reliable in providing the order in which the main parameters affected the water quality. In other words, the coefficients with greater absolute values corresponding to the more distinguishable variables. For the S-ASS, pH, EC, BOD, N-NO3, and Al3+ were the parameters with relatively large differentiation coefficients, with 100% of cases accurately explaining the variation in the water quality, arranged in the decreasing order of BOD > EC > N-NO3 > pH and Al3+. While, in the D-ASS, the parameters causing seasonal water quality fluctuations were mainly BOD, N-NO3, EC, Fe3+, and N-NH4+. The discriminant coefficients were 0.65, 0.21, 0.21, 0.19, and 0.13, respectively.

4. Discussion

4.1. Water Quality Characteristics in Various Types of Land Use

The results of the pH have also been reported in previous research. The pH in the areas of D-ASS where Acacia hybrid and Melaleuca cajuputi were planted tended to be higher than that in the S-ASS [24,32]. One of the reasons for this difference is the intolerant-flooding characteristic, in which the land needs to be mounted. This leads to a potential ASS layer to become the topsoil, enabling ions to be dissolved in the water when it is affected by the overflows [27,33]. The differences of AH and PMC compared with NMC indicated that the soil disturbances had a significant effect on the water quality in the water bodies in the study area. Besides that, there was a significant variation between the two seasons for S-ASS. This was characterized by precipitation, resulting in increased water flow in the park, and a large capacity to dissolve the pollutants.
The decreasing trend in the dry season may be due to the leaching of EC in the soil of solutes in the rainy season, so the EC in the water decreases. According to the analysis results, the EC values in the AH and PMC areas were higher than those in the NMC area, in which S-ASS had EC values higher than that in D-ASS. This result was similar to the previous research [24,34]. The low DO in water may be due to microorganisms using a large amount to decompose organic matters in the water. However, this tended to decrease during the dry season. The difference of DO concentrations in AH and PMC compared with NMC can be explained by the canal system (due to soil mounting), which facilitates the exchange of oxygen in the air; in addition, aquatic activity due to light is more receptive. Furthermore, as previously reported by Be et al. (2017) [24], DO in the AH and PMC areas ranged from 0.80 to 1.27 mg L−1 (S-ASS) and 0.33 to 0.56 mg L−1 (D-ASS). This indicates that the water quality tended to be improved.
The increase in BOD concentrations during the rainy season was likely due to the resuspension of organic matters from sediments under the impact of runoff and turbulence in rainwater [35]. In addition, high temperature, humidity, and inundation could facilitate the decomposition of organic matters in the AH and PMC areas [36]. On the other hand, these organic substances are easily washed away into the water bodies, which can be a factor leading to high BOD concentrations in water in the AH and PMC land use types. Compared with the previous study, it was clearly shown that BOD tended to increase while COD tended to decrease [24], indicating the organic matters in the water bodies in the study area as susceptible to biodegradation [37,38]. In addition, the ratio of BOD/COD was calculated to consider the degree of biodegradation and can be viewed as an indicator of pollution time. The results showed that the ratio value ranged from 0.06 to 0.17 in the dry season and from 0.16 to 0.46 in the rainy season, indicating that the possibility of organic pollutant decomposition in the rainy season was higher than that in the dry season. If this ratio was greater than 0.5, the water was highly biodegradable and can be an effective biological treatment (values between 0.3 and 0.5 (slow biodegradable water) and <0.3 (very slow biodegradable) [38]. Therefore, it can be seen that the biodegradability in the water in the study areas was slow, especially in the dry season, where this process may not take place. The water quality in the study area was highly polluted and, in the area of S-ASS, tended to be higher than that in D-ASS. The level of organic matter pollution in the land use type of NMC was higher than that of the AH and PMC areas.
The results of N-NH4+ indicated that the presence of N-NH4+ on S-ASS was greater than that of D-ASS. This was similar to that reported in the previous research by Be et al. (2017) [24]. D-ASS had a lower N-NH4+ concentration than that in S-ASS. Instead, the N-NO3 concentration in the area of D-ASS in the rainy season tended to the opposite. This reflects the degree of soil disturbance through tree age in the areas. Considering the seasonal variation, the concentrations of N-NH4+ and N-NO3 in the study areas all increased in the rainy season. The speed of nitrification and denitrification decreased with the increasing temperature. Therefore, during the dry season, N-NO3 and N-NH4+ were removed more efficiently, reducing their concentrations in the water [39].
For heavy metal ions, the tendency for a higher concentration in S-ASS could be explained by the process of tillage, for afforestation created the phenomenon of acidification from the lower soil layer into the topsoil layer [32,34]. This showed that the risk of toxic release from the mounting during cultivation is very high [34]. The comparison with the Fe3+ concentration showed that the study area was mainly iron-toxic, since the Al3+ concentration was significantly lower [24]. Besides, the differences in Fe3+ and Al3+ concentrations between the two seasons can be explained by the dilution of rainwater. The amount of rainfall was relatively high (accounting for 90% of the annual rainfall), and the dilution of toxic substances made the concentration of Al3+ decrease significantly in the rainy season. While, in the dry season, due to the effects of water evaporation and oxidation of the topsoil, together with the amount of water leaching, toxic substances can migrate into the water source, causing serious pollution. In summary, the soil layer disturbances and seasonal factors in the study area showed a larger range of variations of Al3+ in the AH and PMC areas compared to that of the NMC areas.
In addition, since the study area is located near peatland, the water quality may be partially affected. According to some previous studies, it has been determined that peatlands have been found to contain more humus compounds and substances that are readily hydrolyzed [40,41,42], and thus, the runoff quality from the catchments is likely to be altered [43]. Therefore, the water quality differences of these areas also depends on the canal system of the neighboring areas and water regulation, especially for peatland areas.

4.2. Correlation of Water Parameters in the Various Land Use Types

Table 3 shows the results of the Pearson’s analysis, providing information on the relationships between the water quality variables. The analysis results showed that the pH value had a high inverse correlation with the parameters of N-NH4+, Fe3+, and Al3+ in the AH area. However, only a negative correlation of the pH with Al3+ (r = −0.58) was recorded in the PMC area. This suggests that the pH in water may be influenced by acid sulfate soils in the study area. Meanwhile, pH correlated highly with most of the remaining parameters in the NMC area (except for N-NH4+ and N-NO3). This indicates that there are few influencing factors/sources of pollution, reducing the complexity of the water environment in the water bodies in the NMC land use type. In contrast to the pH, the EC in all three land use types was found to have a positive correlation with the parameters of BOD and N-NO3 (r = 0.73 and r = 0.63 for the AH area, r = 0.75 and r = 0.71 for the PMC area, and r = 0.96 and r = 0.68 for the NMC area). In addition, the EC was found to have a high correlation with N-NH4+ in the AH area and COD and Al3+ in the NMC area. A lesser correlation for the PMC area may be related to the frequency of impacts on the soil environment, vegetation accumulation, and organic residue in aquatic sediments.
Similar to the EC, the BOD showed a close positive correlation with N-NO3 in the three land use types, which reflects the process involved in the accumulation of organic matters in water, because BOD is considered a reflection parameter for the amount of organic substances that are easily biodegradable. Moreover, BOD also had an inverse correlation with Al3+ on the NMC area (r = −0.81), since a low pH and increase in organic matters can promote the binding and complexing of Al (Al-OM). This leads to an increase in the amount of metabolic Al and a decrease in organic matter [44]. On the other hand, there was no significant correlation of DO and COD with all the remaining parameters (p > 0.05) in the AH area. In the PMC area, the DO was analyzed to have an inverse correlation with the BOD (r = −0.43) and inversely correlate with the BOD, COD, and EC in the NMC area. As expected, the DO is often inversely correlated with BOD, because microorganisms use oxygen in the water to decompose organic substances, so the higher the content of biodegradable organic matter, the lower the DO value and vice versa [13,37,45]. Besides, it is interesting that DO was found to have a very close positive correlation with Al3+ in the NMC area (r = 0.95); on the contrary, COD showed an inverse relationship with Al3+ (r = −0.62). This is similarly explained with the correlation between BOD and Al3+ by a positive relationship between COD and BOD (r = 0.86) in the NMC area also being determined. The correlation of COD and BOD indicates the presence of bioactive organic substances and has been presented in many previous studies on water quality [46,47,48].
The analysis results showed a positive correlation between N-NO3 with N-NH4+ (r = 0.48) on the AH area. This correlation has also been reported in similar wetlands [13]. On the other hand, on the NMC area, the N-NO3 concentration was detected in a negative relationship with Fe3+ (r = −0.58). This can be considered as the result of redox and Fe2+ oxidation in wetlands. Fe2+ reacts with nitrite, resulting in the generation of Fe3+ minerals [49]. However, for the N-NH4+ parameter, which has the opposite trend, no relationship with Fe3+ on the NMC area was recorded. This close correlation was again determined in the AH and PMC areas, with the coefficients 0.63 and 0.62, respectively. The overall results showed that Pearson’s correlation was consistent with the characteristics of each land use type in the study. The NMC area showed a strong correlation among the water quality parameters, followed by PMC and, finally, AH. This correlation showed that the water quality in the three land use types can be affected by several different point and nonpoint sources.

4.3. Seasonal Variation of Water Quality in Various Land Use Types

On the S-ASS, cluster 3 showed that the water quality of the areas was disturbed by the rainwater. Meanwhile, there was no differences between the disturbed area and the natural area in cluster 4. One of the reasons may be due to drought conditions. The factors that affected the water environments through runoff and precipitation were significantly reduced, mainly affected by the physical and chemical processes in the water. Therefore, the water quality in the study area was almost similar between the land use types in the dry season. Moreover, the differences in the grouping of PMC > 5_Wet on the D-ASS indicated that the water quality was affected by the ASS depth in the study area. In addition, the clustering of the land use types in cluster 2 also showed the clear impact level of the ASS depth on the water quality. Cluster 3 was classified as the location that was observed entirely during the rainy season with human impact on the soil and the water quality and all types of land use types observed in the dry season for cluster 4. This similarity was observed with shallow ASS, which further confirmed that there were few factors affecting the water environment during the dry season. In general, there was a slight variation in water quality between the tree age levels in the same farming patterns on the S-ASS. On the contrary, the research recorded the relative variations in the water quality in the D-ASS. Accordingly, Figure 2 and Figure 3 showed that season is the main source of the change in the water quality over time. Specifically, the analysis of CA on the S-ASS and D-ASS showed that all formed land use types belonged to a certain season. The seasonal factors leading to water quality changes have also been reported in some similar water bodies [48,50,51]. It was observed, in fact, that the variation in water quality of the land use types was found to be due to the influence of soil disturbances, rainfall effects, and runoff flows.

4.4. Parameters Resulting Seasonal Changes in Water Quality

The DA results indicated that the CA analysis was reliable, and there was a significant temporal variation of the water quality. The explanation of the water quality fluctuations showed that the BOD, EC, and N-NO3 can be general parameters causing temporal variations in the study area. Moreover, the water quality was affected by organic matters, the weather conditions between the two seasons, and the soil properties. In addition, the construction of the dike system also caused the water flow differences between the wet and dry seasons and had a significant effect on the water quality. In short, the organic pollutant (BOD), nutrients (N-NO3 and N-NH4+) and metal ions (Al3+ and Fe3+) with observed values differed considerably between the two seasons. These parameters may form factors leading to the improvement or deterioration of water quality in the study area.

5. Conclusions

The results of this study indicated that the water quality in the water bodies in the S-ASS tended to be more polluted than that in the D-ASS. In particular, the study also found out that water had problems with organic matters and nutrients in the land use type of NMC and water impairments due to the chemistry of ASS in the AH and PMC. The concentrations of BOD, COD, N-NO3, and N-NH4+ were found to be affected by the season in which these concentrations tended to be higher in the rainy season. The close relationship of the water quality parameters was noted in the land use types as NMC > PMC > AH. The CA analysis classified five land use patterns in two seasons into four clusters on the S-ASS and four clusters on the D-ASS, clearly showing the variations of the water quality due to the seasons and tree age levels of each area. The DA analysis presented that pH, EC, BOD, N-NO3, and Al3+ were the determinant parameters resulting in the change of the water quality between the two seasons on the S-ASS; meanwhile, EC, BOD, N-NO3, N-NH4+, and Fe3+ were the important parameters responsible for the temporal change of the water quality on the D-ASS. The results of the current study could provide important information for the water treatment and monitoring in the study area.

Supplementary Materials

The following are available online at https://www.mdpi.com/article/10.3390/w13111501/s1: Table S1. Water quality parameter values after the sample analysis at each tree age of the area (in the rainy season). Table S2. Water quality parameter values after the sample analysis at each tree age of the area (in the dry season).

Author Contributions

Conceptualization, V.D.L., H.D.T., and T.G.N.; methodology, V.D.L., H.D.T., and T.G.N.; software, V.D.L., H.D.T., and T.G.N.; validation, V.D.L., H.D.T., and T.G.N.; formal analysis, V.D.L., H.D.T., and T.G.N.; investigation, V.D.L., H.D.T., and T.G.N.; resources, V.D.L., H.D.T., and T.G.N.; data curation, V.D.L., H.D.T., and T.G.N.; writing—original draft preparation, V.D.L., H.D.T., and T.G.N.; writing—review and editing, V.D.L., H.D.T., and T.G.N.; visualization, V.D.L., H.D.T., and T.G.N.; supervision, H.D.T.; project administration, H.D.T.; and funding acquisition, V.D.L., H.D.T., and T.G.N. All authors have read and agreed to the published version of the manuscript.

Funding

This research was funded in part by the Technical Cooperation Project “Building capacity for Can Tho University to be an excellent institution of education, scientific research and technology transfer” of JICA. This study was funded in part by the Can Tho University Improvement Project VN14-P6, supported by a Japanese OAD loan.

Institutional Review Board Statement

Not applicable.

Informed Consent Statement

Not applicable.

Data Availability Statement

Not applicable.

Conflicts of Interest

The authors declare no conflict of interest.

Abbreviations

AH, Acacia hybrid; PMC, planted melaleuca cajuputi; NMC, natural melaleuca cajuputi; S-ASS, shallow acid sulfate soil; D-ASS, deep acid sulfate soil; ASS, acid sulfate soil; CA, Cluster analysis; DA, Discriminant analysis; EC, electrical conductivity; Al3+, aluminum; Fe3+, ferric iron; DO, dissolved oxygen; BOD, biochemical oxygen demand; COD, chemical oxygen demand; N-NH4+, ammonium; N-NO3, nitrate.

References

  1. Malthby, E.; Barker, T. The Wetlands Handbook; Wiley-Blackwell Publishing Ltd.: Oxford, UK, 2009. [Google Scholar]
  2. Triet, T.; Dung, N.T.K.; Thuyen, L.X.; Dao, T.T.A. Climate Change Vulnerability Assessment U Minh Thuong National Park, Vietnam; IUCN: Gland, Switzerland, 2018; 42p. [Google Scholar]
  3. Oujidi, B.; Tahri, M.; Layachi, M.; Abid, A.; Bouchnan, R.; Selfati, M.; Bounakhla, M.; Bouch, M.E.; Maanan, M.; Bazairi, H.; et al. Effects of the watershed on the seasonal variation of the surface water quality of a post-restoration coastal wetland: The case of the Nador lagoon (Mediterranean sea, Morocco). Reg. Stud. Mar. Sci. 2020, 35, 101127. [Google Scholar] [CrossRef]
  4. Yetis, A.D.; Akyuz, F. Water quality evaluation by using multivariate statistical techniques and pressure-impact analysis in wetlands: Ahlat Marshes, Turkey. Environ. Dev. Sustain. 2021, 23, 969–988. [Google Scholar] [CrossRef]
  5. Scholte, S.S.K.; Todorova, M.; van Teeffelen, A.J.A.; Verburg, P.H. Public support for wetland restoration: What is the link with ecosystem service values? Wetlands 2016, 36, 467–481. [Google Scholar] [CrossRef] [Green Version]
  6. Hu, S.; Niu, Z.; Chen, Y.; Li, L.; Zhang, H. Global wetlands: Potential distribution, wetland loss, and status. Sci. Total Environ. 2017, 586, 319–327. [Google Scholar] [CrossRef]
  7. Cui, S.; Yu, T.; Zhang, F.; Fu, Q.; Hough, R.; An, L.; Gao, S.; Zhang, Z.; Hu, P.; Zhu, Q.; et al. Understanding the risks from diffuse pollution on wetland eco-systems: The effectiveness of water quality classification schemes. Ecol. Eng. 2020, 15, 105929. [Google Scholar] [CrossRef]
  8. Patino, J.E.; Estupinan-Suarez, L.M. Hotspots of Wetland Area Loss in Colombia. Wetlands 2016, 36, 935–943. [Google Scholar] [CrossRef]
  9. Tuboi, C.; Irengbam, M.; Hussain, S.A. Seasonal variations in the water quality of a tropical wetland dominated by floating meadows and its implication for conservation of Ramsar wetlands. Phys. Chem. Earth 2018, 103, 107–114. [Google Scholar] [CrossRef]
  10. Nouri, J.; Mirbagheri, S.A.; Farrokhian, F.; Jaafarzadeh, N.; Alesheikh, A.A. Water quality variability and eutrophic state in wet and dry years in wetlands of the semiarid and arid regions. Environ. Earth Sci. 2010, 59, 1397–1407. [Google Scholar] [CrossRef]
  11. Yetis, A.D.; Selek, Z.; Seckin, G.; Davutluoglu, O.I. Water quality of Mediterranean coastal plains: Conservation implications from the Akyatan Lagoon, Turkey. Environ. Monit. Assess. 2014, 186, 7631–7642. [Google Scholar] [CrossRef]
  12. Verhoeven, J.T.A.; Arheimer, B.; Yin, C.; Hefting, M.M. Regional and global concerns over wetlands and water quality. Trends Ecol. Evol. 2006, 21, 96–103. [Google Scholar] [CrossRef] [PubMed]
  13. Sabia, G.; Petta, L.; Moretti, F.; Ceccarelli, R. Combined statistical techniques for the water quality analysis of a natural wetland and evaluation of the potential implementation of a FWS for the area restoration: The Torre Flavia case study, Italy. Ecol. Indic. 2018, 84, 234–244. [Google Scholar] [CrossRef]
  14. Wijeyaratne, W.M.D.N.; Nanayakkara, D.B.M. Monitoring of water quality variation trends in a tropical urban wetland system located within a Ramsar wetland city: A GIS and phytoplankton-based assessment. Environ. Nanotechnol. Monit. Manag. 2020, 14, 100323. [Google Scholar]
  15. Zhang, Y.; Li, M.; Dong, J.; Yang, H.; Van Zwieten, L.; Lu, H.; Alshameri, A.; Zhan, Z.; Chen, X.; Jiang, X.; et al. A Critical Review of Methods for Analyzing Freshwater Eutrophication. Water 2021, 13, 225. [Google Scholar] [CrossRef]
  16. Venkatesharaju, K.; Somashekar, R.K.; Prakash, K.L. Study of seasonal and spatial variation in surface water quality of Cauvery river stretch in Karnataka. J. Ecol. Nat. Environ. 2010, 2, 001–009. [Google Scholar]
  17. Chow, M.F.; Shiah, F.K.; Lai, C.C.; Kuo, H.Y.; Wang, K.U.; Lin, C.H.; Chen, T.Y.; Kobayashi, Y.; Ko, C.Y. Evaluation of surface water quality using multivariate statistical techniques: A case study of Fei-Tsui Reservoir basin, Taiwan. Environ. Earth Sci. 2016, 75. [Google Scholar] [CrossRef]
  18. Tran, D.B.; Dargusch, P.; Moss, P.; Hoang, T.V. An assessment of potential responses of Melaleuca genus to global climate change. Mitig. Adapt. Strateg. Glob. Chang. 2013, 18, 851–867. [Google Scholar] [CrossRef]
  19. Hong, T.T.K.; Long, N.B.; Ni, D.V.; Be, N.V. Peat thickness affecting growth indexes of the Melaleuca forest in the U Minh Ha National Part, Ca Mau province. Can Tho Univ. J. Sci. 2015, 40, 92–100. [Google Scholar]
  20. Quoi, L.P.; Truyen, N.T.; Thang, T.V. Restoration of peatland ecosystems and biodiversity in U Minh region of Mekong delta, Vietnam. In Proceedings of the 15th International Peat Congress, Sarawak, Malaysia, 15–19 August 2016; pp. 445–450. [Google Scholar]
  21. Khanh, P.T.; Subasinghe, S.M.C.U.P. Identification of vegetation change of lower U Minh National Park of Vietnam from 1975 to 2015. J. Trop. For. Environ. 2017, 7, 10–20. [Google Scholar] [CrossRef] [Green Version]
  22. Tran, N.T.N.; Quan, H.B.A.; Lam, N.T.; Dinh, T.D.; Yen, D.T. The species composition of fish distributed in surrounding areas of U Minh Thuong and U Minh Ha National Parks. Can Tho Univ. J. Sci. 2020, 56, 185–191. [Google Scholar]
  23. Haidary, A.; Amiri, B.J.; Adamowski, J.; Fohrer, N.; Nakane, K. Assessing the Impacts of Four Land Use Types on the Water Quality of Wetlands in Japan. Water Resour. Manag. 2017, 27, 2217–2229. [Google Scholar] [CrossRef]
  24. Be, N.V.U.; Loi, L.T.; Ni, L.H.; Tran, H.T.K. Evaluating water properties in trench of land use types of Acacia hybrid and Melaleuca Cajuputi at U Minh Ha, Ca Mau. Can Tho Univ. J. Sci. 2017, 1, 79–85. [Google Scholar]
  25. Giao, N.T.; Cong, N.V.; Nhien, H.T.H. Using remote sensing and multivariate statistics in analyzing the relationship between land use pattern and water quality in Tien Giang province, Vietnam. Water 2021, 13, 1093. [Google Scholar] [CrossRef]
  26. Thanh, V.H.T.; Hoang, P.P.V.; Trong, K.H.; Thanh, P.P.H. Evaluation of current situation of melaleuca forest in the U Minh Ha national park, Vietnam under the situation of climate change and proposed solutions for conservation and sustainable development. Mater. Sci. Eng. 2020, 736, 072014. [Google Scholar] [CrossRef]
  27. Trung, N.V. Impact Assessment of Acacia hybrid Planting on Soil Properties and Vegetation Cover under Forest Canopy of U Minh Ha, Ca Mau. Master’s Thesis, Can Tho University, Can Tho, Vietnam, 2015. [Google Scholar]
  28. Vietnam Environment Administration (VEA). Preservation and Handling of Water Samples; Ministry of Science and Technology: Hanoi, Vietnam, 2018. [Google Scholar]
  29. APHA; AWWA; WEF. Standard Methods of for the Examination of Water and Wastewater, 22nd ed.; American Public Health Association: Washington, DC, USA, 2012. [Google Scholar]
  30. Ward, J.H. Ward’s method. J. Am. Stat. Assoc. 1963, 58, 236–246. [Google Scholar] [CrossRef]
  31. Samsudin, M.S.; Azid, A.; Khalit, S.I.; Sani, M.S.A.; Lananan, F. Comparison of prediction area using spatial discriminant analysis for marine water quality index in mangrove estuarine zones. Mar. Pollut. Bull. 2019, 141, 472–481. [Google Scholar] [CrossRef]
  32. Tran, H.T.K. The Study on Affecting of Planting Acacia Hibrid to Water Quality in the Forest Ecosystem of U Minh Ha. Master’s Thesis, Can Tho University, Can Tho, Vietnam, 2015; 105p. [Google Scholar]
  33. Thinh, N.H. Study on the Impact of the Effect on Soil and Water Quality and Early Growth of Melaleuca Forest (Melaleuca Cajuputi) in Sub-Zone 307, U Minh I Forest Enterprise, Ca Mau Province. Master’s Thesis, Can Tho University, Can Tho, Vietnam, 2008; 110p. [Google Scholar]
  34. Quang, N.M. Assessing the Quality of Osmotic Water on the Banks of Acacia and Melaleuca Plantations in U Minh Ha Forest. Master’s Thesis, Can Tho University, Can Tho, Vietnam, 2016; 80p. [Google Scholar]
  35. Park, J.; Batalla, R.J.; Birgand, F.; Esteves, M.; Gentile, F.; Harrington, J.R.; Navratil, O.; López-Tarazón, J.A.; Vericat, D. Influences of Catchment and River Channel Characteristics on the Magnitude and Dynamics of Storage and Re-Suspension of Fine Sediments in River Beds. Water 2019, 11, 878. [Google Scholar] [CrossRef] [Green Version]
  36. Horwath, W. Carbon cycling and formation of soil organic matter. In Soil Microbiology, Ecology and Biochemistry; Academic Press: Cambridge, MA, USA, 2007; pp. 303–339. [Google Scholar]
  37. Chi, D.K. Environmental Chemistry; Science and Technology Publishing House: Hanoi, Vietnam, 2001. [Google Scholar]
  38. Sremački, M.; Obrovski, B.; Petrović, M.; Mihajlović, I.; Dragičević, P.; Radić, J.; Miloradov, M.V. Comprehensive environmental monitoring and assessment of protected wetland and lake water quality in Croatia and Serbia. Environ. Monit. Assess. 2020, 192, 187. [Google Scholar] [CrossRef]
  39. Anteneh, Y.; Zeleke, G.; Gebremariam, E. Assessment of surface water quality in Legedadie and Dire catchments, Central Ethiopia, using multivariate statistical analysis. Acta Ecol. Sin. 2018, 38, 81–95. [Google Scholar] [CrossRef]
  40. Holden, J.; Chapman, P.J.; Labadz, J.C. Artificial drainage of peatlands: Hydrological and hydrochemical process and wetland restoration. Prog. Phys. Geogr. 2004, 28, 95–123. [Google Scholar] [CrossRef] [Green Version]
  41. Hai, T.N.; Minh, D.D.; Hoa, N.M. Chemical characteristics of peat soil in the surroundings area and in the core zone in U Minh Ha National Reserve in Ca Mau province, Vietnam. Can Tho Univ. J. Sci. 2011, 18, 83–91. [Google Scholar]
  42. Thai, L.V.; Luom, T.T. Research on the resolution capability and mineral chemical in U Minh Thuong national park. Vietnam J. Agric. Rural. Dev. 2020, 397, 113–117. [Google Scholar]
  43. Hai, T.N.; Hoa, N.M.; Guong, V.T. Chemical characteristics of water environment in the surroundings area and in the core zone at U Minh Ha National Park in Ca Mau province. Can Tho Univ. J. Sci. 2013, 26, 105–112. [Google Scholar]
  44. Yliane, A.M.; Guiliani, Y.; Waite, T.D.; Collins, R.N. Exchangeable and secondary mineral reactive pools of aluminium in coastal lowland acid sulfate soils. Sci. Total Environ. 2014, 485–486, 232–240. [Google Scholar]
  45. Kumar, S.; Prakash, K.L. Surface Water Quality in the Forest Catchment—A Case Study of Tunga and Bhadra River Stretches, Karnataka. Curr. World Environ. 2020, 15, 227. [Google Scholar]
  46. Monica, N.; Choi, K. Temporal and spatial analysis of water quality in Saemangeum watershed using multivariate statistical techniques. Paddy Water Environ. 2016, 14, 3–17. [Google Scholar] [CrossRef]
  47. Haldar, K.; Kujawa-Roeleveld, K.; Dey, P.; Bosu, S.; Datta, D.K.; Rijnaarts, H.H. Spatio-temporal variations in chemical-physical water quality parameters influencing water reuse for irrigated agriculture in tropical urbanized deltas. Sci. Total Environ. 2020, 708, 134559. [Google Scholar] [CrossRef]
  48. Giao, N.T.; Anh, P.K.; Nhien, H.T.H. Spatiotemporal Analysis of Surface Water Quality in Dong Thap Province, Vietnam Using Water Quality Index and Statistical Approaches. Water 2021, 13, 336. [Google Scholar] [CrossRef]
  49. Chen, D.; Yuan, X.; Zhao, W.; Luo, X.; Li, F.; Liu, T. Chemodenitrification by Fe(II) and nitrite: pH effect, mineralization and kinetic modeling. Chem. Geol. 2020, 541, 119586. [Google Scholar] [CrossRef]
  50. Giao, N.T. Evaluating Current Water Quality Monitoring System on Hau River, Mekong Delta, Vietnam Using Multivariate Statistical Techniques. Appl. Environ. Res. 2020, 42, 14–25. [Google Scholar]
  51. Giao, N.T. Spatial variations of surface water quality in Hau Giang Province, Vietnam using multivariate statistical techniques. Environ. Nat. Resour. J. 2020, 18, 400–410. [Google Scholar] [CrossRef]
Figure 1. Map of the sampling locations in U Minh Ha National Park.
Water 13 01501 g001
Figure 2. Water quality classification at the locations on shallow acid sulfate soils.
Water 13 01501 g002
Figure 3. Water quality classification at the locations on deep acid sulfate soils.
Water 13 01501 g003
Table 1. The values of the water quality parameters of various land use types.
SeasonASSMod.pHEC
(µS cm−1)
DO
(mg L−1)
BOD
(mg L−1)
COD
(mg L−1)
N-NH4+
(mg L−1)
N-NO3
(mg L−1)
Fe3+
(mg L−1)
Al3+
(mg L−1)
RainyD-ASSAH6.8 ± 0.4 a11.7 ± 1.5 b (*)3 ± 2.1 a54.2 ± 4.4 (*)119 ± 59 b2.1 ± 1 (*)28.9 ± 19.3 (*)9.4 ± 6.6 b (*)0.3 ± 0.4
PMC4.6 ± 2.1 b25.6 ± 13.1 a (*)2 ± 0.2 ab (*)52.5 ± 11.3 (*)125.5 ± 74.4 b1.7 ± 1.419.8 ± 11.7 (*)22.4 ± 10.3 a (*)8.1 ± 8.5
NMC5.8 ± 0.1 ab1.7 ± 0.1 b (*)0.7 ± 0.1 b (*)54.4 ± 2.9 (*)282 ± 128.9 a2.7 ± 0.915.2 ± 16.2 (*)5.8 ± 0.7 b (*)1.8 ± 0.1
S-ASSAH2.9 ± 0.5 d (*)23.6 ± 9.7 c (*)2.6 ± 0.9 c (*)49.1 ± 3.8 d (*)113.9 ± 132.9 d (*)3 ± 0.521.5 ± 12.335.2 ± 20.7c6.8 ± 7 (*)
PMC2.8 ± 0.6 d (*)27.6 ± 8.3 c (*)2.6 ± 0.4 c (*)48.3 ± 4.8 d (*)173.9 ± 109.7 d (*)2.3 ± 0.923.5 ± 11.528.9 ± 14.4 cd6.1 ± 7.5 (*)
NMC5.8 ± 0 c (*)1.9 ± 0 d (*)0.8 ± 0.1 d (*)61.7 ± 4.5 c (*)388.3 ± 51.5 c (*)2 ± 0.428.3 ± 21.87.4 ± 2.6 d2 ± 0.5 (*)
DryD-ASSAH7.3 ± 0.4 A1.7 ± 0.1 B2.8 ± 0.1 A12.2 ± 4.3104.2 ± 18.5 B0.5 ± 0.1 B2 ± 2.9 AB1 ± 0.8 B0.2 ± 0.2
PMC5.1 ± 2.4 AB2.6 ± 0.9 A2.9 ± 0.3 A9.5 ± 4.5127.5 ± 13.2 A1 ± 0.8 B0.1 ± 0.1 B2.1 ± 1.4 B10.3 ± 11.4
NMC4.8 ± 0 B0.9 ± 0 B1.8 ± 0.2 B14.4 ± 1.182.4 ± 13.3 B2.2 ± 0.2 A3.2 ± 0.7 A8.4 ± 0.3 A3 ± 0.2
S-ASSAH2.4 ± 0.1 D2.9 ± 0.6 C2.5 ± 0.3 D3.9 ± 2.8 D99.6 ± 39.22.4 ± 0.21.4 ± 1.3 CD26.7 ± 6.215 ± 13.3
PMC2.4 ± 0.1 D3.1 ± 0.5 C2.3 ± 0.2 D8.9 ± 7.3 CD152.5 ± 95.18.5 ± 9.60.9 ± 0.4 D193.5 ± 258.717.9 ± 10.8
NMC4.8 ± 0.1 C1.2 ± 0.1 D3.1 ± 0.6 C13.8 ± 2.9 C128.8 ± 1.92.5 ± 0.72.4 ± 0.4 C9.4 ± 1.53.9 ± 0.9
Note: (*) There was seasonal variation, which has a significance level less than 0.05 (p < 0.05). The letters a, b, c, and d show statistically significant differences between the land use types during the rainy season on the same D-ASS and S-ASS, respectively. The letters A, B, C, and D show statistically significant differences between the land use types during the dry season on the same D-ASS and S-ASS, respectively. The baseline water quality data at each tree age of the area were presented in Tables S1 and S2.
Table 2. The ability to discriminate (a) and the discriminant coefficient (b) of the temporal surface water quality variation of the land use patterns on the S-ASS and D-ASS.
(a)(b)
Tests of Equality of Group MeansParameterDFs
S-ASSD-ASS
ParameterS-ASSD-ASSpH0.06−0.03
Wilks’ LambdaSig.Wilks’ LambdaSig.EC0.190.21
pH0.740.010.980.53DO0.02−0.03
EC0.220.000.470.00BOD0.440.65
DO0.970.390.980.47COD0.010.01
BOD0.050.000.080.00N-NO30.140.21
COD0.990.670.990.75N-NH4+−0.030.13
N-NO30.340.000.470.00Fe3+−0.030.19
N-NH4+0.930.200.690.00Al3+−0.06−0.01
Fe3+0.920.180.510.00Wilks’ Lambda0.010.04
Al3+0.770.020.990.76Sig.0.000.00
Table 3. Correlation coefficient between the water quality parameters and various land use types.
AH
pHDOECCODBODN-NO3N-NH4+Fe3+Al3+
pH1.00
DO0.261.00
EC−0.270.051.00
COD0.05−0.230.381.00
BOD0.140.100.73 **0.081.00
N-NO30.130.120.63 **0.180.76 **1.00
N-NH4+−0.69 **−0.280.52 **−0.030.43 *0.48 *1.00
Fe3+−0.79 **−0.170.27−0.330.12−0.050.63 **1.00
Al3+−0.58 **−0.01−0.020.07−0.31−0.220.270.311.00
PMC
pHDOECCODBODN-NO3N-NH4+Fe3+Al3+
pH1.00
DO−0.051.00
EC−0.23−0.201.00
COD−0.300.020.391.00
BOD0.06−0.43 *0.75 **0.051.00
N-NO3−0.15−0.390.71 **0.130.80 **1.00
N-NH4+−0.28−0.31−0.220.24−0.16−0.231.00
Fe3+−0.24−0.34−0.220.48 *−0.15−0.190.62 **1.00
Al3+−0.58 **0.24−0.050.44 *−0.39−0.280.220.321.00
NMC
pHDOECCODBODN-NO3N-NH4+Fe3+Al3+
pH1.00
DO−0.84 **1.00
EC0.94 **−0.67 *1.00
COD0.84 **−0.65 *0.87 **1.00
BOD0.97 **−0.84 **0.96 **0.86 **1.00
N-NO30.57−0.470.68 *0.520.68 *1.00
N-NH4+−0.08−0.05−0.11−0.270.020.101.00
Fe3+−0.66 *0.55−0.50−0.55−0.57−0.58 *0.111.00
Al3+−0.80 **0.95 **−0.65 *−0.62 *−0.81 **−0.36−0.130.361.00
* Correlation is significant at the 0.05 level (2-tailed). ** Correlation is significant at the 0.01 level (2-tailed).
Publisher’s Note: MDPI stays neutral with regard to jurisdictional claims in published maps and institutional affiliations.

