Article

Simulation of Extreme Precipitation in Four Climate Regions in China by General Circulation Models (GCMs): Performance and Projections

1
State Key Laboratory of Hydrology–Water Resources and Hydraulic Engineering, Hohai University, Nanjing 210000, China
2
Department of Civil and Environmental Engineering, Princeton University, Princeton, NJ 08544, USA
*
Author to whom correspondence should be addressed.
Water 2021, 13(11), 1509; https://doi.org/10.3390/w13111509
Submission received: 22 April 2021 / Revised: 20 May 2021 / Accepted: 25 May 2021 / Published: 27 May 2021
(This article belongs to the Section Hydrology)

Abstract

:
In the context of global climate change, it is important to monitor abnormal changes in extreme precipitation events that lead to frequent floods. This research used precipitation indices to describe variations in extreme precipitation and analyzed the characteristics of extreme precipitation in four climatic (arid, semi-arid, semi-humid and humid) regions across China. The equidistant cumulative distribution function (EDCDF) method was used to downscale and bias-correct daily precipitation in eight Coupled Model Intercomparison Project Phase 5 (CMIP5) general circulation models (GCMs). From 1961 to 2005, the humid region had stronger and longer extreme precipitation compared with the other regions. In the future, the projected extreme precipitation is mainly concentrated in summer, and there will be large areas with substantial changes in maximum consecutive 5-day precipitation (Rx5) and precipitation intensity (SDII). The greatest differences between two scenarios (RCP4.5 and RCP8.5) are in semi-arid and semi-humid areas for summer precipitation anomalies. However, the area of the four regions with an increasing trend of extreme precipitation is larger under the RCP8.5 scenario than that under the RCP4.5 scenario. The increasing trend of extreme precipitation in the future is relatively pronounced, especially in humid areas, implying a potential heightened flood risk in these areas.

1. Introduction

In a warming climate, understanding the spatiotemporal changes in extreme precipitation is extremely important for the prevention and mitigation of water-related disasters, as well as for effective water resource management. Changes in extreme climate are key factors in extreme precipitation, which can lead to severe flooding. Currently, detecting and predicting extreme climate events are important research topics due to their significant impacts on humans and economies [1,2,3]. The 5th Assessment Report of the IPCC (2014) states that it is very likely that global near-surface and tropospheric air humidity has increased since the 1970s [4], which indicates that more land regions will likely experience an increase rather than a decrease in extreme precipitation events. Studies have shown that extreme precipitation has substantially increased in recent years [5]. Moreover, extreme precipitation events are expected to be more frequent and intense by the end of the 21st century [6].
With the increasing severity of extreme precipitation worldwide, researchers have performed extensive research related to extreme precipitation, mainly focusing on its relationship with temperature [7,8]. The Clausius–Clapeyron (CC) relation, as an expression of the fundamental relationship between the water-holding capacity of a gas and its temperature, is used to predict precipitation extremes, and its performance is better than methods that use average precipitation variation [9,10]. Due to large regional differences in precipitation extremes with temperature changes, the CC relationship is a good method for predicting future changes in extreme precipitation in mid-latitudinal regions [11]. Some studies involving regional differences have found that, on a large scale, there are trends of wetter regions becoming wetter and drier regions becoming drier [12,13]. Therefore, the patterns of extreme precipitation characteristics for different climatic zones in China need to be explored.
In last few decades, many studies have shown significant increasing trends of extreme precipitation in North America, Europe, Australia, Japan, China and elsewhere [14,15,16,17]. Particularly, China, which has the largest population in the world and a complex climate, suffers from many severe natural disasters. Additionally, China has mixed precipitation patterns under differing climate regimes [18]. Extreme precipitation events in China are a serious threat to socioeconomic security, agricultural production safety and human health [19]. Research on the temporal and spatial behaviors of extreme precipitation in China is of great importance for flood monitoring and the formulation of flood control strategies.
Many studies have focused on the total amount, frequency and intensity of extreme precipitation in China. In the field of thermodynamics, changes in extreme precipitation are often expected to scale with precipitable water changes, and extreme precipitation greatly contributes to the total precipitation. For example, Li and Hu [20] found that the contribution of extreme precipitation to total rainfall reached 40–60% in Poyang Lake. Although different definitions of extreme precipitation may lead to substantially different results [21], it is possible to summarize the characteristics of different types of extreme precipitation and to compare the differences and similarities between different forms of extreme precipitation [22]. Precipitation indices based on the definitions recommended by the Expert Team on Climate Change Detection and Indices (ETCCDI) were adopted to quantify extreme precipitation. In addition, to better facilitate the discussion about the regional features of changes in extreme precipitation, many studies have subdivided China based on geographical conditions or focused on major river basins and provinces in China [23,24]. Considering climatological characteristics, we divided China into arid, semi-arid, semi-humid and humid regions and used precipitation indices to analyze regional differences in the temporal and spatial characteristics of extreme precipitation in China. Furthermore, based on climate projections, we explored future trends of extreme precipitation over different regions of China, which is of great significance to flood management and prevention.

2. Data and Methods

2.1. Datasets

The observed daily precipitation over China from 1961 to 2005 was obtained from the National Meteorological Information Center, China Meteorological Administration (http://data.cma.cn/, accessed date: 15 October 2019), which has a 0.5° spatial resolution.
Based on the observed data, the performance of eight CMIP5 global circulation models (GCMs) in simulating daily extreme precipitation over China was evaluated. The models are archived at the Program on Climate Model Diagnosis and Intercomparison (PCMID) website (https://pcmdi.llnl.gov/index.html, accessed date: 12 August 2019) and are listed in Table 1. The eight simulation models of precipitation and temperature have been verified by previous research results [25], and their simulation effects are better than those obtained with other models. Therefore, based on previous research, these eight models were selected for this research. The historical period of CMIP5 data covers 45 years, from 1961 to 2005, and the future period is from 2006 to 2099. Considering future conditions and global warming signals, two scenarios (RCP4.5 and RCP8.5) with medium and high future greenhouse gas emissions were simulated and compared. Because of the different spatial resolutions of different GCMs, all model outputs were first bilinearly interpolated to the same 0.5° × 0.5° grid as the observations [26].
Because of the complex terrain and distinct climatic features of China, the study area was divided into four climate regions based on the precipitation climatology over China in 1961–2005 [27]. Average annual precipitation levels of 200 mm, 400 mm and 800 mm were applied as thresholds to divide the entire area into four subregions (arid, semi-arid, semi-humid and humid), as shown in Figure 1.

2.2. Methods

2.2.1. Precipitation Indices

Eleven precipitation indices were adopted based on the definitions recommended by the Expert Team on Climate Change Detection and Indices (ETCCDI) and were used to quantify the degree of extreme precipitation [28]. The primary function of precipitation indices is to characterize the frequency (CDD, CWD, R1, R10 and R20), intensity (Rx1, Rx5 and SDII) and amount (R95p, R99p and PTOT) of precipitation events in observations and model simulations, as seen in Table 2.

2.2.2. Bias Correction and Downscaling

The equidistant cumulative distribution function (EDCDF) method uses the difference between the cumulative distribution characteristics of climate elements simulated by GCMs and those regionally measured to correct the deviation of simulated values and effectively capture the extreme values [25,29]. The EDCDF method improves the inherent errors in climate model data and the limitations of applied interpolation methods to increase the simulation accuracy of climate elements [30,31]. Based on the EDCDF method, the daily precipitation of the eight CMIP5 models was downscaled and corrected in historical (1961–2005) and future (2006–2099) periods.

2.2.3. Statistical Assessment Method

To assess the performance of CMIP5 data in China, we calculated the Kling–Gupta Efficiency (KGE) [32,33].
K G E = 1 E D
E D = ( r 1 ) 2 + ( α 1 ) 2 + ( β 1 ) 2
α = σ s / σ o
β = μ s / μ o
where ED is the Euclidian distance from the ideal point; r is the linear correlation coefficient; α is a measure of relative variability in the simulated and observed values; β is the ratio between the mean simulated and mean observed values; σ o and σ s are the standard deviations of observed and simulated values, respectively; and μ o and μ s are the means of observed and simulated values, respectively.
However, the KGE, alone, may not be able to detect differences between a single model and multi-model ensemble mean in simulating extreme precipitation. The comprehensive model rank (MR) was adopted to evaluate the performance of each model. Larger MR values indicate better model performance [34,35].
M R = 1 1 ( 1 × m × n ) i = 1 n r a n k i
where m and n are the numbers of models and indices, respectively, and ranki is based on the model’s order of performance for each index.
In order to directly reflect the future variation trends of extreme precipitation characteristics in different regions, the Mann–Kendall (M–K) method was used. The trend of the sequence is determined by the test value of the M–K method. A positive test value indicates an increasing trend, and a negative value indicates a decreasing trend. In this paper, the absolute value of the M–K result is greater than or equal to 1.96 to indicate that it passes the 0.05 significance level.
Difference coefficients were used to quantify the uncertainty of climate model projections of future extreme precipitation in the four regions of China. The difference coefficient (C) formula is as follows:
C = 1 m i = 1 m ( x i x ¯ ) 2 / | x ¯ |
where x i is the simulated precipitation index for each model, x ¯ is the ensemble mean of CMIP5 models and m is the number of climate models (m = 8). The smaller the value of C, the smaller the degree of dispersion of the climate model projections, and thus, the smaller the uncertainty of the model projections.
The precipitation anomaly method [36] was applied to analyze precipitation index characteristics. In order to distinguish differences in precipitation characteristics in different months, the anomaly value of the precipitation index was calculated for each month in the four regions. This method can eliminate seasonal differences in precipitation and directly reflect the annual variation trend of extreme precipitation in each season.

3. Results

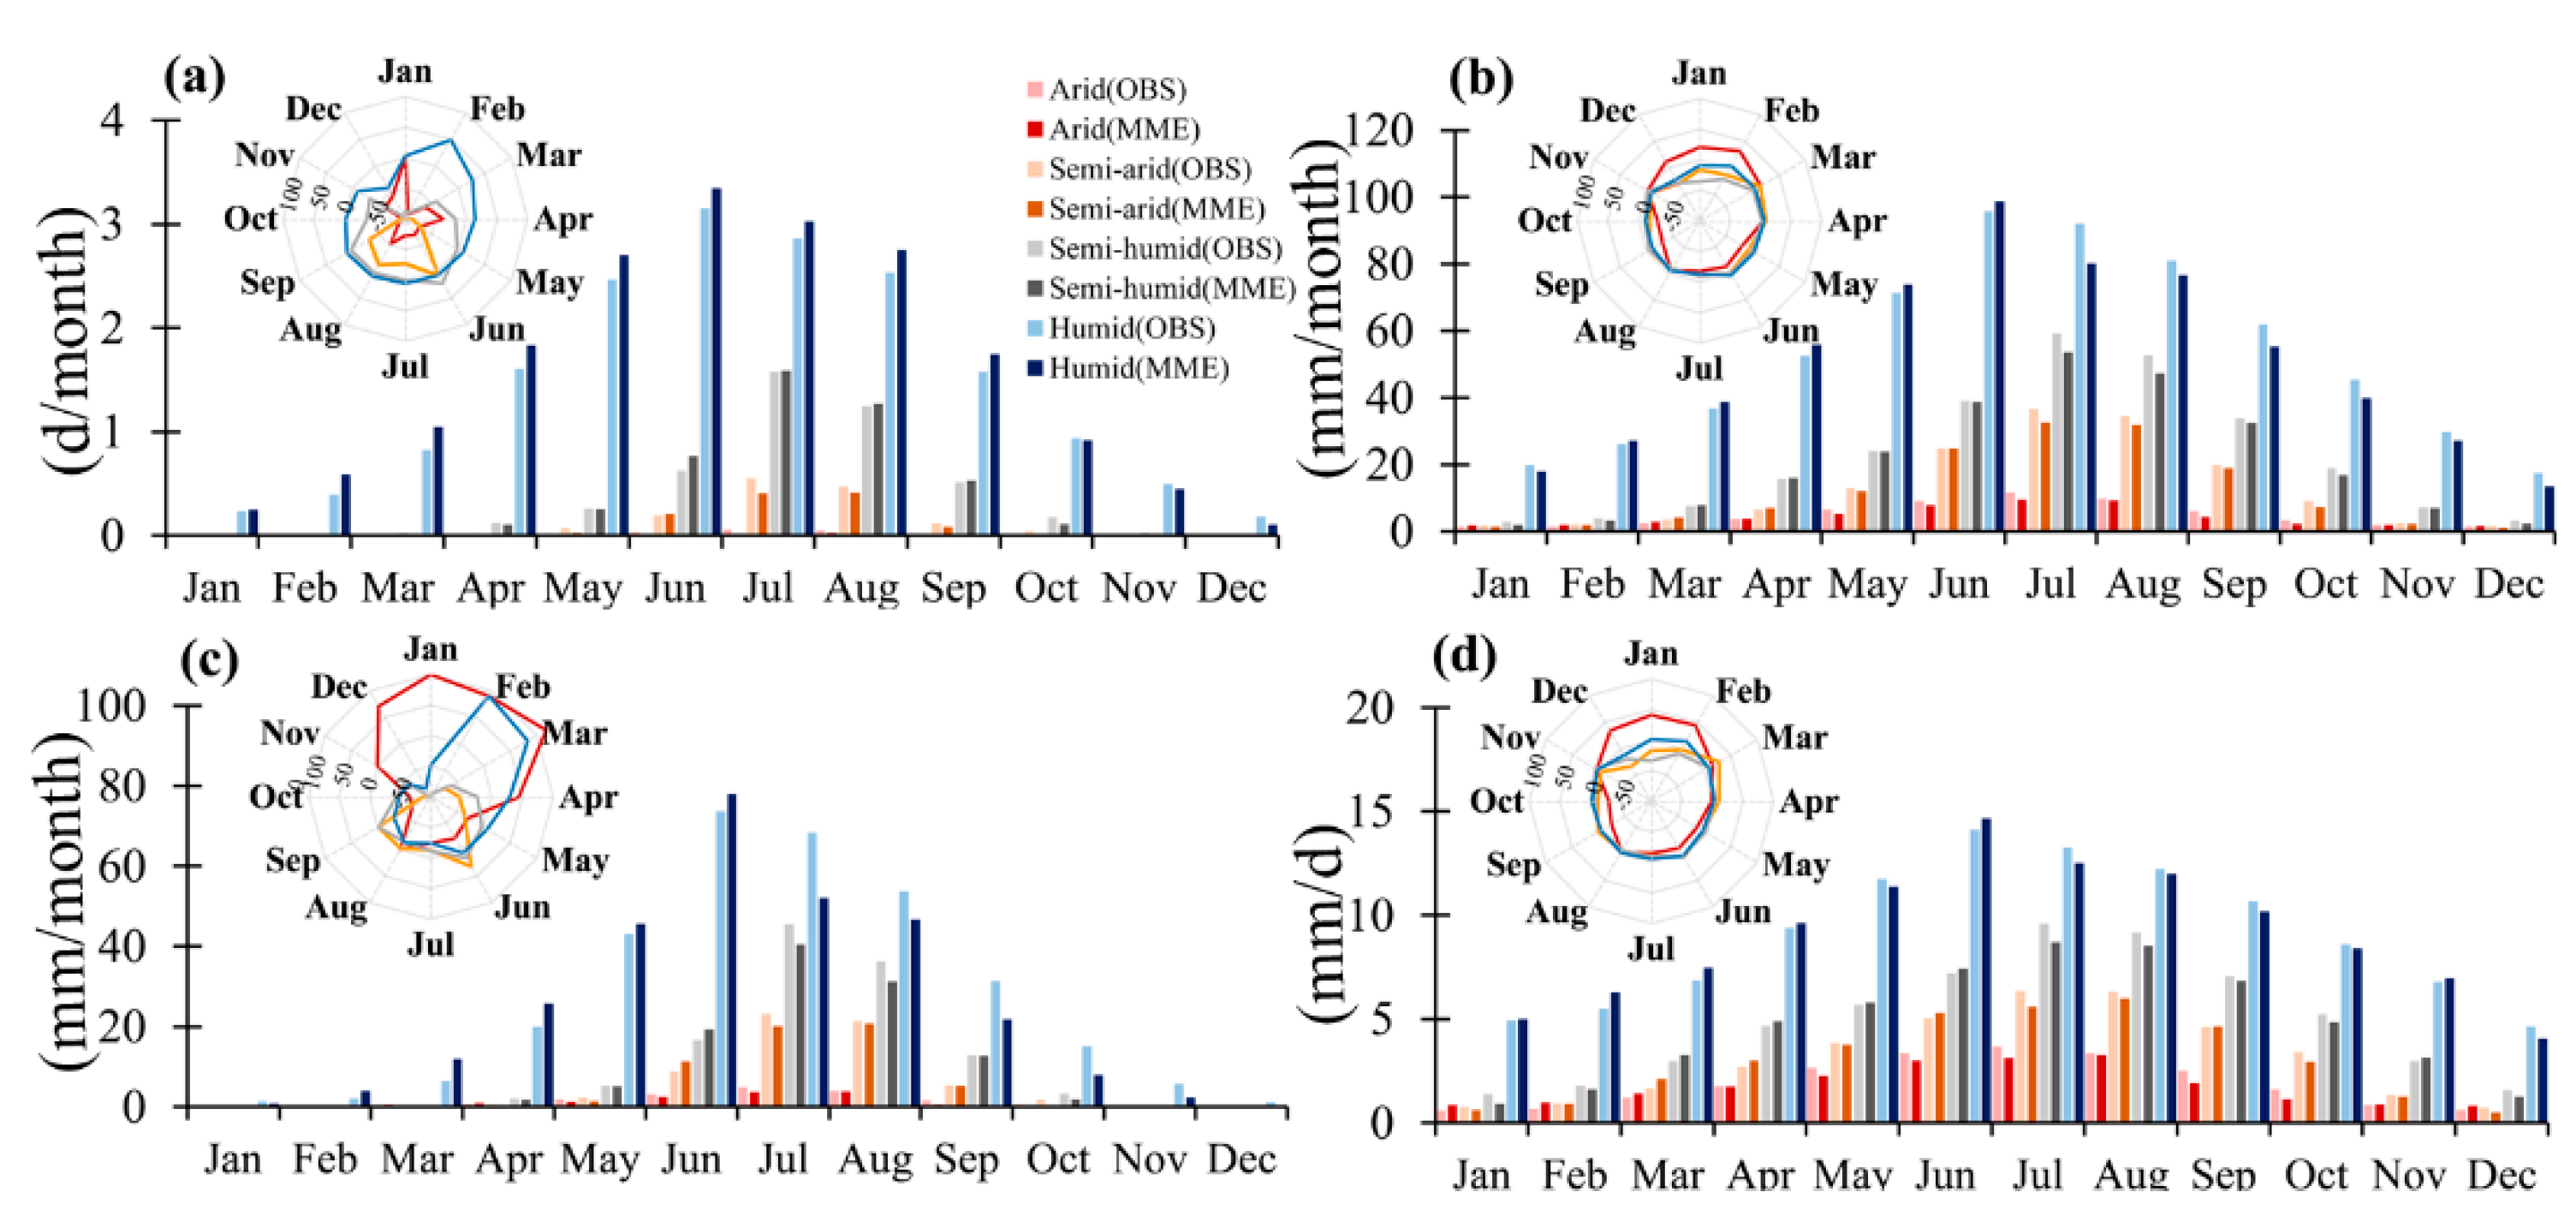
3.1. Performance Assessment

In order to assess the performance of precipitation indices in the eight CMIP5 models during 1961–2005, the KGEs of 11 precipitation indices in four different regions were calculated and are presented in Figure 2. The figure shows that all CMIP5 models have precipitation indices with similar KGE values, except for R20. For most precipitation indices, the simulated results are better in semi-arid and semi-humid regions, and KGE values are over 0.5 for almost all precipitation indices. The results also show that the multi-model ensemble mean can offset the large deviation between observations and a single CMIP5 model. In order to study the characteristics of extreme precipitation and considering the simulation performance of precipitation indices in the model, we selected 4 (R20, Rx5, R95p and SDII) of the 11 precipitation indices for further analysis, among which R20, Rx5 and R95p can reflect the characteristics of extreme precipitation. The four indices can represent the intensity, frequency and amount of extreme precipitation. Based on the four precipitation indices, the comprehensive model rank shows the relative performance of the eight single models and the multi-model ensemble mean in simulating extreme precipitation (Figure 3). The comprehensive rank of the multi-model ensemble mean is much better than that of a single model. In general, the eight CMIP5 models and the multi-model ensemble mean perform well in simulating precipitation indices in the four regions. For R20, the KGE results are not as good in the semi-arid region, but the KGE values are all larger than −1. The multi-model ensemble mean provides better simulation results for R20 in arid and semi-arid areas than other models. The reason is that the R20 results of the eight CMIP5 models for June–October are slightly different from observation data, whereas the multi-model ensemble mean fits well with the observed R20 results. The multi-model ensemble mean has advantages in simulating extreme precipitation, so it was used as the optimal model to analyze the characteristics of extreme precipitation. Therefore, we used the four selected indices and the multi-model ensemble mean to predict the trend of extreme precipitation.

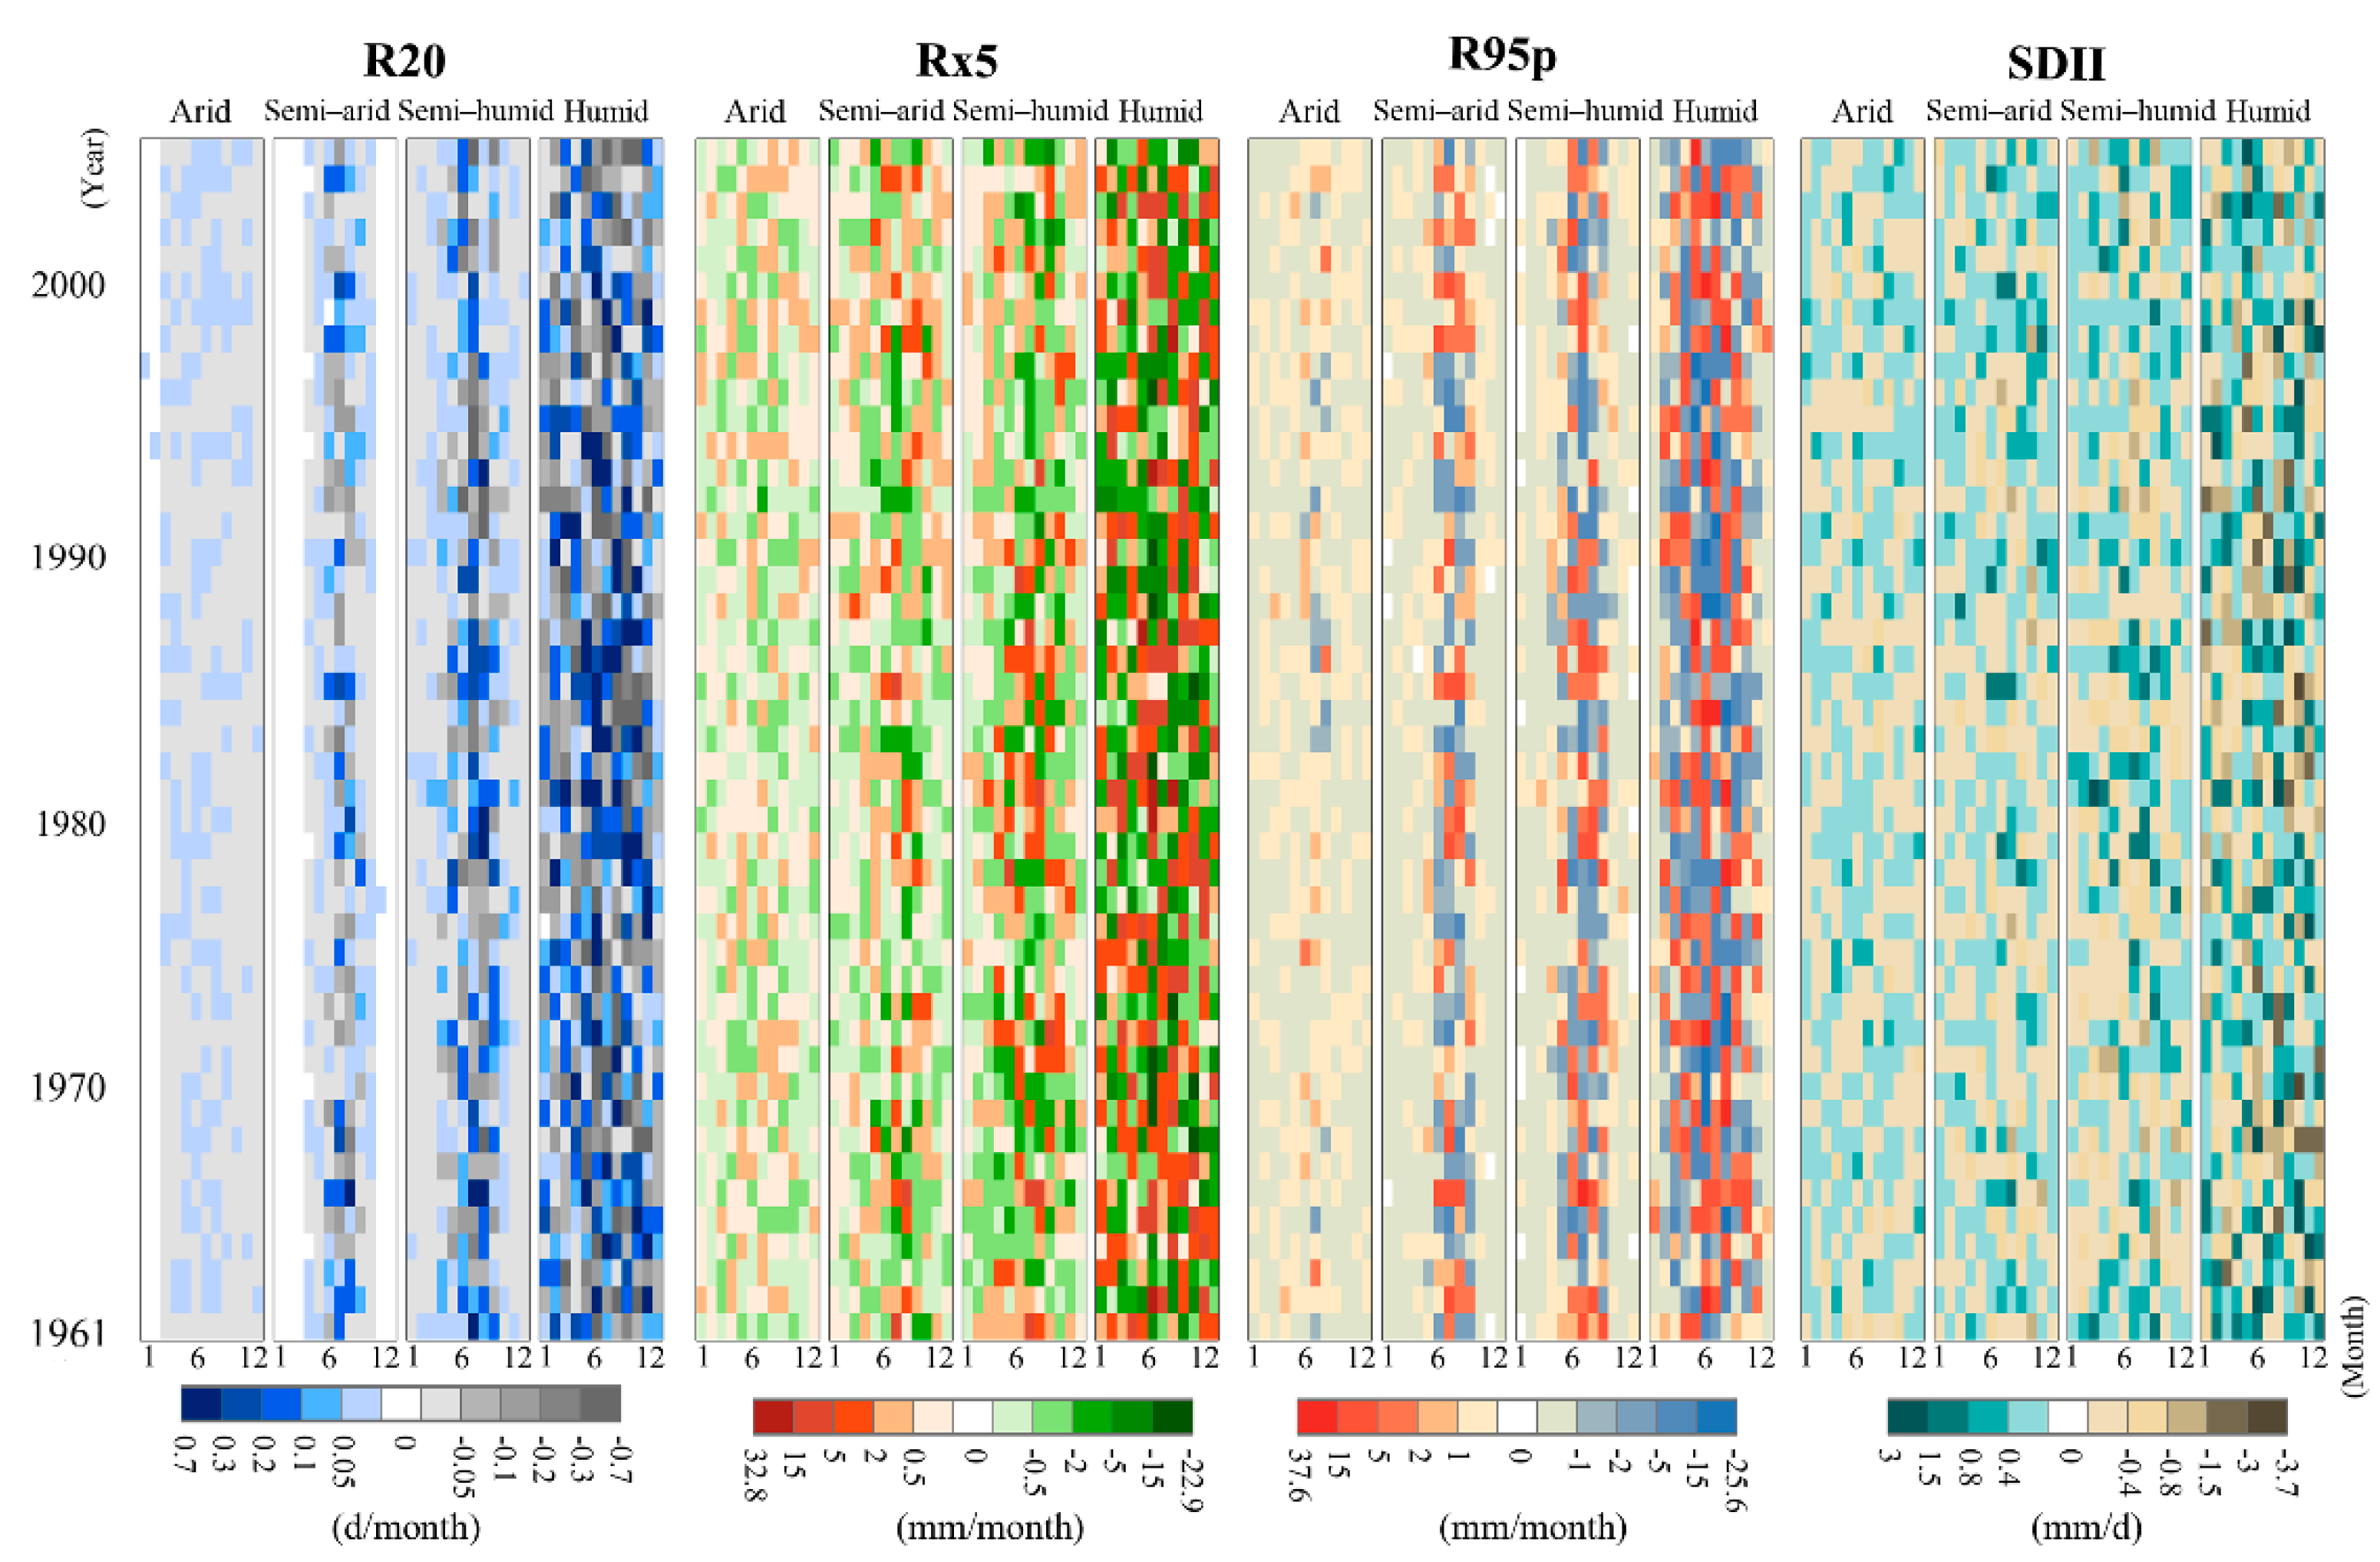
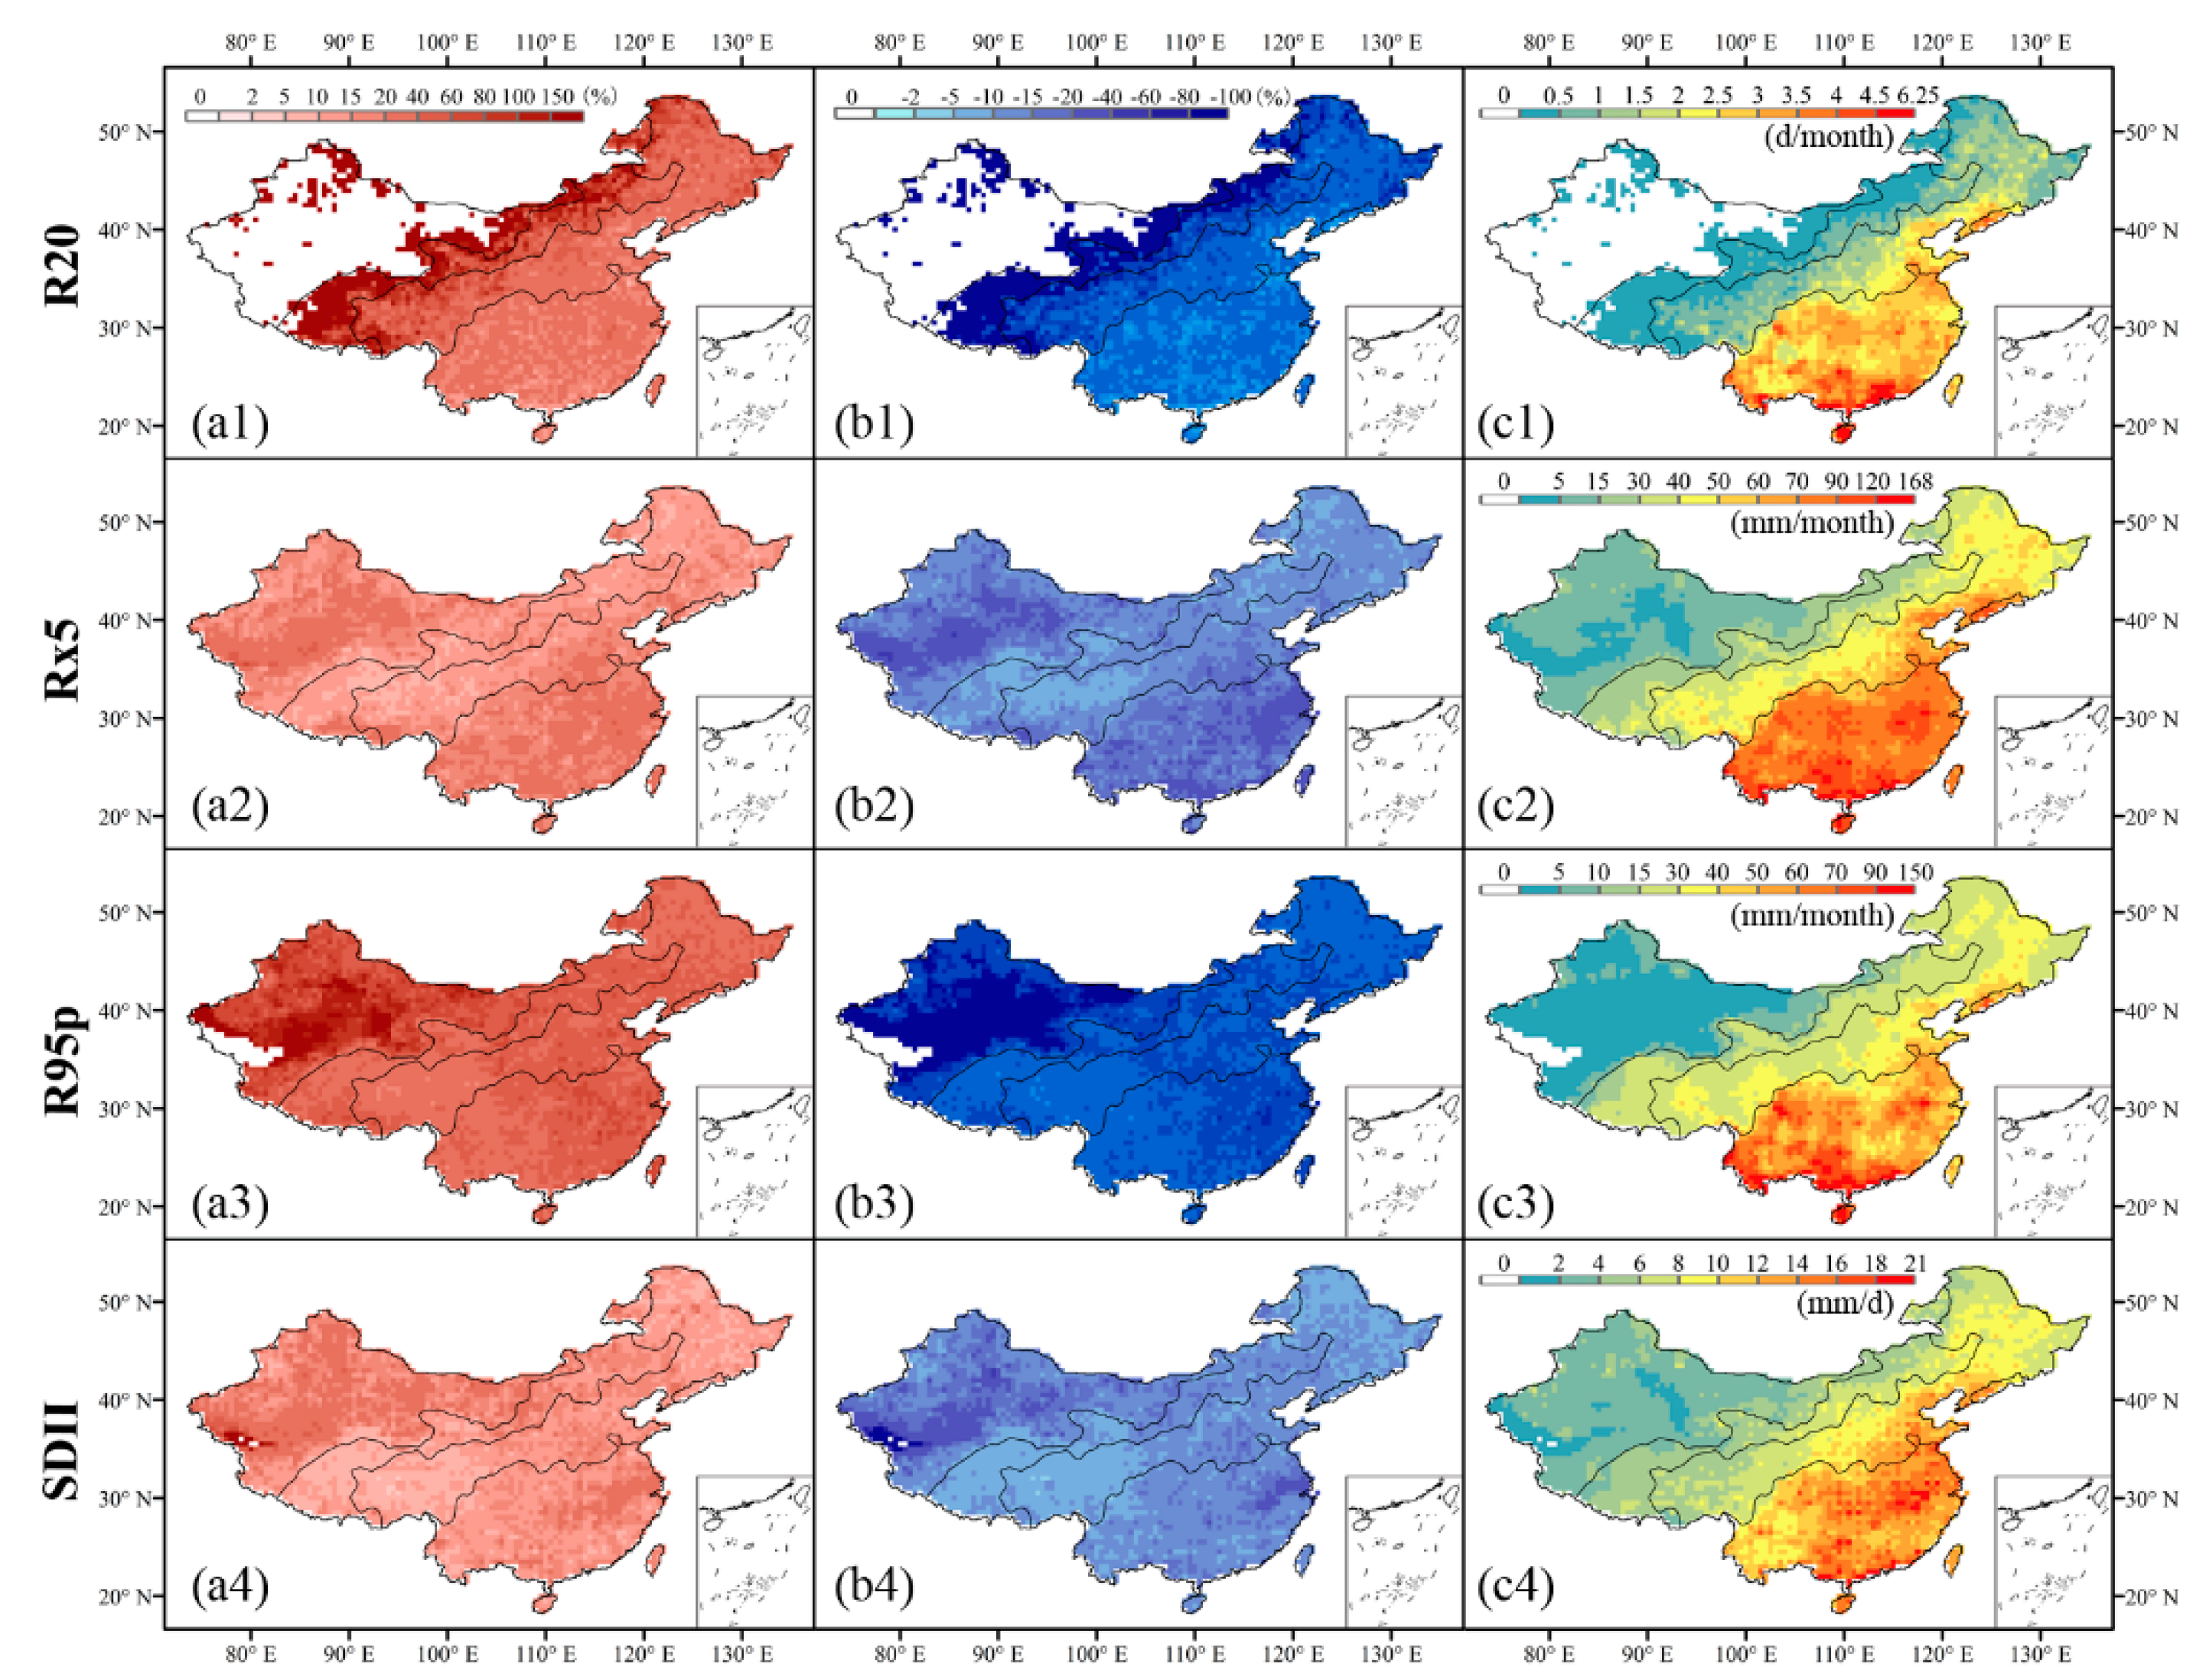
3.2. Characteristics of Precipitation Indices in the Historical Period

Figure 4 shows the cumulative probability distribution of extreme values of four precipitation indices (R20, Rx5, SDII and R95p) based on the bias-corrected multi-model ensemble mean (MME) and observations. When the cumulative probability level is above 0.9, the MME results in extreme precipitation index values that are greater than the observed results in arid, semi-arid and semi-humid regions. However, when the cumulative probability level is less than 0.9, the MME results match the observations very well in all subregions. This indicates that the gamma distribution for bias-correcting precipitation does not match the extreme values of the observations in the arid, semi-arid and semi-humid regions. The cumulative probability distribution characteristics of the precipitation indices in the four regions have significant differences. By contrast, there is no significant difference in precipitation indices between the MME results and observations. In general, the cumulative probability distributions show that the bias-corrected multi-model ensemble mean (MME) simulations of precipitation characteristics (R20, Rx5, SDII and R95p) closely match observations in the four regions, especially in the humid area. For the arid, semi-arid and semi-humid regions, the MME underestimates R20, Rx5, SDII and R95p above a cumulative probability level of 0.9. This result is consistent with the study of Allan and Soden, who found that GCMs may underestimate the sensitivity of precipitation extremes in response to warming [37].
The four precipitation indices have not only significant regional differences but also significant seasonal differences (Figure 5). Due to climatic conditions, there is more precipitation in summer and less precipitation in winter in China. The multi-year monthly averages of the four precipitation indices show a clear seasonal pattern over all subregions, and the results are consistent with the general precipitation pattern in China. From 1961 to 2005, the results show that the probability of extreme precipitation events is highest in June, July and August (JJA). The multi-year monthly average results show large regional differences in R20, which represents the frequency of precipitation, and R95p, which represents the intensity of extreme precipitation. Deviations between the bias-corrected MME and observations were determined for each subregion and month, and the results for the four precipitation indices show that the bias-corrected MME has the best simulation results for the Rx5 and SDII indices (deviation range between −50% and 50%), especially in semi-arid, semi-humid and humid regions, which have very small deviations. The R95p results show the largest deviation, which ranges between 50% and 100%, mainly in the arid and humid regions in winter, while the deviation is smaller in summer. For JJA (June–August), the deviations of the four precipitation indices in different regions remain between −27% and 32%, except that the deviation of R20 in arid areas is less than −50%. This indicates that the bias-corrected MMEs of precipitation indices (R20, Rx5, R95p and SDII) match the observations in summer to a good extent.
Extreme precipitation in China is relatively strong in summer. However, differences in the characteristics of extreme precipitation in the four regions are not only seasonal but also spatial. In order to explore the temporal and spatial rules of extreme precipitation in different regions, the temporal evolution trends of four precipitation index anomalies (R20, Rx5, R95p and SDII) in 1961–2005 were established (Figure 6). In the arid region, the precipitation index anomalies are almost zero for each month, and interannual variability exists only in the summer for the R95p index. This indicates that the extreme summer precipitation in arid regions is only manifested in the extreme precipitation amount (R95p index). In the semi-arid and semi-humid areas, we can see a clear band of fluctuations in JJA in 1961–2005. The fluctuation zone of anomalies becomes wider in humid areas, and the amplitude of values changes greatly. In JJA, the anomaly of each precipitation index in the humid area is about twice as large as that in semi-arid and semi-humid areas. This indicates that, in the transition from the arid zone to the humid zone, the summer characteristics of extreme precipitation become more pronounced, and the intensity of extreme precipitation becomes greater. The extreme precipitation in semi-arid and semi-humid regions mainly occurs in summer, while the extreme precipitation in the humid region occurs with high probability and intensity in the three seasons other than winter. Overall, the extreme precipitation frequency and amount strongly vary in summer in all subregions, with the intensity gradually increasing from arid to humid areas.
Based on the annual mean values Figure 7(c1–c4) of the four precipitation indices in JJA, we calculated the percentage of precipitation index anomalies and distinguished between positive and negative values in JJA (Figure 7(a1–a4),(b1–b4)). In order to avoid the phenomenon of time feature homogenization caused by calculating the mean multi-year deviation, we distinguished between years with positive and negative deviations and calculated the annual deviation means of positive and negative years, respectively. Figure 7 shows the spatial difference and annual mean value of each index (R20, Rx5, R95p and SDII) in JJA in 1961–2005. Due to the lack of precipitation in the arid region, the annual average monthly values of R20 in this region and those of R95p in the southwestern part of the region are almost zero. Therefore, the precipitation anomaly variation in this region was not considered. In semi-arid regions, multi-year averages of precipitation indices are of small magnitude. This result reflects the low probability of extreme precipitation events in arid and semi-arid regions. In semi-humid and humid regions, the positive and negative anomaly percentages of the R20 and R95p indices are larger than those of Rx5 and SDII. However, the difference in R20 is not prominent in humid regions, and the variation in R95p is concentrated in the southeast of humid and semi-humid regions, with the variation ranges of positive and negative values about 20 to 80% and −15% to −80%, respectively. The variation in Rx5 and SDII is still concentrated in the southeast area, with the variance in positive and negative values amounting to 5 to 20% and −5% to −20%, respectively. This reveals that there is little variation in the frequency and intensity of extreme precipitation in humid areas, but the strongest variation in the amount of extreme precipitation is found in humid and semi-humid areas.

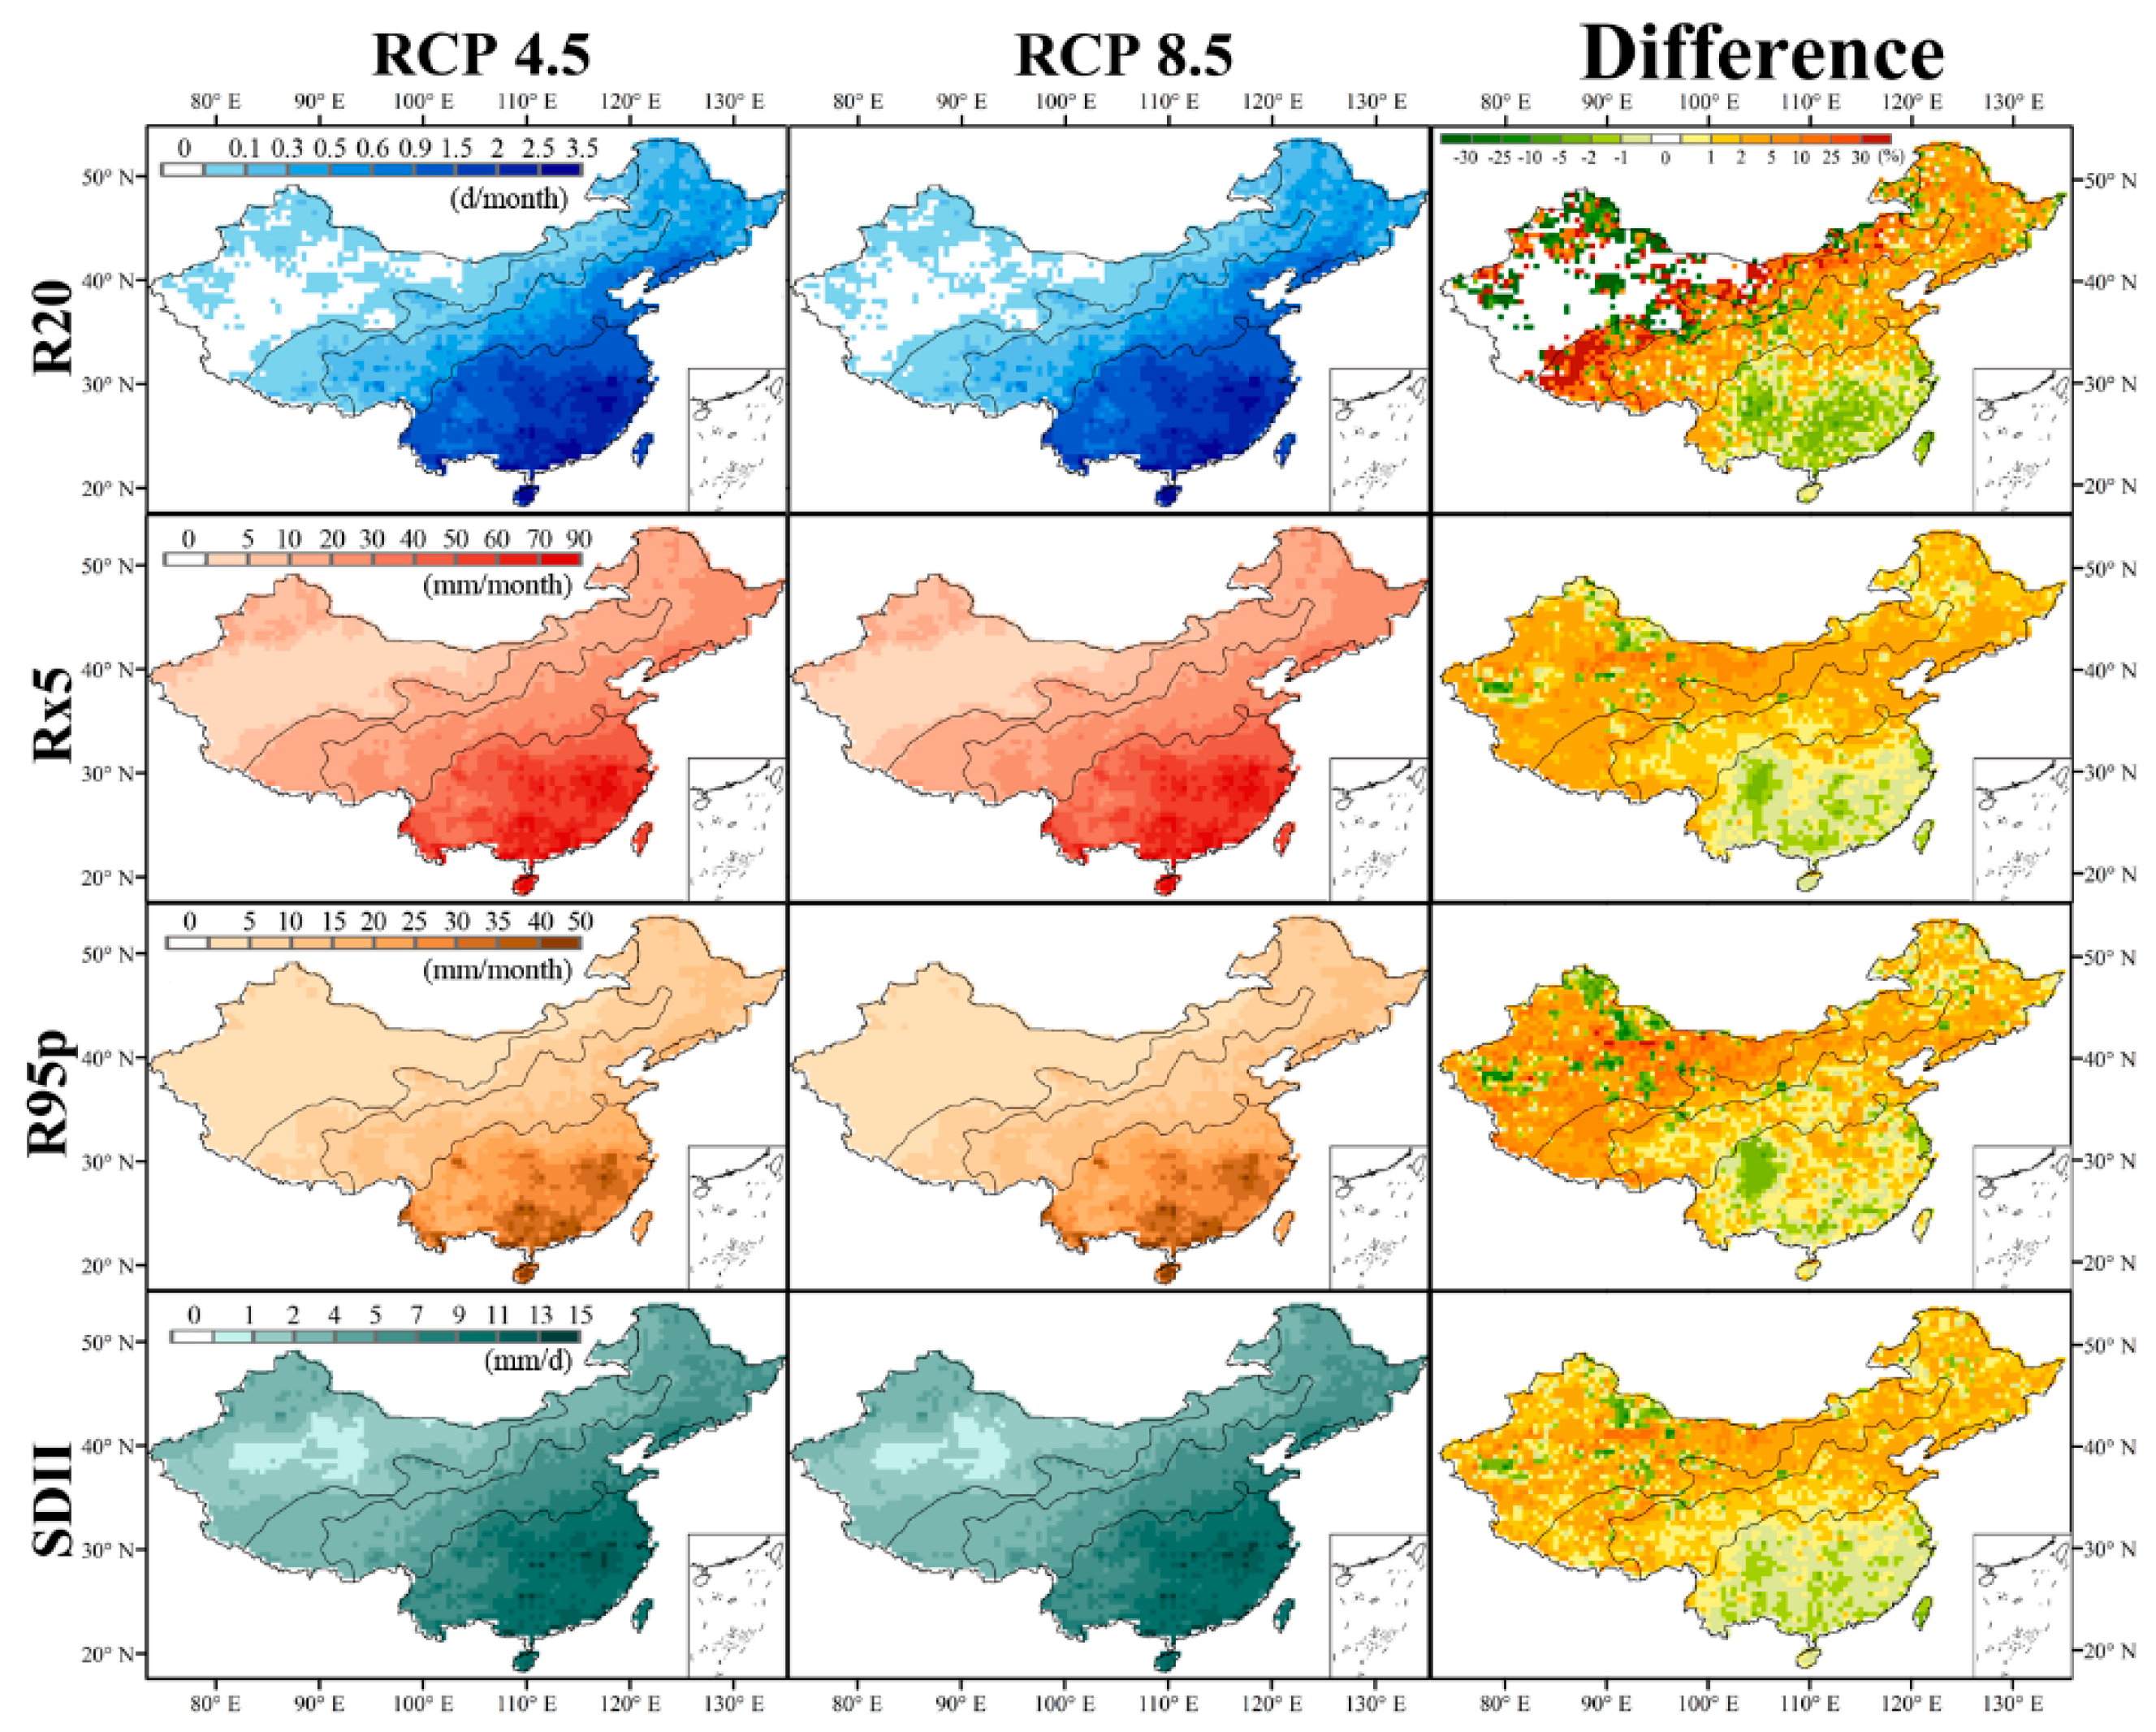
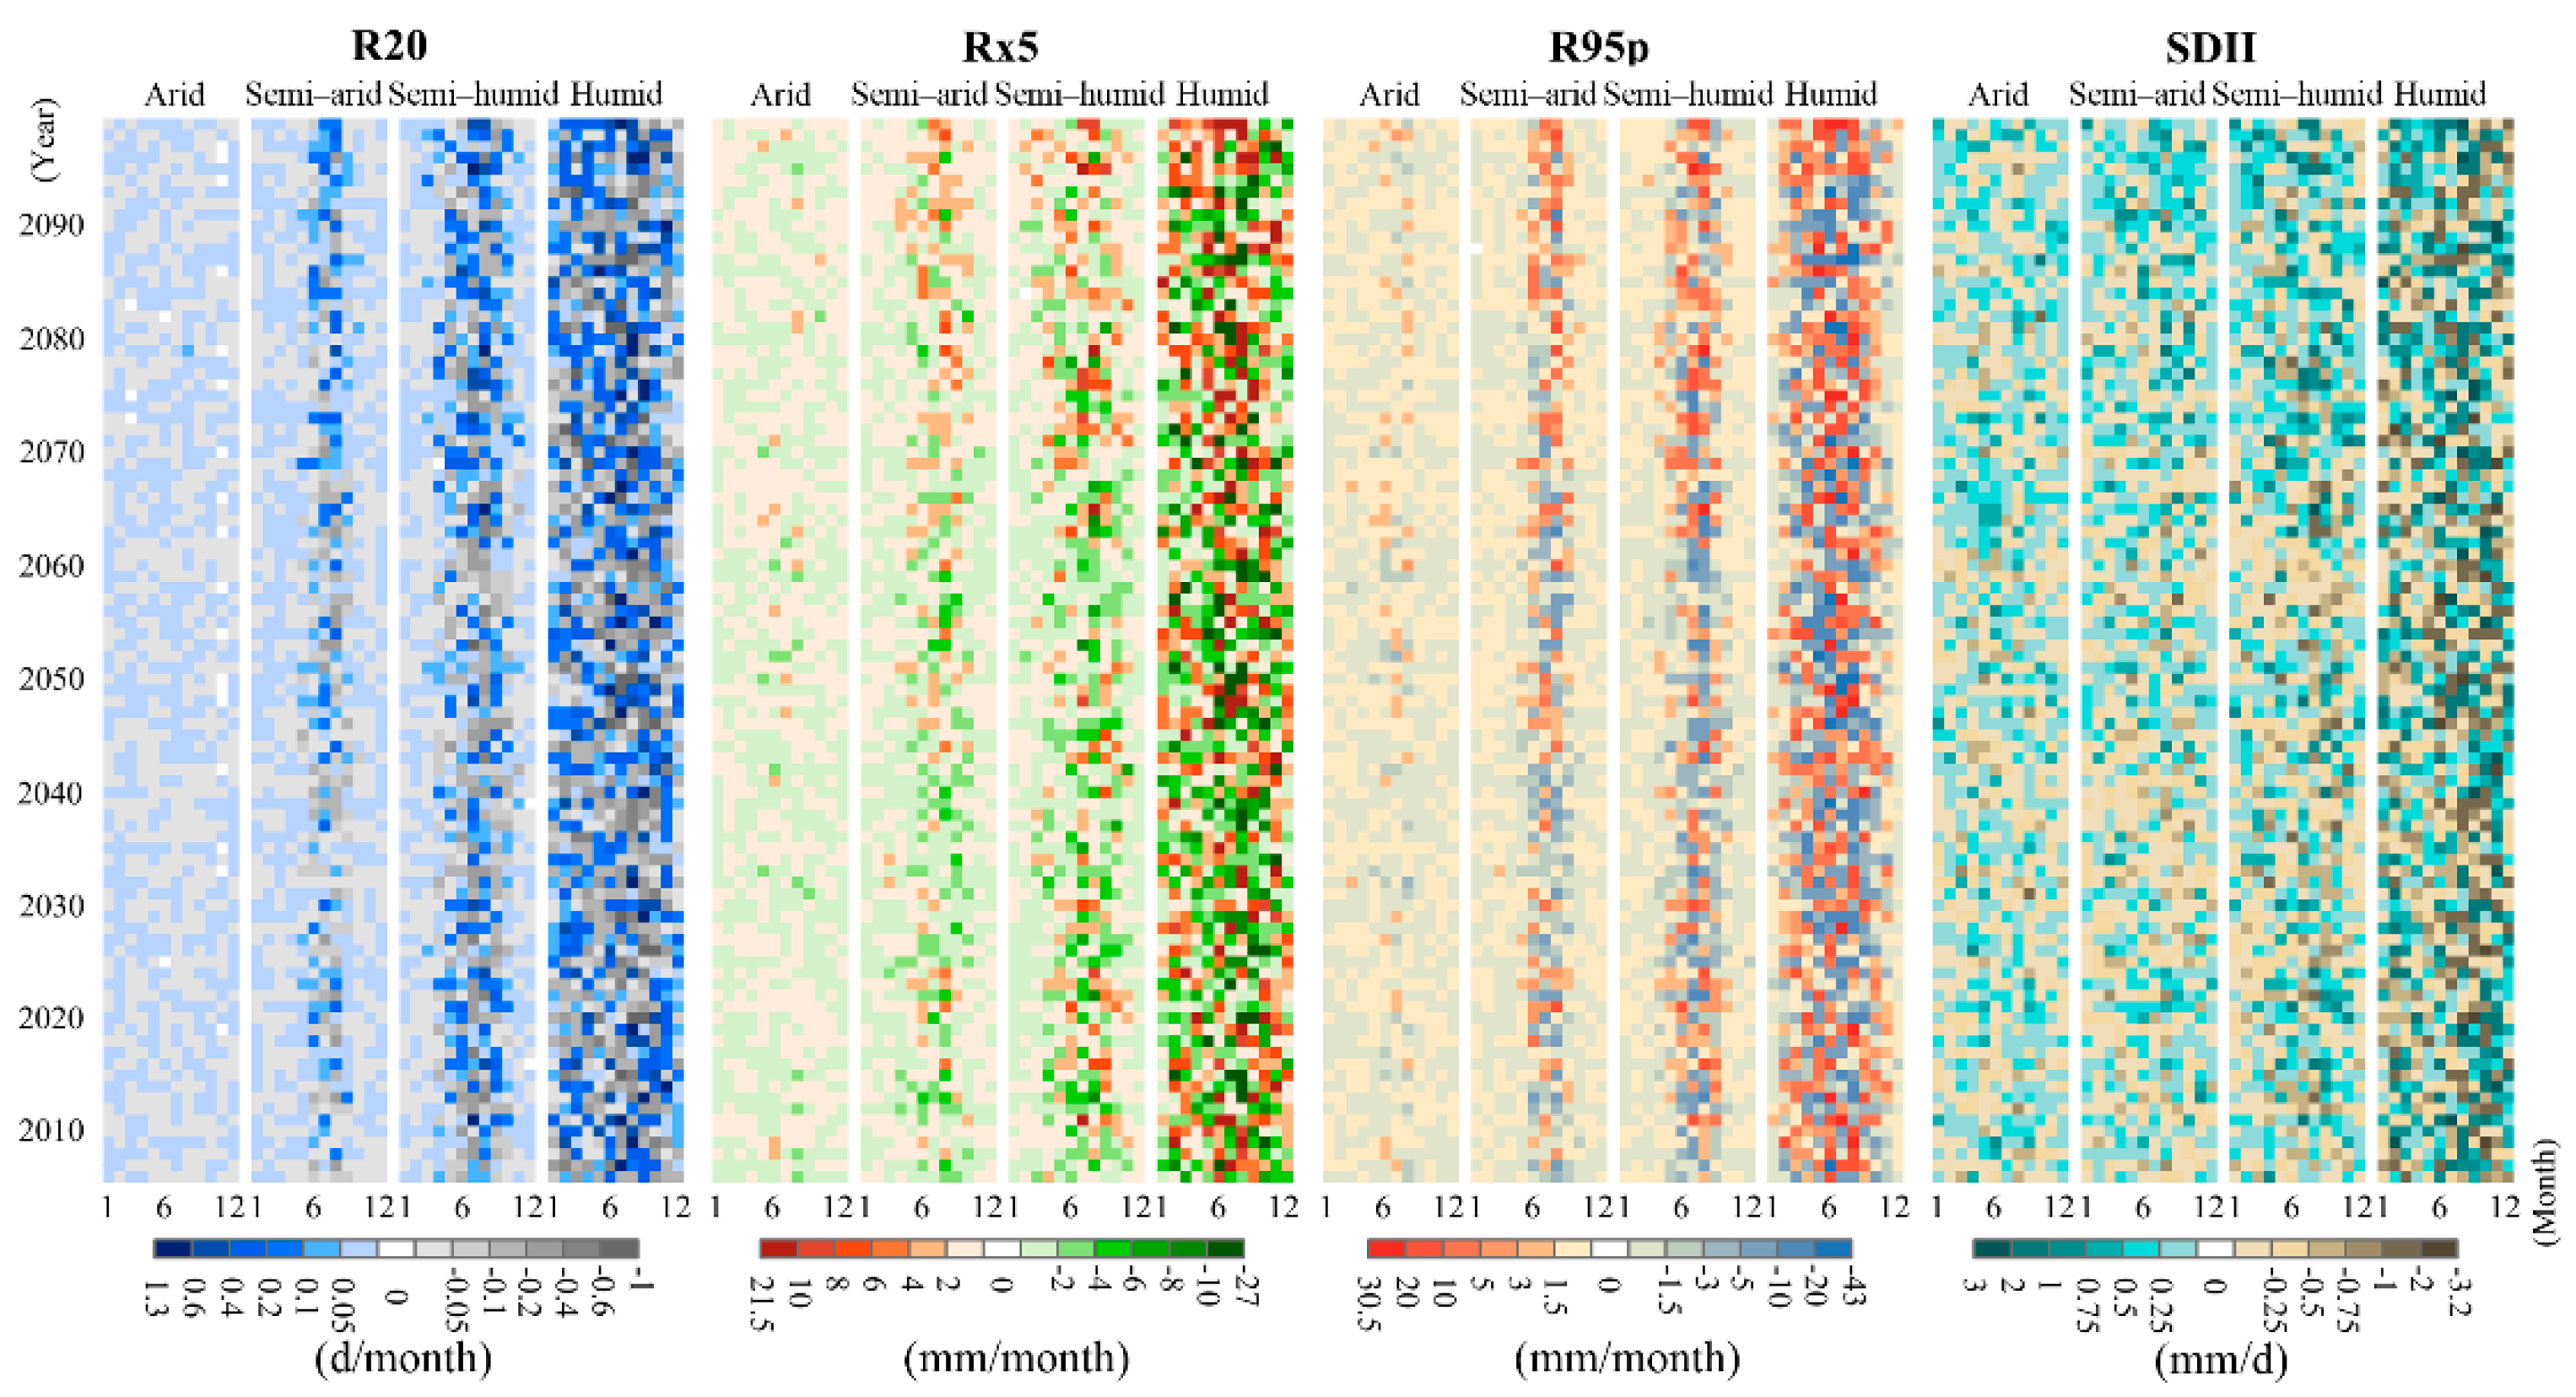
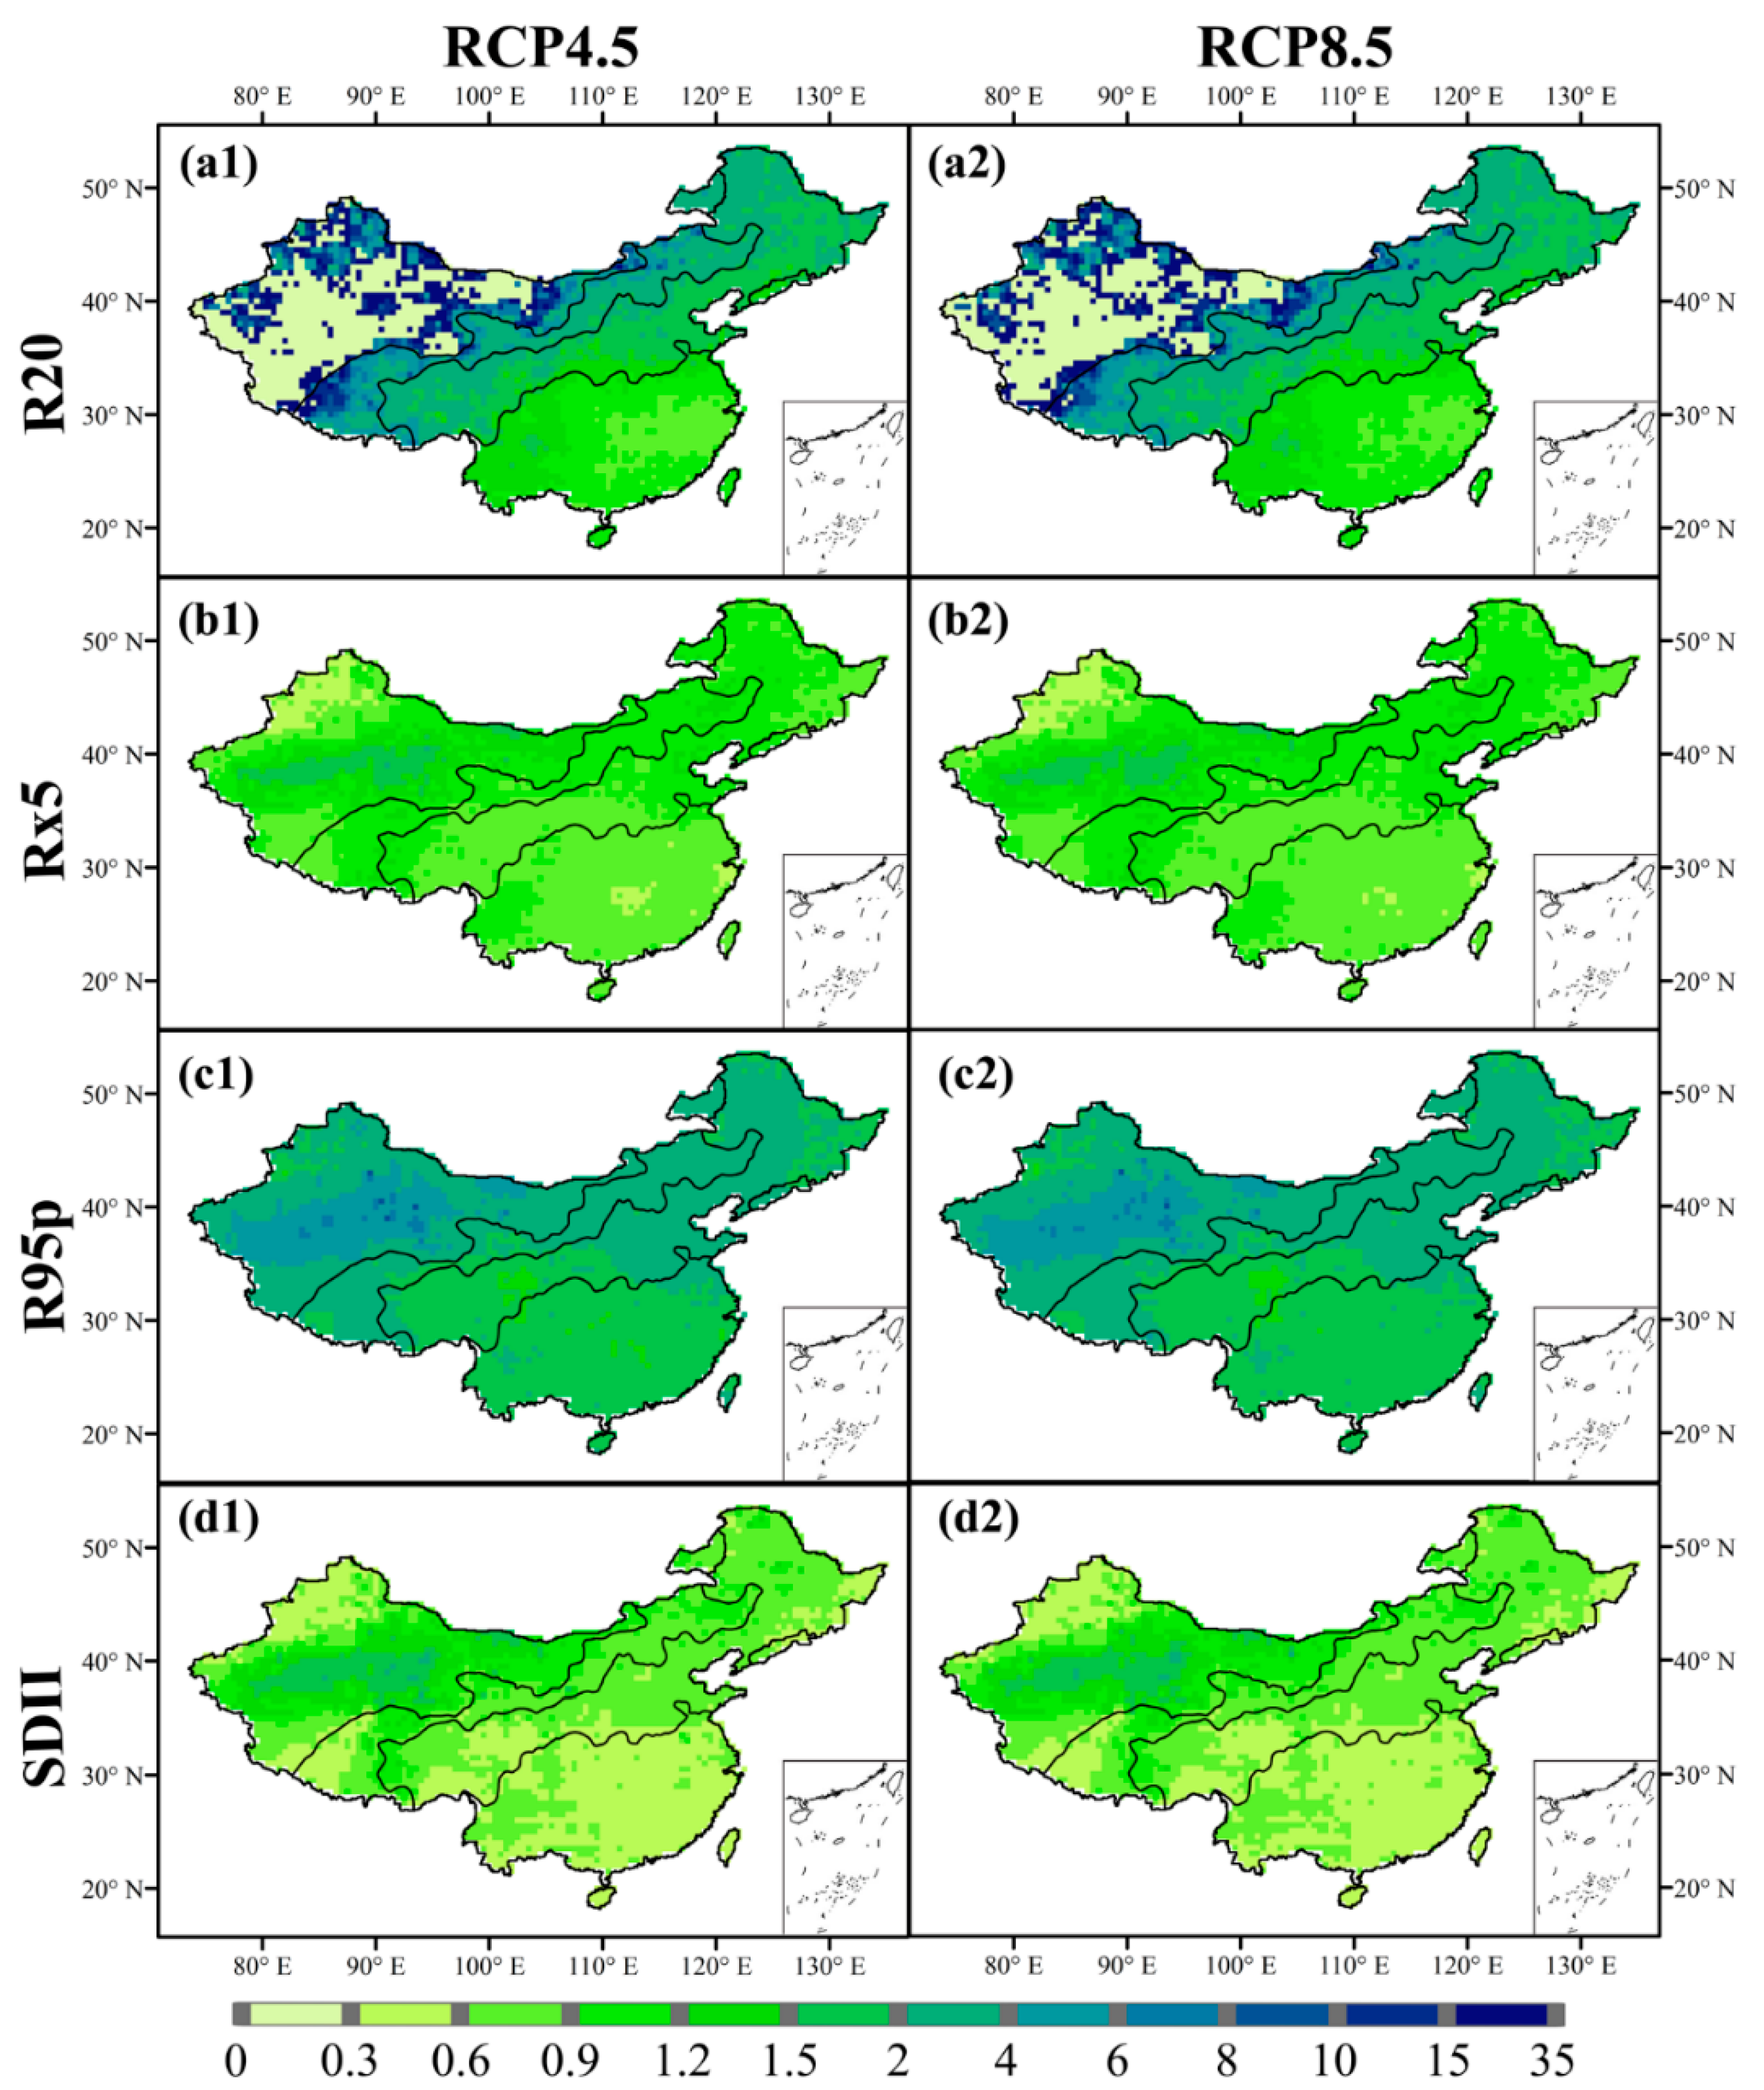
3.3. Changing Trend of Precipitation Indices in the Future

In order to investigate future characteristics and the differences between RCP4.5 and RCP8.5 scenarios, we compared differences in the spatial distribution of precipitation indices (Figure 8) and temporal differences in precipitation index anomalies (Figure 9) between these two scenarios. Future projected extreme precipitation mainly occurs in humid regions, and the frequency, amount and intensity of extreme precipitation gradually decrease from humid regions to arid regions. In the arid region, the R20 values are mostly zero, Rx5 ranges from 0 to 5 mm/month, R95p is in the range of 0–5 mm/month and SDII is mainly 1–2 mm/d. The characteristics of extreme precipitation frequency, amount and intensity are the strongest in humid regions. In humid regions, R20 ranges from 0.9 to 3.5 d/month, and Rx5 values are almost 50–90 mm/month, which is 10–18 times higher than in the arid region; R95p values are larger in the central and southeastern areas of humid regions, reaching 35–90 mm/month, which is 7–18 times higher than in the arid region, and SDII values range from 7 to 15 mm/d, which is also high compared with the results in the arid region. In the semi-humid region, the results of the four precipitation indices (R20, Rx5, R95p, SDII) are 0.2 d/month, 10 mm/month, 5 mm/month and 1 mm/month higher than those in the semi-arid region, respectively. Comparing the spatial results between the RCP4.5 and RCP8.5 scenarios, the percentage differences ((PRCP8.5 − PRCP4.5)/PRCP4.5 × 100%, where PRCP4.5 and PRCP8.5 are precipitation index values under RCP4.5 and RCP8.5 scenarios, respectively) in the four indices in the two scenarios are between −30% and 30%. Not only in the entire humid region, but also in the central and northern regions of the arid region, the extreme precipitation results under the RCP8.5 scenario are smaller than those under the RCP4.5 scenario, and the most significant differences between the two scenarios are in the R20 index, which is −2% to −30%. In RCP8.5 scenario, the values of the Rx5 and R95p indices are 0 to −10% lower than those in RCP4.5, and SDII indices are 0 to −5% lower. In other regions, the results of the four precipitation indices in the RCP8.5 scenario are 2–10% higher than those in RCP4.5. Future projected extreme precipitation in CMIP5 is strong in the humid zone. In addition, extreme precipitation in the RCP8.5 scenario is weak in the humid zone.
In order to analyze the temporal and spatial differences between RCP4.5 and RCP8.5, we calculated the differences in the four precipitation index anomalies under the two scenarios. The differences in R20, Rx5 and R95p index anomalies between these two scenarios (RCP8.5 minus RCP4.5) reveal noteworthy characteristics of extreme precipitation in summer in semi-arid and semi-humid areas. In addition, at the end of spring and in early autumn, differences between these two scenarios are prominent in the semi-humid area. The extreme precipitation anomaly differences fluctuate greatly over the month in humid areas, with no seasonal differences. In arid regions, the scenario differences in seasonal characteristics are not remarkable, and there are slight differences in the Rx5 and R95p index anomalies between the two scenarios in summer between 2045 and 2071. Differences in SDII index anomalies between the two scenarios have no notable seasonal characteristics, but the difference in the humid area is larger than that in the other three areas. Overall, differences in extreme precipitation characteristics of R20, Rx5 and R95p in summer between the two scenarios are most evident in semi-arid and semi-humid areas. Compared with the other three regions, differences in extreme precipitation between the two scenarios are the largest in the humid region.
The Mann–Kendall (M–K) test was used to detect the future trends of extreme precipitation characteristics in different regions. The changing trend of each grid in 2006–2099 was calculated by adopting the M–K method. We calculated the area proportions with increasing and decreasing trends (at the 95% significance level) of extreme precipitation in each region (Table 3). For the R20 index, the area proportions of the four regions with projected changes are small and do not reach 5% in any region. Under the RCP4.5 scenario, the most prominent changes are in the proportion of arid areas with increases in the Rx5 index and the proportion of sub-humid areas with increases in the SDII index, with both areas exceeding 10%. Under the RCP8.5 scenario, relatively large area proportions of arid, semi-arid and semi-humid regions have increasing trends of Rx5 and SDII indices. The areas with increasing trends of Rx5 and SDII are more than 12% and 17%, respectively, while those with decreasing trends of Rx5 and SDII are relatively small. This indicates that the area projected to have an increasing trend is larger under the RCP8.5 scenario than under the RCP4.5 scenario, whereas the area predicted to have a decreasing trend is slightly larger under the RCP4.5 scenario. The area proportion with an increasing trend is larger, while that with a decreasing trend is smaller, which does not exceed 10% in either scenario. Therefore, in the future, the Rx5 and SDII index features will change in a relatively large area, which is greater in RCP8.5 than in RCP4.5, while the decreasing trends have the opposite pattern. In the RCP8.5 scenario, the area of the four regions with an increasing trend of extreme precipitation is larger than that under the RCP4.5 scenario, while the area with a decreasing trend is smaller than that under RCP4.5.
Difference coefficients were used to evaluate the uncertainty of future extreme precipitation projections of the climate model in the four regions of China (Figure 10). The uncertainties in the Rx5, R95p and SDII indices in the climate model are low for China, overall. The uncertainties of Rx5 and SDII indices are the lowest, and the difference coefficients are generally between 0 and 1.5. The uncertainty of R95p is larger than that of Rx5 and SDII, and the difference coefficients are generally less than 6. For the R20 index, there is a small area in the arid region with larger difference coefficients, which range from 15 to 35. However, the uncertainty of the R20 index predicted by the climate model in other regions is relatively normal, and the difference coefficients remain between 0 and 4. The uncertainties of the projected extreme precipitation in China under the RCP4.5 and RCP8.5 scenarios are similar, and there is no notable spatial difference. In terms of spatial distribution, the uncertainty of the extreme precipitation projection gradually decreases from arid to humid regions in both scenarios. The difference coefficients between semi-humid and semi-arid regions in the east are larger than those in the west. In summary, except for a small part of the arid area with a relatively large difference coefficient for the R20 index, the climate model has low uncertainty in the estimation of the precipitation index in China.

4. Conclusions and Discussion

We evaluated the performance of precipitation indices using CMIP5 data in China and compared the differences in extreme precipitation characteristics between four different zones in different seasons. Finally, we analyzed the uncertainty of the MME in simulating four precipitation indices (R20, Rx5, R95p and SDII) under two future scenarios and predicted the future trends of extreme precipitation characteristics over four climate regions.
Based on meteorological observations, the accuracy of the CMIP5 precipitation data in simulating extreme precipitation in China was verified. The results show that the simulation effect is the best in the semi-arid and semi-humid areas of China. Different precipitation indices and regional factors were assessed, and the evaluation results of single models were compared with the those of the ensemble model. The results show that the ensemble model was more effective in simulating extreme precipitation in China. The ensemble mean of eight CMIP5 models has a robust ability to simulate historical precipitation and satisfactorily captures extreme precipitation characteristics in China.
Changes in extreme precipitation characteristics of the four regions reveal that, under influence of climatic conditions, these regions have precipitation characteristics of different intensities. Extreme precipitation is the most prominent in humid areas. In terms of seasonal characteristics, the extreme precipitation from 1961 to 2005 occurred mainly in the summer. The extreme precipitation results predicted for the future period are consistent with those in the historical period.
Two scenarios from CMIP5 (RCP4.5 and RCP8.5) were compared. There are marked spatiotemporal differences in the projections of extreme precipitation between the RCP4.5 and RCP8.5 scenarios. The predicted precipitation index in humid regions is smaller under RCP8.5 than that under RCP4.5, with R20 having the most noteworthy value (−2% to −30%). Differences in the extreme precipitation amount in summer between the two scenarios are most evident in semi-arid and semi-humid areas. Furthermore, the selected climate models have low uncertainty in their projections of extreme precipitation.
Based on CMIP5 analysis of extreme precipitation in arid, semi-arid, semi-humid and humid regions of China, the increasing trend of extreme precipitation in the future is still relatively pronounced, especially in humid areas, suggesting that the flood risk should be strictly monitored in these areas. Regional differences in extreme rainfall are notable in summer. Conclusions about such regional differences can guide reasonable flood control decisions for different climatic regions in China.
Global climate models are the main means of estimating global and regional climate change. The global climate models (GCMs) from the Couple Model Intercomparison Project Phase 5 (CMIP5) have become the mainstay of many climate change studies, as they can predict future climate-driven change trends of meteorological variables [38]. In comparison with the previous model generation (CMIP3), CMIP5 includes more comprehensive climate models with higher spatial resolution. CMIP6 data have also been published, but, considering the good simulation effect of CMIP5 after downscaling and correction by the EDCDF method, CMIP5 data were still adopted. With CMIP5 models, the research community can solve a wide variety of scientific problems, including the important task of exploring extreme climate and weather events, and many achievements have been made in this research area [39,40,41]. The CMIP5 model is driven by climate, so it is very important to establish climatic zones in the research area. Numerous studies on precipitation in China have been performed based on geographical location or watershed zoning [22,42,43]. Therefore, according to the precipitation characteristics in China, four climatic zones were established for the comparison and projection of extreme precipitation. The results show that the humid area of China is characterized by extreme precipitation in summer. Summer precipitation in eastern China is closely related to the western North Pacific subtropical high (WNPSH). These results also show that the westward extension of the WNPSH increases the occurrence of extreme precipitation in South China, which is consistent with the presented results. For precipitation research, there are many ways to define extreme precipitation. Many studies have applied percentile-based thresholds to define precipitation degrees [44]. A series of precipitation indices in ETCCDI were adopted to represent the characteristics of extreme precipitation. The set of climate indices provides a comprehensive overview of precipitation statistics, with a particular focus on extreme aspects [45], and it can more comprehensively reflect the frequency, intensity and amount of extreme precipitation. Furthermore, we selected representative precipitation indices (R20, Rx5, SDII and R95p) to analyze extreme precipitation characteristics in China.
This study mainly focuses on the spatiotemporal characteristics of extreme precipitation in China through four indicators. Subsequent work is required to investigate factors that drive changes in extreme precipitation characteristics in China, such as the Pacific Decadal Oscillation, Atlantic Multi-decadal Oscillation, etc. [46]. In the future, the results will be updated with CMIP6 data to compare differences in the performance of CMIP5 and CMIP6 in simulating extreme precipitation in the future, and the reliability of the data will be verified by including multi-source data such as satellite precipitation. This research will provide a better understanding of the relationship between climate change and extreme precipitation events in different climatic regions of China.

Author Contributions

Conceptualization, M.Z. and X.Y.; methodology, L.R. and M.P.; software, F.Y.; validation, M.P. and M.Z.; analysis, M.Z.; investigation, L.R.; resources, X.Y.; data curation, M.Z. and X.Y.; writing—original draft preparation, X.Y. and M.Z.; writing—review and editing, M.Z.; visualization, S.J. and Y.L.; supervision, X.Y.; project administration, L.R.; funding acquisition, L.R., X.Y. and X.F.; All authors have read and agreed to the published version of the manuscript.

Funding

This research was funded by the National Science Foundation of China (Grant 52079036) and the National Science Foundation of China (Grant 42071040).

Institutional Review Board Statement

Not applicable.

Informed Consent Statement

Not applicable.

Data Availability Statement

The data that support the findings of this study are available from CMIP5 climate modeling groups (https://esgf-node.llnl.gov/projects/cmip5/, accessed date: 12 August 2019) and the National Meteorological Information Center, China Meteorological Administration (http://data.cma.cn/, accessed date: 15 October 2019).

Acknowledgments

We express our gratitude to Ming Pan (Department of Civil and Environmental Engineering, Princeton University) for helpful discussions, and we thank Xiaogang He (Department of Civil and Environmental Engineering, National University of Singapore) for helpful advice. The authors acknowledge the support of the National Key Research and Development Program and the National Science Foundation of China.

Conflicts of Interest

The authors declare no conflict of interest.

References

  1. Kunkel, K.E.; Pielke, R.A.; Changnon, S.A. Temporal fluctuations in weather and climate extremes that cause economic and human health impacts: A review. Bull. Am. Meteorol. Soc. 1999, 80, 1077–1098. [Google Scholar] [CrossRef] [Green Version]
  2. Easterling, D.R.; Evans, J.L.; Groisman, P.Y.; Karl, T.R.; Kunkel, K.E.; Ambenje, P. Observed variability and trends in extreme climate events: A brief review. Bull. Am. Meteorol. Soc. 2000, 81, 417–426. [Google Scholar] [CrossRef] [Green Version]
  3. Meehl, G.A.; Karl, T.; Easterling, D.R.; Changnon, S.; Pielke, R.; Changnon, D.; Evans, J.; Groisman, P.Y.; Knutson, T.R.; Kunkel, K.E.; et al. An Introduction to Trends in Extreme Weather and Climate Events: Observations, Socioeconomic Impacts, Terrestrial Ecological Impacts, and Model Projections. Bull. Am. Meteorol. Soc. 2000, 108, 46–51. [Google Scholar] [CrossRef] [Green Version]
  4. IPCC. Climate Change 2014: Synthesis Report. Contribution of Working Groups I, II and III to the Fifth Assessment Report of the Intergovernmental Panel on Climate Change; IPCC: Geneva, Switzerland, 2014; ISBN 9789291691432. [Google Scholar]
  5. Alexander, L.V. Global observed long-term changes in temperature and precipitation extremes: A review of progress and limitations in IPCC assessments and beyond. Weather Clim. Extrem. 2016, 11, 4–16. [Google Scholar] [CrossRef] [Green Version]
  6. Zhan, W.; He, X.; Sheffield, J.; Wood, E.F. Projected Seasonal Changes in Large-Scale Global Precipitation and Temperature Extremes Based on the CMIP5 Ensemble. J. Clim. 2020, 33. [Google Scholar] [CrossRef] [Green Version]
  7. Dong, X.; Zhang, S.; Zhou, J.; Cao, J.; Jiao, L.; Zhang, Z.; Liu, Y. Magnitude and frequency of temperature and precipitation extremes and the associated atmospheric circulation patterns in the Yellow River Basin (1960–2017), China. Water 2019, 11, 2334. [Google Scholar] [CrossRef] [Green Version]
  8. Tan, M.L.; Samat, N.; Chan, N.W.; Lee, A.J.; Li, C. Analysis of precipitation and temperature extremes over the Muda River Basin, Malaysia. Water 2019, 11, 283. [Google Scholar] [CrossRef] [Green Version]
  9. Allen, M.R.; Ingram, W.J. Constraints on future changes in climate and the hydrologic cycle. Nature 2002, 419, 224–232. [Google Scholar] [CrossRef] [PubMed]
  10. Zhai, P.; Eskridge, R.E. Atmospheric water vapor over China. J. Clim. 1997, 10, 2643–2652. [Google Scholar] [CrossRef]
  11. Pfahl, S.; O’Gorman, P.A.; Fischer, E.M. Understanding the regional pattern of projected future changes in extreme precipitation. Nat. Clim. Chang. 2017, 7. [Google Scholar] [CrossRef]
  12. Liu, C.; Allan, R.P. Observed and simulated precipitation responses in wet and dry regions 1850–2100. Environ. Res. Lett. 2013, 8. [Google Scholar] [CrossRef]
  13. Chou, C.; Chiang, J.C.H.; Lan, C.W.; Chung, C.H.; Liao, Y.C.; Lee, C.J. Increase in the range between wet and dry season precipitation. Nat. Geosci. 2013, 6, 263–267. [Google Scholar] [CrossRef]
  14. Hawcroft, M.; Walsh, E.; Hodges, K.; Zappa, G. Significantly increased extreme precipitation expected in Europe and North America from extratropical cyclones. Environ. Res. Lett. 2018, 13. [Google Scholar] [CrossRef]
  15. Bao, J.; Sherwood, S.C.; Alexander, L.V.; Evans, J.P. Future increases in extreme precipitation exceed observed scaling rates. Nat. Clim. Chang. 2017, 7, 128–132. [Google Scholar] [CrossRef]
  16. Hatsuzuka, D.; Sato, T. Future changes in monthly extreme precipitation in Japan using large-ensemble regional climate simulations. J. Hydrometeorol. 2019, 20, 563–574. [Google Scholar] [CrossRef]
  17. Wu, X.; Guo, S.; Yin, J.; Yang, G.; Zhong, Y.; Liu, D. On the event-based extreme precipitation across China: Time distribution patterns, trends, and return levels. J. Hydrol. 2018, 562, 305–317. [Google Scholar] [CrossRef]
  18. Sun, Q.; Miao, C.; Duan, Q. Changes in the spatial heterogeneity and annual distribution of observed precipitation across China. J. Clim. 2017. [Google Scholar] [CrossRef]
  19. Tong, S.; Berry, H.L.; Ebi, K.; Bambrick, H.; Hu, W.; Green, D.; Hanna, E.; Wang, Z.; Butler, C.D. Climate change, food, water and population health in China. Bull. World Health Organ. 2016, 94, 759–765. [Google Scholar] [CrossRef] [PubMed]
  20. Li, X.; Hu, Q. Spatiotemporal Changes in Extreme Precipitation and Its Dependence on Topography over the Poyang Lake Basin, China. Adv. Meteorol. 2019, 2019, 1–15. [Google Scholar] [CrossRef] [Green Version]
  21. She, D.; Shao, Q.; Xia, J.; Taylor, J.A.; Zhang, Y.; Zhang, L.; Zhang, X.; Zou, L. Investigating the variation and non-stationarity in precipitation extremes based on the concept of event-based extreme precipitation. J. Hydrol. 2015, 530, 785–798. [Google Scholar] [CrossRef]
  22. Guo, X.; Wu, Z.; He, H.; Du, H.; Wang, L.; Yang, Y.; Zhao, W. Variations in the start, end, and length of extreme precipitation period across China. Int. J. Climatol. 2018. [Google Scholar] [CrossRef]
  23. Jiang, P.; Yu, Z.; Yuan, F.; Acharya, K. The multi-scale temporal variability of extreme precipitation in the source region of the Yellow River. Water 2019, 11, 92. [Google Scholar] [CrossRef] [Green Version]
  24. Shi, J.; Cui, L.; Wen, K.; Tian, Z.; Wei, P.; Zhang, B. Trends in the consecutive days of temperature and precipitation extremes in China during 1961–2015. Environ. Res. 2018, 161, 381–391. [Google Scholar] [CrossRef] [PubMed]
  25. Yang, X.; Wood, E.F.; Sheffield, J.; Ren, L.; Zhang, M.; Wang, Y. Bias correction of historical and future simulations of precipitation and temperature for China from CMIP5 models. J. Hydrometeorol. 2018, 19. [Google Scholar] [CrossRef]
  26. Kirkland, E.J. Advanced Computing in Electron Microscopy, 2nd ed.; Springer: New York, NY, USA, 2010; ISBN 978-1-4419-6532-5. [Google Scholar]
  27. Yang, X.; Zhang, L.; Wang, Y.; Singh, V.P.; Xu, C.Y.; Ren, L.; Zhang, M.; Liu, Y.; Jiang, S.; Yuan, F. Spatial and temporal characterization of drought events in China using the severity-area-duration method. Water 2020, 12, 230. [Google Scholar] [CrossRef] [Green Version]
  28. Gao, Y.; Xiao, L.; Chen, D.; Xu, J.; Zhang, H. Comparison between past and future extreme precipitations simulated by global and regional climate models over the tibetan plateau. Int. J. Climatol. 2018, 38. [Google Scholar] [CrossRef]
  29. Li, H.; Sheffield, J.; Wood, E.F. Bias correction of monthly precipitation and temperature fields from Intergovernmental Panel on Climate Change AR4 models using equidistant quantile matching. J. Geophys. Res. Atmos. 2010, 115. [Google Scholar] [CrossRef]
  30. Aloysius, N.R.; Sheffield, J.; Saiers, J.E.; Li, H.; Wood, E.F. Journal of Geophysical Research: Atmospheres Africa from CMIP5 climate models. J. Geophys. Res. Atmos. 2016, 121, 130–152. [Google Scholar] [CrossRef] [Green Version]
  31. Yang, X.; Yu, X.; Wang, Y.; Liu, Y.; Zhang, M.; Ren, L.; Yuan, F.; Jiang, S. Estimating the response of hydrological regimes to future projections of precipitation and temperature over the upper Yangtze River. Atmos. Res. 2019, 230, 104627. [Google Scholar] [CrossRef]
  32. Gupta, H.V.; Kling, H.; Yilmaz, K.K.; Martinez, G.F. Decomposition of the mean squared error and NSE performance criteria: Implications for improving hydrological modelling. J. Hydrol. 2009, 377, 80–91. [Google Scholar] [CrossRef] [Green Version]
  33. Kling, H.; Fuchs, M.; Paulin, M. Runoff conditions in the upper Danube basin under an ensemble of climate change scenarios. J. Hydrol. 2012, 424, 264–277. [Google Scholar] [CrossRef]
  34. Jiang, Z.; Li, W.; Xu, J.; Li, L. Extreme precipitation indices over China in CMIP5 models. Part I: Model evaluation. J. Clim. 2015. [Google Scholar] [CrossRef]
  35. Jiang, Z.; Song, J.; Li, L.; Chen, W.; Wang, Z.; Wang, J. Extreme climate events in China: IPCC-AR4 model evaluation and projection. Clim. Chang. 2012, 110, 385–401. [Google Scholar] [CrossRef]
  36. Jones, P.D.; Hulme, M. Calculating regional climatic time series for temperature and precipitation: Methods and illustrations. Int. J. Climatol. 1996, 16, 361–377. [Google Scholar] [CrossRef]
  37. Allan, R.P.; Soden, B.J. Atmospheric warming and the amplification of precipitation extremes. Science 2008, 321, 1481–1484. [Google Scholar] [CrossRef] [Green Version]
  38. Nazari-Sharabian, M.; Taheriyoun, M.; Ahmad, S.; Karakouzian, M.; Ahmadi, A. Water Quality Modeling of Mahabad Dam Watershed–Reservoir System under Climate Change Conditions, using SWAT and System Dynamics. Water 2019, 11, 394. [Google Scholar] [CrossRef] [Green Version]
  39. Janssen, E.; Sriver, R.L.; Wuebbles, D.J.; Kunkel, K.E. Seasonal and regional variations in extreme precipitation event frequency using CMIP5. Geophys. Res. Lett. 2016, 43, 5385–5393. [Google Scholar] [CrossRef] [Green Version]
  40. Mukherjee, S.; Aadhar, S.; Stone, D.; Mishra, V. Increase in extreme precipitation events under anthropogenic warming in India. Weather Clim. Extrem. 2018. [Google Scholar] [CrossRef]
  41. Bador, M.; Donat, M.G.; Geoffroy, O.; Alexander, L.V. Assessing the robustness of future extreme precipitation intensification in the CMIP5 ensemble. J. Clim. 2018. [Google Scholar] [CrossRef]
  42. Li, J.; Zhang, Q.; Chen, Y.D.; Singh, V.P. Future joint probability behaviors of precipitation extremes across China: Spatiotemporal patterns and implications for flood and drought hazards. Glob. Planet. Chang. 2015, 124, 107–122. [Google Scholar] [CrossRef] [Green Version]
  43. Zhang, Q.; Xiao, M.; Singh, V.P.; Chen, Y.D. Max-stable based evaluation of impacts of climate indices on extreme precipitation processes across the Poyang Lake basin, China. Glob. Planet. Chang. 2014, 122, 271–281. [Google Scholar] [CrossRef]
  44. Zhang, Q.; Zheng, Y.; Singh, V.P.; Luo, M.; Xie, Z. Summer extreme precipitation in eastern China: Mechanisms and impacts. J. Geophys. Res. 2017, 122. [Google Scholar] [CrossRef]
  45. Karl, T.R.; Easterling, D.R. Climate extremes: Selected review and future research directions. Clim. Chang. 1999, 42, 309–325. [Google Scholar] [CrossRef]
  46. Ding, Y.; Sun, Y.; Wang, Z.; Zhu, Y.; Song, Y. Inter-decadal variation of the summer precipitation in China and its association with decreasing Asian summer monsoon Part II: Possible causes. Int. J. Climatol. 2009, 29. [Google Scholar] [CrossRef]
Figure 1. Map showing the distribution of four climate regions based on the annual mean precipitation (1961–2005) over China.
Water 13 01509 g001
Figure 2. Scatter plots of model performance showing the Kling–Gupta efficiency (KGE) values for the 11 simulated precipitation indices in four regions. The results are from CMIP5 models and the multi-model ensemble mean (ensemble mean model is shown by solid circles, and single models are shown by hollow circles) in 1961–2005.
Water 13 01509 g002
Figure 3. Comprehensive model ranks of 8 CMIP5 models and multi-model mean ensemble for simulating precipitation indices.
Water 13 01509 g003
Figure 4. Cumulative probability distribution of extreme values of four precipitation indices (R20, Rx5, SDII and R95p) in four regions based on multi-model ensemble mean (MME) and observation data.
Water 13 01509 g004
Figure 5. Monthly precipitation indices ((a) R20: d/month; (b) Rx5: mm/month; (c) R95p: mm/month; (d) SDII: mm/d) of four regions (arid, semi-arid, semi-humid, humid) in China and bias between multi-model ensemble means and observations ((MME–OBS)/OBS; unit: %) in 1961–2005.
Water 13 01509 g005
Figure 6. The temporal evolution trend of four precipitation index anomalies in 1961–2005. (R20: d/month; Rx5: mm/month; R95p: mm/month; SDII: mm/d).
Water 13 01509 g006
Figure 7. Spatial distribution of the annual mean anomaly percentages (positive percentage: (a1a4); negative percentage: (b1b4) and annual mean values (c1–c4) of four precipitation indices in JJA.
Water 13 01509 g007
Figure 8. Spatial distribution of multi-year mean monthly precipitation indices and percentage differences between RCP4.5 and RCP8.5 scenarios in 2006–2099. (The calculation formula of percentage difference is (PRCP8.5 − PRCP4.5)/PRCP4.5 × 100%, where PRCP4.5 and PRCP8.5 are precipitation index values under RCP4.5 and RCP8.5 scenarios, respectively.).
Water 13 01509 g008
Figure 9. The difference in precipitation index anomalies between RCP4.5 and RCP8.5 scenarios (RCP8.5 minus RCP4.5) in 2006–2099.
Water 13 01509 g009
Figure 10. Extreme precipitation difference coefficients (C) in four regions under two scenarios (RCP4.5 and RCP8.5) in 2006–2099. There are four precipitation indices. R20 index: (a1,2); Rx5 index: (b1,2); R95p index: (c1,2); SDII index: (d1,2)).
Water 13 01509 g010
Table 1. Information on the 8 general circulation models.
Model NameInstituteCountryResolution
(lon × lat)
BCC-CSM1–1Beijing Climate CenterChina2.8° × 2.8°
CanESM2Canadian Center for Climate Modelling and AnalysisCanada2.8° × 2.8°
CCSM4National Center for Atmospheric ResearchUnited States1.25° × 0.9°
CSIRO-MK3–6-0Commonwealth Scientific and Industrial Research OrganizationAustralia1.8° × 1.8°
GISS-E2-RNASA Goddard Institute for Space StudiesUnited States2.5° × 2.0°
MPI-ESM-LRMax Planck Institute for MeteorologyGermany1.9° × 1.9°
MRI-CGCM3Meteorological Research InstituteJapan1.1° × 1.1°
NorESM1-MNorwegian Climate CenterNorway2.5° × 1.9°
Table 2. List of 11 precipitation indices of the Expert Team on Climate Change Detection and Indices (ETCCDI).
IndexDescriptive NameUnitsDefinition
CDDConsecutive dry daysd/monthCount the largest number of consecutive days for Pij < 1 mm per month, where Pij is the daily precipitation amount on day i in period j.
CWDConsecutive wet daysd/monthCount the largest number of consecutive days for Pij > 1 mm per month, where Pij is the daily precipitation amount on day i in period j.
R1Number of wet daysd/monthCount the number of days for Pij > 1 mm per month, where Pij is the daily precipitation amount on day i in period j.
R10Heavy precipitation daysd/monthCount the number of days for Pij > 10 mm per month, where Pij is the daily precipitation amount on day i in period j.
R20Very heavy precipitation daysd/monthCount the number of days for Pij > 20 mm per month, where Pij is the daily precipitation amount on day i in period j.
Rx1Maximum 1-day precipitationmm/monthThe maximum daily precipitation amount of 1 day per month: Rx1j = max (Pij), where Pij is the daily precipitation amount on day i in period j.
Rx5Maximum consecutive 5-day precipitationmm/monthThe maximum daily precipitation amount of 5 consecutive days per month: Rx5j = max (Pkj), where Pkj is the precipitation amount of 5 consecutive days ending with the day k in period j.
R95pVery wet daysmm/monthThe sum of all daily precipitation over the 95th percentile of precipitation on wet days (Pij ≥ 1 mm) in period j.
R99pExtremely wet daysmm/monthThe sum of all daily precipitation over the 99th percentile of precipitation on wet days (Pij ≥ 1 mm) in period j.
PTOTTotal wet day precipitationmm/monthThe total precipitation amount of daily precipitation on wet days (Pij ≥ 1 mm) per month.
SDIISimple daily intensitymm/dSDIIj = ( w = 1 D P w j )/D, where Pwj is the daily precipitation amount on wet days, Pwj ≥ 1 mm, and D is the number of wet days in period j.
Table 3. The area proportions (%) of the four regions with statistically significant trends (at the 95% significance level) of four precipitation indictors in 2006–2099.
RCP45RCP85
IncreaseDecreaseIncreaseDecrease
R20arid0.17 0.34 0.17 0.17
semi-arid0.17 2.86 0.00 2.02
semi-humid2.09 0.45 3.37 0.18
humid0.21 0.00 0.73 0.00
Rx5arid14.94 2.03 23.21 1.27
semi-arid1.01 8.74 12.10 4.54
semi-humid7.19 2.37 18.29 1.00
humid1.15 0.00 1.77 0.00
R95parid3.12 1.35 4.73 1.01
semi-arid0.34 5.71 2.02 2.86
semi-humid2.46 0.82 3.82 0.18
humid0.31 0.00 0.21 0.00
SDIIarid9.62 2.78 18.90 1.52
semi-arid1.51 9.41 17.48 5.04
semi-humid10.56 2.09 31.30 0.82
humid1.15 0.00 3.13 0.00
Publisher’s Note: MDPI stays neutral with regard to jurisdictional claims in published maps and institutional affiliations.

