Article

Iron Oxide (Fe3O4)-Supported SiO2 Magnetic Nanocomposites for Efficient Adsorption of Fluoride from Drinking Water: Synthesis, Characterization, and Adsorption Isotherm Analysis

1
Department of Environmental Sciences, COMSATS University Islamabad, Abbottabad Campus, Khyber Pakhtunkhwa 22060, Pakistan
2
Department of Landscape and Architecture, School of Design, Shanghai Jiao Tong University, Shanghai 200240, China
3
Department of Chemistry, COMSATS University Islamabad, Abbottabad Campus, Khyber Pakhtunkhwa 22060, Pakistan
4
Botany and Microbiology Department, College of Science, King Saud University, Riyadh 11451, Saudi Arabia
5
Mycology and Plant Disease Survey Department, Plant Pathology Research Institute, ARC, Giza 12511, Egypt
6
Plant Production Department, College of Food and Agricultural Sciences, King Saud University, Riyadh 11451, Saudi Arabia
*
Authors to whom correspondence should be addressed.
First two authors equally contributed in the manuscript.
Water 2021, 13(11), 1514; https://doi.org/10.3390/w13111514
Submission received: 19 March 2021 / Revised: 15 April 2021 / Accepted: 20 April 2021 / Published: 27 May 2021
(This article belongs to the Section Wastewater Treatment and Reuse)

Abstract

:
This research work reports the magnetic adsorption of fluoride from drinking water through silica-coated Fe3O4 nanoparticles. Chemical precipitation and wet impregnation methods were employed to synthesize the magnetic nanomaterials. Moreover, the synthesized nanomaterials were characterized for physicochemical properties through scanning electron microscopy, Fourier-transform infrared spectroscopy, and X-ray powder diffraction. Screening studies were conducted to select the best iron oxide loading (0.0–1.5 wt%) and calcination temperature (300–500 °C). The best selected nanomaterial (0.5Fe-Si-500) showed a homogenous FeO distribution with a 23.79 nm crystallite size. Moreover, the optimized reaction parameters were: 10 min of contact time, 0.03 g L1 adsorbent dose, and 10 mg L−1 fluoride (F) concentration. Adsorption data were fitted to the Langmuir and Freundlich isotherm models. The Qm and KF (the maximum adsorption capacities) values were 5.5991 mg g−1 and 1.869 L g1 respectively. Furthermore, accelerated adsorption with shorter contact times and high adsorption capacity at working pH was among the outcomes of this research work.

1. Introduction

The occurrence of fluoride (F) in water bodies is due to the combination of natural processes and anthropogenic activities [1]. The sources of F in water bodies include the natural weathering of fluorine minerals (fluorapatite and fluorite) and industrial activities such as mineral processing and glass production [2,3], as well as the use of phosphate fertilizers, aluminum and zinc smelters and coal mining products [4] refrigerants (freon), ceramics, Teflon™ cookware, and aerosol propellants [3,5]. The average fluorine concentration in the Earth’s crust has been reported to be around 0.05–0.1% (500–1000 mg per kg). Fluorine concentrations in igneous, sedimentary, and metamorphic rocks vary from hundreds to thousands of milligrams per kilogram of water [6]. The chemical properties of groundwater, especially with regard to the concentrations of F, are significantly affected as a result of contact with sedimentary carbonates [7]. Around 35 countries worldwide are facing the problem of fluoride contamination; amongst these, India, China, and some parts of Africa are badly affected [8,9].
High F concentrations (>1.5 mg L−1) have great effects on human health [10,11]. The excessive intake of F may result in fluorosis [12] and neurotransmitter and fetal cerebral dysfunction [1]. It may also result in crippling skeletal deformation, as well as pitting, staining, and loss of tooth enamel [13,14]. F was found to be effective for human health only when concentrations were within the permissible limit of 1.5 mg L−1 [3,5,15,16,17]. The intake of F in human body from drinking water at the level of 1.0 mg L−1 was found to be effective for bone development and prevent dental caries [18]. Different F concentrations and their health effects have been discussed previously [3]. The pathways through which F enters into human body are either through dermal contact or ingestion of food (vegetables, tea, etc.) and drinking water [19]. High F concentrations in the body mostly occur due to intake of drinking water. In food, the concentration of F is due to water [20].
The defluoridation of drinking water is a great challenge worldwide. The presence of fluoride (F) in drinking water is an important worldwide environmental issue due to its adverse and toxic effects [18,21]. The Earth´s crust contains 0.06–0.09% fluorides. F is a member of halogen family, can only found in the form of inorganic and organic compounds known as F, and does not exist in an elemental form due to its specific characteristics, which include reactivity and electronegativity [4,5,22]. Various defluoridation techniques have been studied, including coagulation/precipitation (where alum and lime are used as coagulants in the Nalgonda technique), ion-exchange processes (using zeolite greensand, inorganic metallic oxides, and resins), membrane processes (reverse osmosis, nanofiltration, electrodialysis), and adsorption processes [5,23]. Adsorption processes are effective methods for the remediation of fluoride from drinking water. These methods have shown significant results, as shown by many recent studies [5,24,25]. The adsorption method has gained great attention because of its simple design, easy operation, flexibility, cost-effectiveness, and environmentally friendly characteristics [24].
Various adsorbents have been studied for the defluoridation of drinking water, including activated carbons, ores, and natural materials (clays, kaolinite, bentonite, lignite, mud, fly ash, alumina, chitosan etc.). Biosorbents (coconut shell, neem leaves, spirulina algae, blackberry, guava leaf, neem bark, and rice husk) are other examples [18]. Recently, nanoparticles (NPs) have gained increased attention due to their high surface-to-volume ratio [26]. NPs have become a part of modern life. NPs have been used in various industrial processes and commercial products such as cosmetics, coatings, construction, and environmental remediation [27,28]. These NPs can be used as adsorbents for contact with metallic species [29] since they provide substantial binding sites for interaction [30]. Magnetic NP adsorbents are efficacious in the treatment of both drinking water and wastewater due to their low cost, simplicity of use, small size, high surface-to-volume ratio, and environmental friendliness [31]. The use of such nanomaterials, combined with nanotechnology and magnetic separation methods, may result in an effective water pollution remediation technology [32].
In addition to their use in water treatment systems, they are also used in various fields for mineral separation and in magnetic storage devices and magnetic cooling systems (in refrigeration) [30,33]. Various NP-based treatment technologies have been reported for the adsorption of Fˉ, with a special focus on the type of nanomaterial and their behaviors at reported working pH for Fˉ removal [5,24].
The focus of this research was to defluoridate drinking water using silica-coated Fe3O4 nanoparticles as magnetic adsorbents. Magnetic nanoparticles (Fe-NP and Fe-Si-NC) were synthesized using chemical precipitation and wet impregnation methods, respectively. Detailed synthesis protocols are reported in the following subsections. The synthesis screening basically focuses on testing the performance of the synthesized nanocomposites (NCs) with different silica loading values (0–1.5 wt%) and calcination temperatures (300–500 °C). In addition, the best NC was selected for optimization against various parameters such as adsorbent dose and initial concentration of F (1–20 mg L1). Only the selected NC was subject to a variety of characterizations. Different isotherms, including those of Langmuir and Freundlich, were employed to evaluate the adsorption processes.

2. Materials and Methods

2.1. Materials

The list of the equipment, chemicals, and reagents used for the synthesis of iron oxide nanoparticles and their silica composites is given in Table S1. All the chemicals were of analytical quality and were used without further processing.

2.2. Synthesis of Nanoparticles and Related Nanocomposites

Nanoparticle synthesis was carried out in 2 steps through the synthesis of nanoparticles (i.e., magnetic nanoparticles and SiO2 nanoparticles) and related nanocomposites (Fe-Si). The detailed description of the synthesis is explained in the following sections.

2.2.1. Fe3O4 Nanoparticles

Magnetic nanoparticles (Fe-NPs) were prepared by using the most common and efficient chemical precipitation technique [34]. Two solutions were prepared to synthesize the nanoparticles as follows. For solution 1, 2.1 g of FeSO4·7H2O were dissolved in 40 mL of distilled water and for solution 2, 3.1 g of FeCl3·6H2O were dissolved in 40 mL of distilled water. Both solutions 1 and 2 were combined with continuous stirring and heated to 80 °C. The pH of solutions 1 and 2 was 7, and this was adjusted to 10 by the dropwise addition of NH4OH (25%) along with continuous stirring until the solution become black. The solution was then filtered using Whatman filter paper. After filtration, nanoparticles were washed thrice with ethanol and then with distilled water, followed by drying overnight in an oven at 80 °C.

2.2.2. Synthesis of Calcium Carbonate Nanoparticles (Ca-NPs)

Ca-NPs were synthesized through a modified protocol described elsewhere [35]. In a typical method, 2 solutions, i.e., solution A (sodium nitrate) and solution B (calcium nitrate), were prepared. Solution A was prepared through mixing 0.1 M CaCO3 and 0.18 M sodium nitrate solutions. The pH of solution A was controlled through a 1 M solution of sodium hydroxide. Meanwhile, solution B (1 M Ca(NO3)2) was prepared by adding a desired amount of calcium nitrate in deionized water. Solution B was added dropwise to solution A under continuous stirring at a constant temperature in a water bath. The resultant precipitates were filtered and dried at room temperature to obtain powdered Ca-NPs.

2.2.3. Synthesis of SiO2 Nanoparticles (Si-NPs)

SiO2 nanoparticles were prepared by using sodium silicate (Na2SiO3·9H2O). Firstly, the sodium silicate solution was prepared. Then it was added dropwise to a nanosized CaCO3 suspension over 1 h along with continuous stirring. Both solutions were mixed and then kept in an oven at 80 °C. The pH was adjusted by adding HCl solution (10 wt%, pH range = 9–10). A mixture with a 1/10 molar ratio of SiO2/CaCO3 was produced. The mixture was stirred for the next 2 h, followed by filtering using Whatman® filter paper, rinsing with distilled water and ethanol, and finally drying at 100 °C (in an oven). Calcination was performed at 700 °C for 5 h to obtain core shell composite of the CaCO3-SiO2 nanoparticles. In order to fully extract CaCO3, the CaCO3-SiO2 composite was dissolved in HCl (10 wt%) for 12 h. The residual gel was purified and rinsed with distilled water. After rinsing the gel, the silica nanoparticles were calcined at 100 °C for 1 h [36].

2.2.4. Fe-Si Nanocomposites (Fe-Si-NCs)

A series of Fe-Si nanocomposites with different Fe3O4 (Fe-NP) loading values (0.1, 0.25, 0.5, 1.0 and 1.5 wt/wt%) were fabricated employing the wet impregnation (WI) method. A detailed synthesis procedure was provided in our previous publication [37,38,39]. For Fe-Si-NC synthesis, the known concentration of Fe-NPs was first dissolved in distilled water. Si-NPs (as a substrate) were added to Fe-NP solution and this was stirred continuously to homogenize the slurry (for an hour) followed by evaporation in a water bath with continuous stirring to obtain a thick paste. The raw Fe-Si-NCs were aged overnight and dried in an oven. The raw nanomaterial obtained was dried overnight, grinded into fine powder, calcined at 300 °C and 500 °C, and stored in a desiccator for further use.

2.3. Screening and Optimization Studies

Fe-Si-NCs were screened for their adsorption capacity of Fˉ against different synthesis and reaction parameters including different Fe3O4 loading values (wt%), calcination temperatures (300 °C, 500 °C), and contact times (minutes). The best selected Fe-Si-NC after screening was further evaluated for its performance against reaction parameters such as adsorbent dose (0–1 g L−1), contact time (0–60 min), and initial fluoride concentration (1–20 mg L−1). For a typical batch experiment, an adsorbent dose of 0.03 g L−1 was used with a total of 50 mL of reaction volume. The reaction was carried out at a neutral pH (6.8) for a 1 h duration. Samples were collected (1 mL every 10 min) and analyzed using spectrophotometric method at 570 nm [40]. The adsorption percentages (η%) and adsorption capacity (Qe, mg g−1) of Fe-Si-NCs were measured by the amount adsorbed (of fluoride) and estimated according to Equations (1) and (2)
η % = C 0   C t C 0   × 100
Q e = C 0   C t × V M
where C0 and Ct (both in mg g−1) are the initial and equilibrium F concentrations (at time t), respectively, V (L) is the volume of the aqueous solution, and M (g) is the mass of the adsorbent.

2.4. Adsorption Isotherms

Adsorption may be demonstrated as the separation of single-phase substances, accompanied by its application or concentration on the surface of the adsorption phase. The whole transfer process takes place until the conditions of stability have been reached. The correlation of isothermal data with mathematical or qualitative equations is desired for practical applications. In this study, 2 isotherms were used to describe experimental data, i.e., the Langmuir and Freundlich isotherms. The Langmuir isotherm explains the concept of a single adsorbate in a single molecular layer, whereas the Freundlich isotherm is used to model non-ideal adsorption on heterogeneous surfaces. Heterogeneity was caused by the presence of various functional groups on the surface, as well as the multiple adsorbent–adsorbate interactions. The linear transformation of the Langmuir isotherm model can be expressed as [29]:
1 Q e = ( 1 K a d s Q m ) × 1 C e + 1 Q m
where Qe = amount of dye adsorbed (mg g−1), Ce = equilibrium concentration (mg L−1), Kads = equilibrium adsorption constant (mg L−1), and Qm = Qe for complete monolayer adsorption capacity (mg g−1). The Freundlich isotherm was used for non-ideal adsorption on heterogeneous surfaces. The heterogeneity arises from the presence of different functional groups on the surface, and the various adsorbent–adsorbate interactions. The Freundlich isotherm was expressed by the following empirical equation [41]:
Q e = K F × C e 1 / n
The Freundlich isotherm was expressed by the following empirical equation [41]:
l o g   Q e = l o g K F + ( 1 n ) l o g C e
where KF = the Freundlich adsorption constant (L g−1). The Freundlich constant with n indicated how satisfactory the adsorption process was (1/n is a measure of adsorption capacity).

2.5. Characterization of Fe-NPs and Fe-Si-NCs

Selected NPs and NCs were characterized to understand their physicochemical properties. Surface morphology (using scanning electron microscopy, SEM) was analyzed by taking microscopic images at various resolutions with the JSM-5910 scanning electron microscope (JEOL, Tokyo, Japan) at the Central Resource Laboratory (CRL), Peshawar. The surface chemistry of NCs and NPs (in powder form) was analyzed using Fourier-transform infrared spectroscopy (FTIR) in the range of 500 per cm to 4000 per cm. Phase analysis and crystallite size estimation were performed by XRD (X-ray Diffraction) using a powder X-ray diffractive meter (Cu Kα radiation, 1 = 1.5418 A°, 2 Theta, range 0–80°, JDX-3532-JEOL, Japan) at the Material Resource Laboratory (MRL), Peshawar. The XRD spectra and Scherrer equation were used to calculate the crystallinity of the samples (Equation (6)) [42].
2 θ = K λ β c o s θ  
where the crystallite size is ϕ , K represents the shape factor, the X-ray wavelength is λ, β is the full line width at the half-maximum height of the main intensity peak, and the Bragg angle is θ.

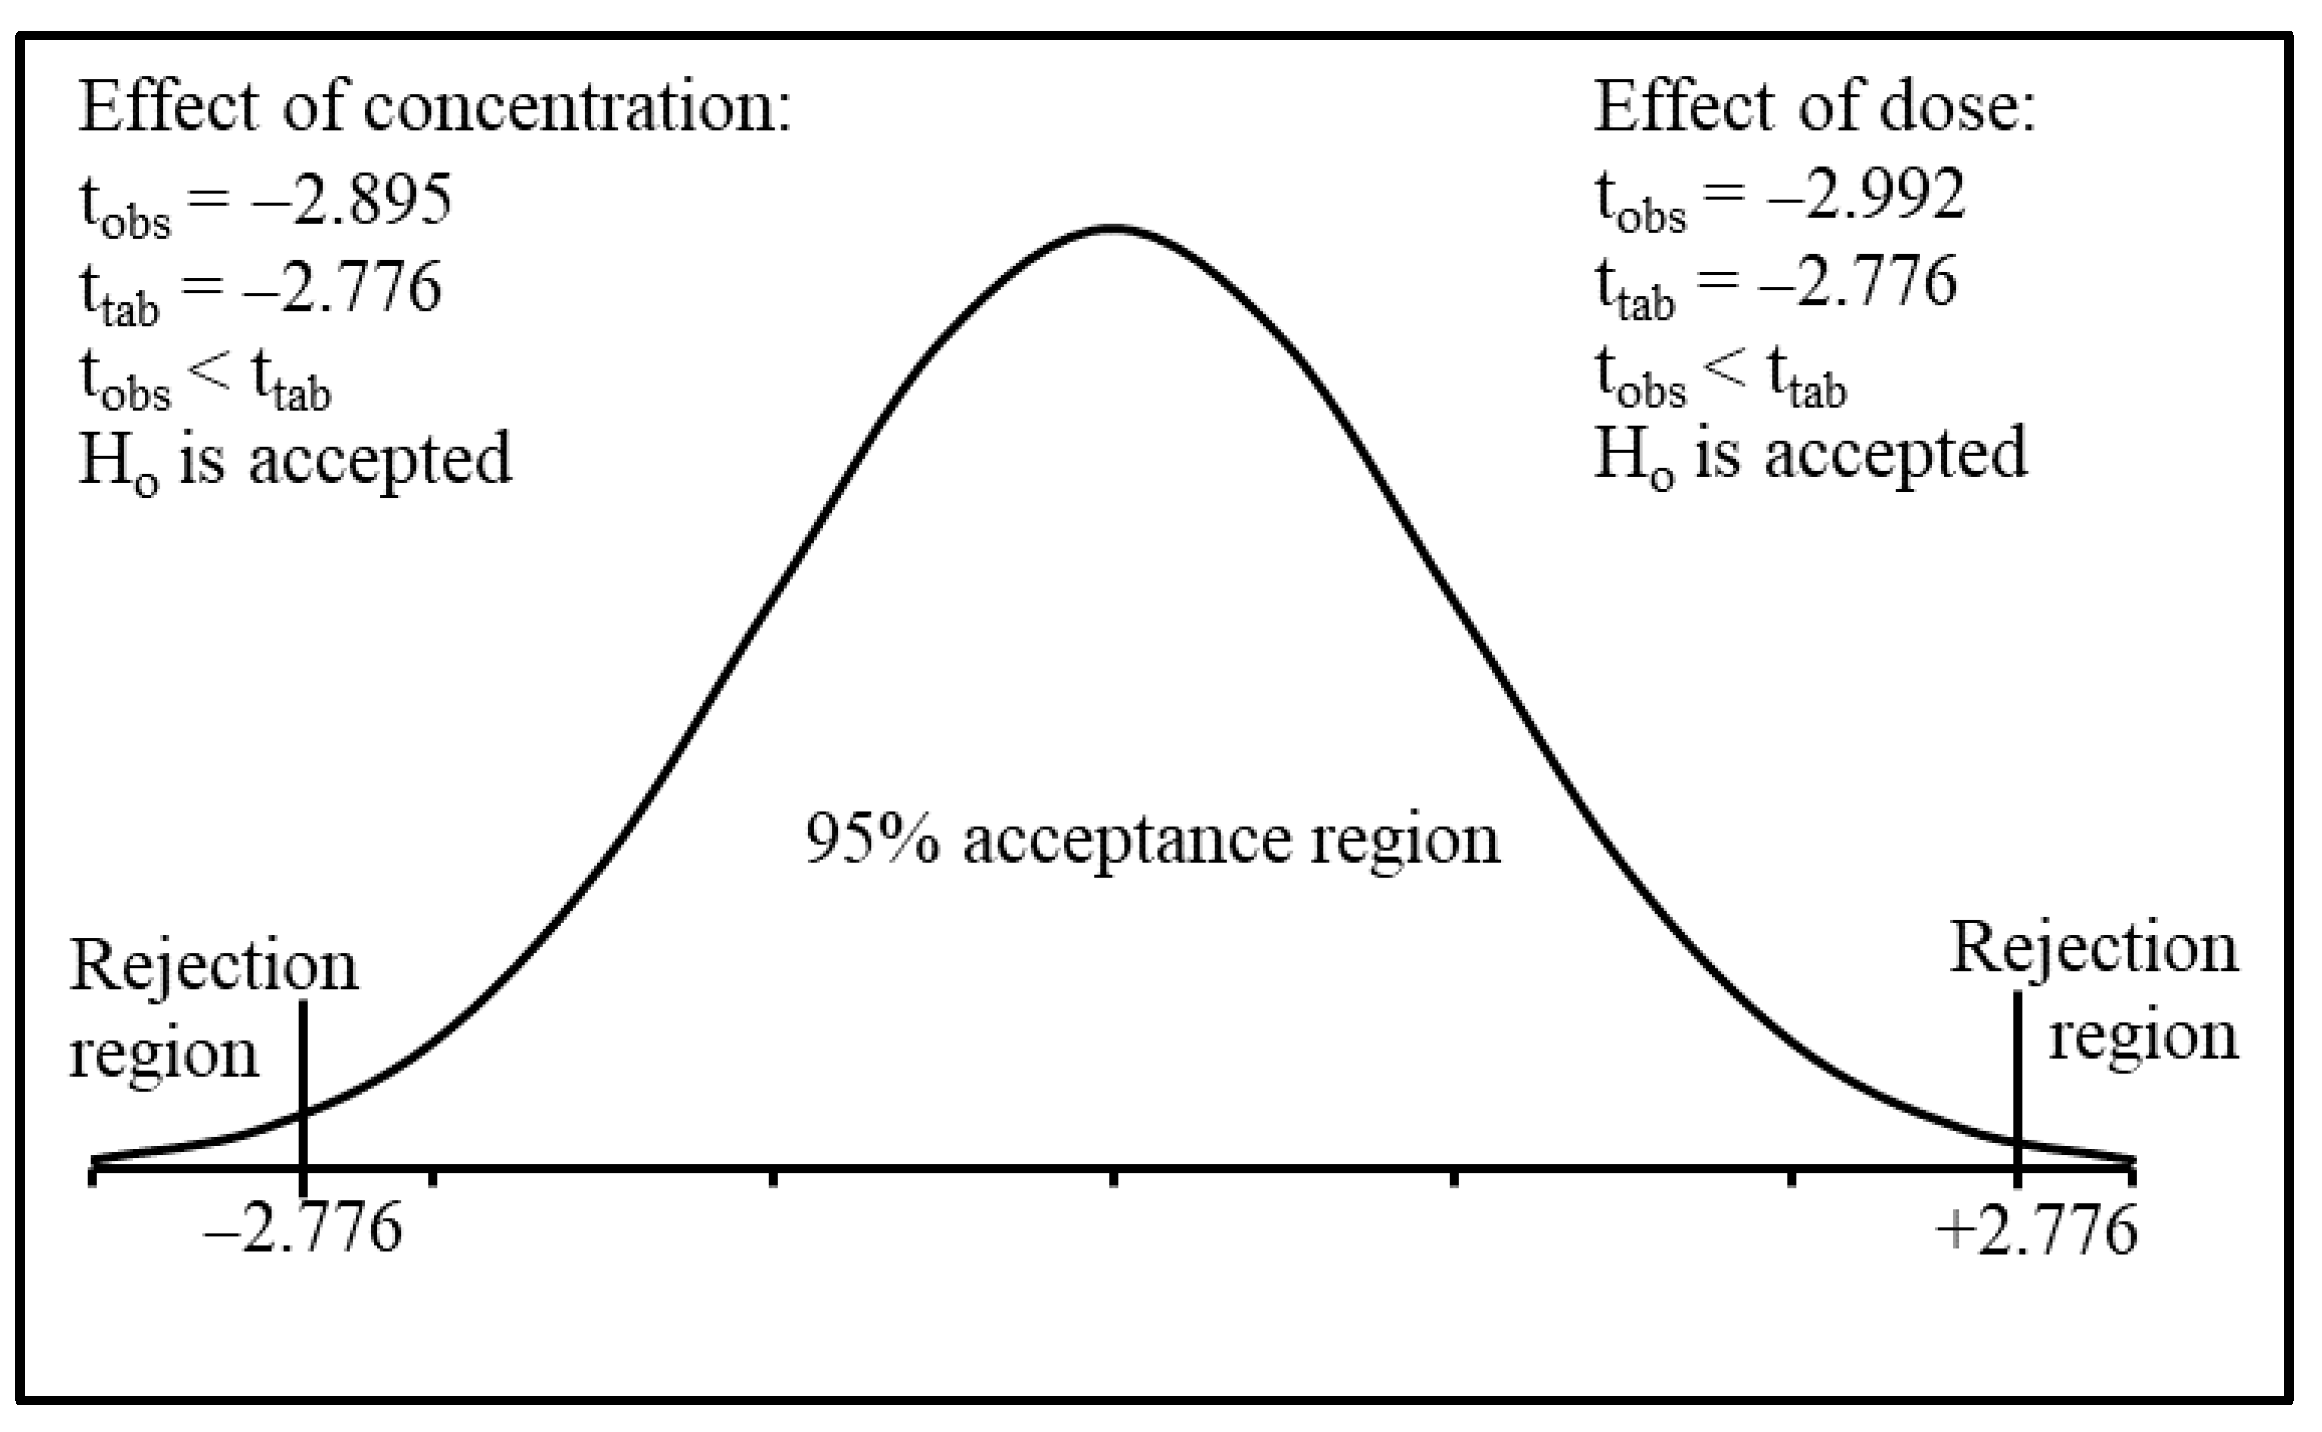
2.6. Statistical Analysis

Student’s t-test was used to determine the statistical significance of the results.

3. Results and Discussion

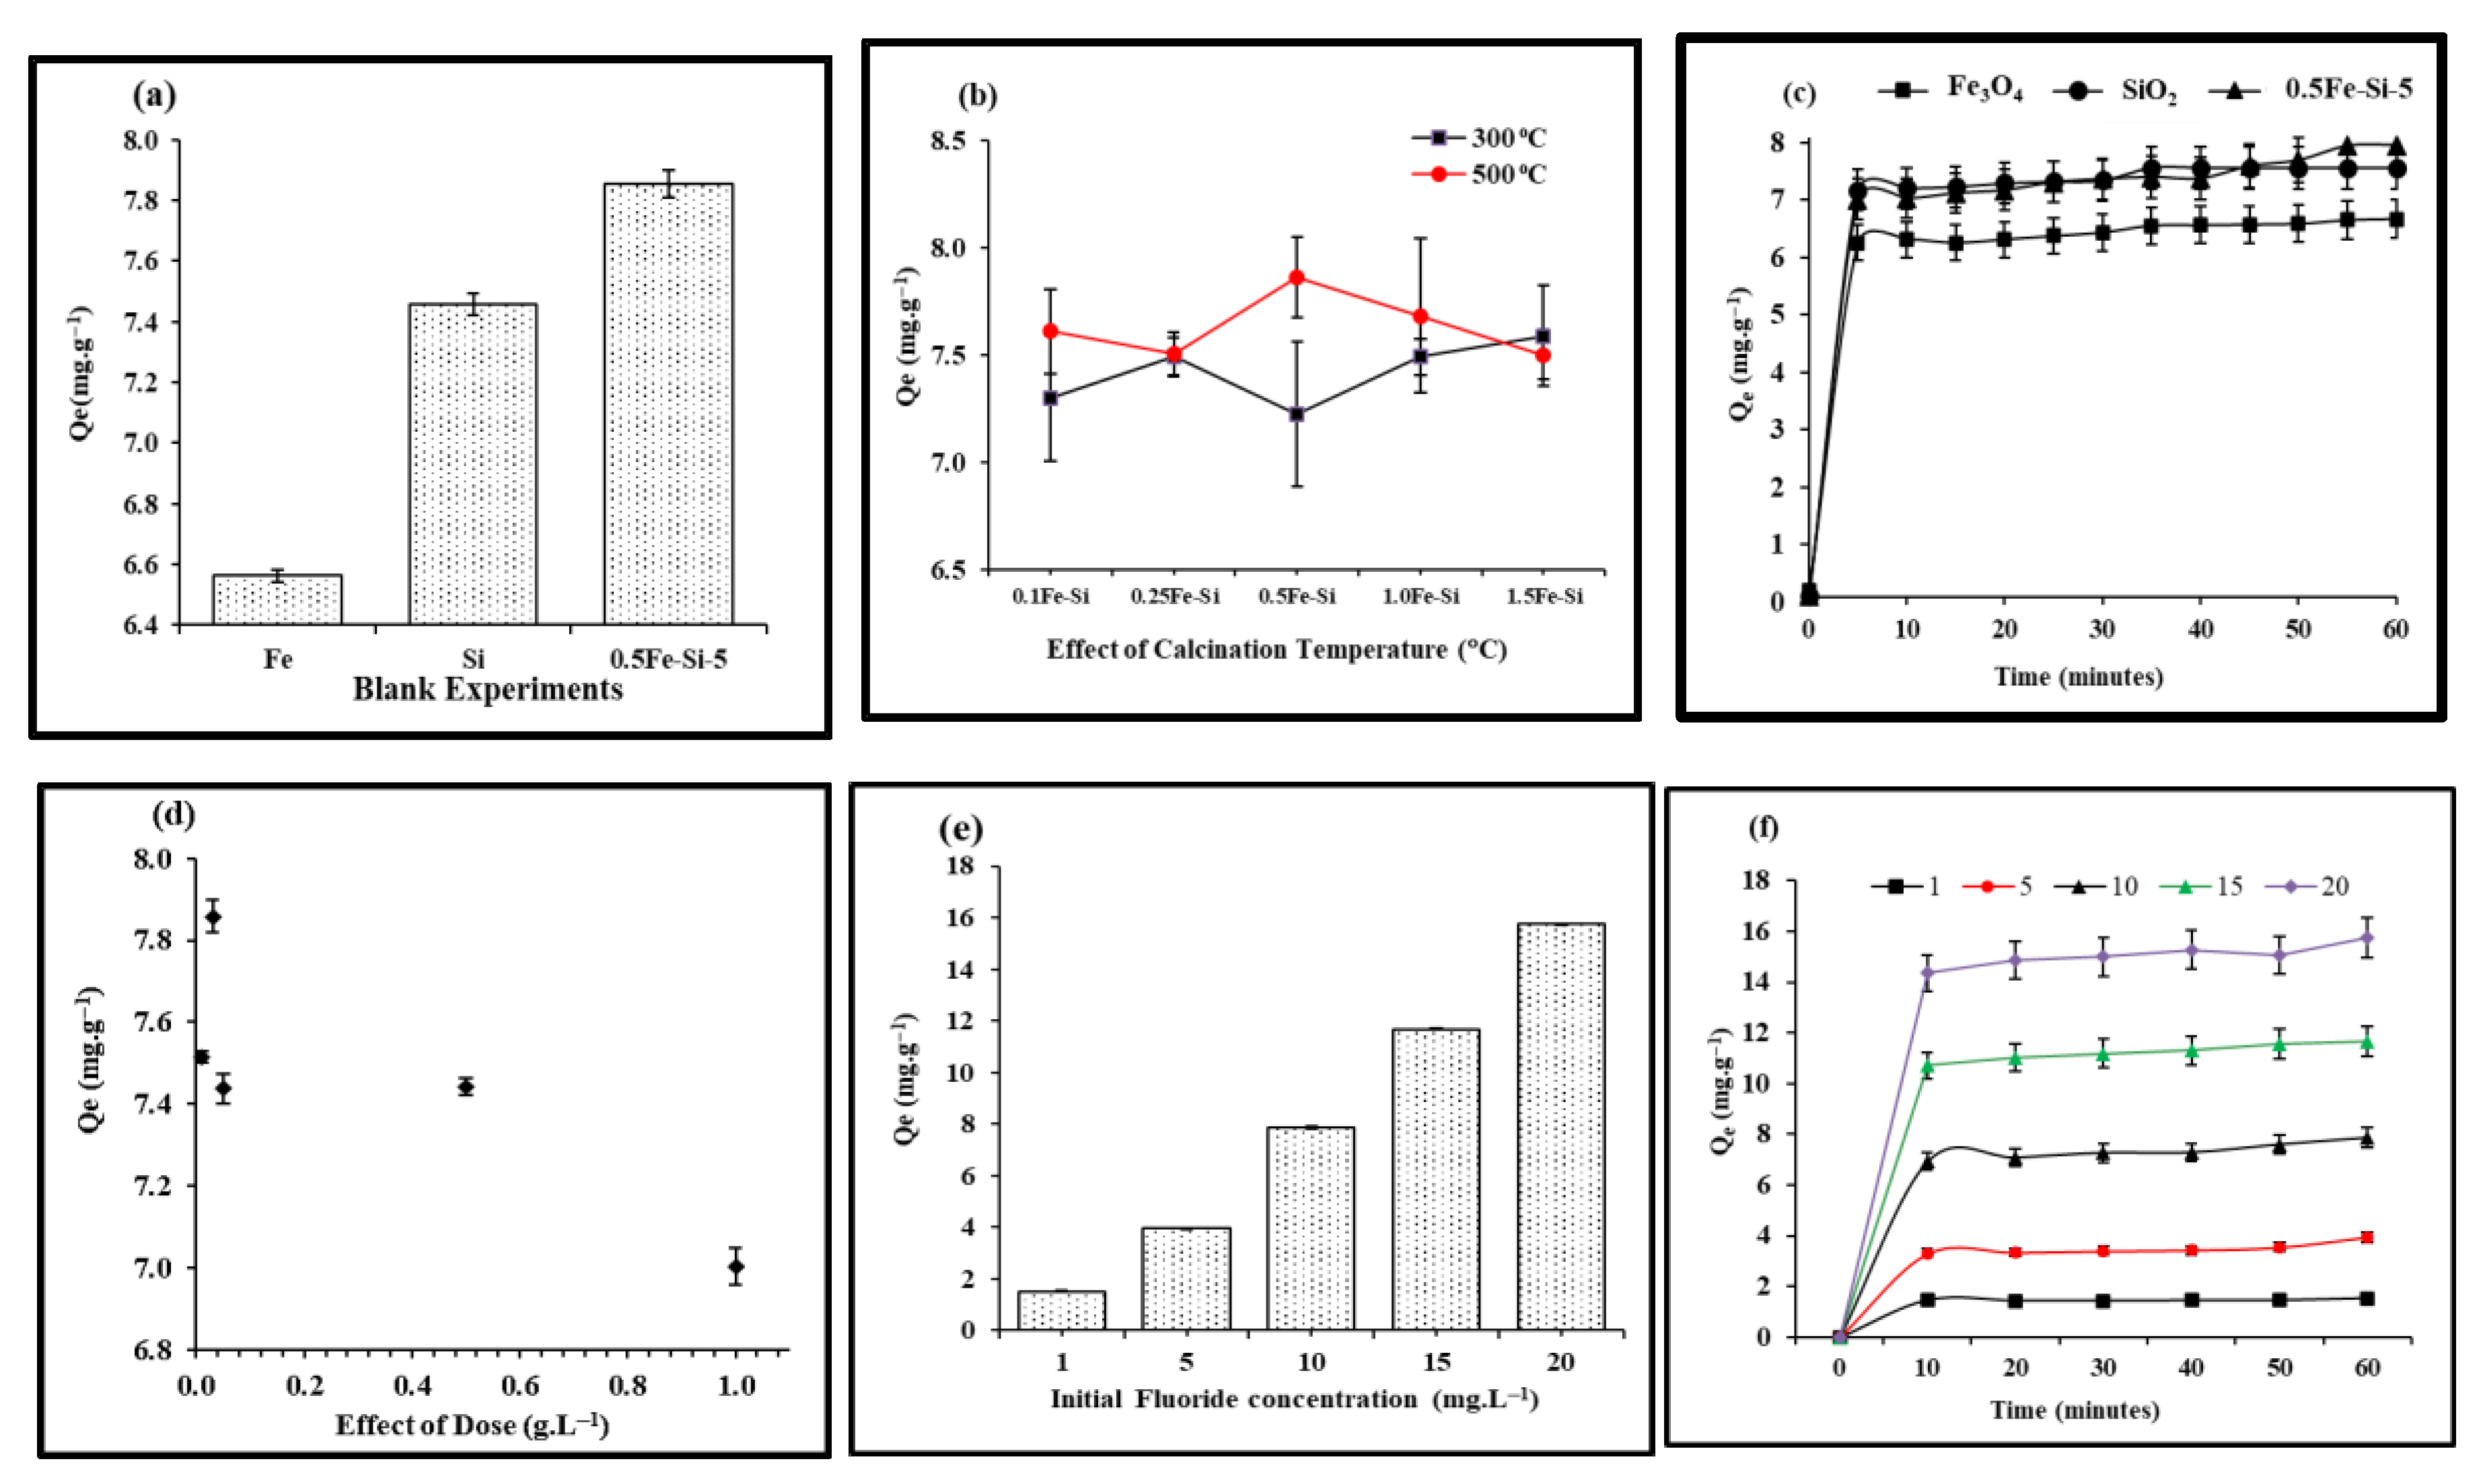
3.1. Screening and Optimization Studies

The fluoride adsorption efficiency using Fe3O4 nanoparticles (FeO-NPs) and their nanocomposites (NCs) was analyzed. Fe3O4-SiO2 NCs (Fe-Si-NCs) were synthesized with different Fe3O4 loading values (0.1, 0.25, 0.5, 1.0, and 1.5% by wt%) onto silica NPs. After the synthesis of various Fe-Si-NCs, the synthesized compounds were further calcined at different calcination temperatures (300 °C and 500 °C). Results with the various studied screening and optimization parameters (Figure 1a) clearly show the increased adsorption efficiency of Fe-Si-NCs as compared to SiO2 and Fe3O4 nanoparticles. In order to determine the effect of different Fe3O4 loading values (wt%) and calcination temperatures, experiments were carried out to evaluate the Fˉ adsorption (Qe) efficiency of Fe-Si-NCs, and the corresponding results are shown in Figure 1b. It was evident that Fe3O4 loading on SiO2 had an inverse relationship with F adsorption beyond an Fe-Si combination of 0.5, implying that the increase in silica loading resulted in decreased performance after 0.5 wt% Fe3O4 loading. However, the overall efficiency was almost the same (75%) for all the tested NCs. The highest amount of Fˉ adsorption was obtained using Fe-S-500 was 7.86 mg g−1. Thus, Fe-Si-NCs at 0.5 wt% loading at a calcination temperature of 500 °C were selected as a suitable combination for further experiments using different adsorbent doses and initial fluoride concentrations.
Figure 1c depicts the effect of contact time on F adsorption on Fe-Si-NC-500 with various silica loading values (0.1, 0.25, 0.5, 1, and 1.5) and an initial F concentration of 10 mg L−1. An L-shaped graph was obtained with Fe-Si-NC-500. It was evident that the maximum removal occurred within 10 min (6.86 mg g−1). The results support those of a previous study [43] showing that the equilibrium time was independent of F concentration, and that the maximum time required to achieve this was 15 min.
Based on the material employed for fluoride adsorption, different adsorption capacity values along with the contact time were reported. A minimum of 30 min for the maximum adsorption (18.7–6.35 mg g−1) [24] has been reported for MOF-801, as for this type of material, rapid removal of F usually occurs when binding sites are accessible on the external layer. Since the adsorption was rapid in the beginning and then gradually slowed down before equilibrium was reached (mainly due to the weaker uptake), it was possible that the fluoride ions flowed into the porous MOF-801. According to another study, equilibrium occurred within 120 min using lanthanum-impregnated bauxite for the removal of F. The maximum absorption capacity of F was found to be 18.8 mg g−1 [44].
One important parameter of adsorption was in relation to the impact of adsorbent doses on fluoride adsorption. Results on the impact of varying adsorbent doses (0.01, 0.03, 0.05, 0.5, and 1.0 g L−1) with regard to fluoride removal while maintaining other parameters (F concentration and contact time) constant using 0.5 wt% Fe-Si-NC-500 are presented in Figure 1d. The dose of 0.03 g L−1 led to the maximum fluoride adsorption (i.e., 7.86 mg g−1). It is evident from results that as the adsorbent dose increases, the removal efficiency of the NC adsorbent decreases. There are many vacant adsorption sites on the adsorbent at the start of an adsorption operation. However, as adsorption advances, empty adsorption sites are gradually occupied. As a result, there are fewer adsorption sites available for adsorbates to bind [45]. The results presented in this study are in agreement with previously reported studies for F adsorption using MOF-801 showing that increasing the adsorbate dose from 0.3 to 1.5 g resulted in an increased efficiency, primarily due to an increase in the number of active sites [24]. These results are further supported by a study by [46] which showed that with an increase in adsorbent dosage above 0.02 g, adsorption was decreased. The present study reports decreased F adsorption with an increase in adsorbent dose, mainly due to the blockage of active sites on the adsorbent surface [47].
Null hypothesis (Ho): Ho = Optimum dose = 0.03
Alternate hypothesis (Ha): Ha = Optimum dose ≠ 0.03
For (n − 1) degree of freedom
t = ( X μ σ s N ) = t obs
where σs is the standard deviation, X is an average value of X, and N is sample size.
The σs value is ±3.07, while the tcal value is −2.992. However, the t value obtained from the Student’s t-test table (ttab) was −2.776 at a 5% level of significance for 4 df and a 2-tailed t-distribution (also known as Student’s T Distribution) [48,49]. As can be seen in Figure 2 the tcal value was less than ttab value, so the Ho (that the optimum dose was 0.03 g L−1) was accepted.
Results on the fluoride quantity adsorbed against initial Fˉ concentration (1, 5, 10, 15, 20 mg L−1) at neutral pH using 0.5 wt% Fe3O4-SiO2 nanocomposites calcined at 500 °C are shown in Figure 1e,f (concentration vs. time). The impact of the Fˉ concentration on Fˉ adsorption using 0.5 wt% of Fe3O4-SiO2 nanocomposites was investigated, and it was found that adsorption ability increased linearly with increasing initial fluoride concentrations from 1 to 20 mg L−1. It was noted that increasing F concentrations increased the driving force at the solid–liquid interface by increasing the adsorption power. The results revealed that the efficiency of adsorption was proportional to the initial concentration of fluoride ions. The adsorption capacity (instead of the adsorption rate) increased with increasing initial concentrations. This demonstrates that the adsorption mechanism is physi-sorption [50,51]. Previous studies using MOF-801 support the present findings that an increase in initial F concentration (5.0–25 mg L−1) results in an increased adsorption due to an increase in the driving force at the solid–liquid interface [24,47]. Another study conducted on the defluoridation of drinking water also supports the findings of the present study that with an increase in the initial Fˉ concentration an increase in adsorption capacity can be observed [52]. The increase in adsorption potential is mainly because of the variations in surface charges with increasing initial concentrations (positive for modified nano alumina and negative for F).
The Student’s t-test was employed to compare the calculated and tabulated value for the adsorption of different Fˉ concentrations on a 0.03 g L−1 dose of nanomaterial. The null hypothesis (Ho) for the optimum concentration was 10 mg L−1. The σs was ± 2.52, while the tcal was −3.895; however, the t value obtained from the Student’s t-test table (ttab) was −2.776 at a 5% level of significance for 4 df and a two-tailed t-distribution [48,49]. As can be seen in Figure 2, the tcal was less than the ttab, so the Ho (the optimum concentration was 10 mg L−1) was accepted.

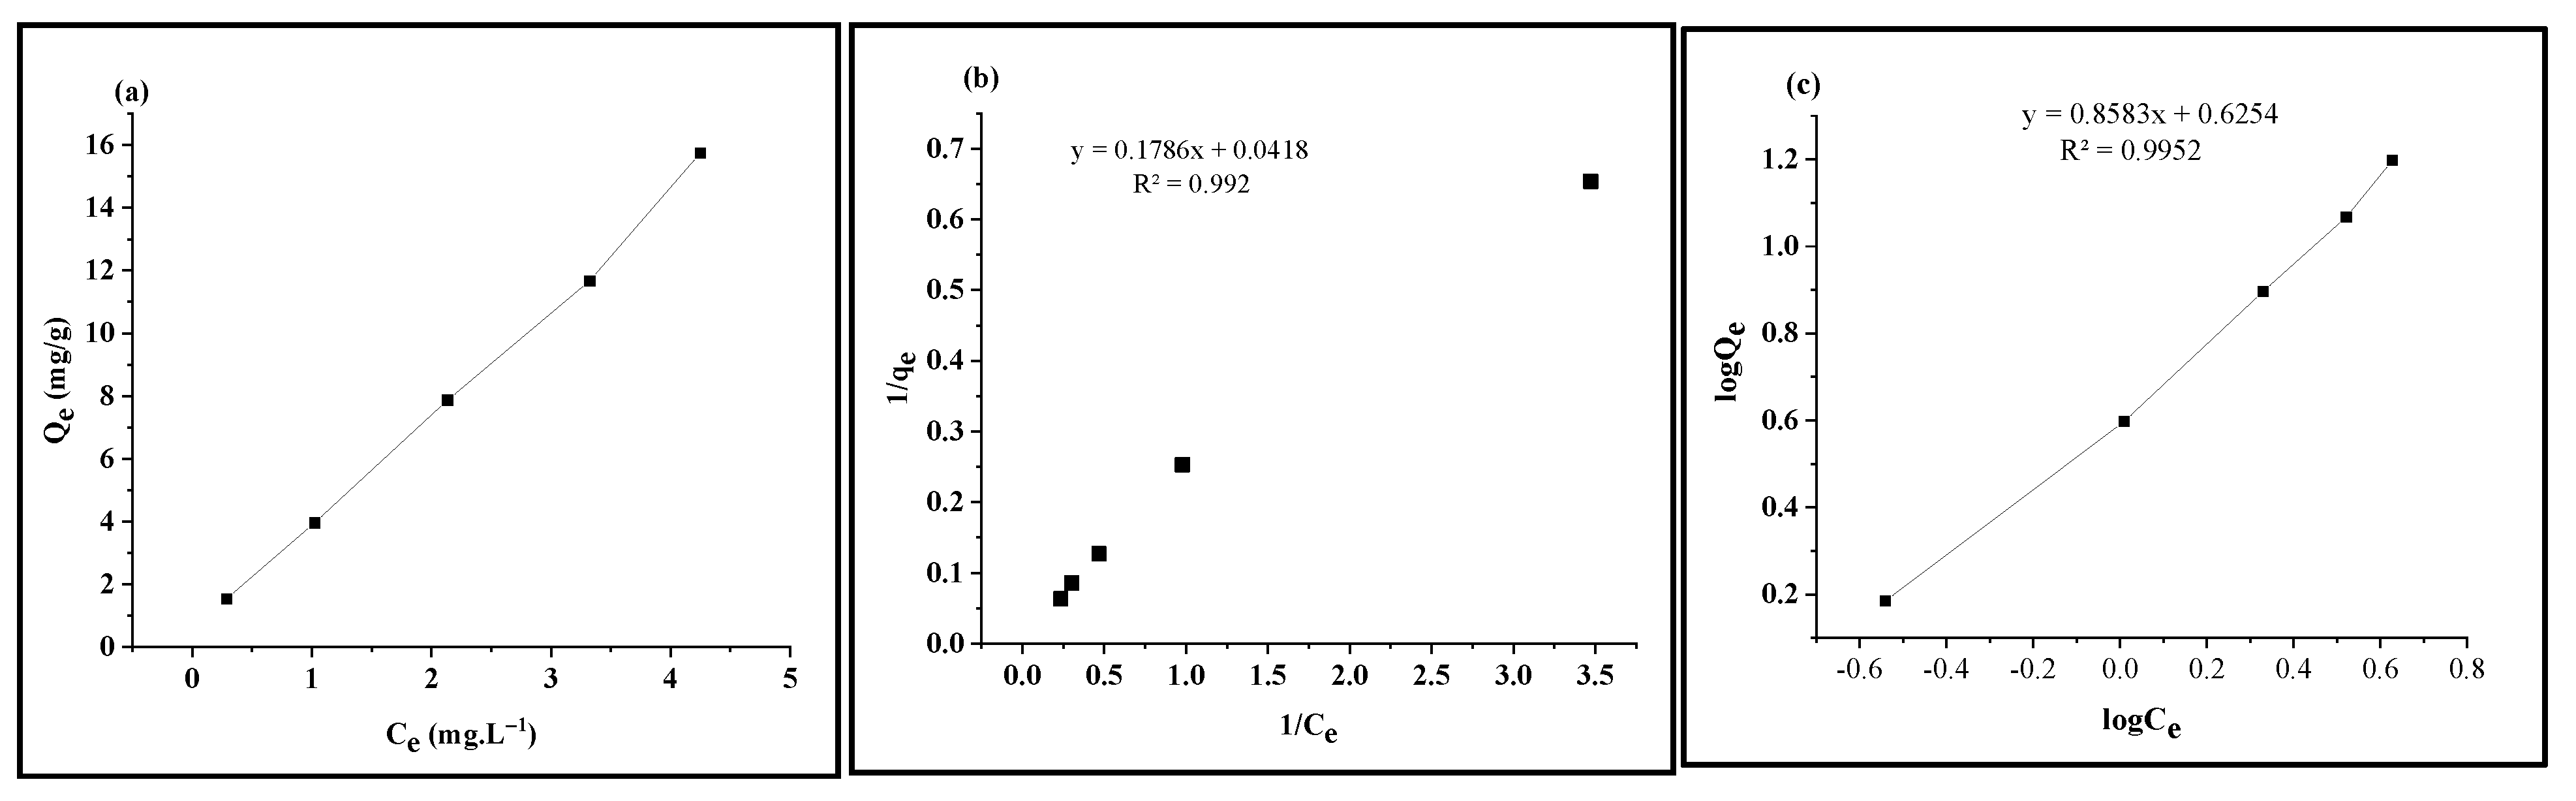
3.2. Adsorption Isotherm

To evaluate the adsorption processes, the Langmuir and Freundlich isotherms were used to analyze the experimental data and to discuss equilibrium condition of the adsorption. The Langmuir isotherm model (Figure 3b) shows the homogenous adsorbed material with the same energy on the surface, whereas the Freundlich isotherm model represents a direct relationship between Qe and Ce (Figure 3a). This model represents non-uniform distribution of surface absorption heat from a heterogeneous surface. The Freundlich equation can be linearized, and the experimental results are plotted as logQe versus logCe (Figure 3c). The Freundlich isotherm constants KF and n were found to be 1.869 mg g1 and 1.1651 L g1, respectively. Fluoride adsorption at 0.5 Fe-Si calcined at 500 °C was best suited to both the Langmuir model isotherm (R2 = 0.992) and the Freundlich model isotherm (R2 = 0.995). A high correlation coefficient was obtained for both the Langmuir and Freundlich isotherms, as shown in Figure 3b,c. The maximum adsorption capacities (Qm) of various pollutants on Fe3O4-SiO2 and other adsorbents are documented in the literature [53,54,55,56,57,58]. It can be summarized that Fe3O4-SiO2 synthesized using various methods showed different adsorption capacity values at a working pH below 4. On the other hand, the present study showed promising results, with 5.5991 and 1.869 mg g1 obtained as the maximum adsorption capacity values of Qm and KF (calculated using the Langmuir and Freundlich isotherms, respectively) at a neutral pH, without the addition of any reagent to change the reaction pH.
It was found that the adsorption of F on 0.5 Fe-Si calcined at 500 °C best fit into both the Langmuir model isotherm (R2 = 0.992) and the Freundlich model isotherm (R2 = 0.995). High correlation coefficients were obtained for both the Langmuir and Freundlich isotherm. The results of this study show consistency with both the Langmuir isotherm and the Freundlich isotherm, as shown in Figure 3b,c. The maximum adsorption capacities (Qm) of various pollutants on the Fe3O4-SiO2 and other adsorbents have been documented in the literature [53,54,55,56,57,58]. It can be summarized that Fe3O4-SiO2 synthesized using various methods showed different adsorption capacity values at a working pH below 4. The obtained results showed that the studied models fitted the data in the order as follows: Freundlich (R2 = 0.995) > Langmuir (R2 = 0.992). A high coefficient for modeling usually means that the data follow the model. The interaction of F content with magnetic adsorbents is characterized as a physical adsorption phase according to the adsorption isotherm modeling. Because of their repulsion, there is no creation of a complex between the adsorbed molecules. There is a significant distinction between both adsorption isotherms applied in this study. The Freundlich isotherm is quantitative, whereas Langmuir’s model is theoretical and assumes that there is only a monomolecular layer on the surface at full coverage. This constraint does not apply to the Freundlich isotherm.

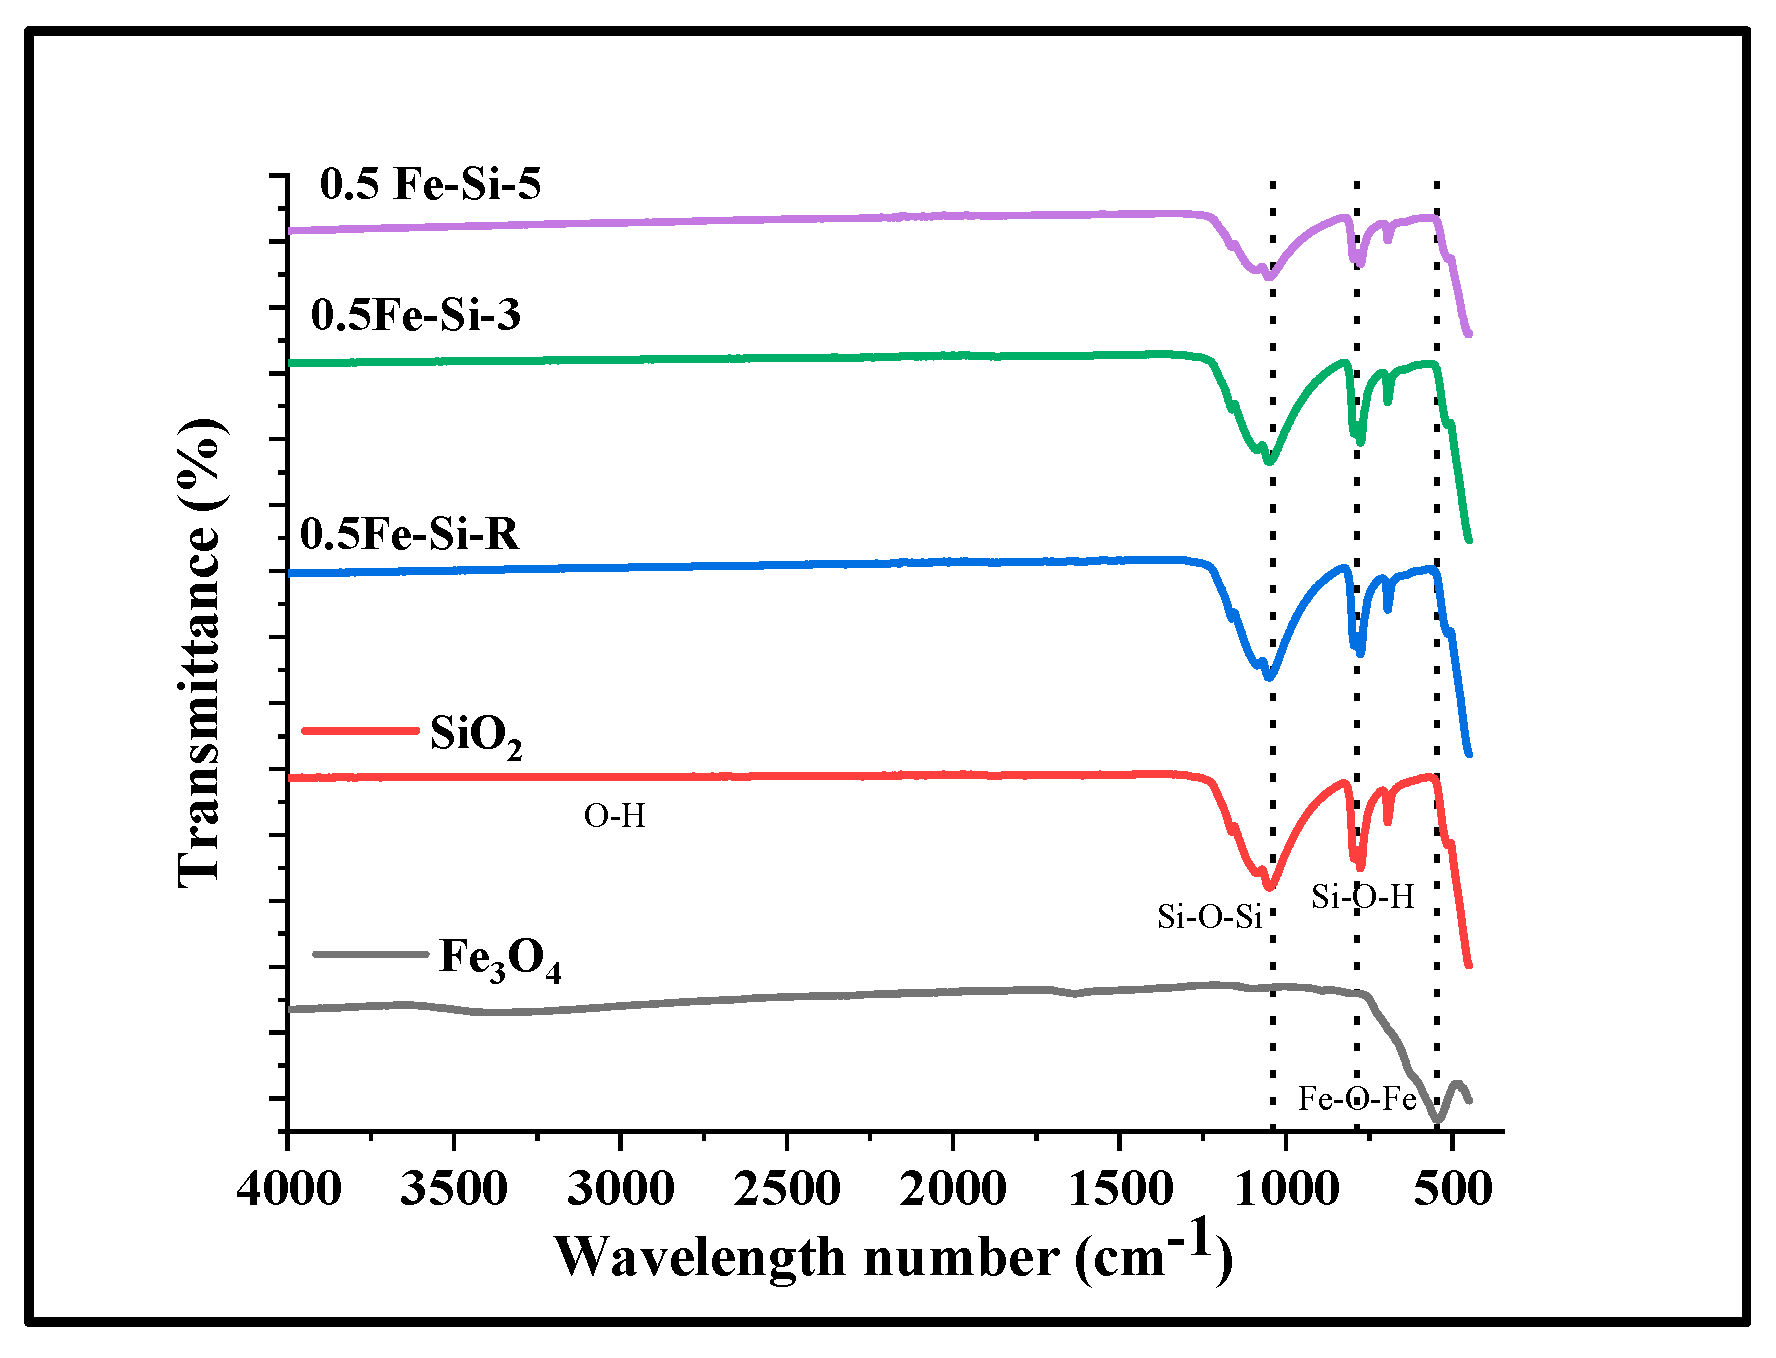
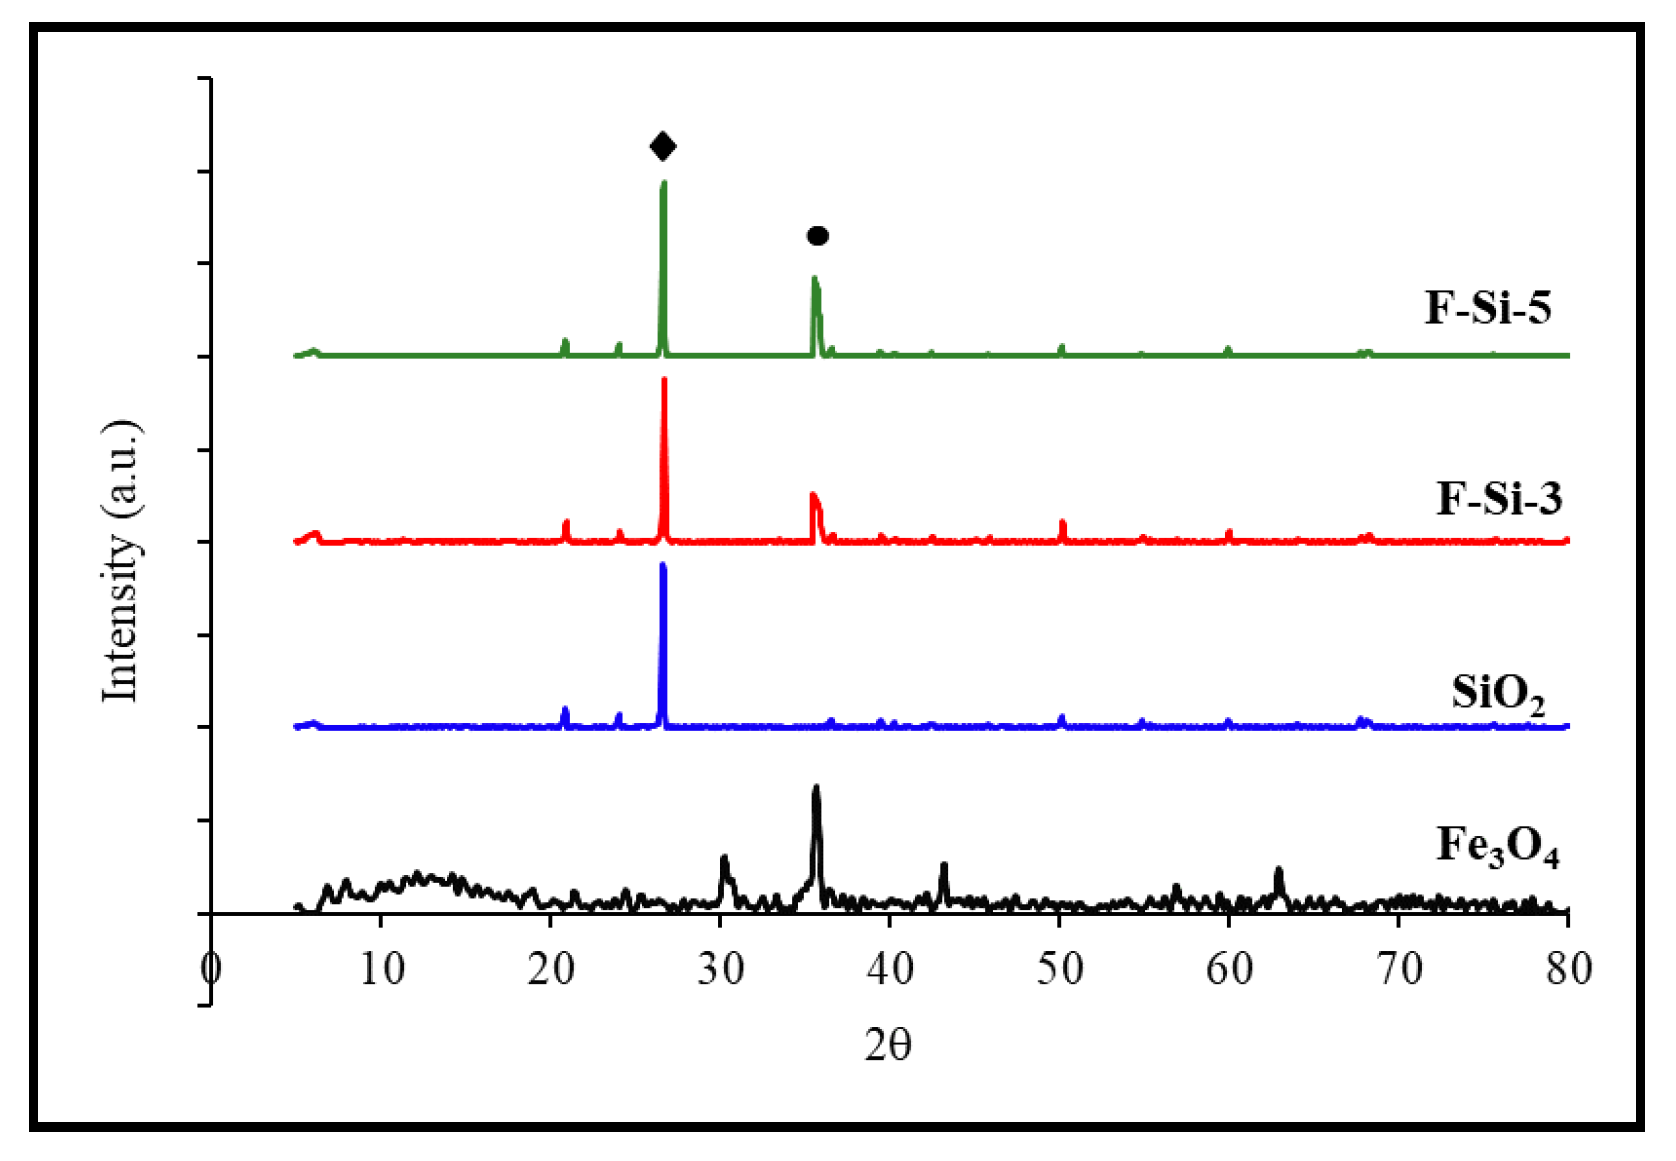
3.3. Characterization

The results for the characterization of the synthesized nanomaterials (NMs) and their composites (NCs) are discussed in this section. The characterization of the NMs and related NCs includes surface morphology (SEM) and surface chemistry (FTIR), along with crystallite size estimation (XRD). Only the best-performing NCs based on the adsorption capacities of the model pollutant were selected to analyze their physicochemical properties.
Scanning electron microscopy (SEM) and the FTIR spectrum were employed to observe the surface morphology and chemistry of the NMs and related NCs, as shown in Figure 4 (1-A represents NPs whereas 1-B represents NCs) and Figure 5, respectively. The SEM micrographs (Figure 4) of Fe3O4 nanoparticles and related nanocomposites after calcination at optimum operating conditions with 30,000–60,000 KX magnification are also shown. Based on the observation from SEM micrographs, NCs were seen as homogeneously distributed but noticeably agglomerated particles [59].
To understand the surface chemistry of Fe3O4 nanoparticles and related SiO2 nanocomposites, FTIR spectroscopy was carried out. Related results along with possible assignments for the different peaks observed along with comparison are presented in Figure 5. The comparison of the corresponding spectra revealed that for NC with SiO2, in addition to the adsorption of Fe-O-Fe in Fe3O4 around 580–590 per cm (key phase of as-synthesized particles is magnetite), new bands appeared at around 975 and 1130 per cm, and are related to Si-O-H and Si-O-Si stretching, respectively [58,60]. Broad peaks occurring at around 1622 per cm and 3450 per cm in the spectrum were attributed to O-H bond stretching and bending vibrations of water, respectively [61]. The reason for the formation of broad peak is because of the aqueous medium synthesis supporting free Fe atoms and O on the NP surface [58,62].
Phase identification and crystallite size estimation were carried out using XRD analysis. The typical XRD diffraction peaks related to the nanoparticles (Fe3O4 and SiO2) and related SiO2 nanocomposites are shown in Figure 6. Diffraction peaks were observed at 30.2°, 35.6°, 43.15°, 53.8°, 57.0°, and 63.0°, respectively, corresponding to the planes of cubic inverse spinel Fe3O4 (represented by a ball symbol) of 220, 311, 400, 422, 511, and 440 [59]. The incremental peak was at 26.6° for SiO2 (shown by a square), and the majority of the peaks were comparable to those reported in Fe3O4 XRD patterns. As calculated using Scherer’s formula [63] the crystallite sizes of the nanoparticles (Fe3O4 and SiO2) and related SiO2 NCs were around 22.55 and 56.01 nm for Fe3O4 and SiO2 NPs, respectively, and 24.88 and 23.79 nm for Fe-Si-3 and Fe-Si-5 NCs [58,59,61]. When the temperature increased, the crystallite size increased marginally, with irregular dispersion of the particle size. The increased frequency of a collision between such nanoparticle leads to an increase in the kinetic energy of the collision, giving the nanoparticles a strong tendency to overcome the potential barrier between them and clump into big particles.
When the temperature increased, the particle size became slightly bigger, and the particle size distribution was irregular. The increased frequency of collisions between the particles led to an increased kinetic energy of collisions; this gave the nanoparticles a strong tendency to overcome the potential barrier between them and agglomerate into large particles.

4. Conclusions

In conclusion, silica-coated Fe3O4 nanoparticle composites were successfully synthesized and used as a green magnetic nanocomposite for the efficient defluoridation of drinking water. With elevated calcination temperatures (500 °C), as the particle size increased slightly an increase in the adsorption capacity was observed, with optimum Fe3O4 loading at 0.5 wt%. An irregular particle size distribution along with the crystallite size was reported and verified by SEM and XRD, respectively. The investigated adsorption was maximized, with 5.599 and 1.869 mg g−1 obtained as the maximum adsorption capacity values in the initial 10 min for Qm and KF (calculated using Langmuir and Freundlich isotherms, respectively) at a neutral reaction pH. The interaction of F content with magnetic adsorbents was characterized as a physical adsorption phase according to adsorption isotherm modeling. This work showed accelerated adsorption with shorter contact times and good adsorption capacity at neutral pH as compared to reports in other studies using similar nanomaterials, without the addition of toxic solvents.

Supplementary Materials

The following are available online at https://www.mdpi.com/article/10.3390/w13111514/s1, Table S1: list of the equipment, chemicals, and reagents used for the synthesis of iron oxide nanoparticles and their silica composites.

Author Contributions

Conceptualization, Q.M.; methodology, N.R.; software, M.S.K.; validation, Q.M., N.R., and A.N.; formal analysis, A.S.; resources, Q.M. and J.W.; data curation, A.S.; writing—original draft preparation, A.S.; writing—review and editing, Q.M. and N.R., U.F.; supervision, Q.M. and N.R.; project administration, Q.M.; funding acquisition, A.A.A., A.H., A.-B.F.A.-A. and E.F.A.A. All authors have read and agreed to the published version of the manuscript.

Funding

This research was funded by Deanship of Scientific Research at King Saud University for funding this research group NO (RGP-271).

Acknowledgments

The authors would like to extend their sincere appreciation to the Deanship of Scientific Research at King Saud University for funding this research group NO (RGP-271) and by the Guangxi Major Projects of Science and Technology (Grant No. AA18118013, AA17202032,) from the Guangxi Science and Technology Department.

Conflicts of Interest

The authors declare no conflict of interest.

References

  1. Wang, J.; Xu, W.; Chen, L.; Jia, Y.; Wang, L.; Huang, X.-J.; Liu, J. Excellent fluoride removal performance by CeO2–ZrO2 nanocages in water environment. Chem. Eng. J. 2013, 231, 198–205. [Google Scholar] [CrossRef]
  2. Wang, H.; Feng, Q.; Liu, K.; Li, Z.; Tang, X.; Li, G. Highly efficient fluoride adsorption from aqueous solution by nepheline prepared from kaolinite through alkali-hydrothermal process. J. Environ. Manag. 2017, 196, 72–79. [Google Scholar] [CrossRef]
  3. Collivignarelli, M.C.; Abbà, A.; Carnevale Miino, M.; Torretta, V.; Rada, E.C.; Caccamo, F.M.; Sorlini, S. Adsorption of Fluorides in Drinking Water by Palm Residues. Sustainability 2020, 12, 3786. [Google Scholar] [CrossRef]
  4. Jiang, H.; Li, X.; Tian, L.; Wang, T.; Wang, Q.; Niu, P.; Chen, P.; Luo, X. Defluoridation investigation of Yttrium by laminated Y-Zr-Al tri-metal nanocomposite and analysis of the fluoride sorption mechanism. Sci. Total Environ. 2019, 648, 1342–1353. [Google Scholar] [CrossRef]
  5. Yadav, K.K.; Gupta, N.; Kumar, V.; Khan, S.A.; Kumar, A. A review of emerging adsorbents and current demand for defluoridation of water: Bright future in water sustainability. Environ. Int. 2018, 111, 80–108. [Google Scholar] [CrossRef] [PubMed]
  6. Marques, J.M.; Andrade, M.; Carreira, P.M.; Eggenkamp, H.G.M.; Graça, R.C.; Aires-Barros, L.; Antunes DA Silva, M. Chemical and isotopic signatures of Na/HCO3/CO2-rich geofluids, North Portugal. Geofluids 2006, 6, 273–287. [Google Scholar] [CrossRef]
  7. Sivasankar, V.; Darchen, A.; Omine, K.; Sakthivel, R. Fluoride: A world ubiquitous compound, its chemistry, and ways of contamination. In Surface Modified Carbons as Scavengers for Fluoride from Water; Springer: Berlin/Heidelberg, Germany, 2016; pp. 5–32. [Google Scholar]
  8. Ayoob, S.; Gupta, A.K. Performance evaluation of alumina cement granules in removing fluoride from natural and synthetic waters. Chem. Eng. J. 2009, 150, 485–491. [Google Scholar] [CrossRef]
  9. Rasool, A.; Farooqi, A.; Xiao, T.; Ali, W.; Noor, S.; Abiola, O.; Ali, S.; Nasim, W. A review of global outlook on fluoride contamination in groundwater with prominence on the Pakistan current situation. Environ. Geochem. Health 2018, 40, 1265–1281. [Google Scholar] [CrossRef]
  10. Shahid, M.K.; Kim, J.Y.; Shin, G.; Choi, Y. Effect of pyrolysis conditions on characteristics and fluoride adsorptive performance of bone char derived from bone residue. J. Water Process Eng. 2020, 37, 101499. [Google Scholar] [CrossRef]
  11. Huang, L.; Yang, Z.; He, Y.; Chai, L.; Yang, W.; Deng, H.; Wang, H.; Chen, Y.; Crittenden, J. Adsorption mechanism for removing different species of fluoride by designing of core-shell boehmite. J. Hazard. Mater. 2020, 394, 122555. [Google Scholar] [CrossRef]
  12. Meenakshi, R.C. Fluoride in drinking water and its removal. J. Hazard. Mater. 2006, 137, 456–463. [Google Scholar] [CrossRef]
  13. Wambu, E.W.; Ambusso, W.O.; Onindo, C.; Muthakia, G.K. Review of fluoride removal from water by adsorption using soil adsorbents—An evaluation of the status. J. Water Reuse Desalin. 2015, 6, 1–29. [Google Scholar] [CrossRef] [Green Version]
  14. Xu, L.; Chen, G.; Peng, C.; Qiao, H.; Ke, F.; Hou, R.; Li, D.; Cai, H.; Wan, X. Adsorptive removal of fluoride from drinking water using porous starch loaded with common metal ions. Carbohydr. Polym. 2017, 160, 82–89. [Google Scholar] [CrossRef]
  15. Tahir, M.; Rasheed, H. Fluoride in the drinking water of Pakistan and the possible risk of crippling fluorosis. Drink. Water Eng. Sci. 2013, 6, 17–23. [Google Scholar] [CrossRef] [Green Version]
  16. Fakhri, A. Application of response surface methodology to optimize the process variables for fluoride ion removal using maghemite nanoparticles. J. Saudi Chem. Soc. 2014, 18, 340–347. [Google Scholar] [CrossRef]
  17. Pandi, K.; Periyasamy, S.; Viswanathan, N. Remediation of fluoride from drinking water using magnetic iron oxide coated hydrotalcite/chitosan composite. Int. J. Biol. Macromol. 2017, 104, 1569–1577. [Google Scholar] [CrossRef] [PubMed]
  18. Sivarajasekar, N.; Paramasivan, T.; Muthusaravanan, S.; Muthukumaran, P.; Sivamani, S. Defluoridation of water using adsorbents-a concise review. J. Environ. Biotechnol. Res. 2017, 6, 186–198. [Google Scholar]
  19. Zhang, L.e.; Huang, D.; Yang, J.; Wei, X.; Qin, J.; Ou, S.; Zhang, Z.; Zou, Y. Probabilistic risk assessment of Chinese residents’ exposure to fluoride in improved drinking water in endemic fluorosis areas. Environ. Pollut. 2017, 222, 118–125. [Google Scholar] [CrossRef] [PubMed]
  20. Hussein, I.A.; Vegi, M.R. Defluoridation of drinking water using coalesced and un-coalesced mica. Appl. Water Sci. 2020, 10, 64. [Google Scholar] [CrossRef] [Green Version]
  21. Ndé-Tchoupé, A.I.; Crane, R.A.; Mwakabona, H.T.; Noubactep, C.; Njau, K.N. Technologies for decentralized fluoride removal: Testing metallic iron-based filters. Water 2015, 7, 6750–6774. [Google Scholar] [CrossRef] [Green Version]
  22. Rafique, T.; Naseem, S.; Bhanger, M.I.; Usmani, T.H. Fluoride ion contamination in the groundwater of Mithi sub-district, the Thar Desert, Pakistan. Environ. Geol. 2008, 56, 317–326. [Google Scholar] [CrossRef]
  23. Kumari, U.; Mishra, A.; Siddiqi, H.; Meikap, B.C. Effective defluoridation of industrial wastewater by using acid modified alumina in fixed-bed adsorption column: Experimental and breakthrough curves analysis. J. Clean. Prod. 2021, 279, 123645. [Google Scholar] [CrossRef]
  24. Tan, T.L.; Nakajima, H.; Rashid, S.A. Adsorptive, kinetics and regeneration studies of fluoride removal from water using zirconium-based metal organic frameworks. RSC Adv. 2020, 10, 18740–18752. [Google Scholar] [CrossRef]
  25. Mahmood, Q.; Khan, M.S.; Riaz, N. Existing treatment—Globally in full scale plants. In Pharmaceutical Wastewater Treatment Technologies: Concepts and Implementation Strategies; Khan, N.A., Ahmed, S., Vambol, V., Vambol, S., Eds.; IWA Publishing: London, UK, 2021; p. 353. [Google Scholar] [CrossRef]
  26. Saikia, J.; Sikdar, Y.; Saha, B.; Das, G. Malachite nanoparticle: A potent surface for the adsorption of xanthene dyes. J. Environ. Chem. Eng. 2013, 1, 1166–1173. [Google Scholar] [CrossRef]
  27. Olabarrieta, J.; Monzón, O.; Belaustegui, Y.; Alvarez, J.-I.; Zorita, S. Removal of TiO2 nanoparticles from water by low pressure pilot plant filtration. Sci. Total Environ. 2018, 618, 551–560. [Google Scholar] [CrossRef] [Green Version]
  28. Homaeigohar, S. Water Treatment with New Nanomaterials. Water 2020, 12, 1507. [Google Scholar] [CrossRef]
  29. Khan, M.S.; Shah, J.A.; Riaz, N.; Butt, T.A.; Khan, A.J.; Khalifa, W.; Gasmi, H.H.; Latifee, E.R.; Arshad, M.; Al-Naghi, A.A.A.; et al. Synthesis and Characterization of Fe-TiO2 Nanomaterial: Performance Evaluation for RB5 Decolorization and In Vitro Antibacterial Studies. Nanomaterials 2021, 11, 436. [Google Scholar] [CrossRef]
  30. Panneerselvam, P.; Morad, N.; Tan, K.A. Magnetic nanoparticle (Fe3O4) impregnated onto tea waste for the removal of nickel (II) from aqueous solution. J. Hazard. Mater. 2011, 186, 160–168. [Google Scholar] [CrossRef]
  31. Rajput, S.; Singh, L.P.; Pittman, C.U., Jr.; Mohan, D. Lead (Pb2+) and copper (Cu2+) remediation from water using superparamagnetic maghemite (γ-Fe2O3) nanoparticles synthesized by Flame Spray Pyrolysis (FSP). J. Colloid Interface Sci. 2017, 492, 176–190. [Google Scholar] [CrossRef]
  32. Nithya, R.; Thirunavukkarasu, A.; Sathya, A.B.; Sivashankar, R. Magnetic materials and magnetic separation of dyes from aqueous solutions: A review. Environ. Chem. Lett. 2021. [Google Scholar] [CrossRef]
  33. Sharma, Y.; Srivastava, V. Separation of Ni (II) ions from aqueous solutions by magnetic nanoparticles. J. Chem. Eng. Data 2010, 55, 1441–1442. [Google Scholar] [CrossRef]
  34. Shah, K.H.; Ali, S.; Shah, F.; Waseem, M.; Ismail, B.; Khan, R.A.; Khan, A.M.; Khan, A.R. Magnetic oxide nanoparticles (Fe3O4) impregnated bentonite clay as a potential adsorbent for Cr(III) adsorption. Mater. Res. Express 2018, 5, 096102. [Google Scholar] [CrossRef]
  35. Babou-Kammoe, R.; Hamoudi, S.; Larachi, F.; Belkacemi, K. Synthesis of CaCO3 nanoparticles by controlled precipitation of saturated carbonate and calcium nitrate aqueous solutions. Can. J. Chem. Eng. 2012, 90, 26–33. [Google Scholar] [CrossRef]
  36. Chen, J.-F.; Ding, H.-M.; Wang, J.-X.; Shao, L. Preparation and characterization of porous hollow silica nanoparticles for drug delivery application. Biomaterials 2004, 25, 723–727. [Google Scholar] [CrossRef]
  37. Iftikhar, A.; Khan, M.S.; Rashid, U.; Mahmood, Q.; Zafar, H.; Bilal, M.; Riaz, N. Influence of metallic species for efficient photocatalytic water disinfection: Bactericidal mechanism of in vitro results using docking simulation. Environ. Sci. Pollut. Res. 2020, 27, 39819–39831. [Google Scholar] [CrossRef]
  38. Riaz, N.; Hassan, M.; Siddique, M.; Mahmood, Q.; Farooq, U.; Sarwar, R.; Khan, M.S. Photocatalytic degradation and kinetic modeling of azo dye using bimetallic photocatalysts: Effect of synthesis and operational parameters. Environ. Sci. Pollut. Res. 2020, 27, 2992–3006. [Google Scholar] [CrossRef] [PubMed]
  39. Riaz, N.; Kait, C.F.; Man, Z.B.; Dutta, B.K.; Ramli, R.M.; Khan, M.S. Visible Light Photodegradation of Azo Dye by Cu/TiO2. In Advanced Materials Research; 2014; pp. 151–159. Available online: https://www.scientific.net/AMR.917.151 (accessed on 15 February 2021).
  40. Zazouli, M.A.; Mahvi, A.H.; Dobaradaran, S.; Barafrashtehpour, M.; Mahdavi, Y.; Balarak, D. Adsorption of fluoride from aqueous solution by modified Azolla filiculoides. Adsorption 2014, 47, 349–358. [Google Scholar]
  41. Freundlich, H.M.F. Over the adsorption in solution. J. Phys. Chem. 1906, 57, 385–471. [Google Scholar]
  42. Scherrer, P. Determination of the Internal Structure and Size of Colloidal Particles by Means of X-Rays. In Colloid Chemistry A Textbook. Chemical Technology in Single Representations; Springer: Berlin/Heidelberg, Germany, 1912; Available online: https://doi.org/10.1007/978-3-662-33915-2_7 (accessed on 21 April 2021).
  43. Mahramanlioglu, M.; Kizilcikli, I.; Bicer, I.O. Adsorption of fluoride from aqueous solution by acid treated spent bleaching earth. J. Fluor. Chem. 2002, 115, 41–47. [Google Scholar] [CrossRef]
  44. Vivek Vardhan, C.M.; Srimurali, M. Removal of fluoride from water using a novel sorbent lanthanum-impregnated bauxite. SpringerPlus 2016, 5, 1426. [Google Scholar] [CrossRef] [PubMed] [Green Version]
  45. Al-Ghouti, M.A.; Da’ana, D.A. Guidelines for the use and interpretation of adsorption isotherm models: A review. J. Hazard. Mater. 2020, 393, 122383. [Google Scholar] [CrossRef]
  46. Ahmadi, S.; Rahdar, S.; Igwegbe, C.A.; Rahdar, A.; Shafighi, N.; Sadeghfar, F. Data on the removal of fluoride from aqueous solutions using synthesized P/γ-Fe2O3 nanoparticles: A novel adsorbent. MethodsX 2019, 6, 98–106. [Google Scholar] [CrossRef] [PubMed]
  47. Naghizadeh, A.; Gholami, K. Bentonite and montmorillonite nanoparticles effectiveness in removal of fluoride from water solutions. J. Water Health 2017, 15, 555–565. [Google Scholar] [CrossRef] [PubMed] [Green Version]
  48. Kothari, C.R. Research Methodology: Methods and Techniques; New Age International: New Delhi, India, 2004. [Google Scholar]
  49. Kaushal, A.; Singh, S.K. Critical analysis of adsorption data statistically. Appl. Water Sci. 2017, 7, 3191–3196. [Google Scholar] [CrossRef] [Green Version]
  50. Meenakshi, S.; Viswanathan, N. Identification of selective ion-exchange resin for fluoride sorption. J. Colloid Interface Sci. 2007, 308, 438–450. [Google Scholar] [CrossRef]
  51. Raghav, S.; Kumar, D. Adsorption Equilibrium, Kinetics, and Thermodynamic Studies of Fluoride Adsorbed by Tetrametallic Oxide Adsorbent. J. Chem. Eng. Data 2018, 63, 1682–1697. [Google Scholar] [CrossRef]
  52. Shivaprasad, P.; Singh, P.K.; Saharan, V.K.; George, S. Synthesis of nano alumina for defluoridation of drinking water. Nano Struct. Nano Objects 2018, 13, 109–120. [Google Scholar] [CrossRef]
  53. Zhang, Y.; Xu, Q.; Zhang, S.; Liu, J.; Zhou, J.; Xu, H.; Xiao, H.; Li, J. Preparation of thiol-modified Fe3O4@SiO2 nanoparticles and their application for gold recovery from dilute solution. Sep. Purif. Technol. 2013, 116, 391–397. [Google Scholar] [CrossRef]
  54. Roto, R.; Yusran, Y.; Kuncaka, A. Magnetic adsorbent of Fe3O4@SiO2 core-shell nanoparticles modified with thiol group for chloroauric ion adsorption. Appl. Surf. Sci. 2016, 377, 30–36. [Google Scholar] [CrossRef]
  55. Wang, Z.; Xu, J.; Hu, Y.; Zhao, H.; Zhou, J.; Liu, Y.; Lou, Z.; Xu, X. Functional nanomaterials: Study on aqueous Hg(II) adsorption by magnetic Fe3O4@SiO2-SH nanoparticles. J. Taiwan Inst. Chem. Eng. 2016, 60, 394–402. [Google Scholar] [CrossRef]
  56. Ding, H.; Zhao, Y.; Duan, Q.; Wang, J.; Zhang, K.; Ding, G.; Xie, X.; Ding, C. Efficient removal of phosphate from aqueous solution using novel magnetic nanocomposites with Fe3O4@SiO2 core and mesoporous CeO2 shell. J. Rare Earths 2017, 35, 984–994. [Google Scholar] [CrossRef]
  57. Yimin, D.; Jiaqi, Z.; Danyang, L.; Lanli, N.; Liling, Z.; Yi, Z.; Xiaohong, Z. Preparation of Congo red functionalized Fe3O4@SiO2 nanoparticle and its application for the removal of methylene blue. Colloids Surf. A Physicochem. Eng. Asp. 2018, 550, 90–98. [Google Scholar] [CrossRef]
  58. Shamsizadeh, Z.; Ehrampoush Mohammad, H.; Dehghani Firouzabadi, Z.; Jasemi Zad, T.; Molavi, F.; Ebrahimi Ali, A.; Kamranifar, M. Fe3O4@SiO2 magnetic nanocomposites as adsorbents for removal of diazinon from aqueous solution: Isotherm and kinetic study. Pigment Resin Technol. 2020, 49, 457–464. [Google Scholar] [CrossRef]
  59. Asab, G.; Zereffa, E.A.; Abdo Seghne, T. Synthesis of Silica-Coated Fe3O4 Nanoparticles by Microemulsion Method: Characterization and Evaluation of Antimicrobial Activity. Int. J. Biomater. 2020, 2020, 4783612. [Google Scholar] [CrossRef] [PubMed] [Green Version]
  60. Andrade, A.L.; Souza, D.M.; Pereira, M.C.; Fabris, J.D.; Domingues, R.Z. Synthesis and characterization of magnetic nanoparticles coated with silica through a sol-gel approach. Cerâmica 2009, 55, 420–424. [Google Scholar] [CrossRef] [Green Version]
  61. Prabhu, Y.T.; Rao, K.V.; Kumari, B.S.; Kumar, V.S.S.; Pavani, T. Synthesis of Fe3O4 nanoparticles and its antibacterial application. Int. Nano Lett. 2015, 5, 85–92. [Google Scholar] [CrossRef]
  62. Shagholani, H.; Ghoreishi, S.M.; Mousazadeh, M. Improvement of interaction between PVA and chitosan via magnetite nanoparticles for drug delivery application. Int. J. Biol. Macromol. 2015, 78, 130–136. [Google Scholar] [CrossRef]
  63. Cullity, B.D. Elements of X-ray Diffraction; Addison-Wesley Publishing: Boston, MA, USA, 1956. [Google Scholar]
Figure 1. Screening and optimization studies of fluoride adsorption using synthesized NCs against various parameters. (a) Comparison of blanks using Fe3O4, SiO2, and 0.5-Fe-Si-5 NCs. (b) Effect of calcination temperature using Fe3O4-SiO2 calcined at 300 °C and 500 °C. (c) Effect of contact time (min) using nanoparticles (Fe3O4 and SiO2) and their best performing 0.5-Fe-Si-5 NCs. (d) Effect of adsorbent dose (0–1.0 g L−1) using 0.5-Fe-Si-5 NCs. (e) Effect of initial fluoride concentrations (mg L−1) using 0.5-Fe-Si-5 NCs. (f) Fluoride quantity (Qe) adsorbed at various initial fluoride concentrations (1–20 mg L−1) vs. time.
Water 13 01514 g001
Figure 2. Probability chart for t distribution of 2-tailed test for the effect of dose and different fluoride concentrations.
Water 13 01514 g002
Figure 3. (a) Plot of Qe vs. Ce (b) Langmuir (c) Freundlich adsorption isotherm of fluoride using 0.5 Fe-Si-5.
Water 13 01514 g003
Figure 4. An SEM micrograph of Fe3O4 nanoparticles (1-A) and related SiO2 nanocomposites (1-B) (calcined at 500 °C) at different resolutions.
Water 13 01514 g004
Figure 5. FTIR spectra of Fe3O4 nanoparticles and related SiO2 nanocomposites (raw and calcined at 300 °C and 500 °C).
Water 13 01514 g005
Figure 6. XRD patterns of Fe3O4 nanoparticles, SiO2, and related SiO2 nanocomposites calcined at 300 °C and 500 °C.
Water 13 01514 g006
Publisher’s Note: MDPI stays neutral with regard to jurisdictional claims in published maps and institutional affiliations.

