
Modeling Shallow Urban Groundwater at Regional and Local Scales: A Case Study in Detroit, MI

Department of Civil and Environmental Engineering, College of Engineering, Wayne State University, 5050 Anthony Wayne Drive, Detroit, MI 48202, USA
*
Author to whom correspondence should be addressed.
Water 2021, 13(11), 1515; https://doi.org/10.3390/w13111515
Submission received: 24 April 2021
/
Revised: 19 May 2021
/
Accepted: 25 May 2021
/
Published: 28 May 2021
(This article belongs to the Special Issue Urban Hydrogeology Studies)
Abstract
:Groundwater plays a significant role in the vitality of the Great Lakes Basin, supplying water for various sectors. Due to the interconnection of groundwater and surface water features in this region, the groundwater quality can be affected, leading to potential economic, political, health, and social issues for the region. Groundwater resources have received less emphasis, perhaps due to an “out of sight, out of mind” mentality. The incomplete characterization of groundwater, especially shallow, near-surface waters in urban centers, is an added source of environmental vulnerability for the Great Lakes Basin. This paper provides an improved understanding of urban groundwater to reduce this vulnerability. Towards that end, two approaches for improved characterization of groundwater in southeast Michigan are employed in this project. In the first approach, we construct a regional groundwater model that encompasses four major watersheds to define the large-scale groundwater features. In the second approach, we adopt a local scale and develop a local urban water budget with subsequent groundwater simulation. The results show the groundwater movement in the two different scales, implying the effect of urban settings on the subsurface resources. Both the regional and local scale models can be used to evaluate and mitigate environmental risks in urban centers.
1. Introduction
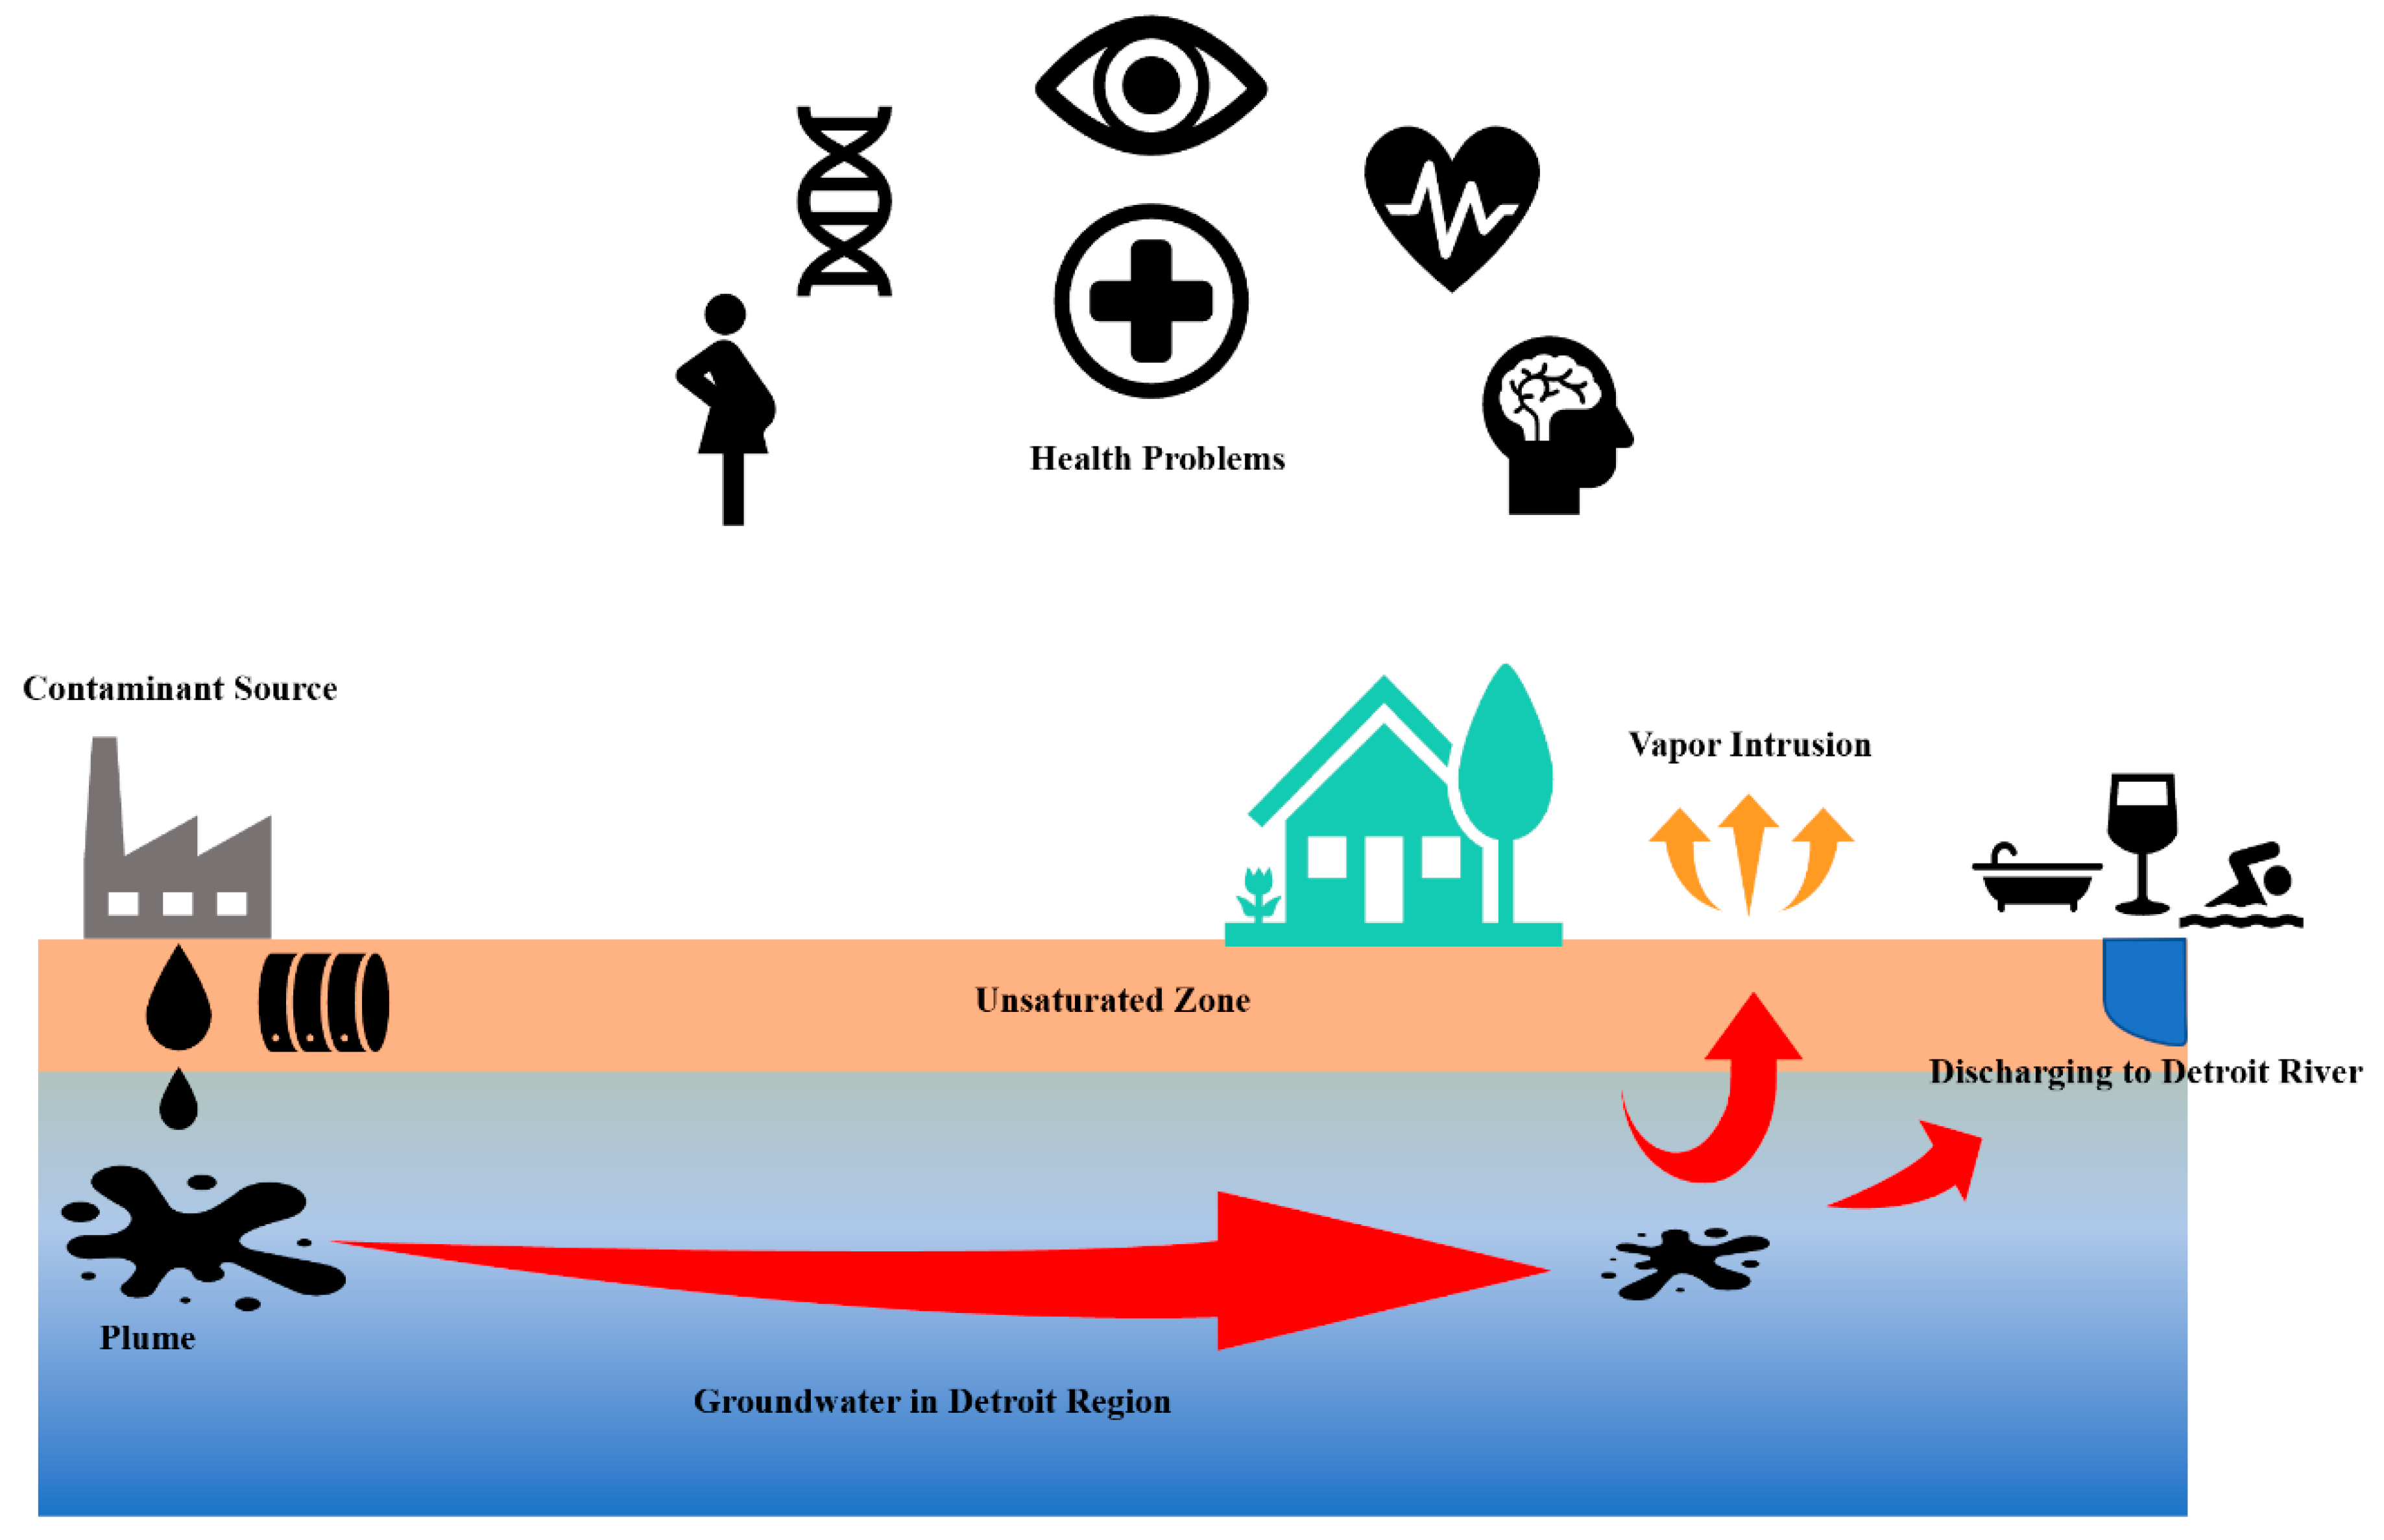
Groundwater serves a vital role in supplying drinking water and providing essential services such as cooling water for power generation, irrigation water for farms and landscapes, and industrial water in the Great Lakes Basin (GLB). Groundwater quality issues can lead to environmental and human health problems and can challenge environmental management. Groundwater exists in hidden natural reservoirs (aquifers) that gradually deliver water to many other surface water resources such as lakes, streams, and wetlands. Due to groundwater’s slow transport rates and the lack of a visible interface, there is often a tremendous lag between a contamination incident and the recognition of a problem [1]. To that end, protecting and remediating groundwater is often far more complex and costly than the same efforts for surface water bodies [2,3,4]. Regulatory efforts on groundwater primarily focus on contamination from hazardous chemicals and typically rely on a site-by-site approach. The high financial cost and piecemeal approach to groundwater remediation has led to a research gap in understanding of urban groundwater movement in cities that rely on surface water in the GLB [5]. This study reviews known and expanding information about groundwater resources in the Detroit metro region, the principal urban area in Michigan, as well as one of the largest in the GLB. In this region, groundwater is recharged almost entirely from rainfall and snowmelt that infiltrates down to the water table. The hydrologic interconnection between the groundwater and surface water systems leads to the mixing of subsurface and surface contaminants. Examples of these subsurface contaminants are volatile organic compounds (VOCs), polychlorinated biphenyls (PCBs), polynuclear aromatic compounds (PNAs), and metals [6]. Groundwater, therefore, can serve as a pollutant transport mechanism and can ultimately expose Detroiters to contaminants such as VOCs via numerous routes, including vapor intrusion and ingestion [7,8,9] (Figure 1). Ingestion can occur through direct consumption of vegetation “fed” by contaminated vadose zone water or by consuming water impacted by groundwater contamination [10,11,12].
The quality of urban groundwater is critical as it can influence human health issues. Groundwater in areas such as Detroit with shallow urban groundwater systems is physically near human activities and can contribute to short exposure routes due to the short vertical distances. Urban disturbances influence subsurface hydrologic pathways, which make understanding subsurface exposure routes difficult [13,14]. While there has been some research performed on the groundwater quality in southeast Michigan [15,16,17,18,19,20], further studies are required to evaluate migration pathways and contaminants in shallow urban groundwater. For example, the VOCs group is one of these chemical pollutants, of which the adverse impacts of their pathways on human health are well-documented [21,22,23,24,25]. Preterm birth is a crucial health issue within the Detroit region [26]. Detroit has the nation’s highest preterm birth rate among America’s largest cities in 2018 [27]. A recent study links VOC exposure to higher preterm birth rates [28]. Therefore, a comprehensive investigation of groundwater to evaluate groundwater flow direction, transmissivity, and the depth of the water table is imperative to explain urban water pathways.
This paper aims to describe the urban shallow groundwater of the metro Detroit region by utilizing public data from multiple sources to generate a series of models at differing resolutions. This paper includes a review of the geologic setting and the development of two groundwater models at regional and local scales aimed to provide an initial assessment of urban water movement in coastal Great Lakes cities. Through developing an understanding of groundwater, potential pollutant exposure pathway risks posed to urban environments and human health are better understood.
2. Materials and Methods
Regional and local modeling provide a baseline to assess urban groundwater in southeast Michigan. Regional datasets for southeast Michigan were assessed to provide a general understanding of groundwater flow direction, discharge, and depth to groundwater. A narrower, neighborhood-scale evaluation was completed for RecoveryPark, providing a case study to evaluate localized urban water budgets and local-scale groundwater flow. Both datasets provide useful but different contributions to the understanding of urban groundwater movement.
The paper highlights the use of readily available data from multiple sources to understand groundwater movement at the regional and local scales. While there is no comprehensive database for urban shallow subsurface information, there are several studies and data centers that provide information regarding urban groundwater movement. This paper brings data together from historical well logs, current ongoing field studies, and simulations to provide both a regional and local understanding of shallow subsurface groundwater movement in Metro Detroit. MODFLOW [29] was used to simulate the steady-state groundwater head distributions for both the regional- and local-scale applications. ESRI ArcMap 10.7.1 was used for data interpolation and mapping.
2.1. Southeast Michigan Regional and Local Field Setting
Within the Detroit regional watershed, the subsurface sediment layers are dominated by a large clay diamicton [6,30,31], which supports the presence of shallow groundwater. The amount of water transferring through this shallow system is not well-quantified since most of the historic water resource studies have focused on deep groundwater systems occurring at depths of more than six meters. Although the shallow groundwater does not supply a significant source of drinking water for the residents in Detroit, the position of the groundwater table can significantly affect the design and requirements of sewer systems, drinking water networks, and surface infrastructures. More importantly, the depth of the groundwater table directly controls the thickness of the vadose zone and the separation distance between surface features and groundwater features.
2.1.1. Regional Scale: General Depositional Environment and Drainage Characteristics
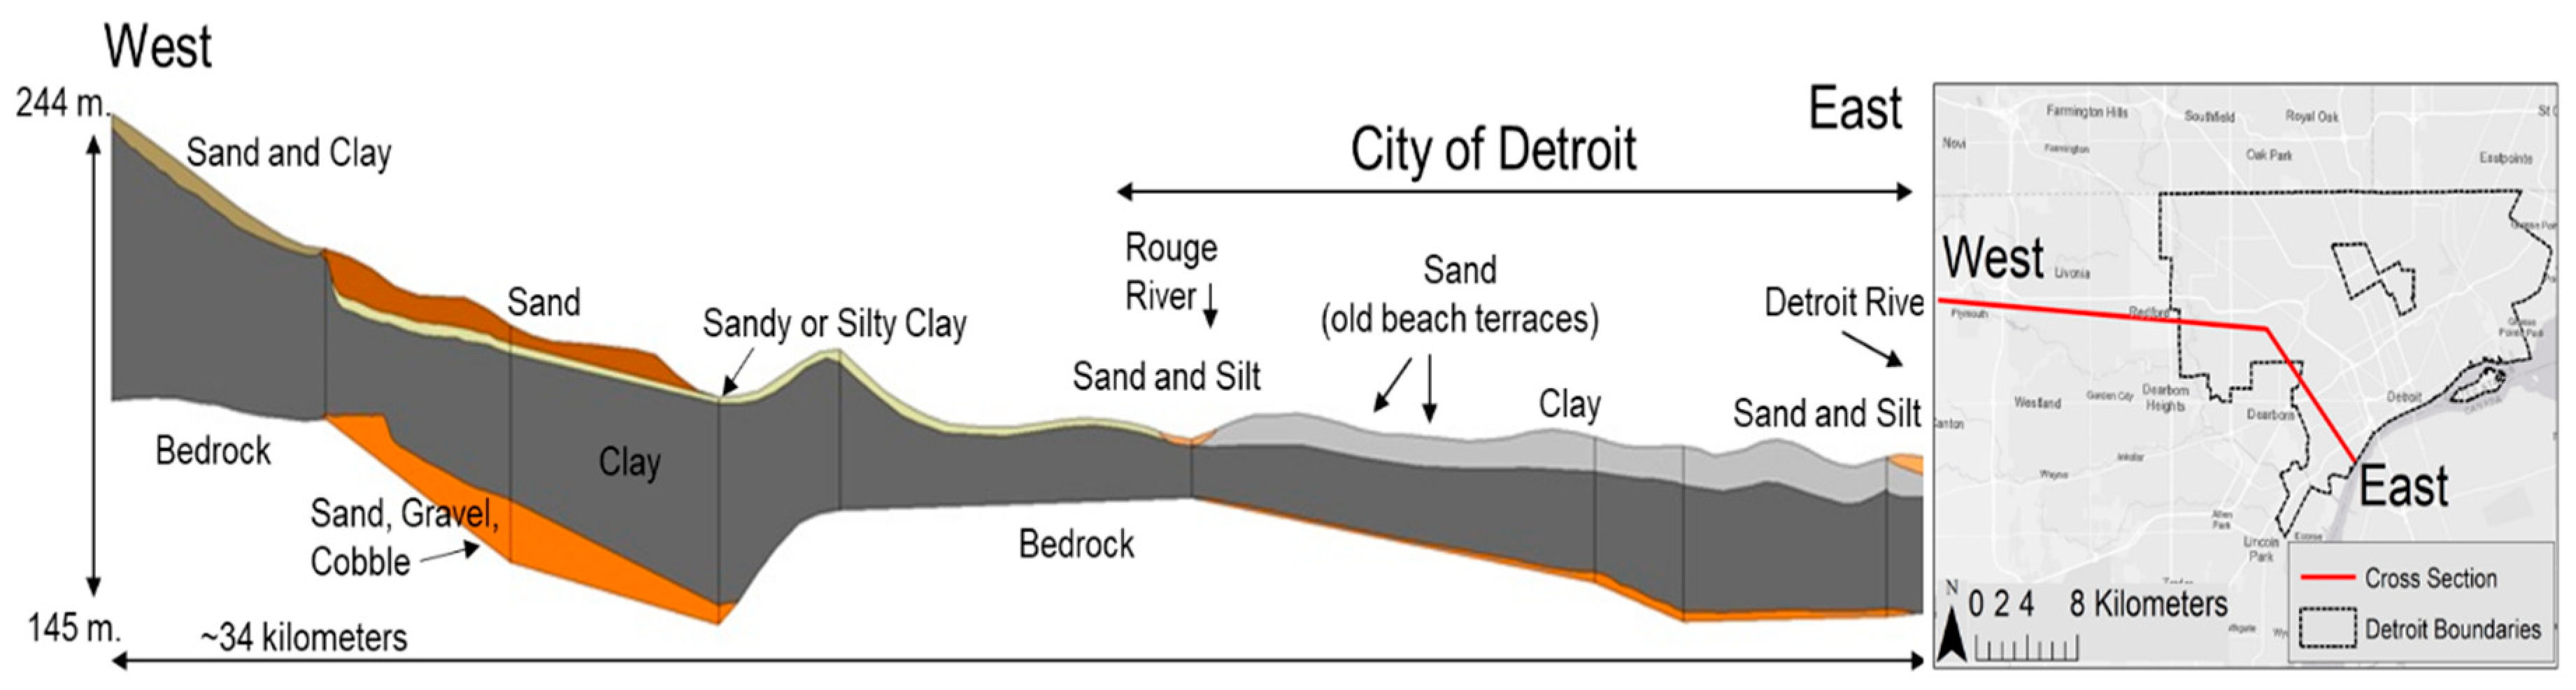
The Detroit metropolitan area predominantly overlies glacial lacustrine deposits producing scattered small to moderate quantities of water in some locations [20]. Detroit’s till dates from the Wisconsian age and varies in thickness and composition [32]. As shown in Figure 2, the thickness of glacial sediments gradually decreases to the southeast and the area along south to the east is mainly clay mixed with isolated beaches, terraces, and lenses of gravel and sand [30,31]. The glacial drift of the region consists of irregular beds of gravel, sand, silt, and clay [6] and may be cemented by iron oxide or carbonate. In southeast Michigan, the bedrock consists of Devonian age Antrim Shale, Traverse Group, which is a mix of shale and limestone, Dundee Limestone, and Detroit River Dolomite. Given the thickness of the clay lacustrine deposits, clay composition hydrologically generates a disconnected media in the deposits underground. The bedrock underlying the Detroit metropolitan area is not a reliable source of groundwater due to the low permeability of the soil and poor water quality.
Historical hydrogeological studies relied on water well logs and surficial and bedrock geologic maps. These studies were primarily conducted for groundwater exploitation and did not typically address near-surface aquifers because they were not generally considered potential potable water sources. Leverett [33] conducted the first detailed study of the groundwater resources of southeastern Michigan. Leverett’s study was prompted by a potential shortage of available groundwater resources in the central and eastern portions of Wayne County. Hydrogeologic studies of southeastern Michigan rely primarily on water well logs. The reliability of these water well logs is limited by the lack of uniformity among drillers, absence of detailed subsurface lithologic descriptions, and insufficient geographic distribution of wells. The stratigraphic correlation of near-surface sediments in southeastern Michigan is complicated because of the complex nature of sedimentation by both ice and water [34]. Groundwater flows toward the surface water within the sand units, and if present, is generally found at a depth ranging from ~one to three meters from the land surface [6,31]. However, in Metro Detroit, the perched or discontinuous groundwater is usually encountered in the upper one meter due to the predominant underlying clay unit. Mozola [30] suggested that the source of groundwater recharge for sand, gravel, and coble layer may be the Defiance Moraine; however, this has not been confirmed. Howard [32] presented a surficial geologic map of the Detroit quadrangle, which can serve as a framework for assessing and redeveloping future urban sites. The final maps, including stratigraphic sections and soil layers across Metro Detroit, are useful for expanded studies on groundwater and the vadose zone beneath this region.
2.1.2. Local Scale: RecoveryPark Field Site
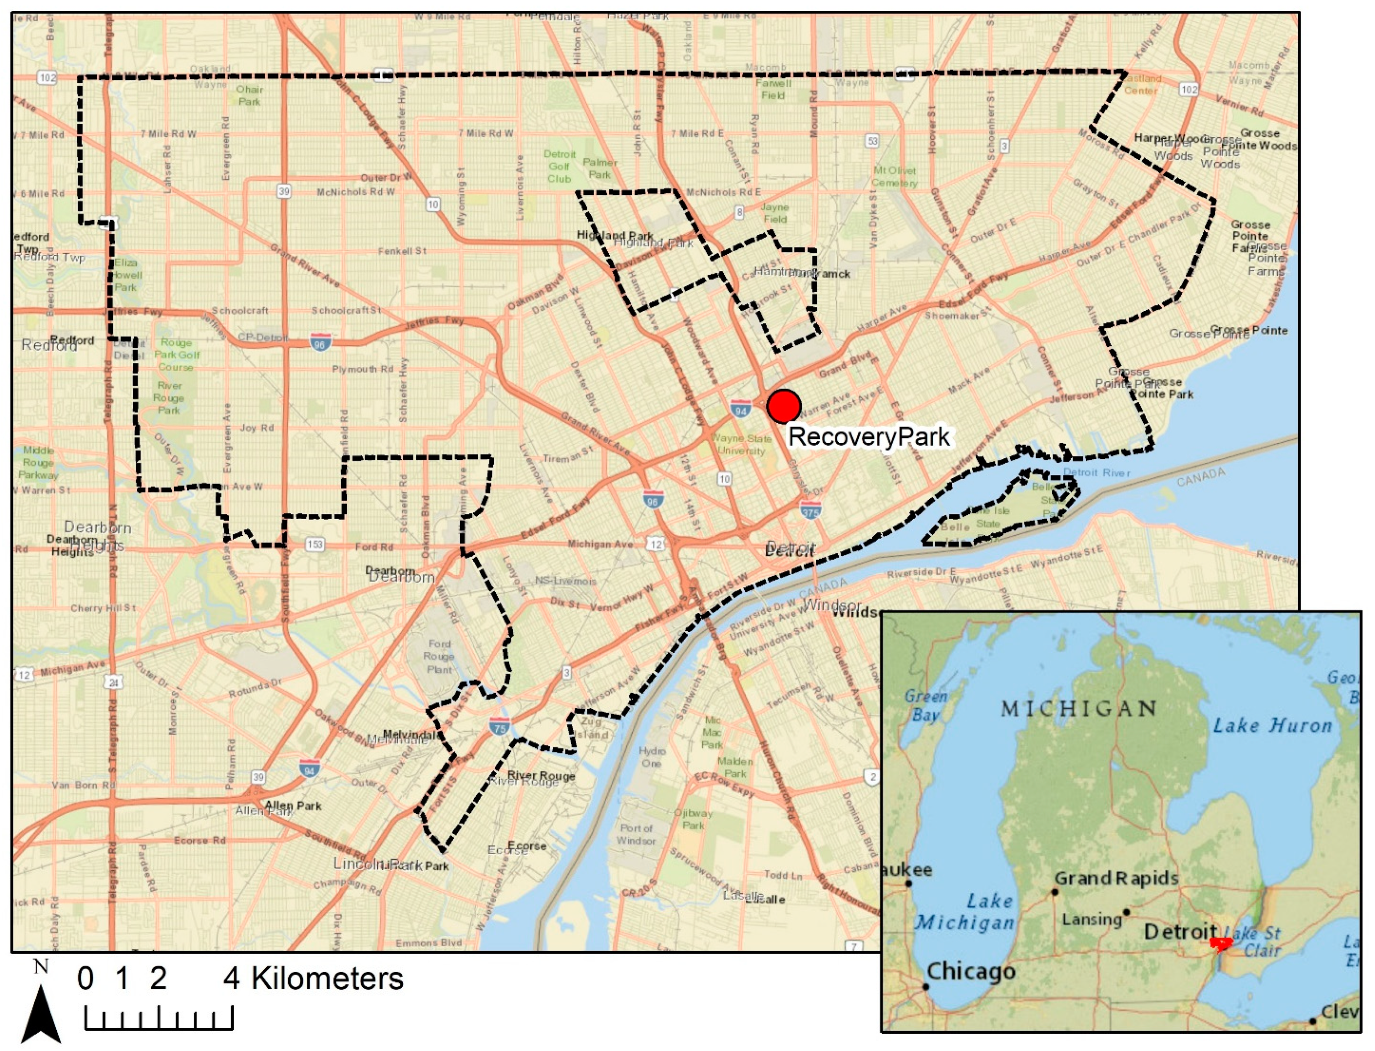
RecoveryPark is a nonprofit urban farm in the Poletown neighborhood of Detroit that provides local agricultural employment for residents [35] (Figure 3). While RecoveryPark is located in an urban neighborhood, a majority of the lots are cleared of debris and vacant. Apart from the existing or historic utility infrastructure and building basements, no other major subsurface features are present.
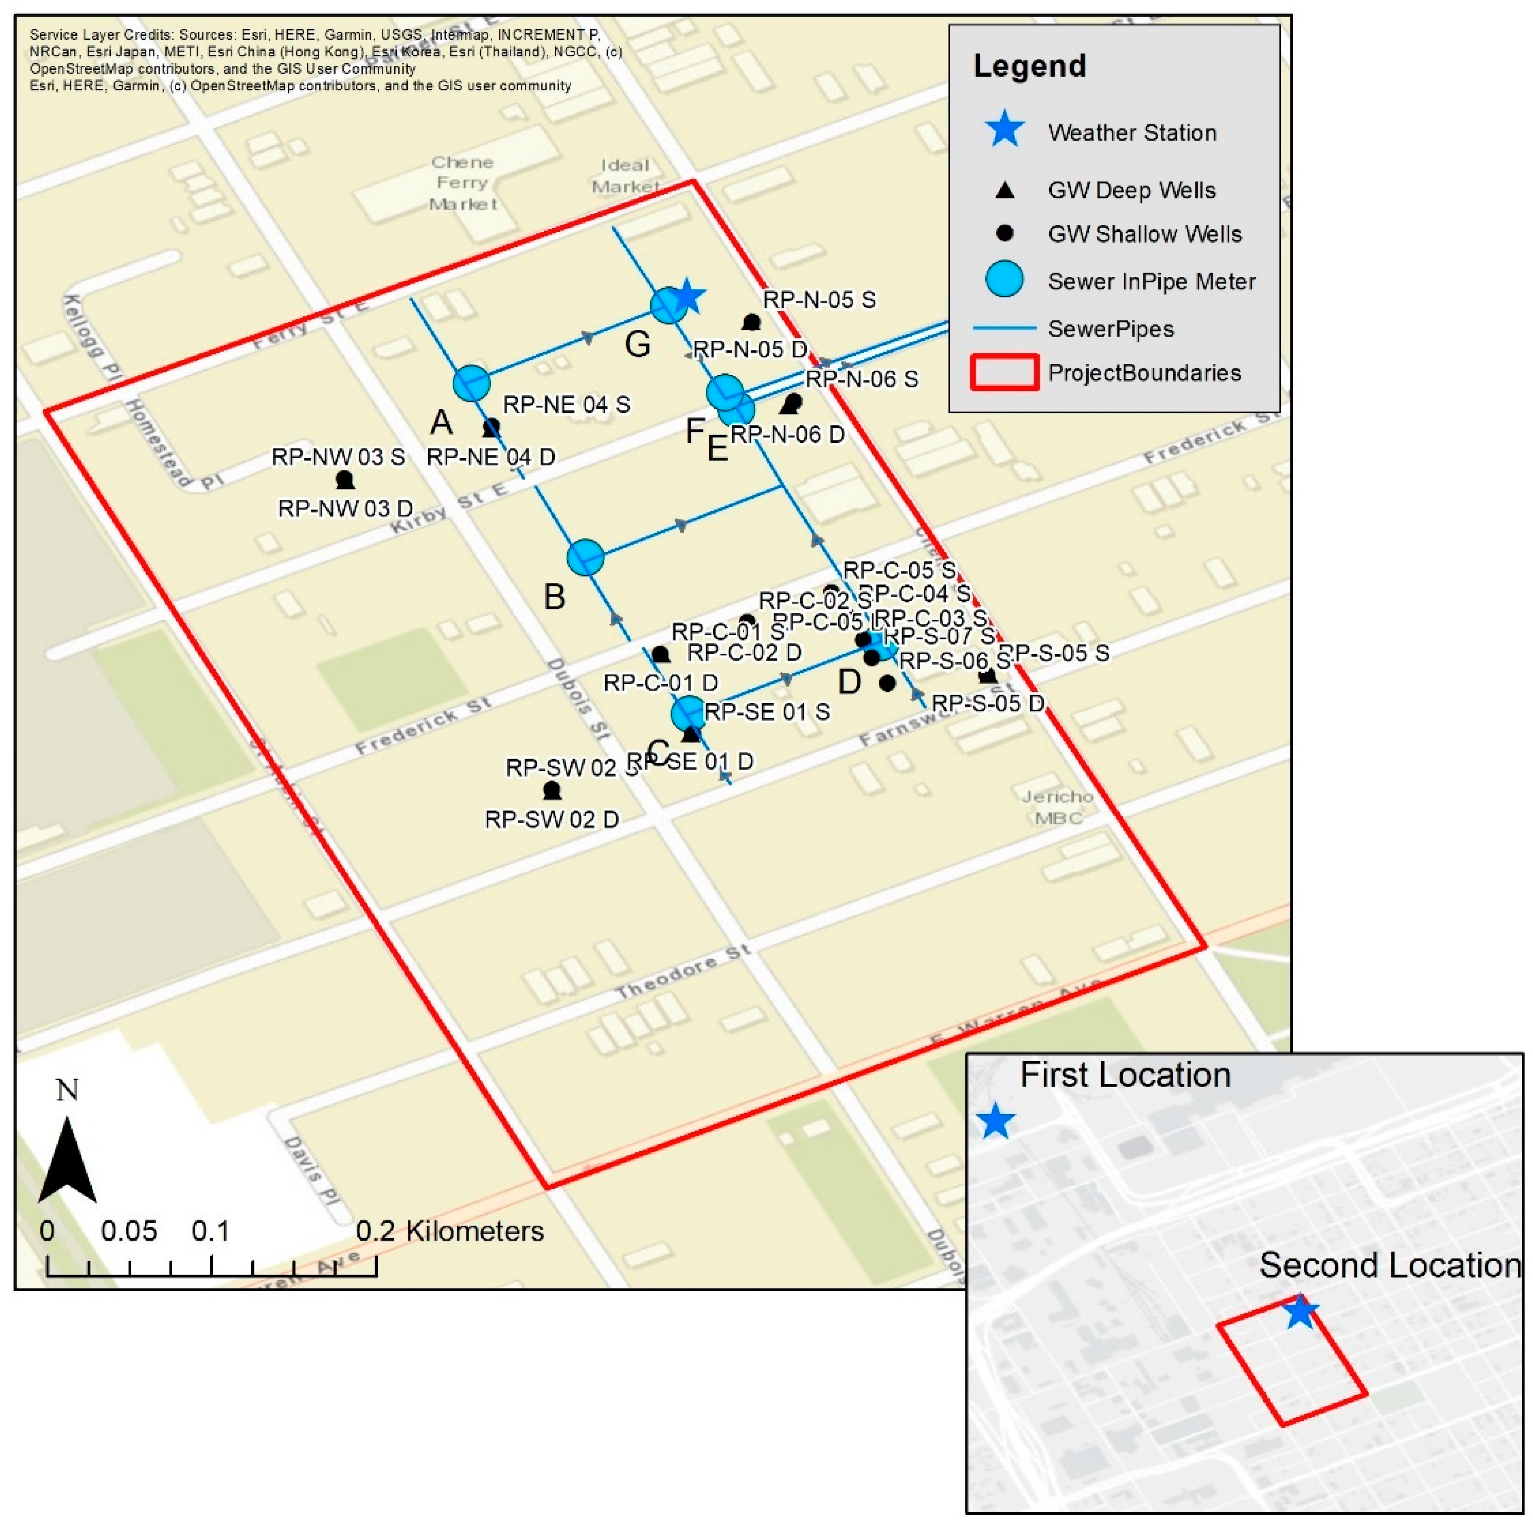
The United States Geological Survey (USGS) and the United States Environmental Protection Agency (USEPA) collaborated to study the effectiveness of green stormwater infrastructure (GSI) at this site since 2014. A water cycle monitoring approach was used to assess the role of GSI in a larger hydrologic context. The property includes a weather station and the only publicly available groundwater wells in the city of Detroit. The weather station was initially located north of the study (first location: 2014 to 2017) and then was moved to its current onsite location during fall 2017 (second location: 2017 to present). Soil boring data and in-pipe flow meter data from the site are available from the Detroit Water and Sewage Department (DWSD). Overall, there are 23 groundwater wells and seven in-pipe sewer meters spread over a area (Figure 4). The onsite sewer lines appearing in Figure 4 transported only local sewage (no off-site areas contributed), and the sewer output all flowed through meters E and F before exiting the study boundaries. Soil moisture sensors were added to the field equipment in 2017 and are located near the weather station. The location and head value of observation wells are also presented in Table 1.
RecoveryPark is a unique urban study area in that it includes one of the only urban well fields in the Great Lakes Basin [36]. The insights gleaned from this location offer a detailed understanding of one localized neighborhood but still does not remedy the larger regional knowledge gap. The lack of publicly available urban well data presents issues for groundwater mapping both at the regional and local scales. This problem is not unique to the metropolitan Detroit region. Most major cities in the United States lack open-source groundwater field data [5].

Table 1.
Location and head value of observation wells at RecoveryPark (USGS [37]).
Table 1.
Location and head value of observation wells at RecoveryPark (USGS [37]).
| Type | Name | Alias | X 1 | Y 1 | Top Elevation 2,3 (m) | Depth to Water Table (m) | Observed Value (m) |
|---|---|---|---|---|---|---|---|
| Deeper Observation Wells | RP-C-01 D | C1D | −83.0437139 | 42.3672917 | 192.27698 | 1.8212 | 190.4558 |
| RP-C-02 D | C2D | −83.0432556 | 42.3674583 | 192.10325 | 1.0790 | 191.0243 | |
| RP-C-05 D | C5D | −83.0427917 | 42.3676222 | 191.9417 | 1.3122 | 190.6295 | |
| RP-N-05 D | N5D | −83.0432250 | 42.3691139 | 192.32948 | 2.4201 | 189.9094 | |
| RP-N-06 D | N6D | −83.0430194 | 42.3686500 | 191.44782 | 1.4356 | 190.0122 | |
| RP-S-05 D | S5D | −83.0419250 | 42.3671778 | 191.65519 | 1.9111 | 189.7441 | |
| RP-SE-01 D | SE1D | −83.0435528 | 42.3668583 | 192.49644 | 1.3457 | 191.1507 | |
| RP-SW-02 D | SW2D | −83.0443111 | 42.3665417 | 193.4044 | 2.2906 | 191.1138 | |
| RP-NE-04 D | NE4D | −83.0446444 | 42.3685250 | 192.13373 | 1.9126 | 190.2211 | |
| RP-NW-03 D | NW3D | −83.0430194 | 42.3686500 | 192.90198 | No data recorded | No data recorded | |
| Shallow Observation Wells | RP-C-01 S | C1S | −83.0437194 | 42.3672889 | 192.27394 | 0.6614 | 191.6125 |
| RP-C-02 S | C2S | −83.0432444 | 42.3674611 | 191.28435 | 0.1798 | 191.1045 | |
| RP-C-03 S | C3S | −83.0426111 | 42.3673639 | 192.60767 | 1.7450 | 190.8627 | |
| RP-C-04 S | C4S | −83.0427000 | 42.3674972 | 191.92951 | 1.0973 | 190.8322 | |
| RP-N-05 S | N5S | −83.0432194 | 42.3691056 | 192.40397 | 2.0604 | 190.3435 | |
| RP-N-06 S | N6S | −83.0429889 | 42.3686722 | 191.44349 | 0.9876 | 190.4559 | |
| RP-NE-04 S | NE4S | −83.0446444 | 42.3685333 | 192.48642 | 1.4722 | 191.0142 | |
| RP-NW-03 S | NW3S | −83.0454500 | 42.3682472 | 192.35318 | 1.1841 | 191.1690 | |
| RP-S-05 S | S5S | −83.0419333 | 42.3671750 | 191.63081 | 0.8915 | 190.7393 | |
| RP-S-06 S | S6S | −83.0424778 | 42.3671306 | 192.50219 | 1.7054 | 190.7968 | |
| RP-SW-02 S | SW2S | −83.0443139 | 42.3665472 | 193.04669 | 1.4402 | 191.6065 | |
| RP-SE-01 S | SE1S | −83.0435444 | 42.3668500 | 192.50558 | 0.7254 | 191.7802 | |
| RP-S-07 S | S7S | −83.0425611 | 42.3672667 | 192.8624 | 1.9888 | 190.8736 | |
| RP-C-05 S | C5S | −83.0427833 | 42.3676250 | 191.9824 | 1.0287 | 190.9537 |
1 NAD83. 2 above NAVD88. 3 Land surface elevation has been adjusted based on the surface elevation raster data applied to the model.
2.2. Regional Scale Groundwater Model: Metro Detroit Watersheds
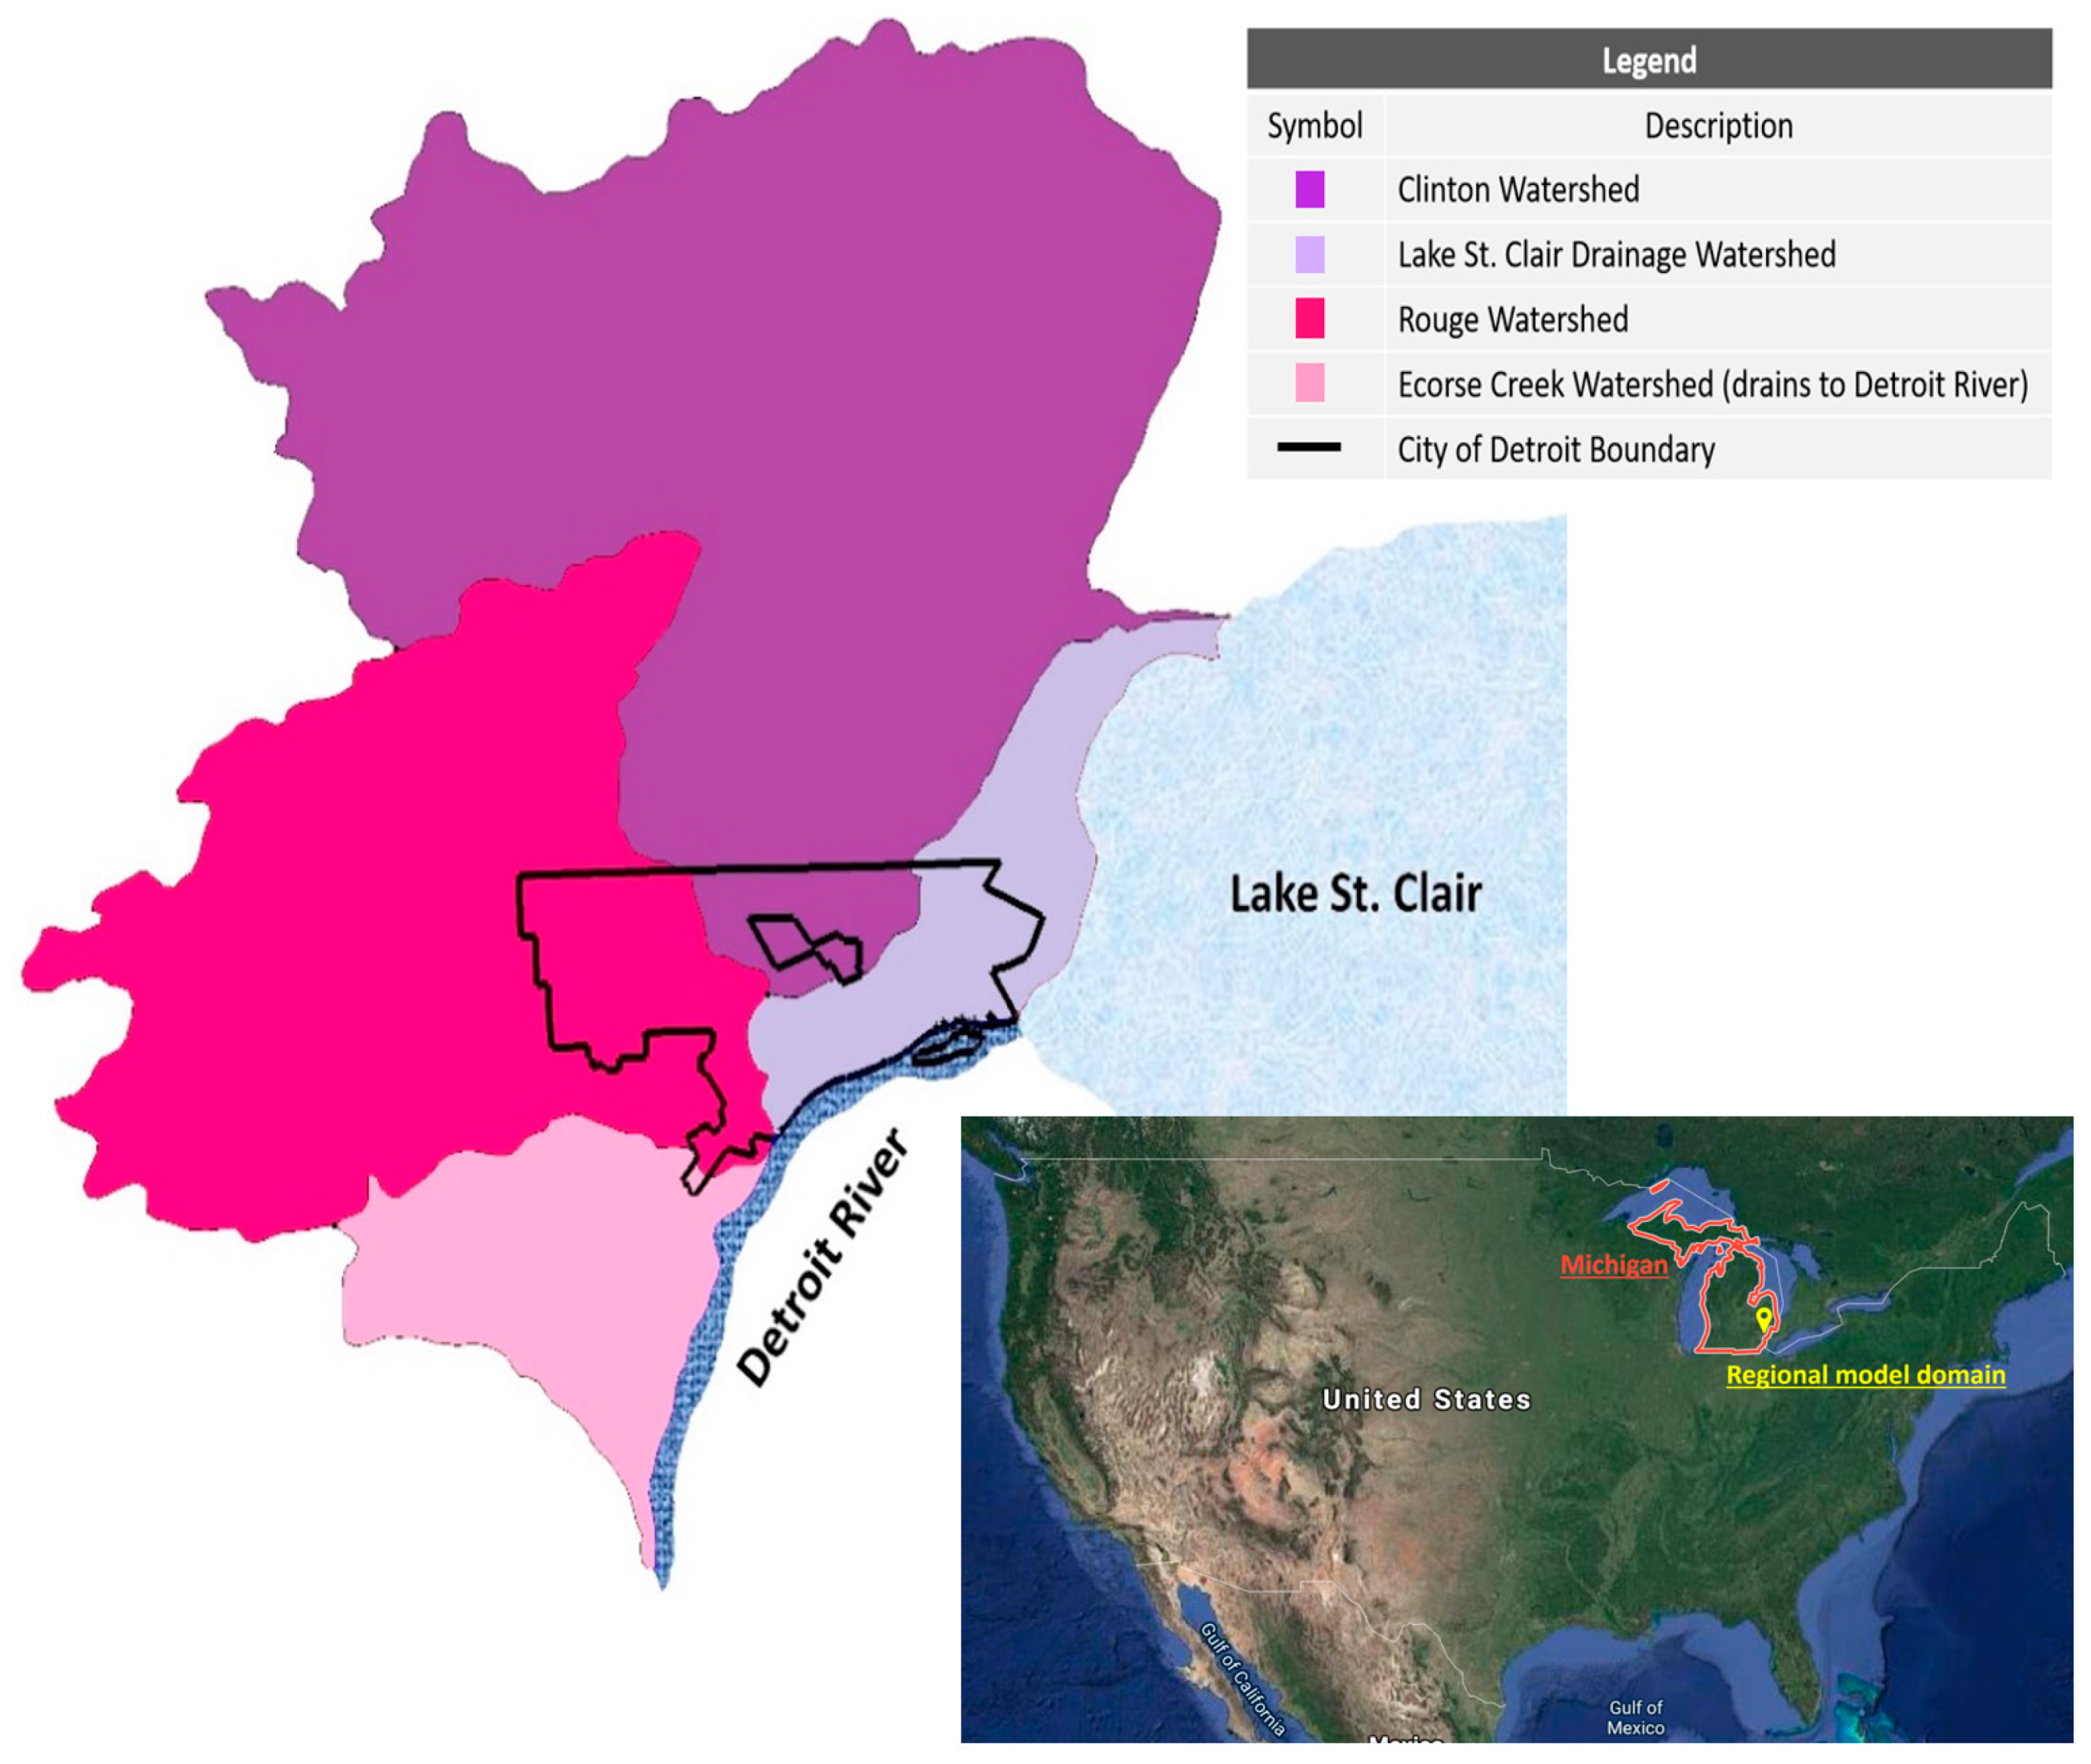
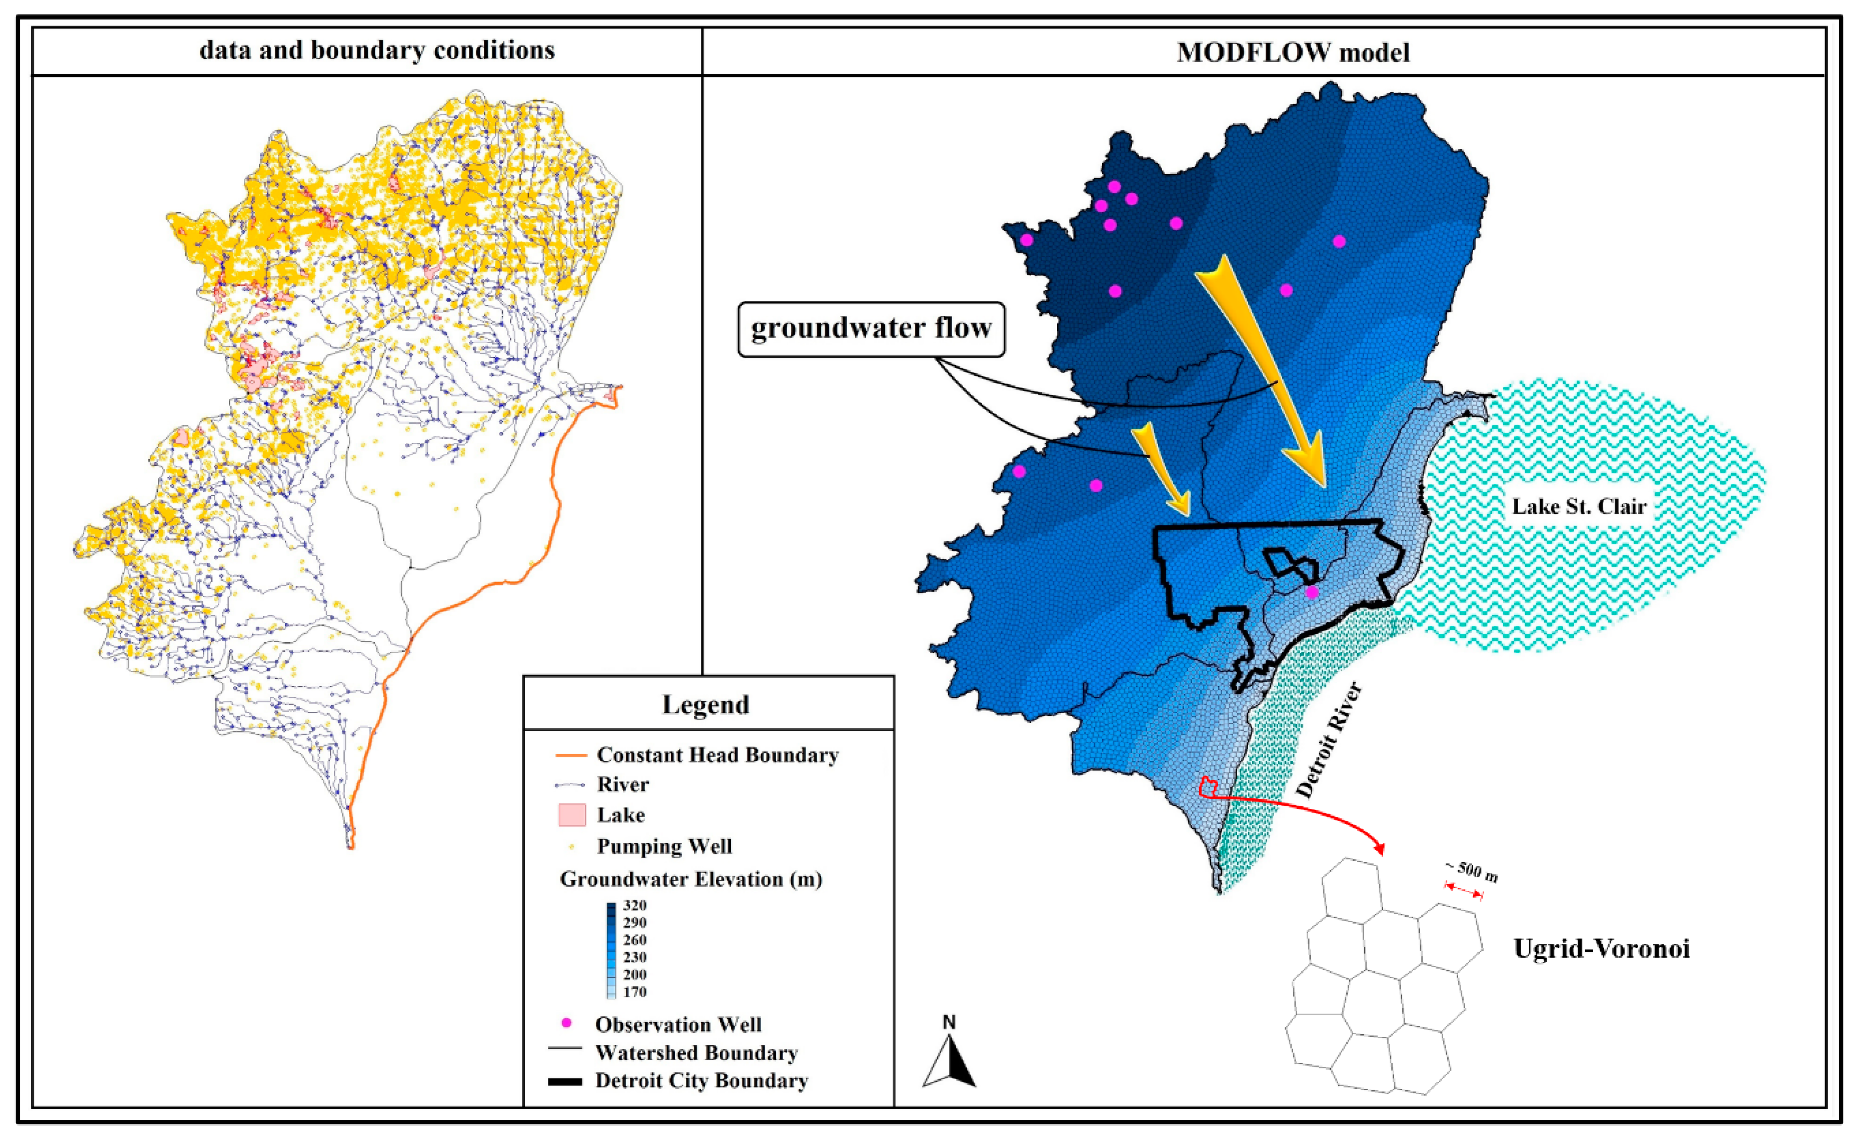
The focus of this investigation is metropolitan Detroit, with an area of 3850.32 and encompassing four major watersheds, all discharging to the Detroit River. The four watersheds (Clinton, Lake St. Clair, Rouge, and Ecorse Creek) are shown in Figure 5. In this region, sink and source elements, including precipitation, evapotranspiration, pumping wells, rivers, and lakes, affect the groundwater flow, quantity, and quality. The values of hydraulic conductivity are obtained from the borehole logs dataset [6,37] and presented in Table 2 for all five units simulated in the model. The ratio of anisotropy is assumed to be equal to 1 for all five soil units. Precipitation and evapotranspiration values are available from the USGS [37] data sources; average annual rates are used in these simulations. In order to simulate the groundwater recharge coming from surface waters, the head stages for the two main rivers of the region, Clinton River and Rouge River, are obtained from the USGS [37] and applied to the model. Furthermore, lake water surface and bottom elevation datasets are collected from the Michigan Department of Natural Resources [38] and applied to all 47 lakes, which have an area greater than 0.3 . Pumping well data were obtained from groundwater datasets for Michigan [39] and categorized into five groups, including industrial, irrigation, household, commercial/institutional, and public-supply wells. Within the study area, there are 12,866 active pumping wells, mostly located in the northwestern portion of the study area.
The developed conceptual model of regional groundwater contains the shape, discharge and recharge sources, and boundary conditions, including general head boundary (representing water elevation at Lake St. Clair and Detroit River) and no-flow boundary. The model grid is set up in one layer with 10,584 active cells of various sizes and shapes (Ugrid–Voronoi [40]). The surface elevation ranges from ~173 m in the southeast to ~325 m in the northwest (NAVD88), while the bottom elevation ranges from ~144 m to ~282 m. Due to the lack of transient data of pumping wells, the simulation is conducted in a steady state.
Figure 5.
The boundary of Detroit and watersheds in the study area (regional model domain) [41].
Figure 5.
The boundary of Detroit and watersheds in the study area (regional model domain) [41].

The regional groundwater model has been developed to evaluate the groundwater head distribution based on the control volume finite difference (CVFD) formulation using MODFLOW-USG [42]. Groundwater Modeling System 10.3.2 (GMS) was used as the pre- and post-processing software tool to construct and run the MODFLOW model. Datasets needed for this model include meteorological (precipitation, evaporation, etc.), hydraulic and geochemical attributes, and topographic elevation.
2.3. Local Scale Model: RecoveryPark
RecoveryPark is outfitted with a real-time weather station that includes multiple instruments. The weather station is comprised of a Campbell Scientific evapotranspiration station (ET-107), solar radiation sensor (CS305-ET), air temperature and relative humidity probe (HMP60-ETS), tipping bucket rain gage (TE525-ET), and wind set (034B-ETM), combining a three-cup anemometer and vane into a single integrated package to measure wind speed and direction.
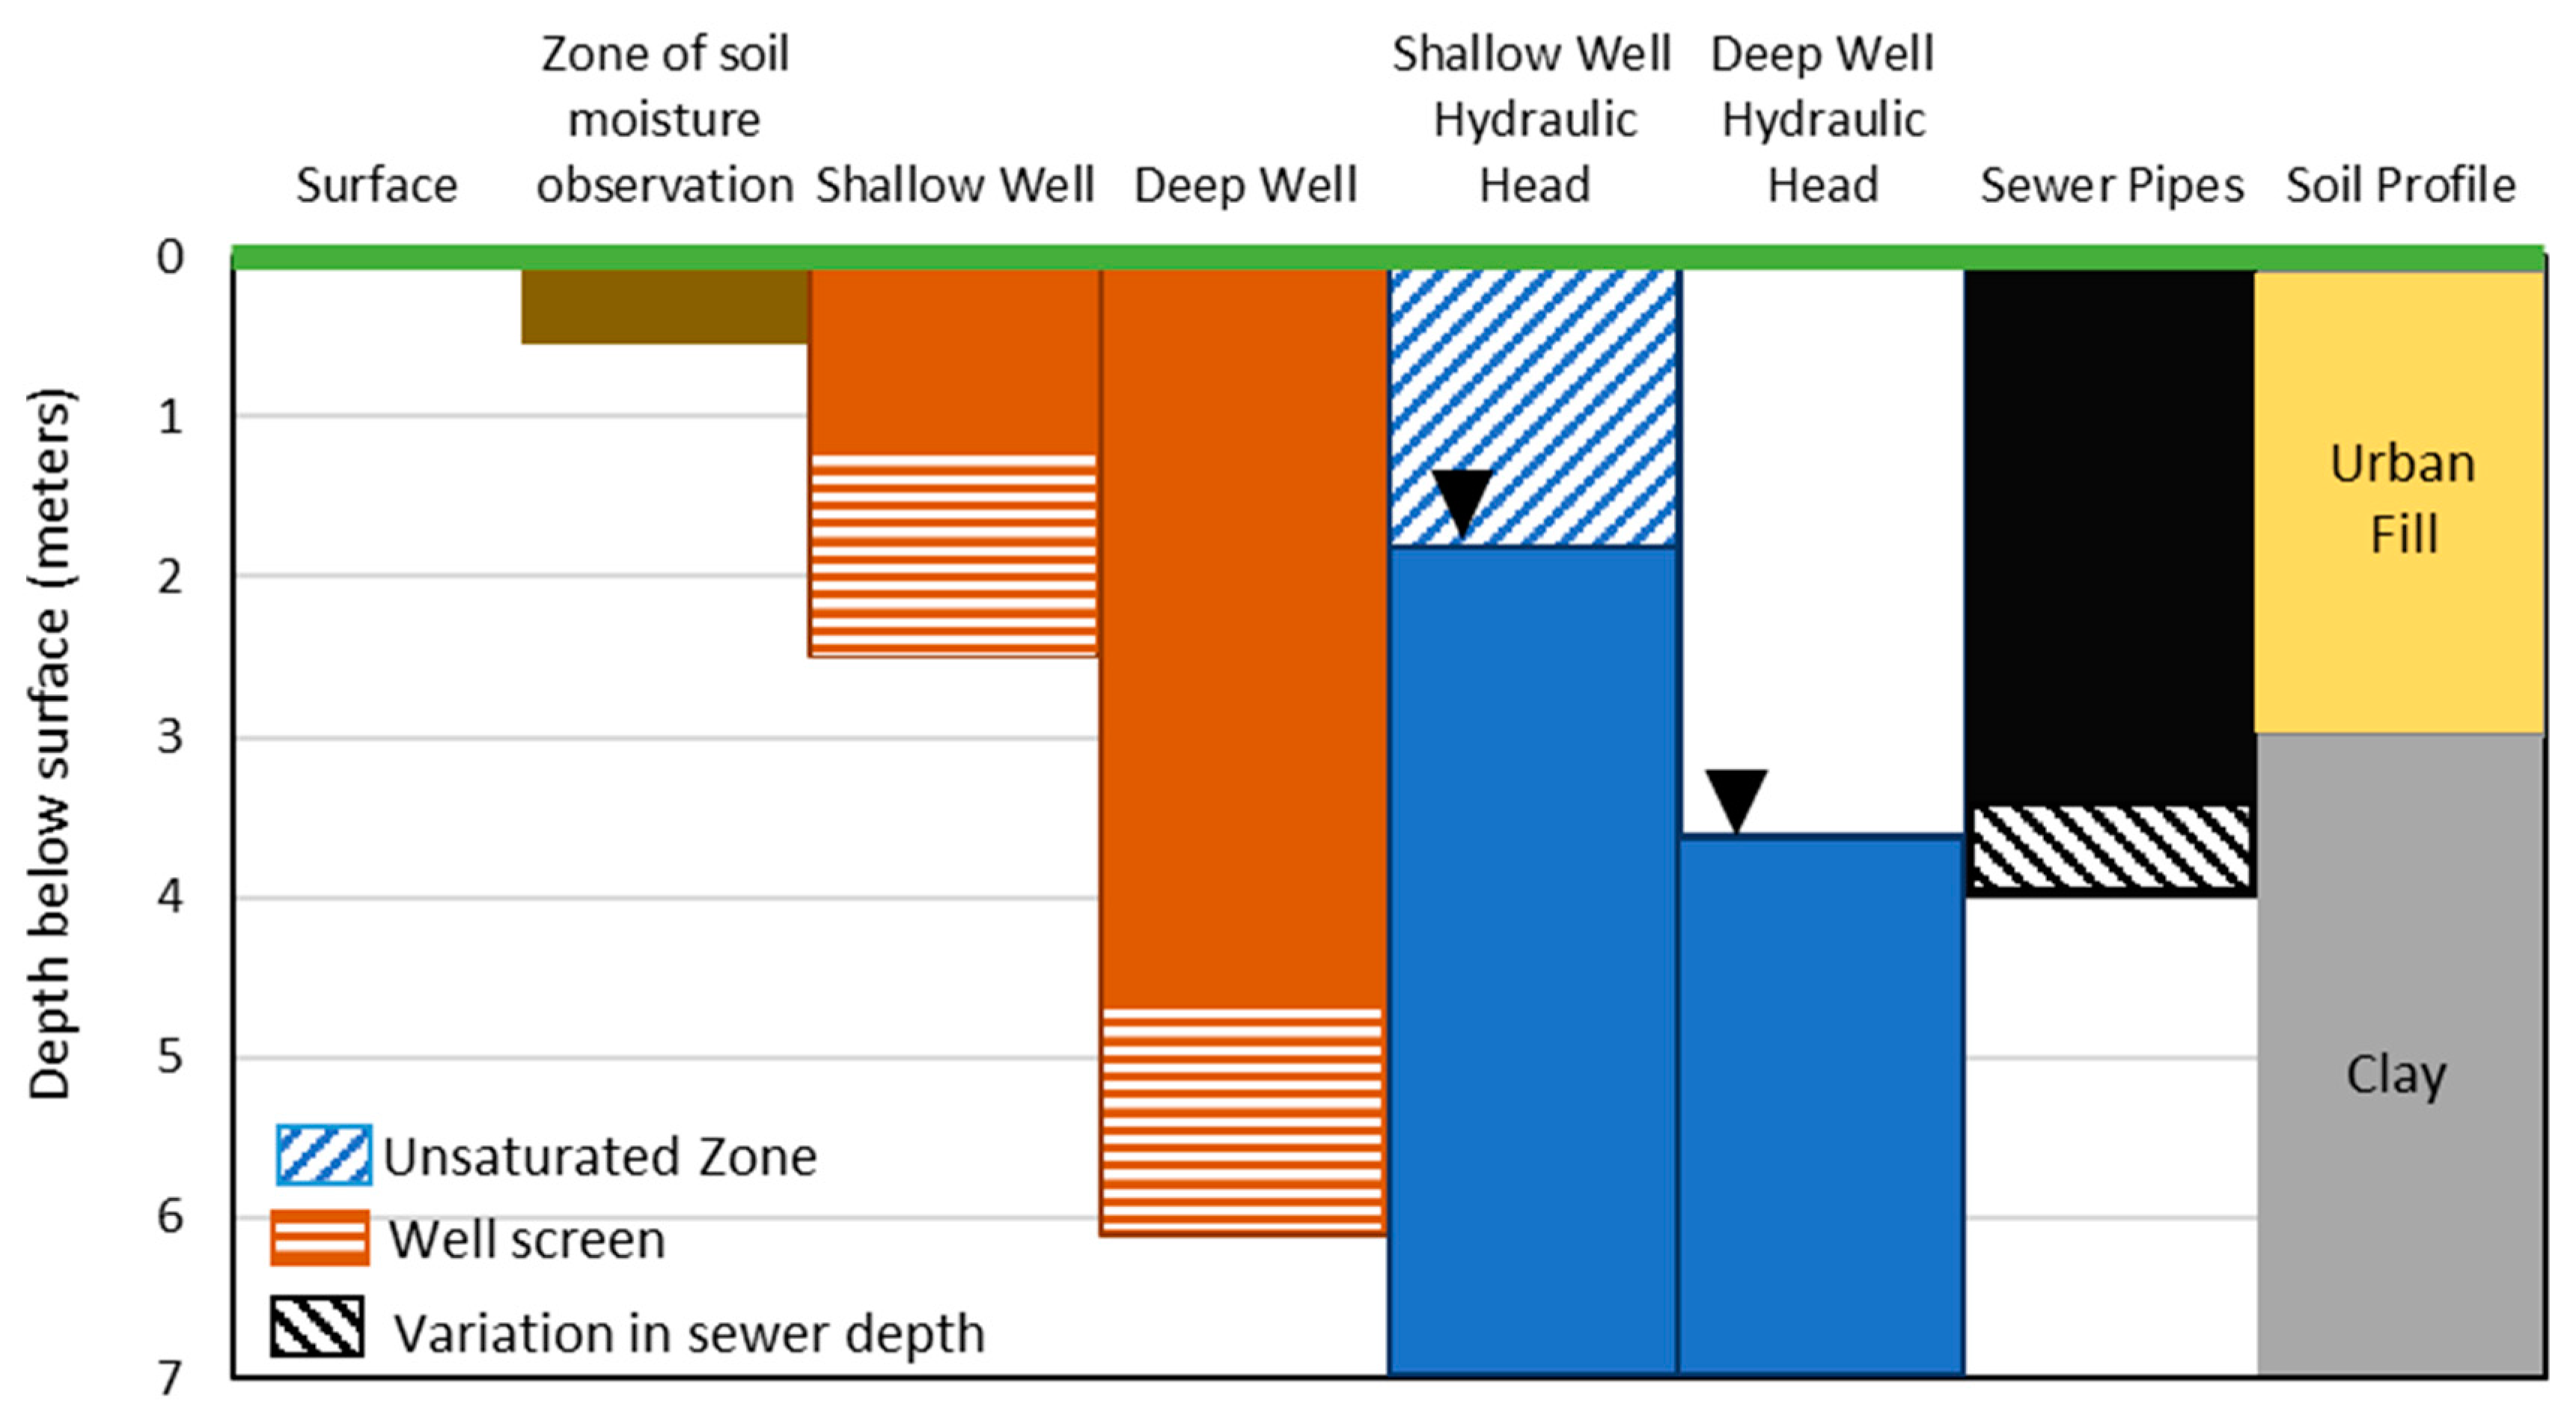
The well groundwater level was recorded using a Schlumberger Diver pressure transducer at 23 individual wells nested with deeper (~six meters below ground surface) and shallow (~three meters below ground surface) wells (Figure 6). The DWSD performed the in-pipe flow measurements at six different locations with meters E and F measuring the discharge out of the RecoveryPark field site. DWSD used V-notch weirs with velocity and stage sensors to generate velocity and discharge values [36]. Eight Campbell Science 655 TDR probes were situated at three different intervals close to the weather station. These were positioned near the surface, at 0.3 m below the surface level and 0.5 m below the surface level. Figure 6 shows the vertical distribution of the monitored subsurface features.
2.3.1. Urban Water Budget
Characterizing urban water budgets is a challenge because of the overlap between groundwater movement and subsurface anthropogenic structures such as sewer lines. In order to better understand these changes, an urban water budget model was developed for the RecoveryPark field site. Periods of rainfall and seasonal variability impact groundwater. In order to account for seasonality and consistency from precipitation events, water budgets were constructed for each quarter around a rainfall event. Four separate rain events were picked to evaluate changes in RecoveryPark’s groundwater storage.
This study applied a mass balance approach to quantify the water budget at the RecoveryPark study area. The area has been extensively reworked to channel surface water flow into sewer drains and onsite GSI. Runoff over the study area is assumed to flow into the sewer drains or is infiltrated into groundwater. Given the locations of the GSI within the study region, interactions between groundwater infiltration from the surface and fluxes in and out of the sewer piping is assumed to be contained within well data and sewer flow data. The shallow wells, located in urban fill, and the deeper wells, located in mostly clay-rich sediments, showed similar fluctuations in hydraulic head levels, indicating that the well sets are hydrologically connected. Referring to Howard and Olszewska [43], the urban fill materials are compacted loamy texture probably originated from a combination of sandy surficial deposits and clayey diamicton family. This urban fill was later mixed with various construction and demolition artifacts due to the urban redevelopment in Detroit city. These artifacts and waste building materials were weathered over the years and left the soil with some significant contaminants. It is worth mentioning that, at RecoveryPark, groundwater has been observed through two sets of observation wells with two different lengths. This observation reflects the field data, where nested shallow and deeper wells show similar changes in hydraulic head. This is also as the shallow well data was used for the water budget analysis. Changes in soil moisture in the vadose zone impact groundwater movement, especially in shallow systems such as Detroit. The changes to hydraulic head in the shallow wells did not account for soil moisture. However, soil moisture influence is reviewed by post-processing. Parameters in the mass balance include the change in groundwater storage (ΔS) in , precipitation (P) in , evapotranspiration (ET) in , and volume of water exiting the site via the sewer network (O) in . The following equation was used to generate a change in groundwater storage estimate scaled to the study area.
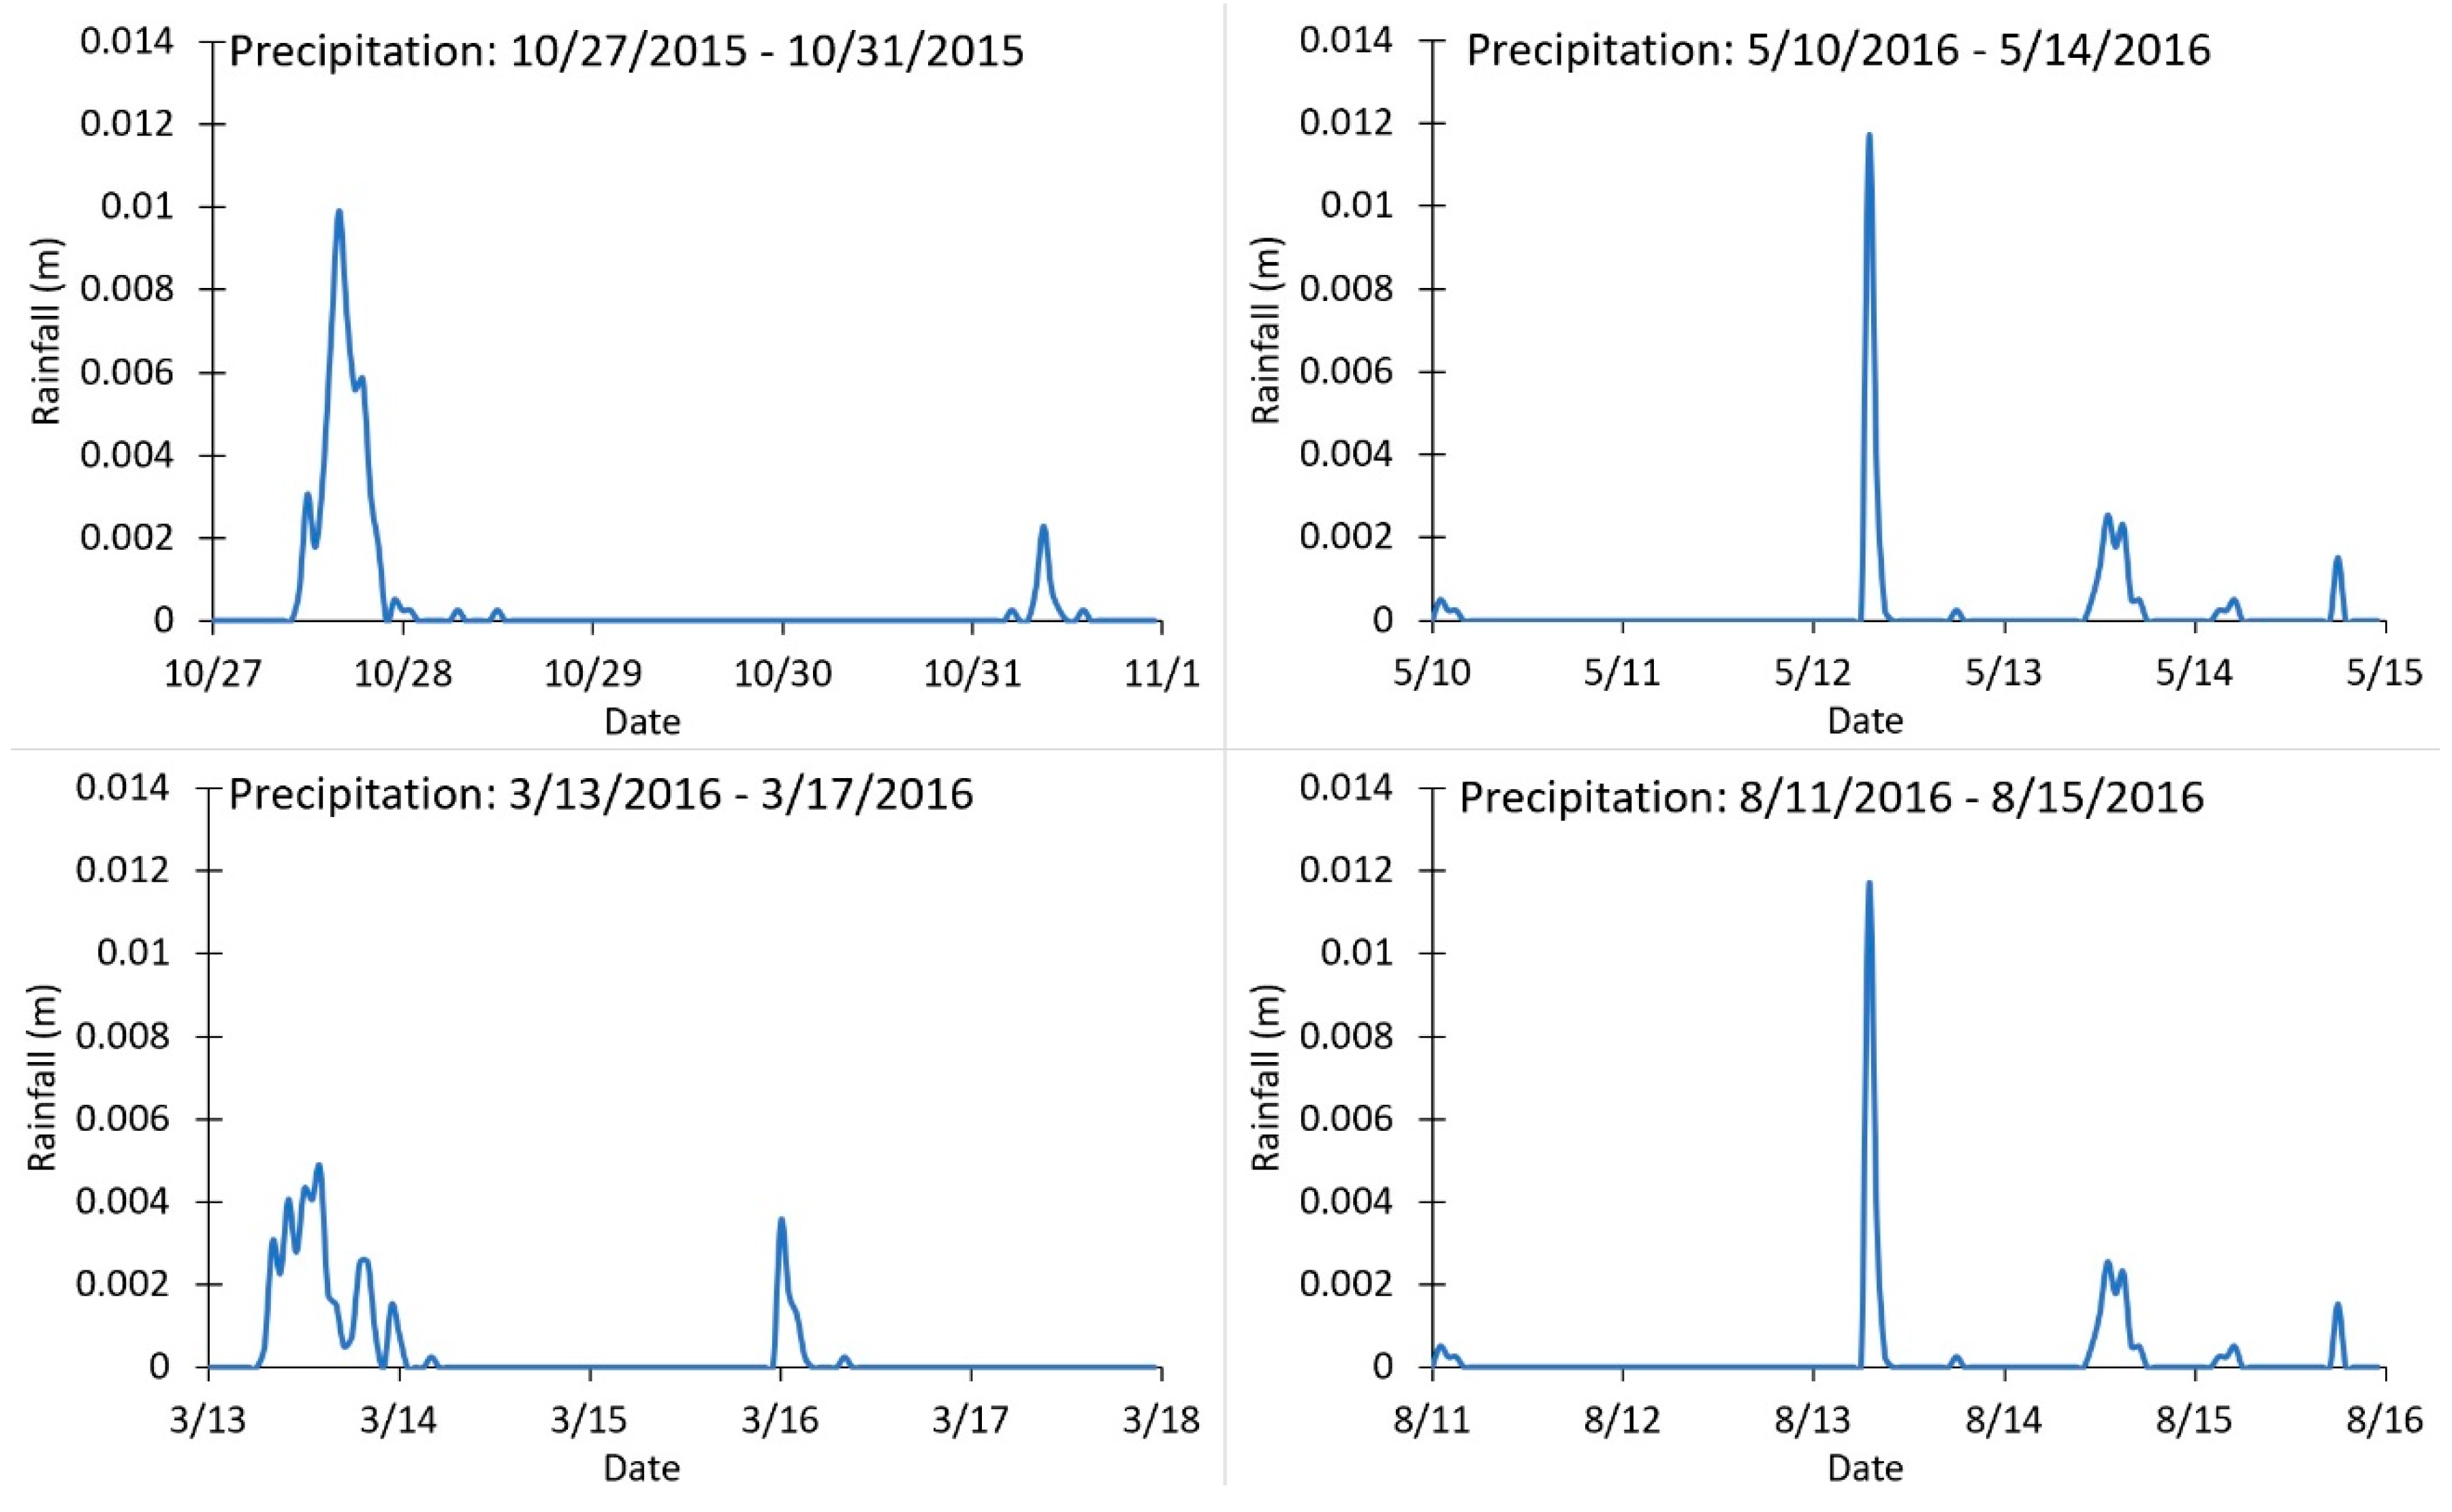
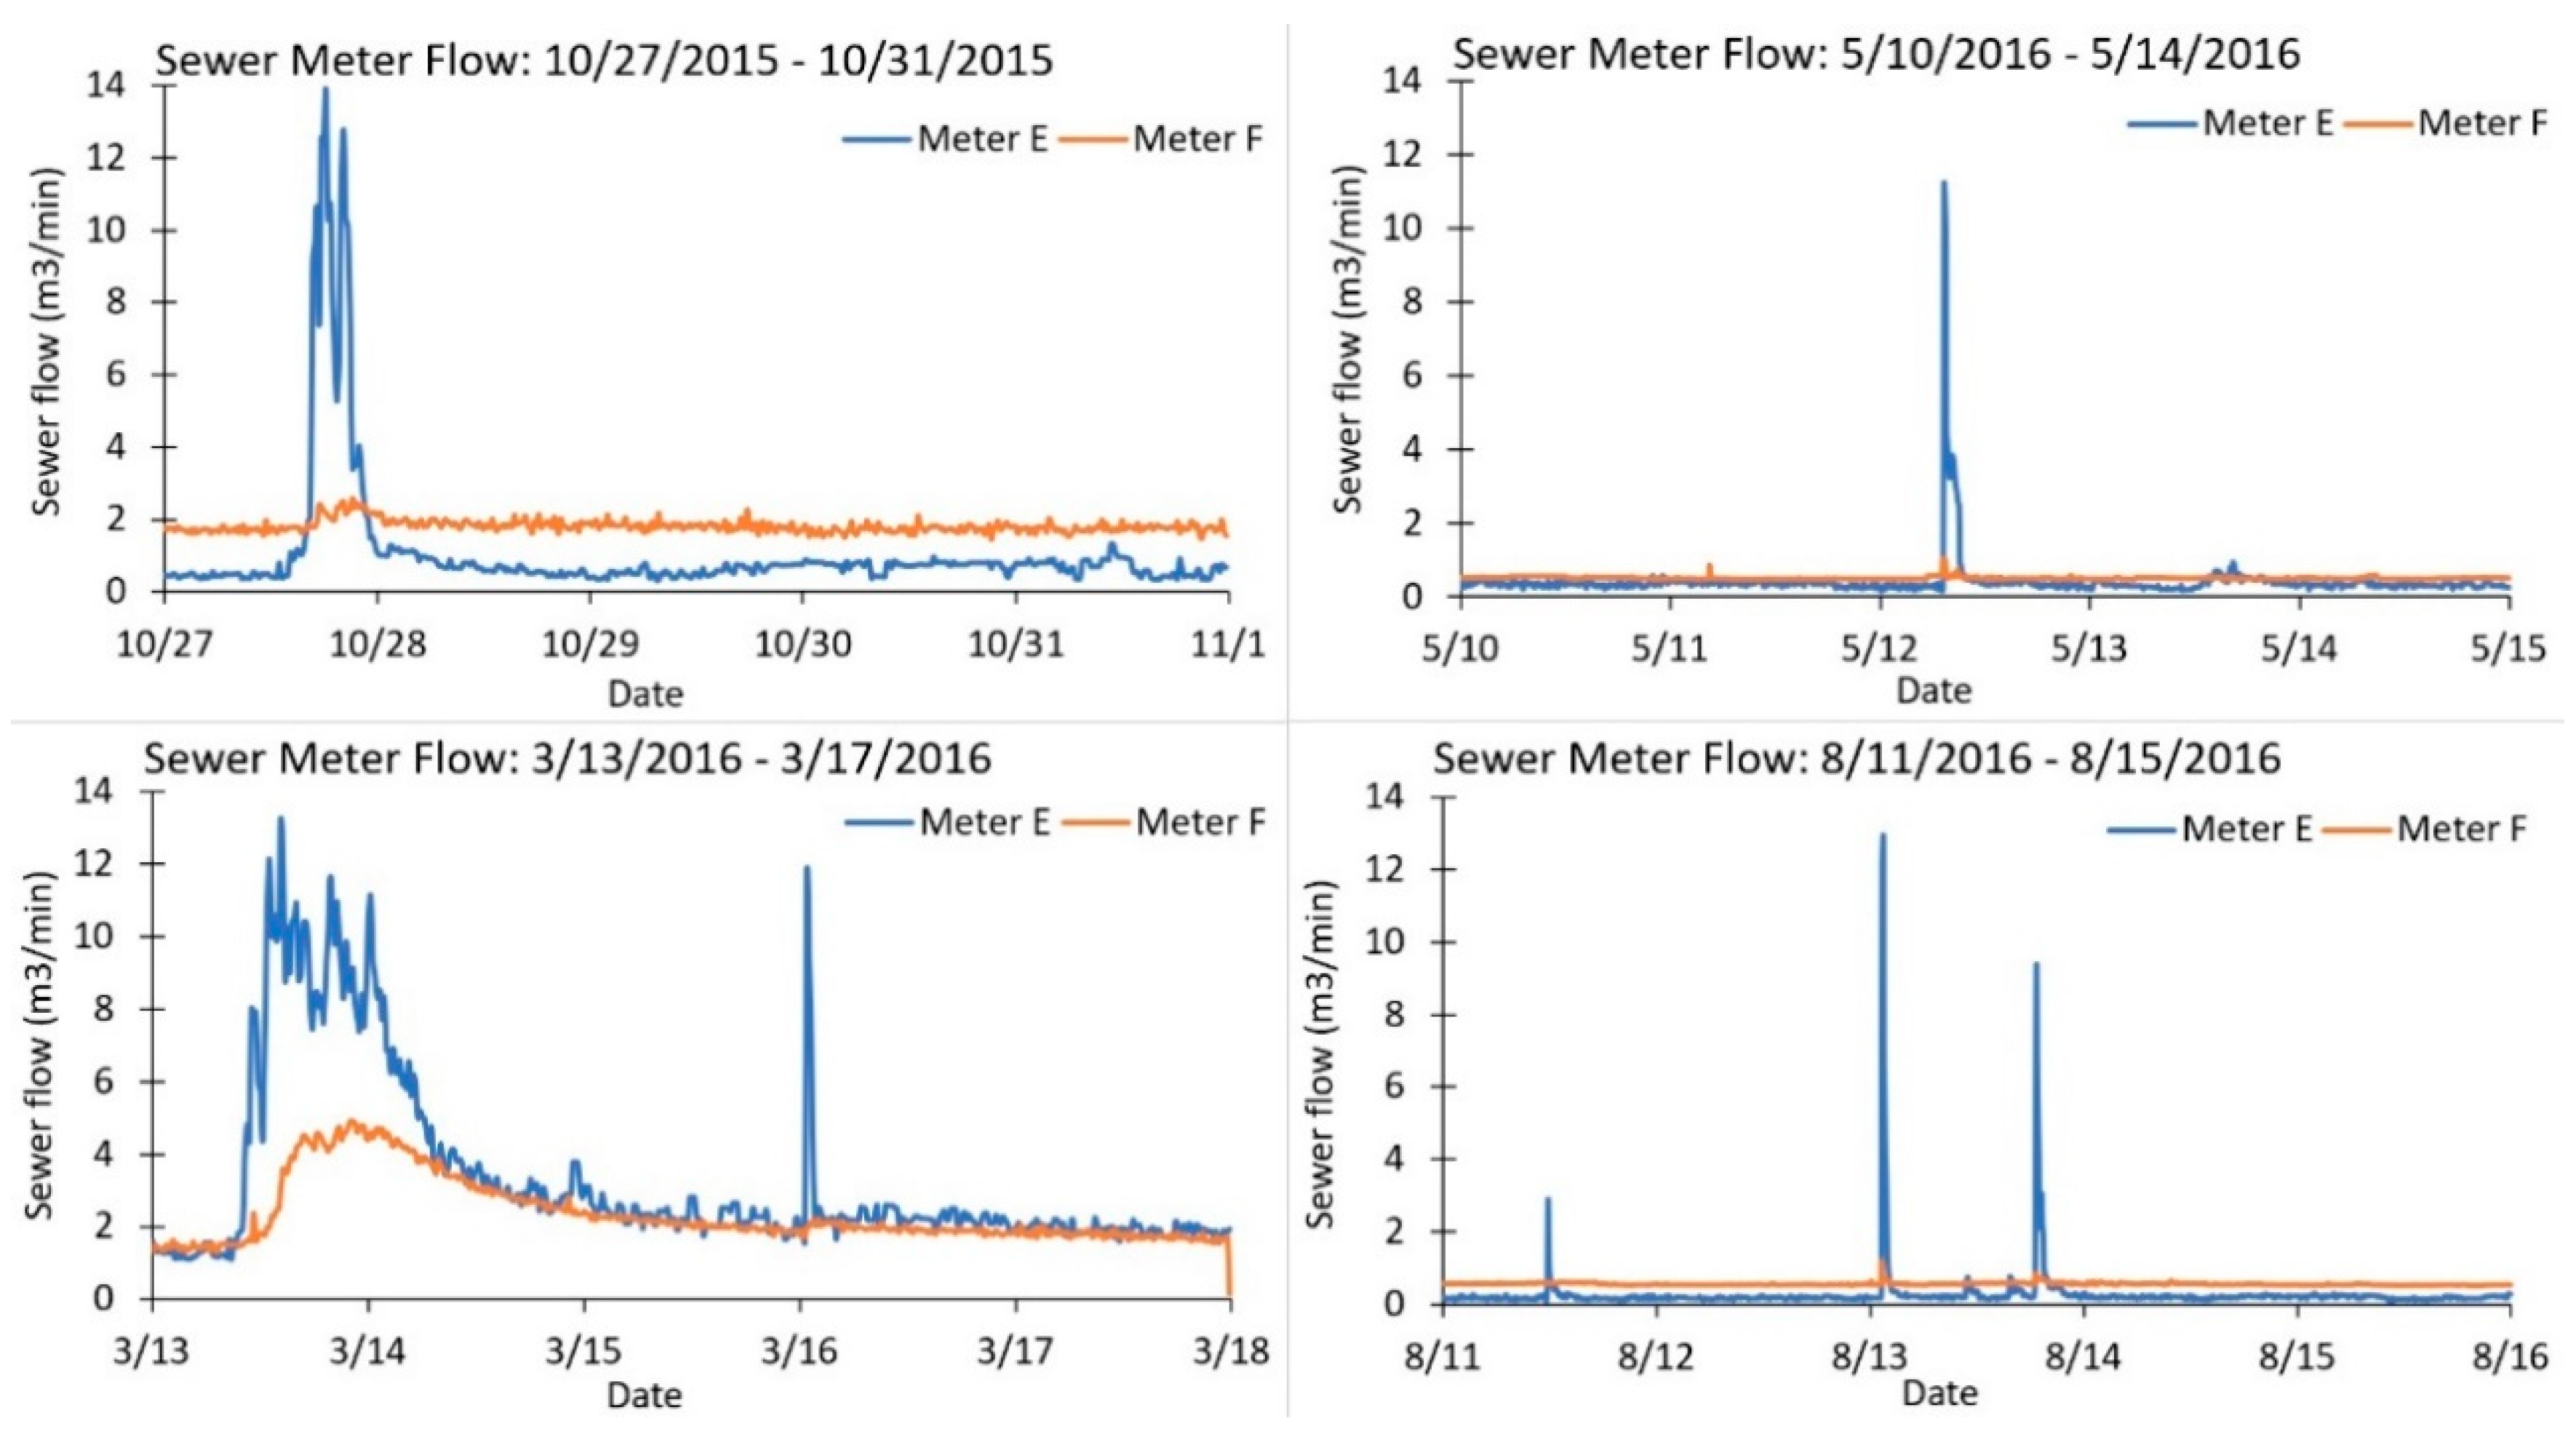
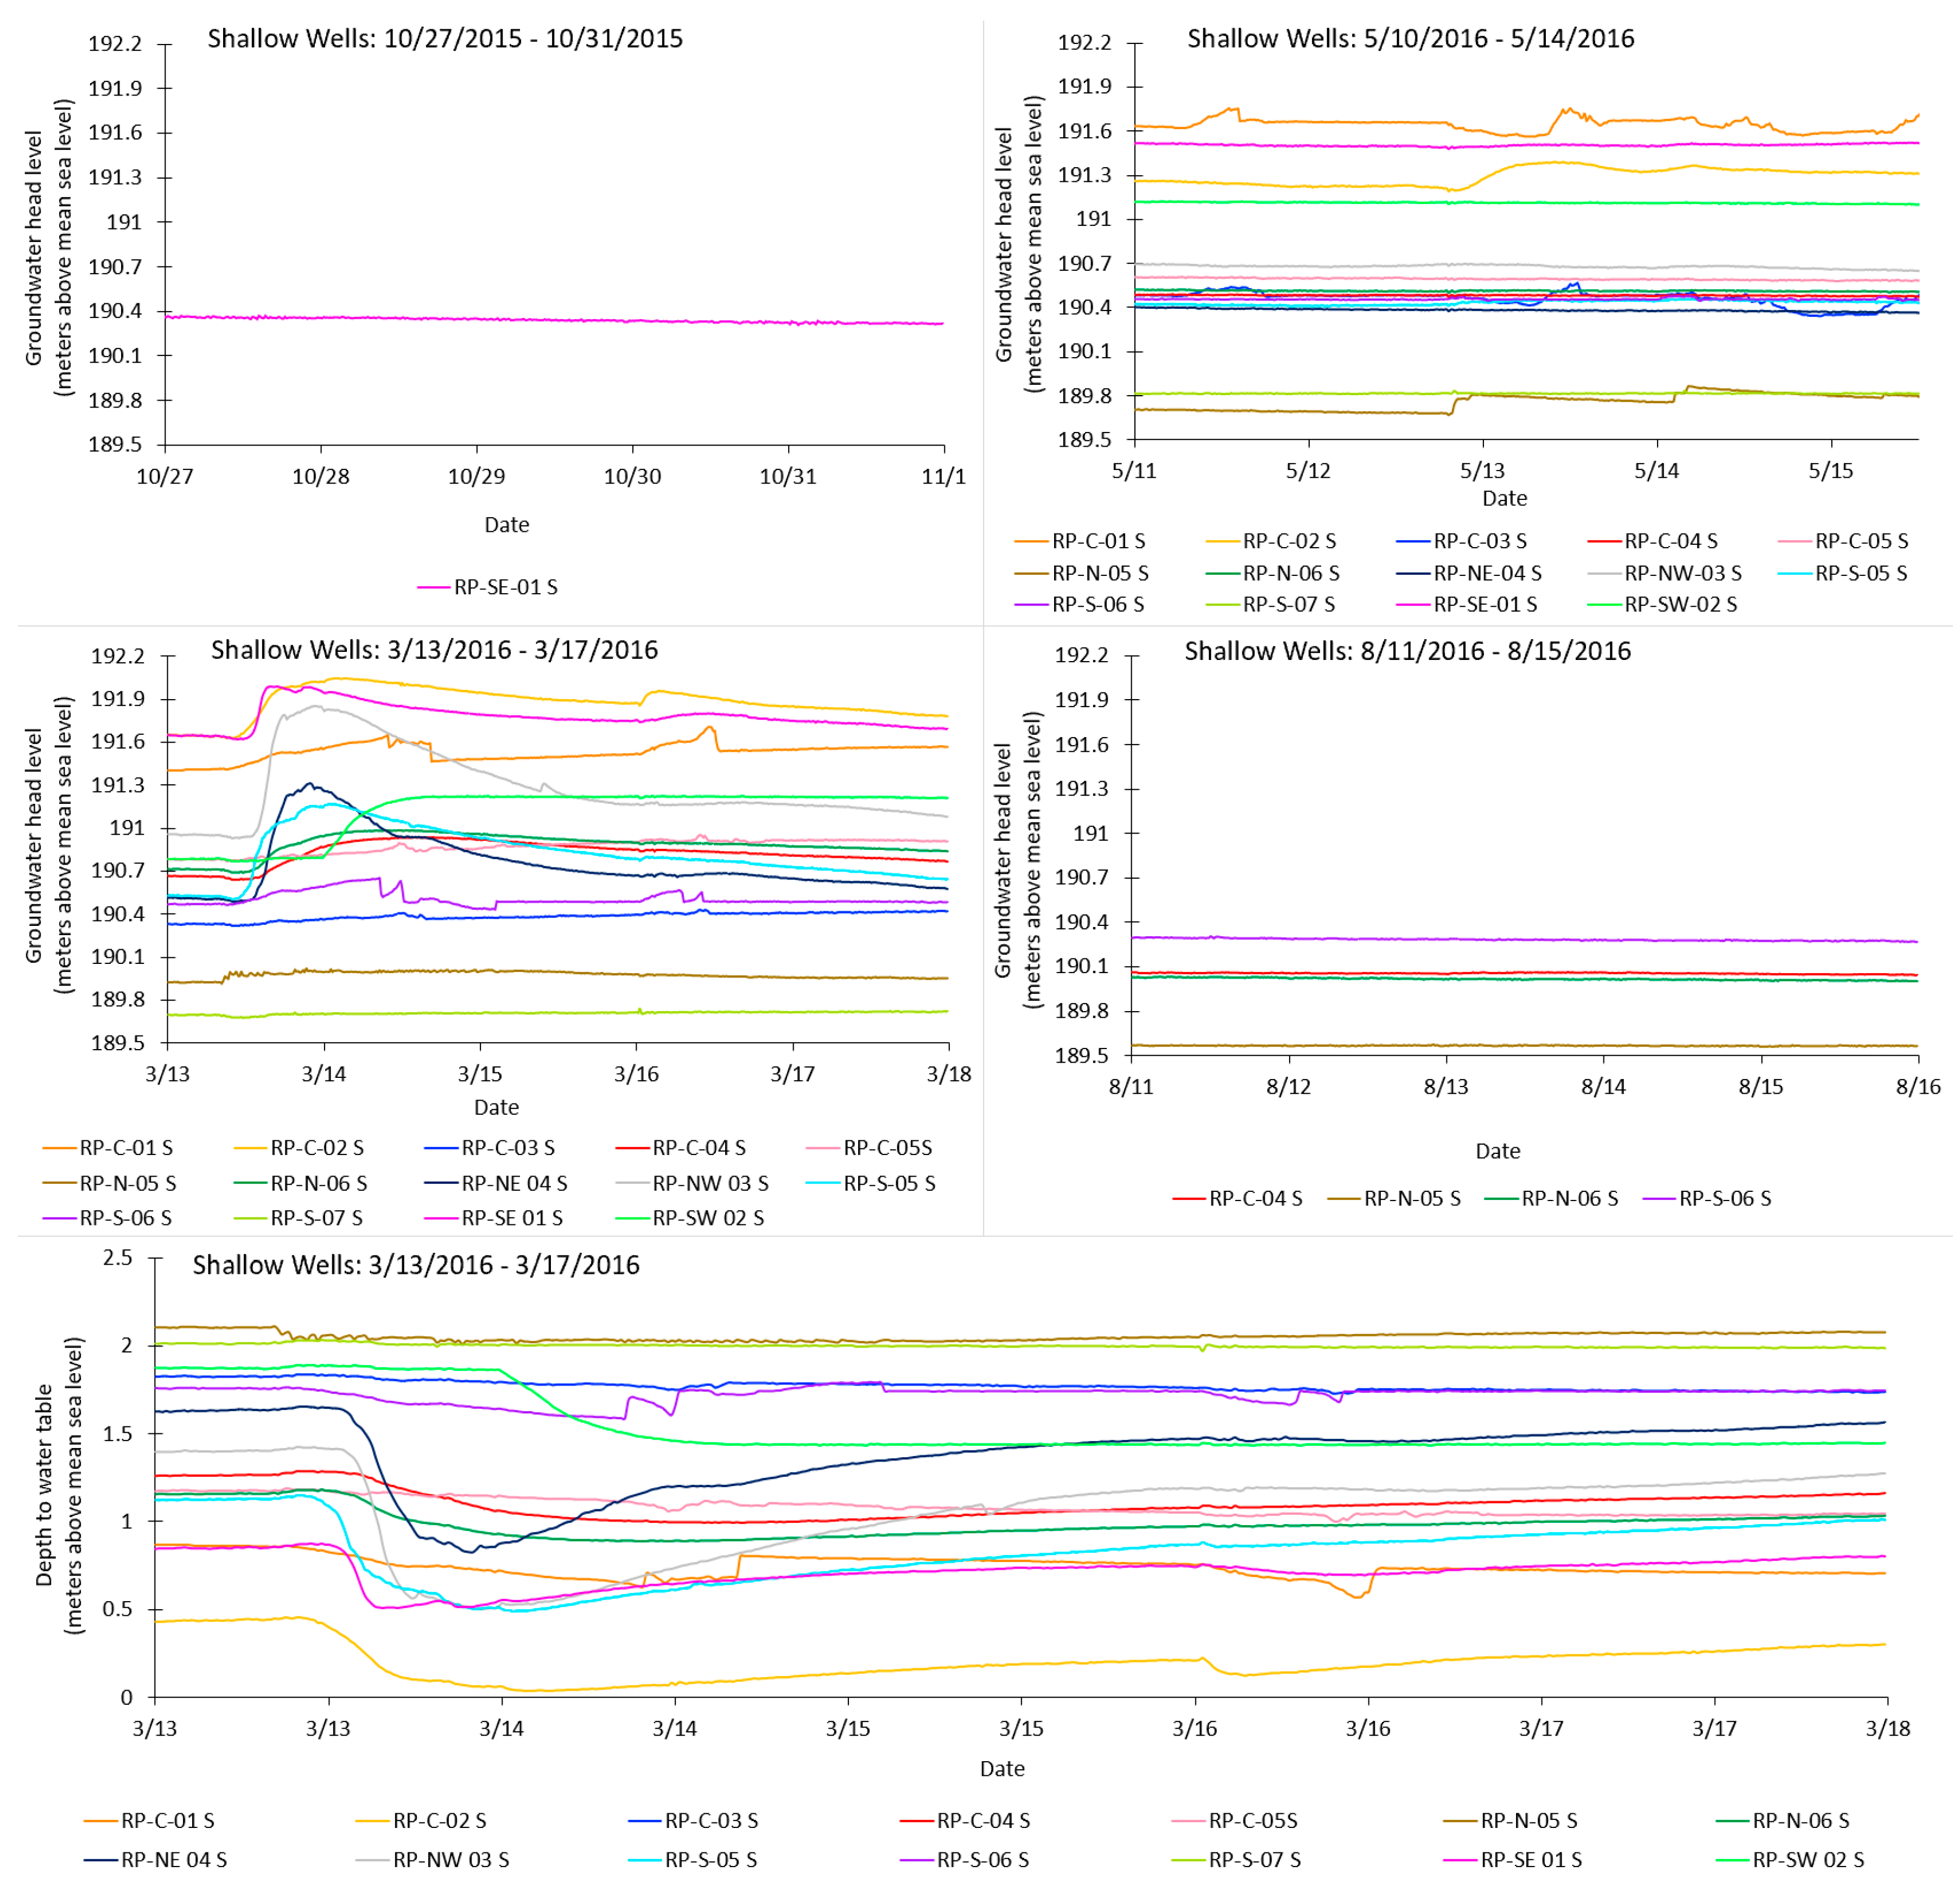
An urban water budget was calculated at RecoveryPark for four different precipitation events, each occurring during the period between October 2015 and September 2016. The specific precipitation events selected for this analysis were chosen were based on the availability of field data and the accuracy of sewer data. Start times of 12:00 a.m. and 12:00 p.m. were chosen based on the start of the precipitation event to ensure baseline data was collected before a precipitation event and contained five days of continuous data from this start time. Table 3 shows a breakdown of available field data for each period studied. Precipitation data (Figure 7), evapotranspiration data (Figure 8), sewer data (Figure 9), and groundwater well data (Figure 10) were included in the example of water budgets.
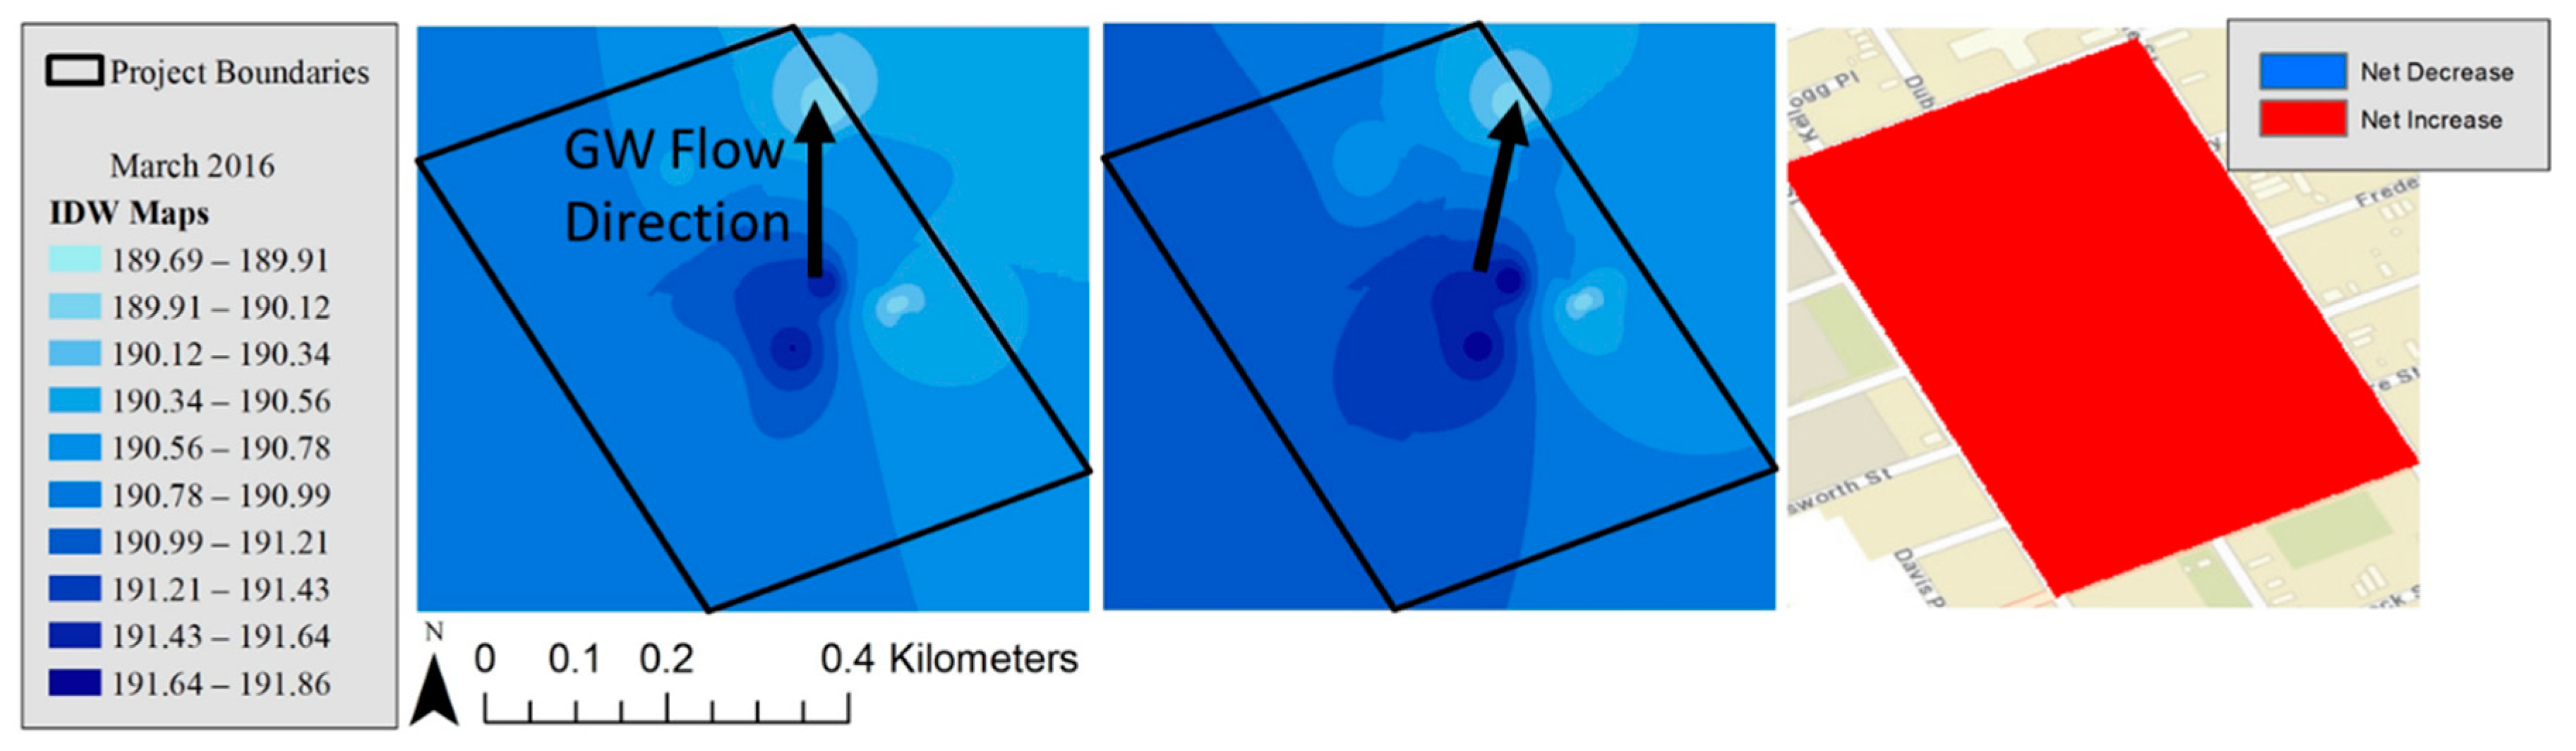
Inverse distance weighting (IDW) models were used to represent the spatial variation of hydraulic head distribution for both the pre-and post-rain time periods. The pre-rain time period corresponds to head measurements taken immediately before the rainfall, while the post-rain time period corresponds to head measurements taken five days after the beginning of the study period. At least one well was operational during the four precipitation events. For the period of 27 to 31 October 2015, the single shallow well is assumed to represent the study area, and an IDW was not generated for this event. The well values were inputted into the ESRI ArcMap, and the ArcMap Spatial Analysis Extension tool was used to create the inverse distance weighting maps for this time period (Figure 11). The layers were then converted to a raster file, and difference maps were generated from the pre-precipitation raster and post-precipitation raster to show net gains and net losses. An effective porosity (n) of 0.3 was used as an average porosity for the RecoveryPark study area based on typical values associated with soils present at RecoveryPark [36]. Change in groundwater storage (ΔS) is the porosity (n) times the net volume gain or loss () over the study period (Equation (1)).
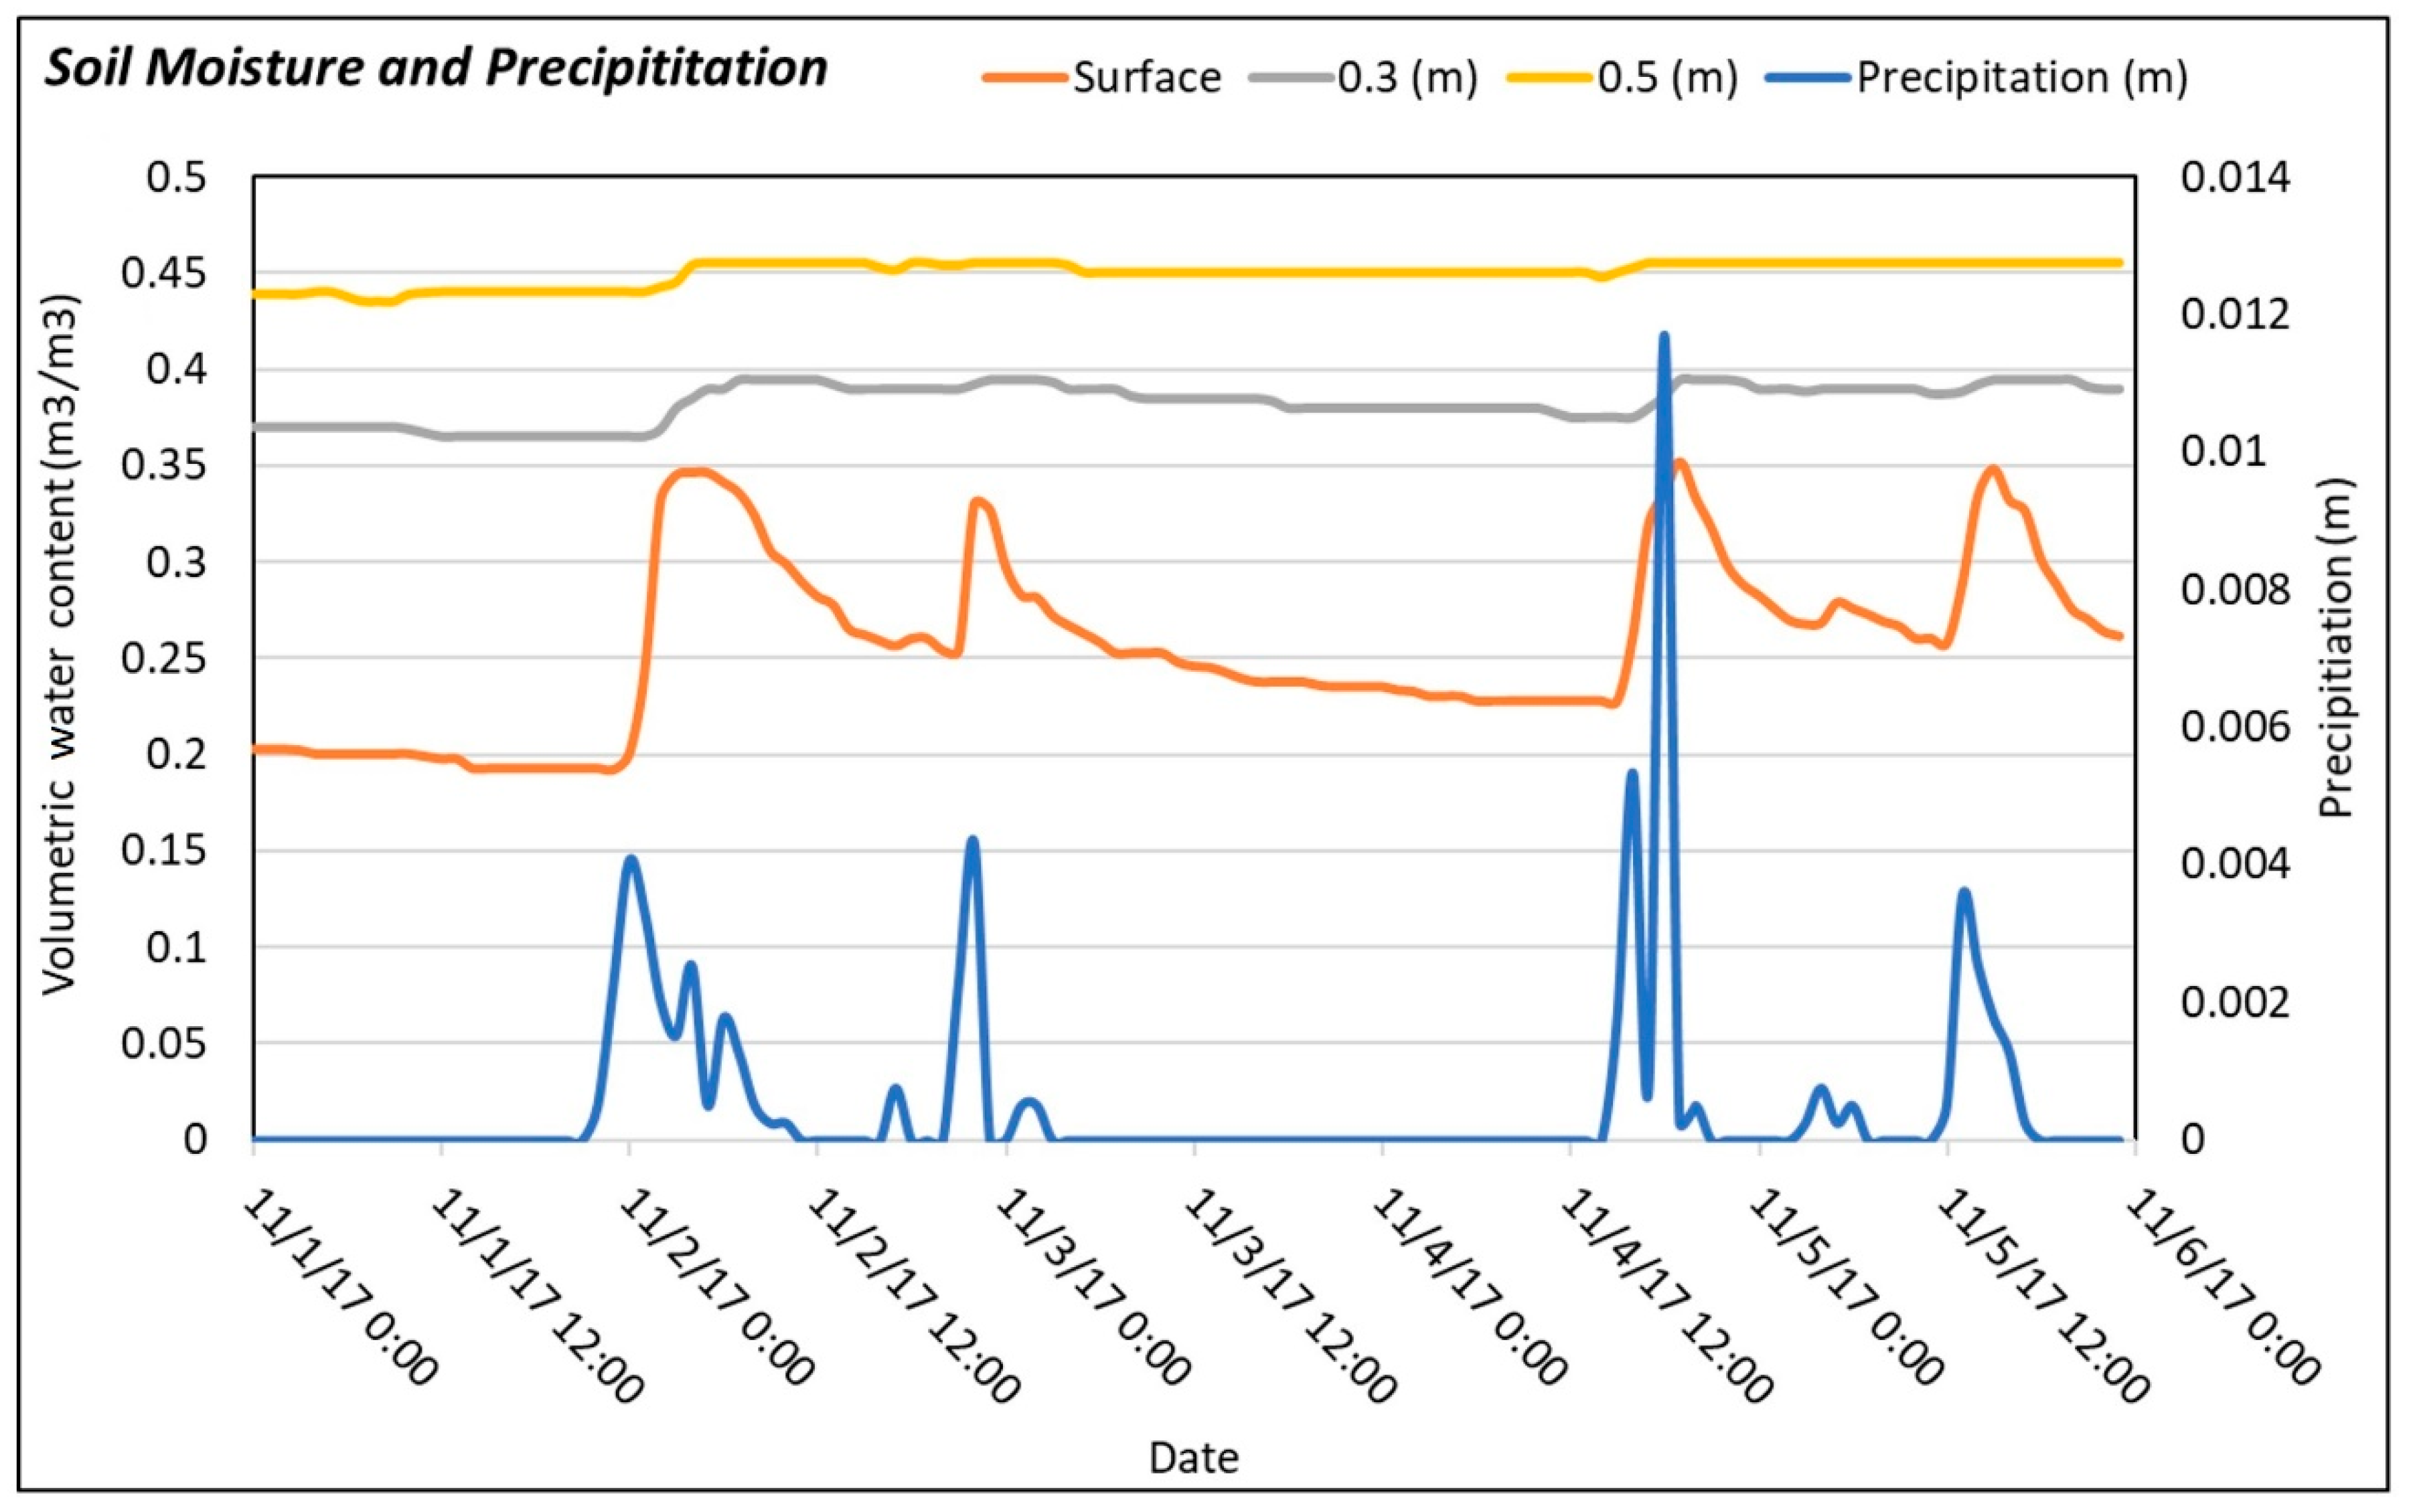
Soil moisture was not initially reviewed because the sensors were not in place during the initial study period during 2015 and 2016. Soil moisture plays a critical role in water retention and, ultimately, in the water budget. It was determined that soil moisture is critical to understanding an urban water budget, and four model rainfall events in 2017 and 2018 were chosen to give an estimated idea of the scale of water retained during rainfall events. While the data was taken for different rainfall events, it still provides valuable information regarding the volume of water retained in the top 0.5 m at RecoveryPark. Given the close proximity of the soil moisture sensors, the averages of sensors placed near the surface, at 0.3 m below the surface, and 0.5 m below the surface were used to estimate soil moisture at RecoveryPark (Figure 12).
2.3.2. Groundwater Model
Similar to the regional simulation, GMS 10.3.2 (MODFLOW 2000) is used to identify groundwater head in the steady-state condition for the local scale model. Since there are two sets of groundwater observed data in RecoveryPark, i.e., shallow and deeper observation wells, two conceptual models for each observed dataset are created to investigate groundwater through shallow and deeper observation wells. In other words, at RecoveryPark, groundwater is investigated through two separate models with two different lengths of the observation wells. Both conceptual models are one-layer models with 41,184 active structured cells. The surface elevation ranges from ~195 m in the north to ~189 m in the south (NAVD88), while the bottom elevation is assumed to be ~150 m for the entire area. The local model is a part of the regional one as it is located in the southeastern part of the regional model. The boundary conditions applied in the local model are adapted to the regional model outputs. The local boundary conditions were chosen based on the regional model results. A constant head of ~188 to 193 m is also assumed for RecoveryPark boundaries.
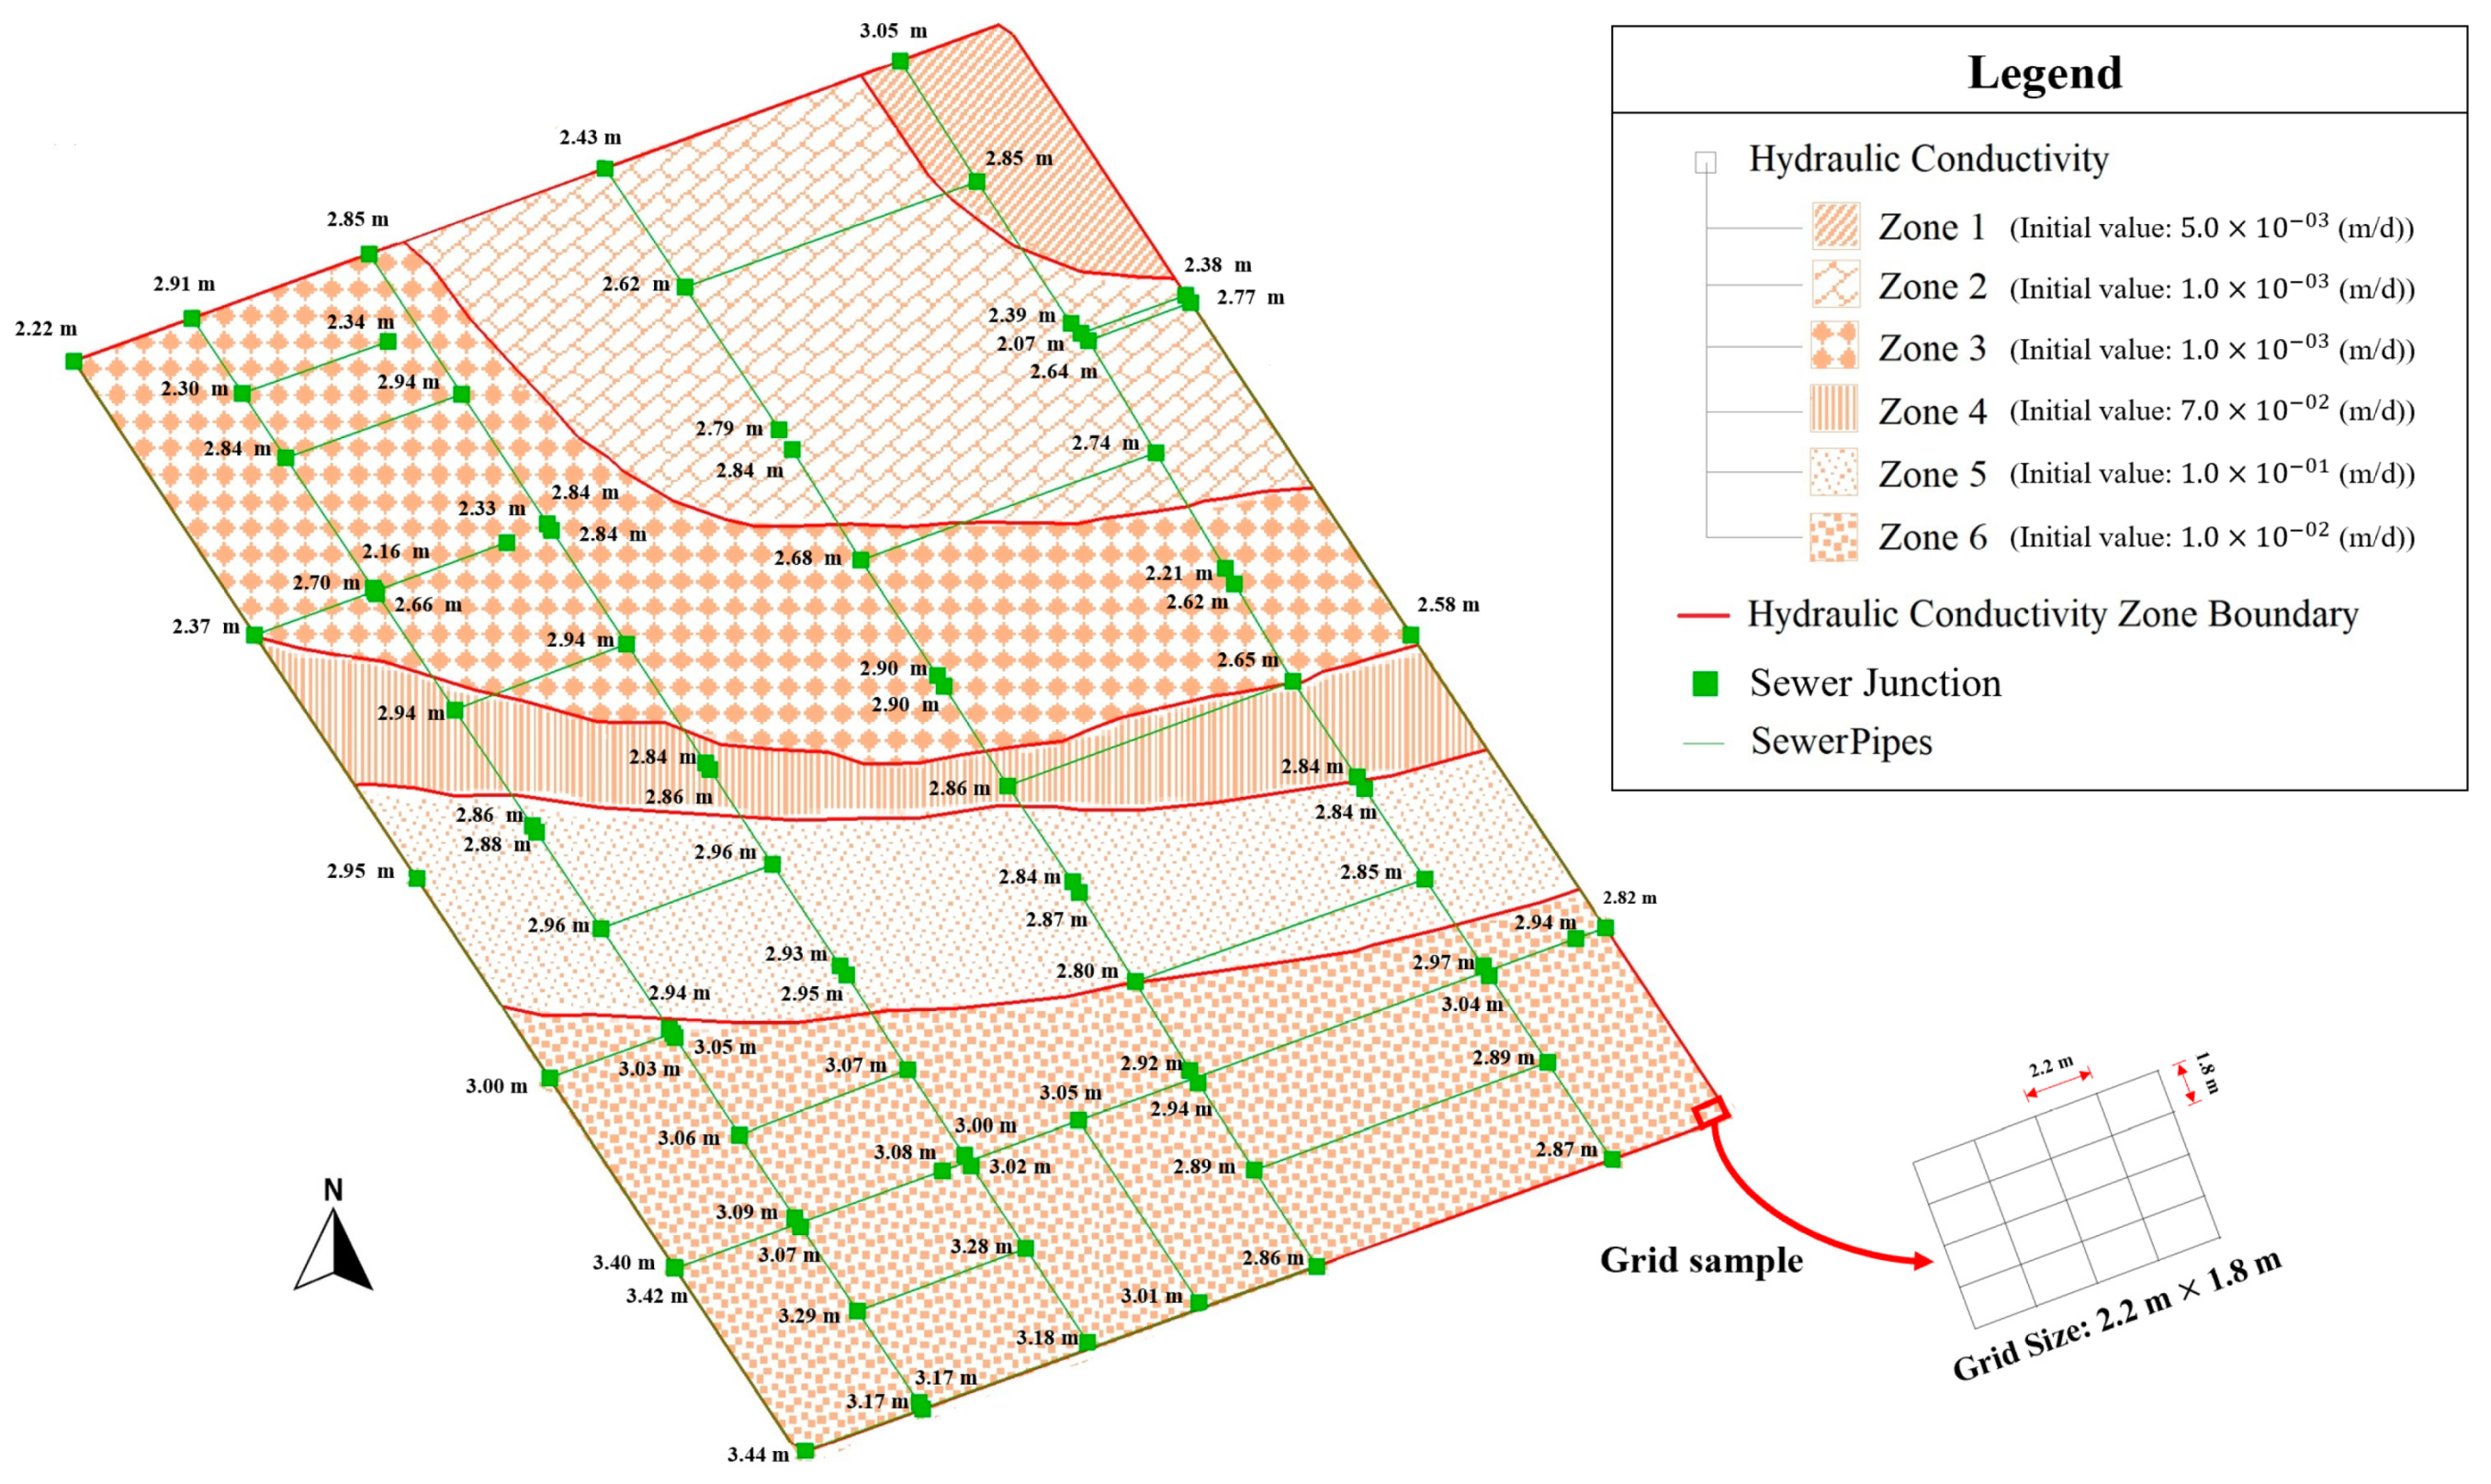
Sewer drains and evapotranspiration are the discharging sources for groundwater, while precipitation is the only source for recharging the groundwater. In the RecoveryPark 3-D model, we obtained sewer line data from [36,44] and divided the area into six zones, as shown in Figure 13. Referring to the samples collected by Rogers [6], the clay unit appears to be uniformly deposited within Detroit city with a hydraulic conductivity range of 8.64 × 10⁻⁴ to 1.1 (m/d). Furthermore, based on the soil-boring data in RecoveryPark [37,39], six different hydraulic conductivities of clay are recognized for RecoveryPark soil. So, we assumed six types (zone) of hydraulic conductivity in the local model and subdivided the model into six zones to make sure that the model correctly represents the hydrogeological features of RecoveryPark. The hydraulic conductance and bottom elevation of pipes are applied to the sewer lines in the local model based on available data of sewerage at RecoveryPark. The sewer network at RecoveryPark is a combined sewer system [44]. Based on the available data, the depth of the sewer pipes junctions is assumed to be ~2 to 3 m in the model. The sewer pipes have been placed deeper in the south to southwest of the local model, while they can be found at a smaller depth in the center-north to the northeast of the model. A hydraulic conductance of 0.0025 ((m2/d)/m) is also assumed for all sewer pipes through the Drain package in the MODFLOW model.
An essential part of any groundwater modeling exercise is the model calibration process. In this project, horizontal and vertical hydraulic conductivity were selected as the calibration variables since they are the least well-known data in this region. The horizontal and vertical hydraulic conductivity values were fine-tuned using the PEST calibration process (Table 4) and the 16 March 2016 observations of groundwater head for the shallow and deeper wells at RecoveryPark. During the PEST calibration process, the groundwater system inputs are estimated from the system results by comparing the model outputs and observed head values. We applied the zone-based approach in the model calibration and selected each hydraulic conductivity zone as a parameter. In RecoveryPark modeling, PEST tracks how the model responds to the hydraulic conductivity changes and calculates the residual for computed and observed head values. In each round of parameter estimation, PEST determines new hydraulic conductivity values for each zone, interpolates new values to the MODFLOW model, and updates the input files for the next MODFLOW run. Each time, the latest output of the model is compared to the observed head values. PEST repeats this process and adjusts the hydraulic conductivity values until the minimum value of residual is achieved.
3. Results
3.1. Regional Scale Groundwater Model: Metro Detroit Watersheds
The study area’s initial groundwater model (Figure 14) shows that in the northwest of the region, the groundwater head level reaches a maximum of ~320 m in the northwest, where the maximum elevation of the ground surface is ~325 m. The minimum groundwater head level of ~170 m is also found at the southeast parts of the region, where the ground surface has a minimum elevation of ~173 m. The difference between the ground surface elevations and groundwater head levels demonstrates that the depth to the groundwater gradually decreases toward the southeast, and groundwater is found at a deeper depth in the northwest of the region. As reviewed in the literature, the groundwater head level within the Detroit urban area, along the cross-section of Figure 2, is at ~one to three meters below the ground surface.
Furthermore, the water table is found at a higher level in the northwest parts of the model than the southeast of the region. Therefore, groundwater flows in a southeasterly direction and discharges to the Detroit River and Lake St. Clair.
3.2. Local Scale Model: RecoveryPark
3.2.1. Urban Water Budget
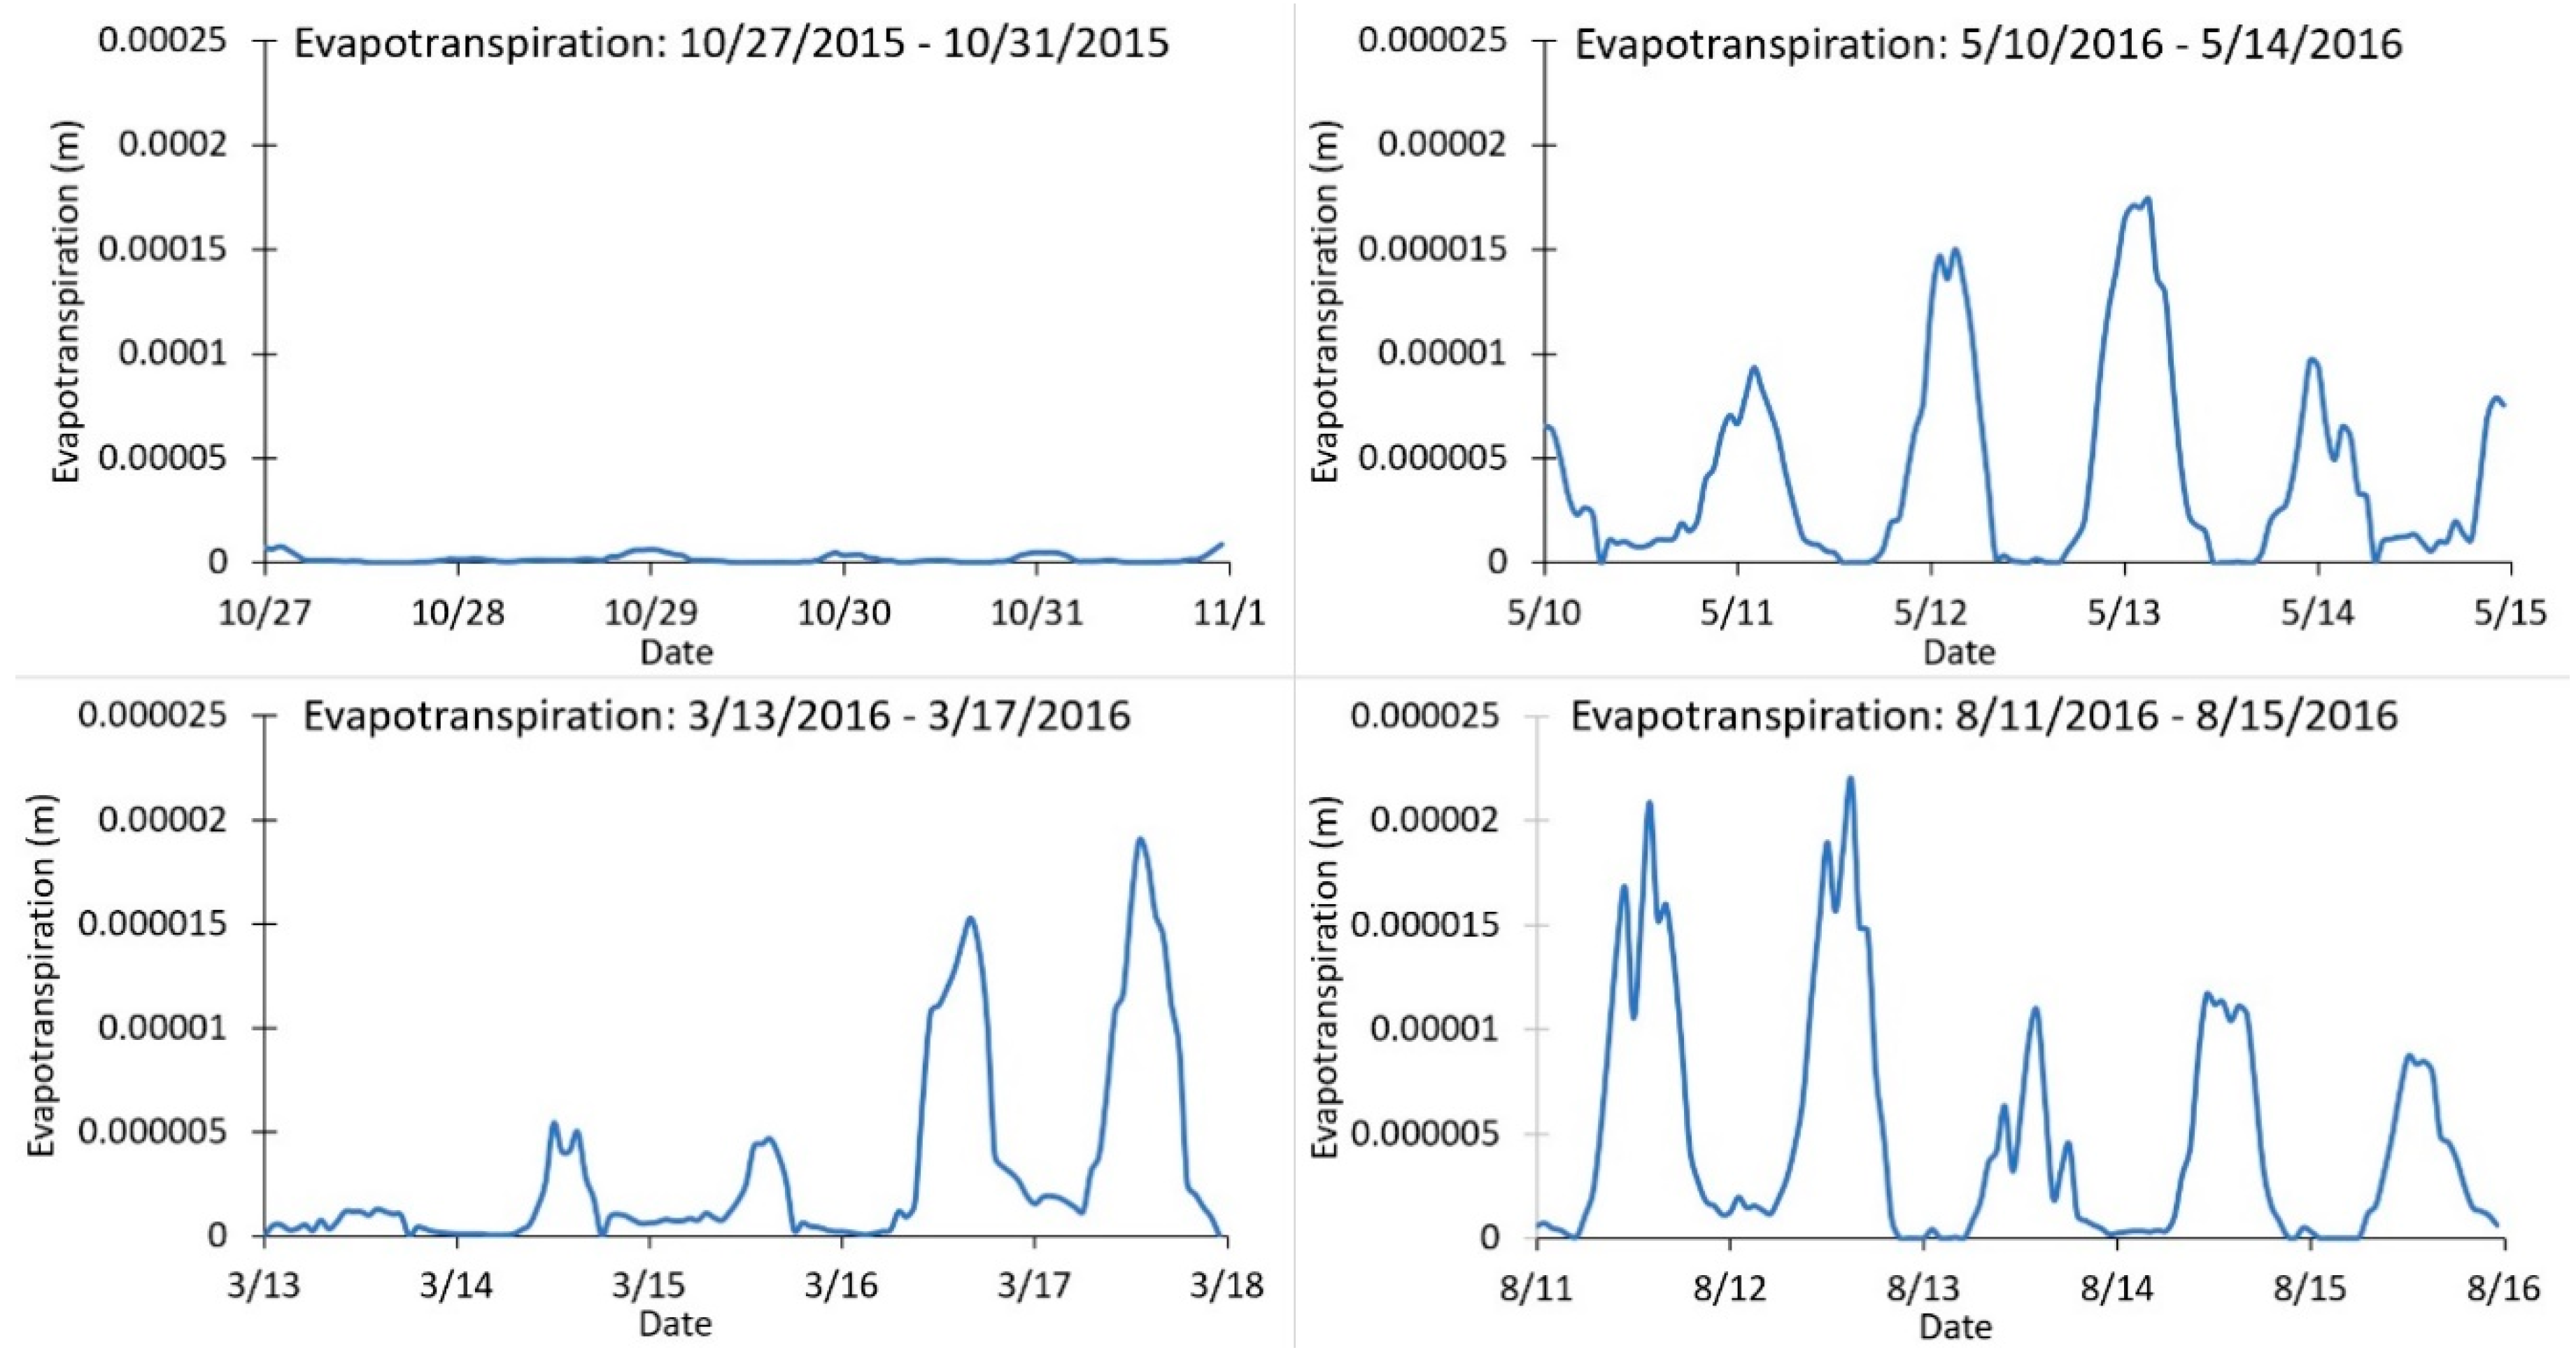
Water budget variables were evaluated for four precipitation events: 27 to 31 October 2015; 13 to 17 March 2016; 10 to 14 May 2016; and 11 to 15 August 2016. These included precipitation (Figure 7), evapotranspiration (Figure 8), in-pipe flow meter (Figure 9), and changes in groundwater storage (Figure 10). The totals are showed in Table 5 and compared in Figure 15. Equation (1) calculated the total change in storage with a measured change in storage based on the hydraulic head. The unaccounted water value was determined to be the difference between the computed storage and the measured change in storage, which is defined as excess in Table 5.
The sewage flows below the study area were monitored during each evaluation period at meters E and F (Figure 9). Meter E showed consistent surges of water during each precipitation event, while meter F showed slight increases. It is most likely due to the fact that meter E’s outlet conveyed sewer water for a larger portion of the study area. The sewer flow decreased rapidly after the initial storm surge.
The measured hydraulic head in the shallow wells exhibited similar trends during each observed time period (Figure 10). The October and August time periods showed a consistent drop in groundwater. The March and May time periods showed responses to the rainfall events during the observed time periods. The difference maps generated from the IDW models produced a change in storage values for the shallow well interval for the four study periods (Table 5).
Quarterly water budgets were assessed for each time period (Figure 15). October 2015, May 2016, and August 2016 showed excess unaccounted water onsite, while March 2016 showed an increase in groundwater storage beyond precipitation (Table 5). This indicates that the measurements taken at RecoveryPark during 2015 and 2016 did not fully capture the water budget during episodic rain events. Soil moisture was evaluated during four different seasonal rain events at RecoveryPark in 2017 to give an indication of the changes in soil water above the water table. Figure 12 represents an example measurement reviewed from 1 November 2017 to 5 November 2017. The volume of the total change in soil moisture calculated in Figure 12 shows a positive change of 2286.41 when scaled to the RecoveryPark study area. Other precipitation events in March 2018 resulted in an increasing volume of 1581.26 , June 2018 showed 910.29 , and August 2018 showed 2200.94 .
3.2.2. Groundwater Model
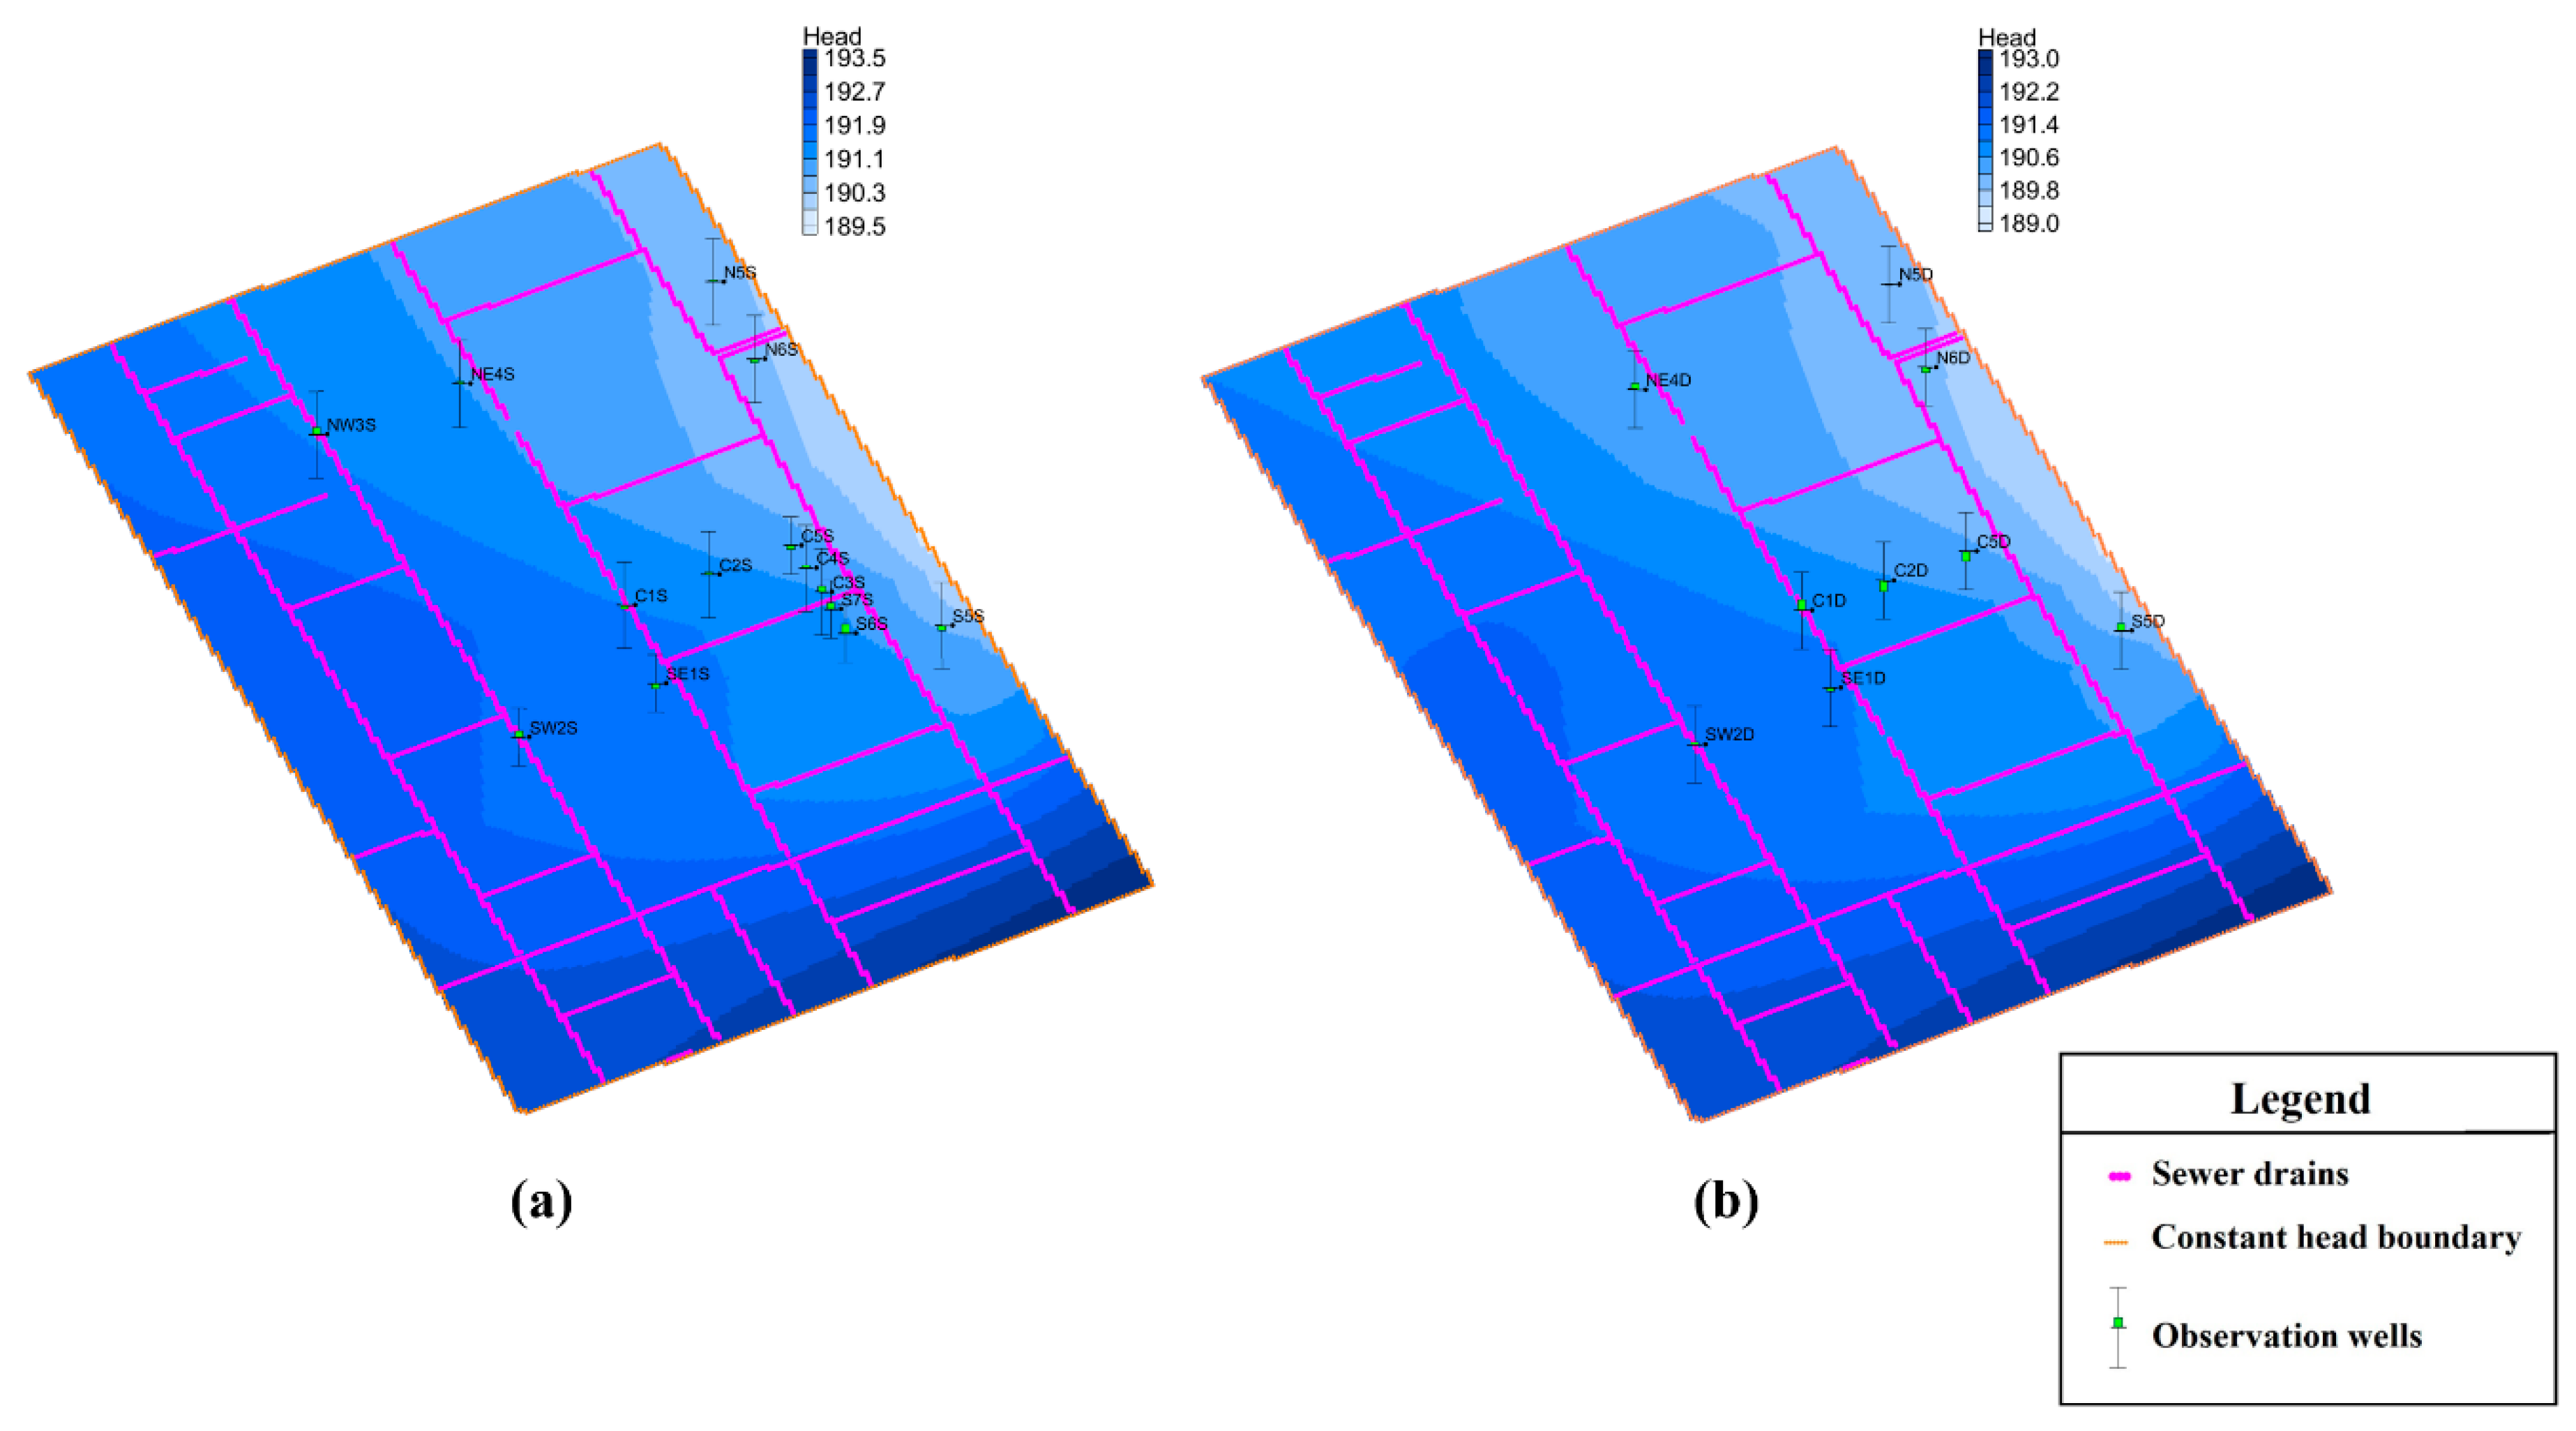
Figure 16 presents the final results of the shallow and deeper groundwater simulation for RecoveryPark. The detail of assumptions and modeling process have been presented in Section 2.3.2. The results show that the groundwater gradient is to the north of RecoveryPark. Additionally, the shallow and deeper observation wells reflected similar groundwater fluctuations. The groundwater observed through observation wells with two different lengths (shallow and deeper) behaves equally and moves from the south to the north of the RecoveryPark models.
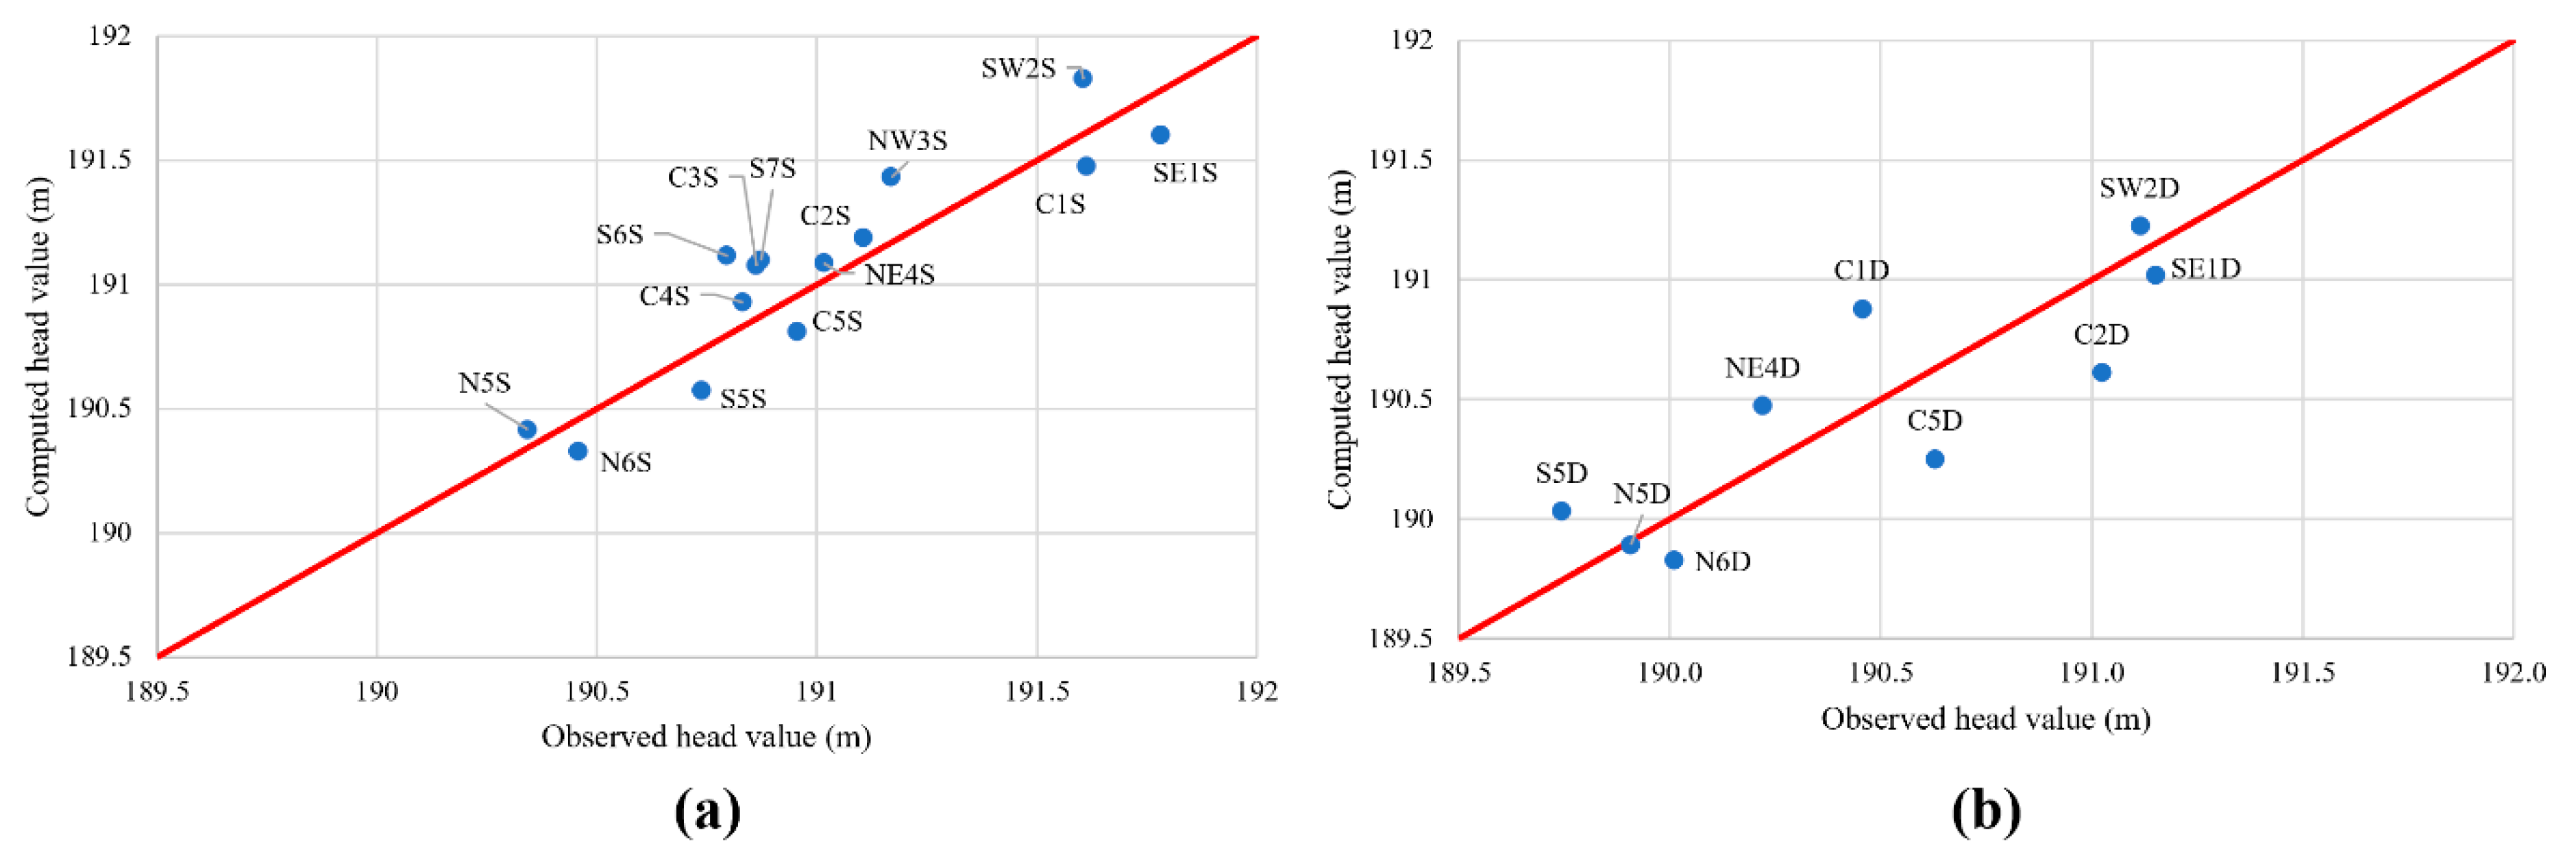
The RecoveryPark groundwater simulation model was calibrated by varying hydraulic conductivity parameters (Table 4) to optimize hydraulic head values. Through using differing hydraulic conductivity parameters, the residual between the observed values and calculated values showed a consistent reduction in mean error, which resulted in a reduction of uncertainty in the model. The final output from the groundwater simulation at RecoveryPark provides a conceptual model representing the behavior of neighborhood-scale groundwater. Figure 17 provides a comparison between the computed head levels and the observed ones. The Nash–Sutcliffe coefficient for the shallow and deeper groundwater model of RecoveryPark are NSE > 0.8 and NSE > 0.69, respectively.
4. Discussion
This study provides an initial start to defining urban groundwater movement in coastal urban cities in the Great Lakes Basin. The modeling of field data from the RecoveryPark field site and the broader Detroit metro-area highlights the lack of publicly available datasets while demonstrating pragmatic approaches to evaluate urban groundwater movement. These two approaches of groundwater movement modeling in four-integrated watersheds and localized scale in Detroit show how differences in scale yield diverse insights into assessing urban influences into groundwater flow.
4.1. Regional Scale Groundwater Model: Metro Detroit Watersheds
At the regional scale, both groundwater flows and groundwater depth generally agreed with results reported in past literature [6,31]. The regional modeling indicates that the groundwater in the region of Detroit watersheds is primarily a shallow aquifer placed on impermeable clay units and flows in sand layer units. Additionally, the model shows that groundwater can be found at a depth ranging from ~one to three meters below the ground surface. The probability of encountering groundwater decreases toward the east as it flows toward the southeast of the region [6]. Therefore, the groundwater gradient tends to the southeast direction, discharging into the Detroit River. There are many legacy contaminated sites located throughout the study area that include superfund sites and smaller-scale brownfields [45,46]. The general direction of groundwater flow is towards the Detroit River, creating potential pathways for the pollutants coming from these contaminated sites to reach drinking water sources for Detroiters. Moreover, since the water table is found at only a few meters below the land surface of Detroit city, volatile contaminants existing in the groundwater can easily intrude the upper zones and produce human and environmental health issues for this urbanized area.
4.2. Local Scale Model: RecoveryPark
This paper demonstrates techniques to evaluate the urban groundwater flow and assess an urban water budget. Previous studies at RecoveryPark focused on implementing green stormwater infrastructure for sustainable development [44,47], monitoring urban water cycles for understanding the effectiveness of green stormwater infrastructure [48] and interactions with urban water infrastructure [36]. The hydraulic conductance and bottom elevation of sewer lines applied to the local model manifest the groundwater interaction with the sewer line system as the urban infrastructure available at RecoveryPark. As the local model is built in one layer, the sewer lines are assumed to remain in that one layer to have their full interaction with local groundwater in steady-state modeling. By the full interaction term, we mean that the entire sewer lines are included in the model layer. The urban water budget portion of this paper focuses on evaluating the groundwater, while considering subsurface sewer networks and weather parameters.
4.2.1. Urban Water Budget
The RecoveryPark case study is unique as it accesses one of the few urban datasets housed on an open data platform through the USGS National Water Information System. The RecoveryPark field site provides a broad scope of site-specific data sets. While it does not apply to the larger Detroit area, it is a useful start to understand urban water fluxes and localized flow directions. The urban water budget evaluated in this paper represents an insight into episodic rainfall events, which differs from Hoard, Haefner, Shuster, Pieschek and Beeler [36], where urban water budgets were evaluated on a monthly and seasonal basis.
A review of the datasets at RecoveryPark confirms that the silty clay loam deposits located 3 m below the ground surface are hydraulically connected to the shallow fill zone. These results also show that the wells in the clay layer are horizontally connected, most likely as a result of sand lenses [32]. Evaluating the depth to water on a yearly basis shows a seasonal variation with a low depth to water in the summer. Periods of no data suggest the water table is not present or below the pressure transducers set in the groundwater wells.
The hydraulic head observed in the shallow wells did not always show a response to infiltration from rain events. Potential reasons for this include overland flow being directed into the sewer and not infiltrating and groundwater flow increases. Another consideration is that a large portion of the surface cover is utilized by GSI, which could direct water to areas not covered by the urban well field. March 2016 noted large increases in the hydraulic head at both the shallow and deeper wells, which may be an indication of rainwater melting and elevating the water table. The low changes in groundwater during May 2016 may reflect the drop in the water table during the warmer months of the year. This continued during the drop-in groundwater levels during the August 2016 study period.
The sewer systems did not have as large of an influence on the water outputs off the RecoveryPark site as the groundwater. RecoveryPark was originally designed as an experimental field site for green stormwater infrastructure. Groundwater is the controlling feature for moving precipitation on and off the study location because of this land use. Evapotranspiration also had a small impact on the overall water balance. Factors for evapotranspiration include the small scale of the study area and that the study periods specifically targeted periods of precipitation. Evapotranspiration showed consistent, rapid decreases during rain events at RecoveryPark, which is most likely due to increasing cloud cover and cooler temperatures.
The large excess water noted in Table 5 indicates that Equation (1) did not initially fully encompass all inputs and outputs of the urban water budget mass balance. Notably, soil moisture in the vadose zone above the shallow wells was absent. An initial review of the 2017 and 2018 soil water data demonstrates the importance of water retention in the vadose zone. The observed soil moisture data evaluated in this paper only represents the top 0.5 m at RecoveryPark. The calculated volume can account for a large amount of excess water at RecoveryPark, which would increase if extrapolated down to two to three meters below the surface to the water table.
GSI are important features of urban hydrologic interactions but these systems are contained within the study region. The sewer and groundwater elevation data were assumed to capture the subsurface GSI interactions. Therefore, the inputs and outputs measured in the urban water budget are assumed to be representative of the green stormwater infrastructure. Additionally, the soil cores taken at RecoveryPark show a confining clay layer located directly beneath the GSI. Our model assumes that this clay layer along with the shallow water table enable horizonal water movement that is captured by the wells.
4.2.2. Groundwater Model
The RecoveryPark groundwater simulation provides a city-block-scale estimate of groundwater flow over the study location. The local neighborhood scale modeling revealed a flow that is the opposite of the regional flow direction. Modeling results and field site data showed the higher hydraulic head in the southeast and the lower hydraulic head in the northwest [36]. This contrasting flow direction confirms that spatial location in urban areas impacts groundwater flow. The reasons for local changes in groundwater flow direction include heterogeneity of subsurface, and influences on the hydraulic head such as dewatering pumps may dictate neighborhood-scale flow direction. It demonstrates that local geology, disturbance patterns of the soil, anthropogenic activities, and urban setting, in general, have a large influence on localized groundwater flow patterns.
Furthermore, RecoveryPark models calibrated based on shallow and deeper observation wells show similar hydraulic head fluctuation values for depth to groundwater. This observation reflects the field data, where nested shallow and deeper wells show similar changes in hydraulic head. Since the models of shallow and deeper wells are under the same conditions of recharge, discharge, and boundary conditions, these models suggest that there is no confining condition up to the screened zone of deeper wells, which may cause changes in the groundwater fluctuation pattern at RecoveryPark.
4.3. Larger Impact on Southeast Michigan
High population density and industrial centers increase the susceptibility of shallow groundwater to contamination within the Great Lakes Basin. Since very few data are available in urban areas of the Great Lakes Region, developing groundwater models provide invaluable information for urban groundwater resource management [49]. This paper contributes to addressing the priority science of urban groundwater outlined by the last status report on the Great Lakes Water Quality Agreement provided by Grannemann and Van Stempvoort [49]. The paper represents a pragmatic way to evaluate shallow subsurface groundwater movement in southeast Michigan with the eventual goal of understanding the subsurface fate and transport in urban settings. Remediation sites are not limited to property boundaries, and through understanding regional and neighborhood-scale transport, decision-makers can better advise on public health concerns such as VOC exposure. Since the shallow water table occurs only a few meters below the ground surface, VOCs are able to transmit faster from groundwater to the upper unsaturated zone and ground surface. These hydrogeological characteristics of Detroit’s urban groundwater can increase the chances of soil vapor movement.
4.4. Limitations
This paper relies on publicly available data and is limited in its ability to expand these datasets to other areas of the metro-Detroit and Great Lakes Basin. The regional model covers a large segment of southeast Michigan and is not adequately covered by wells. The predictions of groundwater model results may be affected by many factors, for example, the sampling method of datasets, the structure of the groundwater conceptual model, and the deviation resulted from the mathematical solution of the groundwater model. Additionally, the scarcity of datasets, including pumping rate and hydraulic conductivity, creates uncertainty in both regional and neighborhood-scale models. The neighborhood-scale model for RecoveryPark has been calibrated using horizontal and vertical hydraulic conductivity as calibration parameters. However, a limited number of observation wells at the regional scale restrict the full calibration process of the regional model. This irregular distribution of wells limits the ability to support the datasets for further understanding and studies on the groundwater movement as well as transferring of contaminants in the groundwater. However, this model can provide useful results for initial assessments of the groundwater flow within the study area. These results are also beneficial in guiding the activities of data collection and combining large amounts of data for hydrological investigations.
At the RecoveryPark field site, several external factors limited the presented modeling work. The sewer data showed inconsistent readings, and the data were quality controlled only through 2016. Therefore, only data that underwent quality control was used in the municipal water budget. Unlike the precipitation, evapotranspiration, and sewer data, the shallow and deeper well values were derived from time-specific data. Soil moisture field data is limited to after August 2017. External factors, such as interstate highways close to the field site, may have a disproportionate influence on the groundwater flow of the region. The interstate freeways in this region are below ground and operate dewatering pumps.
5. Conclusions
Urban groundwater plays a critical role in the vitality of the Great Lakes Basin and is often difficult to characterize, given anthropogenic changes of subsurface hydrology. While data availability presents issues, this study demonstrates pragmatic methods to utilize existing datasets to start developing a multiscale understanding of near-surface groundwater movement. This study highlights the interconnected nature of natural and urban systems from the regional water drainage characteristics to neighborhood-scale hydrologic water flow. This project is leading research that provides sorely needed insights into general urban groundwater flow and transport in the Great Lakes region.
In this project, we developed a conceptual model of groundwater in the Detroit region located in four major watersheds, analyzed hydraulic head changes, and provide a baseline for understanding groundwater’s role in subsurface urban contaminant movement. In this model, we assumed a steady-state condition for the finite volume solution of the groundwater equations and considered some critical hydrogeological data such as precipitation and evaporation rates, rivers head and depth, soil layers with their hydraulic conductivities, and discharging wells. The regional model shows that there is shallow groundwater underlying the Detroit region and flowing from the northwest to the southeast within the study area. At RecoveryPark, the water balance demonstrated the difficulty in generating episodic urban water balances but provides insight into the controlling variables for water flow in urban settings. The neighborhood-scale simulation evaluated the small-scale heterogeneity of urban soils and subsurface infrastructure to provide a modeled flow direction on a city block basis. In the neighborhood-scale simulation, the local movement of groundwater is in the north direction, which is opposite to the regional groundwater flow. The different flow directions in local and regional scales imply the effect of urban settings on the behavior of groundwater resources. Understanding this difference is important in the accurate prediction of contaminant transport pathways and the effective application of remediation practices.
Author Contributions
Conceptualization, C.J.M.; data curation, S.T. and B.F.O.; formal analysis, S.T. and B.F.O.; funding acquisition, C.J.M.; investigation, S.T. and B.F.O.; methodology, S.T. and B.F.O.; project administration, S.T.; resources, S.T. and B.F.O.; software, S.T. and B.F.O.; supervision, C.J.M.; validation, S.T. and C.J.M.; visualization, S.T. and B.F.O.; writing—original draft, S.T., B.F.O. and C.J.M.; writing—review and editing, S.T., B.F.O. and C.J.M. All authors have read and agreed to the published version of the manuscript.
Funding
This study received financial support from Wayne State University through the Office of the Vice President for Research and from Healthy Urban Waters through the Fred A. and Barbara M. Erb Family Foundation and by the National Science Foundation (NSF) under Grant No. 1735038.
Institutional Review Board Statement
Not applicable.
Informed Consent Statement
Not applicable.
Data Availability Statement
Data are contained within the article. More detailed data may be requested from authors. The raw data sets can be accessed at the National Water Information System (USGS Water Data for the Nation available at https://nwis.waterdata.usgs.gov/mi/nwis, (accessed on 5 May 2020)), Michigan Department of Natural Resources Open Data (https://gis-midnr.opendata.arcgis.com/search?collection=Dataset, (accessed on 5 May 2020)), and Department of Environmental Quality (Wellogic System, available at https://secure1.state.mi.us/wellogic/Login.aspx?ReturnUrl=%2fwellogic%2fdefault.aspx, (accessed on 2 May 2020)).
Acknowledgments
The authors gratefully acknowledge the contributions of the United States Geological Survey and the United States Environmental Protection Agency work at RecoveryPark. Specifically, Ralph Haefner and Chris Hoard from USGS and William Shuster from Wayne State University for their work in providing RecoveryPark field data and background information. The authors appreciate RecoveryPark for providing a study location in the city of Detroit, MI.
Conflicts of Interest
The authors declare no conflict of interest. The funders had no role in the design of the study; in the collection, analyses, or interpretation of data; in the writing of the manuscript, or in the decision to publish the results.
References
- Bachmat, Y. Groundwater and aquifers. In Encyclopedia of Soils in the Environment, 1st ed.; Hillel, D., Ed.; Elsevier: Amsterdam, The Netherlands, 2005; Volume 2, pp. 153–168. [Google Scholar]
- Barcelona, M.J. Development and applications of groundwater remediation technologies in the USA. Hydrogeol. J. 2005, 13, 288–294. [Google Scholar] [CrossRef]
- Kavanaugh, M.C. Alternatives for Ground Water Cleanup, 2nd ed.; National Research Council, National Academies Press: Washington, DC, USA, 1994. [Google Scholar]
- Luo, J.; Lu, W.; Yang, Q.; Ji, Y.; Xin, X. An adaptive dynamic surrogate model using a constrained trust region algorithm: Application to DNAPL-contaminated-groundwater-remediation design. Hydrogeol. J. 2020, 28, 1285–1298. [Google Scholar] [CrossRef]
- Howard, K.; Gerber, R. Impacts of urban areas and urban growth on groundwater in the Great Lakes Basin of North America. J. Great Lakes Res. 2018, 44, 1–13. [Google Scholar] [CrossRef]
- Rogers, D.T. Environmental Geology of Metropolitan Detroit; Clayton Environmental Consultants Inc.: Novi, MI, USA, 1996. [Google Scholar]
- Guo, Y.; Holton, C.; Luo, H.; Dahlen, P.; Johnson, P.C. Influence of Fluctuating Groundwater Table on Volatile Organic Chemical Emission Flux at a Dissolved Chlorinated-Solvent Plume Site. Ground Water Monit. Remediat. 2019, 39, 43–52. [Google Scholar] [CrossRef]
- Qi, S.; Luo, J.; O’Connor, D.; Cao, X.; Hou, D. Influence of groundwater table fluctuation on the non-equilibrium transport of volatile organic contaminants in the vadose zone. J. Hydrol. 2020, 580, 124353. [Google Scholar] [CrossRef]
- Yu, L.; Rozemeijer, J.C.; Van Der Velde, Y.; van Breukelen, B.; Ouboter, M.; Broers, H.P. Urban hydrogeology: Transport routes and mixing of water and solutes in a groundwater influenced urban lowland catchment. Sci. Total Environ. 2019, 678, 288–300. [Google Scholar] [CrossRef] [PubMed]
- Bailey, R.T. Review: Selenium contamination, fate, and reactive transport in groundwater in relation to human health. Hydrogeol. J. 2016, 25, 1191–1217. [Google Scholar] [CrossRef]
- Chakraborti, D.; Rahman, M.M.; Das, B.; Chatterjee, A.; Das, D.; Nayak, B.; Pal, A.; Chowdhury, U.K.; Ahmed, S.; Biswas, B.K.; et al. Groundwater arsenic contamination and its health effects in India. Hydrogeol. J. 2017, 25, 1165–1181. [Google Scholar] [CrossRef]
- Hill, M.K. Understanding Environmental Pollution, 3rd ed.; Cambridge University Press: Cambridge, UK, 2010. [Google Scholar]
- Beckley, L.; McHugh, T. A conceptual model for vapor intrusion from groundwater through sewer lines. Sci. Total Environ. 2020, 698, 134283. [Google Scholar] [CrossRef]
- Bonneau, J.; Fletcher, T.D.; Costelloe, J.F.; Burns, M.J. Stormwater infiltration and the ‘urban karst’—A review. J. Hydrol. 2017, 552, 141–150. [Google Scholar] [CrossRef]
- Çiçek, A.; Bakiş, R.; Uğurluoğlu, A.; Köse, E.; Tokatli, C. The Effects of Large Borate Deposits on Groundwater Quality. Polish J. Environ. Stud. 2013, 22, 1031–1037. [Google Scholar]
- Dumouchelle, D.; Cummings, T.; Klepper, G.R. Michigan Ground-Water Quality; US Geological Survey Open-File Report 87-0732; USGS: Denver, CO, USA, 1987.
- Goovaerts, P.; AvRuskin, G.; Meliker, J.; Slotnick, M.; Jacquez, G.; Nriagu, J. Geostatistical modeling of the spatial variability of arsenic in groundwater of southeast Michigan. Water Resour. Res. 2005, 41. [Google Scholar] [CrossRef]
- Katz, B.G.; Eberts, S.M.; Kauffman, L.J. Using Cl/Br ratios and other indicators to assess potential impacts on groundwater quality from septic systems: A review and examples from principal aquifers in the United States. J. Hydrol. 2011, 397, 151–166. [Google Scholar] [CrossRef]
- Kim, M.-J.; Nriagu, J.; Haack, S. Arsenic species and chemistry in groundwater of southeast Michigan. Environ. Pollut. 2002, 120, 379–390. [Google Scholar] [CrossRef]
- Thomas, M.A. The effect of residential development on ground-water quality near detroit, Michigan. JAWRA J. Am. Water Resour. Assoc. 2000, 36, 1023–1038. [Google Scholar] [CrossRef]
- Miller, C.J.; Runge-Morris, M.; Cassidy-Bushrow, A.E.; Straughen, J.K.; Dittrich, T.M.; Baker, T.R.; Petriello, M.C.; Mor, G.; Ruden, D.M.; O’Leary, B.F.; et al. A Review of Volatile Organic Compound Contamination in Post-Industrial Urban Centers: Reproductive Health Implications Using a Detroit Lens. Int. J. Environ. Res. Public Health 2020, 17, 8755. [Google Scholar] [CrossRef]
- Cassidy-Bushrow, A.E.; Peters, R.M.; Johnson, D.A.; Templin, T.N. Association of depressive symptoms with inflammatory biomarkers among pregnant African-American women. J. Reprod. Immunol. 2012, 94, 202–209. [Google Scholar] [CrossRef]
- Forand, S.P.; Lewis-Michl, E.L.; Gomez, M.I. Adverse Birth Outcomes and Maternal Exposure to Trichloroethylene and Tetrachloroethylene through Soil Vapor Intrusion in New York State. Environ. Health Perspect. 2012, 120, 616–621. [Google Scholar] [CrossRef] [Green Version]
- Herdt-Losavio, M.L.; Lin, S.; Druschel, C.M.; Hwang, S.-A.; Mauer, M.P.; Carlson, G.A. The Risk of Having a Low Birth Weight or Preterm Infant among Cosmetologists in New York State. Matern. Child Health J. 2008, 13, 90–97. [Google Scholar] [CrossRef]
- Montero-Montoya, R.; López-Vargas, R.; Arellano-Aguilar, O. Volatile Organic Compounds in Air: Sources, Distribution, Exposure and Associated Illnesses in Children. Ann. Glob. Health 2018, 84, 225–238. [Google Scholar] [CrossRef] [Green Version]
- MDHHS. Rate of Live Births by Age of Mother and Prematurity Classification Michigan 2018. Available online: http://www.mdch.state.mi.us/osr/chi/births14/frameBxChar.html (accessed on 25 July 2020).
- Stafford, K.; Tanner, K.; Guillen, J. As Mayor Mike Duggan Touts Make Your Date’s Success, Detroit’s Preterm Birth Rate Spikes. Available online: https://www.freep.com/story/news/investigations/2019/11/07/detroit-preterm-birth-rate-make-your-date/4156777002/ (accessed on 21 August 2020).
- Cassidy-Bushrow, A.E.; Burmeister, C.; Lamerato, L.; Lemke, L.D.; Mathieu, M.; O’Leary, B.F.; Sperone, F.G.; Straughen, J.K.; Reiners, J.J. Prenatal airshed pollutants and preterm birth in an observational birth cohort study in Detroit, Michigan, USA. Environ. Res. 2020, 189, 109845. [Google Scholar] [CrossRef] [PubMed]
- McDonald, M.G.; Harbaugh, A.W. A Modular Three-Dimensional Finite-Difference Ground-Water Flow Model; USGS (United States Government Printing Office): Denver, CO, USA, 1988.
- Mozola, A.J. Geology for Land and Groundwater Development in Wayne County; State of Michigan Department of Natural Resources, Geology Survey: Lansing, MI, USA, 1969. [Google Scholar]
- Wisler, C.O.; Stramel, G.J.; Laird, L.B. Water Resources of the Detroit Area, Michigan; U.S. Department of the Interior: Washington, DC, USA, 1952; Volume 183.
- Howard, J.L. Quaternary Geology of the Detroit, Michigan Quadrangle and Surrounding Areas; Department of Geology, Wayne State University: Detroit, MI, USA, 2013. [Google Scholar]
- Leverett, F. Flowing Wells and Municipal Water Supplies on the Southern Portion of the Southern Peninsula of Michigan; USGS (United States Government Printing Office): Washington, DC, USA, 1906.
- Mozola, A.J. A Survey of Groundwater Resources in Oakland County, Michigan; Doctoral Dissertation, Syracuse University: Syracuse, NY, USA, December 1953. [Google Scholar]
- Henriette, C.V. Anna Kohn of RecoveryPark Talks Jobs, Opportunity and Impact. Available online: https://detroitisit.com/detroit-works-anna-kohn-of-recovery-park-jobs-impact-oppertunity/ (accessed on 25 July 2020).
- Hoard, C.J.; Haefner, R.J.; Shuster, W.D.; Pieschek, R.L.; Beeler, S. Full Water-Cycle Monitoring in an Urban Catchment Reveals Unexpected Water Transfers (Detroit MI, USA). JAWRA J. Am. Water Resour. Assoc. 2019, 56, 82–99. [Google Scholar] [CrossRef] [PubMed]
- USGS. National Water Information System Data Available on the World Wide Web (USGS Water Data for the Nation), United States Geological Survey. Available online: https://waterdata.usgs.gov/mi/nwis (accessed on 5 May 2020).
- Michigan Department of Natural Resources. DNR Open Data. Available online: https://gis-midnr.opendata.arcgis.com/search?collection=Dataset (accessed on 5 May 2020).
- Wellogic System. Department of Environmental Quality (DEQ), State of Michigan’s Statewide Groundwater Database. Available online: https://secure1.state.mi.us/wellogic/Login.aspx?ReturnUrl=%2fwellogic%2fdefault.aspx (accessed on 2 May 2020).
- Aquaveo. GMS: UGrid Module. Available online: https://www.xmswiki.com/wiki/GMS:UGrid_Module (accessed on 15 December 2019).
- EGLE. Michigan’s Major Watersheds. Available online: https://www.michigan.gov/egle/0,9429,7-135-3313_3684_3724---,00.html (accessed on 3 March 2020).
- Panday, S.; Langevin, C.D.; Niswonger, R.G.; Ibaraki, M.; Hughes, J.D. MODFLOW–USG Version 1: An Unstructured Grid Version of MODFLOW for Simulating Groundwater Flow and Tightly Coupled Processes Using a Control Volume Finite-Difference Formulation; 2328-7055; USGS: Reston, VA, USA, 2013.
- Howard, J.L.; Olszewska, D. Pedogenesis, geochemical forms of heavy metals, and artifact weathering in an urban soil chronosequence, Detroit, Michigan. Environ. Pollut. 2011, 159, 754–761. [Google Scholar] [CrossRef]
- Pieschek, R.; Carpenter, D. Modeling green infrastructure in the support of the re-development of Detroit’s neighborhoods. In Proceedings of the World Environmental and Water Resources Congress 2016, West Palm Beach, FL, USA, 22–26 May 2016; pp. 247–254. [Google Scholar]
- Aichele, S.S. Ground-Water Quality Atlas of Oakland County, Michigan; Water-Resources Investigation 00-4120; USGS: Lansing, MI, USA, 2000.
- EGLE. Environmetal Mapper. Available online: https://www.mcgi.state.mi.us/environmentalmapper/# (accessed on 2 May 2020).
- Zhang, K.; Chui, T.F.M. A review on implementing infiltration-based green infrastructure in shallow groundwater environments: Challenges, approaches, and progress. J. Hydrol. 2019, 579. [Google Scholar] [CrossRef]
- Carpenter, D.D.; Pieschek, R.L.; Drummond, C.D. Documenting the Urban Water Cycle and Implications for Determining the Effectiveness of Transforming the Landscape with Green Stormwater Infrastructure. In Proceedings of the 10th Novatech Conferenace, Lyon, France, 1–5 July 2019. [Google Scholar]
- Grannemann, G.; Van Stempvoort, D. Groundwater Science Relevant to the Great Lakes Water Quality Agreement: A Status Report. Environment and Climate Change Canada and U.S. Environmental Protection Agency, May 2016. Available online: https://binational.net/2016/06/13/groundwater-science-f/ (accessed on 5 November 2020).
Figure 1.
Hypothetical scheme of hydrogeological cycle in the Detroit region.

Figure 2.
Interpolated surficial deposits cross-section of metropolitan Detroit (based on a cross-section from [6]).
Figure 2.
Interpolated surficial deposits cross-section of metropolitan Detroit (based on a cross-section from [6]).

Figure 3.
Location map for RecoveryPark. City of Detroit boundaries are shown by the dashed lines, and RecoveryPark location is shown by the red dot.
Figure 3.
Location map for RecoveryPark. City of Detroit boundaries are shown by the dashed lines, and RecoveryPark location is shown by the red dot.

Figure 4.
Site map at RecoveryPark with shallow wells, deeper wells, sewer in-pipe meter locations, and weather station. Wells start with RP, and in-pipe sewer meters are alphabetically labeled.
Figure 4.
Site map at RecoveryPark with shallow wells, deeper wells, sewer in-pipe meter locations, and weather station. Wells start with RP, and in-pipe sewer meters are alphabetically labeled.

Figure 6.
Subsurface vertical profile of observed features at the RecoveryPark study site. Hydraulic head is an example hydraulic head based on the average October 2015 well data.
Figure 6.
Subsurface vertical profile of observed features at the RecoveryPark study site. Hydraulic head is an example hydraulic head based on the average October 2015 well data.

Figure 7.
Daily totals of precipitation at RecoveryPark.

Figure 8.
Evapotranspiration values for RecoveryPark over the four study periods.

Figure 9.
In-pipe sewer flow meter data for RecoveryPark over the four-study period.

Figure 10.
Groundwater head levels at shallow wells at RecoveryPark over the four study periods.

Figure 11.
Inverse distance weighted model of groundwater above mean sea level (meters) for shallow wells on 13 March 2016 (left), and 17 March 2016 (center). The legend for these models is on the left side. The change in the hydraulic head is measured by the net decrease and net increase map on the right with the legend located in the top right of the map. In this example, there was no net decrease observed.

Figure 12.
Example figure showing changes in volumetric soil moisture over a five-day period with a rain event. Volumetric soil moisture is on the left axis, while precipitation is on the right axis. The orange line is soil moisture near the surface, the grey line is at ~0.3 m below the surface, and the yellow line is ~0.5 m below the surface.

Figure 13.
Sewer pipes’ location and hydraulic conductivity zones in the RecoveryPark model. The numbers are the depth at which the sewer junctions are located.
Figure 13.
Sewer pipes’ location and hydraulic conductivity zones in the RecoveryPark model. The numbers are the depth at which the sewer junctions are located.

Figure 14.
The initial model of groundwater flow in the region of Detroit watersheds.

Figure 15.
Quarterly calculated water balances at RecoveryPark. Values are shown next to the bar graphs. Evapotranspiration is <100 m3 and not shown in text form.
Figure 15.
Quarterly calculated water balances at RecoveryPark. Values are shown next to the bar graphs. Evapotranspiration is <100 m3 and not shown in text form.

Figure 16.
Groundwater head model at RecoveryPark calibrated by (a) shallow (b) deeper observation wells.
Figure 16.
Groundwater head model at RecoveryPark calibrated by (a) shallow (b) deeper observation wells.

Figure 17.
Computed head values vs. observed head values at (a) shallow (b) deeper groundwater model of RecoveryPark.
Figure 17.
Computed head values vs. observed head values at (a) shallow (b) deeper groundwater model of RecoveryPark.

Table 2.
Hydraulic conductivity of stratigraphic units assumed in the model.
| Stratigraphic Unit | Hydraulic Conductivity (m/day) |
|---|---|
| Moraine Unit | |
| Sand Clay Unit | |
| Sand Unit | |
| Sandy and Silty Clay Unit | |
| Clay Unit |
Table 3.
Overview of field data used over the one-year period.
| Dates | Start Time | Precipitation | Evapotranspiration | Sewer Data | Shallow Wells Online | Deeper Wells Online |
|---|---|---|---|---|---|---|
| 27–31 October 2015 | 12:00 p.m. | Continuous 5-min data | Continuous 60-min data | Meter E, Meter F | 1 | 4 |
| 13–17 March 2016 | 12:00 a.m. | Meter E, Meter F | 14 | 8 | ||
| 10–14 May 2016 | 12:00 p.m. | Meter E, Meter F | 14 | 9 | ||
| 11–15 August 2016 | 12:00 a.m. | Meter E, Meter F | 4 | 8 |
Table 4.
Details of sink/sources inputs for calibrated RecoveryPark model.
| Parameter | Values |
|---|---|
| Precipitation (m) 1 | 1.524 × 10⁻³ |
| Horizontal hydraulic conductivity (m/d) (obtained after calibration process) | Zone 1: 1.818 × 10⁻³ |
| Zone 2: 8.738 × 10⁻³ | |
| Zone 3: 3.141 × 10⁻³ | |
| Zone 4: 3.830 × 10⁻² | |
| Zone 5: 1.0 | |
| Zone 6: 9.298 × 10⁻³ | |
| Vertical hydraulic conductivity (m/d) in all zones (obtained after calibration process) | 0.5 |
| Evapotranspiration rate (m/d) 1 | 4 × 10⁻⁶ |
1 USGS [37] data.
Table 5.
Totaled values for each precipitation event.
| Date | 27–31 October 2015 | 13–17 March 2016 | 10–14 May 2016 | 11–15 August 2016 |
|---|---|---|---|---|
| Units | m3 | m3 | m3 | m3 |
| Precipitation | 9509.10 | 7859.12 | 4863.10 | 8032.80 |
| Evapotranspiration | −39.97 | −62.74 | −85.15 | −97.65 |
| Sewer Flow | −1370.63 | −2715.42 | −1561.84 | −2130.72 |
| Change in Storage | −2188.24 | 8550.26 | 119.67 | −719.84 |
| Excess | 5910.269 | 13,631.22 | 3335.781 | 5084.59 |
Publisher’s Note: MDPI stays neutral with regard to jurisdictional claims in published maps and institutional affiliations. |
© 2021 by the authors. Licensee MDPI, Basel, Switzerland. This article is an open access article distributed under the terms and conditions of the Creative Commons Attribution (CC BY) license (https://creativecommons.org/licenses/by/4.0/).
Share and Cite
MDPI and ACS Style
Teimoori, S.; O’Leary, B.F.; Miller, C.J. Modeling Shallow Urban Groundwater at Regional and Local Scales: A Case Study in Detroit, MI. Water 2021, 13, 1515. https://doi.org/10.3390/w13111515
AMA Style
Teimoori S, O’Leary BF, Miller CJ. Modeling Shallow Urban Groundwater at Regional and Local Scales: A Case Study in Detroit, MI. Water. 2021; 13(11):1515. https://doi.org/10.3390/w13111515
Chicago/Turabian StyleTeimoori, Sadaf, Brendan F. O’Leary, and Carol J. Miller. 2021. "Modeling Shallow Urban Groundwater at Regional and Local Scales: A Case Study in Detroit, MI" Water 13, no. 11: 1515. https://doi.org/10.3390/w13111515
Note that from the first issue of 2016, this journal uses article numbers instead of page numbers. See further details here.