
Flood Inundation Analysis in Penang Island (Malaysia) Based on InSAR Maps of Land Subsidence and Local Sea Level Scenarios


1
School of Physics, Universiti Sains Malaysia, Penang 11800, Malaysia
2
School of Housing, Building, and Planning, Universiti Sains Malaysia, Penang 11800, Malaysia
*
Author to whom correspondence should be addressed.
Water 2021, 13(11), 1518; https://doi.org/10.3390/w13111518
Submission received: 30 March 2021
/
Revised: 23 May 2021
/
Accepted: 26 May 2021
/
Published: 28 May 2021
(This article belongs to the Special Issue Coastal Hazards Management)
Abstract
:Penang Island is an important economic center in Malaysia and most of its population live in the coastal areas. Although previous studies have shown that it is vulnerable to rising sea levels, the combination of sea-level rise and local land subsidence would be devastating. Therefore, the objective of this study is to apply the local land subsidence model to estimate the inundated areas which relate to sea level rise by 2100. Land subsidence is quantified by the SBAS-InSAR technique on the basis of Sentinel-1 radar images for both ascending and descending tracks. For the first time, the geostatistical analyst method is used to merge the different track results and create the land subsidence models, the results show this method can maximize land deformation fields and minimize deformation errors. According to the land deformation results, all of the coastlines in the east of the island have differing medium levels of subsidence, especially in reclaimed lands and building areas. Lastly, the bathtub model is used to quantify the inundated areas by combing regional sea-level rise projection and local land subsidence models under CoastalDEM in 2100 projections. The results of this study indicate land subsidence that would increase 2.0% and 5.9% of the inundated area based on the different scenarios by 2100 projections.
1. Introduction
The change in relative sea level is the result of rising sea levels and vertical land movement. Over the last few decades, these issues had posed a major threat to coastal areas. Particularly, most South-East Asia countries are vulnerable, as a large percent of the population and economic activities are concentrated along the coastlines.
The United Nation’s Intergovernmental Panel on Climate Change (IPCC) Fifth Assessment Report (AR5) projected that the global sea level would rise from 0.28 m to 0.98 m by the end of this century using different Representative Concentration Pathway (RCP) models [1]. In Peninsular Malaysia, the regional data showed that the mean sea level is expected to rise from 0.14 m to 0.17 m in 2040, and from 0.25 m to 0.52 m in 2100 (relative to 2010), some of the relative high magnitudes can be found on the west coasts, like the low-lying area of Penang Island [2]. However, the adjustment of a complex regional geological structure may also have significant influences on relative sea-level change, such as glacial isostatic adjustment [3] and great earthquakes [4]. In addition, land subsidence is increasing at a much faster rate than the natural sea-level rise in coastal areas, which will result in inundated areas associated with the sea-level rise that are several times larger than previously predicted [5,6,7].
In Penang Island, the influences of both sea-level rise and tsunami on potentially inundated areas were analyzed in [2]. The results concluded that 30% of coastal land would be submerged in the worst-case tsunami inundation model, meanwhile, most people live in these areas. However, tsunamis, typhoons, and earthquakes are rare because of their special geographical location, and the study still fails to provide an analysis of the growing local land subsidence rate.
Currently, the majority of land subsidence monitoring tools are traditional techniques, such as benchmark data [8], Global Positioning System (GPS) [9], and geophysical investigation method (electronic distance measuring) [10]. Although these methods have a lot of advantages in terms of measurement accuracy, they are not sensitive to spatial information, costly, and time- and labor-intensive [11,12,13]. In contrast to these conventional single-point-measuring methods, Interferometric Synthetic Aperture Radar (InSAR) is a valuable remote sensing technique that has demonstrated a prominent ability to work on all-weather, all-day for mapping slow land movement in a large area [14,15]. Of these, the standard Differential InSAR (DInSAR) method adopts phase differences between at least two images to evaluate the distance traveled by the ground targets. Nevertheless, the applications are limited by temporal and spatial decorrelation, external Digital Elevation Model (DEM) error, and atmosphere phase delay [16,17]. In this context, the time series InSAR (MT-InSAR) technique was designed to minimize these effects from multiple radar images [18,19]. The Small Baseline Subset InSAR (SBAS-InSAR) technique is one of the most widely used MT-InSAR techniques [20], which had been successfully applied to extract land deformation by using various SAR images. Furthermore, the performance and accuracy of the SBAS-InSAR technique have also been proved in a variety of applications. For example, Sowter et al. described land subsidence in Mexico City using the SBAS-InSAR technique, indicating a −0.48 cm/year deformation rate over the whole study area, and the efficiency of single look complex (SLC) products was proved [21].
The most common InSAR post-processing method is to combine the different track results to calculate 3D ground deformation [22,23,24], but there are the following two issues that remain unsolved: (1) The InSAR derived results in different tracks must be obtained from the same ground points, instead of the same pixels. Since a single pixel in an InSAR image could represent several square meters and a large number of ground targets. This means that all of these ground targets may contribute to the same pixel; (2) The second is that only a few of the pixels can be used for deformation monitoring, especially in densely vegetated areas where radar image correlations are lower. Therefore, conventional 3D decomposition methods could derive misleading results, and these issues are difficult to correct. This can show how to use the different track results more effectively, which needs to be further discussed.
To present the influences of land subsidence on inundated areas associated with a projected sea-level rise by 2100 in Penang Island. In this study, we utilized the SBAS-InSAR technique and Sentinel-1 data to identify land subsidence from January 2018 to August 2020 in both ascending and descending tracks. The geostatistical analyst method was used to further process the InSAR results and help to create a land subsidence model. Finally, CoastalDEM was used to obtain the inundated areas, which has been proved to be more useful than other commonly used DEMs.
2. Study Area and Data Sets
2.1. Study Area
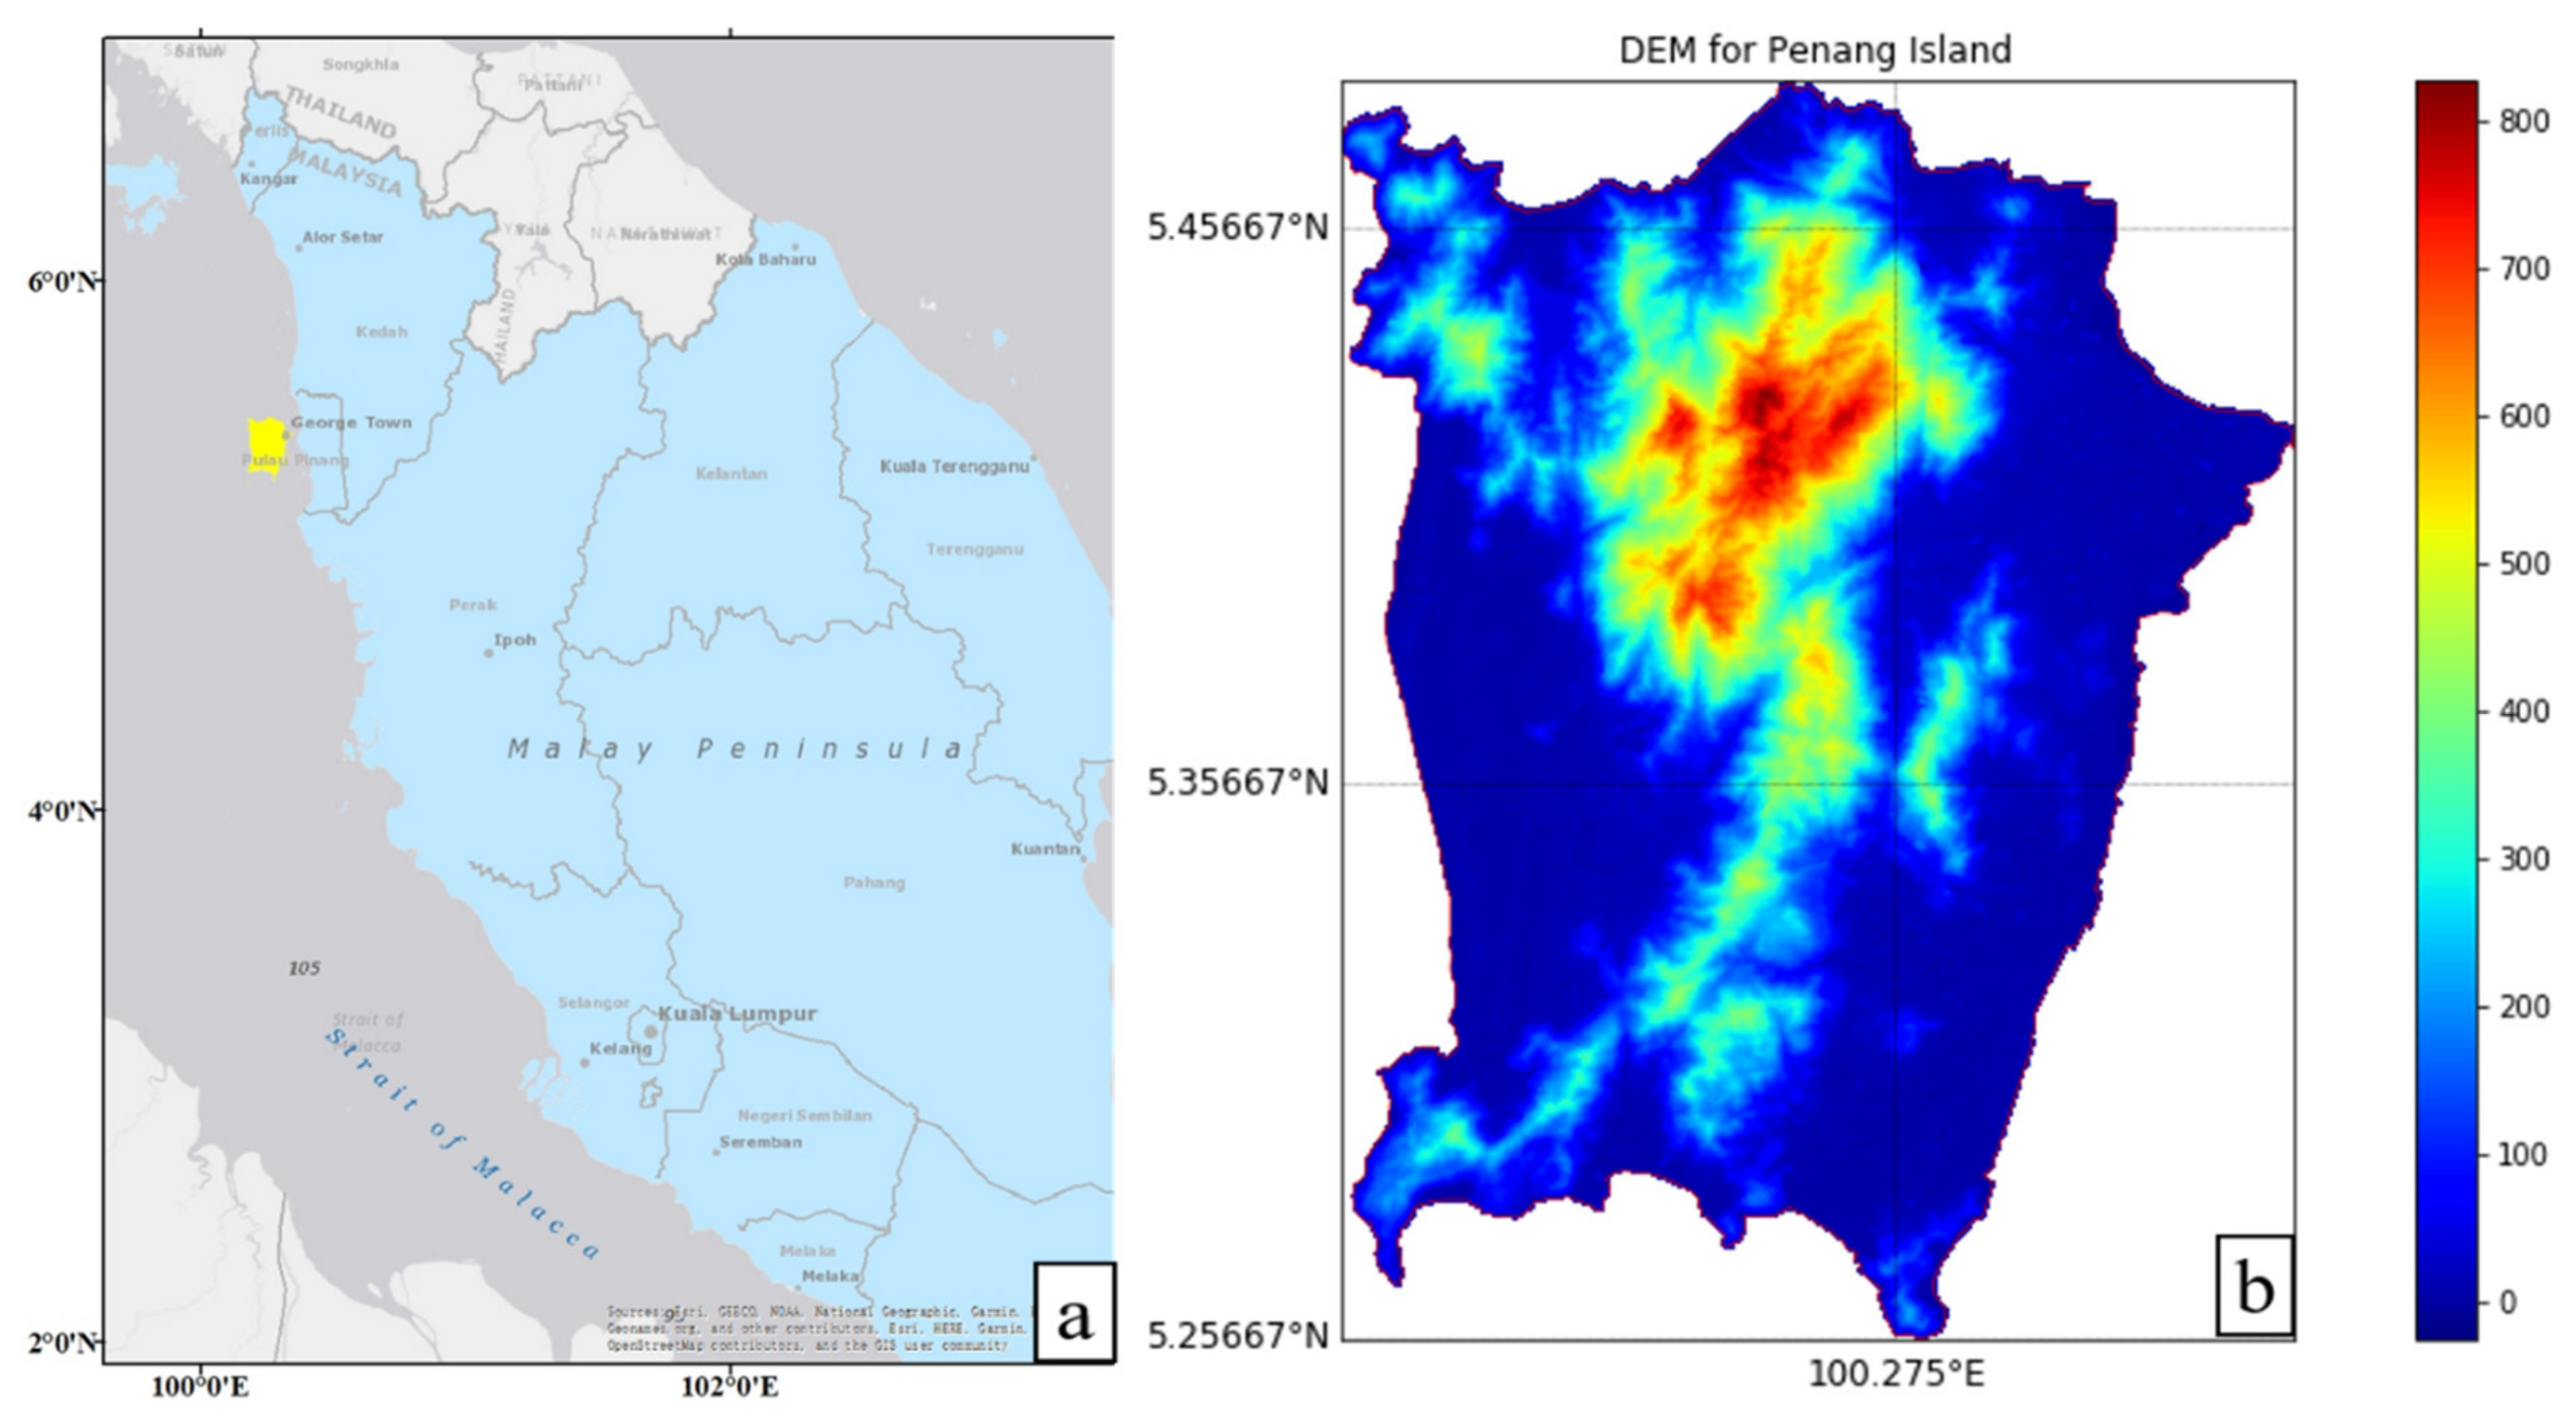
Penang Island was chosen as the primary case of the study (with a land area of 293 km2), located at the Malacca Strait, off the northwestern coast of Peninsular Malaysia (Figure 1a). According to the Department of Statistics, Penang state has a 90.8% urbanization rate, with the population has increased from 722,384 (2465/km2) in 2010 to 808,900 (2760/km2) in 2018. As a tropical island, the relative humidity varies from 60.9% to 96.8%, and the annual rainfall ranges from 2670 mm to 3250 mm. In this context, the majority of this island is covered in dense vegetation. In order to address the shortage of land, reclaimed lands have increased from 0.4 km2 (0.1%) in 1960 to 9.5 km2 (3.2%) in 2015, and it is expected to reach 32.3 km2 in 2030 with the new construction projects completed [25]. The elevation is given in meters in (Figure 1b), 16% of the island is below 5m above mean sea level, the higher elevation can be seen in the central island. Geographically, Penang is in the northern hemisphere, which is close to the equator. The low latitude induces the weak geostrophic deflection force (Coriolis force), which makes tropical cyclone development difficult. In addition, it is also outside of the Circum-Pacific seismic belt area, even though the 2004 Indian Ocean earthquake and tsunami had only limited influence. The whole island can be divided into five main geological units: (1) unconsolidated marine clay, sand, and gravel deposit; (2) medium to coarse-grained biotite granite; (3) fine to coarse-grained biotite granite; (4) fine-grained biotite granite; (5) reclaimed land (fine-grained sands) [26,27].
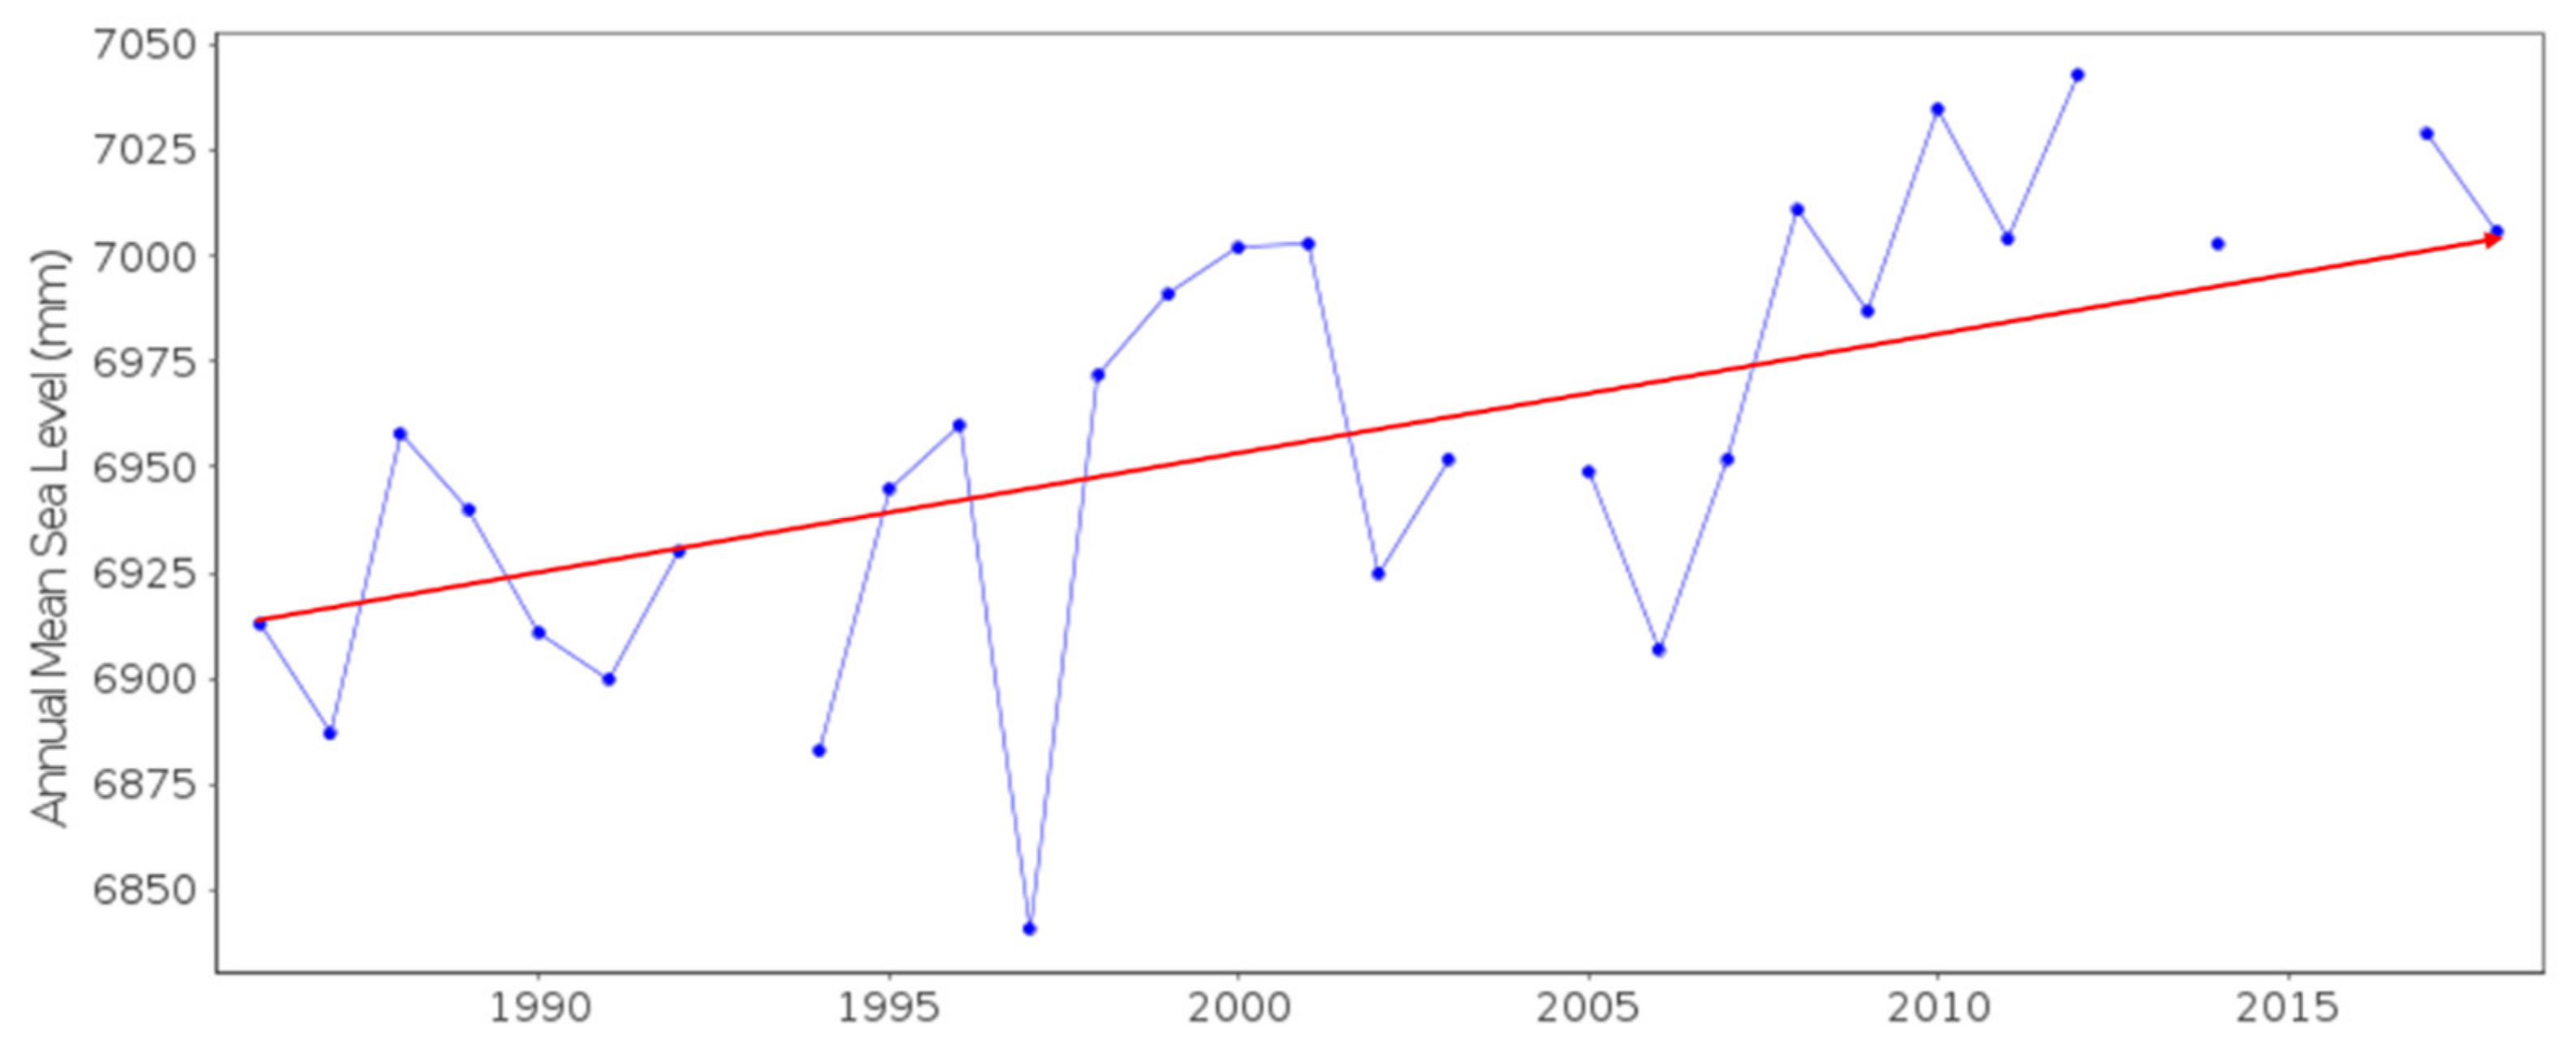
As has been demonstrated in Jakarta [28], Vietnam [29], and Shanghai [30], rising sea levels play an important role in flooding, shoreline erosion, and hazards from storms. Particularly, in South-East Asia, most of the population lives in densely populated coastal areas. In Malaysia, a previous study showed a 1-m rise in sea level would result in the loss of 7000 km2 land area [31]. As it is an important industrial center, Penang Island has experienced an average sea level rise rate of 3.2 mm/year over the past three decades, as shown in Figure 2. Within this trend, the sea level is likely to rise 320 mm to 7320 mm above 2000 levels by 2100. Even so, land subsidence models are not considered. Therefore, most coastal lands would be submerged because of the relatively low elevation.
2.2. Data Description
Sentinel-1A the Terrain Observation with Progressive Scans (TOPS) SAR Interferometric Wide Swath Mode (IW) single-look complex (SLC) products were acquired from January 2018 to August 2020, including 24 scenes descending track and 32 scenes ascending track. Moreover, each image covers a 250 km-wide area with a spatial resolution of 5 m × 20 m (range × azimuth). Sentinel-1 is the first Copernicus Program satellite developed by the European Space Agency (ESA), a constellation of two SAR satellites (Sentinel-1A and Sentinel-1B) each carrying a C-band SAR instrument (5.405 GHz). Both satellites are on a sun-synchronous near-polar orbit with a revisit time of 12 days, operate in the ascending (satellite travels from the south pole towards the north pole) and descending tracks (satellite travels from the north pole towards the south pole).
SARscape is one of the radar interferometry software for processing remote sensing data that is designed as a module of ENVI. All Sentinel-1 images in the Single Look Complex (SLC) format were employed to extract deformation maps by ENVI, and ArcGIS software was used to further process or refine data.
CoastalDEM (with a resolution of 90 m) was applied to detect flooding threats, which is a product of Climate Central that has high precision in low-lying coastal areas and using an artificial neural network to reduces median errors to near zero in NASA’s widely used SRTM DEM. In addition, the Precise Orbit Determination (POD) precise orbit ephemerides were used to reduce the errors of calculation. The Landsat-8 multi-spectral image with a spatial resolution of 30 m and a full-color band of 15 m was used as a background of the inundation map.
3. Methodology
3.1. Insar Technique Processing
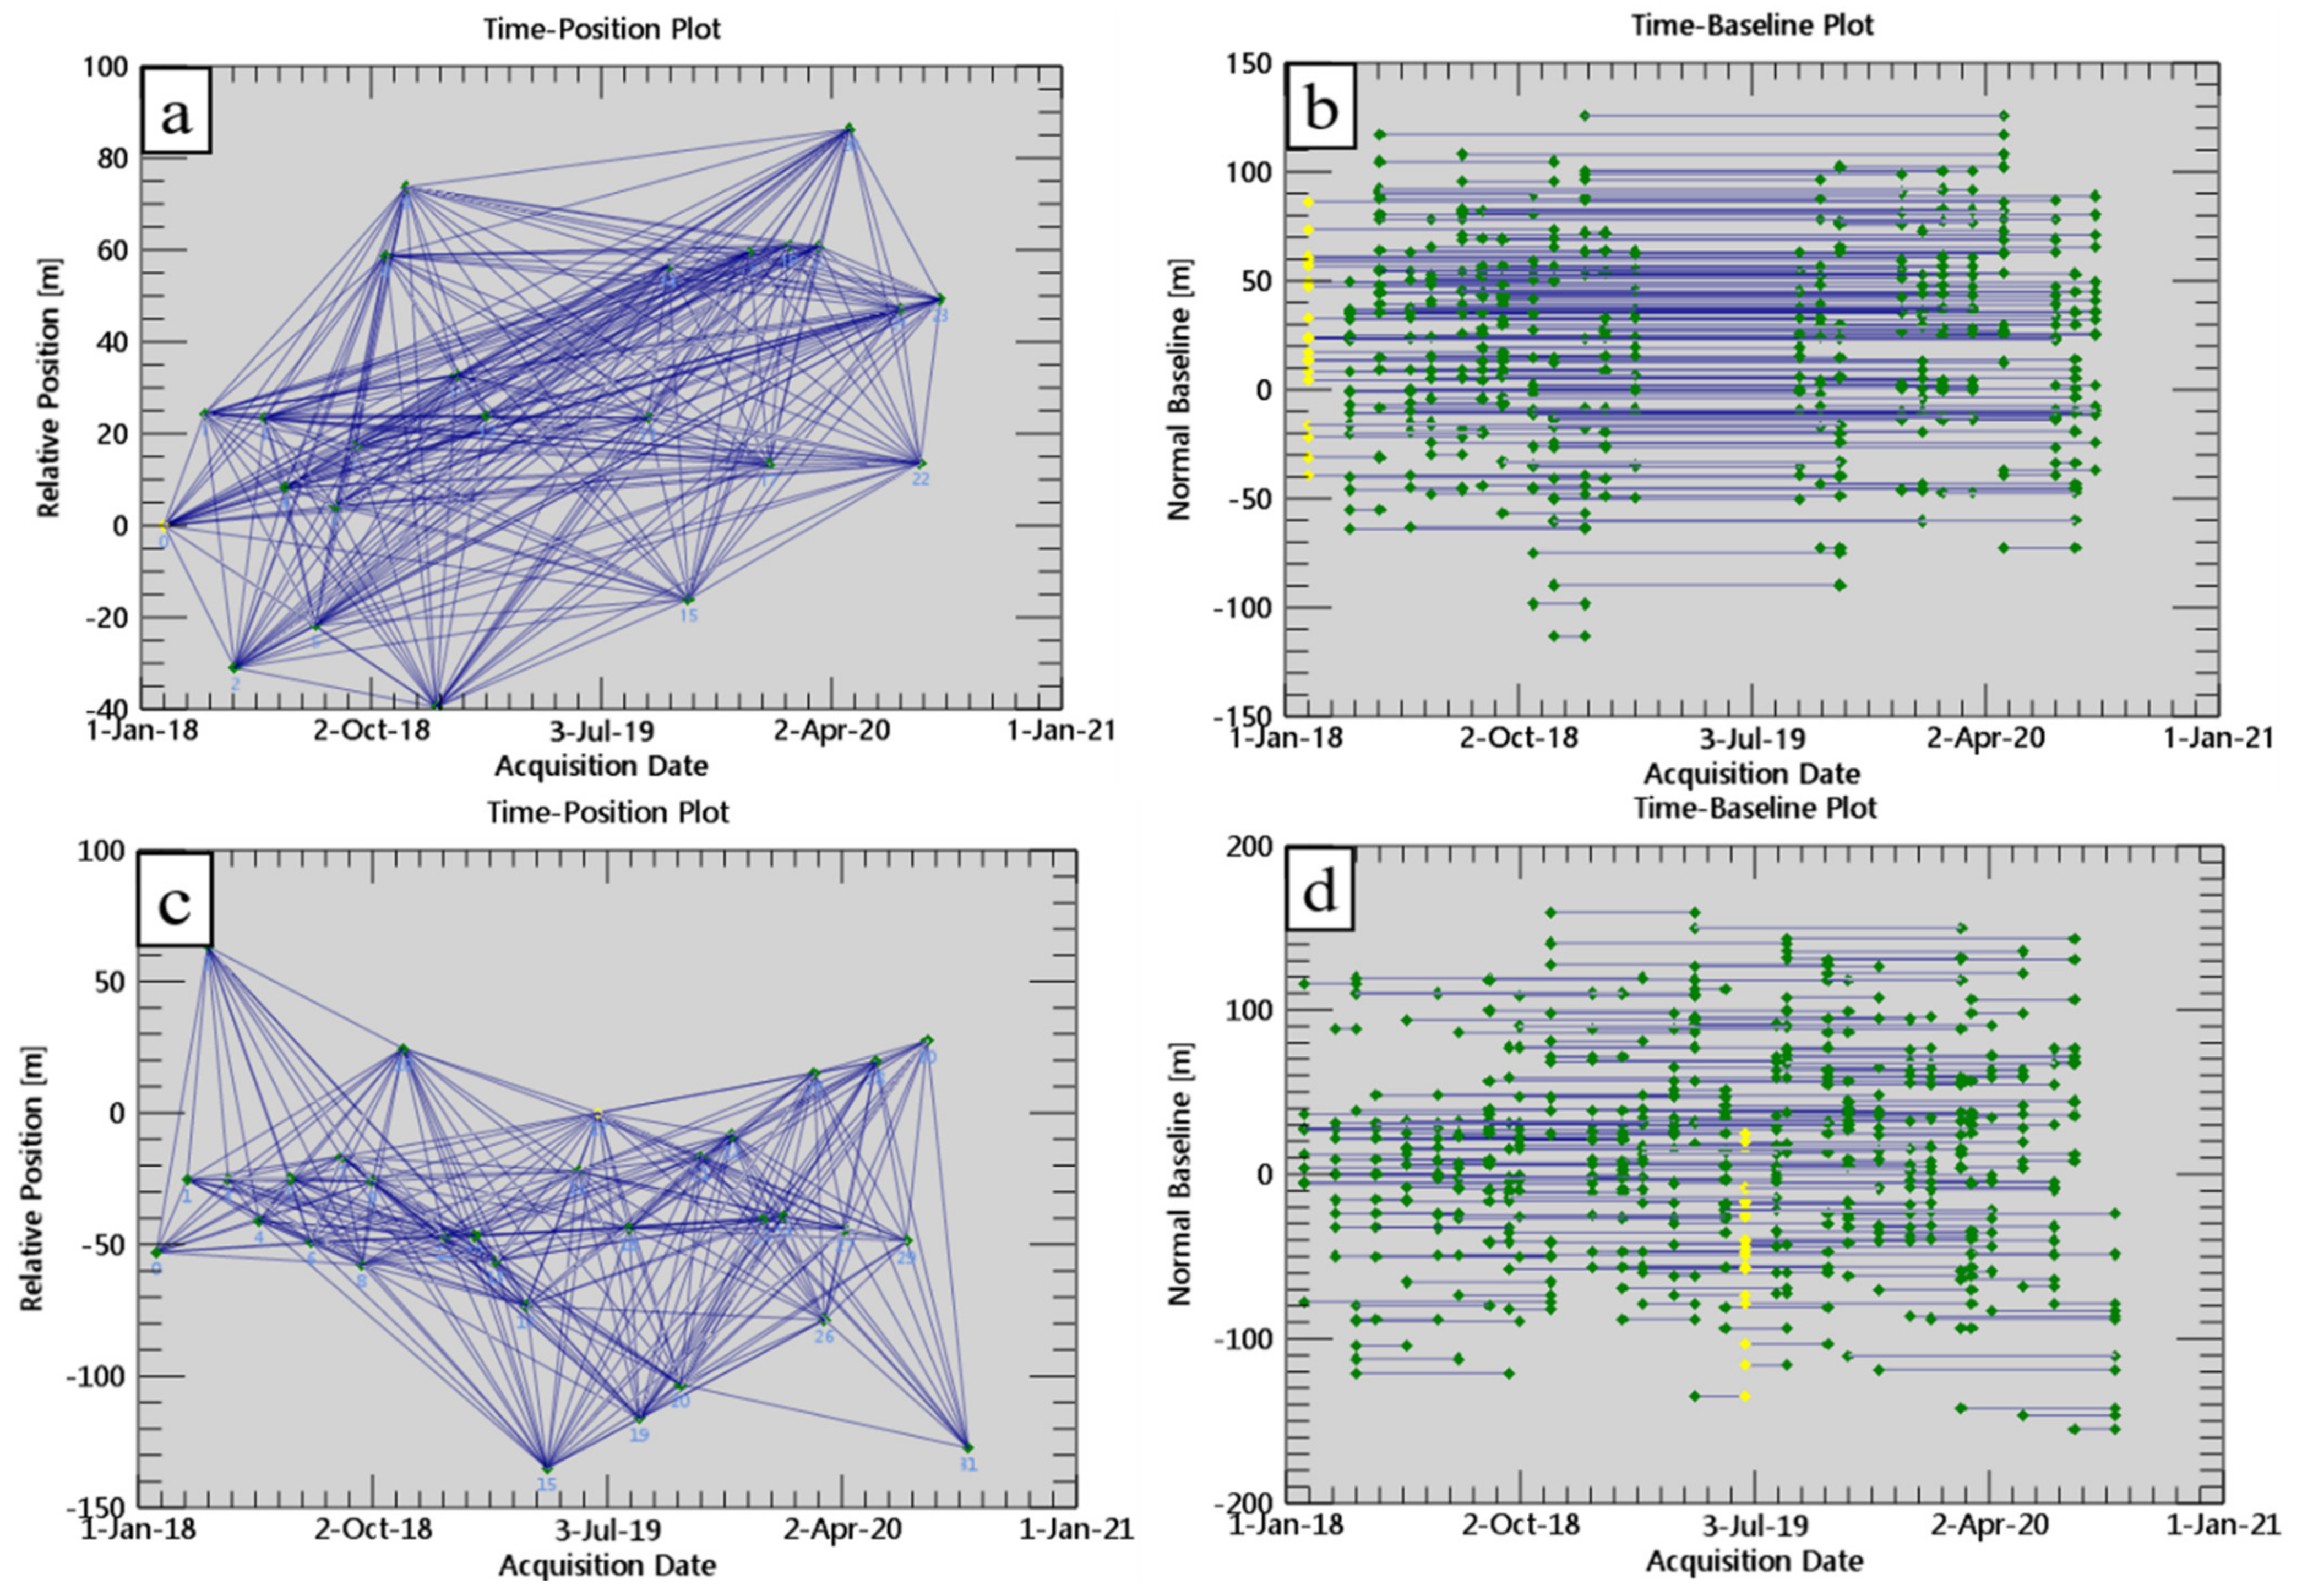
Previous studies have shown that the SBAS-InSAR technique can effectively solve the poor coherence of InSAR images and obtain more accurate results in such densely vegetated areas [32,33,34]. Therefore, it was used to process Sentinel-1 images and obtain land deformation in this study. The principle of this method is to divide SAR images into various short baseline subsets (both spatial and temporal baselines) to limit the spatial decorrelation and obtain a series of interferograms by combining multiple SAR radar images with high-quality coherent points [35]. Then, the Singular Value Decomposition (SVD) method is used to invert land deformation [36]. In the process, high coherence of stable ground control points (GCPs) have been chosen by the following criteria [37]: (1) the location is far away from the large deformation area; (2) previous research and field investigations confirmed that the land deformation is close to zero; (3) the largest possible number of targets. In this study, 35 GCPs were selected. Figure 3 shows the time-baseline and time-position plots of the interferometric pairs from ascending and descending tracks, respectively. The time-baseline plots show a normal perpendicular baseline component, while the time-position plots show a normal distance from the master image and the input acquisition dates. Low-coherence interferometric pairs are removed, and only those with spatial baselines of less than 200 m and temporal baselines of less than 200 days are selected. Meanwhile, a resolution of 30 m SRTM DEM was used to remove topographic phases from the interferograms and the nonlinear part was moved by bandpass filtering [38].
Unlike commonly used optical sensors that look directly down, SAR sensors have a special right-looking imaging geometry, which causes InSAR results to be in the line-of-sight (LOS) direction. Typically, the LOS deformation velocity is composed of the 3D velocity with components , and in up-down, east-west, and north-south directions, respectively. Thus, LOS deformation can be expressed approximately as:
In most urban areas, land deformation occurs in an up-down direction. Hence, the up-down deformation can be obtained by ignoring the horizontal displacements in most cases, as shown in follow:
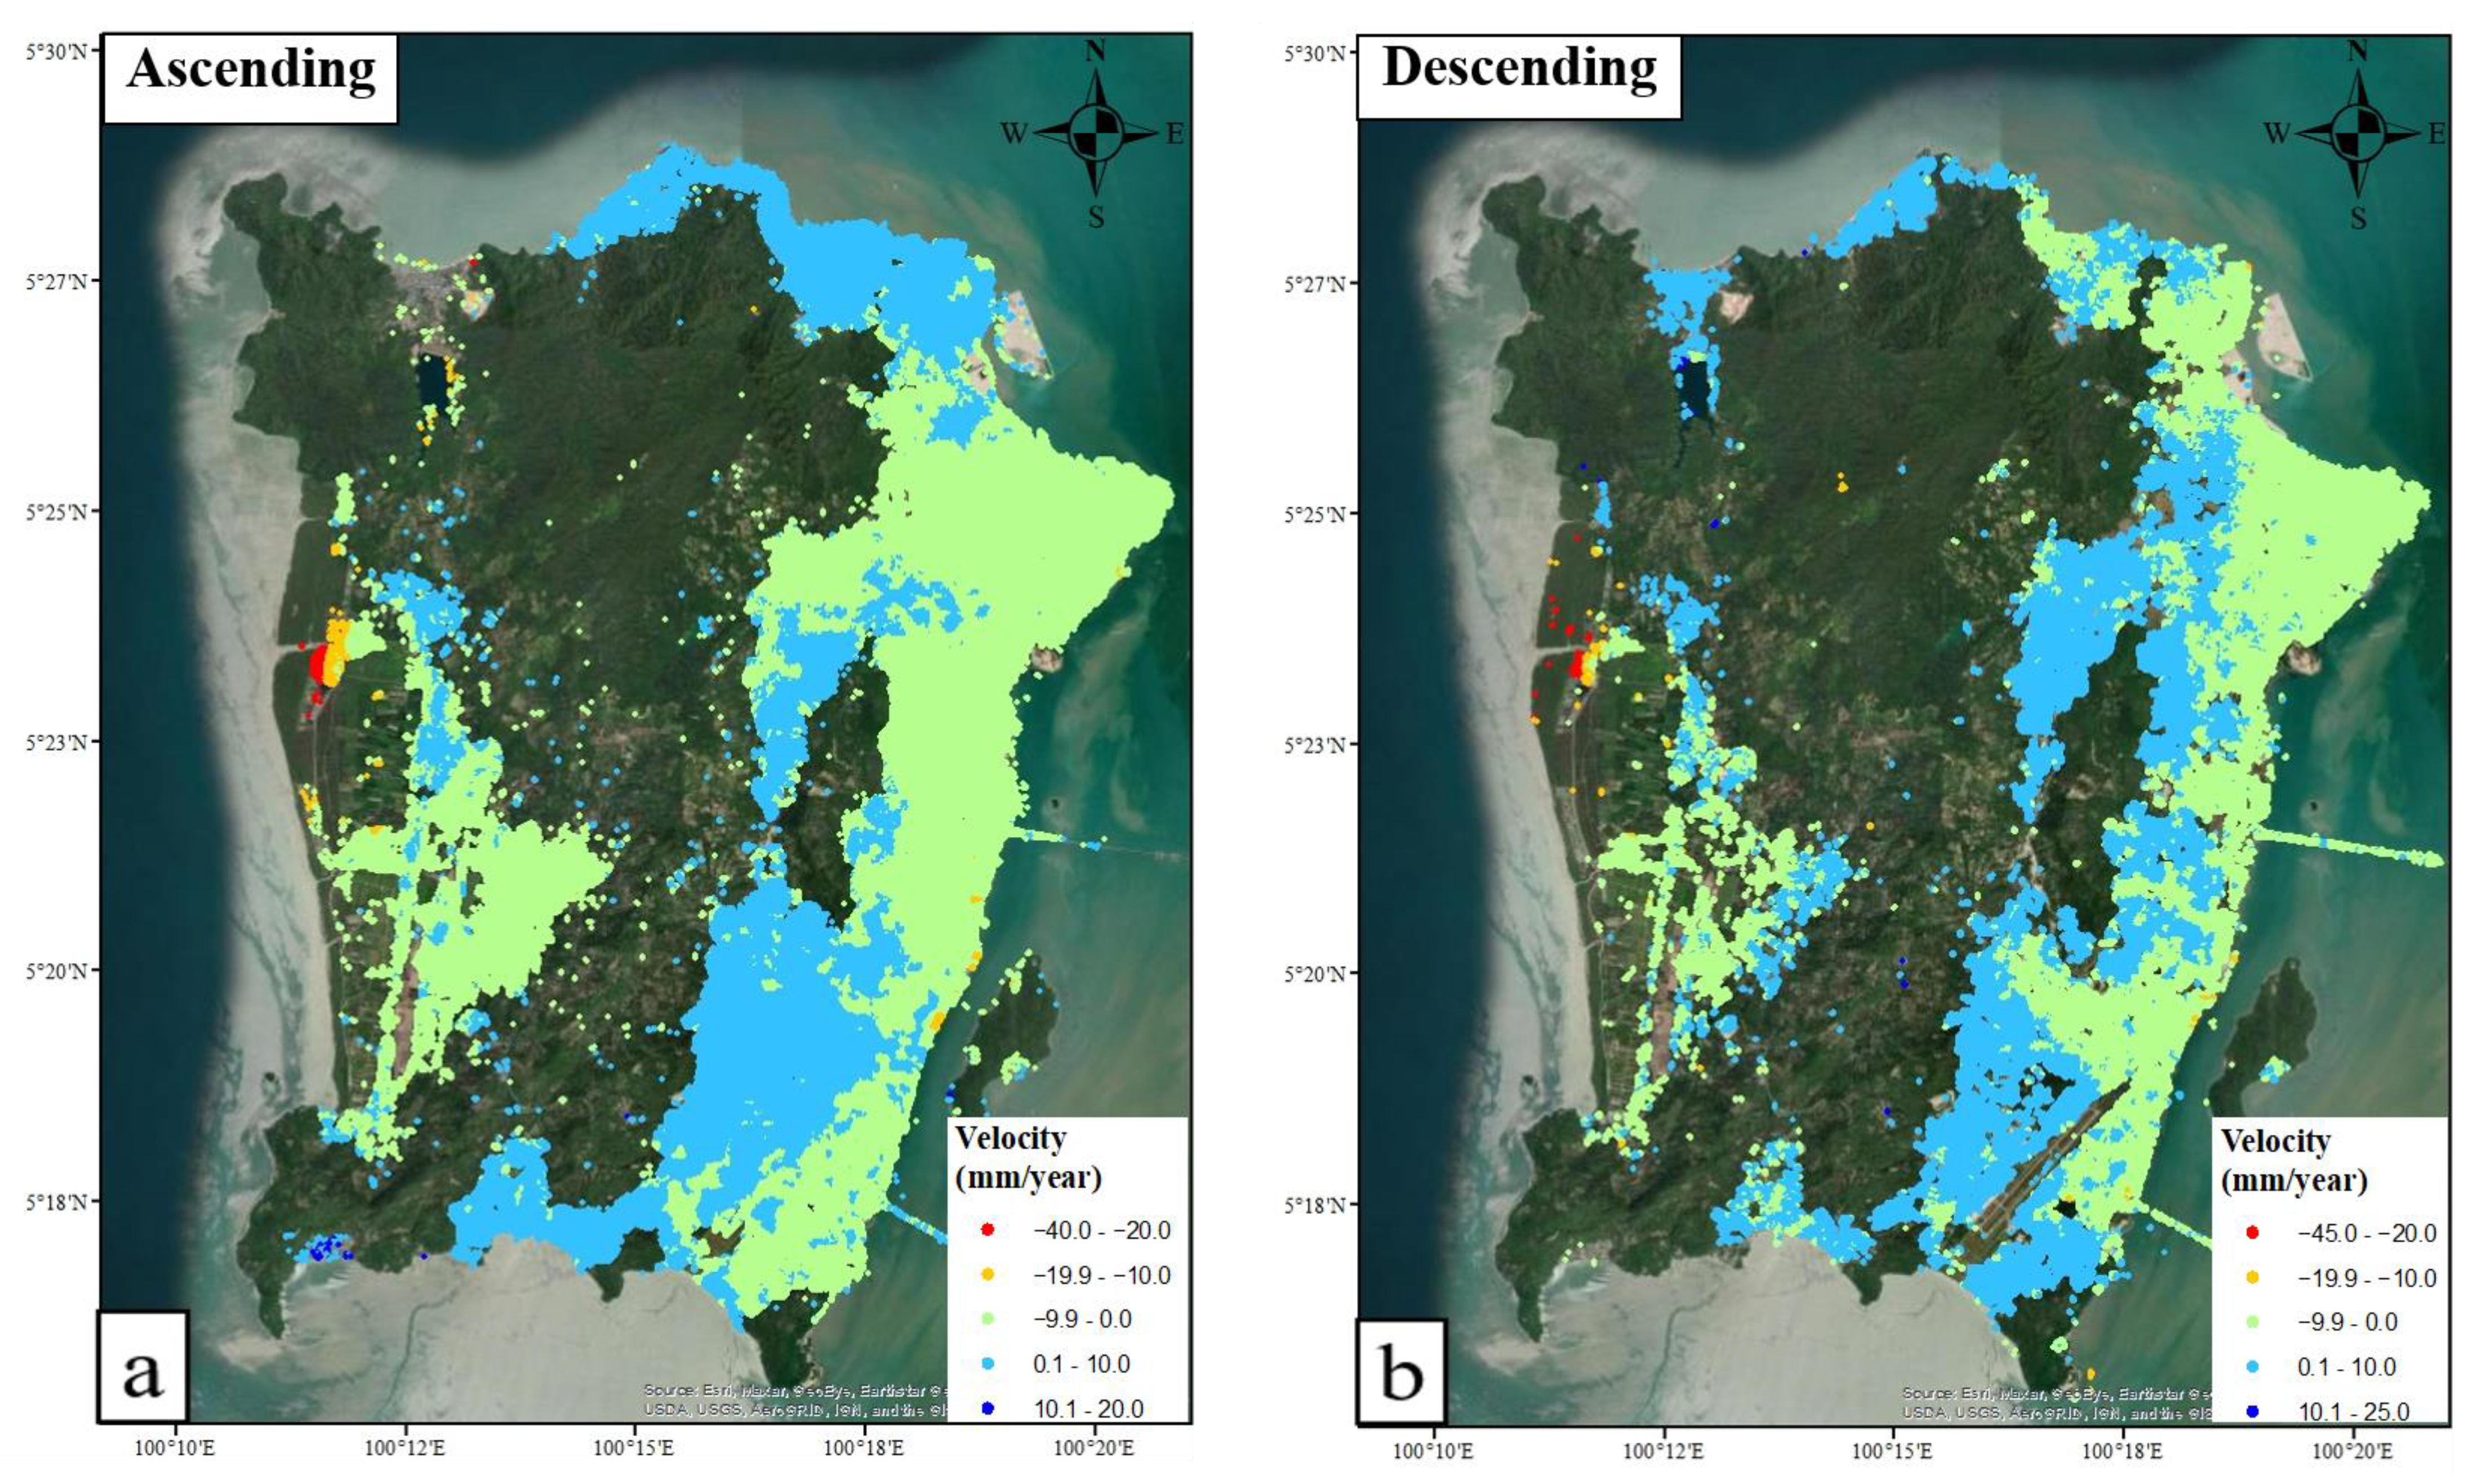
Figure 4 shows the SBAS-InSAR derived LOS deformation results for both tracks. A total of 324,111 (about 1106.2 points/km2) and 188,555 (about 643.5 points/km2) points were collected by the ascending and descending tracks, respectively. The eastern and western parts of the island have the most deformation points, while the central mountain has fewer. The spatial distribution and deformation rates of both tracks are identical in most areas, but there are also some variations. The larger subsidence can be found in the west of the island and some of the coastal areas in the east of the island.
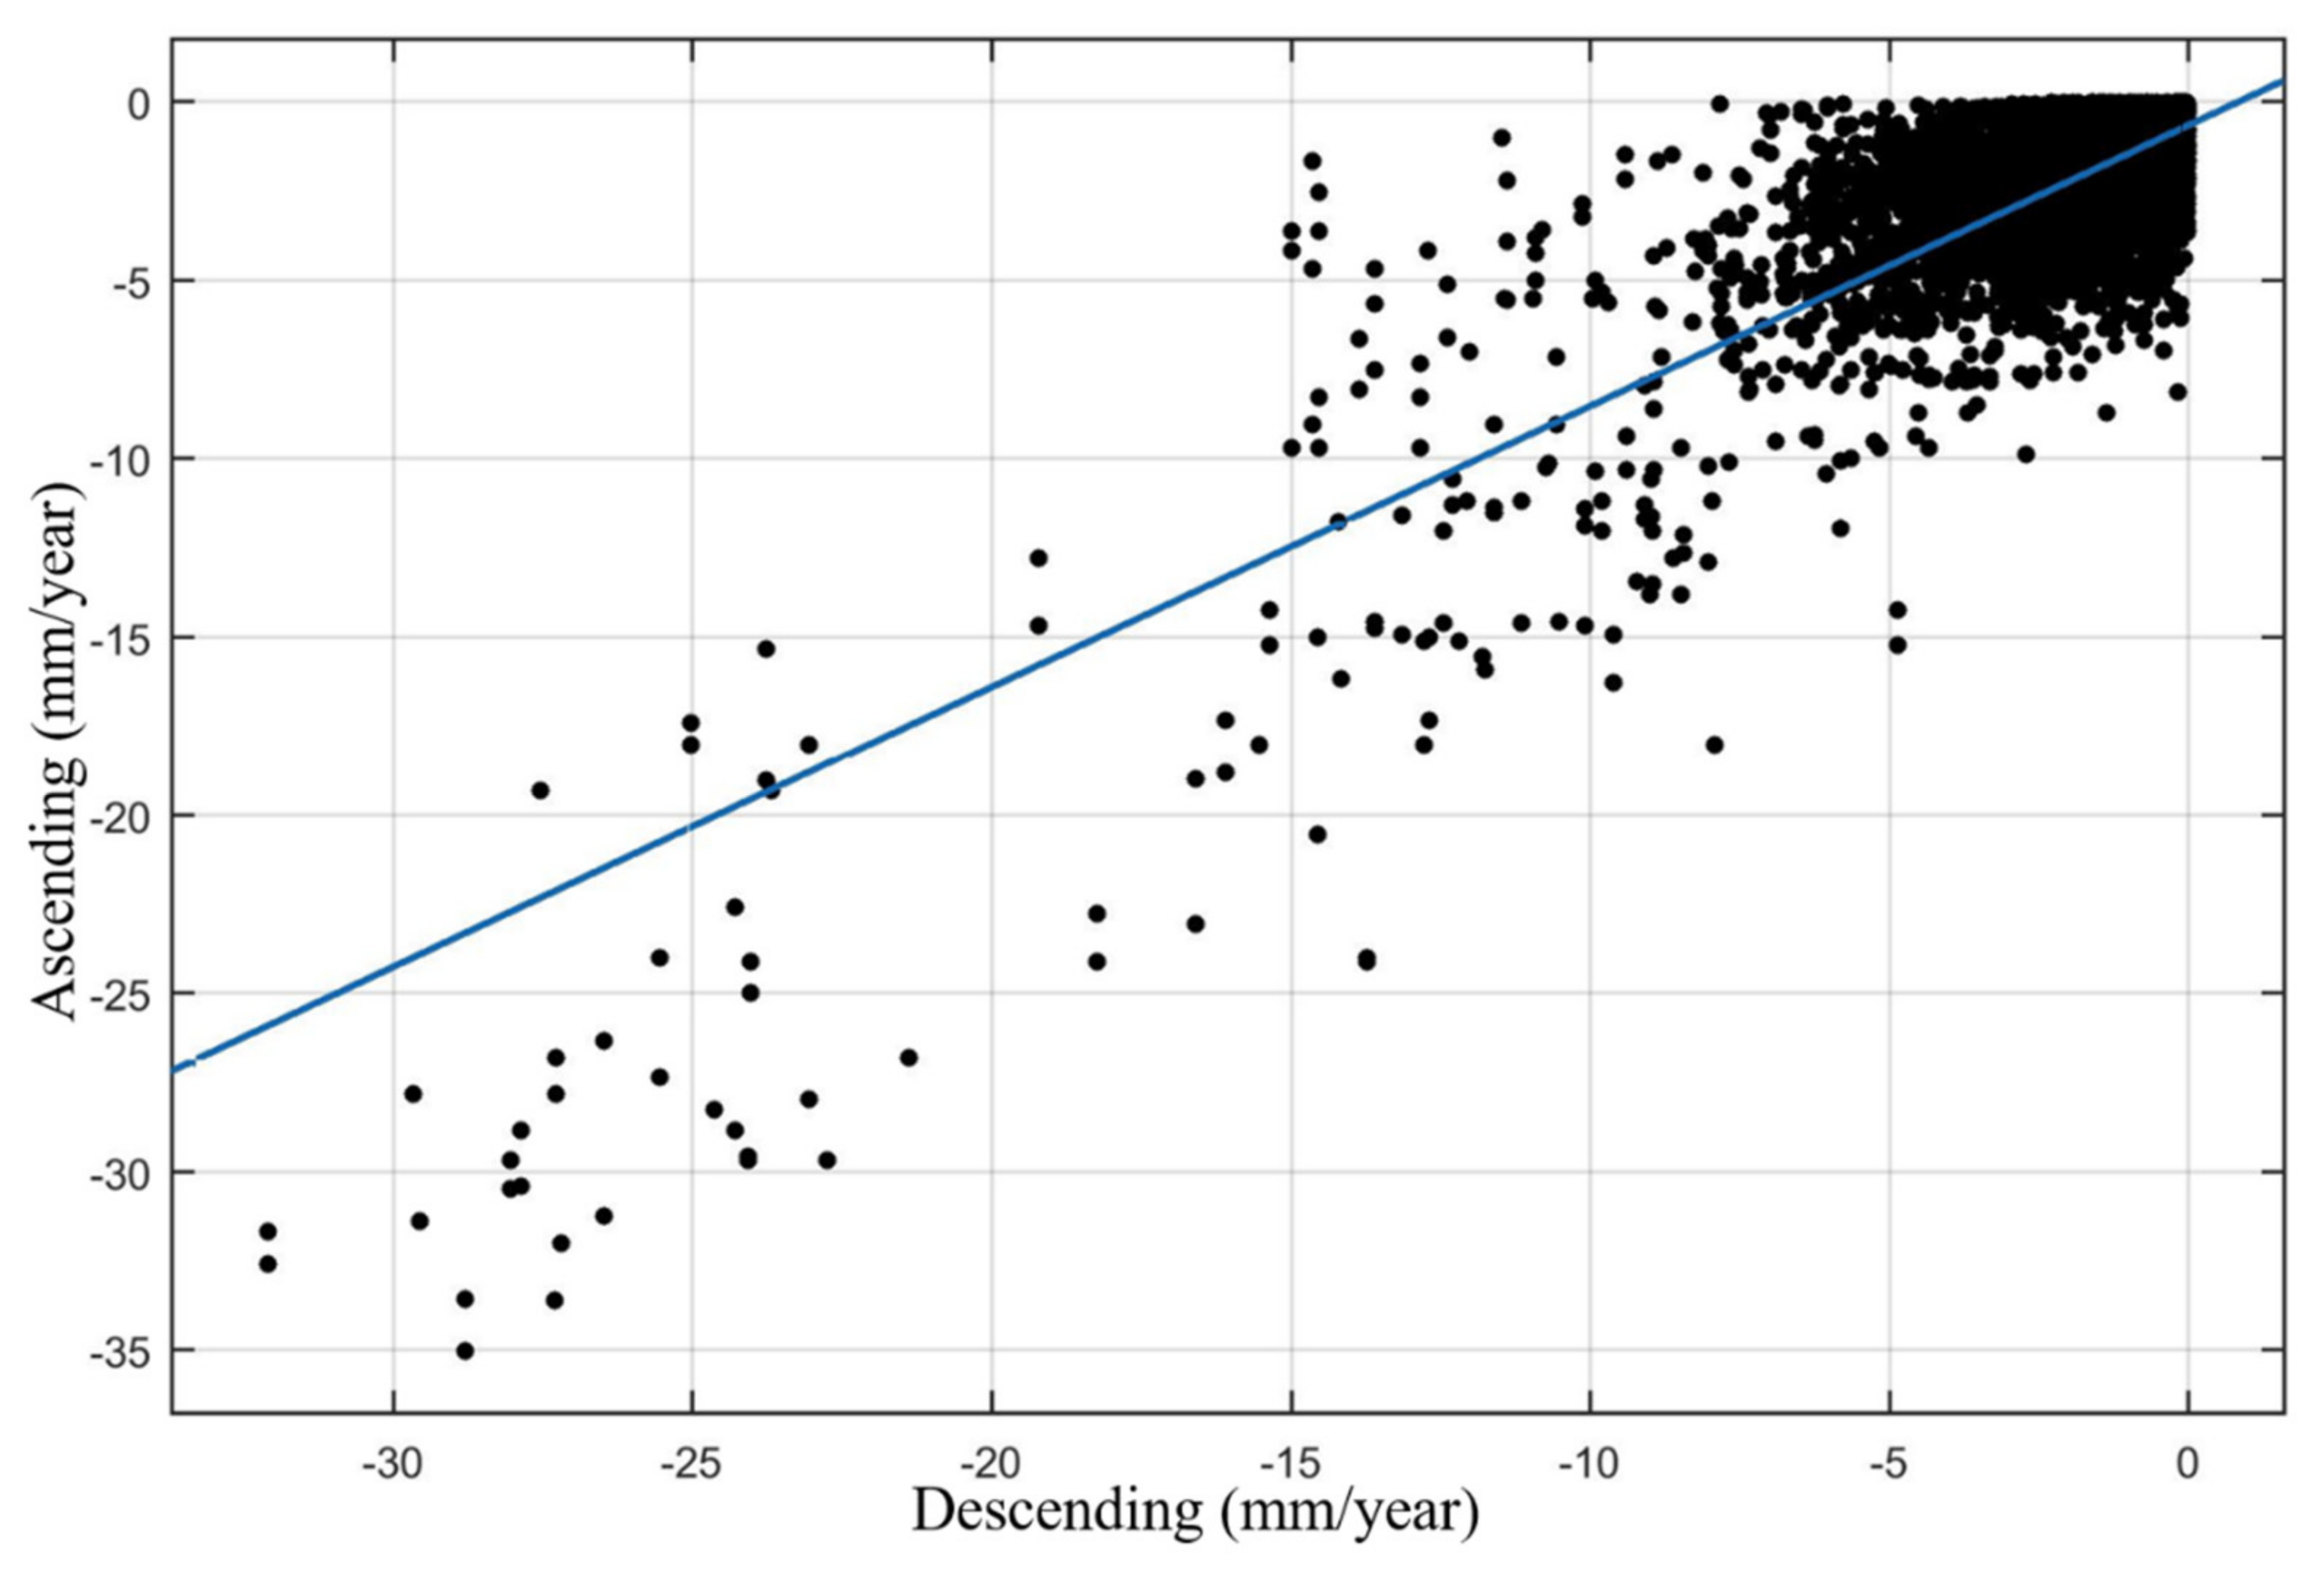
Due to the lack of other geophysical data and only one GPS station in the study area, regression analysis was used to verify the self-consistency of both tracks. In order to use InSAR results with greater efficiency, 100,000 random points were firstly created by ArcGIS software. Then, using both ascending and descending results to assign value to those random points, and null values have been removed. Figure 5 shows the linear regression analysis result in the subsidence areas, the linear coefficient determination (R2) is close to 0.65. This is to indicate the annual deformation rates acquired from two tracks may differ but still be correlated. These differences can be caused by mainly several factors: horizontal movement of the ground targets, unmatched position, and the errors of the SBAS-InSAR technique itself.
In order to quantify these differences, the cell statistical result was used to calculate the different track results, as shown in Figure 6. All the deviation distributions show relatively smaller differences, indicating that these two results are relevant, and this technique is useful in monitoring land subsidence. Larger variations can be found near a mountain with a steep slope and a construction site. In flat terrain areas and most coastal zone, the differences are relatively small, suggesting the significant proportion of the land deformation is vertical movement in the study area. Since our study area is mainly focused on coastal areas, these differences have limited impact.
3.2. Geostatistical Analyst
The geostatistical analyst method is an effective spatial analysis tool in natural phenomena and can help to create accurate predictions for those unmeasured locations within the same area by identifying variation. Of these, Cokriging is a widely used geostatistical analyst method for resolving primary variables that are difficult to obtain or have unreliable interpolation consequences [39]. As explained earlier, land deformation may be acquired from various targets within the same pixels of different tracks. There are also some deformations that may be observed by only one of the tracks. The Cokriging method was used to generate predictive values by both tracks results in this study, which could make the most InSAR results and maximize land deformation. For hazard prevention, this is very helpful. The ordinary Cokriging is an optimal linear predictor within a limited area [40], which assumes the constant mean is unknown, and the general formula can be shown:
where is the primary variable at the point of estimation ; is the measured values at the ith nearby location, represents weights applied to the primary data; is the secondary values at the jth nearby location, represents weights applied to the secondary data.
InSAR results show the ascending result contains more deformation points, while the descending result has relatively fewer points. However, the descending data were acquired early in the morning which means little atmospheric delay and more accuracy. Therefore, the descending result is assumed to primary variables while the ascending result is assumed to secondary variables. In addition, if the horizontal displacement is prominent in real deformation, this method could provide weighted average results (see Equation (3)), making the final results are insignificant. Therefore, all InSAR results can be fully used, and land deformation is closer to reality.
The coefficient of determination (R-squared) and standard root mean square error (RMSE) are used to estimate the accuracy of predicted data. Mathematically, R-squared and RMSE can be calculated using the following formula:
where n is the number of data points; and are the real and predicted value, respectively.
3.3. Inundation Map Processing
In this study, the bathtub model was used to quantify the extent of land subsidence that would increase to inundated areas as a result of the projected sea-level rise. The fundamental principle of the bathtub model is that the areas below a certain flood level will be flooded, like pouring water into a bathtub. The bathtub model can be used either without or with the hydrological connectivity model. The former, also known as the zero-side rule, divide raster data into numerous land cells, any land cell elevation lower than the projected sea level representing flooding. The latter contains four- and eight-connectivity algorithms, in which the connectivity of the grid cell is taken into account. Since high accuracy LIDAR DEM is inapplicable in most of the Asia areas, the CoastalDEM is practical for mapping much greater flood risk areas (about three to five times than SRTM DEM) [41,42]. All relevant data, as well as CoastalDEM, are imported to a python-based eight-connectivity algorithm (flood fill algorithm). The seed point was chosen from the lowest elevation of the study area. In the study of inundated areas, the connection between the river and ocean commonly plays an important role. However, because of the lack of data and deteriorating river environment, these impacts are not considered. In addition, adaptation measures, storm surge, and tsunami also have not been taken into account.
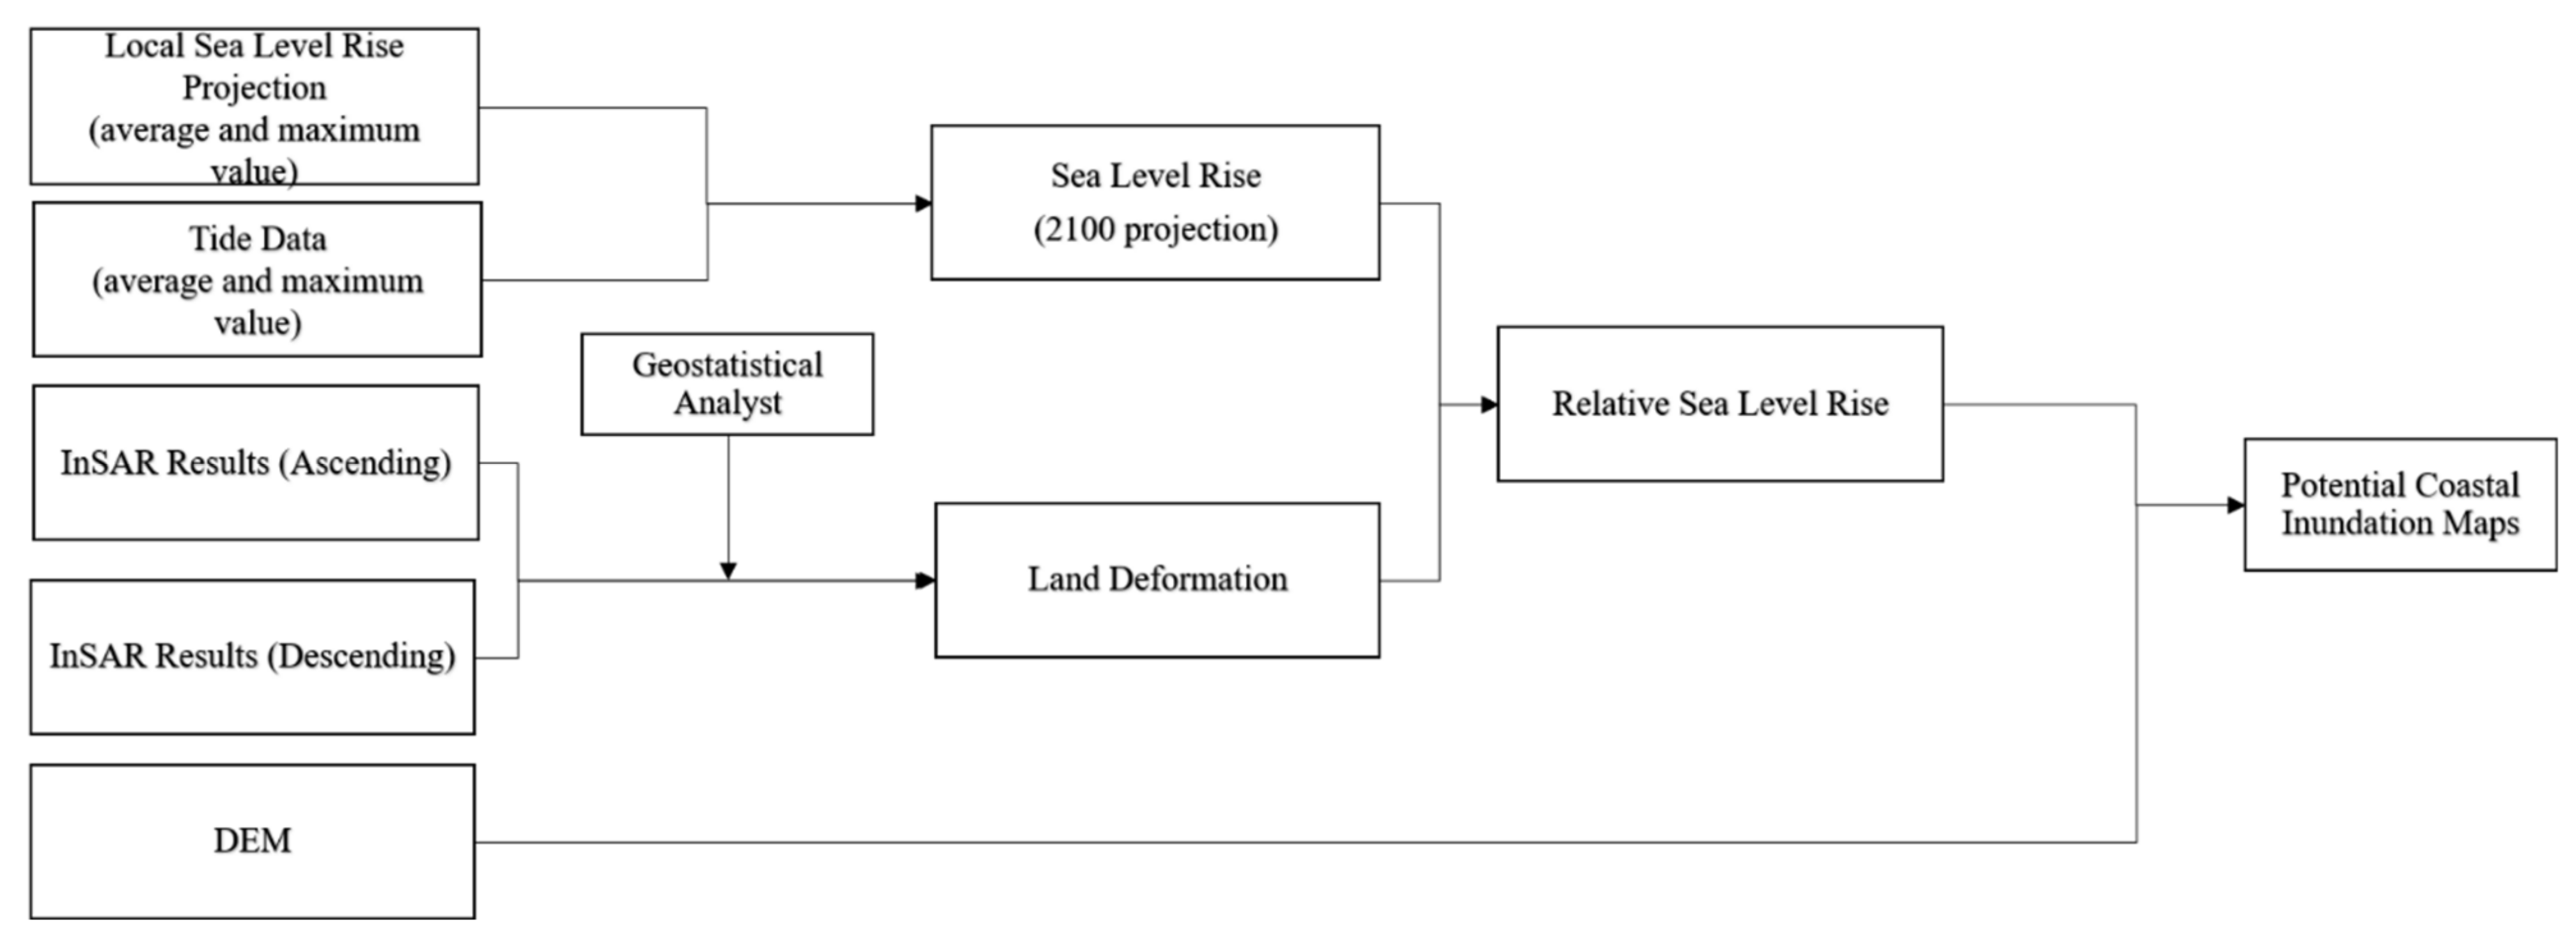
A detailed flowchart of the proposed method in this study is shown in Figure 7.
4. Results and Discussion
4.1. Subsidence Results
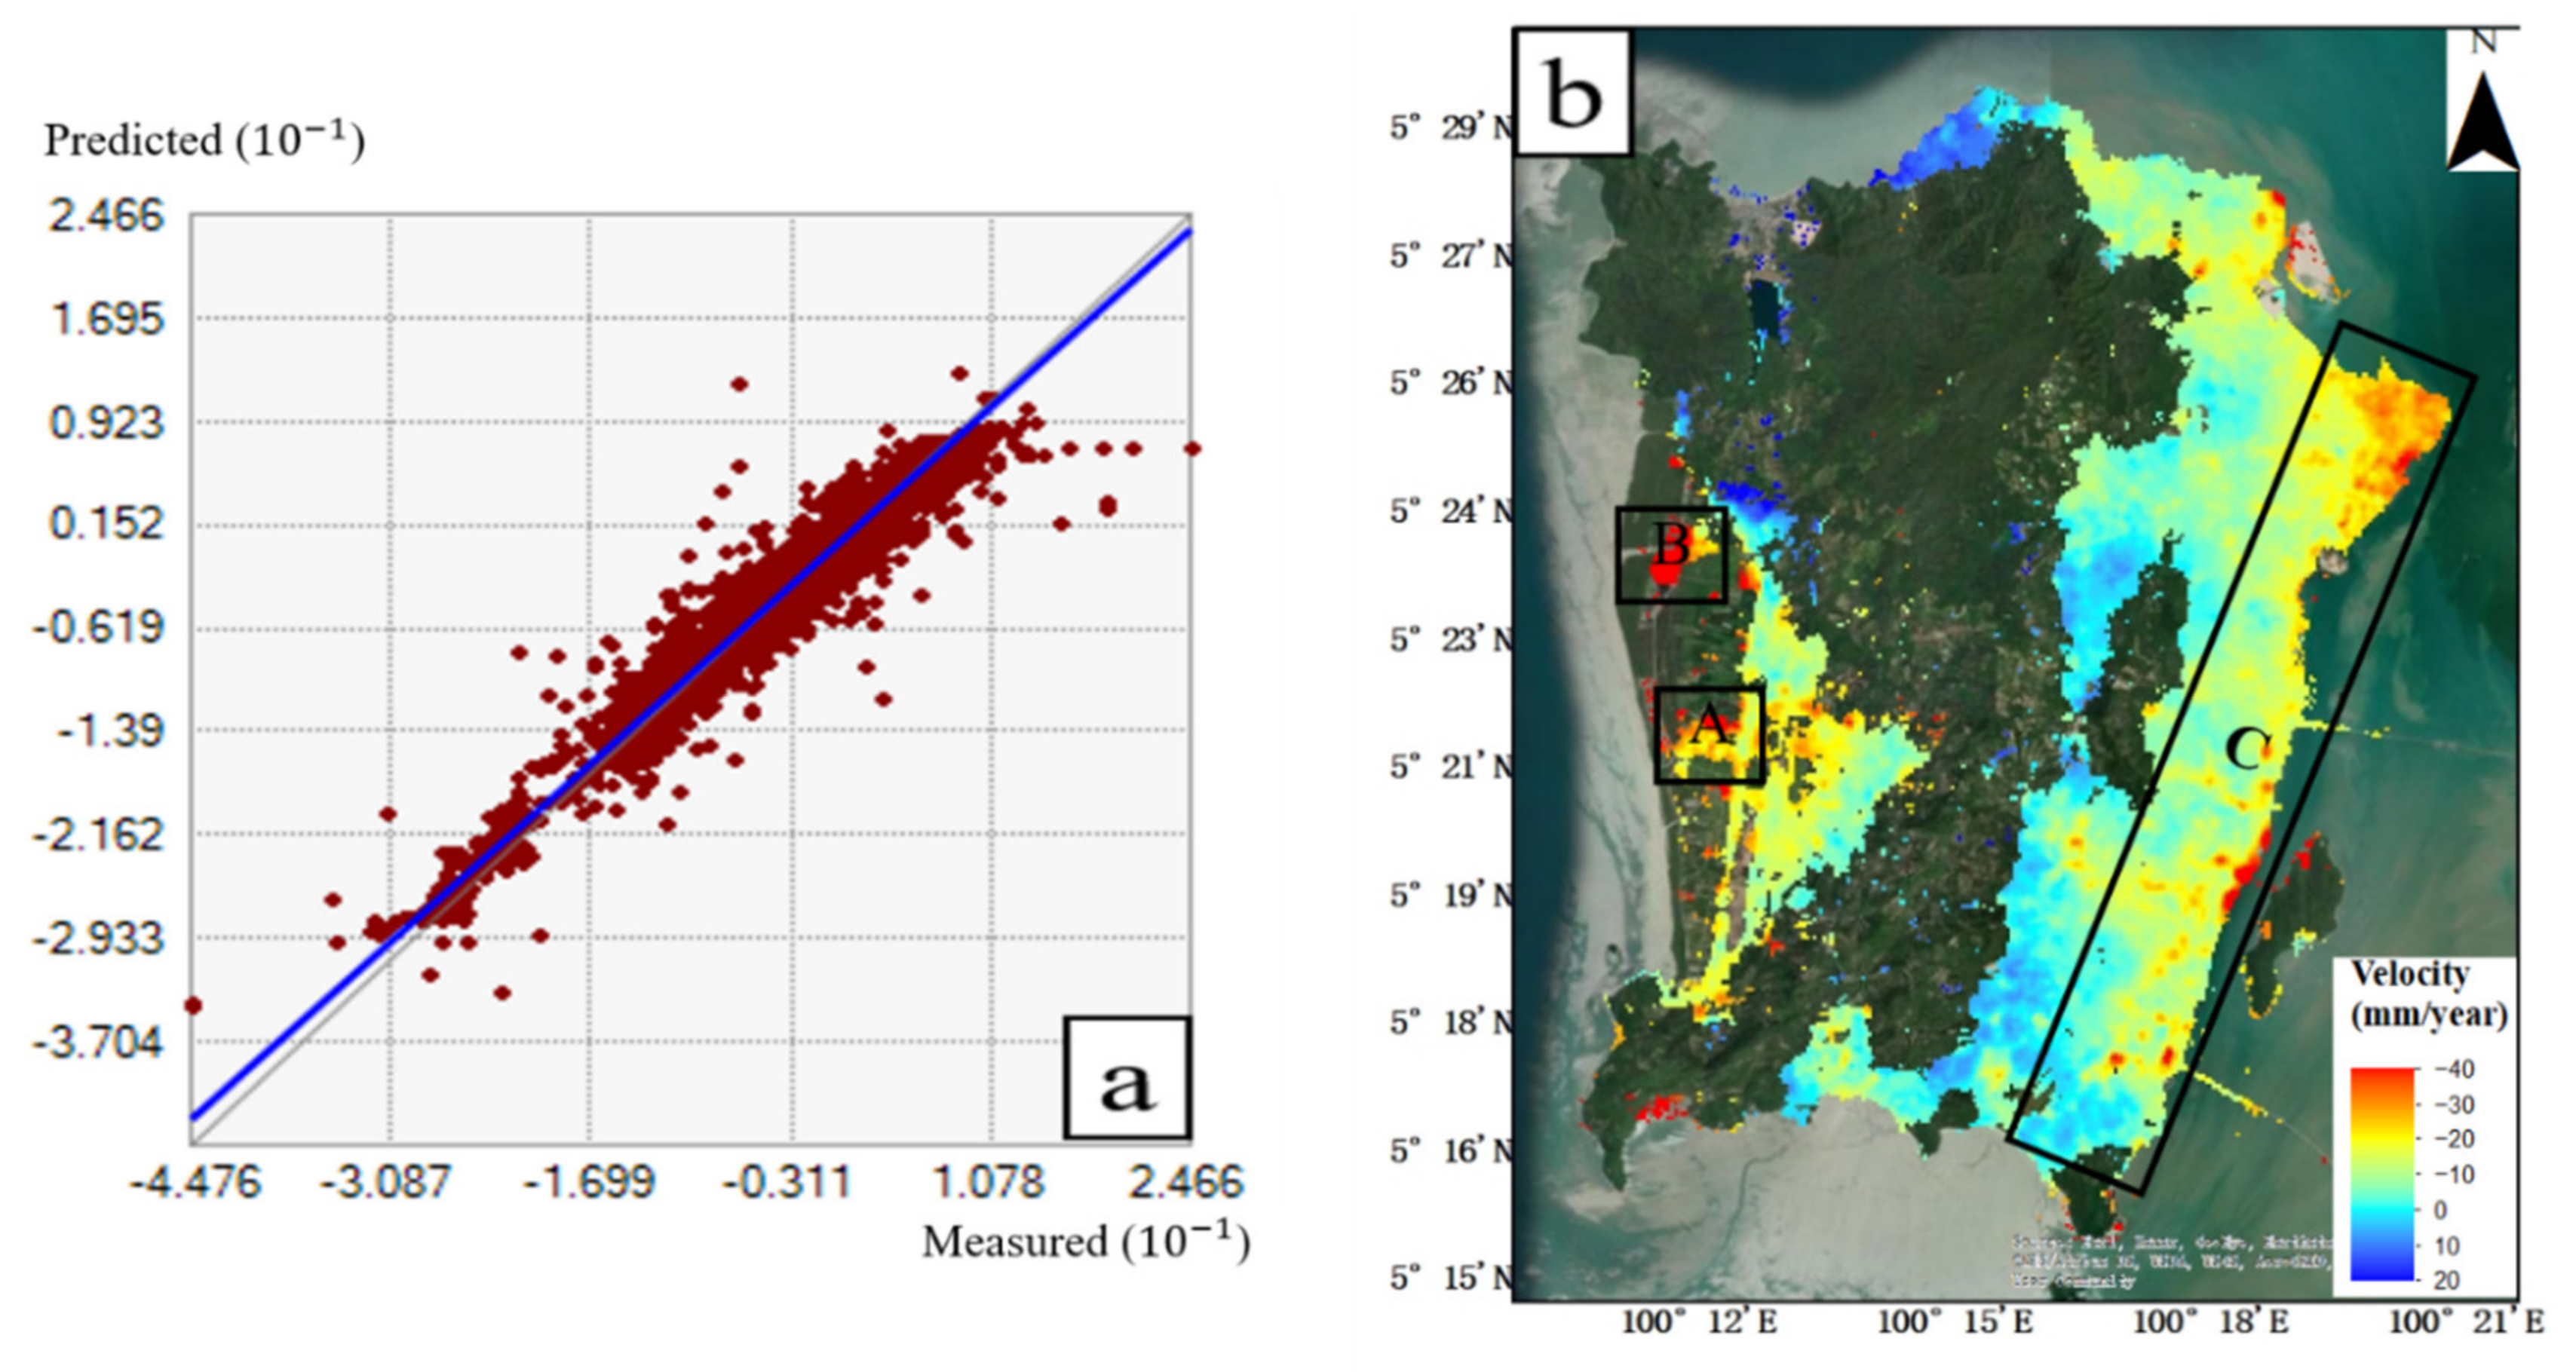
The land deformation monitoring was performed through the combination of ascending and descending results by applying the geostatistical analyst method. Figure 8a shows the linear regression analysis of predicted and real data, the RMSE is 0.43 and the standard R-square is 0.95. This means that the predicated and real data are closely aligned, thus the predicated data can reflect the deformation for both tracks. Figure 8b shows the results of land deformation rates over the period January 2018 to August 2020, negative values indicate land subsidence in the vertical direction, while positive values represent vertical land uplift.
Comparing to the InSAR results, the geostatistical analyst result can maximize the deformation field, which is beneficial to create the inundation model in the case of disaster prevention. The relatively severe subsidence can be found in the west of the island (see areas with the rectangular A and B), with the highest subsidence rate of −33.2 mm/yr. In rural areas, this subsidence might be related to the large construction projects in unconsolidated soil, and the potentially illegal exploitation of groundwater for fish farming and agricultural purpose. In the central mountain areas, there are almost no deformation data, and without risk to sea-level rise. In the eastern part of the island (see the area with rectangle C), as a key economic center of Penang Island, existing obvious subsidence. The north is the state capital and has one of the highest population densities in Malaysia. Meanwhile, as a historic Old Town, many buildings were built in the last century. In addition, a significant subsidence area can be found along the coast, which is reclaimed land and is currently being built. The land subsidence ranges from −1 to −7 mm/year in this part, and most are less than 5 m in elevation. In the south part, most of them are reclaimed lands that have been developed since 1970, the average deformation rate is about −2 mm/year. In Site C, land subsidence areas are mostly identified along the coastlines. Considering its low elevation and lack of production measures, this area is vulnerable to sea-level rise. Other parts of the study area show a low subsidence rate, such as the southern part of the island which is a rural area. In addition, there is a noticeable land uplift along the northern coast with the highest uplift rate of 9.3 mm/year and the average uplift of 3.9 mm/year, which is a popular vacation spot. The previous study indicated these large-scale land uplift may be related to land creation projects in the mountain region [43]. In addition, tourist numbers have decreased as a result of the COVID-19 situation, which may produce some effect.
4.2. Subsidence Modelling
Although land deformation results show severe subsidence in the west of the island, coastal forests slow down the flooding rate so the final static inundation may never happen during storms and other severe but temporary events. However, most of the population lives in the eastern region, which is about 6 m above sea level. Since the objective of this study is to investigate the effect of local land subsidence on inundated areas, the following analysis is limited to low-elevation coastal areas in the east of the island.
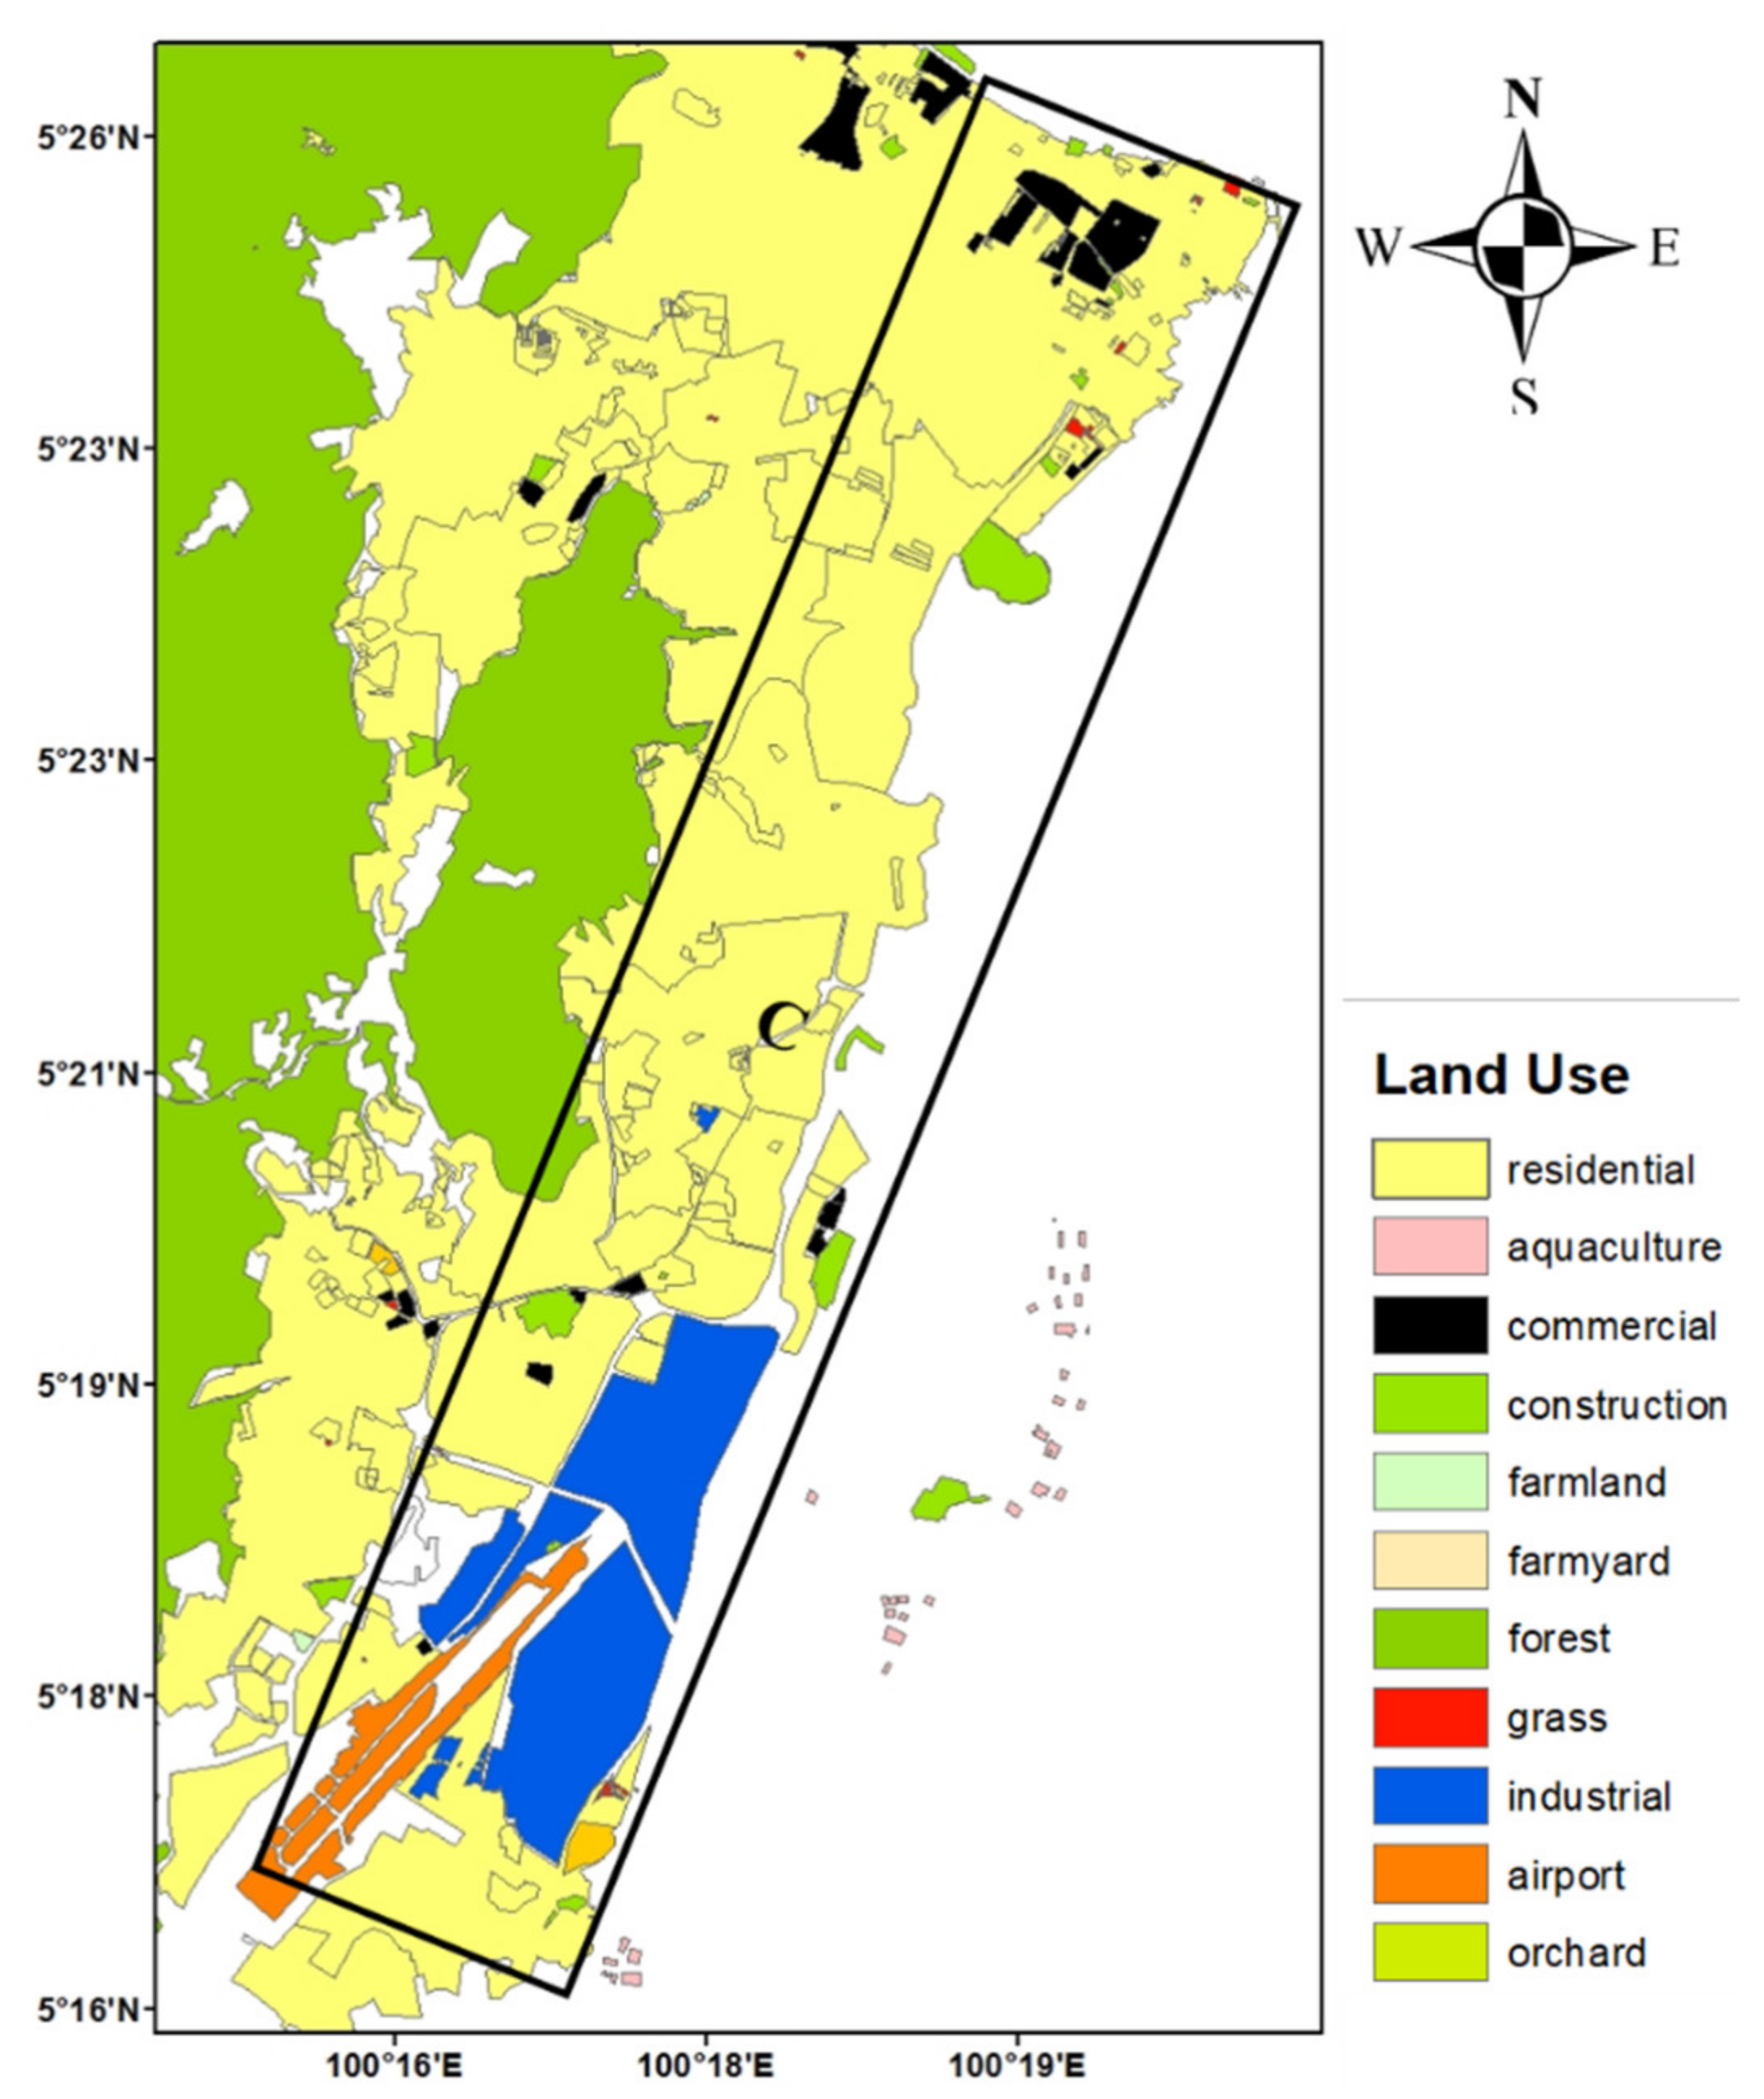
Empirical estimates indicate larger land subsidence always occurs on building areas, reclaimed lands, highway roads, and industrial zones. In the past years, rapid urbanization has resulted in the primary land use type converted to residential lands, and some of them are residential and commercial complex buildings, as shown in Figure 9. The average subsidence rate of −5 mm/year with a maximum rate of −15 mm/year can be found in these residential areas. This may be a consequence related to most buildings being built on unconsolidated soil (which covers 19% of the whole island), which has been proven to be the primary driver for land subsidence [44]. In response to the shortage of land, the common type of coastline is large areas of reclaimed lands with an average subsidence rate of larger than −8 mm/year. The existing height standard for these reclaimed lands is 4m but some of them only have a visible height of 1–2 m. As new programs continue in the operation, land subsidence is going to get worse in these areas that potentially exacerbates the risk of being submerged associated with sea-level rise. In the north part of Site C, although there is a lack of large-scale construction projects, it is most sensitive to rising sea levels because of dense residential lands and high population density. On industrial land in the south, the main land-use type is reclaimed land, with a total area of about 6 km2. The higher subsidence rates can be found on the edge of this zone. Particularly, the main trunk road along the coast that connects the industrial zone to the main urban area. It has the highest subsidence rate of −25 mm/year. All of these indicate that the eastern region has a high degree of risk of being submerged considering both sea-level rise and land subsidence in the future.
4.3. Inundation Scenarios
In this study, the inundation scenarios are determined by combining regional sea-level rise projections and local land subsidence models. In addition, the effects of heavy rainfall, storm surges, and tsunami were not taken into account, because most of them are temporary events. The considered regional sea-level rise projections are provided by Ghazali et al. [2], which showed the mean sea level around Peninsular Malaysia is expected to rise from 0.25 m to 0.52 m in 2100 (relative to 2010). Land subsidence models were obtained by extrapolating the subsidence rates of the eastern island by 2100. The tide data were considered in order to have better demonstrating the effects of land subsidence. Most of the predictions are in a given range, thus the inundated areas will be divided into the lowest effect level and the highest effect level. The lowest effect level refers to minimum sea level rise value + average tide height + average land subsidence value, and one considers land subsidence and the other without regard. At the same time, the highest effect level is based on maximum sea-level rise value + highest tide height + maximum land subsidence value, and one considers land subsidence and the others without regard.
According to various variables, we estimated potentially inundated areas in 2100, as shown in Figure 10. The red color represents only sea-level rise impact, while the yellow color represents the combination of land subsidence and sea-level rise. Previous local reports were always based on the results of Climate Central (https://sealevel.climatecentral.org/maps/, last accessed on 27 May 2021), which is a nonprofit organization that analyzes and reports on climate science. The predictions in this study are likely to occur because they are based on regional data and consider the land subsidence models.
Inundated areas related to only rising sea level shows that significant parts of the west of Penang Island are at the high risk of being submerged, as well as most of the coastal reclaimed land, parts of industrial area and the international airport, and these areas always tend to have large subsidence rates. In these scenarios, the inundated areas can vary between 17.58 km2 and 26.07 km2 in 2100, for the lowest and highest levels, respectively. When sea-level rise and land subsidence are both taken into account, the predicated inundated areas are 23.44 km2 and 43.36 km2, under the same two scenarios. Most of the industrial zone reclaimed land and the entire international airport would be submerged. In the highest-level scenario, about 14.8% of the island would be submerged.
Therefore, land subsidence has a significant contribution to inundated areas, which can increase 2.0% and 5.9% of inundated areas caused by sea-level rise in the 2100 projection, based on the lowest and the highest level, respectively. Although heavy rainfall is not considered in this study, sometimes the average total accumulation of rainfall can reach several hundred millimeters. Moreover, as infrastructure projects process, the land subsidence status could be worsening. As a result, potential inundation could affect a larger region in the future.
5. Conclusions
Penang is one of the largest and most populated cities in Malaysia, which is facing a serious risk to projected sea-level rises because most population lives along the coast. In this study, we integrated the effect of land subsidence to inundated areas caused by sea-level rise in the 2100 projection. Inundated areas were applied by regional sea-level rise projection, tide data, and InSAR-derived land subsidence models under CoastalDEM. Firstly, the SBAS-InSAR technique was used to generate deformation maps based on both ascending and descending tracks. By the way also for the cross-validation and cell-statistical apply to calculate the variations between different tracks. Due to the limitations of the InSAR technique itself, the process of 3D composition may generate misleading results. The geostatistical analyst method was used to merge ascending and descending data, the results show this method can maximize the land deformation fields and help to reduce the errors. To the author’s knowledge, this is the first time using the geostatistical analyst method to process different track results, and it is helpful in the case of disaster prevention. Then, the subsidence rates in different land-use types are analyzed, the results show the larger subsidence rates exist in these building areas, reclaimed lands, and main truck roads. Finally, the inundation maps are obtained under different projections by combining the local sea-level rise projection and land subsidence models. The results indicate land subsidence would increase 2.0% and 5.9% of the inundated area, based on the lowest and highest effect level in 2100 projections, respectively. In the highest effect, about 14.8% of the island (the yellow color highlighted in Figure 10b) would be submerged.
Therefore, it is suggested that the Penang state government policymakers take immediate action in mitigating the effect of floods and accept the variation of the future environment. Apart from the production and protection of mangrove forests along the coastline, the state government ought to take some stabilization measures in the east and south of the island, such as beach replenishment and embankment to cope with the storm hazards, tsunamis, and sea-level rise. These outputs are and will be fundamental for coastal planning adaptation within a sustainable gradual and collaborative strategy. For future work, complementary to the InSAR technique, L-band data may drive a more accurate result in such tropical areas and using continuous GPS and benchmark data could better understand land subsidence in the study area. During the mapping of inundated areas, a high-resolution LIDAR DEM and dynamic model are more effective.
Author Contributions
Conceptualization, G.G. and L.H.S.; methodology, G.G. and L.H.S.; validation, G.G. and L.H.S.; formal analysis, G.G. and L.H.S.; writing—original draft preparation, G.G., Y.Z. and L.H.S.; writing—review and editing, G.G., Y.Z. and L.H.S. All authors have read and agreed to the published version of the manuscript.
Funding
This work is financially supported by the grant “Burning In the Southeast Asian Maritime Continent: Solving Smoke Direct and Semi-Direct Radiative Forcing Through AERONET and MPLNET Constraint” (1001.PFIZIK.8011079), which is under the RUI grant from University Sains Malaysia (USM). All supports from USM and various parties are gratefully acknowledged.
Institutional Review Board Statement
Not applicable.
Informed Consent Statement
Not applicable.
Data Availability Statement
Not applicable.
Conflicts of Interest
The authors declare no conflict of interest.
References
- Church, J.A.; Clark, P.U.; Cazenave, A.; Gregory, J.M.; Jevrejeva, S.; Levermann, A.; Merrifield, M.A.; Milne, G.A.; Nerem, R.S.; Nunn, P.D.; et al. Sea Level Change. In Climate Change 2013: The Physical Science Basis. Contribution of Working Group I to the Fifth Assessment Report of the Intergovernmental Panel on Climate Change; Stocker, T.F., Qin, D., Plattner, G.-K., Tignor, M., Allen, S.K., Boschung, J., Nauels, A., Xia, Y., Bex, V., Midgley, P.M., Eds.; Cambridge University Press: Cambridge, UK; New York, NY, USA, 2013. [Google Scholar]
- Ghazali, N.H.M.; Awang, N.A.; Mahmud, M.; Mokhtar, A. Impact of Sea Level Rise and Tsunami on Coastal Areas of North-West Peninsular Malaysia. Irrig. Drain. 2018, 67, 119–129. [Google Scholar] [CrossRef]
- Roy, K.; Peltier, W. Glacial isostatic adjustment, relative sea level history and mantle viscosity: Reconciling relative sea level model predictions for the U.S. East coast with geological constraints. Geophys. J. Int. 2015, 201, 1156–1181. [Google Scholar] [CrossRef]
- Melini, D.; Piersanti, A.; Spada, G.; Soldati, G.; Casarotti, E.; Boschi, E. Earthquakes and relative sealevel changes. Geophys. Res. Lett. 2004, 31, 09601. [Google Scholar] [CrossRef]
- Catalao, J.; Raju, D.; Nico, G. Insar Maps of Land Subsidence and Sea Level Scenarios to Quantify the Flood Inundation Risk in Coastal Cities: The Case of Singapore. Remote Sens. 2020, 12, 296. [Google Scholar] [CrossRef] [Green Version]
- Anzidei, M.; Bosman, A.; Carluccio, R.; Casalbore, D.; Caracciolo, F.D.; Esposito, A.; Nicolosi, I.; Pietrantonio, G.; Vecchio, A.; Carmisciano, C.; et al. Flooding scenarios due to land subsidence and sea-level rise: A case study for Lipari Island (Italy). Terra Nova 2017, 29, 44–51. [Google Scholar] [CrossRef]
- Chen, C.-N.; Tfwala, S.S. Impacts of Climate Change and Land Subsidence on Inundation Risk. Water 2018, 10, 157. [Google Scholar] [CrossRef] [Green Version]
- Li, M.-G.; Chen, J.-J.; Xu, Y.-S.; Tong, D.-G.; Cao, W.-W.; Shi, Y.-J. Effects of groundwater exploitation and recharge on land subsidence and infrastructure settlement patterns in Shanghai. Eng. Geol. 2021, 282, 105995. [Google Scholar] [CrossRef]
- Zhao, R.; Wang, G.; Yu, X.; Sun, X.; Bao, Y.; Xiao, G.; Gan, W.; Shen, S. Rapid Land Subsidence in Tianjin, China Derived from Continuous GPS Observations (2010–2019). Proc. Int. Assoc. Hydrol. Sci. 2020, 382, 241–247. [Google Scholar] [CrossRef] [Green Version]
- Wagner, A.M.; Lindsey, N.J.; Dou, S.; Gelvin, A.; Saari, S.; Williams, C.; Ekblaw, I.; Ulrich, C.; Borglin, S.; Morales, A.; et al. Permafrost Degradation and Subsidence Observations during a Controlled Warming Experiment. Sci. Rep. 2018, 8, 10908. [Google Scholar] [CrossRef] [PubMed]
- Poland, M.; Bürgmann, R.; Dzurisin, D.; Lisowski, M.; Masterlark, T.; Owen, S.; Fink, J. Constraints on the mechanism of long-term, steady subsidence at Medicine Lake volcano, northern California, from GPS, leveling, and InSAR. J. Volcanol. Geotherm. Res. 2006, 150, 55–78. [Google Scholar] [CrossRef]
- Ito, H.; Susaki, J.; Anahara, T. Integrating multi-temporal sar images and gps data to monitor three-dimensional land subsidence. ISPRS Ann. Photogramm. Remote Sens. Spat. Inf. Sci. 2019, IV-3/W1, 9–16. [Google Scholar] [CrossRef] [Green Version]
- Psimoulis, P.; Ghilardi, M.; Fouache, E.; Stiros, S. Subsidence and evolution of the Thessaloniki plain, Greece, based on historical leveling and GPS data. Eng. Geol. 2007, 90, 55–70. [Google Scholar] [CrossRef]
- Benattou, M.M.; Balz, T.; Liao, M. Measuring surface subsidence in Wuhan, China with sentinel-1 data using psinsar. In Proceedings of the 2018 ISPRS TC III Mid-term Symposium Developments, Technologies and Applications in Remote Sensing, Beijing, China, 7–10 May 2018. [Google Scholar]
- Zhou, L.; Guo, J.; Hu, J.; Li, J.; Xu, Y.; Pan, Y.; Shi, M. Wuhan Surface Subsidence Analysis in 2015–2016 Based on Sentinel-1A Data by SBAS-InSAR. Remote Sens. 2017, 9, 982. [Google Scholar] [CrossRef] [Green Version]
- Zhao, X.; Chen, B.; Gong, H.; Zhou, C.; Li, X.; Lei, K.; Ke, Y. Land subsidence along the Beijing–Tianjin Intercity Railway during the period of the South-to-North Water Diversion Project. Int. J. Remote Sens. 2020, 41, 4447–4469. [Google Scholar] [CrossRef]
- Osmanoğlu, B.; Sunar, F.; Wdowinski, S.; Cabral-Cano, E. Time series analysis of InSAR data: Methods and trends. ISPRS J. Photogramm. Remote Sens. 2016, 115, 90–102. [Google Scholar] [CrossRef]
- Nico, G.; Tomé, R.; Catalao, J.; Miranda, P.M.A. On the Use of the WRF Model to Mitigate Tropospheric Phase Delay Effects in SAR Interferograms. IEEE Trans. Geosci. Remote Sens. 2011, 49, 4970–4976. [Google Scholar] [CrossRef]
- Mateus, P.; Nico, G.; Catalao, J. Uncertainty Assessment of the Estimated Atmospheric Delay Obtained by a Numerical Weather Model (NMW). IEEE Trans. Geosci. Remote Sens. 2015, 53, 6710–6717. [Google Scholar] [CrossRef]
- Berardino, P.; Fornaro, G.; Lanari, R.; Sansosti, E. A new algorithm for surface deformation monitoring based on small baseline differential SAR interferograms. IEEE Trans. Geosci. Remote Sens. 2002, 40, 2375–2383. [Google Scholar] [CrossRef] [Green Version]
- Sowter, A.; Amat, M.B.C.; Cigna, F.; Marsh, S.; Athab, A.; Alshammari, L. Mexico City land subsidence in 2014–2015 with Sentinel-1 IW TOPS: Results using the Intermittent SBAS (ISBAS) technique. Int. J. Appl. Earth Obs. Geoinformation 2016, 52, 230–242. [Google Scholar] [CrossRef]
- Ng, A.H.-M.; Ge, L.; Zhang, K.; Chang, H.-C.; Li, X.; Rizos, C.; Omura, M. Deformation mapping in three dimensions for underground mining using InSAR—Southern highland coalfield in New South Wales, Australia. Int. J. Remote Sens. 2011, 32, 7227–7256. [Google Scholar] [CrossRef]
- Samieie-Esfahany, S.; Hanssen, R.; van Thienen-Visser, K.; Muntendam-Bos, A. On the effect of horizontal deformation on InSAR subsidence estimates. In Proceedings of the Fringe 2009 Workshop, Frascati, Italy, 30 November–4 December 2009. [Google Scholar]
- Wright, T.J.; Parsons, B.E.; Lu, Z. Toward mapping surface deformation in three dimensions using InSAR. Geophys. Res. Lett. 2004, 31, L01607. [Google Scholar] [CrossRef] [Green Version]
- Chee, S.Y.; Othman, A.G.; Sim, Y.K.; Adam, A.N.M.; Firth, L.B. Land reclamation and artificial islands: Walking the tightrope between development and conservation. Glob. Ecol. Conserv. 2017, 12, 80–95. [Google Scholar] [CrossRef] [Green Version]
- Pradhan, B.; Lee, S. Delineation of landslide hazard areas on Penang Island, Malaysia, by using frequency ratio, logistic regression, and artificial neural network models. Environ. Earth Sci. 2010, 60, 1037–1054. [Google Scholar] [CrossRef]
- Gee, T.; Partners, L.; Ashford, K. Geological and geotechnical considerations for seismic hazards for Penang Island, Malaysia. In Proceedings of the XVII ECSMGE-2019, Reykjavik, Iceland, 1–7 September 2019. [Google Scholar]
- Abidin, H.Z.; Andreas, H.; Gamal, M.; Gumilar, I.; Napitupulu, M.; Fukuda, Y.; Deguchi, T.; Maruyama, Y.; Riawan, E. Land subsidence characteristics of the Jakarta Basin (Indonesia) and its relation with groundwater extraction and sea level rise. In Groundwater Response to Changing Climate; CRC: Boca Raton, FL, USA, 2010; Chapter 10; pp. 113–130. [Google Scholar]
- Erban, L.E.; Gorelick, S.M.; Zebker, H.A. Groundwater extraction, land subsidence, and sea-level rise in the Mekong Delta, Vietnam. Environ. Res. Lett. 2014, 9, 084010. [Google Scholar] [CrossRef]
- Wang, J.; Gao, W.; Xu, S.; Yu, L. Evaluation of the combined risk of sea level rise, land subsidence, and storm surges on the coastal areas of Shanghai, China. Clim. Chang. 2012, 115, 537–558. [Google Scholar] [CrossRef]
- Nicholls, R.J.; Mimura, N.; Topping, J.C. Climate change in south and south-east Asia: Some implications for coastal areas. J. Glob. Environ. Eng. 1995, 1, 137–154. [Google Scholar]
- Xichao, H.; Meng, W.; Bing, H.; Tianbin, Y.; Yu, J. Study on Early Identification of Landslide Hazard in Mountain Valley Area based on InSAR and Optical Remote Sensing Technology. In Proceedings of the IOP Conference Series: Earth and Environmental Science; IOP Publishing: Birstol, UK, 2020; Volume 570, p. 062047. [Google Scholar]
- Kim, J.W. Applications of Synthetic Aperture Radar (SAR)/SAR Interferometry (InSAR) for Monitoring of Wetland Water Level and Land Subsidence. Ph.D. Thesis, The Ohio State University, Columbus, OH, USA, 2013. [Google Scholar]
- Bayramov, E.; Buchroithner, M.; Kada, M. Radar Remote Sensing to Supplement Pipeline Surveillance Programs through Measurements of Surface Deformations and Identification of Geohazard Risks. Remote Sens. 2020, 12, 3934. [Google Scholar] [CrossRef]
- Lanari, R.; Mora, O.; Manunta, M.; Mallorqui, J.; Berardino, P.; Sansosti, E. A small-baseline approach for investigating deformations on full-resolution differential SAR interferograms. IEEE Trans. Geosci. Remote Sens. 2004, 42, 1377–1386. [Google Scholar] [CrossRef]
- Golub, G.H.; Loan, C.F.V. Matrix Computations, 3rd ed.; Johns Hopkins University Press: Baltimore, MD, USA, 1996; ISBN 978-0-8018-5414-9. [Google Scholar]
- Chen, G.; Zhang, Y.; Zeng, R.; Yang, Z.; Chen, X.; Zhao, F.; Meng, X. Detection of Land Subsidence Associated with Land Creation and Rapid Urbanization in the Chinese Loess Plateau Using Time Series InSAR: A Case Study of Lanzhou New District. Remote Sens. 2018, 10, 270. [Google Scholar] [CrossRef] [Green Version]
- Bianchini Ciampoli, L.; Gagliardi, V.; Tosti, F.; Calvi, A.; Benedetto, A. Persistent Scatterer SAR Interferometry (PSI) for Airport Runways monitoring. In Proceedings of the EGU General Assembly 2020, Online, 4–8 May 2020. EGU2020-8699. [Google Scholar] [CrossRef] [Green Version]
- Goovaerts, P. Geostatistics for Natural Resource Evaluation; Oxford University Press: New York, NY, USA, 1997. [Google Scholar]
- Miyaya, Y.; Kogure, K.; Honjo, Y. Estimation of spatial variation of soil profiles in a submarine clayey deposit. Proc. Civ. Eng. Ocean 1997, 13, 441–446. [Google Scholar] [CrossRef]
- Kulp, S.A.; Strauss, B.H. New elevation data triple estimates of global vulnerability to sea-level rise and coastal flooding. Nat. Commun. 2019, 10, 1–12. [Google Scholar] [CrossRef] [Green Version]
- Bove, G.; Becker, A.; Sweeney, B.; Vousdoukas, M.; Kulp, S. A method for regional estimation of climate change exposure of coastal infrastructure: Case of USVI and the influence of digital elevation models on assessments. Sci. Total Environ. 2020, 710, 136162. [Google Scholar] [CrossRef] [PubMed]
- Wu, Q.; Jia, C.; Chen, S.; Li, H. SBAS-InSAR Based Deformation Detection of Urban Land, Created from Mega-Scale Mountain Excavating and Valley Filling in the Loess Plateau: The Case Study of Yan’an City. Remote Sens. 2019, 11, 1673. [Google Scholar] [CrossRef] [Green Version]
- Guo, H.; Zhang, Z.; Cheng, G.; Li, W.; Li, T.; Jiao, J.J. Groundwater-derived land subsidence in the North China Plain. Environ. Earth Sci. 2015, 74, 1415–1427. [Google Scholar] [CrossRef]
Figure 1.
The study area and the CoastalDEM of Penang Island. (a) the study area is presented by a yellow color, and Peninsular Malaysia is presented by blue color; (b) the DEM of CoastalDEM with 90m spatial resolution.
Figure 1.
The study area and the CoastalDEM of Penang Island. (a) the study area is presented by a yellow color, and Peninsular Malaysia is presented by blue color; (b) the DEM of CoastalDEM with 90m spatial resolution.

Figure 2.
Annual mean sea level data from the Permanent Services for Mean Sea Level (PSMSL) for Penang Island (Station ID: 1595) from 1986 to 2016, the red line represents the trend line.
Figure 2.
Annual mean sea level data from the Permanent Services for Mean Sea Level (PSMSL) for Penang Island (Station ID: 1595) from 1986 to 2016, the red line represents the trend line.

Figure 3.
The time-position and time-baseline configuration of SBAS-InSAR interferometric pairs from descending track (a,b) and ascending track (c,d), respectively. The yellow dots denote the super master image, and the green dots are the slave images. Blue lines represent interferometric pairs.
Figure 3.
The time-position and time-baseline configuration of SBAS-InSAR interferometric pairs from descending track (a,b) and ascending track (c,d), respectively. The yellow dots denote the super master image, and the green dots are the slave images. Blue lines represent interferometric pairs.

Figure 4.
The average deformation rate maps of the SBAS-InSAR technique from ascending (a) and descending (b), respectively. The negative values indicate land subsidence, while the positive values indicate uplift.
Figure 4.
The average deformation rate maps of the SBAS-InSAR technique from ascending (a) and descending (b), respectively. The negative values indicate land subsidence, while the positive values indicate uplift.

Figure 5.
The regression analysis result between ascending and descending tracks.

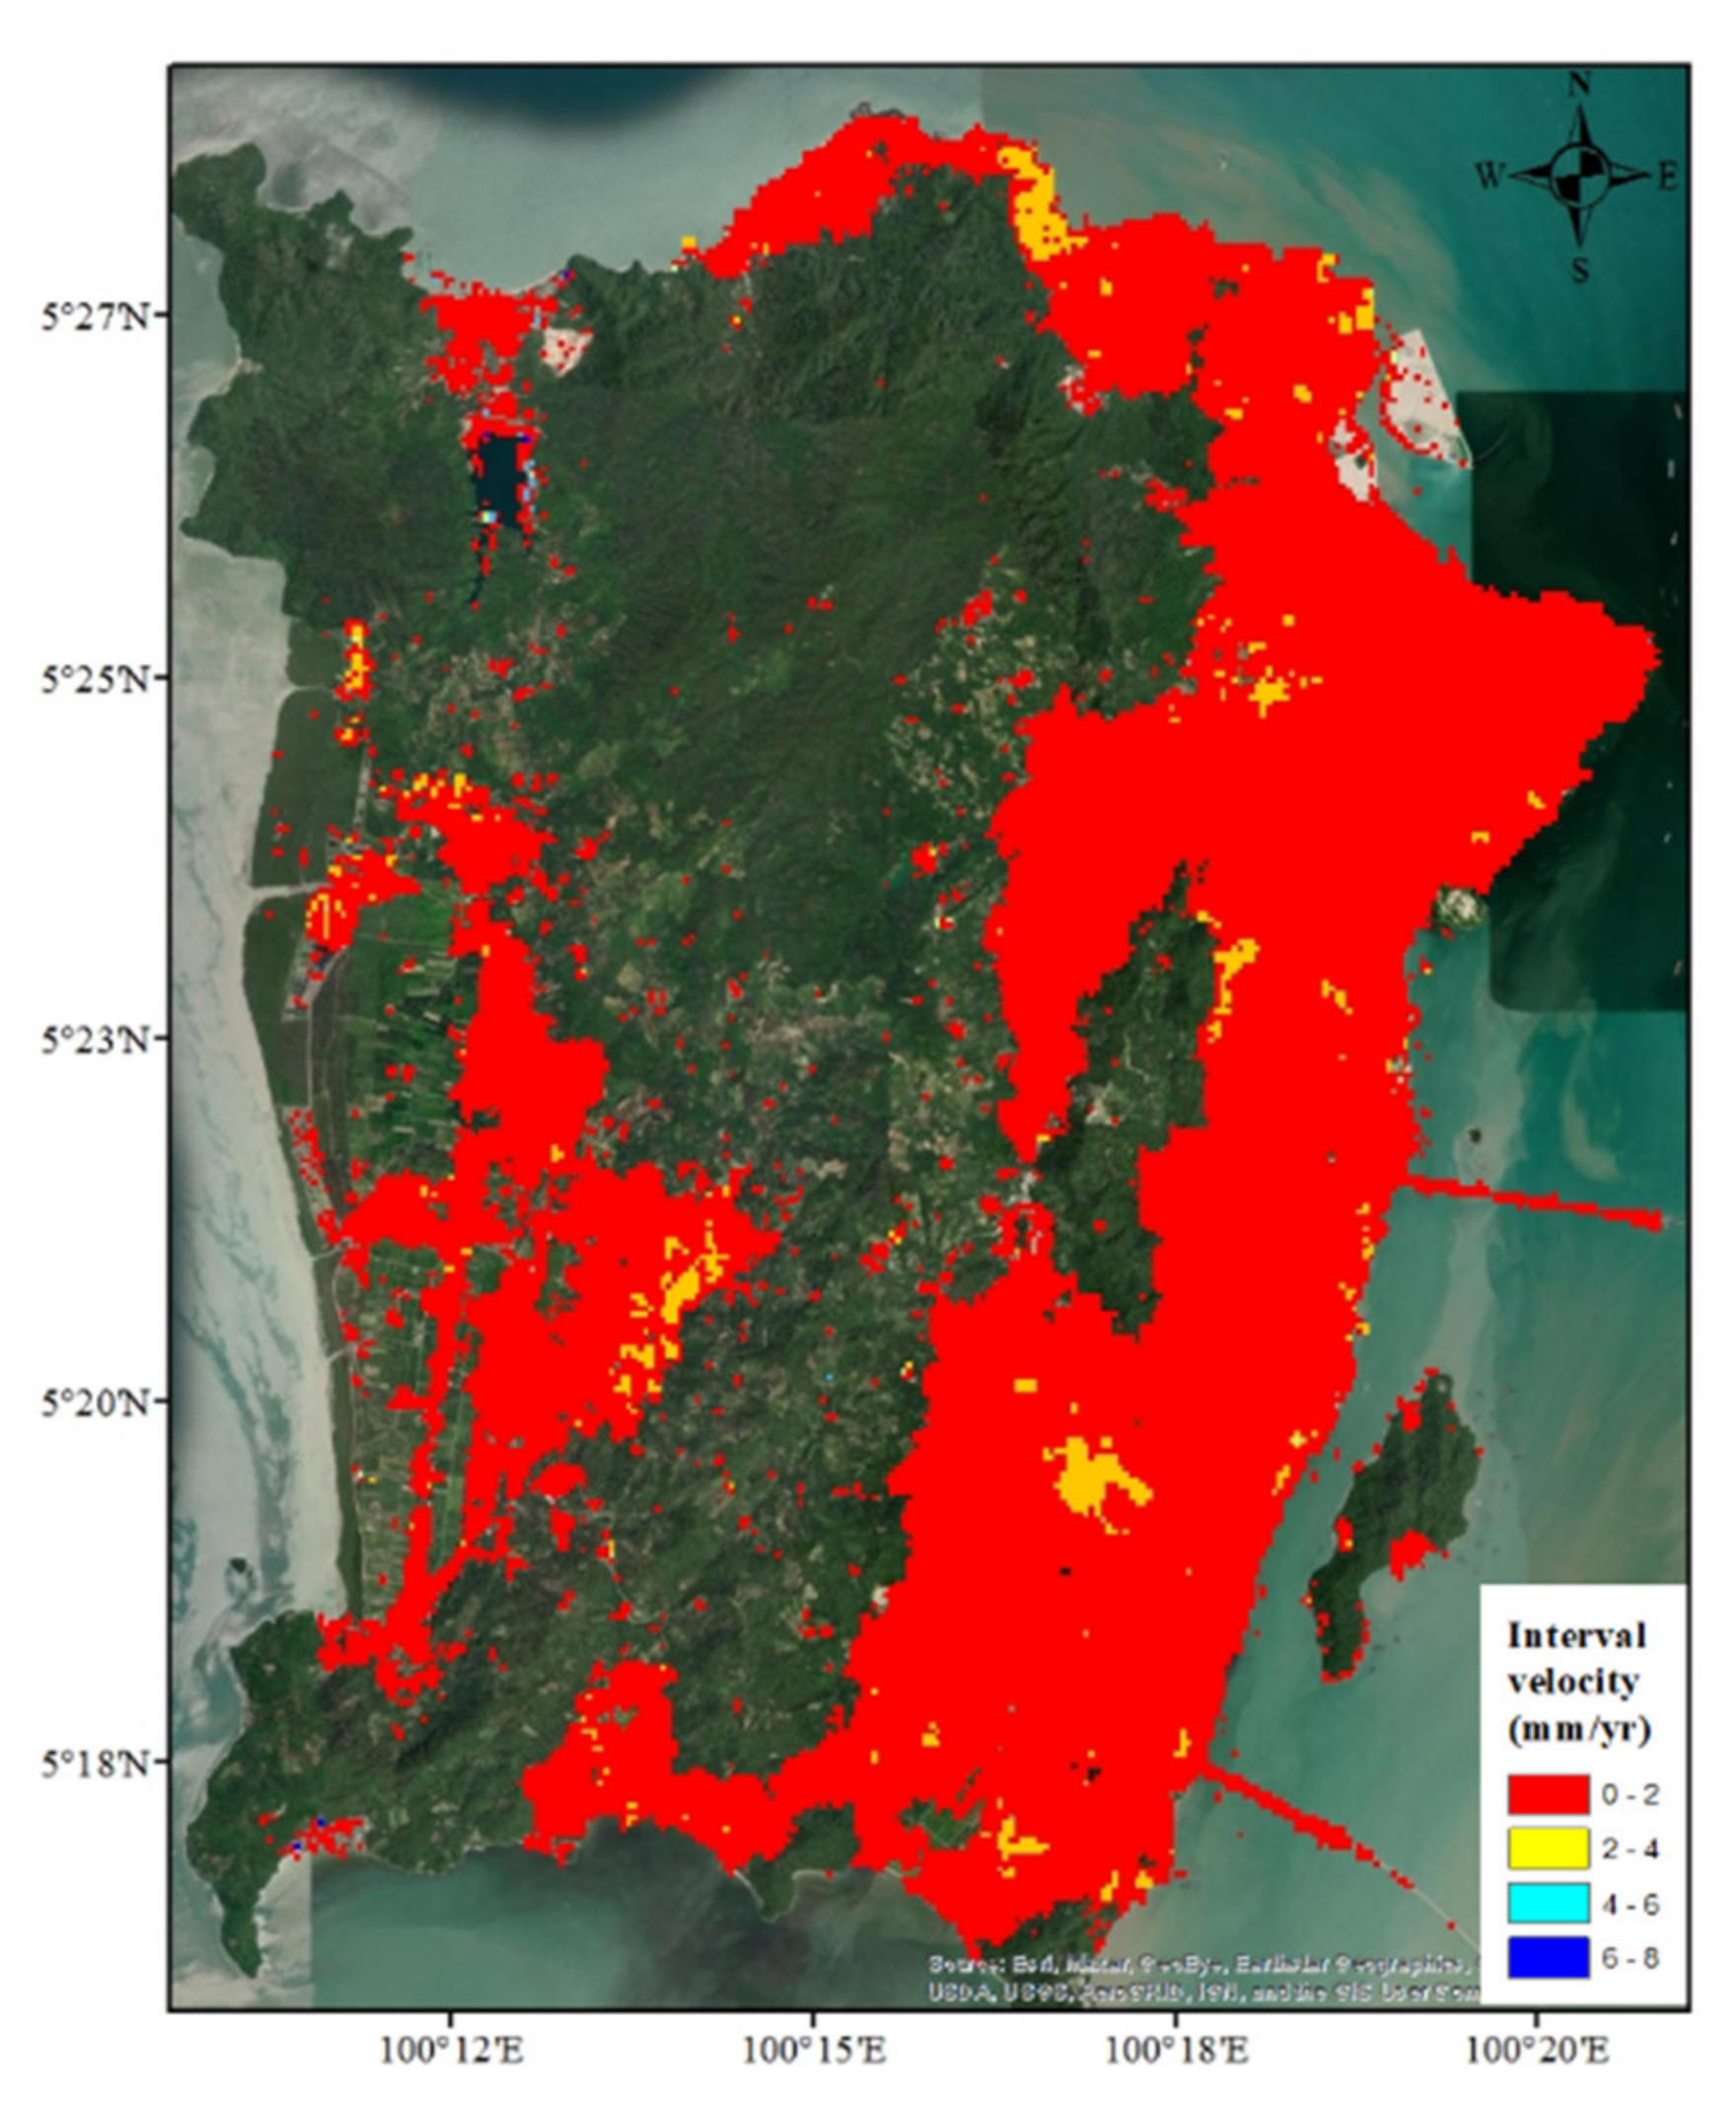
Figure 6.
The deviation distribution of the ascending and descending results in the pixel (mm/year).
Figure 6.
The deviation distribution of the ascending and descending results in the pixel (mm/year).

Figure 7.
The flowchart of the methodology used in this study.

Figure 8.
(a) the regression analysis result of the geostatistical analyst method; (b) the land deformation result of the geostatistical analyst method. Site A, B and C will be further discussed below.
Figure 8.
(a) the regression analysis result of the geostatistical analyst method; (b) the land deformation result of the geostatistical analyst method. Site A, B and C will be further discussed below.

Figure 9.
Land use map in Site C.

Figure 10.
Inundation map for Penang Island under different projections by 2100. (a) the inundated area under the lowest effect level; (b) inundated area under the highest effect level. The results of sea-level rise are shown in red, and the cumulative impacts of sea-level rise and land subsidence are shown in yellow.

Publisher’s Note: MDPI stays neutral with regard to jurisdictional claims in published maps and institutional affiliations. |
© 2021 by the authors. Licensee MDPI, Basel, Switzerland. This article is an open access article distributed under the terms and conditions of the Creative Commons Attribution (CC BY) license (https://creativecommons.org/licenses/by/4.0/).
Share and Cite
MDPI and ACS Style
Gao, G.; San, L.H.; Zhu, Y. Flood Inundation Analysis in Penang Island (Malaysia) Based on InSAR Maps of Land Subsidence and Local Sea Level Scenarios. Water 2021, 13, 1518. https://doi.org/10.3390/w13111518
AMA Style
Gao G, San LH, Zhu Y. Flood Inundation Analysis in Penang Island (Malaysia) Based on InSAR Maps of Land Subsidence and Local Sea Level Scenarios. Water. 2021; 13(11):1518. https://doi.org/10.3390/w13111518
Chicago/Turabian StyleGao, Guosheng, Lim Hwee San, and Yidan Zhu. 2021. "Flood Inundation Analysis in Penang Island (Malaysia) Based on InSAR Maps of Land Subsidence and Local Sea Level Scenarios" Water 13, no. 11: 1518. https://doi.org/10.3390/w13111518
Note that from the first issue of 2016, this journal uses article numbers instead of page numbers. See further details here.