Article

Comparison of Sr Transport in Compacted Homoionous Na and Ca Bentonite Using a Planar Source Method Evaluated at Ideal and Non-Ideal Boundary Condition

1
Department of Nuclear Chemistry, Faculty of Nuclear Sciences and Physical Engineering, Czech Technical University in Prague, Břehová 7, 115 19 Prague, Czech Republic
2
Department of Nuclear Chemistry, Faculty of Natural Sciences, Comenius University in Bratislava, Ilkovičová 6, Mlynská dolina, 842 15 Bratislava, Slovakia
*
Author to whom correspondence should be addressed.
Water 2021, 13(11), 1520; https://doi.org/10.3390/w13111520
Submission received: 25 April 2021 / Revised: 22 May 2021 / Accepted: 24 May 2021 / Published: 28 May 2021
(This article belongs to the Special Issue Solid/Liquid Adsorption in Water and Wastewater Treatment)

Abstract

:
With the aim to determine the influence of dominant interlayer cation on the sorption and diffusion properties of bentonite, diffusion experiments with Sr on the compacted homoionous Ca- and Na-forms of Czech natural Mg/Ca bentonite using the planar source method were performed. The bentonite was compacted to 1400 kg·m−3, and diffusion experiments lasted 1, 3 or 5 days. Two methods of apparent diffusion coefficient Da determination based on the analytical solution of diffusion equation for ideal boundary conditions in a linear form were compared and applied. The determined Da value for Ca-bentonite was 1.36 times higher than that for Na-bentonite sample. Values of Kd were determined in independent batch sorption experiments and were extrapolated for the conditions of compacted bentonite. In spite of this treatment, the use of Kd values determined by batch sorption experiments on a loose material for the determination of effective diffusion coefficient De values from planar source diffusion experiments proved to be inconsistent with the standard Fickian description of diffusion taking into account only the pore diffusion in compacted bentonite. Discrepancies between Kd and De values were measured in independent experiments, and those that resulted from the evaluation of planar source diffusion experiments could be well explained by the phenomenon of surface diffusion. The obtained values of surface diffusion coefficients Ds were similar for both studied systems, and the predicted value of total effective diffusion coefficient De(tot) describing Sr transport in the Na-bentonite was four times higher than in the Ca-bentonite.

1. Introduction

Clays are considered as promising host formations for the deep geological repository for disposal of high-level radioactive waste and spent nuclear fuel due to their main advantages, such as high sorption capacity for contaminants, geochemical and thermal stability, buffering capacity, low hydraulic conductivity, etc. [1]. The understanding of transport (sorption and diffusion) processes in clays and between clays and other materials is a key issue with respect to the functionality of engineered barriers [2].
For strongly sorbing species of radionuclides, steady-state methods of determining diffusion parameters are very time-consuming, and if used, the real achievement of the steady-state might be unsure, as it was encountered, for example, by Bestel et al. [3]. Additionally, if the time-lag method is used for the evaluation of through-diffusion experiments, the maintaining of the required ideal boundary conditions might be challenging because the flux into the compacted clay layer is large due to the sorption, and changing of solutions in reservoirs might become a source of uncertainties [4]. From this point of view, non-steady-state methods appear to be more suitable. In all methods using either an inlet and/or outlet reservoir, it is necessary to deal with separating filters, which affect the evaluation of the experiments, as was shown, e.g., by Glaus et al. [4,5] or Samper et al. [6]. Application of a planar-source method eliminates both of the mentioned complicating factors. Firstly, no filters are needed, eliminating the uncertainties associated with their impact on experiment evaluation. Secondly, the diffusion experiment duration would be short to ensure that the tracer will not reach the end of the bentonite layer and the required boundary conditions will be met. In the presented study, two evaluation methods based on a linear representation of the analytical solution of diffusion equation for given boundary conditions are introduced, also allowing the evaluation of real planar source diffusion experiments, which do not meet the required semi-infinite boundary condition [7].
The aim of our study was to verify the differences in transport properties between clays with different dominant interlayer cations, namely Na+ and Ca2+ as most investigated representatives of monovalent and divalent interlayer cations, respectively. Some of these differences were observed in our previous through-diffusion studies [8,9], in which natural bentonite saturated by respective electrolytes was used. The diffusive transport of Sr was faster when the dominating interlayer and background cation was Ca2+. This might be explained by lower swelling pressure and higher hydraulic conductivity of Ca-bentonite, which many authors have referred to [10,11,12,13,14,15]. For example, González Sánchez et al. [11] found HTO (tritiated water) De values about the factor 2.5 lower in Na-exchanged bentonite compared to Ca-exchanged bentonite.
As a sorbing species was chosen, Sr that exists dominantly as Sr2+ under the wide range of physico-chemical conditions and its sorption mechanism on clay minerals is dominantly ion exchange. This sorption mechanism is described as non-specific and reversible [16,17,18] with fast sorption kinetics, and therefore, the uptake is dependent on the solution composition and ionic strength as well as on the cation exchange capacity and cation-exchange complex composition of the sorbent. The dependence of Sr distribution and selectivity coefficient value in FEBEX bentonite contacted to sodium solutions on ionic strength was showed by Missana and García-Gutiérrez [19]. The strongest competitor for Sr2+ sorption on clay minerals is Ca2+ due to its similar ionic (respectively hydrated) radius and valence [20]. Suppressed Sr sorption on Slovak bentonite by cations in the order of Ba2+ < Ca2+ < Mg2+ < NH4+ < K+ < Na+ was reported by Galamboš et al. [21], and similarly, Khan et al. [22] reported the decreasing competitive strength for Sr of Ca2+ < Mg2+ < K+ < Na+ and decreasing Sr sorption with increasing ionic strength of solution. In our sorption study [9], the selectivity of natural bentonite for divalent cations was found to be about ten times higher than the selectivity for Na. This is in agreement with the selectivity coefficient determined by Karnland et al. [23] for the exchange of Ca for Na on the MX-80 bentonite, which was 5.7–11.7 with the correction for activity in high ionic strength solutions (correction factor 1.5). To further eliminate complicating factors such as a heterogeneous mixture of interlayer cations in natural bentonite, homoionous Na- and Ca-forms of the Czech natural Mg/Ca bentonite were used in this work.
It is often reported that some cations, mainly those from alkali or alkali earth metal groups that have high hydration status and their main sorption mechanism on clay minerals is ion exchange, diffuse through compacted clays faster than expected, e.g., on the basis of HTO diffusion or batch sorption experiments [5,6,18,24,25,26,27,28]. Most of these studies were based on through-diffusion experiments. For observed discrepancies between the results of diffusion experiments and single porosity diffusion models which suppose linear decrease of apparent diffusion coefficient Da with increasing value of distribution coefficient Kd, an idea of surface diffusion was introduced. Such discrepancies were described, e.g., by Eriksen et al. [29]. The theory was first described for gases, but later was also used for ionic substances. As early as 1983, Rasmuson and Neretnieks [30] introduced surface diffusion coefficient Ds [m2·s−1]. Surface diffusion enhances the diffusive transport and is related to sorption via distribution coefficient and dry density of the clay. The mobile surface-bound species might be adsorbed in the electrical double-layer (EDL) or create an outer-sphere complex [31]. This means that the effect of surface diffusion depends on the cation hydration status, and the cations with a more extensive hydration shell, which is also bound by weaker sorption forces, should be more influenced. This assumption is supported by results of diffusion experiments with strongly (Cs, Eu) and weakly (Na, Sr) bound species, where the diffusive transport of the former usually fits the non-electrostatic single-porosity models better, whereas the transport of the latter is faster than predicted, e.g., in [19,29,32].
Except for the extent of hydration shell and sorption specificity, the surface diffusion is further influenced by the ionic strength of pore solution and the dry density of clay material. Thanks to the competition between ions in pore water, sorption by ion exchange is lower [15] and thus the effect of surface diffusion is less pronounced, and the diffusion is slower as the ionic strength of pore solution increases. At low ionic strengths, faster diffusion expressed as higher effective diffusion coefficient De is often observed [24,28]. Glaus et al. [27] evaluated diffusion experiments of Sr, Co and Zn with the use of transport code in the geochemical speciation program PhreeqC [33], which allows to implement cation mobility in EDL, and found a good agreement between the model and experimental data. As it was explained by Tachi and Yotsuji [34], drawing from an electrostatic single-porosity model developed by Ochs et al. [35,36], ionic strength does not influence only sorption, but through electrostatic forces, which manifest as geometric characteristic of pore space, it influences effective diffusivity itself. Resulting apparent diffusion coefficients are then ionic strength independent, which is consistent with Gouy–Chapman theory [37]. The microstructure analysis performed by Melkior et al. [38] showed that the diffusion coefficient of HTO and Na+ was dependent on the content of gel phase in the clay with solid particles homogeneously dispersed throughout the microstructure, which was higher in Na-dominated clay, whereas in Ca-dominated clay, solid particles were aggregated with free spaces amidst them. The dependence, however, was of the opposite significance for neutral and cationic species, i.e., HTO diffusion was correlated to the gel content negatively, whereas Na+ diffusion was positive. This indicates that the cation diffusion pathway may differ from that of neutral species. This might be also supported by the results of Kozaki et al. [12], although they only measured Da values. They found increasing values of Da(HTO) with increasing content of Ca2+ in Ca-enriched clay but independent values of Da(Ca), leading to the conclusion that HTO diffuses in bulk pore water, whereas cations diffuse dominantly through interlayer space, the characteristics of which, according to XRD analyses, do not depend on the content of Ca2+ in the clay.
From the review of literature resources, as well as from our own previous work, it is clear that the description of diffusive transport of Sr in compacted clays by the standard Fickean transport model is insufficient. Therefore, for this work, we have focused on relatively simple experimental methods and homoionous clay systems with the aim to quantify the cation dual transport pathway in a relatively simple manner and draw conclusions for future work with more complex systems.

2. Materials and Methods

The material used was Czech bentonite BaM (“Bentonite and Montmorillonite”) which was transformed into homoionous Ca- and Na-form (named Ca-BaM and Na-BaM, respectively) by the procedure mentioned below. Bentonite BaM has high smectite content ~88% (distribution of other minerals is: SiO2 ~5%, anatas ~4% and Mg-siderite ~3%) and CEC ~60 mmol+·100 g−1 (determined by Cu-Trien method) [39]. The bentonite was transformed into homoionous form in four steps: (a) carbonates removal; (b) transformation into dominant cation form; (c) removal of salt residuals and dialysis; (d) drying and milling. The resulting occupancy of ion exchange sites by dominating ions were ~85% in case of Na-BaM and ~88% in case of Ca-BaM.

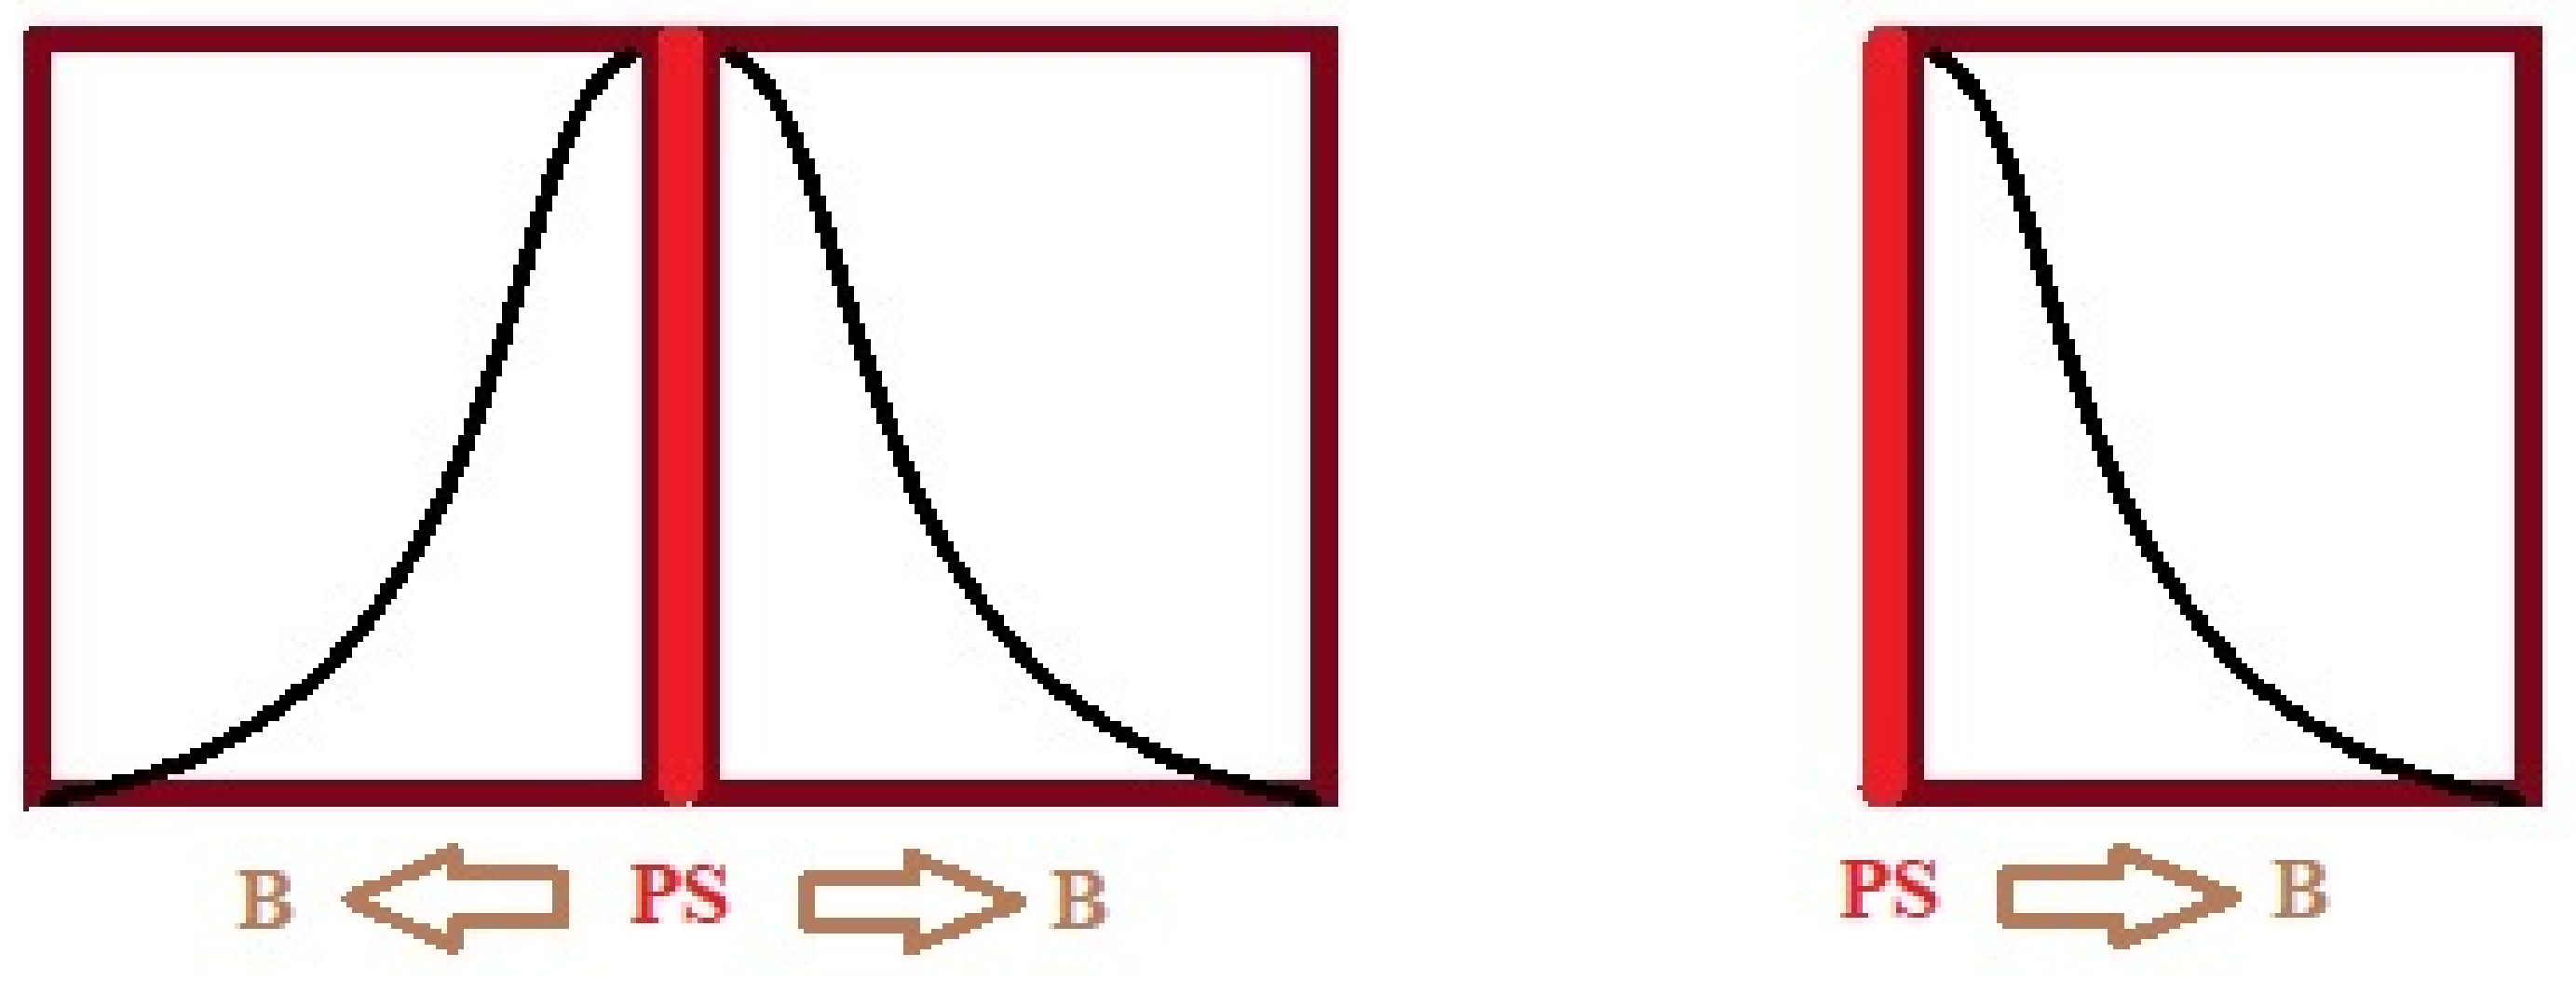
2.1. Planar Source Diffusion Experiments

The main experimental technique was a planar source diffusion experiment. The diffusion experiments were carried out in static stainless-steel diffusion cells with the inner lining of carbon composite, the inner diameter d = 0.03 m and the length L = 0.01 or 0.015 m. Initially, the given mass of powdered bentonite for the dry density ρd = 1400 kg∙m−3 was weighted and compacted by hydraulic press into the diffusion cell. For saturation, stainless-steel filters were placed at both ends of the cell, the plastic reservoir with solution of either 0.1 M NaCl or 0.033 M CaCl2) was connected, and the cell was placed into the vacuum dryer for at least two weeks. When the solution reached the end of the plug, the direction of saturation was switched to ensure the homogeneous saturation. The diffusion cell with filters and reservoir is schematically depicted in Figure 1 and described in detail in a separate publication [40].
Before the start of an experiment, the tail end of the cell was sealed with a plastic foil to avoid water evaporation and diffusion into the filter space. The source of radioactive tracer was a circle of filter paper with the same diameter as the bentonite plug spiked with 7.5 × 10⁻⁸ m3 of solution (V0, [m3]) containing a known initial source tracer concentration (C0, [mol∙m−3]) provided by non-active carrier (SrCl2·6H2O) and a known total activity of 85Sr measured as counts per 100 s (I0, [counts/100 s]) (concentration of 85Sr was not higher than 5·10−12 mol·m−3) and thus a known molar mass of non-active Sr (M, [mol]). All reagents used during experiments were with analytical purity. The source end of the cell was then also sealed with plastic foil. It was verified in an independent experiment and also after the experiment termination that the tracer is sorbed neither by the filter paper nor by the plastic foil. It was also verified that the presence of the filter paper does not have significant influence on the shape of the concentration profile which would lead to mistaken value of determined Da, this knowledge is also supported in the literature [41]. After the given contact time, the bentonite plug was pushed out of the cell and sliced into 0.5 mm slices, which were placed into plastic vials, weighted, and 2 mL of demineralized water were added to unify geometry of 85Sr activity measurement. Samples γ-activity of 85Sr was measured in a well-type NaI(Tl) scintillation detector (Tesla, η ≈ 30%) with a single-channel analyzer (Tema JKA300 RS232) for 3 × 100 s. Samples were measured relatively against a reference sample with the correction to the background signal. The total concentration of the tracer in each sample (Ctot,i, [mol∙m−3]) was calculated from the total activity of the sample (Ii, [counts/100 s]) and from its volume (Vi, [m3]) estimated from its mass (mi, [g]) and known volume of the diffusion cell (Vcell, [m3]). The distance of the sample center from the source (x, [m]) was also calculated based on the volumes of individual slices. Finally, the slices were dried at temperature 105 °C, and from the difference between the wet and dry weights, the value of porosity ε was determined and the saturation and compaction homogeneity were verified.

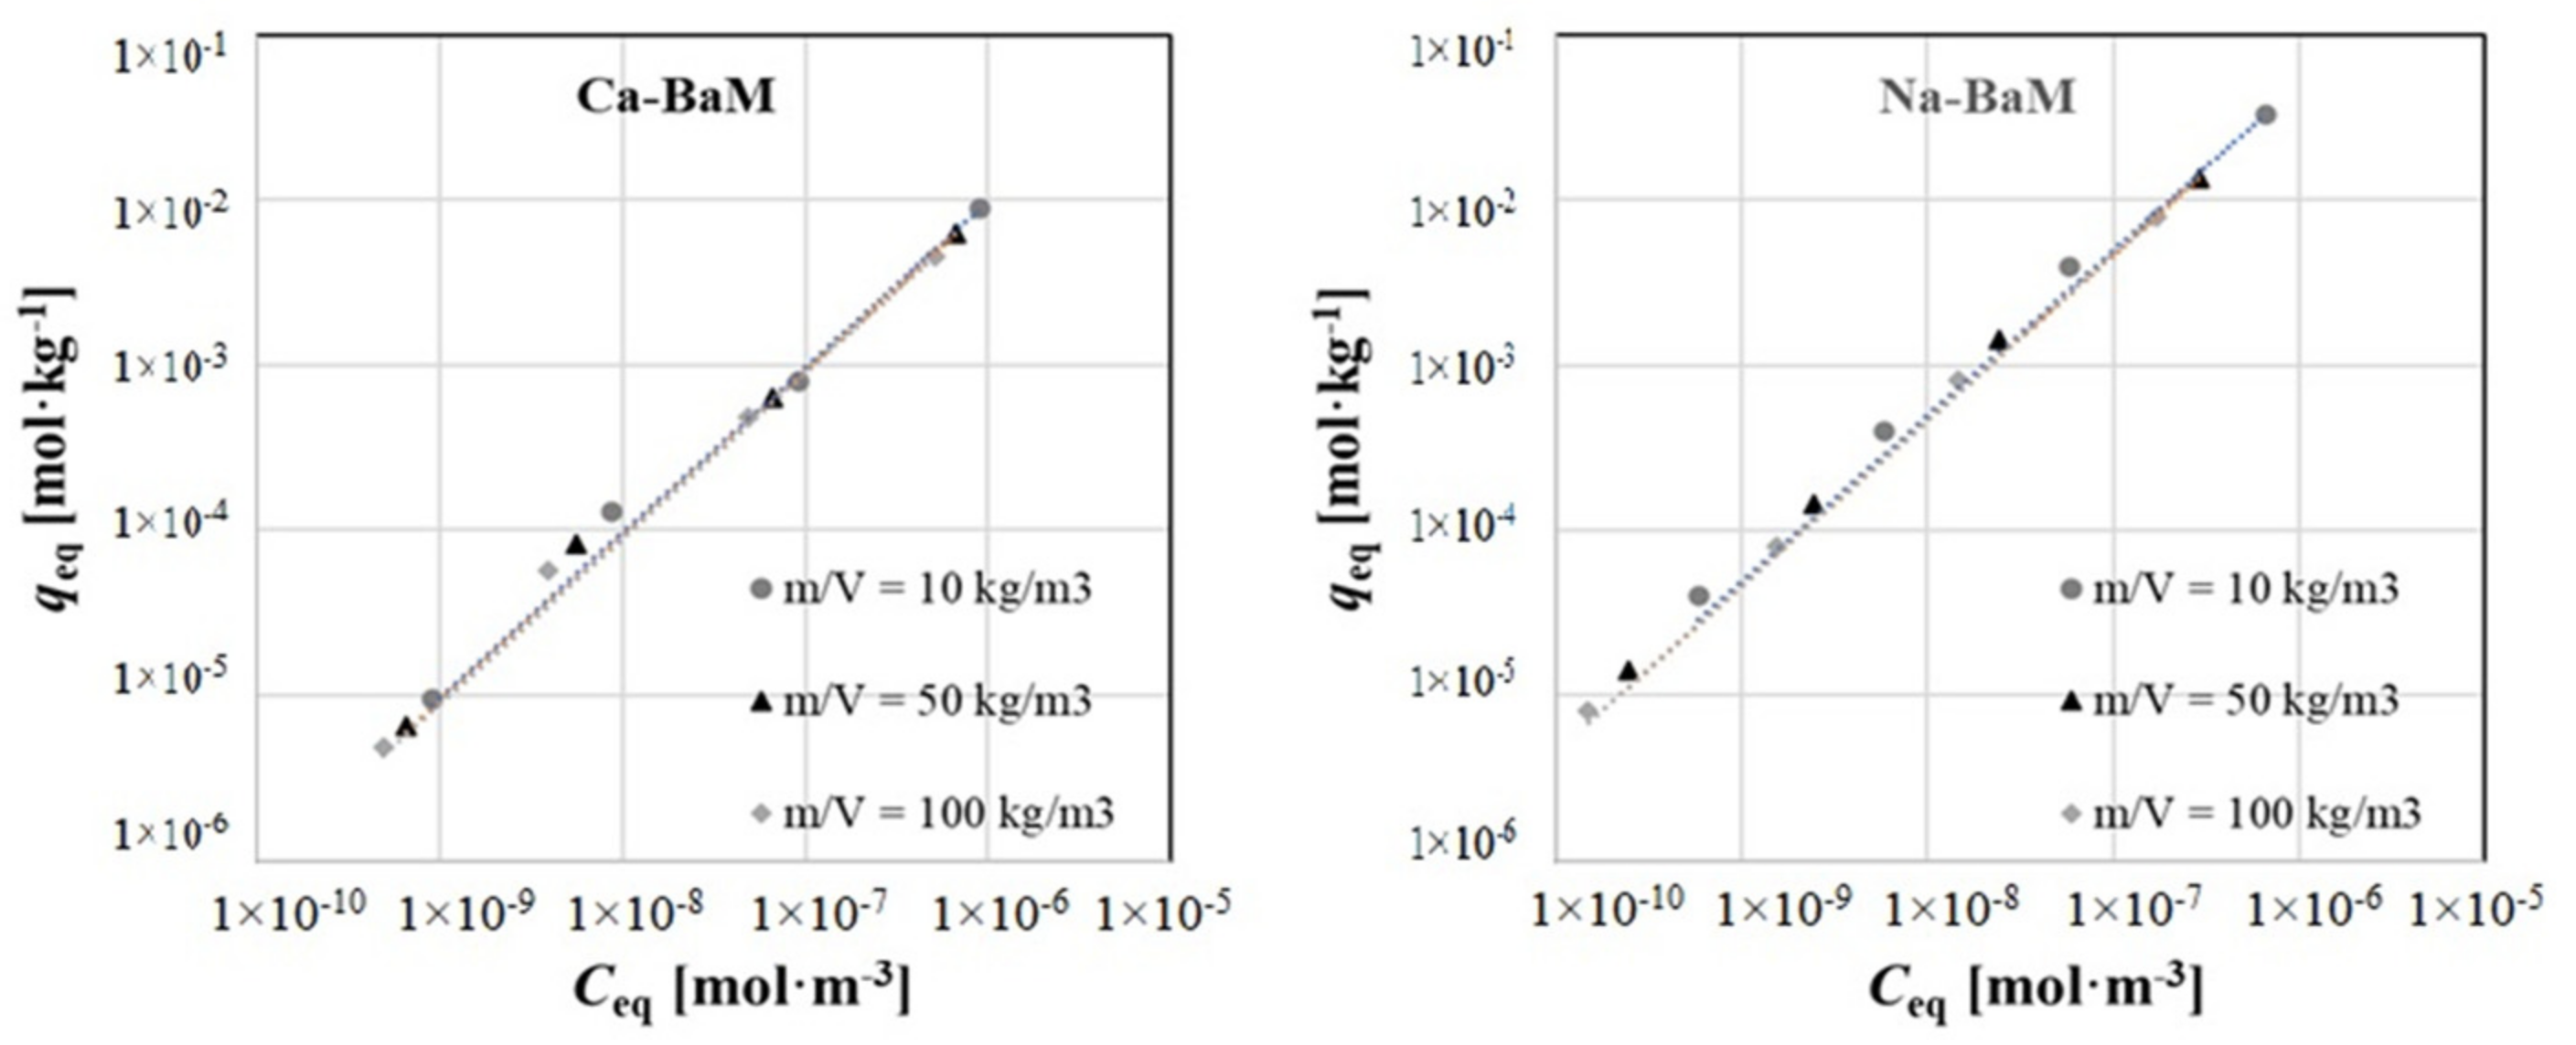
2.2. Batch Sorption Experiments

In addition to planar source diffusion experiments, batch sorption experiments with both clays mixed with respective electrolytes were carried out. Several values of solid-to-liquid ratios (m/V, [kg·m−3]) and a range of tracer total concentrations (C0, [mol·m−3]) were tested. The total concentration was controlled by non-active carrier (SrCl2·6H2O), and the distribution between solid and liquid phase was assessed with the use of radioactive tracer (85Sr), the concentration of which was not higher than 5 × 10⁻¹² mol·m−3. The equilibration time was set to be 3 days. The experimental vials were placed on the horizontal shaker for the desired contact time, after which samples were centrifuged (966× g for 10 min) and the activity in 2 mL of supernatant was measured in a well-type NaI(Tl) scintillation detector. The equilibrium distribution of a tracer between solid and liquid phase was determined and based on the measured data, sorption isotherms were constructed, expressed as q e q = f ( C eq ) , where qeq [mol·kg−1] is an equilibrium concentration in the solid phase and Ceq [mol·m−3] is an equilibrium concentration in the liquid phase. The distribution coefficient Kd [m3·kg−1] was determined as a parameter of linear function q eq = K d   ·   C eq   for each solid-to-liquid ratio.

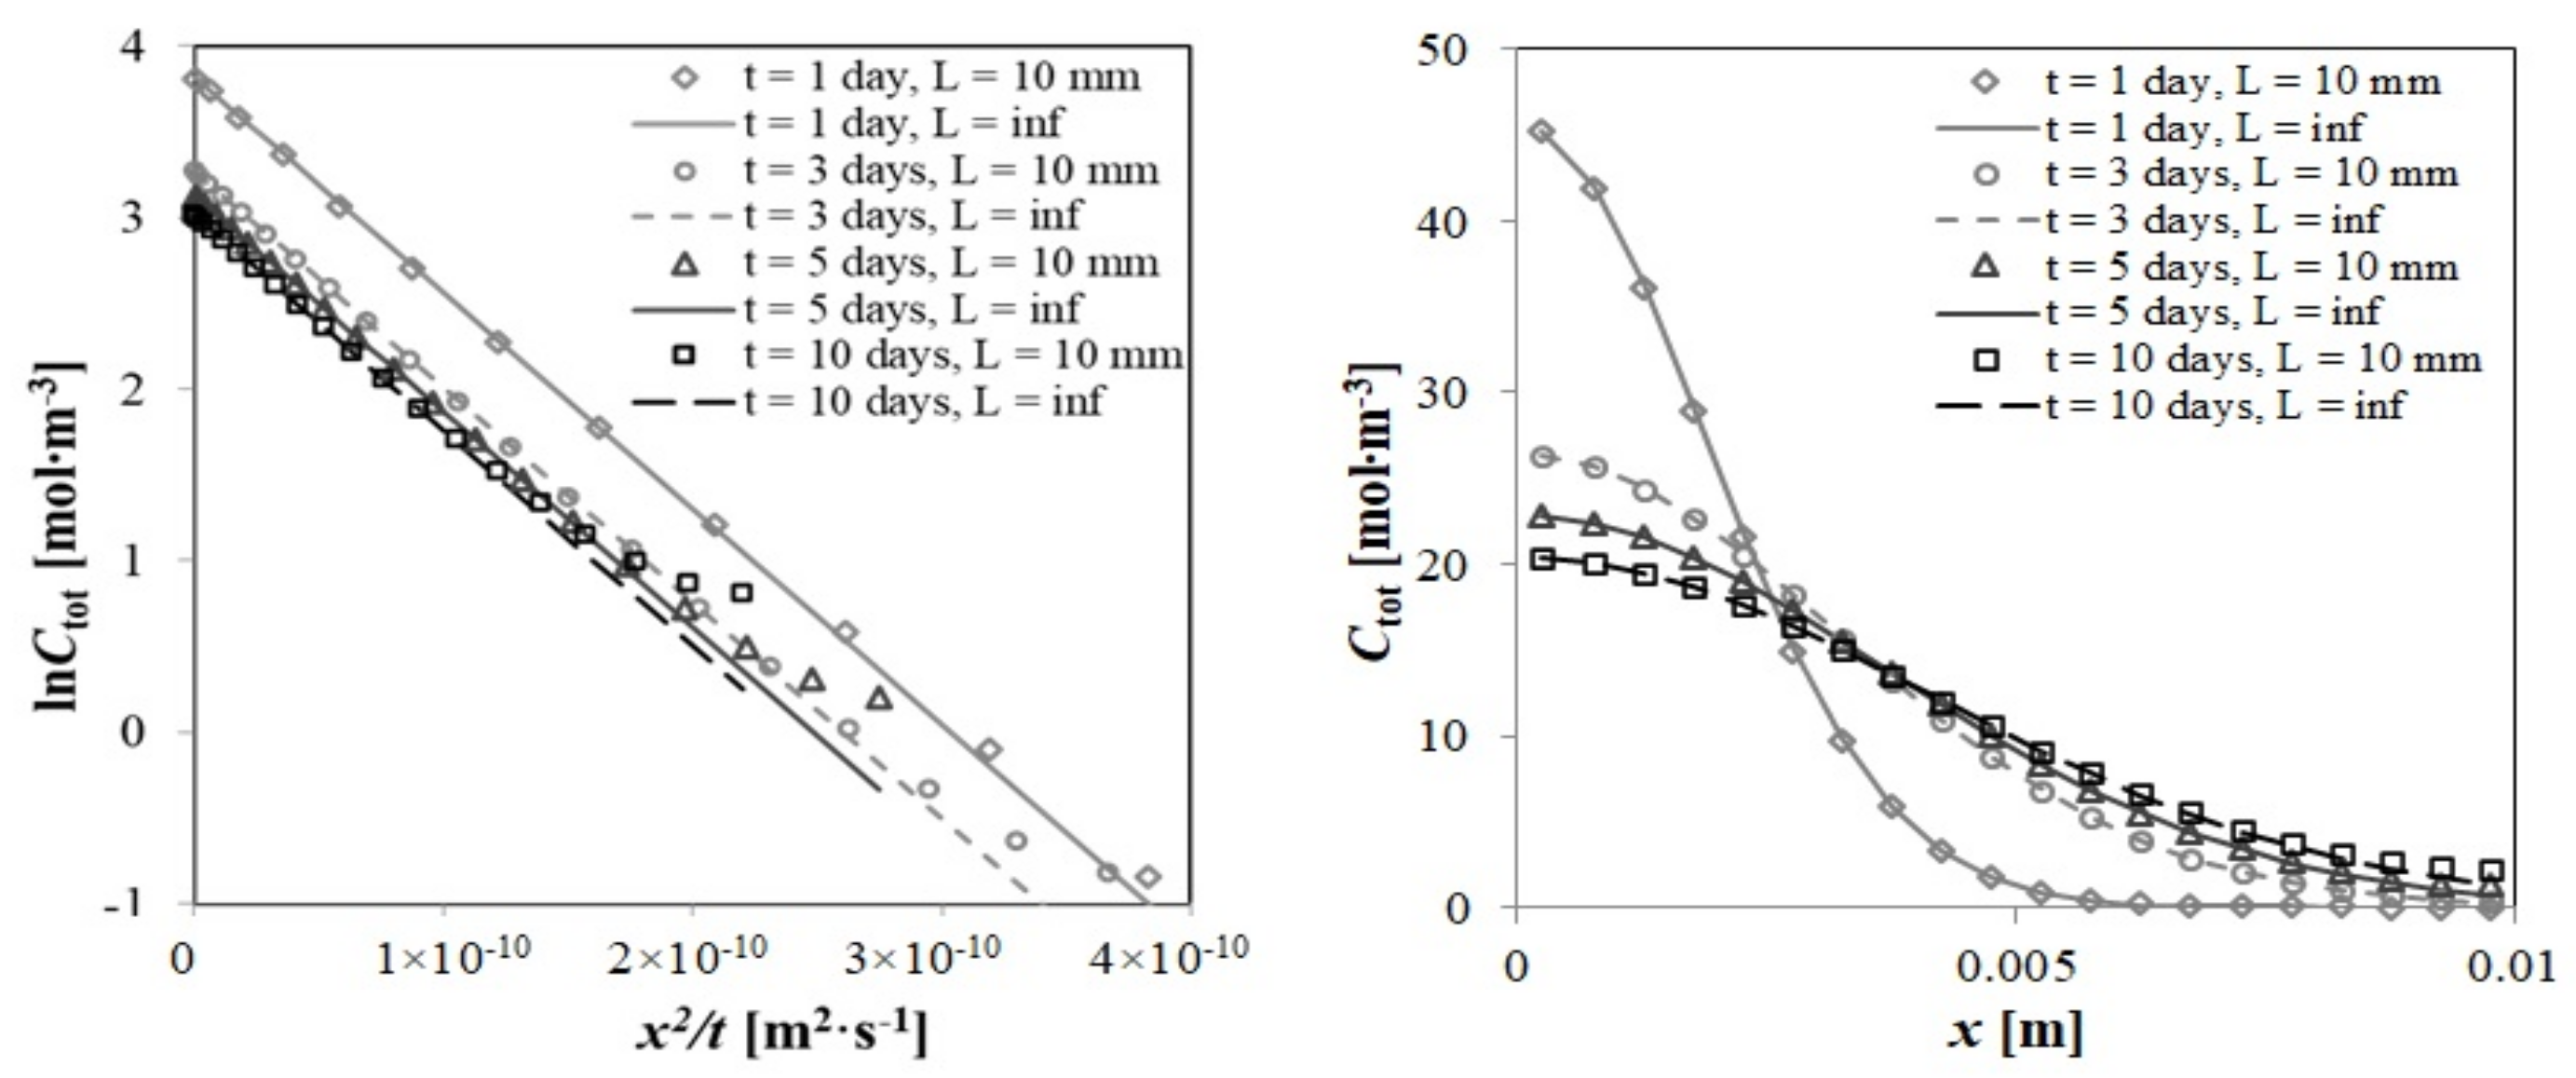
2.3. Evaluation of Planar Source Experiments

The usually described setup of planar-source method is a thin source, often a filter paper soaked with a tracer solution, placed between two parts of a compacted saturated bentonite sample [7]. For evaluation of such experiments, the analytical solution of diffusion equation might be used, which is restricted to initial and boundary conditions, which are further referred to as “ideal”. The assumptions of ideal planar source diffusion experiments are homogeneous, isotropic, saturated porous medium of semi-infinite length, i.e., the tracer does not reach the layer boundary (infinite boundary condition). The width of the planar source is very small, and therefore, Dirac delta function δ(x) might be applied for the description of the source. The source is homogeneous, i.e., the tracer is equally distributed over the cross section of the compacted bentonite sample. For the initial and boundary conditions in the time t = 0 and at the distance x = 0, the total concentration Ctot(x, t) equals:
C tot ( x = 0 ,   t = 0 ) = M A δ ( x )   and
C tot ( x   >   0 ,   t = 0 ) = 0
Here, Ctot(x, t) is a total tracer concentration [mol∙m−3] at the distance x [m] and the time t [s], M is a total tracer molar mass [mol], and A is a cross section area [m2].
Apparent diffusion coefficient Da for the symmetrical setup of diffusion experiment (i.e., the source placed between two parts of compacted saturated bentonite sample) is evaluated by the analytical solution of diffusion equation for the cross-section area unit [7]. This solution should be multiplied by the factor two for the asymmetrical setup of diffusion experiment (i.e., the source placed on the front side of compacted saturated bentonite plug) [42] (both setups are illustrated in Figure 2):
C tot ( x ,   t ) = M A π D a t exp   ( - x 2 4 D a t )
By logarithmization of this equation, the linear dependence of total tracer concentration logarithm on the square of longitudinal coordinate over time is obtained (4), in which both constants determining the linear function, the slope a and the intercept b, contain the apparent diffusion coefficient Da:
ln C tot x ,   t = ln ( M A π D a t )   -   x 2 4 D a t
The advantage of this method is that it not only provides the value of Da in two ways, but it gives also uncertainty estimates s(Da) for both methods of Da determination. The Gauss’s law of uncertainty propagation was applied, using standard deviations estimates of linear function parameters s(a) and s(b) obtained by the linear regression of transformed experimental data. Derived relationships for quantifying Da and s(Da) by both methods are summarized in Equations (5) and (6). The advantage of method ‘slope’ over method ‘intercept’ is that it is independent of the tracer amount in the source.
Method   slope :   D a = 1 4 a ,   S D a = D a a s a
Method   intercept :   D a = 1 π t · M A · e b 2 ,   S ( D a ) = 2 D a S b
Using these approaches, it is possible to evaluate even those experiments that do not satisfy the output boundary condition set for analytical solution of diffusion from the planar source (4), which assumes an infinite length of diffusion layer. At the real finite length of diffusion layer, the course of the concentration profiles over time is influenced by the real boundary condition at the end of the layer, i.e., it differs from the ideal course given by relation (4). The extent to which it would be suitable to evaluate real experimental data by applying the analytical solution of diffusion equation on the initial linear part of the concentration profile in a linear representation was demonstrated in a numerical study with the use of verified model of real diffusion experiment prepared in Contaminant Transport Module of GoldSim program environment [43], which is a graphical object-oriented program that allows to create complex models and run dynamic and probability simulations. The prepared model of diffusion experiment is based on a full analytical solution of transport equation and solves the diffusion equation using a finite difference method. Transport simulations may follow various initial and boundary conditions, consider linear or non-linear description of sorption and enable connection of filters. Its application on through-diffusion experiments with Sr was presented by Baborová et al. [8]. Using this model in a setup similar to a real planar source diffusion experiment, i.e., very small volume of inlet and outlet reservoirs, diffusion cell of length L = 10 mm and diameter d = 30 mm with the Da value 2 × 10⁻¹¹ m2∙s−1, concentration profiles were generated and compared with the analytical solution of diffusion equation valid for the planar source experiment (4). As can be visually assessed from Figure 3, for given conditions, the concentration profile in a finite diffusion cell begins to be influenced after 3 days of experiment duration, which was also verified in a numerical study. The analytical solution expressed as l n C tot = f x 2 t valid for semi-infinite boundary condition creates straight lines, which are almost parallel for different times, and their intercepts are function of time.
The difference between the default Da value 2 × 10⁻¹¹ m2∙s−1 and the Da value obtained by fitting of the analytical solution to the initial linear part of the transformed concentration profile ( ln C tot = f x 2 t ) in a model of real diffusion cell of finite length generated by the diffusion model in GoldSim program increased with increasing duration of the model experiment. Based on the results of this numerical study, it could be concluded that both methods based on the analytical solution of diffusion equation are feasible for the evaluation of planar source diffusion experiment, where the tracer concentration profile is influenced by the restricted length of diffusion cell, given that the effect is not too great. The difference between the default Da value and that obtained by the ‘intercept’ method exceed 10% after 16 days, whereas in case of the ‘slope’ method, it was after 10 days for given conditions. The ‘intercept’ method provided a smaller systematic error for more influenced profiles, i.e., for longer lasting experiments, and it tended to underestimate the theoretical Da value, whereas the ‘slope’ method was overestimating the Da value of several times in more influenced profiles.

3. Results

3.1. Batch Sorption Experiments

Sorption of Sr on both clays showed a linear trend in the given concentration range (Ceq from 10−9 to 10−6 mol·m−3), as shown in Figure 4. Values of Kd obtained from the slope of a linear regression of the equilibrium sorbed amount of tracer qeq [mol·kg−1] dependence on the equilibrium liquid concentration Ceq [mol·l−1] for each solid-to-liquid ratio are summarized in Table 1. Mean Kd value of Sr on Ca-BaM in CaCl2 was (9.4 ± 0.3) × 10−3 m3·kg−1, and (47.4 ± 1.8) × 10−3 m3·kg−1 on Na-BaM in NaCl background electrolyte, respectively. Such a difference between Sr sorption on clays with different dominating interlayer cations is in agreement with the previous findings on the natural bentonite [9]. It is given by the different selectivity of bentonite ion exchange sites for Na+, Ca2+ and Sr2+ ions. In our previous study [9], it was estimated that the selectivity of natural bentonite for divalent cations was about 10 times higher than that for monovalent Na+.
The Kd values of Sr on homoionous clays did not tend to decrease with increasing m/V as significantly as in the case of natural bentonite contacted with simple electrolytes [9]. Such result supports the assumption that the Kd dependence on m/V in natural bentonite is caused by competing cations, which are released into the solution in a higher amount when the bentonite mass in the system is increased. In case of homoionous clay contacted to homoionous solution, the competition among ions, except between the tracer and the dominant ion, was significantly reduced. However, because a certain dependence of Kd values on m/V was appreciable, an extrapolation of Kd value to the solid-to-liquid ratio m/V of compacted bentonite was performed according to power function, where:
K d = k ( m V ) n
The fitted constants k and n and the extrapolated Kd values for the bentonite dry density ρd = 1400 kg∙m−3 used in planar source diffusion experiments are summarized in Table 2.

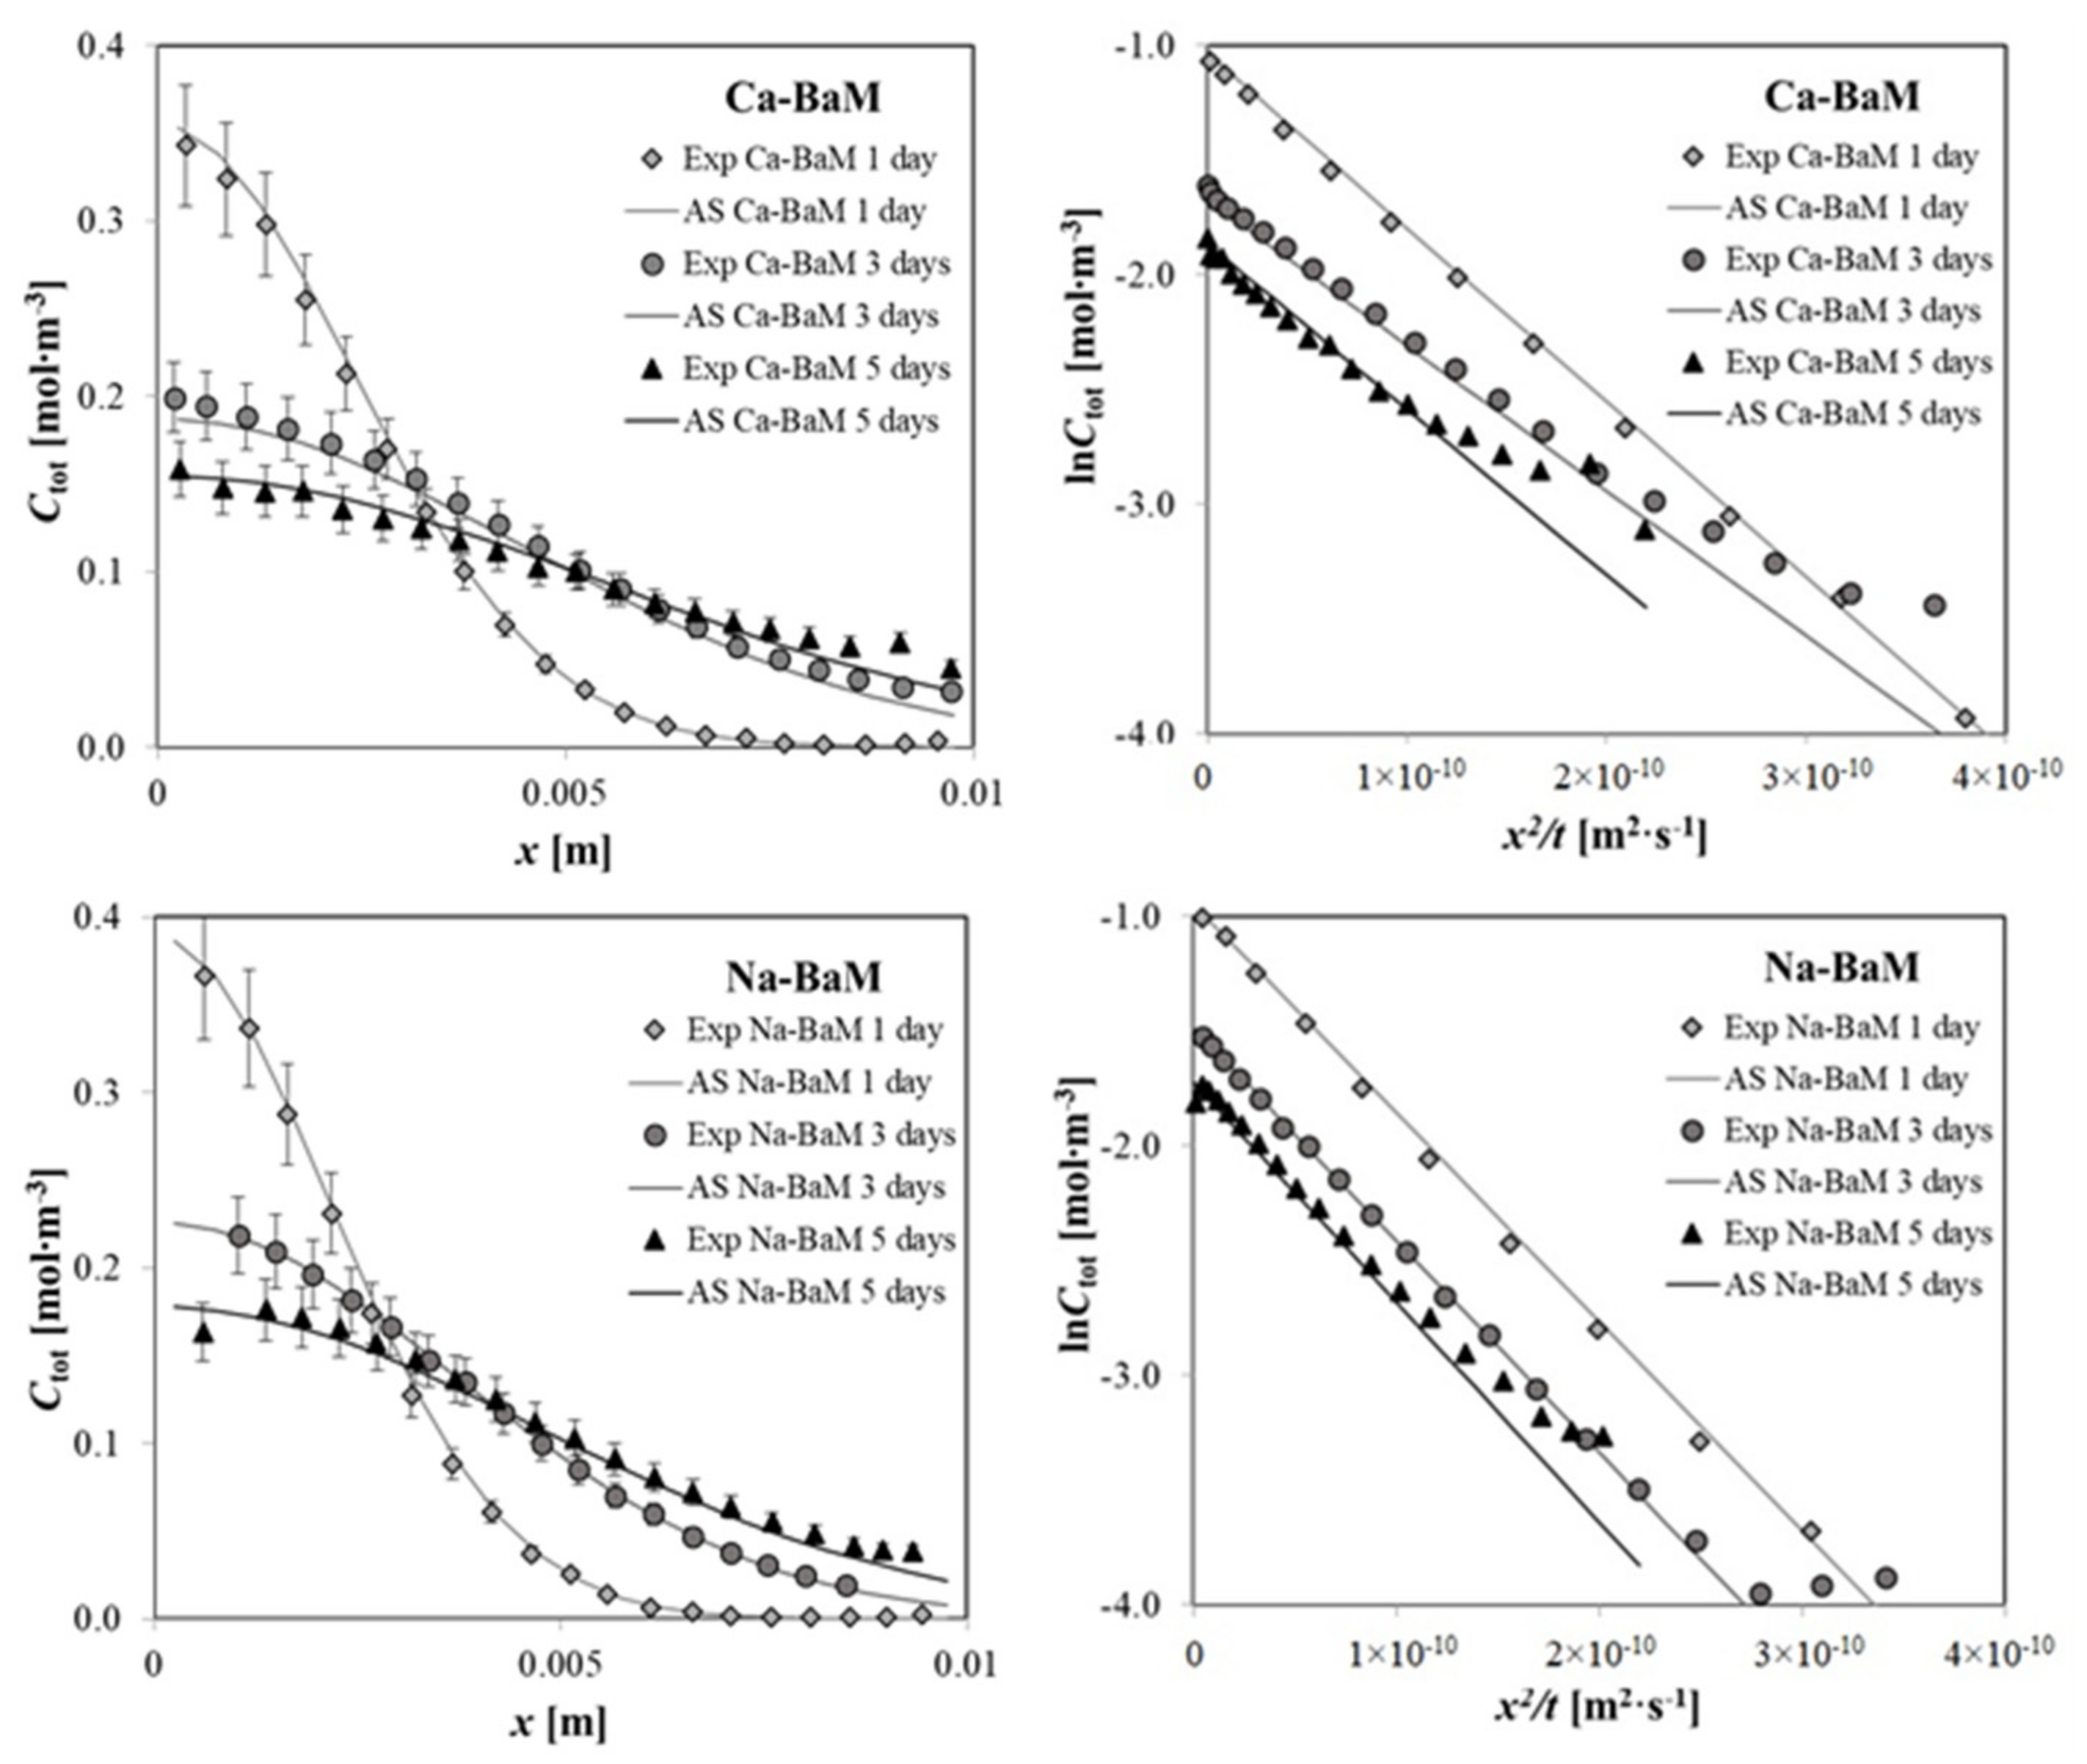
3.2. Planar Source Diffusion Experiments

Obtained profiles of Sr total concentration in compacted bentonite after the termination of planar source experiments were fitted with the analytical solution of diffusion equation for given boundary conditions in a linear form (4) and the ‘slope’ (5) and the ‘intercept’ (6) methods of Da evaluation were compared (Table 3). The modelled concentration profiles corresponding to the ‘slope’ method are displayed in Figure 5 along with experimental points. As can be seen, the concentration profiles of Sr in Ca-bentonite are less steep than those in Na-bentonite, which indicates faster transport of Sr and thus higher Da value in Ca-bentonite. This is in line with our previous findings on the natural bentonite [8]. The results of single experiments evaluations are summarized in Table 3.
The mean Da values and the estimates of its standard deviations obtained by the ‘slope’ method and the ‘intercept’ method did not differ significantly. Thus, final Da values for further discussion were calculated as the mean of values obtained from both methods, these values were (3.6 ± 0.2) × 10−11 m2·s−1 for Ca-BaM and (2.6 ± 0.2) × 10−11 m2·s−1 for Na-BaM, see Table 4. The Da value of Sr obtained in this work for Ca-BaM was 1.36 times higher than that for Na-BaM that might correspond either to lower value of Kd or to higher value of G (lower tortuosity) or both, which might be caused by higher swelling pressure in Na-bentonite. In any case, both the qualitative and the quantitative difference in diffusion between these two materials is less distinctive than it could be expected from the results of sorption experiments. This discrepancy will be further discussed.

4. Discussion

Obtained Da values lay within the range of usually reported Da values for similar experimental conditions (i.e., compacted powdered clay in dominant Ca- or Na-form) in the order of 10−11 m2·s−1 (e.g., [32,44,45]). Through-diffusion experiments were performed by Glaus et al. [46] on Volclay compacted to 1300 and 1600 kg∙m−3 and saturated with bentonite pore water and evaluated using a numerical solution with consideration of separating filters presence, and the resulting Da values were about 2 × 10⁻¹¹ m2·s−1. The results of Kasar et al. [44] and Kim et al. [32] were obtained by a symmetrical planar-source technique. On a smectite-rich clay compacted to 1600 kg∙m−3, Kasar et al. [44] found the Da value of about 3.3 × 10⁻¹¹ m2·s−1, and on MX−80, the Da values obtained for 1300 and 1600 kg∙m−3 were 1.6 × 10⁻¹¹ and 1.1 × 10⁻¹¹ m2·s−1, respectively [32]. All of these clays were dominantly in Na-form. There is not very much data on Sr diffusion in Ca-dominated clays relevant for this work. The Da values in FEBEX bentonite [6,25] are almost two orders of magnitude lower, which is given by two orders of magnitude higher distribution coefficient of Sr on this bentonite, which was contacted to bentonite pore water. Clay rocks exhibit low diffusion coefficients due to their high bulk density and low porosity. The Da value measured on Opalinus clay with bulk density of approximately 2500 kg∙m−3 is about three times lower compared to that in Na-BaM [18]. Similar values were found on Callovo-Oxfordian clay with a similar bulk density [26], although this clay was contacted with Bure pore water with dominating Ca2+ cation. The Da value of Sr on Callovo-Oxfordian clay contacted with Na-dominating solution of a similar ionic strength was about two times lower than in the previous example, i.e., 3.6 × 10⁻¹² m2·s−1, despite, in this case, the stated bulk density was slightly lower, ca 2200 kg∙m−3 [28].
From the nature of this type of diffusion experiment, which is evaluated by a model with a single fitting parameter, i.e., apparent diffusion coefficient Da, there is no inherent information on the values of either the partial diffusion parameters, such as Kd or G (a geometric factor that expresses the relationship between the diffusion in the pores of compacted bentonite, Dp, and under ideal conditions in free water, Dw), or the value of effective diffusion coefficient De. If we apply the value of Kd extrapolated from the batch sorption experiments with loose material using relation (7) in the equation (8), as it is stated, e.g., in the fundamental work of Shackelford and Moore [46] for the standard Fickian description of diffusion in a homogeneous water-saturated layer of compacted bentonite, the relation between an apparent diffusion coefficient Da, describing diffusion flux in the bulk volume, and an effective diffusion coefficient De (9), describing diffusion flux in the pore water, we will arrive at the conclusion that the value of geometric factor G should be higher than a physically relevant value for both systems (see Table 4):
D a = G ε D w ε + ρ d K d
Note that in this relation, G [-] is a geometric factor, ε [-] is a total porosity, ρd [kg∙m−3] is a dry density of compacted bentonite and Dw [m2∙s−1] is a Sr reference diffusivity (for both systems equal to 1.58 × 10⁻⁹ m2·s−1 [47]).
High G values of some cations (that is usually expressed as high values of effective diffusion coefficient De, i.e., De(cat) ≥ De(HTO)), are often reported, mainly those for from alkali or alkali earth metal groups (e.g., [5,6,24,25,26,27,28,34,38,48]) and are often formally explained by the effect of surface diffusion [28,48,49] or the enhanced transport in the electrical double layer (EDL) [5,24,27,32,34], in both approaches, in some cases, without quantification of characteristic parameters.
On the other hand, if we use the values of G equal to 0.23 ± 0.02 for the Ca system and 0.17 ± 0.02 for the Na system, which were obtained from evaluation of independent through-diffusion experiments with HTO and I through two Czech bentonites [50], and evaluate the experiments using a standard Fickian approach, we will arrive at considerably lower values of Kd than those obtained by evaluation of batch experiments (see Table 4). The difference of G values between the two studied systems mentioned above corresponds well to findings of Choi and Oscarsson [10] and other authors [11,12,13], who attributed this effect to higher swelling pressure and lower hydraulic conductivity in Na systems. Lower cation Kd values obtained from the evaluation of diffusion experiments in a compacted state, using relation (8), compared to those obtained in loose state, were reported in many studies (e.g., [18,41,48]), and also included our previous study on the natural bentonite BaM [8]. This effect is usually explained by the lower amount of accessible sorption sites in a compacted material, where the higher ionic strength is assumed.
Both introduced estimations of parameters Kd and G within the frame of standard Fickian description of diffusive transport lead to physically unsubstantiated results, which indicates that applied description of diffusion is not sufficient for the description of Sr diffusive transport through compacted bentonite. The effective diffusion coefficients De(theor) [m2∙s−1], obtained according to G values presented in Table 4, with the use of measured G(HTO) values, presented in Table 4 and using relation (9):
D e theor = ε G D w
of both bentonites is essentially very close, i.e., (1.84 ± 0.25) × 10−10 for Ca-BaM and (1.43 ± 0.27) × 10−10 m2∙s−1 for Na-BaM. On the contrary, if the effective diffusion coefficient De(tot) [m2∙s−1] is calculated based on the experimentally obtained Da and Kd values according to relation (10):
D e tot = D a α = D a ε + ρ d K d
where α [-] is the capacity factor, the diffusion coefficient De(tot) is four times lower for Ca-BaM compared to Na-BaM, i.e., (4.09 ± 0. 26) × 10−10 for Ca-BaM and (15.65 ± 1.58) × 10−10 m2∙s−1 for Na-BaM.
Regarding effective diffusivities often reported upon the interpretation of diffusion experiments results using standard Fickian descriptions, it is necessary to consider higher values of total porosities, effective porosities and/or geometric factors in clays with dominating Ca ions compared to those with dominating Na ions leading to higher values of effective and/or apparent diffusion coefficients of HTO and/or anionic species [10,11,12,38]. However, the De values of cations in Ca- and Na-dominated clays may have the opposite relation, as was found in our work. Melkior et al. [38] reported higher De(Na) value in Na-clay containing higher amounts of gel phase than Ca-clay, which significantly influences the cation transport in compacted clays.
In compliance with the literature resources cited in Section 1, we decided to interpret the obtained diffusion coefficients using the surface diffusion approach. Assuming that the surface bound species is transported through the porous layer according to its own diffusion coefficient Ds [m2∙s−1], as was introduced by Rasmuson and Neretnieks [30] and developed later by other authors [29,49,50,51]:
D e tot = ε G D w + ρ d K d D s
similar values of Ds for both bentonites, i.e., (2.1 ± 0.3) × 10−11 m2∙s−1 for Ca-BaM and (2.4 ± 0.4) × 10−11 m2∙s−1 for Na-BaM were obtained assuming the predictions of Kd, and G and De(tot) values gained from independent experiments.
It could be therefore concluded that, in case the surface bound species is transported in the bentonite layer, the diffusion coefficient of this species is not influenced by the dominating interlayer cation of the bentonite. On the other hand, the diffusion flux through a solid phase, or over its surface, significantly depends on the value of distribution coefficient Kd.
For systems investigated in the presented work, it can be concluded that, despite the apparent diffusivity Da of Sr in Ca- and Na-bentonite differs to a lesser extent than could be predicted from the sorption studies, the effect of surface diffusion can explain the substantial difference of effective diffusion coefficients De(tot). This can be simply explained using relation (10), from which follows a significant influence of the value of Kd on the value of De. Based on relation (11), also valid in determining the value of the effective diffusion coefficient De, it followed for the studied systems that for Na system, the fraction of flux in the pores was less important ( ε G D w D e tot = 0.09 ) than for Ca system ( ε G D w D e tot = 0.45 ). Thus, in both studied systems, the diffusion flux, which corresponds to surface diffusion, was found to be more significant than the flux corresponding to diffusion in pores. The main advantage of application of the idea of surface diffusion into the description of diffusion experiments with planar source can be seen in respecting the results of independently obtained experimental knowledge about the characteristics of bentonite and studied cationic species (G, Kd) and in the possibility to make relevant conclusions about the value of effective diffusion coefficient De, which is not attainable by the standard evaluation of such type of diffusion experiments based on the simple Fickian approach.

5. Conclusions

Diffusion experiments with Sr on the homoionous Ca- and Na-form of the Czech natural Mg/Ca bentonite BaM using the planar source method were performed. Two methods of apparent diffusion coefficient Da determination based on the analytical solution of diffusion equation for given boundary conditions in a linear form were introduced and both were found suitable and comparable because both provided similar values of Da and their uncertainty estimates.
The mean Da value obtained for Ca-BaM was (3.6 ± 0.2) × 10−11 m2·s−1 and for Na-BaM it was (2.6 ± 0.2) × 10−11 m2·s−1. Obtained apparent diffusion coefficients laid within the range of usually reported values.
Values of Kd were determined in independent batch sorption experiments. The obtained values were (9.4 ± 0.4) × 10−3 m3·kg−1 on Ca-BaM in CaCl2, and (47.4 ± 1.6) × 10−3 m3·kg−1 on Na-BaM in NaCl background electrolytes, respectively, with only a small dependence of the solid-to-liquid ratio, and they were extrapolated for the conditions of compacted bentonite. In spite of this treatment, their use for determination of De from planar source diffusion experiments proved to be inappropriate within the standard Fickian description of diffusion because it was shown that Kd values estimated on the basis of geometric factor G obtained from HTO diffusion experiments were considerably lower. The discrepancies between Kd and G values measured in independent experiments and those resulting from diffusion experiments were explained using the phenomenon of surface diffusion.
The method of evaluation of diffusion experiments with planar source taking into account the effect of surface diffusion was introduced. The obtained values of surface diffusion coefficients Ds were similar, but the subsequently predicted value of effective diffusion coefficient describing Sr transport in the Na-BaM system was found four times higher than that in the Ca-BaM system, corresponding to the higher Kd value determined for this system.

Author Contributions

Conceptualization, D.V.; data curation, L.B.; formal analysis, L.B.; funding acquisition, D.V.; investigation, L.B. and E.V.; methodology, D.V.; project administration, D.V.; resources, E.V. and D.V.; software, L.B. and D.V.; supervision, D.V.; validation, L.B.; visualization, L.B.; writing—original draft, L.B., E.V. and D.V.; writing—review and editing, L.B., E.V. and D.V. All authors have read and agreed to the published version of the manuscript.

Funding

This work is partially a result of Radioactive Waste Repository Authority of the Czech Republic project “Research Support for Safety Evaluation of Deep Geological Repository”, partially a result of European Regional Development Fund-Project “Centre for Advanced Applied Science” (Grant No. CZ.02.1.01/0.0/0.0/16_019/0000778) and partially a result of grant No. SGS16/250/OHK4/3T/14 provided by the Grant Agency of the Czech Technical University in Prague.

Institutional Review Board Statement

Not applicable.

Informed Consent Statement

Not applicable.

Data Availability Statement

The data presented in this study is available in the current manuscript, and raw data is available on request from the corresponding author.

Conflicts of Interest

The authors declare no conflict of interest. The funders had no role in the design of the study; in the collection, analyses, or interpretation of data; in the writing of the manuscript, or in the decision to publish the results.

References

  1. Galamboš, M.; Suchánek, P.; Rosskopfová, O. Sorption of anthropogenic radionuclides on natural and synthetic inorganic sorbents. J. Radioanal. Nucl. Chem. 2012, 293, 613–633. [Google Scholar] [CrossRef]
  2. Gautschi, A.; Gaus, I.; Gimmi, T.; Mazurek, M.; Wersin, P.; Cathelineau, M.; Bath, A. Applied geochemistry special issue on “Geochemistry of clays and clay rocks in the context of radioactive waste disposal”. Appl. Geochem. 2019, 105, 127–129. [Google Scholar] [CrossRef]
  3. Bestel, M.; Glaus, M.A.; Frick, S.; Gimmi, T.; Juranyi, F.; Van Loon, L.R.; Diamond, L.W. Combined tracer through-diffusion of HTO and 22Na through Na-montmorillonite with different bulk dry densities. Appl. Geochem. 2018, 93, 158–166. [Google Scholar] [CrossRef]
  4. Glaus, M.A.; Aertsens, M.; Appelo, C.; Kupcik, T.; Maes, N.; Van Laer, L.; Van Loon, L. Cation diffusion in the electrical double layer enhances the mass transfer rates for Sr2+, Co2+ and Zn2+ in compacted illite. Geochim. Cosmochim. Acta 2015, 165, 376–388. [Google Scholar] [CrossRef]
  5. Glaus, M.A.; Baeyens, B.; Bradbury, M.H.; Jakob, A.; Van Loon, L.R.; Yaroshchuk, A. Diffusion of 22Na and 85Sr in montmorillonite: Evidence of interlayer diffusion being the dominant pathway at high compaction. Environ. Sci. Technol. 2007, 41, 478–485. [Google Scholar] [CrossRef]
  6. Samper, J.; Dai, Z.; Molinero, J.; García-Gutiérrez, M.; Missana, T.; Mingarro, M. Inverse modeling of tracer experiments in FEBEX compacted Ca-bentonite. Phys. Chem. Earth Parts A B C 2006, 31, 640–648. [Google Scholar] [CrossRef]
  7. Crank, J. The Mathematics of Diffusion, 2nd ed.; Clarendon Press: Oxford, UK, 1975. [Google Scholar]
  8. Baborová, L.; Vopálka, D.; Vetešník, A.; Hofmanová, E. Migration behaviour of Strontium in Czech Bentonite Clay. J. Sustain. Dev. Energy Water Environ. Syst. 2016, 4, 293–306. [Google Scholar] [CrossRef]
  9. Baborová, L.; Vopálka, D.; Červinka, R. Sorption of Sr and Cs onto Czech natural bentonite: Experiments and modelling. J. Radioanal. Nucl. Chem. 2018, 318, 2257–2262. [Google Scholar] [CrossRef]
  10. Choi, J.-W.; Oscarson, D. Diffusive transport through compacted Na- and Ca-bentonite. J. Contam. Hydrol. 1996, 22, 189–202. [Google Scholar] [CrossRef]
  11. González Sánchez, F.; Van Loon, L.R.; Gimmi, T.; Jakob, A.; Glaus, M.A.; Diamond, L.W. Self-diffusion of water and its dependence on temperature and ionic strength in highly compacted montmorillonite, illite and kaolinite. Appl. Geochem. 2008, 23, 3840–3851. [Google Scholar] [CrossRef]
  12. Kozaki, T.; Sawaguchi, T.; Fujishima, A.; Sato, S. Effect of exchangeable cations on apparent diffusion of Ca2+ ions in Na- and Ca-montmorillonite mixtures. Phys. Chem. Earth Parts A/B/C 2010, 35, 254–258. [Google Scholar] [CrossRef] [Green Version]
  13. Montes, H.G.; Duplay, J.; Martinez, L.; Geraud, Y.; Rousset-Tournier, B. Influence of interlayer cations on the water sorption and swelling-shrinkage of MX80 bentonite. Appl. Clay Sci. 2003, 23, 309–321. [Google Scholar] [CrossRef]
  14. Pusch, R. Mechanical Properties of Clays and Clay Minerals. In Handbook of Clay Science; Bergaya, F., Theng, B.K.G., Lagaly, G., Eds.; Elsevier: Amsterdam, The Netherlands, 2006; pp. 247–260. [Google Scholar]
  15. Yu, J.; Neretnieks, I. Diffusion and Sorption Properties of Radionuclides in Compacted Bentonite; SKB-TR-97-12; International Atomic Energy Agency (IAEA): Vienna, Austria, 1997; 104p. [Google Scholar]
  16. Aldaba, D.; Garcia-Gutierrez, M.; Rigol, A.; Vidal, M. Comparison of laboratory methodologies for evaluating radiostrontium diffusion in soils: Planar-source versus half-cell methods. Sci. Total Environ. 2010, 408, 5966–5971. [Google Scholar] [CrossRef]
  17. Galamboš, M.; Krajňák, A.; Rosskopfová, O.; Viglašová, E.; Adamcová, R.; Rajec, P. Adsorption equilibrium and kinetic studies of strontium on Mg-bentonite, Fe-bentonite and illite/smectite. J. Radioanal. Nucl. Chem. 2013, 298, 1031–1040. [Google Scholar] [CrossRef]
  18. Van Loon, L.; Baeyens, B.; Bradbury, M. Diffusion and retention of sodium and strontium in Opalinus clay: Comparison of sorption data from diffusion and batch sorption measurements, and geochemical calculations. Appl. Geochem. 2005, 20, 2351–2363. [Google Scholar] [CrossRef]
  19. Missana, T.; García-Gutiérrez, M. Adsorption of bivalent ions (Ca(II), Sr(II) and Co(II)) onto FEBEX bentonite. Phys. Chem. Earth 2007, 32, 559–567. [Google Scholar] [CrossRef]
  20. Shannon, R.D. Revised effective ionic radii and systematic studies of interatomic distances in halides and chalcogenides. Acta Crystallogr. 1976, 32, 751–767. [Google Scholar] [CrossRef]
  21. Galamboš, M.; Kufčáková, J.; Rajec, P. Sorption of strontium on Slovak bentonites. J. Radioanal. Nucl. Chem. 2009, 281, 347–357. [Google Scholar] [CrossRef]
  22. Khan, S.A.; Khan, M.A. Sorption of strontium on bentonite. Waste Manag. 1996, 15, 641–650. [Google Scholar] [CrossRef]
  23. Karnland, O.; Birgersson, M.; Hedström, M. Selectivity coefficient for Ca/Na ion exchange in highly compacted bentonite. Phys. Chem. Earth Parts A B C 2011, 36, 1554–1558. [Google Scholar] [CrossRef]
  24. Altmann, S.; Tournassat, C.; Goutelard, F.; Parneix, J.-C.; Gimmi, T.; Maes, N. Diffusion-driven transport in clayrock formations. Appl. Geochem. 2012, 27, 463–478. [Google Scholar] [CrossRef]
  25. García-Gutiérrez, M.; Missana, T.; Mingarro, M.; Samper, J.; Dai, Z.; Molinero, J. Solute transport properties of compacted Ca-bentonite used in FEBEX project. J. Contam. Hydrol. 2001, 47, 127–137. [Google Scholar] [CrossRef]
  26. Garcia-Gutierrez, M.; Cormenzana, J.; Missana, T.; Mingarro, M.; Alonso, U.; Samper, J.; Yang, Q.; Yi, S. Diffusion experiments in Callovo-Oxfordian clay from the Meuse/Haute-Marne URL, France. Experimental setup and data analyses. Phys. Chem. Earth Parts A B C 2008, 33, S125–S130. [Google Scholar] [CrossRef]
  27. Glaus, M.; Aertsens, M.; Maes, N.; Van Laer, L.; Van Loon, L. Treatment of boundary conditions in through-diffusion: A case study of 85Sr2+ diffusion in compacted illite. J. Contam. Hydrol. 2015, 177–178, 239–248. [Google Scholar] [CrossRef]
  28. Savoye, S.; Beaucaire, C.; Grenut, B.; Fayette, A. Impact of the solution ionic strength on strontium diffusion through the Callovo-Oxfordian clayrocks: An experimental and modeling study. Appl. Geochem. 2015, 61, 41–52. [Google Scholar] [CrossRef]
  29. Eriksen, T.E.; Jansson, M.; Molera, M. Sorption effects on cation diffusion in compacted bentonite. Eng. Geol. 1999, 54, 231–236. [Google Scholar] [CrossRef]
  30. Rasmuson, A.; Neretnieks, I. Surface Migration in Sorption Processes; SKBF-KBS-TR-83-37; International Atomic Energy Agency (IAEA): Vienna, Austria, 1983; 54p. [Google Scholar]
  31. Bourg, I.C.; Sposito, G.; Bourg, A.C. Modeling the diffusion of Na+ in compacted water-saturated Na-bentonite as a function of pore water ionic strength. Appl. Geochem. 2008, 23, 3635–3641. [Google Scholar] [CrossRef] [Green Version]
  32. Kim, H.-T.; Suk, T.-W.; Park, S.-H.; Lee, C.-S. Diffusivities for ions through compacted Na-bentonite with varying dry bulk density. Waste Manag. 1993, 13, 303–308. [Google Scholar] [CrossRef]
  33. Parkhurst, D.L.; Appelo, C.A.J. User’s Guide To PHREEQC (version 2)—A Computer Program for Speciation, and Inverse Geochemical Calculations. Water Resour. Investig. Rep. 1999, 99, 326. [Google Scholar]
  34. Tachi, Y.; Yotsuji, K. Diffusion and sorption of Cs+, Na+, I and HTO in compacted sodium montmorillonite as a function of porewater salinity: Integrated sorption and diffusion model. Geochim. Cosmochim. Acta 2009, 132, 75–93. [Google Scholar] [CrossRef]
  35. Ochs, M.; Lothenbach, B.; Wanner, H.; Sato, H.; Yui, M. An integrated sorption-diffusion model for the calculation of consistent distribution and diffusion coefficients in compacted bentonite. J. Contam. Hydrol. 2001, 47, 283–296. [Google Scholar] [CrossRef]
  36. Ochs, M.; Lothenbach, B.; Shibata, M.; Yui, M. Thermodynamic modeling and sensitivity analysis of porewater chemistry in compacted bentonite. Phys. Chem. Earth Parts A B C 2004, 29, 129–136. [Google Scholar] [CrossRef]
  37. Bourg, I.C.; Tournassat, C. Self-Diffusion of Water and Ions in Clay Barriers. Dev. Clay Sci. 2015, 6, 189–226. [Google Scholar]
  38. Melkior, T.; Gaucher, E.; Brouard, C.; Yahiaoui, S.; Thoby, D.; Clinard, C.; Ferrage, E.; Guyonnet, D.; Tournassat, C.; Coelho, D. Na+ and HTO diffusion in compacted bentonite: Effect of surface chemistry and related texture. J. Hydrol. 2009, 370, 9–20. [Google Scholar] [CrossRef]
  39. Červinka, R.; Vopálka, D.; Adam, R.; Baborová, L.; Brázda, L.; Drtinová, B.; Hofmanová, E.; Kittnerová, J.; Reimitz, D.; Štamberg, K.; et al. Transport of radionuclides from the repository/Input parametres and process models for evaluation of radionuclide transport through engineered barriers (in Czech). SÚRAO Tech. Rep. 2015, 24, 176. [Google Scholar]
  40. Gondolli, J.; Večerník, P. The uncertainties associated with the application of through-diffusion, the steady-state method: A case study of strontium diffusion. In Clays in Natural and Engineered Barriers for Radioactive Waste Confinement; Geological Society of London: London, UK, 2014; pp. 603–612. [Google Scholar] [CrossRef]
  41. Garcia-Gutierrez, M.; Cormenzana, J.; Missana, T.; Alonso, U.; Mingarro, M. Diffusion of strongly sorbing cations (60Co and 152Eu) in compacted FEBEX bentonite. Phys. Chem. Earth Parts A B C 2011, 36, 1708–1713. [Google Scholar] [CrossRef]
  42. García-Gutiérrez, M.; Cormenzana, J.L.; Missana, T.; Mingarro, M.; Molinero, J. Overview of laboratory methods employed for obtaining diffusion coefficients in FEBEX compacted bentonite. J. Iber. Geol. 2006, 32, 37–53. [Google Scholar]
  43. Golder Associates. GoldSim Contaminant Transport Module, Manual; Version 1.30; GoldSim Technology Group: Redmond, WA, USA, 2002; p. 285. [Google Scholar]
  44. Kasar, S.; Kumar, S.; Bajpai, R.; Tomar, B. Diffusion of Na(I), Cs(I), Sr(II) and Eu(III) in smectite rich natural clay. J. Environ. Radioact. 2016, 151, 218–223. [Google Scholar] [CrossRef]
  45. Glaus, M.A.; Frick, S.; Van Loon, L.R. Diffusion of Selected Cations and Anions in Compacted Montmorillonite and Bentonite; Technical Report 17-12; Paul Scherrer Institute: Villigen, Switzerland, 2017; 85p. [Google Scholar]
  46. Shackelford, C.D.; Moore, S.M. Fickian diffusion of radionuclides for engineered containment barriers: Diffusion coefficients, porosities, and complicating issues. Eng. Geol. 2013, 152, 133–147. [Google Scholar] [CrossRef]
  47. Lide, D.R. CRC Handbook of Chemistry and Physics; CRC Press: Boca Raton, FL, USA, 2005. [Google Scholar]
  48. Lee, J.O.; Cho, W.J.; Hahn, P.S.; Lee, K.J. Effect of dry density on Sr-90 diffusion in a compacted Ca-bentonite for a backfill of radioactive waste repository. Ann. Nucl. Energy 1996, 23, 727–738. [Google Scholar] [CrossRef]
  49. Eriksen, T.E.; Jansson, M. Diffusion of I, Cs+ and Sr2+ in Compacted Bentonite—Anion Exclusion and Surface Diffusion; SKB TR 96-16; Swedish Nuclear Fuel and Waste Management Co: Stockholm Sweden, 1996. [Google Scholar]
  50. Bourg, I.; Bourg, A.C.; Sposito, G. Modeling diffusion and adsorption in compacted bentonite: A critical review. J. Contam. Hydrol. 2003, 61, 293–302. [Google Scholar] [CrossRef]
  51. Gimmi, T.; Kosakowski, G. How mobile are sorbed cations in clays and clay rocks? Environ. Sci. Technol. 2011, 45, 1443–1449. [Google Scholar] [CrossRef] [PubMed]
Figure 1. Scheme of a diffusion cell.
Water 13 01520 g001
Figure 2. Schematic representation of symmetrical setup (left) and asymmetrical setup (right) of planar source diffusion experiment. PS—planar source, B—bentonite.
Water 13 01520 g002
Figure 3. Comparison of the analytical model of tracer total concentration profiles in the infinite porous layer compared with the numerical model in the layer of restricted length (L = 0.01 m) in regular (left) and transformed (right) scales. Da = 2 × 10⁻¹¹ m2∙s−1, ρd = 1400 kg∙m−3, C0 = 1 × 10³ mol∙m−3, V0 = 7.5 × 10⁻⁸ m3, d = 0.03 m.
Water 13 01520 g003
Figure 4. Sorption isotherms of Sr on the bentonite Ca-BaM in CaCl2 background electrolyte (left) and on the bentonite Na-BaM in NaCl background electrolyte (right).
Water 13 01520 g004
Figure 5. Profiles of Sr total concentration in the compacted Ca- and Na-bentonite after 1, 3 and 5 days of contact shown as dependences of Ctot on x (left) and ln Ctot on x2/t (right). C0(Sr) was 10 mol·m−3, V0 was 7.5 × 10⁻⁸ m3. AS refers to the analytical solution of diffusion equation fitted to the experimental data using the ‘slope’ method, fitted apparent diffusion coefficients are summarized in Table 4.
Water 13 01520 g005
Table 1. Obtained Kd values from batch sorption experiments with Sr on loose Ca- and Na-bentonite.
Materialm/V
[kg∙m−3]
Kd × 103
[m3·kg−1]
Ca-BaM109.80 ± 0.07
509.29 ± 0.04
1008.97 ± 0.07
Na-BaM1049.5 ± 0.9
5046.1 ± 0.6
10046.7 ± 0.4
Table 2. Extrapolation of Kd value from batch sorption experiments for the conditions corresponding to bentonite dry density ρd = 1400 kg∙m−3 (m/V = 2800 kg∙m−3) according to Equation (7).
MaterialknKd × 103
[m3·kg−1]
Ca-BaM0.01070.0387.95 ± 0.30
Na-BaM0.05250.02842.0 ± 1.6
Table 3. Obtained values of apparent diffusion coefficients from planar source diffusion experiments of Sr on compacted Ca- and Na-bentonite.
MaterialDuration
[days]
ρd
[kg·m−3]
ε
[-]
Da × 1011
(Slope)
[m2·s−1]
Da × 1011
(Intercept)
[m2·s−1]
Ca-BaM113920.513.29 ± 0.013.51 ± 0.03
313560.513.95 ± 0.053.64 ± 0.03
513670.523.47 ± 0.113.66 ± 0.07
Na-BaM114200.492.75 ± 0.032.91 ± 0.10
314110.562.61 ± 0.202.47 ± 0.27
513870.502.61 ± 0.042.42 ± 0.02
Table 4. Mean experimental and calculated values of Sr diffusion parameters.
MaterialMeasuredCalculated According to Equation (8)
ρd
[kg·m−3]
ε
[-]
Da × 1011
[m2·s−1]
(Slope)
G
[-]
Kd × 103
[m3·kg−1]
Ca-BaM1372 ± 150.51 ± 0.013.6 ± 0.20.50 ± 0.03
valid for Kd = 7.9∙10−3 m3·kg−1
3.4 ± 0.3
valid for G = 0.23
Na-BaM1406 ± 140.51 ± 0.032.6 ± 0.21.91 ± 0.10
valid for Kd = 42∙10−3 m3·kg−1
3.5 ± 0.3
valid for G = 0.17
Publisher’s Note: MDPI stays neutral with regard to jurisdictional claims in published maps and institutional affiliations.

