Article

Identifying Microbial Distribution Drivers of Archaeal Community in Sediments from a Black-Odorous Urban River—A Case Study of the Zhang River Basin

1
Chengdu Engineering Corporation Limited, Power China, Chengdu 610072, China
2
Urban Water Environment Treatment Engineering Technology Research Center of Sichuan Province, Chengdu 610072, China
3
College of Environment, Hohai University, Nanjing 210098, China
4
School of Environment, Nanjing Normal University, Nanjing 210023, China
*
Authors to whom correspondence should be addressed.
Water 2021, 13(11), 1545; https://doi.org/10.3390/w13111545
Submission received: 13 May 2021 / Revised: 28 May 2021 / Accepted: 28 May 2021 / Published: 31 May 2021

Abstract

:
Rapid urbanization has destroyed urban water systems and led to blackened and odorous rivers. The heavily polluted rivers are always facing eutrophication and heavy metal pollution, while the combined effects of these environmental factors on the microbial diversity and distribution of the river microbial communities have not been adequately reported, especially the archaeal communities. In this study, we investigated the community structure and microbial distribution of sediment archaeal communities from an urban blackened and odorous river basin of the Zhang river, in Nanling, China. Results showed that the archaeal community from the eight sediment sites have average values of Shannon and Chao1 at 3.4921 and 232.7202, respectively. The community diversity and richness were different among samples. Halobacterota and Euryarchaeota were the most abundant phylum and Crenarchaeota also took up a considerable amount of the archaeal community. To reveal the main environmental drivers of the distribution of archaeal communities in sediment, the environmental physicochemical factors (total nitrogen, total phosphorus, oxidation/reduction potential, nitrate nitrogen, ammonia nitrogen, pH and total organic carbon) and heavy metals (Cr, Ni, Cu, Zn, As, Cd, Pb and Hg) in sediment were determined. A redundancy analysis (RDA) revealed that Eh was the most prominent influencing factor, and As was the most influential heavy metal on the microbial distribution of archaeal communities. Furthermore, a variance partitioning analysis (VPA) was used to identify the impacts of physicochemical factors and heavy metals on the archaeal community distribution. Results showed that heavy metals have higher effects on archaeal community distribution than physicochemical factors. The present study suggested that the heavy metal pollution should be paid more attention in the microbial distribution in heavily polluted urban rivers, and also should be taken into consideration for improving the efficacies of ecological evaluation and remediation.

1. Introduction

Urban rivers and lakes play an important role in the natural biochemical cycle, water utilization and disposal [1]. However, rapid industrialization and urbanization have led to the destruction of urban water environments, especially in developing countries. The serious pollution of eutrophication and heavy metals can easily turn rivers and lakes black and smelly, and the blackening and odorization of water environments would affect the living conditions of local residents and the functioning of ecosystems and urban landscapes [2], which have become a striking problem concerning China’s water environment [3]. In China, blackening and odorization of water has become a common phenomenon in recent decades and is widespread in most cities [2]. Therefore, it is very important to study the characteristics of blackened and odorous water body and understand their impacts on the aquatic environment and habitants.
Sediment is common in aquatic environments and plays an important role in the water environment, which is heavily influenced by the water quality. The sediment in urban rivers and lakes is a complex habitat and densely colonized by diverse groups of microorganisms [4]. It is also presented that sediment could be a rich source of high microbial diversity [5]. The microbial community is very sensitive to environment alteration and highly related to water quality [6]. Thus, the composition and structure of the microbial community have been widely applied to indicate the status of pollution or eutrophication in water and sediments. [7,8,9]. In addition, the microorganisms are responsible for the purification of the water body and maintaining nutrients’ concentration at a stable level through the conversion and circulation of carbon, nitrogen and phosphorus. For example, nitrogen usually exists in forms of ammonium and nitrite/nitrate (urea, ammonium nitrate, ammonium bicarbonate, etc.), and is usually considered as a key factor in eutrophication. Microorganisms could consume the bioavailable nitrogen through the biochemical process, including nitrification/denitrification, and clean the water [10,11,12].
In the blackened water environment, the complex pollutants could alter river structure and the biological community [13]. In the past, studies were mainly focusing on bacterial community composition, diversity, function and their correlation with environmental factors including total organic carbon (TOC), total nitrogen (TN), total phosphorus (TP), CODMn (for freshwater or surface water), COD (for wastewater), BOD5, dissolved oxygen (DO), oxygen reduction potential (ORP), pH, etc. Wu et al. [14] investigated the Jinchuan River and the results of metabolism and xenobiotic biodegradation of the bacterial community showed a significant decrease with a clear different composition caused by the water blackening and pollution aggravation. Liu et al. [15] discovered that sediment had higher microbial diversity and richness than that in the water of the Pearl River Delta. Li et al. [16] found that in the Beihu Gulf, the bacterial microbial composition and diversity varied according to the eutrophication gradient. The gradient was determined by the eutrophication index represented by total inorganic nitrogen (TIN), total inorganic phosphorus (TIP) and CODMn [17]. Wang et al. [1] proved that ORP and heavy metals (Cu and Zn) were the most influential factors to the bacterial community in combined pollutions of eutrophication and heavy metals. Cao et al. [18] also confirmed that ORP along with TN, TP and TOC were important factors impacting the structuring of the bacterial community. Zhang et al. [19] suggested that ammonia nitrogen and ORP were prominent drivers in the vertical and horizontal bacterial community, respectively. Lei et al. [20] also suggested that species replacement and viable selection were the main ecological processes contributing to the archaeal community, and ORP was also the main contributor to the sediment archaeal community horizontal assemblage. However, archaeal community composition and diversity are rarely investigated in current studies. This probably results from two sides: (1) archaea communities are mainly considered to be living in extreme environmental conditions (e.g., deep-water, high salinity water, extreme temperatures, etc.); and (2) archaea communities are only found to be effective regarding the nitrogen cycle, especially the aerobic ammonia oxidation process catalyzed by ammonia-oxidizing archaea (AOA). Therefore, research into archaea concerning eutrophicated urban rivers and lakes was mostly about AOA’s abundance and diversity [11,12,21]. In addition, methanogenic archaea contribute greatly to the production and emission of methane, a powerful greenhouse gas, and have also been widely studied [22,23,24]. Archaeal communities have a vital impact on both nitrogen and carbon circulation, two fundamental metabolic elements. Although archaeal communities take up limited amounts of sedimental microflora compared to bacteria and fungus, it is clear that the archaeal community has its unique impact on the river environment [12]. However, our knowledge into the overall composition, diversity, variation of the archaeal community and its correlation with environmental factors is still lacking.
Heavy metal contamination is ubiquitous in natural environments and could exhibit adverse impacts on microorganisms and disturb biogeochemical processes [21]. The heavy metals discharged into the water environment are usually converted to a solid phase and combined with sediments. Thus, most heavy metals are enriched in sediments [25]. The distribution of heavy metals in water and sediment in urban rivers has been well studied and the responses of microbial communities to heavy metal contamination were also well reported [26,27,28]. As the most sensitive organisms, microbial communities in sediment might exhibit different community structures and microbial distribution in response to heavy metals.
The aim of this study was to investigate the microbial distribution of sediment archaeal communities from an urban blackened and odorous river in Nanling, China. Eight representative sampling sites were selected. The physicochemical parameters, heavy metal concentration and archaeal community composition and diversity in these sediment samples were analyzed. Multiple analytical methods were applied to determine the microbial community variation and difference from different sampling points. In addition, to reveal the main environmental drivers of the archaeal communities in sediment, the environmental factors were divided into two groups regarding their characteristics: (1) physicochemical factors, including TN (total nitrogen), NO3-N/NO2-N, NH4+-N, TP (total phosphorus), ORP, pH and TOC (total organic carbon); (2) heavy metals, including Cr (chromium), Ni (nickel), Cu (copper), Zn (zinc), As (arsenic), Cd (cadmium), Pb (palladium) and Hg (mercury). A variance partitioning analysis (VPA) was used to identify and compare these two factor clusters’ impacts on the microbial distribution of sediment archaeal communities. The results of this study could provide empirical data for further study into the archaeal community in urban water systems, due to the current lack of attention of this field.

2. Materials and Methods

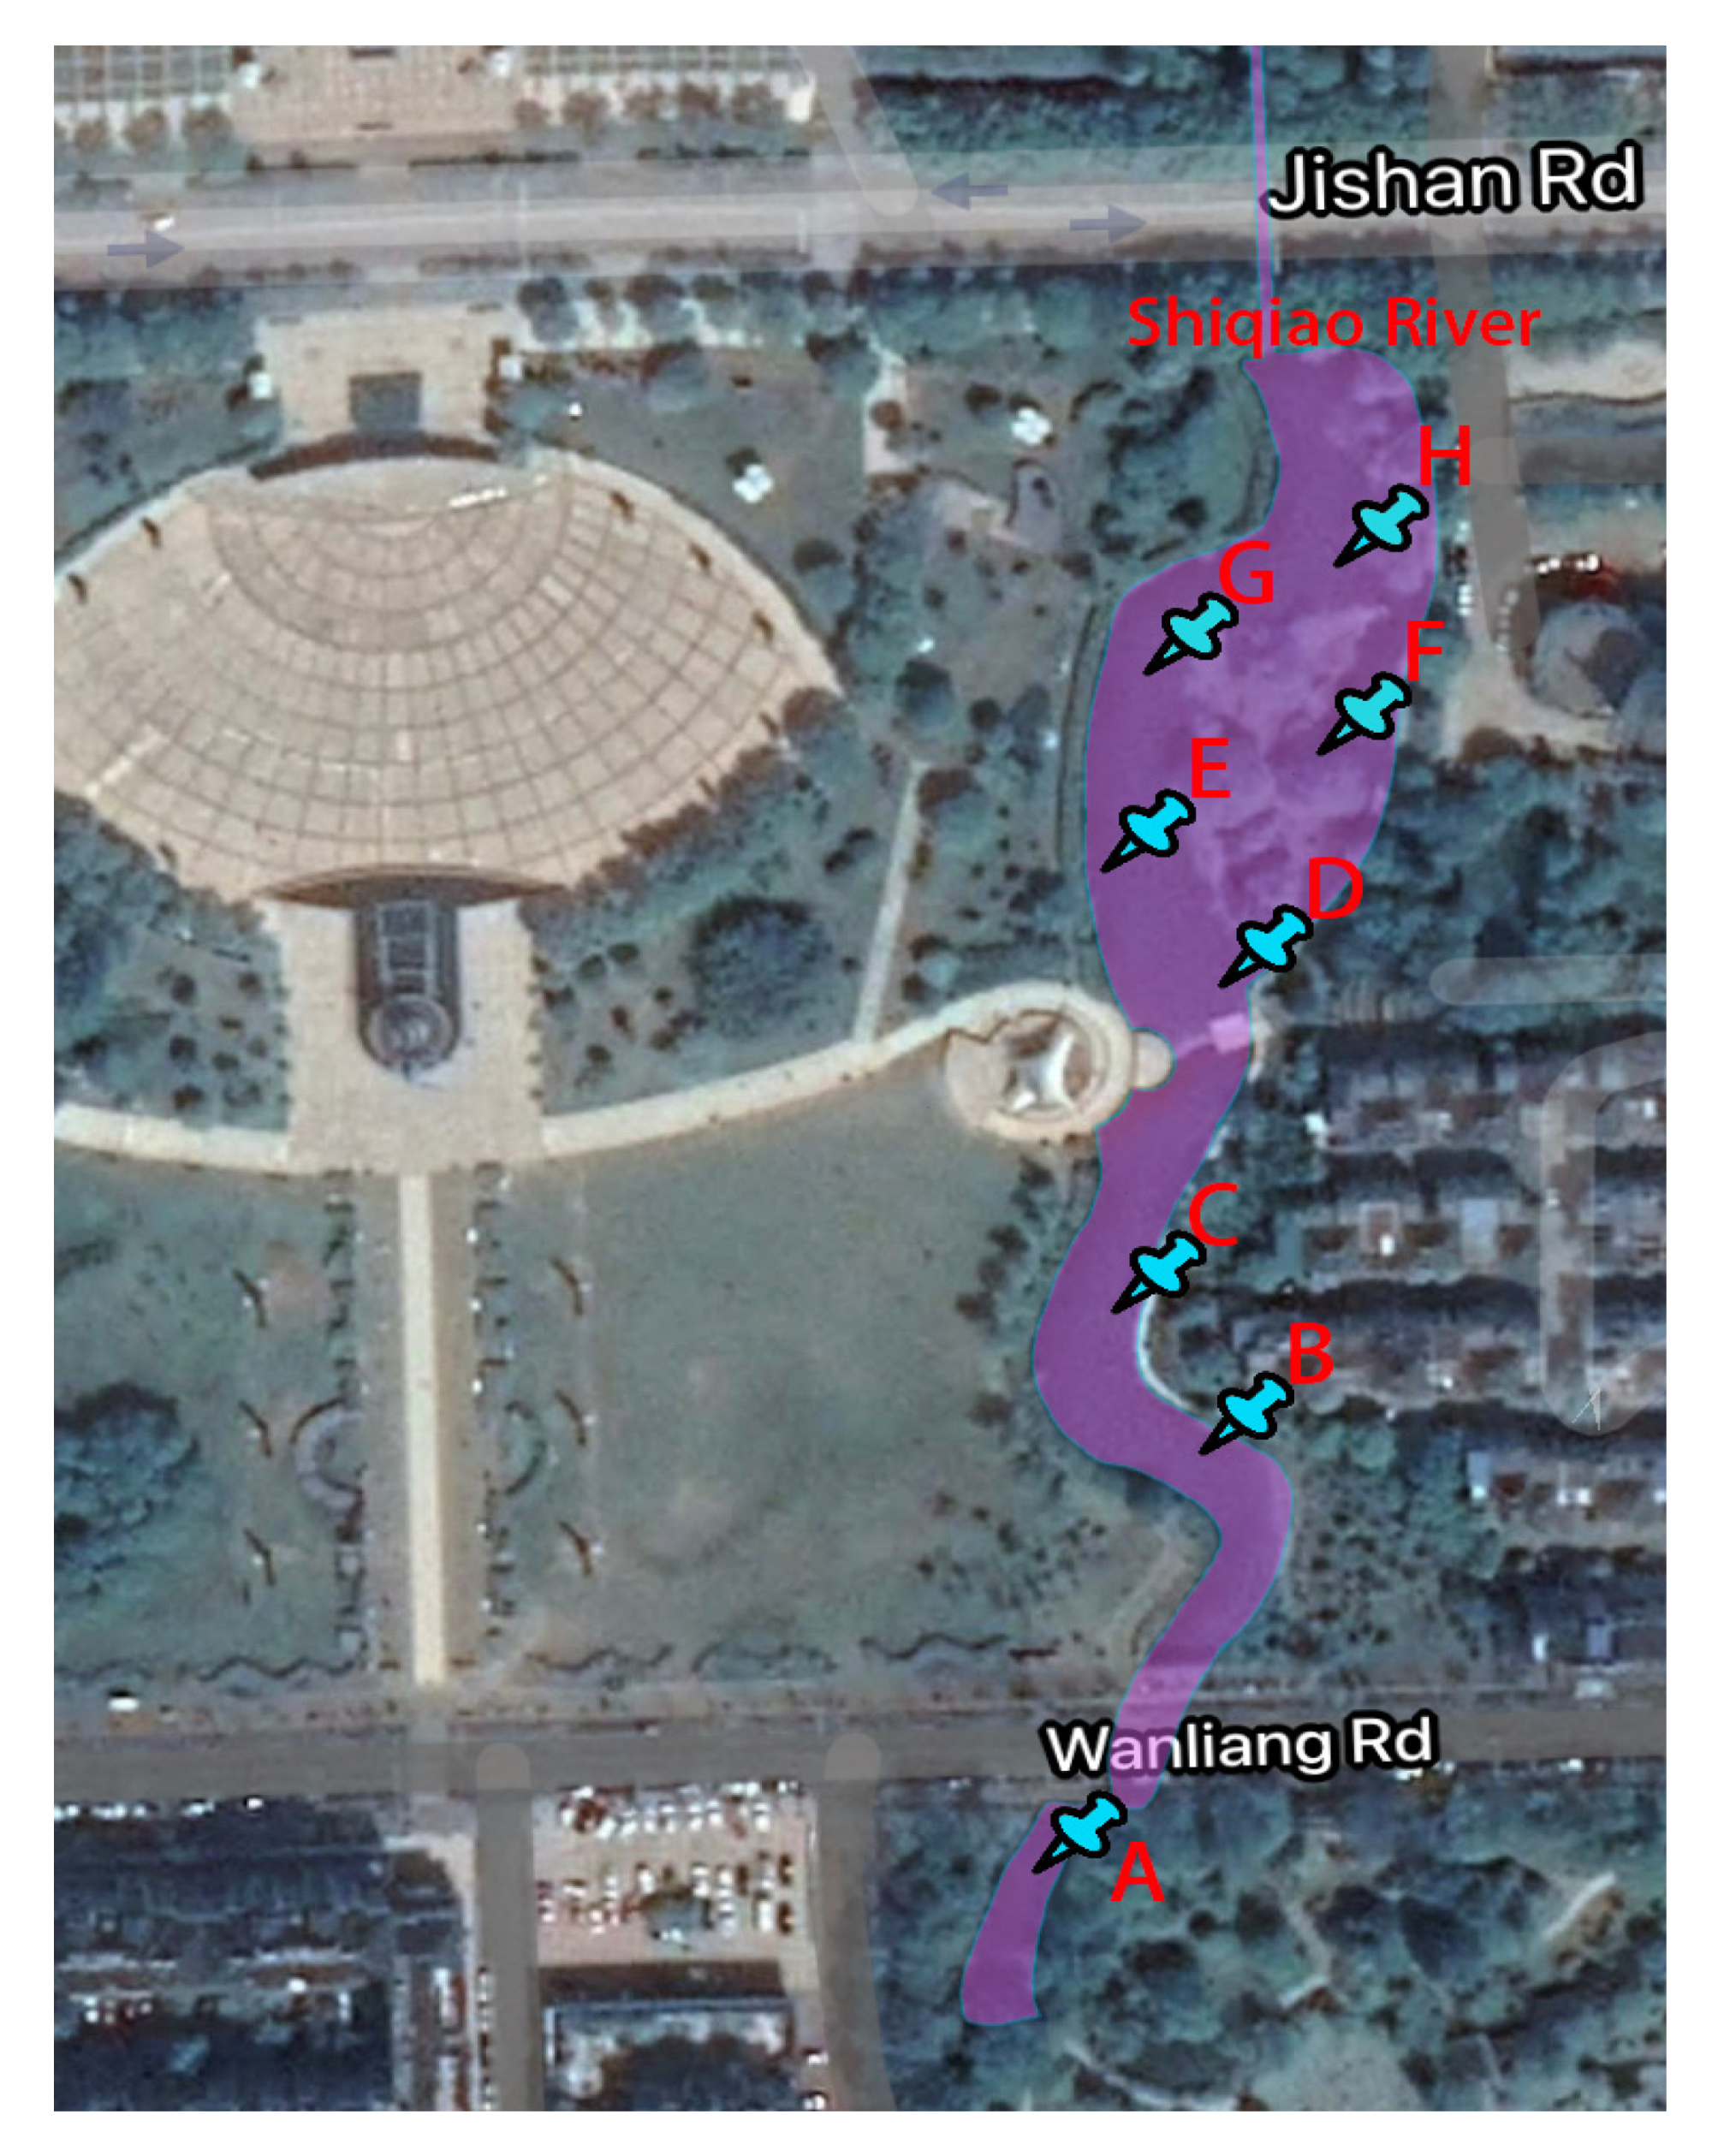
2.1. Study Sites and Sampling Methods

The study was performed on the Shiqiao River (Figure 1), located in Nanling county, Anhui province, China, which belongs to the drainage basin of the Zhang River. The Zhang River is under the control of the northern subtropical monsoon climate with an annual average precipitation at 1312.7 mm and a rapid inter-/within a year variation. Heavy rainfall during April, May, June and August causes severe floods. The water supply of this region’s run-offs is mainly from rainfall which is altered according to the climate. The Zhang River is the prominent water in Nanling country that runs through the county and contributes greatly to the shipping and irrigation activity. The Shiqiao River is a level-1 tributary river (which directly imports into the main stream) to the Zhang River, whose primary run-off extent is 8.18 km with a 10.1 km2 catchment area. It has been heavily polluted for many years due to multiple sewage and wastewater inflow and is classified as inferior than V according to the Chinese Environmental Quality Standards for Surface Water (GB-3838-2002).
The sample points chosen represented important river segments in this area. Site B, C and E were sewage outfalls. Site D was the fork of the river. Site F and G represented the two branches of the river, respectively. Site H represented the intersection of the two branches. The direction of flow was from site A to site H.
The samples of this study were collected from the surface sediment (0–10 cm) using a Peterson grab sampler. There were eight sampling points along the Shiqiao River. All the samples were obtained by mixing three randomly collected sediments at each sampling site then divided into three parallel samples, respectively. A total of 24 sediment samples were collected under an aseptic sealing condition, stored in a container filled with ice and transported to the laboratory within 1 h. The samples were divided into two sub-groups: sub-group 1 was treated and processed immediately for physicochemical parameter analysis; sub-group 2 was frozen and stored in sterile polypropylene tubes at −80 °C for DNA extraction and the molecular biological analysis.

2.2. Physicochemical Parameter and Heavy Metal Analysis

The sediment pH was determined by a pH meter (solid to water ratio was 1:2.5). The redox potential (ORP) was determined using a potable ORP meter (CT-8022, Kedida, China) [1]. Sediment total nitrogen (TN) was determined by the continuous-flow automated analyzer (San++, Skalar, The Netherlands) after digestion with H2SO4-H2O2 [29]. Sediment total phosphorus (TP) was determined using the Murphy–Riley method followed by H2SO4-HClO4 digestion [30]. Sediment ammonia nitrogen (NH4+-N) and nitrate nitrogen (NO3-N) was also determined using a continuous-flow automated analyzer after extracting field-moist sediment with 2 M KCl (solid to water ratio was 1:5). The thermodilution method was applied to the analysis of sediment total organic carbon (TOC) using H2SO4 and K2Cr2O7 [30].
For the examination of heavy metals, the samples were first air-dried for 24 h to a constant weight and then oven dried at 105 °C for 30 min, after which they were placed in a mortar and ground to powder. Then, the powder was digested using HNO3 (1.42 g/mL)-HCl (1.19 g/mL)-HF (1.16 g/mL) acid mixture (HNO3:HCl:HF = 6:3:2 or HNO3:HCl = 2:6) with a microwave digestion apparatus. The digest was examined for heavy metals using an Atomic Absorption Spectrophotometer (Shimadzu, Japan). All treatments were performed in triplicate and the data were presented as the mean ± standard deviation.

2.3. DNA Extraction and Sequence Analysis

Total DNA was extracted from 1 g of each sediment sample using a portable DNA tissue kit (Omega Bio-tek, Norcross, GA, USA) according to the manufacturer’s guidance. The DNA concentration and purification were evaluated using 1.0% agarose gel by NanoDrop 2000 UV-vis spectrophotometer (Thermo Fisher Scientific, Waltham, MA, USA) before sequencing [21]. The extracted DNA was amplified using primers 524F (5′-TGYCAGCCGCCGCGGTAA-3′) and Arch958R (5′-YCCGGCGTTGAVTCCAATT-3′), which target conserved sequences found in archaea. All PCR amplicons were isolated and purified from 2% agarose gels with a DNA gel extraction kit (Axygen Biosciences, Union City, CA, USA). The DNA concentration after PCR was evaluated with the QuantiFluorTM-ST fluorescent quantitative system (Promega, Madison, WI, USA) before sequencing. All PCR products were sequenced using the Illumina MiSeq platform (Illumina, San Diego, CA, USA) by Shanghai Majorbio Bio-pharm Technology Co., Ltd., Shanghai, China.

2.4. Statistical Analysis

After all the data were collected, a few trending microbial analytical indices were selected and adopted. Microbial alpha diversity indices including the Chao1 estimator and Shannon diversity index in Mothur (v 1.30.1) were calculated. The Simpson diversity index and ACE estimator were calculated in complementary. The rarefaction curve for ACE, Chao1 and observed OTUs was also calculated to evaluate the sequencing quantity sufficiency. Microbial beta diversity analysis: a principal component analysis (PCA) based on the Bray–Curtis distance was conducted and visualized with R package vegan; non-metric multidimensional scaling (NMDS) was also calculated in supplementary with PCA using R package vegan and Qiime [31]. A permutational multivariate analysis of variance test (PERMANOVA, n = 999) was applied to examine the interpretation level and statistical significance among differences. A linear discriminant analysis effect size (LEfSe) analysis with a non-parametric factorial Kruskal–Wallis (KW) sum-rank test under one-against-all (less strict) strategy was calculated and drawn using LEfSe (Available online: http://huttenhower.sph.harvard.edu/galaxy/root?tool_id=lefse_upload accessed on 28 May 2020).
The influences of environmental factors on the archaeal community were evaluated with a redundancy analysis (RDA) or canonical correspondence analysis (CCA) after the variance inflation test (VIF) to select prominent factors (VIF value < 10) with R package vegan [1]. A variance partitioning analysis (VPA) was used to identify and compare the impact of two factor groups (physicochemical factors and heavy metals) on the archaeal community with R package vegan [31]. Excel 2016 and Origin 2019 were used for data analysis and diagram drawing, and the results were expressed as mean value ± standard deviation.

3. Results and Discussion

3.1. Physicochemical Parameters and Metal Concentrations

The physicochemical parameters and heavy metal concentration are shown in Table 1. Each value represents the average of three parallel composite samples. The concentration of total nitrogen (TN) and total phosphorus (TP) varied significantly. Sample site A had the highest concentration of TN at 4997 mg/kg and TP at 1681 mg/kg while the lowest appeared on site B. The oxidation-reduction potential of site H approached 0, possibly representing a relatively high reduction of organic compound. Site E had a much higher concentration and became the most polluted by heavy metal including Cr, Ni, Zn, As and Pb. The high concentration of Cu and Hg at site A corresponded to its high TN and TP. The overall TN concentration was lower than that of the Pi River [1], which was the main source of drinking and industrial water, ranging between 4300 mg/kg to 5300 mg/kg but with a relatively high TP concentration. The Pi River also has a higher oxidation-reduction potential than this in this study, probably due to its severe eutrophication. Another study carried out in the Shiwuli River [32] also showed higher TN and TP concentrations. However, the mean Cu and Zn values were 50 and 125 mg/kg, respectively, which was much higher than that in the Pi River. This showed that the sediment sample had relatively low organic pollution, but had significant heavy metal concentration. It is possible that the heavy metals could release back to the water environment under certain weather conditions. However, in this study, the main focus was on the sediments and its microbial community. The possible source of the heavy metal was industrial wastewater discharge as there were multiple wastewater outfalls in the river.
It is notable that while site B had relatively lower TN and TP concentration compared with other sites, the heavy metal concentration of this point was higher than most. This was probably resulting from the unique character of the wastewater discharged into this point. Further investigation is needed to explain this phenomenon.

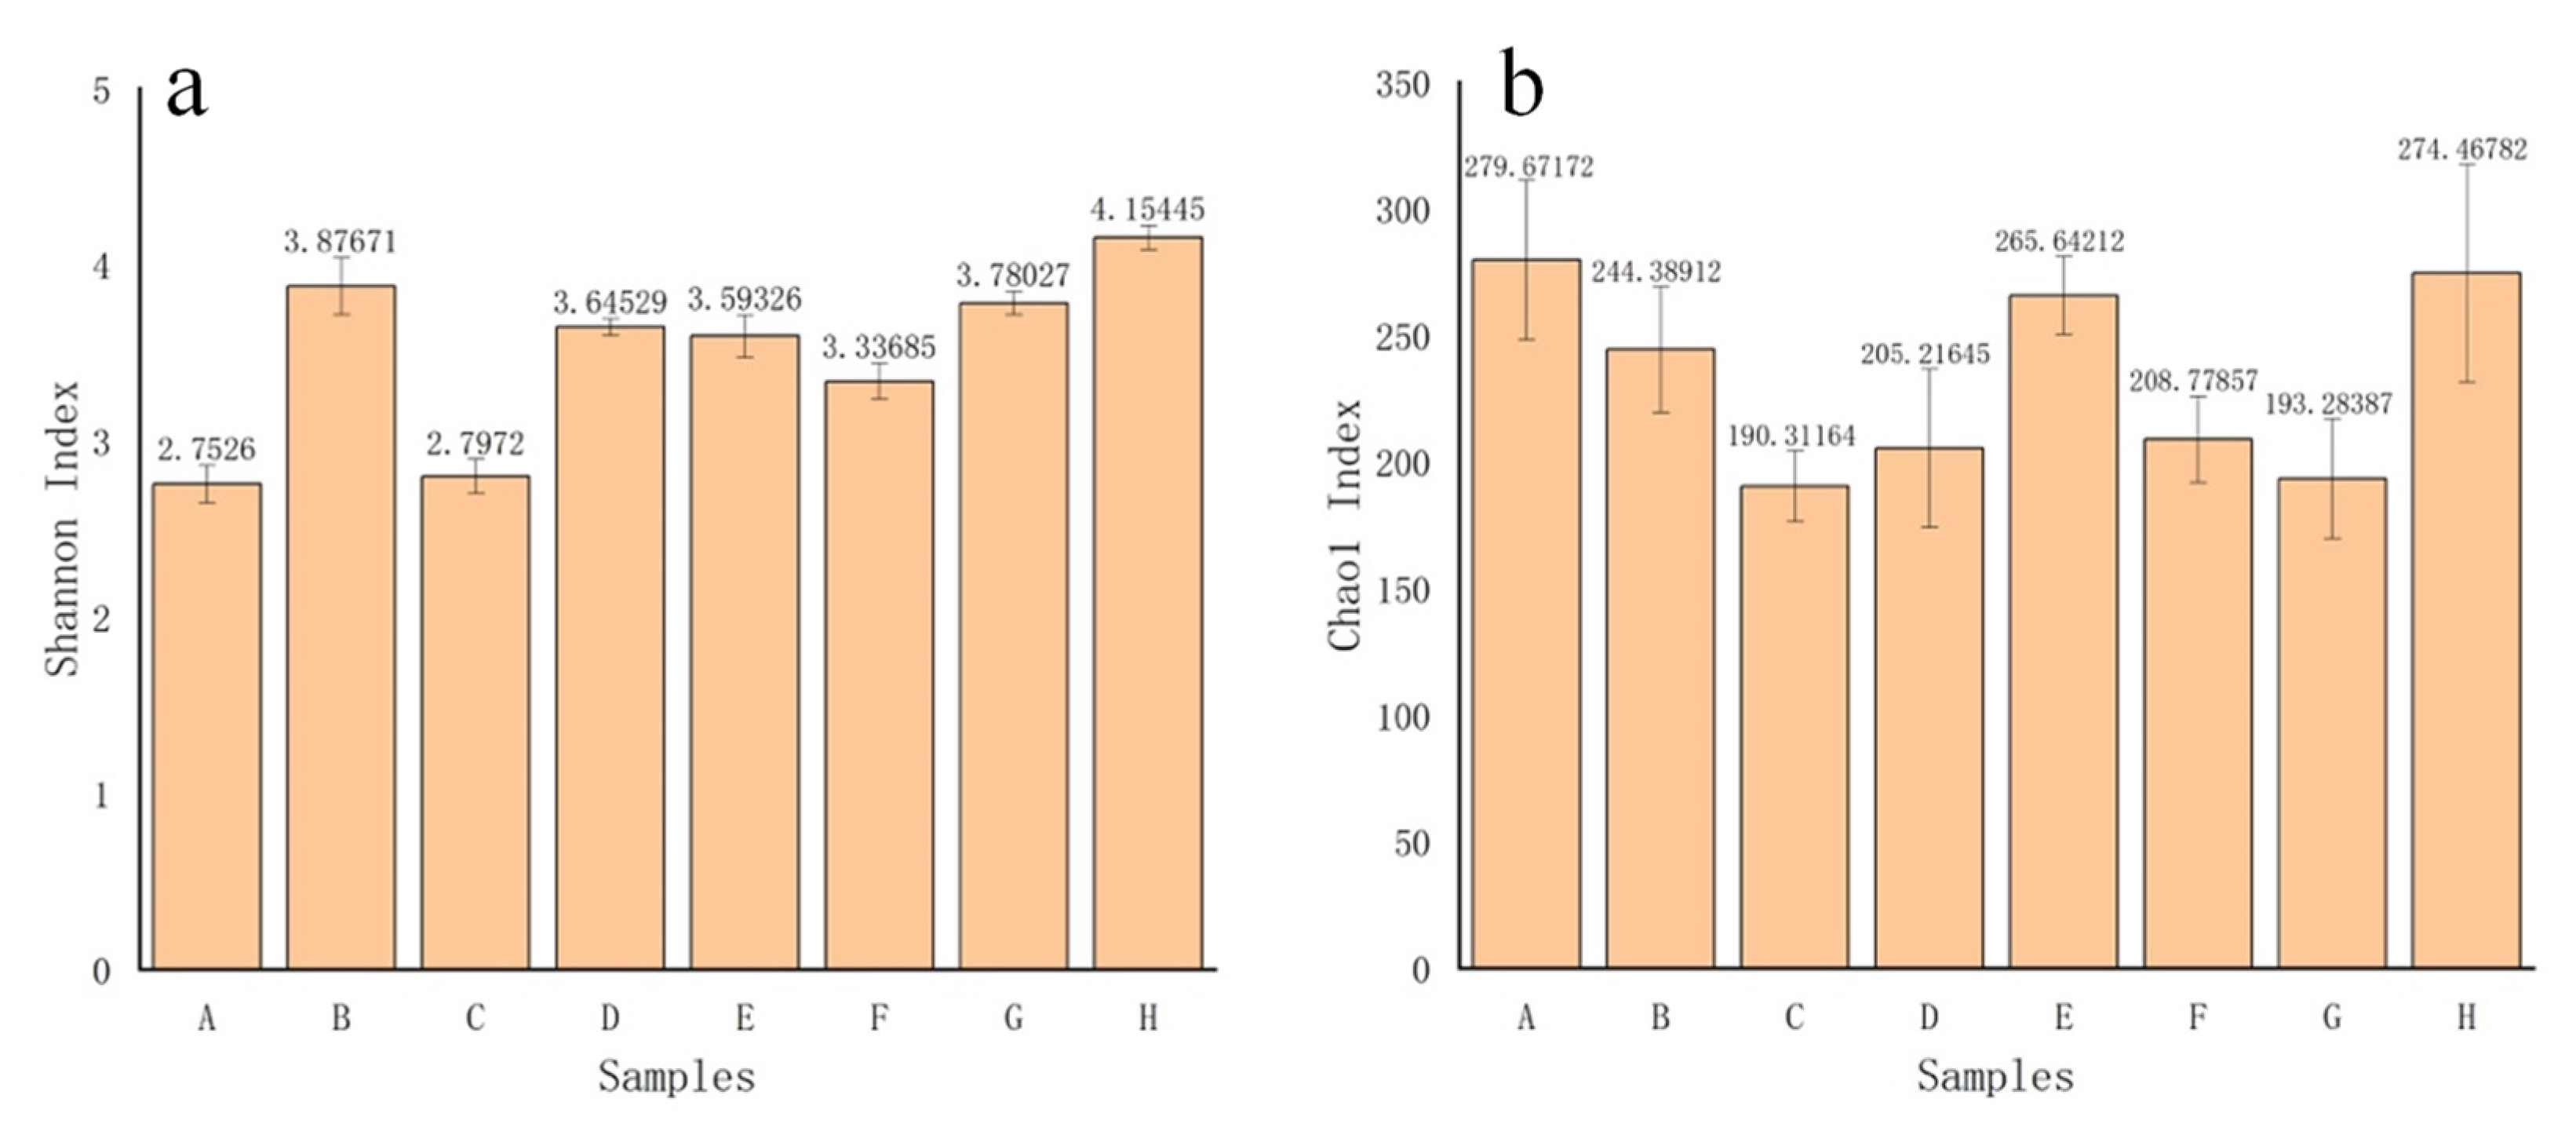
3.2. Alpha Diversity of Archaeal Community

A total of 460,362 valid sequences were obtained from 24 samples and these sequences ranged from 11,316 to 24,760 with an average of 19,182. A cluster analysis showed 517 OTUs of archaea. The rarefaction curve based on ACE and Chao1 suggested that the produced sequence was sufficient to support the research and the majority of the samples reached the saturation state (Figure S1). Rarefaction curves, combined with the high Good’s coverage ranging from 98.97% to 99.68% for the sediment sample, indicated the major archaeal communities were included in the current analysis (Table S1). The Shannon was calculated to represent community diversity and the Chao1 was calculated representing the community richness. The results are shown in Figure 2. The archaeal community from the eight sediment sites have average values of Shannon and Chao1 at 3.4921 and 232.7202, respectively. Specifically, the value of Shannon in sediment A and C were significantly lower than those in the rest of the sediment samples (B, D, E, F, G, H) (all p < 0.01), indicating that the archaea community diversities in these two sediment samples were lower. Meanwhile, the Chao1 value in sediment A was the highest among all the sediment samples, suggesting the highest community richness. The results were significantly different from that in the Jinchuan River where no significant variation was observed [20]. These results indicated the different responses of archaea community diversity and community richness to heavy pollution in sediment samples.

3.3. Archaeal Community Composition and Beta Diversity

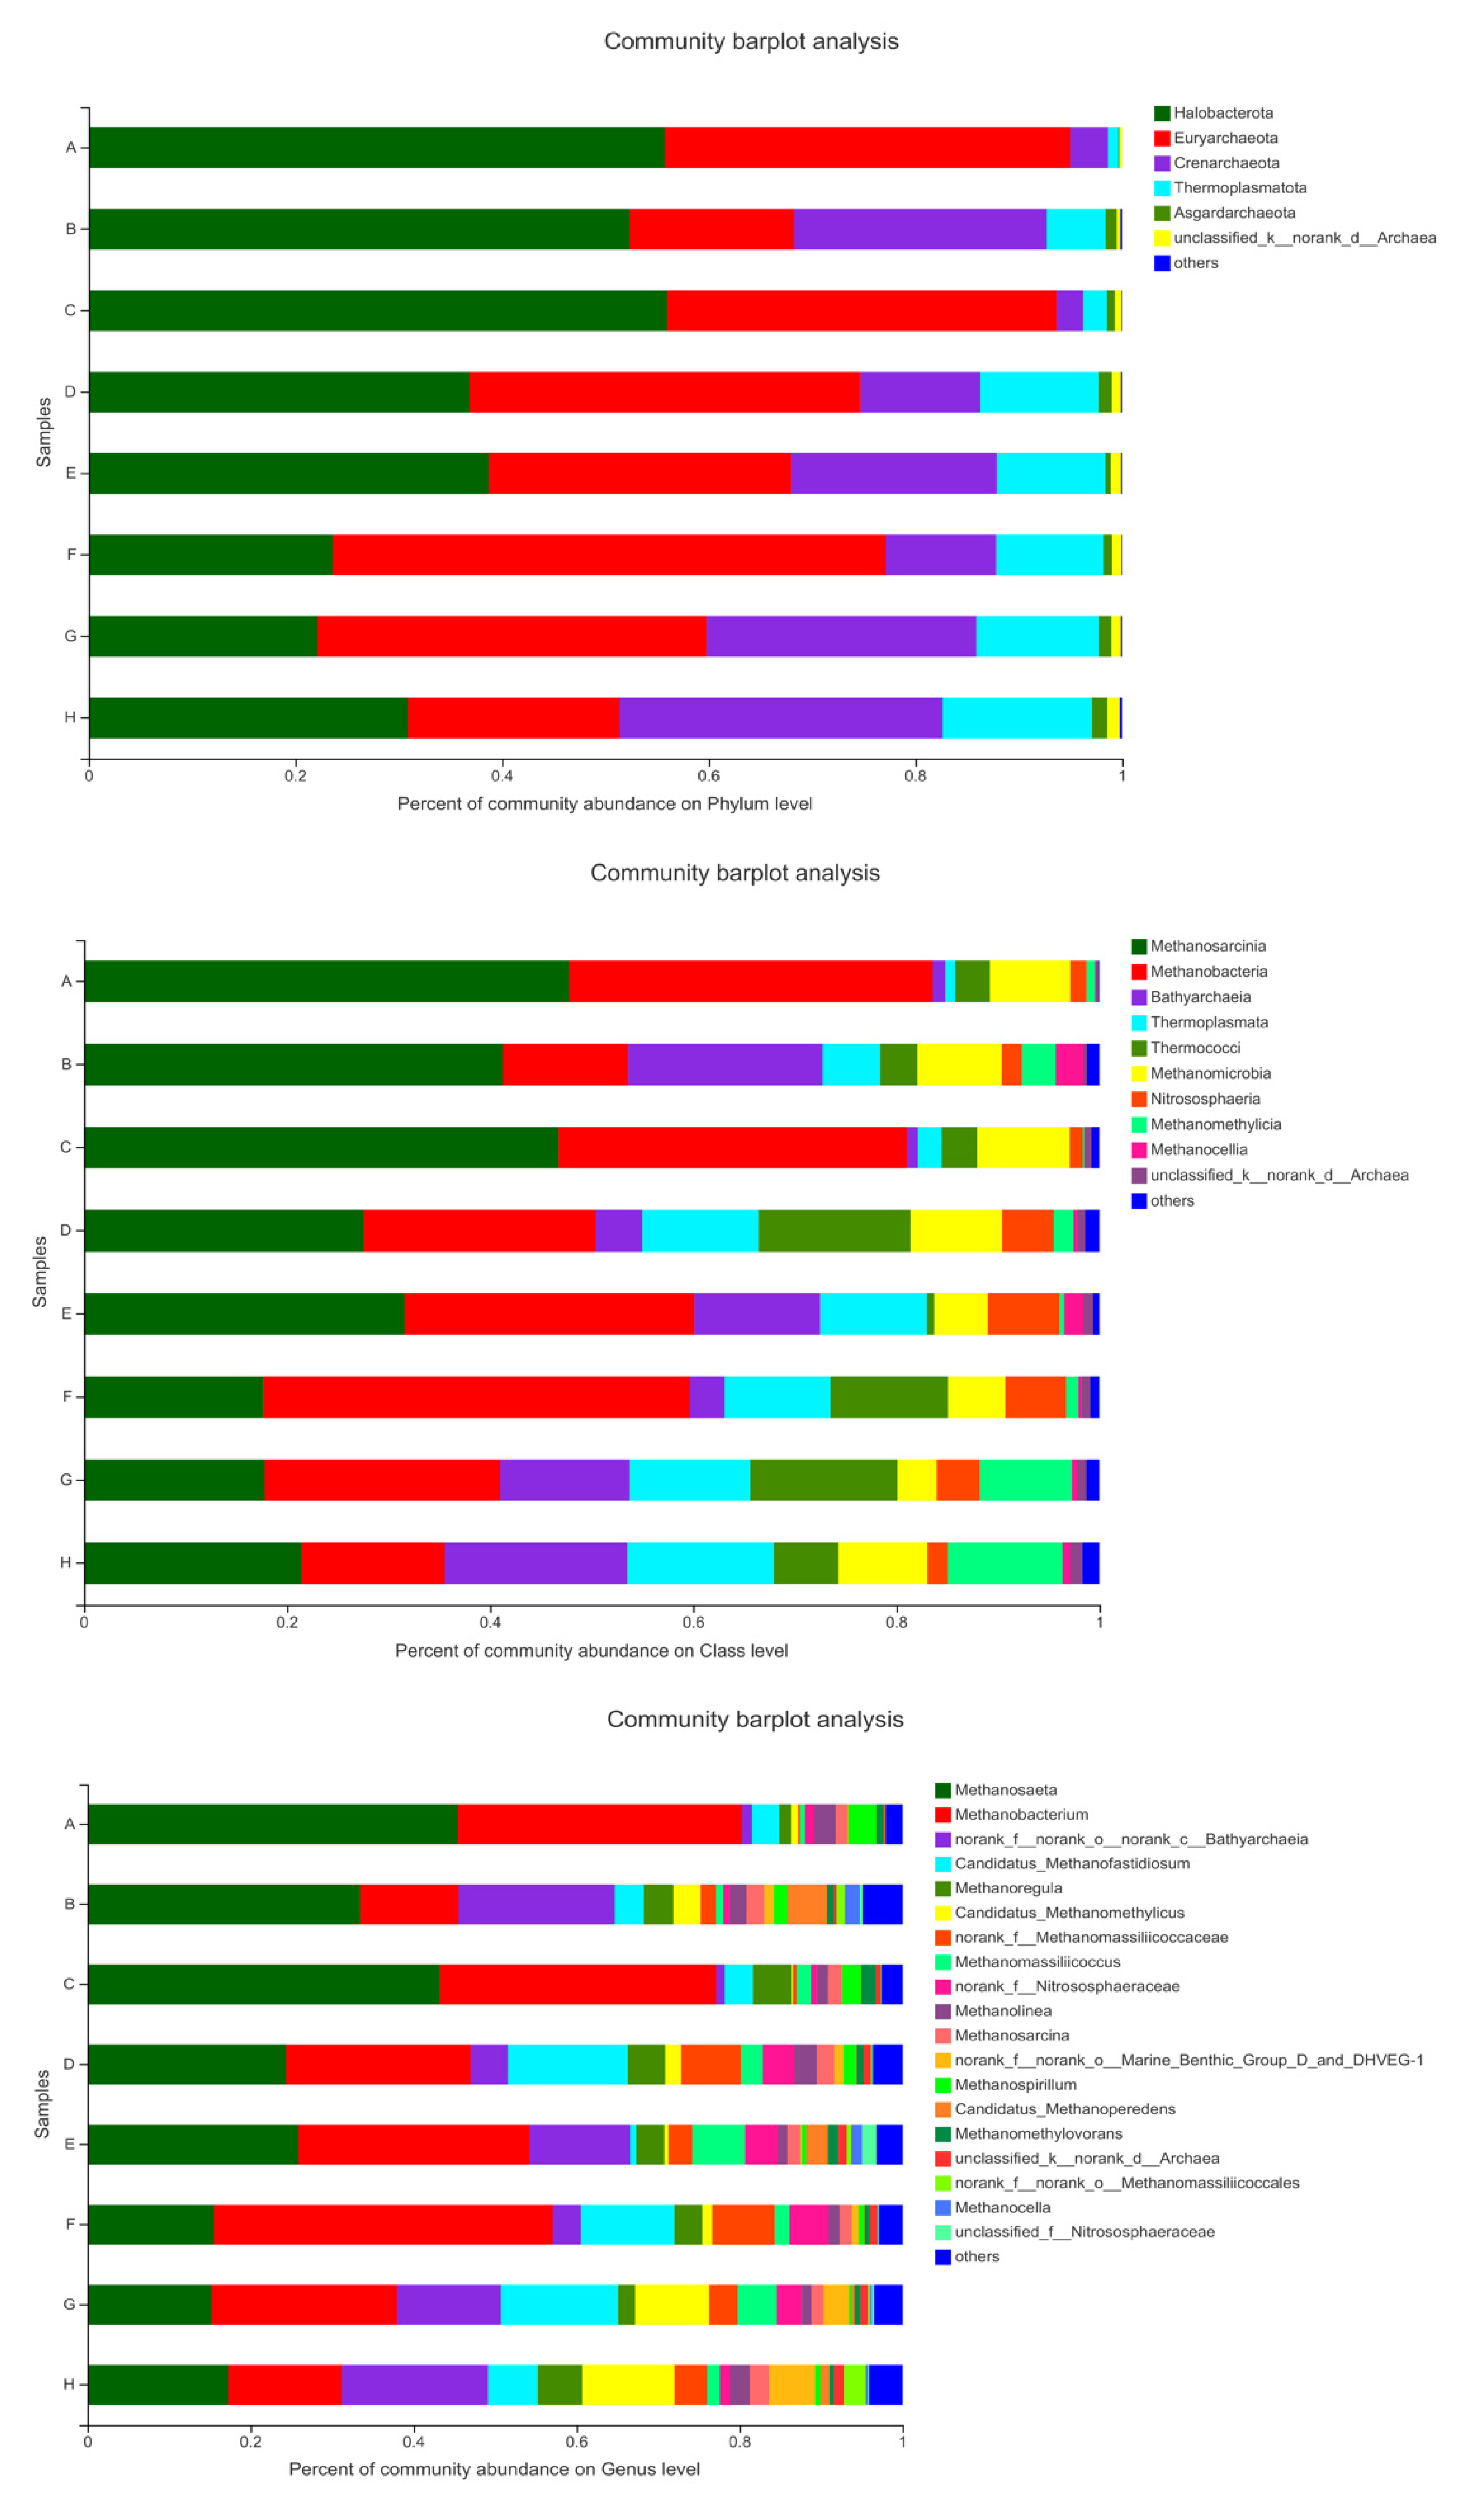
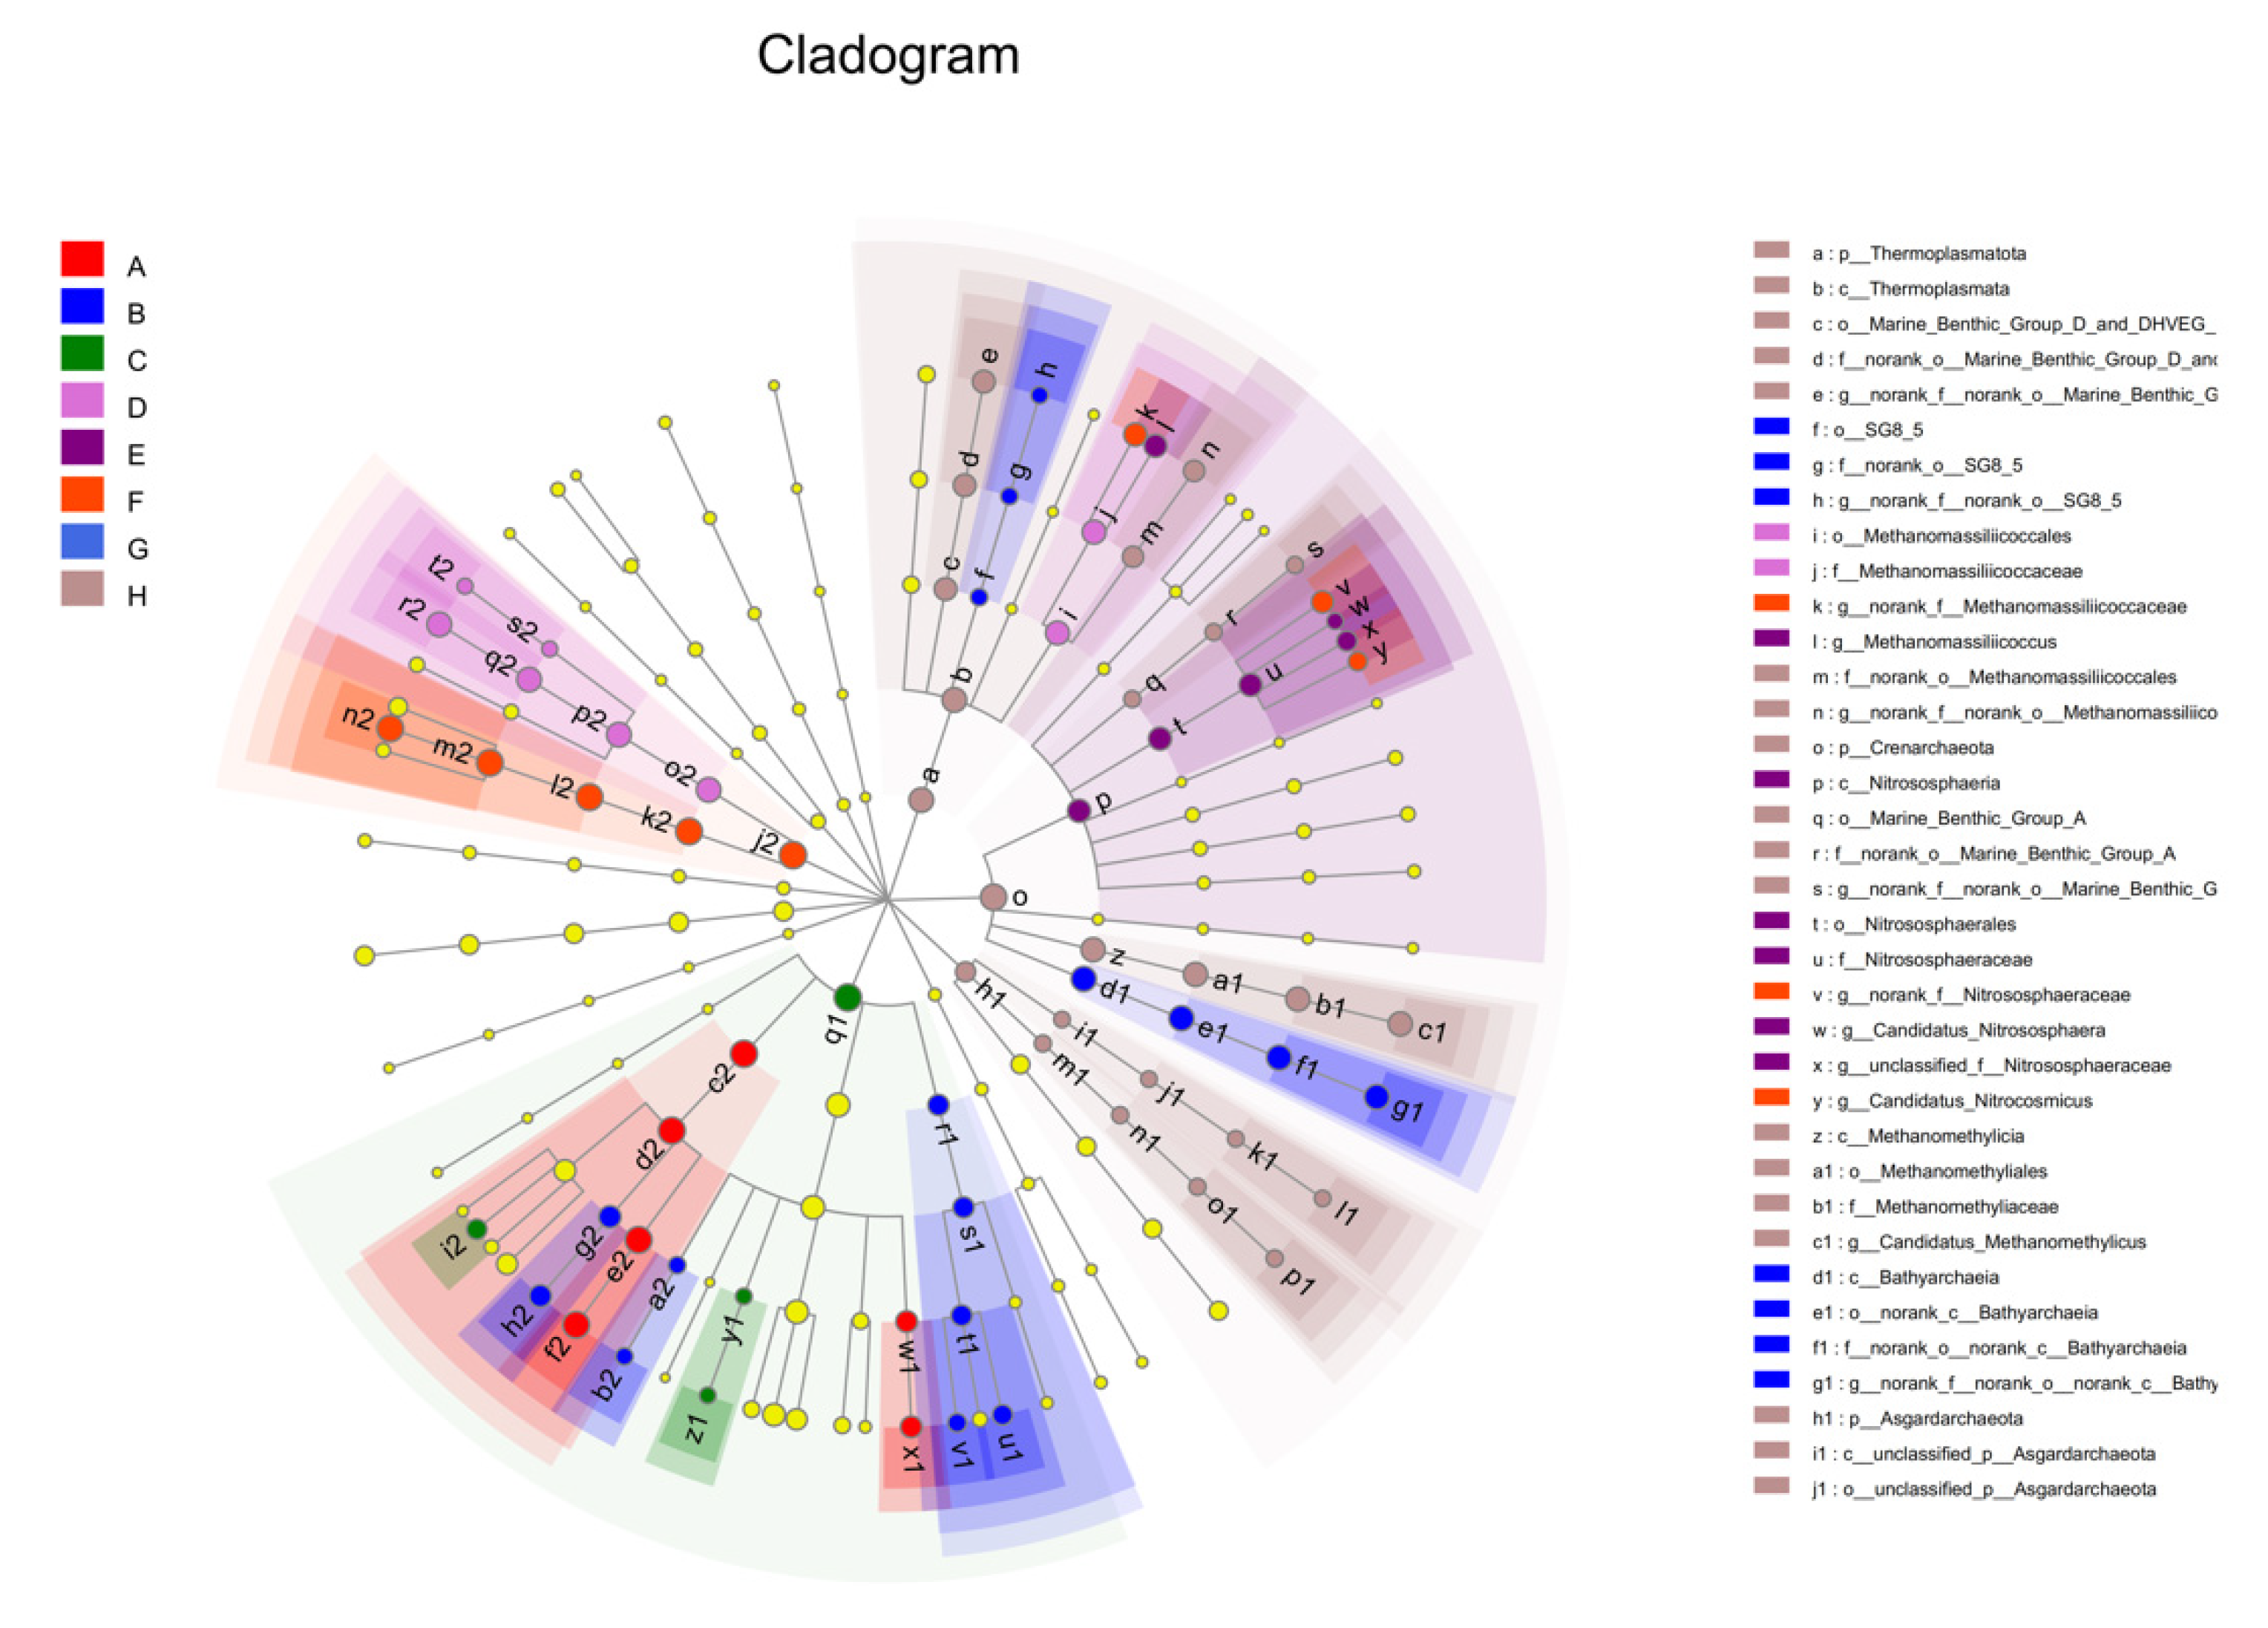
3.3.1. Archaeal Community Composition

Figure 3 represents the archaeal community composition on phylum, class and genus levels, respectively. The composition varied significantly among 8 sediment samples. The results showed that Halobacterota and Euyachaerota were the dominant species representing more than 50% of the general microbial community, corresponding to the result of alpha diversity. On the class level, Methanosarcia class took up the largest amount in sample A (47%), B (41%) and C (46%), while Methanobacteria class became the second (around 35%) in A and C. The combination of Methanosarcia and Methanobacteria took the dominant place in A, B, C, E and F while Methanobacteria surpassed Methanosarcia in F and became the leading class. Bathyachaeria presented a relatively high abundance in sample B, E, G and H with Themoplasmata showing the same abundance ratio in D, E, F, G and H. On the genus level, a similar distribution was observed for Methanosaeta and Methanobacterium, which took up more than 50% in A, B, E and F. The relatively high abundance of Bathyarchaeia was also noticeable in B, E, G and H. In addition, some unclassified archaeal genes were detected, which may lead to a slight miscalculation of the actual distribution.

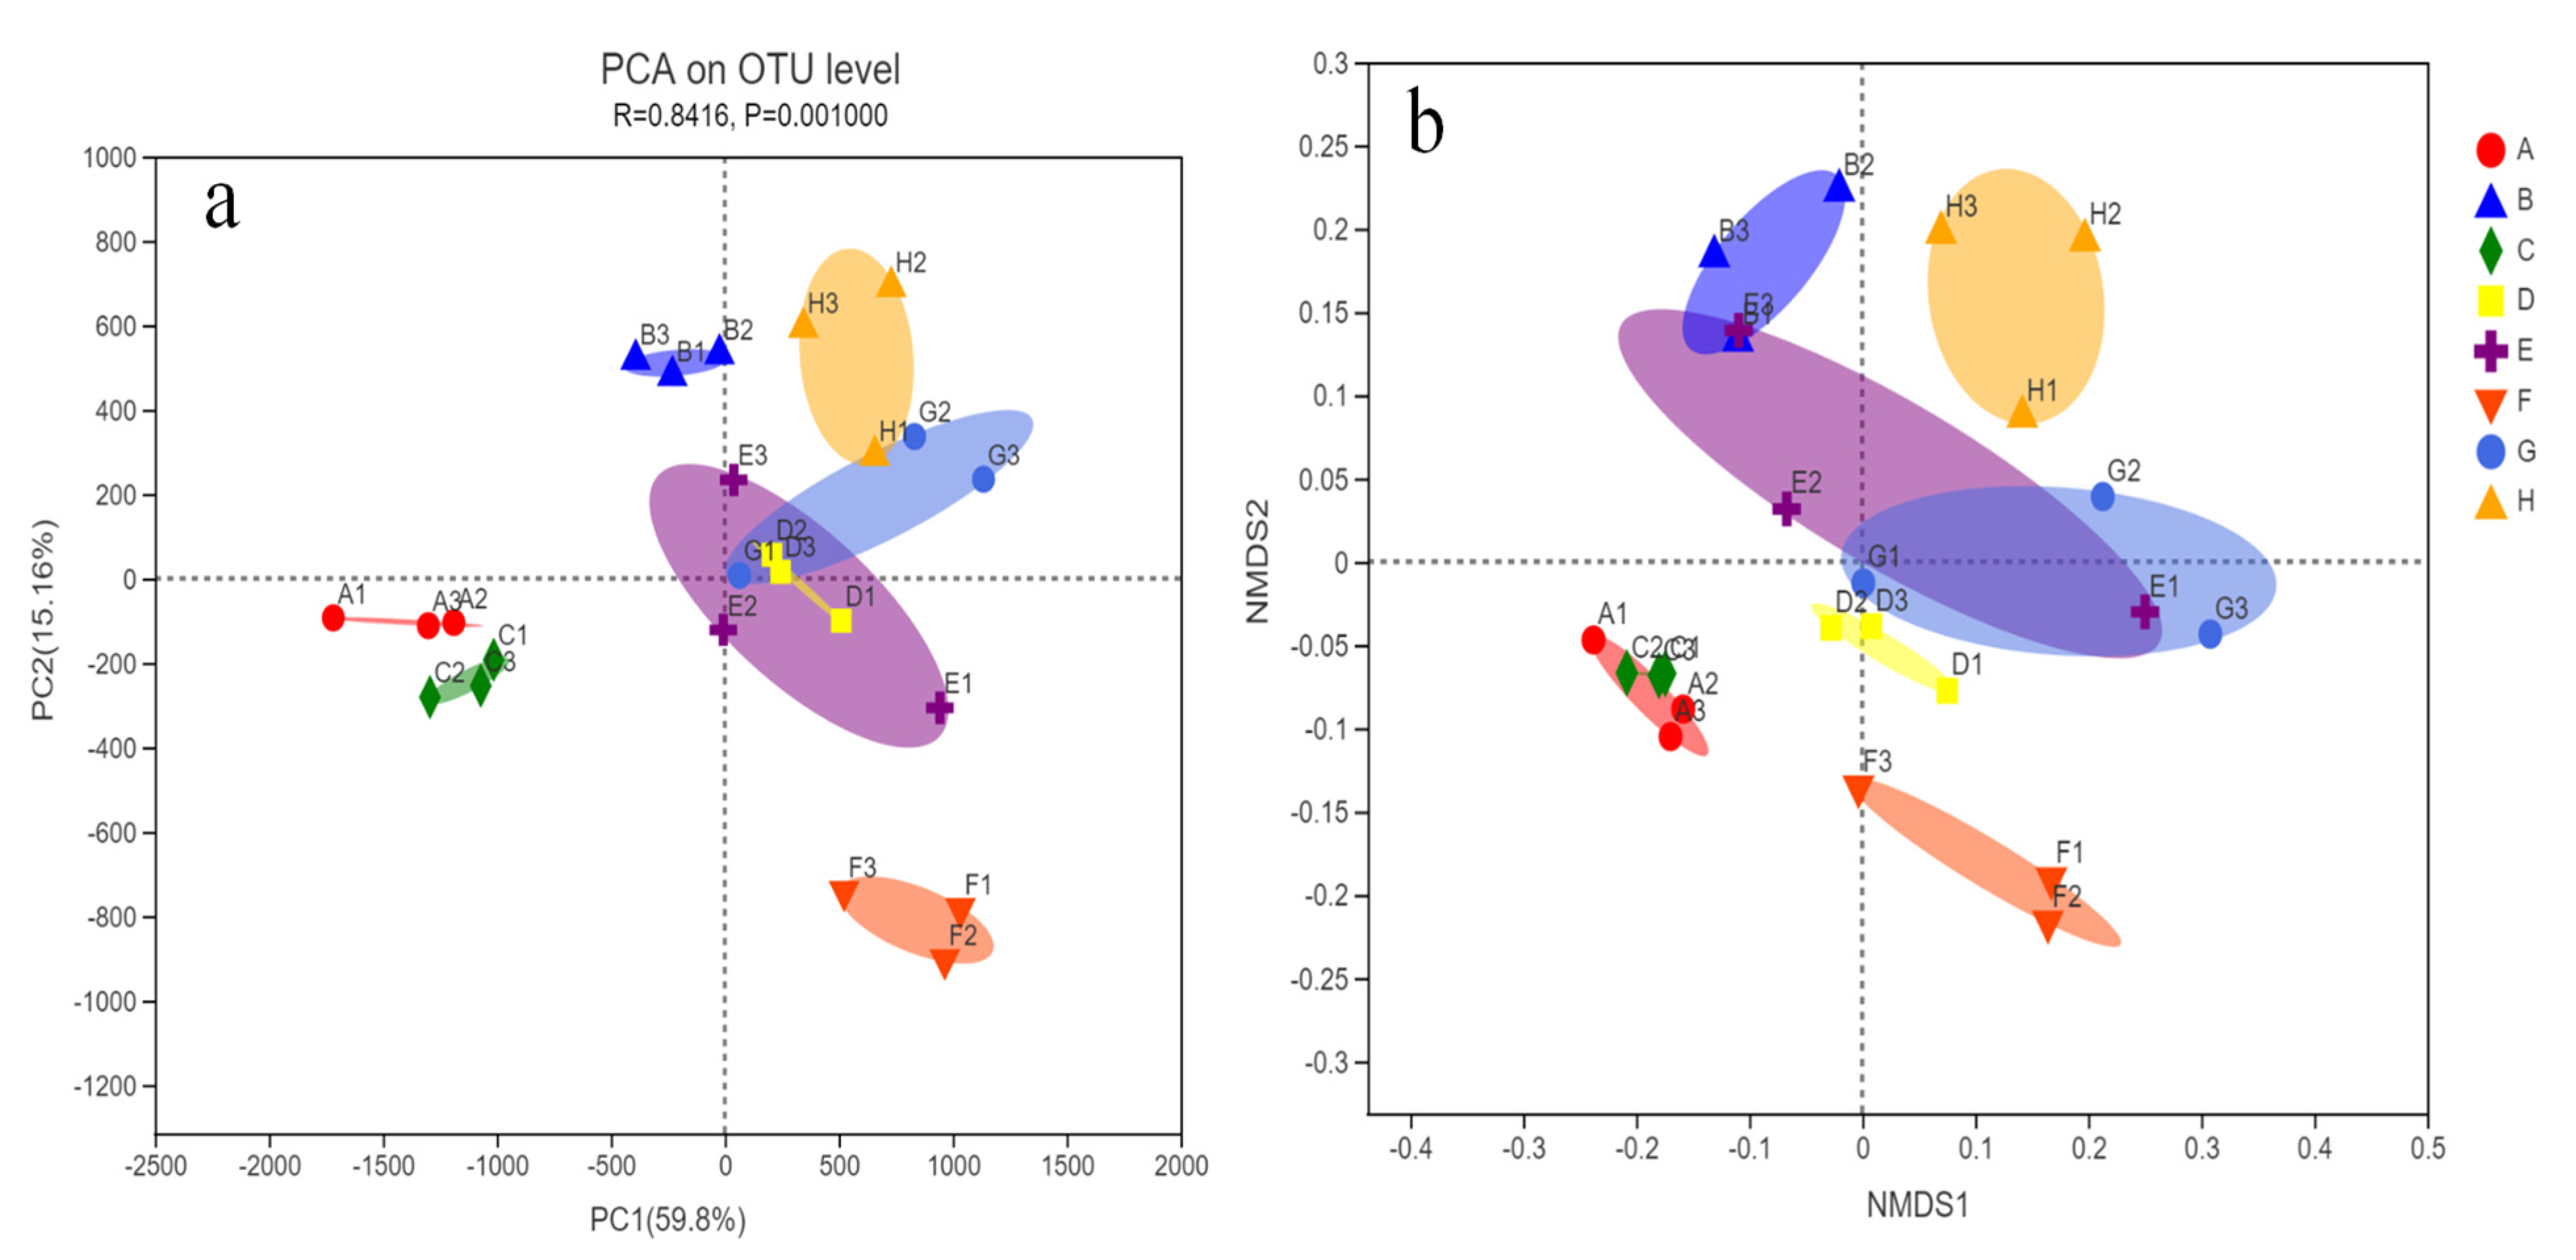
3.3.2. Beta Diversity

Figure 4a represents the PCA plot of the Bray–Curtis distance, which showed a relatively high separation of beta diversity regarding the microbial community structure. The PERMANOVA result also confirmed the results (R2 = 0.751, p = 0.001). Sample A and C were similar while they had the obvious difference from other samples, corresponding to the results of alpha diversity. Sediment F also showed a noticeable partition compared with D, E and G. There was no clear pattern observed to reflect the spatial variation of the sample river.
The NMDS is a more comprehensive and precise analytical method for complex and multi-species samples. Different colors represent different sample groups, while the point distance within the sample groups represents the repeatability of samples. The results (Figure 4b) showed a similar trend with PCA that sediment A and C had the prominent similarity, while no evident gradient or pattern was observed. The results from sample E, H and G showed no tendency to cluster, similar to the observation in the Jinchuan River [20]. The deviation of both PCA and NMDS results represented that there was no prominent pattern of archaeal community assemblage with the community structure varied among samples.
A LEfSe analysis consisting of the Kruskal–Wallis sum-rank test and linear discriminant analysis (LDA) was conducted to determine the key archaeal phylum responsible for the difference among the samples. The results (Figure 5) showed that phylum Asgardarchaeota (p = 0.029) in sample H, phylum Halobacterota (p = 0.027) in sample C and phylum Euryarchaeota (p = 0.017) in sample F were the most abundant and contributed to the difference among other groups. In addition, in the class level, Lokiarchaeia (p = 0.040) in H and Methanosarcinia (p = 0.018) in A were important taxon within their group. A false discovery rate (FDR) test was applied to examine the significance in phylum diversity. Phylum Crenarchaeota (p = 0.0076), Thermoplasmatota (p = 0.008), Aenigmarchaeota (p = 0.0068) and Micrarchaeota (p = 0.0067) showed a relatively significant differential abundance, while phylum Halobacterota (p = 0.027), Euryarchaeota (p = 0.017) and Asgardarchaeota (p = 0.029) also contributed to the diversity.

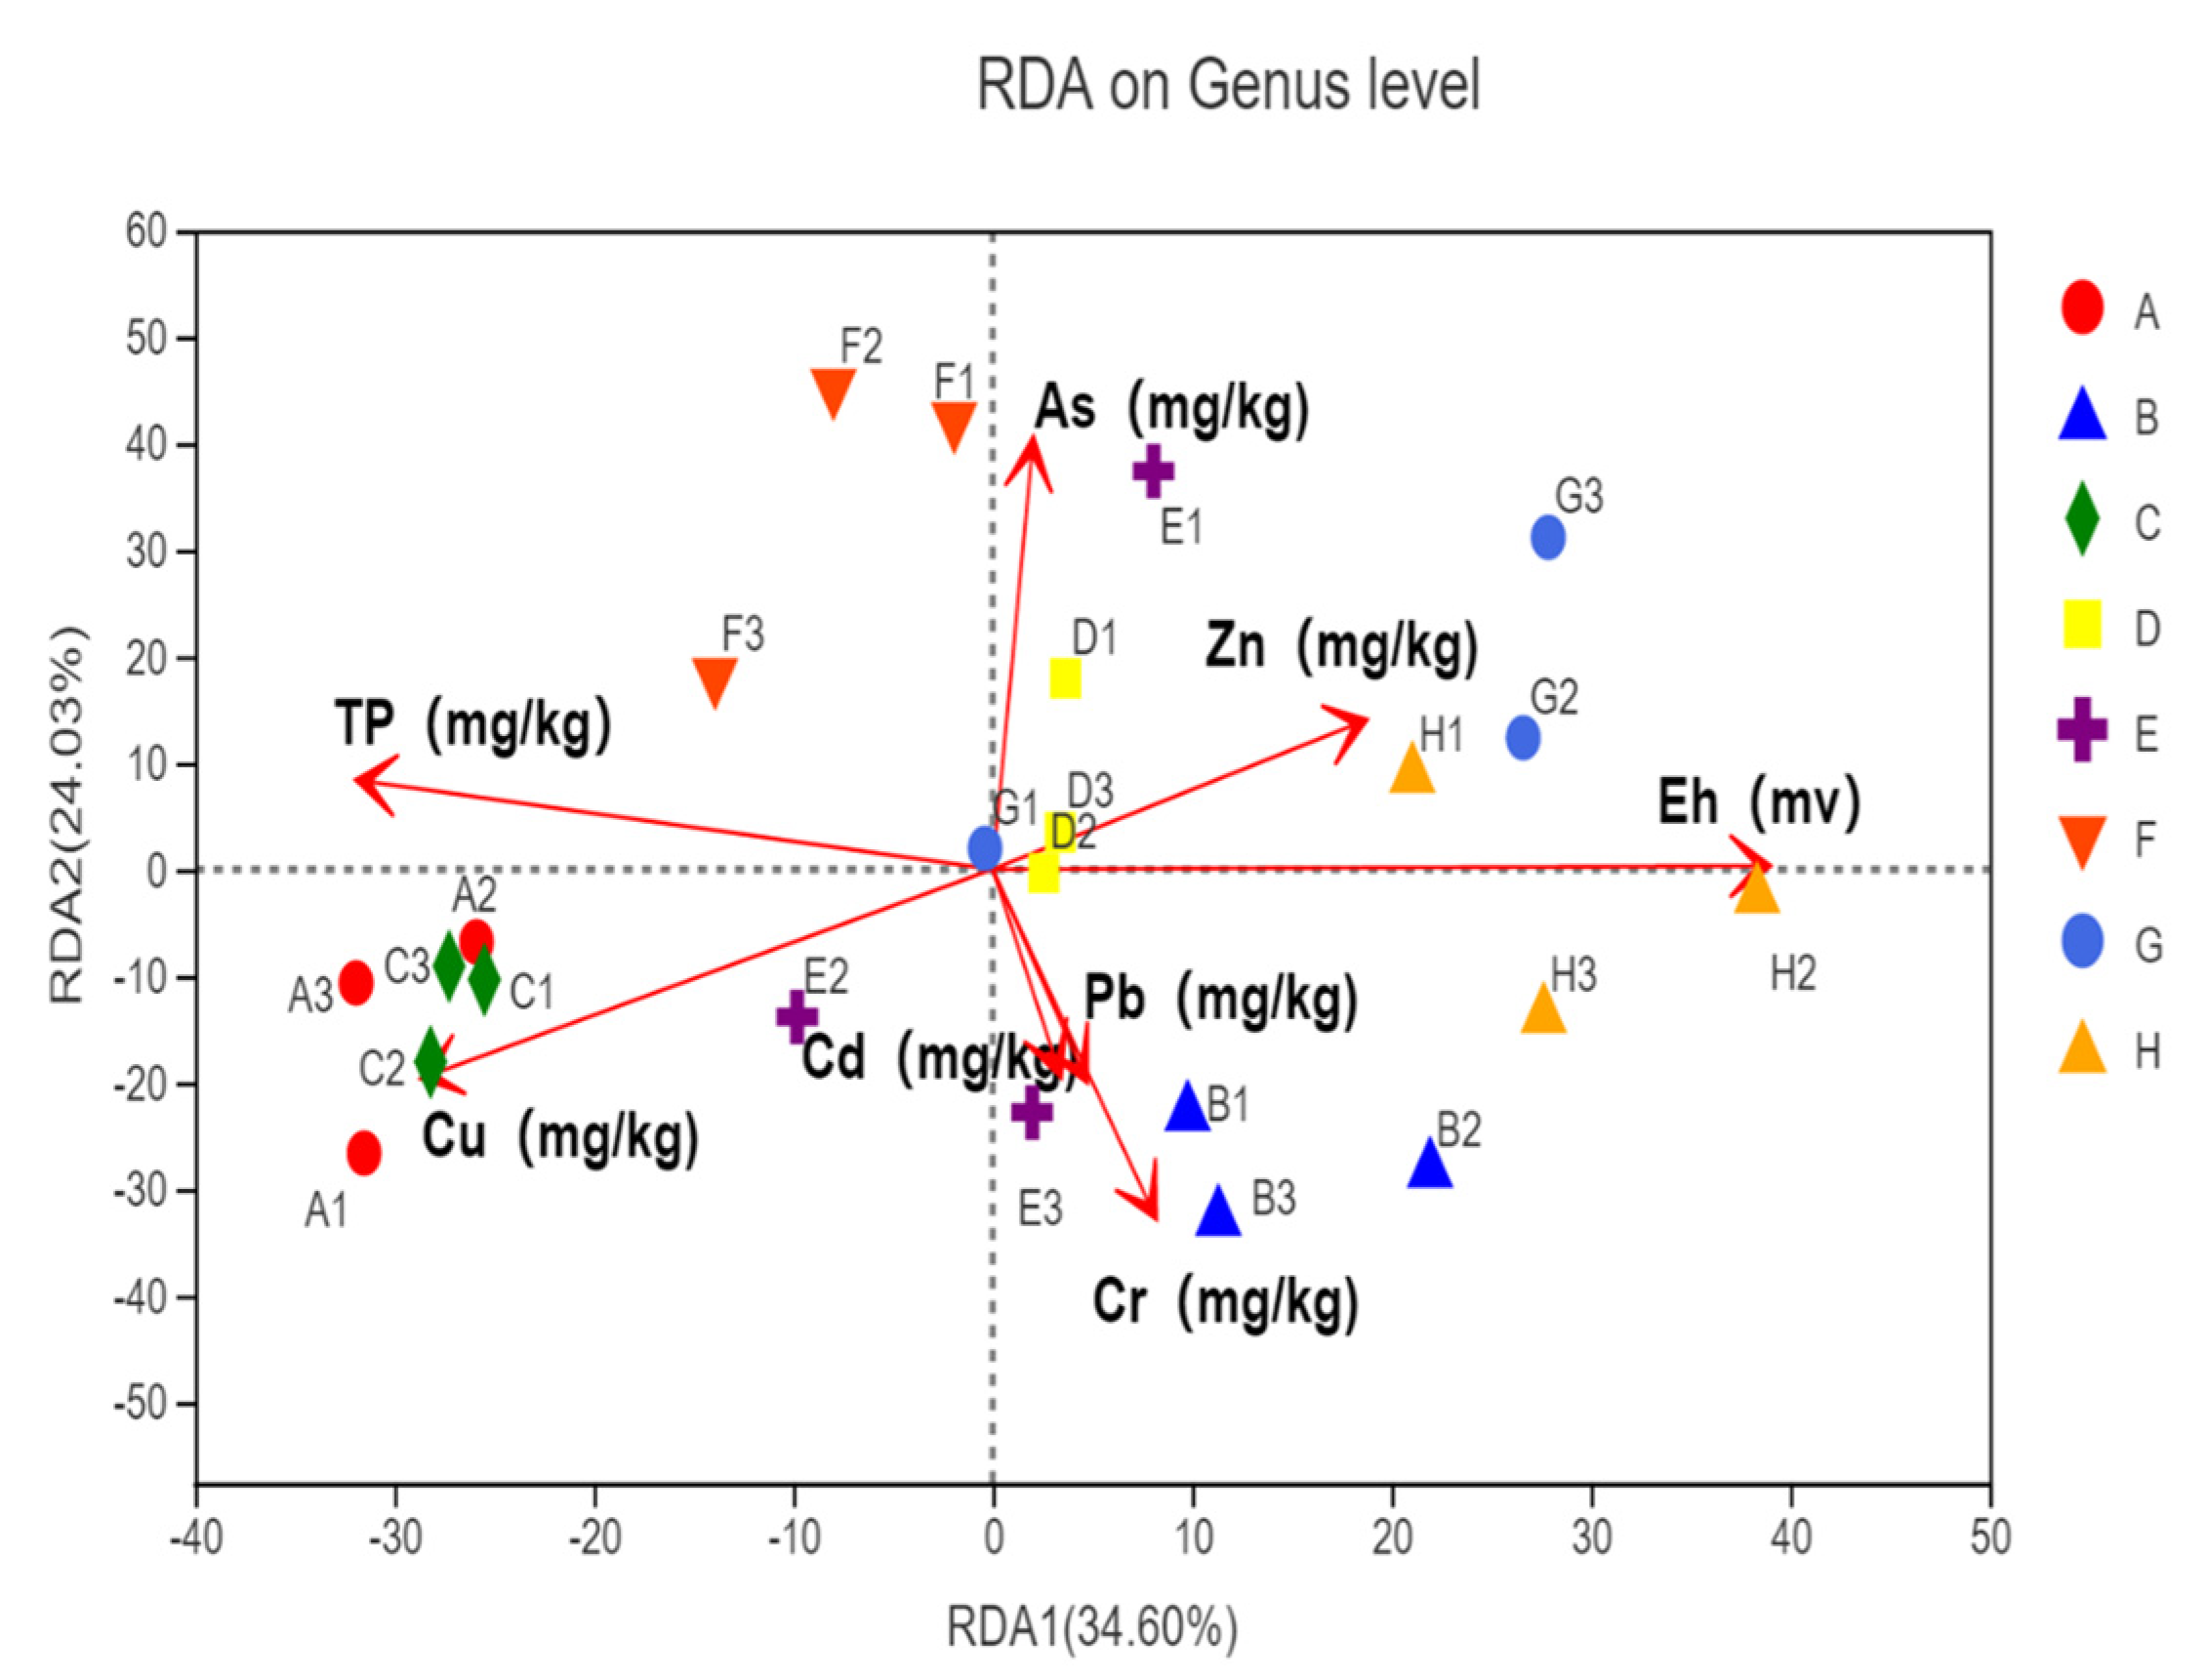
3.4. Influences of Environmental Factors on the Archaeal Community

A variance inflation factor (VIF) test was carried out before the RDA to remove the collinearity and select representative factors (Table S2). TP, Eh, Cr, Cu, Zn, As, Cd and Pd were chosen for the correlation analysis. According to the RDA results, Eh (R2 = 0.3097, p = 0.021) and As (R2 = 0.2664, p = 0.024) were the most relevant factors for explaining the variation. A total of 65.49% of the archaeal community variation could be explained for the sediment sample. The Eh factor with both Cu and TP showed a significant and negative correlation which was consistent with the results from the Pi River [1]. In terms of the physicochemical factors, Methanosarcinia was greatly affected by heavy metal Cu while Methanobacteria was affected by TP. The result is shown in Figure 6 and Table 2.
Previous studies manifested that ORP was a vital influential factor to bacterial community composition and diversity because it was the macroscopic embodiment of both anaerobic and aerobic bacteria [1]. Husson [33] also pointed out that enzyme activities, cell assimilation capacities and the development of microorganisms were impacted by ORP. It is clear that microbial metabolism is affected by ORP especially for anaerobes. Most archaeal species are strict or facultative anaerobic, and the growth and composition of the archaeal community is consequently influenced by ORP. Furthermore, the contamination of heavy metals has also been proven to be toxic and has a significant negative effect on both bacterial and certain archaeal communities [34,35]. Mosier et al. [36] have also suggested that Pb was a suppressant to AOA abundance in estuary sediment. Li et al. [21] indicated the addition of Cu could alter the AOA diversity during a daily manure composting process; however, Li et al. [34] stated that though AOA was more tolerant to Cu contamination than AOB, the microbial activity was still heavily inhibited. In this study, however, Cu and Pd only had a slight influence on the community diversity, while As was the most influencing heavy metal. The sediments had a significantly high level of Cu and Zn compared with the study conducted by Wang et al. [1]. TN and other nitrogen factors also had little correlation with the community diversity, which may indicate low AOA community composition in the samples. No distinct community composition gradient was observed as the heavy metal concentration varied among sample sites. The effect of heavy metals on the overall archaeal community in eutrophicated sediment was still unclear.
VPA was further carried out to determine the significant factor group that impacted the community diversity. The environmental factors were divided into two sections/groups: physicochemical factors and heavy metals. The results (Figure 7) showed that the tested factors represented the main cause for the variation. The influence of heavy metals on the archaeal community was slightly higher than physicochemical factors and proved to be the most influential cause. Nahar et al. [37] and Li et al. [21] have reported the significant influence of heavy metals on the composition, diversity and nitrifying metabolism of AOA. Liu et al. [38], Ruyters et al. [39], Zhou et al. [40] and Mosier et al. [36] proved that heavy metals had no apparent impact on the archaeal community in soil and marine sediment. The heavy metal influence on the other archaeal community is still unclear. However, heavy metals significantly affected the diversity in this study.

4. Conclusions

In this study, we investigated the archaeal community composition and diversity from an urban blackened and odorous river sediment in the Shiqiao River, the drainage basin of the Zhang River. The eutrophication and heavy metal pollution resulting from intensive wastewater discharge significantly impacts the archaeal community in sediment. ORP and heavy metals were found to have the greatest impacts on the shaping of the overall archaeal community, in which Halobacterota and Euyarchaeota were the prominent species. No obvious microbial composition gradient was found among the sampling sites when considering the variation. The VPA analysis revealed that heavy metals were the primary contributing environmental factor for the archaea community distribution over the physicochemical factors. This study provided insights into the overall archaeal diversity and microbial distribution from a blackened and odorous waterbody, contributing to the knowledge of archaeal ecology in polluted environments. The present study suggested that the heavy metal pollution should be paid more attention in microbial distribution in heavily polluted urban rivers and taken into consideration for improving the efficacies of ecological evaluation and remediation.

Supplementary Materials

The following are available online at https://www.mdpi.com/article/10.3390/w13111545/s1. Table S1. The Good’s coverage of the archaeal community from the eight sediment samples. The result are presented as mean ± standard deviation (SD). Table S2. VIF value for selected environmental factors. Figure S1. The rarefaction curves for ACE and Chao1 index of the archaeal community from the eight sediment samples.

Author Contributions

Conceptualization, Y.W. and Y.Y.; Data curation, J.Z.; Formal analysis, G.X.; Funding acquisition, C.S.; Investigation, G.X. and Q.C.; Methodology, J.Z.; Supervision, Y.W. and Y.Y.; Writing–original draft, C.S. and J.Z.; Writing–review & editing, Y.W. and Y.Y. All authors have read and agreed to the published version of the manuscript.

Funding

This work was funded by the Major Project of Specialized Science and Technology Fund of Sichuan Province (No. 2019YFS0505), the Research Project of POWER CHINA Chengdu Engineering Corporation Limited (No. P44920).

Institutional Review Board Statement

Not applicable.

Informed Consent Statement

Not applicable.

Data Availability Statement

The data presented in this study are available on request from the corresponding author.

Acknowledgments

This work was supported by the Major Project of Specialized Science and Technology Fund of Sichuan Province (No. 2019YFS0505) and the Research Project of POWER CHINA Chengdu Engineering Corporation Limited (No. P44920).

Conflicts of Interest

The authors declare no conflict of interest.

References

  1. Wang, J.; Yuan, S.; Tang, L.; Pan, X.; Pu, X.; Li, R.; Shen, C. Contribution of heavy metal in driving microbial distribution in a eutrophic river. Sci. Total Environ. 2020, 712, 136295. [Google Scholar] [CrossRef] [PubMed]
  2. Cao, J.; Sun, Q.; Zhao, D.; Xu, M.; Shen, Q.; Wang, D.; Wang, Y.; Ding, S. A critical review of the appearance of black-odorous waterbodies in China and treatment methods. J. Hazard. Mater. 2020, 385, 121511. [Google Scholar] [CrossRef]
  3. Jin, X.; Xu, Q.; Huang, C. Current status and future tendency of lake eutrophication in China. Sci. China Ser. C Life Sci. 2005, 48, 948–954. [Google Scholar]
  4. Hoellein, T.J.; McCormick, A.R.; Hittie, J.; London, M.G.; Scott, J.W.; Kelly, J.J. Longitudinal patterns of microplastic concentration and bacterial assemblages in surface and benthic habitats of an urban river. Freshw. Sci. 2017, 36, 491–507. [Google Scholar] [CrossRef]
  5. Rathour, R.; Gupta, J.; Kumar, M.; Hiloidhari, M.; Mehrotra, A.K.; Thakur, I.S. Metagenomic Sequencing of Microbial Communities from Brackish Water of Pangong Lake of the Northwest Indian Himalayas. Genome Announc. 2017, 5. [Google Scholar] [CrossRef] [PubMed] [Green Version]
  6. Schloter, M.; Nannipieri, P.; Sørensen, S.J.; van Elsas, J.D. Microbial indicators for soil quality. Biol. Fertil. Soils 2017, 54, 1–10. [Google Scholar] [CrossRef] [Green Version]
  7. Pascazio, S.; Crecchio, C.; Scagliola, M.; Mininni, A.N.; Dichio, B.; Xiloyannis, C.; Sofo, A. Microbial-based soil quality indicators in irrigated and rainfed soil portions of Mediterranean olive and peach orchards under sustainable management. Agric. Water Manag. 2018, 195, 172–179. [Google Scholar] [CrossRef]
  8. Goshu, G.; Koelmans, A.A.; de Klein, J.J.M. Performance of faecal indicator bacteria, microbial source tracking, and pollution risk mapping in tropical water. Environ. Pollut. 2021, 276, 116693. [Google Scholar] [CrossRef]
  9. Nasser, A.; sasi, S.; Nitzan, Y. Coliphages as Indicators for the Microbial Quality of Treated Wastewater Effluents. Food Environ. Virol. 2021. [Google Scholar] [CrossRef]
  10. Xia, F.; Zeleke, J.; Sheng, Q.; Wu, J.-H.; Quan, Z.-X. Communities of ammonia oxidizers at different stages of Spartina alterniflora invasion in salt marshes of Yangtze River estuary. J. Microbiol. 2015, 53, 311–320. [Google Scholar] [CrossRef]
  11. Yin, X.; Chen, L.; Tang, D.; Zhang, Y.; Liu, G.; Hua, Y.; Wan, X.; Zhou, W.; Zhao, J.; Zhu, D. Seasonal and vertical variations in the characteristics of the nitrogen-related functional genes in sediments from urban eutrophic lakes. Appl. Soil Ecol. 2019, 143, 80–88. [Google Scholar] [CrossRef]
  12. Li, Z.; Jin, W.; Liang, Z.; Yue, Y.; Lv, J. Abundance and diversity of ammonia-oxidizing archaea in response to various habitats in Pearl River Delta of China, a subtropical maritime zone. J. Environ. Sci. 2013, 25, 1195–1205. [Google Scholar] [CrossRef]
  13. Xu, Z.; Xu, J.; Yin, H.; Jin, W.; Li, H.; He, Z. Urban river pollution control in developing countries. Nat. Sustain. 2019, 2, 158–160. [Google Scholar] [CrossRef]
  14. Wu, H.; Li, Y.; Zhang, W.; Wang, C.; Wang, P.; Niu, L.; Du, J.; Gao, Y. Bacterial community composition and function shift with the aggravation of water quality in a heavily polluted river. J. Environ. Manag. 2019, 237, 433–441. [Google Scholar] [CrossRef]
  15. Liu, Z.; Iqbal, M.; Zeng, Z.; Lian, Y.; Zheng, A.; Zhao, M.; Li, Z.; Wang, G.; Li, Z.; Xie, J. Comparative analysis of microbial community structure in the ponds with different aquaculture model and fish by high-throughput sequencing. Microb. Pathog. 2020, 142, 104101. [Google Scholar] [CrossRef] [PubMed]
  16. Li, N.; Chen, X.; Zhao, H.; Tang, J.; Jiang, G.; Li, Z.; Li, X.; Chen, S.; Zou, S.; Dong, K.; et al. Spatial distribution and functional profile of the bacterial community in response to eutrophication in the subtropical Beibu Gulf, China. Mar. Pollut. Bull. 2020, 161, 111742. [Google Scholar] [CrossRef] [PubMed]
  17. Xu, M.; Wang, X.; Xi, R.; Long, Y.; Kou, J.; Liu, X. Characteristics of Nutrients and Eutrophication Assessment of Shenzhen Offshore Waters. IOP Conf. Ser. Earth Environ. Sci. 2018, 153, 062038. [Google Scholar] [CrossRef] [Green Version]
  18. Cao, X.; Wang, Y.; Xu, Y.; Duan, G.; Huang, M.; Peng, J. Adaptive Variations of Sediment Microbial Communities and Indication of Fecal-Associated Bacteria to Nutrients in a Regulated Urban River. Water 2020, 12, 1344. [Google Scholar] [CrossRef]
  19. Zhang, W.; Lei, M.; Li, Y.; Wang, P.; Wang, C.; Gao, Y.; Wu, H.; Xu, C.; Niu, L.; Wang, L.; et al. Determination of vertical and horizontal assemblage drivers of bacterial community in a heavily polluted urban river. Water Res. 2019, 161, 98–107. [Google Scholar] [CrossRef]
  20. Lei, M.; Li, Y.; Zhang, W.; Niu, L.; Wang, L.; Zhang, H. Identifying ecological processes driving vertical and horizontal archaeal community assemblages in a contaminated urban river. Chemosphere 2020, 245, 125615. [Google Scholar] [CrossRef]
  21. Li, N.; Chen, Y.; Zhang, Z.; Chang, S.; Huang, D.; Chen, S.; Guo, Q.; Xie, S.; Bing, Y. Response of ammonia-oxidizing archaea to heavy metal contamination in freshwater sediment. J. Environ. Sci. China 2019, 77, 392–399. [Google Scholar] [CrossRef]
  22. Fu, L.; Lu, Y.; Tang, L.; Hu, Y.; Xie, Q.; Zhong, L.; Fan, C.; Liu, Q.; Zhang, S. Dynamics of methane emission and archaeal microbial community in paddy soil amended with different types of biochar. Appl. Soil Ecol. 2021, 162. [Google Scholar] [CrossRef]
  23. Kevorkian, R.T.; Callahan, S.; Winstead, R.; Lloyd, K.G. ANME-1 archaea may drive methane accumulation and removal in estuarine sediments. Environ. Microbiol. Rep. 2021, 13, 185–194. [Google Scholar] [CrossRef]
  24. Watanabe, T.; Kimura, M.; Asakawa, S. Dynamics of methanogenic archaeal communities based on rRNA analysis and their relation to methanogenic activity in Japanese paddy field soils. Soil Biol. Biochem. 2007, 39, 2877–2887. [Google Scholar] [CrossRef]
  25. Zhu, J.; Zhang, J.; Li, Q.; Han, T.; Xie, J.; Hu, Y.; Chai, L. Phylogenetic analysis of bacterial community composition in sediment contaminated with multiple heavy metals from the Xiangjiang River in China. Mar. Pollut. Bull. 2013, 70, 134–139. [Google Scholar] [CrossRef] [PubMed]
  26. Rezaei, M.; Kafaei, R.; Mahmoodi, M.; Sanati, A.M.; Vakilabadi, D.R.; Arfaeinia, H.; Dobaradaran, S.; Sorial, G.A.; Ramavandi, B.; Boffito, D.C. Heavy metals concentration in mangrove tissues and associated sediments and seawater from the north coast of Persian Gulf, Iran: Ecological and health risk assessment. Environ. Nanotechnol. Monit. Manag. 2021, 15. [Google Scholar] [CrossRef]
  27. Elsagh, A.; Jalilian, H.; Ghaderi Aslshabestari, M. Evaluation of heavy metal pollution in coastal sediments of Bandar Abbas, the Persian Gulf, Iran: Mercury pollution and environmental geochemical indices. Mar. Pollut. Bull. 2021, 167, 112314. [Google Scholar] [CrossRef]
  28. Lv, J.; Hu, R.; Wang, N.; Zhu, L.; Zhang, X.; Yuan, X.; Liu, B. Distribution and movement of heavy metals in sediments around the coastal areas under the influence of multiple factors: A case study from the junction of the Bohai Sea and the Yellow Sea. Chemosphere 2021, 278, 130352. [Google Scholar] [CrossRef] [PubMed]
  29. Soon, Y.K.; Kalra, Y.P. SHORT COMMUNICATION: A comparison of plant tissue digestion methods for nitrogen and phosphorus analyses. Can. J. Soil Sci. 1995, 75, 243–245. [Google Scholar] [CrossRef]
  30. Bao, S. Soil Agrochemical Analysis, 3rd ed.; China Agricultural Press: Beijing, China, 2000; Volume 30, pp. 265–267. [Google Scholar]
  31. Miao, L.; Yu, Y.; Adyel, T.M.; Wang, C.; Liu, Z.; Liu, S.; Huang, L.; You, G.; Meng, M.; Qu, H.; et al. Distinct microbial metabolic activities of biofilms colonizing microplastics in three freshwater ecosystems. J. Hazard. Mater. 2021, 403, 123577. [Google Scholar] [CrossRef]
  32. Yu, X.; Zhang, P.; Zhang, J.; Chen, F.; Yang, Y. Characteristics of distribution patterns of microbial biomass and community structures in the sediments from urban river. Acta Sci. Circumstantiae 2020, 40, 585–596. [Google Scholar] [CrossRef]
  33. Husson, O. Redox potential (Eh) and pH as drivers of soil/plant/microorganism systems: A transdisciplinary overview pointing to integrative opportunities for agronomy. Plant Soil 2012, 362, 389–417. [Google Scholar] [CrossRef] [Green Version]
  34. Li, X.; Zhu, Y.-G.; Cavagnaro, T.R.; Chen, M.; Sun, J.; Chen, X.; Qiao, M. Do ammonia-oxidizing archaea respond to soil Cu contamination similarly asammonia-oxidizing bacteria? Plant Soil 2009, 324, 209–217. [Google Scholar] [CrossRef]
  35. Wang, J.; Wang, L.; Zhu, L.; Wang, J. Individual and combined effects of enrofloxacin and cadmium on soil microbial biomass and the ammonia-oxidizing functional gene. Sci. Total Environ. 2018, 624, 900–907. [Google Scholar] [CrossRef] [PubMed]
  36. Mosier, A.C.; Francis, C.A. Relative abundance and diversity of ammonia-oxidizing archaea and bacteria in the San Francisco Bay estuary. Environ. Microbiol. 2008, 10, 3002–3016. [Google Scholar] [CrossRef]
  37. Nahar, K.; Ali, M.M.; Khanom, A.; Alam, M.K.; Azad, M.A.K.; Rahman, M.M. Levels of heavy metal concentrations and their effect on net nitrification rates and nitrifying archaea/bacteria in paddy soils of Bangladesh. Appl. Soil Ecol. 2020, 156. [Google Scholar] [CrossRef]
  38. Liu, Y.-R.; Zheng, Y.-M.; Shen, J.-P.; Zhang, L.-M.; He, J.-Z. Effects of mercury on the activity and community composition of soil ammonia oxidizers. Environ. Sci. Pollut. Res. 2010, 17, 1237–1244. [Google Scholar] [CrossRef] [Green Version]
  39. Ruyters, S.; Mertens, J.; Springael, D.; Smolders, E. Stimulated activity of the soil nitrifying community accelerates community adaptation to Zn stress. Soil Biol. Biochem. 2010, 42, 766–772. [Google Scholar] [CrossRef] [Green Version]
  40. Zhou, Z.F.; Liu, Y.R.; Sun, G.X.; Zheng, Y.M. Responses of soil ammonia oxidizers to a short-term severe mercury stress. J. Environ. Sci. China 2015, 38, 8–13. [Google Scholar] [CrossRef] [PubMed]
Figure 1. The satellite photo of the sampling site. Each sample site was pinpointed with red marks.
Water 13 01545 g001
Figure 2. Shannon (a) and Chao1 (b) indices of the archaeal community from the eight sediment samples.
Water 13 01545 g002
Figure 3. Archaeal community distribution of 8 sample sites at phylum, class and genus levels, respectively. Only relative abundance > 0.01% are shown.
Water 13 01545 g003
Figure 4. Beta diversity analysis: (a) PCA and (b) NMDS showing the differences of separate microbial community composition.
Water 13 01545 g004
Figure 5. Taxonomic cladogram of LEfSe analysis. Different colors indicate different groups whereas yellow indicates non-significance in abundance among groups.
Water 13 01545 g005
Figure 6. RDA analysis reflecting the correlation between the archaeal community and environmental factors.
Water 13 01545 g006
Figure 7. Venn diagram representing the VPA result. The red circle represents physicochemical factors and the green circle represents heavy metals. The residual value is 0.305.
Water 13 01545 g007
Table 1. Physicochemical parameters and heavy metal concentration of each sampling site from the Shiqiao River.
SampleABCDEFGH
TN4997 ± 153 2013 ± 98.5 2115 ± 235 2693 ± 120 2228 ± 24.9 3294 ± 134 2974 ± 20.3 3077 ± 235
TP1681 ± 114 368 ± 27.0 728 ± 90.3 724 ± 7.41 501 ± 34.1 891 ± 72.4 947 ± 3.13 817 ± 11.0
NO3-N104.0 ± 3.46 31.0 ± 1.40 47.0 ± 4.57 55.0 ± 4.64 37.0 ± 1.30 63.0 ± 0.82 57.0 ± 0.29 49.0 ± 4.75
NH4+-N388 ± 38.5 67.0 ± 19.0 168 ± 8.63 148 ± 59.4 87 ± 18.1 193 ± 7.46 132 ± 11.3 105 ± 10.6
pH7.36 ± 0.030 7.54 ± 0.000 7.42 ± 0.040 7.55 ± 0.020 7.57 ± 0.060 7.60 ± 0.060 7.56 ± 0.050 7.55 ± 0.030
TOC23.15 ± 0.400 14.82 ± 0.280 15.36 ± 0.020 17.76 ± 0.140 17.86 ± 0.620 18.81 ± 0.170 16.42 ± 0.110 18.04 ± 0.040
ORP−23.0 ± 2.36 −19.0 ± 1.89 −38.0 ± 1.41 −27.0 ± 6.13 −26.0 ± 2.36 −19.0 ± 3.77 −29.0 ± 1.89 −2.00 ± 0.00
Cr60.0 ± 0.24 100 ± 13.91 72.0 ± 6.85 69.0 ± 2.47 90.0 ± 8.88 47.0 ± 0.09 61.0 ± 9.27 55.0 ± 2.26
Ni35.0 ± 6.22 46.0 ± 3.94 36.0 ± 6.41 40.0 ± 10.8 49.0 ± 12.2 17.0 ± 1.29 23.0 ± 10.4 24.0 ± 1.25
Cu145 ± 85.85 52.0 ± 1.94 30.0 ± 7.15 44.0 ± 27.4 73.0 ± 35.6 18.0 ± 2.36 18.0 ± 7.12 21.0 ± 1.19
Zn240 ± 72.0 176 ± 33.7 153 ± 37.6 419 ± 114 538 ± 196 120 ± 23.3 194 ± 3.15 409 ± 135
As10.0 ± 1.02 10.0 ± 0.660 10.0 ± 0.340 12.0 ± 0.62014.0 ± 5.01 13.0 ± 6.41 10.0 ± 3.23 11.0 ± 3.17
Cd0.480 ± 0.190 0.390 ± 0.100 0.120 ± 0.020 0.340 ± 0.240 1.10 ± 0.020 0.120 ± 0.0200.160 ± 0.030 0.380 ± 0.160
Pb29.0 ± 5.45 28.0 ± 0.000 24.0 ± 3.12 29.0 ± 12.7 37.0 ± 2.43 20.0 ± 0.860 26.0 ± 2.37 27.0 ± 3.45
Hg0.158 ± 0.070 0.088 ± 0.020 0.046 ± 0.010 0.044 ± 0.020 0.101 ± 0.000 0.036 ± 0.010 0.035 ± 0.000 0.066 ± 0.020
Note: TP, total phosphorus; TN, total nitrogen; TOC, total organic carbon; ORP, oxidation reduction potential. The unit of TN, TP, NO3-N, NH4+-N, Cr, Ni, Cu, Zn, As, Cd, Pb and Hg is mg/kg. The unit of TOC is g/kg. The unit of ORP is mV.
Table 2. The environmental factors and their corresponding RDA1, RDA2, R2 and p values.
FactorsRDA1RDA2R2p Values
Eh 0.9400.3420.3100.021
As 0.050−0.9990.2660.024
TP −0.795−0.6060.2400.058
Cr 0.1150.9930.2320.073
Cu −0.9790.2060.1950.100
Zn 0.9560−0.2820.0900.400
Pb 0.1990.9800.0730.448
Cd 0.1120.9940.0680.490
Publisher’s Note: MDPI stays neutral with regard to jurisdictional claims in published maps and institutional affiliations.

