
Ion-Exchange Technology for Lactic Acid Recovery in Downstream Processing: Equilibrium and Kinetic Parameters


1
Chemical Engineering Department, Escola d’Enginyeria de Barcelona Est (EEBE), Universitat Politècnica de Catalunya (UPC)-BarcelonaTECH, C/Eduard Maristany 10-14, Campus Diagonal-Besòs, 08930 Barcelona, Spain
2
Barcelona Research Center for Multiscale Science and Engineering, Campus Diagonal-Besòs, 08930 Barcelona, Spain
3
Chemical Engineering Department, School of Industrial Engineering—CINTECX, University of Vigo, Campus As Lagoas-Marcosende, 36310 Vigo, Spain
4
Water Technology Center (CETAQUA), Carretera d’Esplugues, 75, 08940 Cornellà de Llobregat, Spain
*
Author to whom correspondence should be addressed.
†
These authors contributed equally to the work.
Water 2021, 13(11), 1572; https://doi.org/10.3390/w13111572
Submission received: 7 April 2021
/
Revised: 18 May 2021
/
Accepted: 31 May 2021
/
Published: 2 June 2021
(This article belongs to the Special Issue Wastewater Treatment by Adsorption and/or Ion-Exchange Processes for Resource Recovery)
Abstract
:The downstream processing for the separation and purification of lactic acid is a hot research area in the bio-refinery field due to its continuous growing market in different sectors, such as the food, cosmetic and pharmaceutical sectors. In this work, the use of ion-exchange technology for lactic acid recovery is proposed. For that, four anion exchange resins with different polymer structures and functional groups were tested (A100, MN100, A200E and MP64). The sorption process was optimized by the Box–Behnken factorial design, and the experimental data obtained in the sorption process were analyzed by using the response surface methodology and fitted at different isotherms and kinetics models. Moreover, regenerant type, contact time and solid/liquid ratio were evaluated in the desorption process. Results showed that the best resin for lactic acid removal was A100, at pH = 4, with a resin/lactic acid solution ratio of 0.15 g/mL during a maximum of 1 h, achieving 85% of lactic acid removal. Moreover, equilibrium data sorption of lactic acid onto A100 resin was fitted by a Langmuir isotherm and by a kinetic model of a pseudo-second order. In addition, in the desorption process, it was stablished that a resin/regenerant ratio of 0.15 g/mL during 30 min with 0.1 M of NaOH solution provided the best results (4.45 ± 0.08 mg/g).
1. Introduction
Lactic acid is an alpha-hydroxy acid with dual functional groups, is considered both an alcohol and an acid and has an asymmetric carbon that confers optical activity. It can be found in two optically active forms, levorotatory L (+)-lactic acid and dextrorotatory D (−)-lactic acid, or in racemic form, which is a mixture of L (+)-lactic acid and D (−)-lactic acid [1]. The ratio of each isomer confers different physical properties to the final product, which makes enantiomeric purity a crucial factor for the industrial production of lactic acid, such as in the manufacture of biodegradable plastics and polymers such as polylactic acid [1,2].
Regarding lactic acid production, it can be mainly obtained by two routes:
- chemical synthesis from non-renewable sources, such as coal, petroleum products and natural gas. In this case, it is mainly based on the hydrolysis of lactonitrile by strong acids, but it can also include base-catalyzed degradation of sugars, oxidation of propylene glycol, hydrolysis of chloropropionic acid, oxidation of propylene by nitric acid and reaction of acetaldehyde, carbon monoxide and water at high temperatures and pressures [2,3]; and secondly by
- fermentation, from different renewable substrates, such as starchy materials (e.g., corn, maize, rice, rye, wheat, potato, barley and cassava), lignocellulosic biomass (from agricultural, agro-industrial and forestry sources), microalgae, food waste (e.g., vegetables, meat, etc.) and glycerol [4]. Low temperatures, low energy consumption, better environmental concerns and high purity are some of the advantages of the fermentative route over chemical synthesis [5]. Consequently, 90% of lactic acid production is done by fermentation, since pure lactic acid can be obtained, whereas the chemical synthesis it always gives a racemic mixture [6]. Moreover, the fermentation route is considered a “bio-refinery” alternative, which relies within the circular economy approach.
Furthermore, lactic acid is a worldwide consolidated bioproduct. The industrial interest of lactic acid is widespread, as it is used in different sectors, such as the food and pharmaceutical industries, especially the L (+)-lactic acid isomer; meanwhile, the D (−)-lactic acid isomer is considered harmful to humans and can cause acidosis or de-calcification in high doses [4,6,7,8,9]. For instance, lactic acid presents a large demand share in the food industry (35%) as an acidulant, due to its mild acid taste compared to other acids used in food, and as a preservative in olives and pickled vegetables. It is also used as a flavoring agent, pH regulator and inhibitor of residual bacteria in food processing, such as in candies, breads, soft drinks, beer and other products. Moreover, it is an essential ingredient in fermented foods, such as yogurt, butter and canned vegetables. In the pharmaceutical industry, lactic acid is used in implants, pills, dialysis, surgical sutures and controlled drug-release systems; meanwhile, in the cosmetic industry, lactic acid is used in the manufacture of hygiene and aesthetic products due to its moisturizing, antimicrobial and rejuvenating properties on the skin, as well as in oral hygiene products [1,9].
On the other hand, although the market of lactic acid is constantly growing, its production by fermentation presents two main bottlenecks: (i) the cost of carbon sources and (ii) the cost of sterilization and downstream separation and purification processes [3,10]. The former limitation can be solved by using low-cost and renewable substrates as mentioned above, but they must be saccharificated by physicochemical and enzymatic treatments before use them as a carbon source [11]. The conventional lactic acid recovery is carried out by chemical precipitation. Nowadays, several techniques have been reported on the separation of lactic acid produced in the fermentation broth without precipitation such as diffusion dialysis, solvent extraction, direct distillation, liquid surfactant membrane extraction, adsorption, chromatographic methods, ultrafiltration, reverse osmosis, drying or electrodialysis with monopolar and bipolar membranes [12]. Among them, ion-exchange technology, using resins, can be proposed to recover lactic acid from fermentation media, improving the later weakness; since it is an in situ recovery technique with potential to not only recover lactic acid but also release product inhibition [13].
The recovery of lactic acid obtained by fermentation media or from synthetic solutions has been studied by different authors over the years [14,15,16,17,18,19,20,21,22,23,24,25,26,27,28,29]. In these studies, the most commonly used resin was Amberlite IRA 400 [16,17,18,23,27,28]. The IRA 400 is a gel-type strong base resin, with quaternary ammonium groups. For instance, Moldes et al. [16,18] tested four ion-exchange resins types (Amberlite IRA 900, IRA 400, IRA 96 and IRA 67) for lactic acid recovery from simultaneous saccharification and fermentation (SSF) media. Among them, Amberlite IRA 400 and IRA 900, both strong anion exchange resins, showed the highest capacities for lactic acid recovery. Moreover, the Amberlite IRA 400 resin was selected for intermittent lactic acid separation in a typical SSF process, in which pretreated wood was saccharified by cellulases in the presence of Lactobacillus delbrueckii [16]. Weak anion exchange resins, such as IRA 96 [16,18,24,27] and IRA 67 [16,18,27,29], were also used. For instance, Ahmad et al. [29] proposed the extraction of lactic acid from the fermentation broth by a weak anion exchanger, Amberlite IRA 67, followed by a cation exchanger, Amberlite IR 120. They observed that the maximum adsorption capacity of lactic acid (150 mg/g) was observed with weak anion resin at an initial pH of 3. Lastly, other resins found in the literature for lactic acid recovery were Indion 850, Indion 860, Indion 810, Indion 190 (the first two resins are weak base macroporous and the last two are strong base microporous) [21] and resins from Chinese companies (such as D314, D311 and 331 from Anhui Sanxing Resin Technology Co. (Hochi, Anhui, China); 313, D301 and D319 from Suqing Group (Jinagsu, China); D302 and 201 × 4 from Nansen Hangzhou Water Treatment Equipment Co. (Hangzhou, China) [25]; D354, D380, D941, D396 and D293 from Zhengzhou Qinshi Science and Technology Development Co. (Henan, China); and resins D301, D315, 335, D201 and 717 from Shanghai Zhenhua Technology Development Co. (Shanghai, China) [26]).
In view of the aforementioned, the aim of this study is to evaluate novel types of anionic exchange resins for the lactic acid recovery: one strong base with quaternary ammonium groups gel-type resin (A200E), one weak base containing tertiary amine groups resin with macroporous structure (A100), a weak base macroporous resin containing mixtures of quaternary ammonium and tertiary amine groups (MP64) and a free base macroporous hyper-crosslinked resin containing tertiary amine groups (MN100) in order to evaluate the sorption of lactic acid from water. It should be highlighted that this is the first time that these resins have been evaluated for the recovery of lactic acid. First, sorption optimization was carried out by surface response methodology, being the pH, resin/lactic acid solution ratio and contact time the independents variables. Then, the lactic acid sorption was fitted by different isotherm and kinetic models. Finally, the desorption process was also evaluated changing the type of regenerant, contact time and resin/regenerant ratio.
2. Materials and Methods
2.1. Reagents
Synthetic solutions were prepared by mimicking fermentation media with L (+)-lactic acid (C3H6O3, 85%) purchased from Sigma-Aldrich. Hydrochloric acid (HCl, 37%) was used for resin conditioning and sodium hydroxide (NaOH, 98%) was used for pH adjustment and desorption step, both were supplied by Panreac (Barcelona, Spain). Moreover, sodium hydrogen carbonate (NaHCO3, 99% from Fluka (Madrid, Spain)), anhydrous sodium carbonate (Na2CO3, 99.8% from Panreac (Barcelona, Spain)) and methanosulfonic acid (CH4O3S, 99% from Sigma-Aldrich (Madrid, Spain)) were used as reagents in the analytical chromatography analysis.
2.2. Resins
The anion exchange resins used in this work consisted of A100, MN100 and A200E from Purolite Ltd. (Barcelona, Spain) and MP64 supplied by Lanxess Co. (Cologne, Germany). Before their use, all resins were converted into Cl− form by washing the resin sequentially with 1 M HCl solution during 1 h, and then distilled water until pH = 7. Table 1 shows the main characteristics of the resins.
2.3. Resin Selection
Batch experiments were carried out with two different lactic acid concentrations (1 and 10 g/L) at pH > pKa lactic acid (about 6) and four resins (A100, MN100, A200E and MP64) (Barcelona, Spain), using a resin/solution ratio of 0.1 (1 g: 10 mL, w/v) during 24 h in an overhead shaker (Heidolph Reax 2 from Sigma-Aldrich (Madrid, Spain)). After the sorption process, resins were desorbed with 1 M NaOH at the same ratio as adsorption process during 24 h.
2.4. Sorption Process Optimization by Box–Behnken Design
In order to evaluate the optimal sorption capacity and removal efficiency of lactic acid, a Box–Behnken factorial design was applied [34,35]. For that, an incomplete 33 factorial design was established to obtain theoretical models that define the most favorable conditions for the removal of lactic acid by using the selected resin. The independent variables selected were pH of the lactic acid solution (x1), resin/solution ratio (x2) and contact time (x3); the dependent variables were the adsorption capacity (y1), percentage of lactic acid removal (y2), desorption capacity (y3), and percentage of lactic acid recovery (y4). The 15 experiments established by the factorial design were carried out in an overhead shaker by fixing the lactic acid concentration at 1 g/L. Table 2 shows the variation range established for the independent variables selected, which were codified between −1 and 1 in order to limit the influence of their magnitudes.
The desorption process for the 15 experiments was carried out with 1 M NaOH, at the same solid/liquid ratio and contact time as for the adsorption process tested.
2.4.1. Sorption Isotherms Models
Different isotherms were used to study the sorption process at the equilibrium condition as described in previous works [36]. For instance, the Langmuir isotherm is described by Equations (1) and (2) [37], the Freundlich isotherm by Equation (3) [38], the Dubinin–Radushkevich isotherm by Equations (4) and (5) [39] and the Temkin isotherm by Equations (6) and (7) [40]. All of these equations have been used in this work in order to evaluate the isotherm model that fitted better under the optimal operational conditions previously predicted by the Box–Behnken model. This equilibrium study was carried out by using different initial concentrations of lactic acid, namely 10, 6, 4, 2, 1, 0.5 and 0.1 g/L, and a contact time of 24 h, taking into account the optimal pH and resin/lactic acid solution ratio obtained in the previous stage with the design model.
In these equations, qe (mg/g) is the resin capacity at equilibrium and qm (mg/g) is the maximum theoretical capacity that can be reached; C0 (mg/L) and Ce (mg/L) are the initial and equilibrium lactic acid concentration in the aqueous phase, respectively; KL (mg/L) is the Langmuir equilibrium constant and RL is a dimensionless equilibrium parameter; KF (L/g) is related to the adsorption capacity, and n is associated with the sorption intensity (g/L). In addition, (mol2/J2) is a constant related to the sorption energy, R (8.314 J/mol K) is the ideal gas constant; T (298.15 K) is the temperature of sorption; and E (kJ/mol) is the mean free energy of adsorption per molecule of adsorbate when transferred to the surface of the solid from infinity in solution. Finally, KT (L/mg) is the equilibrium binding constant (maximum binding energy); B1 (J/mol) is related to the heat of sorption; R is the universal gas constant (8.314 J/mol K); T is the temperature at 298 K; and b is the Temkin isotherm constant.
2.4.2. Adsorption Kinetic Models
In addition, at the optimal operational conditions predicted by the Box–Behnken model, a kinetic study was carried out and the experimental data obtained were adjusted to four kinetic models described in previous works [41,42]. The pseudo-first order kinetic model is described by Equation (8) [43], the pseudo-second-order kinetic model by Equation (9) [44], Chien–Clayton kinetic model by Equation (10) [45] and intraparticle diffusion model by Equation (11) [46]. In this work, the kinetic study was developed by using different contact times, namely 0, 2, 4, 6, 8, 10, 12, 14, 20, 30, 40, 50, 60 and 90 min, and an initial lactic acid concentration of 1 g/L at the optimal pH and resin/lactic acid solution ratio obtained in the previous stage with the design model.
In these equations, qe (mg lactic acid/g resin) and qt (mg lactic acid/g resin) are the amount of adsorbed lactic acid at equilibrium and at a defined time t (min), respectively; K1 (1/min) is the rate constant of pseudo-first-order adsorption; K2 (g/mg min) is the equilibrium rate constant of pseudo-second-order sorption; α (min mg/g) is the initial sorption rate; β (g/mg) is related to the extent of surface coverage and activation energy for chemisorption; KP is the intraparticle diffusion rate constant (mg/g min0.5); and C is the intercept (mg/g), and it is related to the thickness of the boundary layer.
2.5. Desorption Process Optimization
Desorption step was evaluated by changing (i) the type and concentration of regenerant: NaOH (0.1, 0.5 and 1 M), ethanol (0.1, 0.5 and 1 M) and equimolar mixture of NaOH/ethanol (0.1, 0.5 and 1 M); (ii) the contact times of 2, 4, 6, 8, 10, 12, 14, 20, 30, 40, 50, 60 and 90 min, as well as 2, 4, 6, 8 and 24 h; and (iii) the resin/regenerant ratio (w:v, g/mL) at 0.075, 0.15 and 0.3. Table 3 shows the experimental design to evaluate the type and concentration of the regenerant, contact time and ratio in the desorption process of lactic acid, fixing the adsorption conditions predicted by the Box–Behnken model.
2.6. Data Analysis
Sorption and desorption capacities were calculated following the procedure described elsewhere [47]. The resin sorption capacity (qads, mg lactic acid/g resin) was calculated by Equation (12), and Equation (13) was applied to determine the percentage of lactic acid removed from the solution:
where C0 is the initial concentration of the lactic acid (mg/L), Ce is the lactic acid at the end of sorption (equilibrium) (mg/L), Vsolution is the volume of lactic acid solution used for sorption (L) and resin mass is the amount of resin mass used for the experiments (g).
On the other hand, the resin desorption capacity (qdes, mg lactic acid/g resin) is described by Equation (14):
where Ce is the lactic acid concentration at the end of desorption process (mg/L), Vregenerant is the volume of regenerant (e.g., NaOH) used for desorption (L) and mass resin is the amount of mass resin used for the experiments (g).
Consequently, the percentage of lactic acid recovery can be established by the relationship between adsorption capacity and desorption capacities of the resin. This parameter (lactic acid recovery percentage, %) was calculated by Equation (15):
where qdes is the desorption capacity (mg/g) and qads is the sorption capacity (mg/g), described in Equations (14) and (12), respectively.
2.7. Analytical Methodology
Lactic acid was determined by cationic and anionic chromatography systems (Dionex ICS-1000 and ICS-1100, respectively) supplied by Thermo-Fisher Scientific (Barcelona, Spain). Both devices were controlled by Chromeleon chromatographic software from the same company. Moreover, a CS16 column (5 × 250 mm2) and an AS23 column (4 × 250 mm2) with their precolumns (CG16 (5 × 50 mm2) and AG23 (4 × 50 mm2)) (Dionex, Barcelona, Spain) were used for cation and anion determination and quantification, respectively. The mobile phase used for each system was 0.03 M CH4O3S for cation equipment and 0.8 mM NaHCO3 and 4.5 mM Na2SO3 for anion apparatus. Before ion chromatography analyses, the samples were filtered by using a 0.22 μm filter.
2.8. Statistical Analysis
Triplicate experiments were performed in order to increase the accuracy of the results. Thus, data are reported as the mean ± standard deviation of triplicate determinations. Data were subjected to analysis of variance (Fisher’s F-test and Student’s t-test) performed by using the excel statistical software package. Significant differences were assessed at p < 0.05.
Moreover, the experimental data obtained in the sorption process were analyzed by using the response surface method with Design-Expert® Version 12 (Stat-Ease, Inc., Minneapolis, MN, USA) by fitting the results obtained to a quadratic function shown in Equation (16):
where y is the dependent variable of each experiment (adsorption capacity, lactic acid removal, desorption capacity and lactic acid recovery); βi represents the regression coefficients, which were calculated from experimental data by performing multiple regressions, using the least-squares method; and xi represents the independent variables of this study (pH, solid/liquid ratio and contact time).
y = β0 + β1 x1 + β2 x2 + β3 x3 + β12 x1x2 + β13 x1x3 + β23 x2x3 + β11 x12 + β22 x22 + β33 x32
3. Results and Discussion
3.1. Ion-Exchange Resins Screening for Lactic Acid Extraction
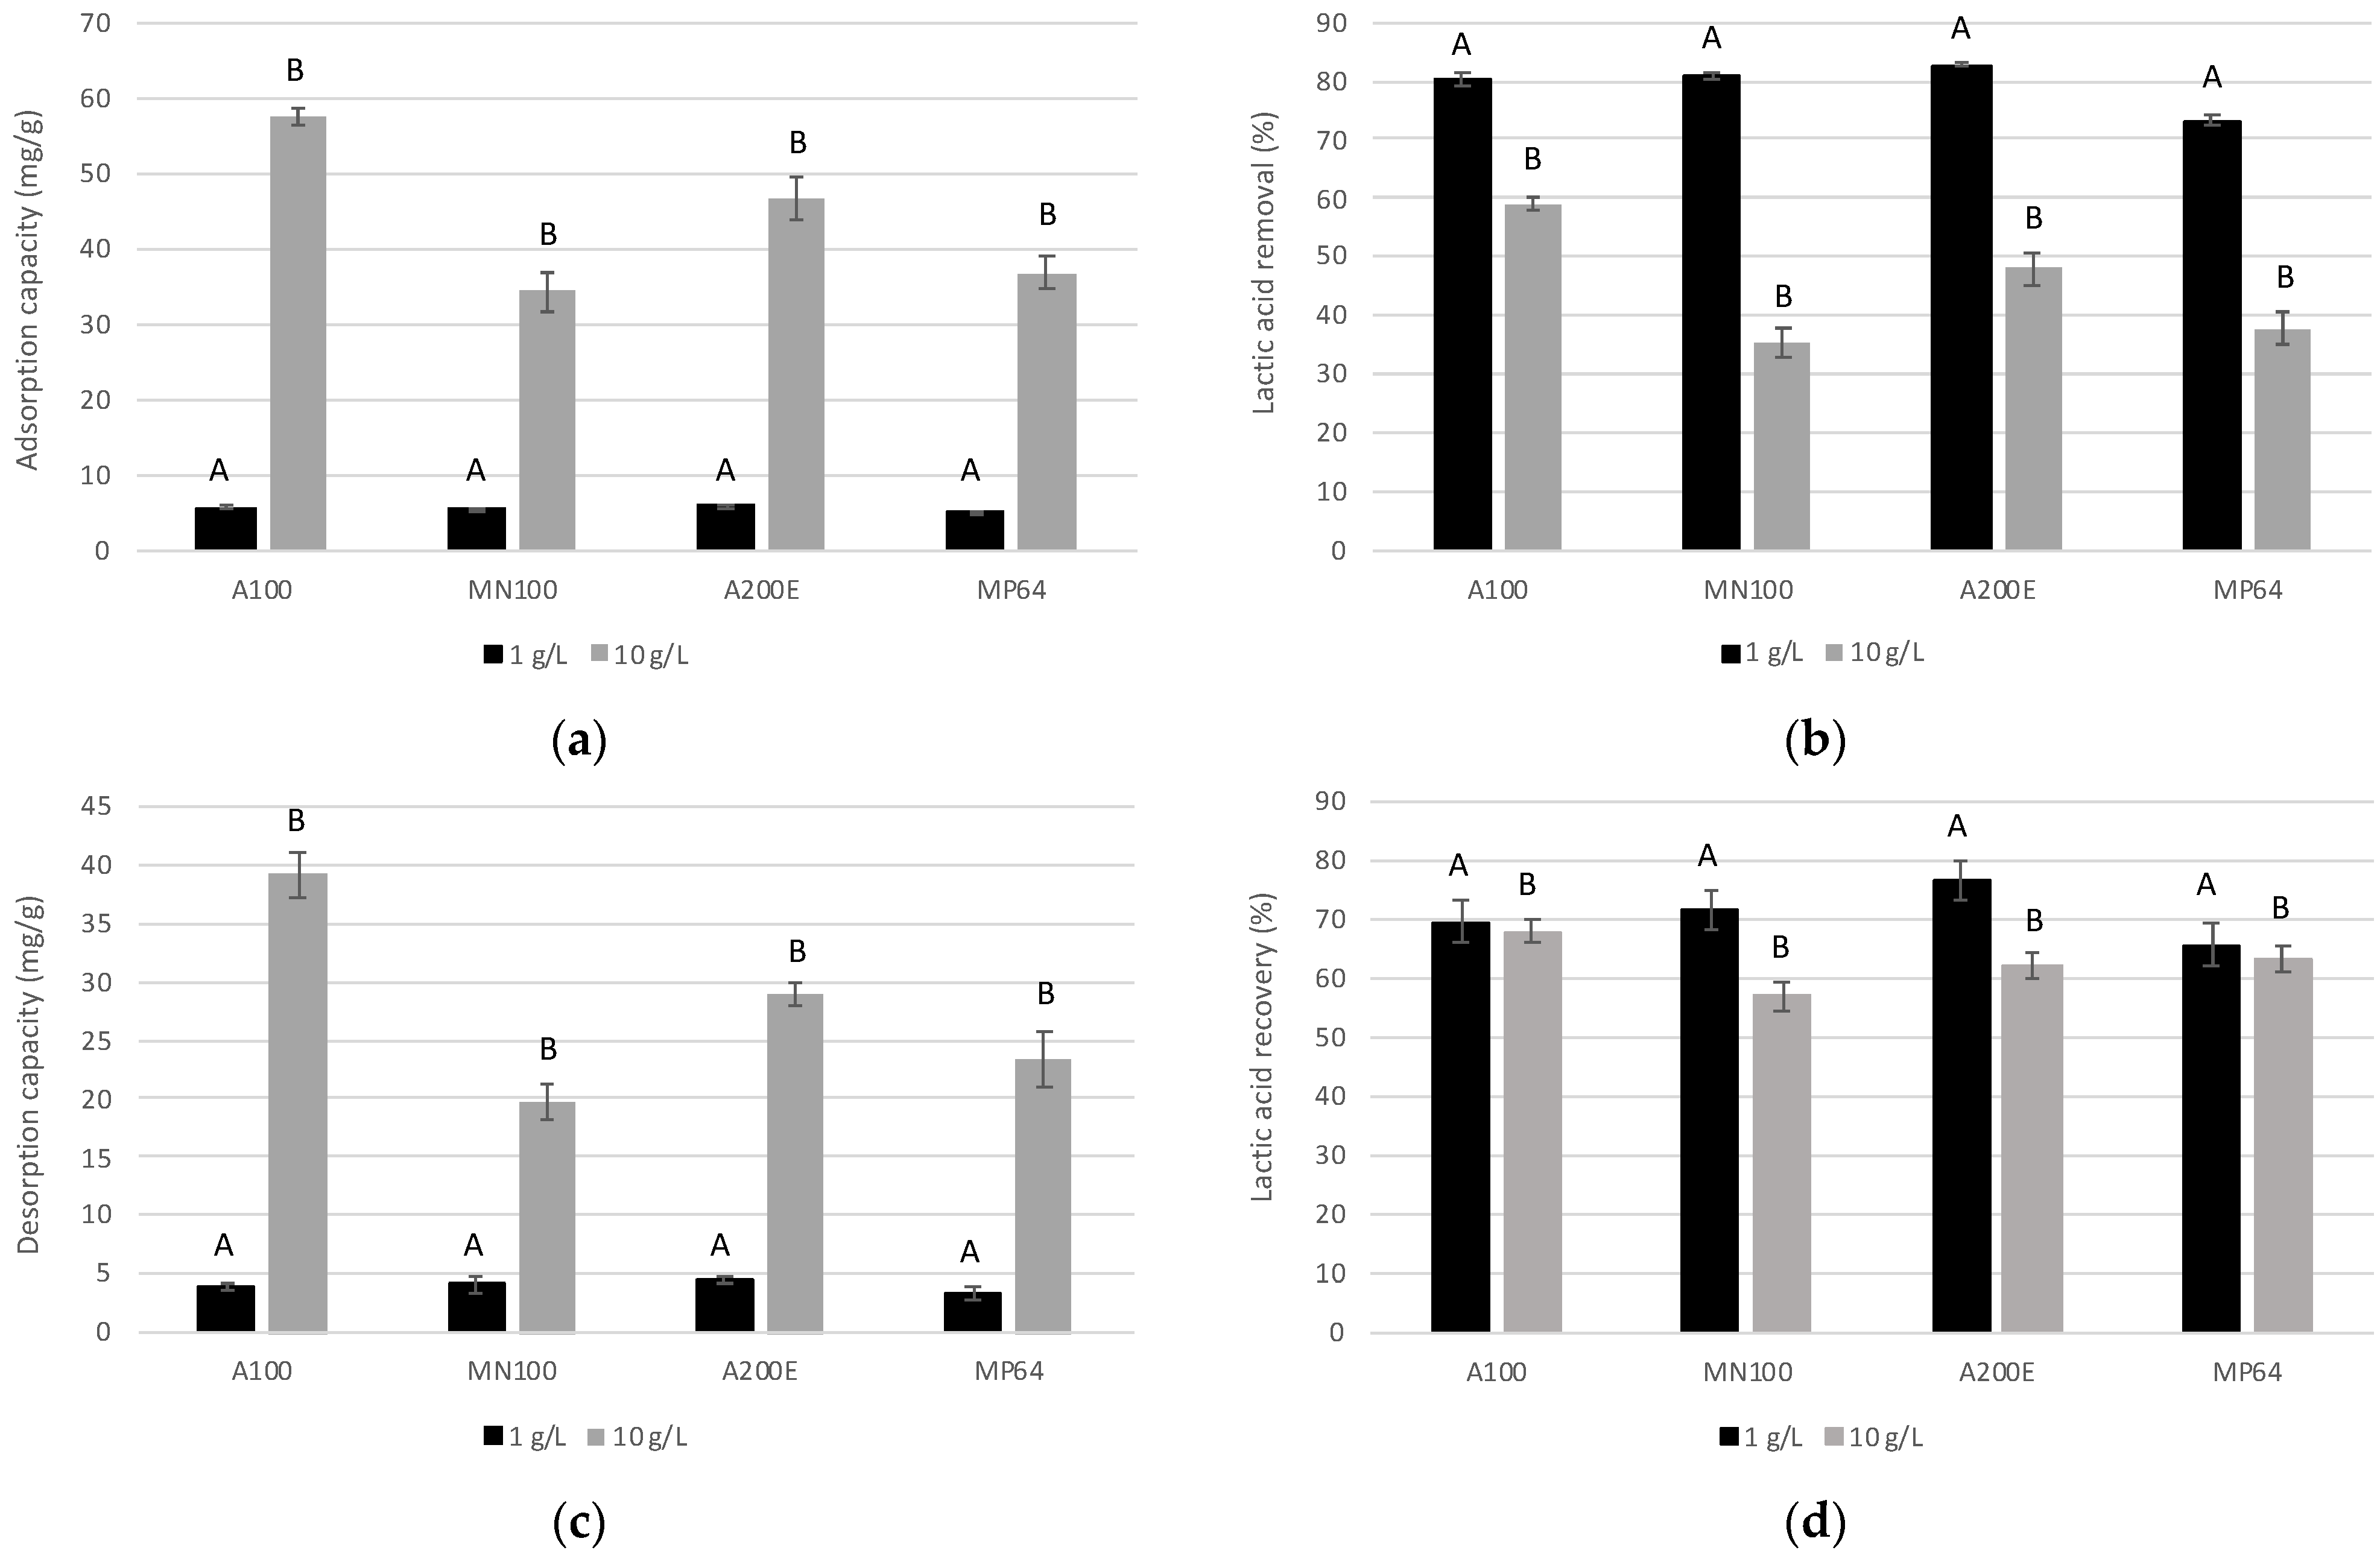
For the selection of the anion exchange resin, the results of the sorption capacity and percentage of lactic acid extracted were obtained in relation to the sorption process (represented in Figure 1a,b, respectively). On the other hand, for the desorption process, desorption capacity and percentage of lactic acid recovery were calculated and plotted in Figure 1c,d, respectively. For each resin, initial concentrations of 1 and 10 g/L of lactic acid were tested.
The sorption capacity was 5.6 ± 0.3 mg/g (average) for all anion exchange resins tested at 1 g/L of lactic acid, whereas it increased up to from 34.3 mg/g, using the MN100 resin, to 57.5 mg/g for A100 resin. The same behavior was observed for the desorption capacity, being a minimum desorption capacity of 4.0 ± 0.4 mg/g (average) for 1 g/L of lactic acid and a maximum of 39.1 mg/g at 10 g/L for A100 resin. Although at 10 g/L of lactic acid, both sorption and desorption capacities varied slightly according to the type of resins, they were not significantly different (p > 0.05).
Regarding to the lactic acid extraction, A100, MN100 and A200E resins provided the maximum value of 81.3 ± 1.2% (average) at 1 g/L. At 10 g/L of lactic acid, A100 and A200E resins achieved values about 50–60%, whereas the lactic acid extraction value decreased up to 36.5 ± 1.7% (average), using the MN100 and MP64 resins. This fact may be due to the fact that the former resins are made of a polystyrene crosslinked with divinylbenzene matrix, while the latter resins are only based on a polystyrene matrix.
Finally, the lactic acid recovery was practically the same, 67 ± 6.1% (average), regardless of the concentration of lactic acid used (1 or 10 g/L). Although, there were no significant differences between the resins evaluated (p > 0.05), the resin that reported the best recovery values, for both concentrations of lactic acid, was the A100 resin. Therefore, only this resin was used in the following assays.
To our knowledge, the resins tested in this work were not studied for lactic acid sorption/desorption previously. For instance, resins A100, MN100 and MP64 have been applied for the recovery of metals [48], halogenated compounds [49], aurocyanide extraction [50], natural organic matter [51,52], dissolved organic matter removal [53] and humic substances removal [54], but no for lactic acid recovery.
However, the removal efficiency of lactic acid as function of different lactic acid concentrations was also studied by other authors, by using other resins. For example, Luongo et al. [27] observed that lactic acid removal efficiency decreased from 68% to 27% at the same time as the initial lactic acid concentration increased from 1.4 to 18.0 g/L, using Amberlite IRA 900 resin at 30 °C. Moreover, Amberlite IRA 400 showed a significant decrease from 71% to 32% in the lactic acid removal efficiency at the same temperature, when increasing the initial lactic acid concentration. Instead, the weak anionic resins, Amberlite IRA 96 and Amberlite IRA 67, showed minimal changes in the removal efficiencies at the tested initial lactic acid concentrations. Similarly, in this work, lactic acid removal and recovery decreased when increasing the initial lactic acid concentration from 1 to 10 g/L (Figure 1b,d). Otherwise, adsorption and desorption capacities increased when testing higher initial lactic acid concentration (Figure 1a,c).
3.2. Optimization of Sorption Process for Lactic Acid Recovery Using Response Surface Methodology
The set of experimental conditions assayed (expressed as coded variables) and the experimental data obtained for the dependent variables y1 to y4 are shown in Table 4.
As can be seen in Table 4, the maximum lactic acid removal value from the Box–Behnken factorial design was 85.3% (Experiment 8), achieved with pH = 4 (low value), ratio 0.15 g/mL (high value) and contact time of 5 h (intermediate value).
In regards with capacities, both sorption and desorption, Experiment 1 (pH 4, ratio 0.05 g/mL and time 5 h) presented better results than Experiment 8 (pH 4, ratio 0.15 g/mL and time 5 h). The only difference between these two experiments was their solid/liquid ratio, where Experiment 1 was carried out with a ratio of 0.5 g: 10 mL, while Experiment 8 with a ratio of 1.5 g: 10 mL, meaning that the later test did not have enough lactic acid solution for a larger amount of resin. Furthermore, a clear positively trend, based on sorption capacity, can be seen when the solid/liquid ratio tested was the lower. Therefore, experiments with a ratio of 0.05 g/mL were best suited to sorb and desorb lactic acid in a more efficient manner, with a sorption capacity range between 21 and 28 mg lactic acid/g resin and a desorption capacity range between 17 and 20 mg lactic acid/g resin.
On the other hand, the experiment at conditions of pH 8, ratio 0.1 g/mL and contact time of 9 h (corresponding to Experiment 7) presented the highest recovery percentage, reaching 88% of the lactic acid recovery. Compared to the Experiment 8 (at pH 4, ratio 0.15 g/mL and contact time of 5 h), 76% of lactic acid was recovered, but the former experiment (Experiment 7) was developed at a higher pH, with a lower solid/liquid ratio and with a longer contact time. Under the above conditions, Experiment 7 reported better results than Experiment 8 due to the fact that a such high pH, it had more lactate ions in the solution than Experiment 8, which a pH 4 was very close to the pKa(298K) of lactic acid (HL/L−) (3.86).
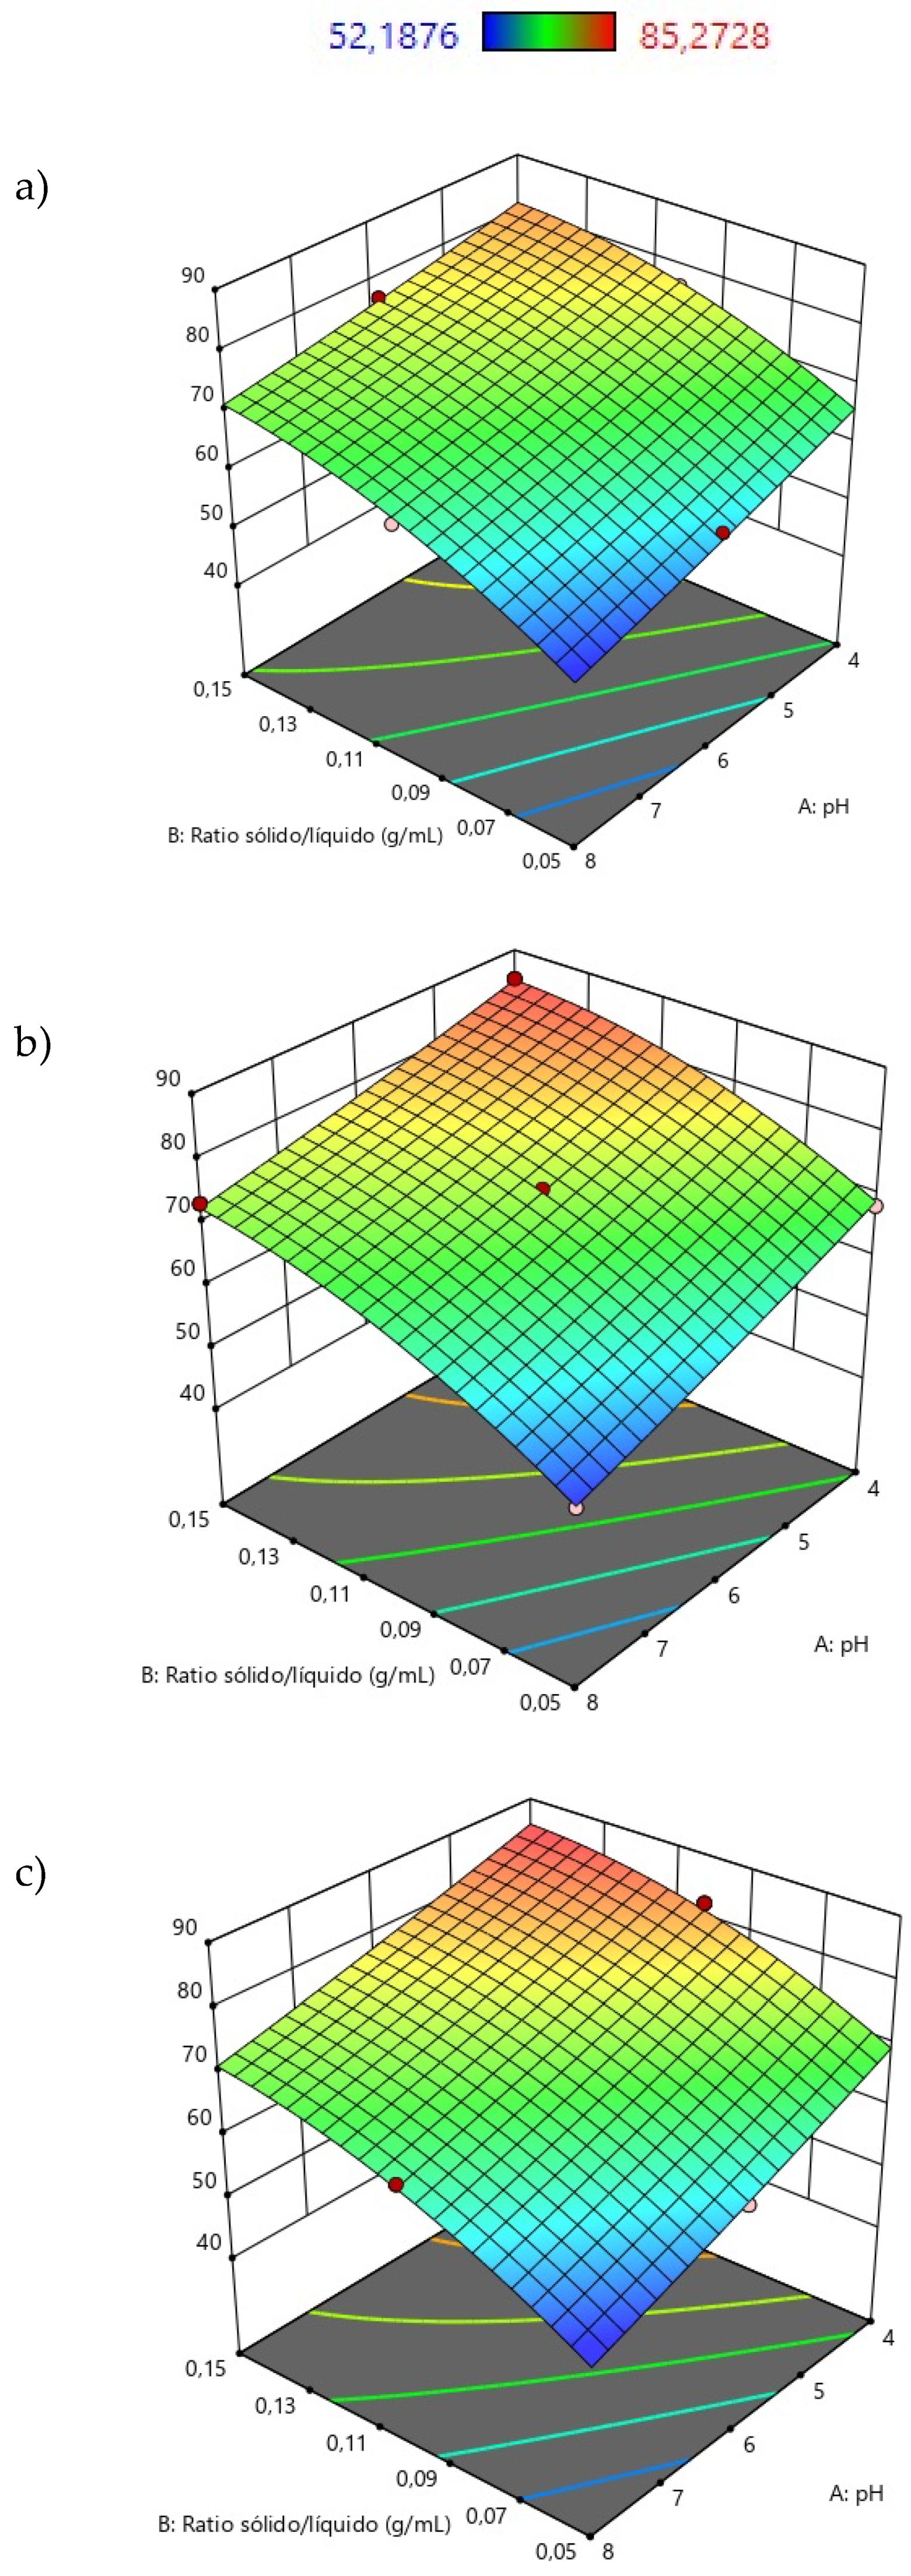
In the case of percentage of lactic acid extracted, the pH (x1) and the solid/liquid ratio (x2) were the only statistically significant variables (p < 0.05), while the contact time effect was negligible. For that, the variation of the lactic acid extraction percentage for the abovementioned independent variables (pH and solid/liquid ratio) as the most statistically significant, with a fixed contact time (x3) of 1 (Figure 2a), 5 (Figure 2b) and 9 h (Figure 2c), is showed in Figure 2.
The same trend is observed, in the graphs of Figure 2, where the best percentage of lactic acid sorption was obtained for the conditions of pH 4 and resin/solution ratio of 0.15 g/mL. Based on these results, it can be established that the highest lactic acid extraction was achieved for the highest solid/liquid ratio and the lower pH, regardless of the contact time.
Similar findings were reported by Luongo et al. [27]. The effect of pH on the lactic acid sorption was studied. The two strong anionic resins tested, IRA 900 and IRA 400, showed a similar trend, both effective at a pH above the pKa (3.86) of lactic acid. At pH 5.0, the highest lactic acid removal efficiency was between 44 and 47% for IRA 900 and between 49 and 50% for IRA 400, respectively. However, the lactic acid removal efficiency did not change significantly for pH > 5.0. Otherwise, for the tertiary amine resins, IRA 96 and IRA 67, showed high selectivity at a pH below the lactic acid pKa, reaching both the highest removal efficiency > 99% at pH 2.0. On the other hand, the contact time for lactic acid adsorption was established 20 min of operation, regardless of the initial concentration of lactic acid.
For a tertiary resin (A100), described for simplicity reasons as P-R2N, where P is the polystyrene divinyl benzene structure and R are the alkyl chains of the tertiary amine group of the resin, the extraction of lactic acid (HL) could be described by a combination of the reactions involving both the solute (Equation (17)) and the adsorbent (Equations (18) and (19)):
- (a)
- Protonation of the tertiary amine group:P-R2Nres +H++Cl− <==> P-R2NH+ Cl− res
- (b)
- Adsorption of lactic acid (HL) and lactate anion (L−):P-R2NH+ Cl− res + L− <==> P-R2NH+ L− res + Cl− (pH > pKa(HL/L−))P-R2NH+ Cl− res + HL <==> P-R2NH+ L− res + H+Cl− (pH < pKa(HL/L−))
3.2.1. Lactic Acid Sorption Isotherms
Table 5 shows the equilibrium parameters for A100 tertiary resin, which were calculated by linear regression, for each isotherm (for average data).
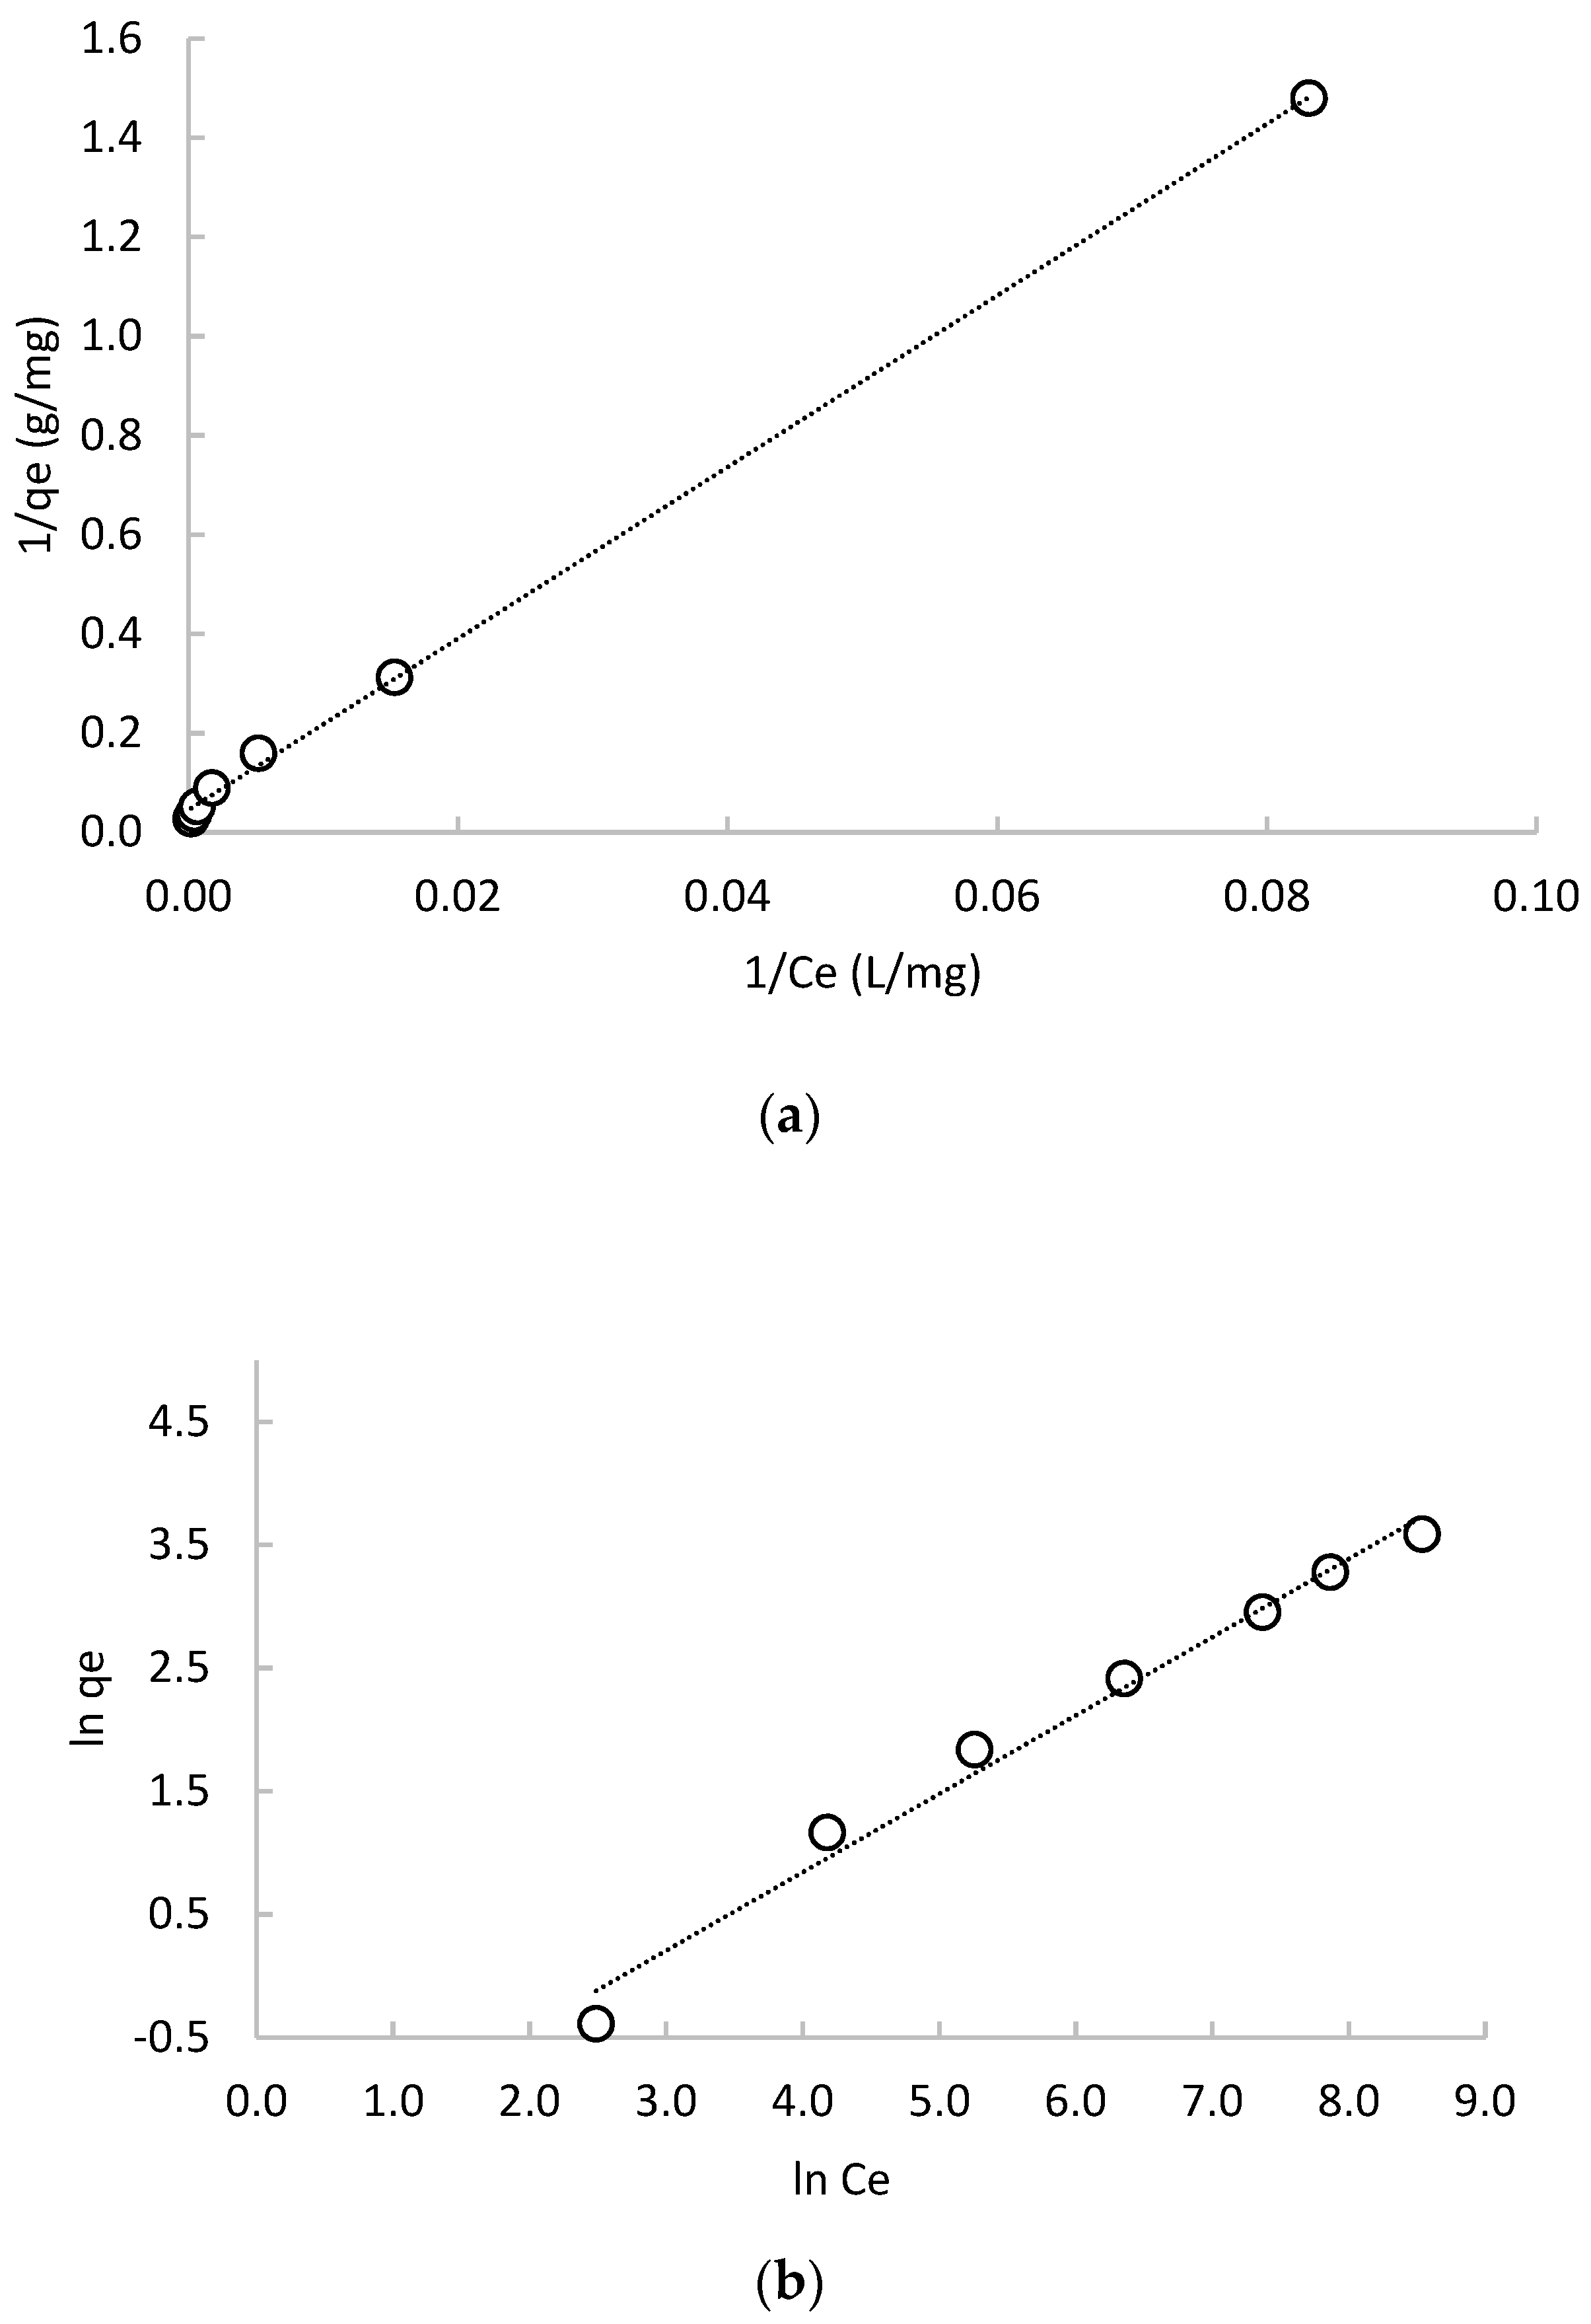
Additionally, Figure 3a shows the good concordance between the experimental and the theoretical data fitted by the Langmuir isotherm (r2 = 0.999, error 1.7%). The RL value obtained from the plot of 1/Ce against 1/qe (between 0.035 and 0.770 for 1 to 10 g/L of lactic acid) indicates that the adsorption is favorable [55]. Moreover, the Freundlich isotherm is plotted in Figure 3b. The n value reached in this case is 1.572 g/L, which implies a beneficial adsorption process [56]. However, the r2 value of 0.984 and an error of 19% show that the adsorption process can be explained by a monolayer adsorption process.
The experimental data were not well described with the Dubinin–Radushkevich and Temkin isotherms (see Table 5) since they yielded an r2 value of 0.662 and 0.858, respectively. However, the apparent energy of adsorption obtained, 0.081 kJ/mol, indicates that the adsorption process is physically controlled [57] and the positive value of KT (0.034 L/mg) indicates a favorable adsorption process. Therefore, considering the r2 values and percentage errors of the studied models (Table 5), the adsorption of lactic acid into the A100 resin is described by the Langmuir isotherm.
Other authors have also obtained good fits of the lactic acid sorption with the Langmuir isotherm model [17,18,26,29]. For example, Moldes et al. [18] assessed mathematical models of lactic acid adsorption, using different anion exchange resins (IRA 900, IRA 400, IRA 96 and IRA 67). IRA 900 and IRA 400 are strong base resins, both based on quaternary ammonium groups, but in macroreticular and gel-type, respectively. Otherwise, IRA 96 and IRA 67 are free base resins, both with polyamine groups, also in macroreticular and gel-type, respectively. In all cases, good agreement was observed between the experimental and theoretical data predicted by equations for the different isotherms models used; with values of correlation coefficients (r2) from 0.995 to 0.998. Regarding to adsorption capacity, IRA 400 provided the lowest value (161 mg/g), while IRA 67 achieved the maximum value (276 mg/g) for 125 g/L of lactic acid concentration at equilibrium. A similar finding is obtained in this work, where the adsorption capacity, by Langmuir model was, 22 mg/g at 10 g/L (taking into account that in our work the initial lactic acid concentration was 10 times lower).
3.2.2. Lactic Acid Sorption Kinetics
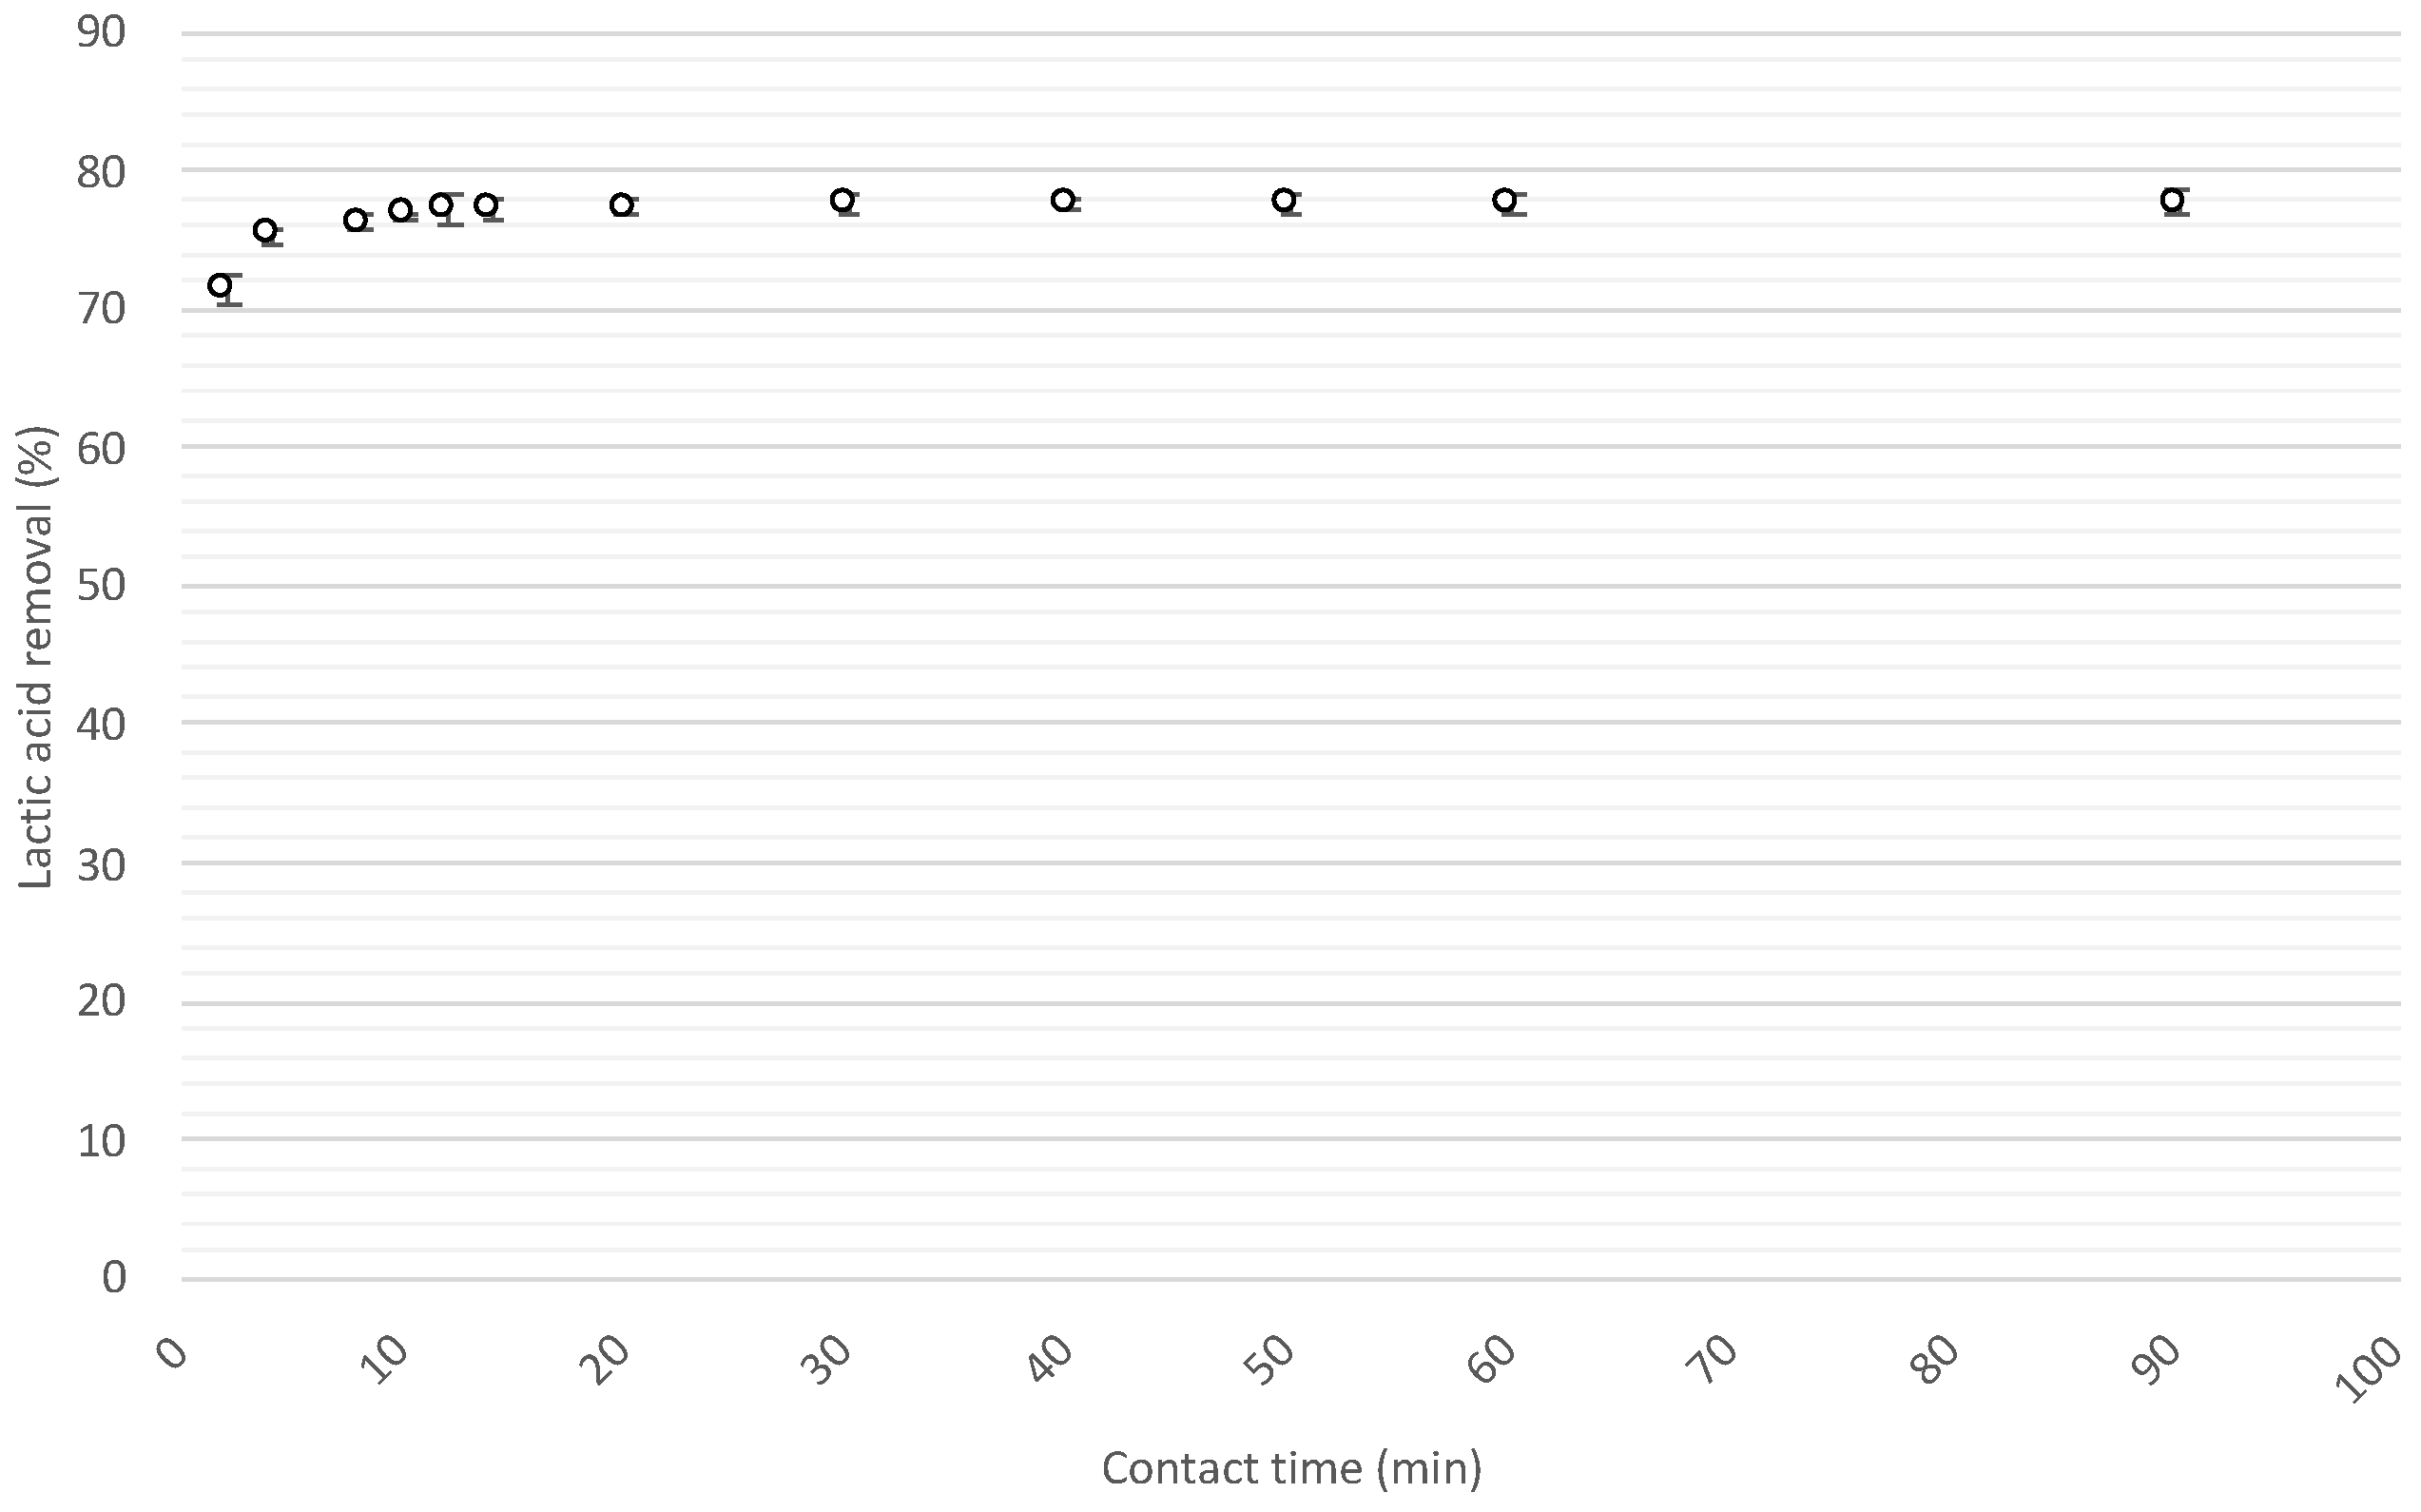
Results of the sorption kinetics, shown in Figure 4, indicates a very fast process. In less than 5 min more than 80% of the total equilibrium attainment was reached, and 20 min was time enough for achieving equilibrium attainment.
Table 6 includes the kinetic parameters obtained for the different models used in this work (for average data). Among the kinetic models tested, it was observed a good agreement between the experimental (5.45 mg/g) and theoretical (5.46 mg/g) adsorption capacity data predicted by the equations of the pseudo-second-order model; with a correlation coefficient (r2) value of 1.000. Hence, it can be postulated that the adsorption process was well described by the pseudo-second-order kinetic model. Data were not well described by the Chien–Clayton kinetic model reaching the lowest correlation coefficient (r2 value of 0.71). However, it can be observed that α value predicted (6 × 10²⁰ mg/g·min), as a measure of the initial sorption rates [41], was very high.
The intraparticle diffusion model determines whether the adsorption process is controlled only by intraparticle diffusion or if it involves other phenomena, such as surface adsorption, ion exchange and complexation [58]. In regard with C value (4.87), obtained applying this model, it indicates that there are other phenomena, apart from the intraparticle diffusion (C values higher than 0) [41], implicated in the adsorption removal process of lactic acid (e.g., reactions Equations (17) to (19) proposed for the extraction mechanism).
3.3. Optimization of Desorption Process for Lactic Acid Recovery
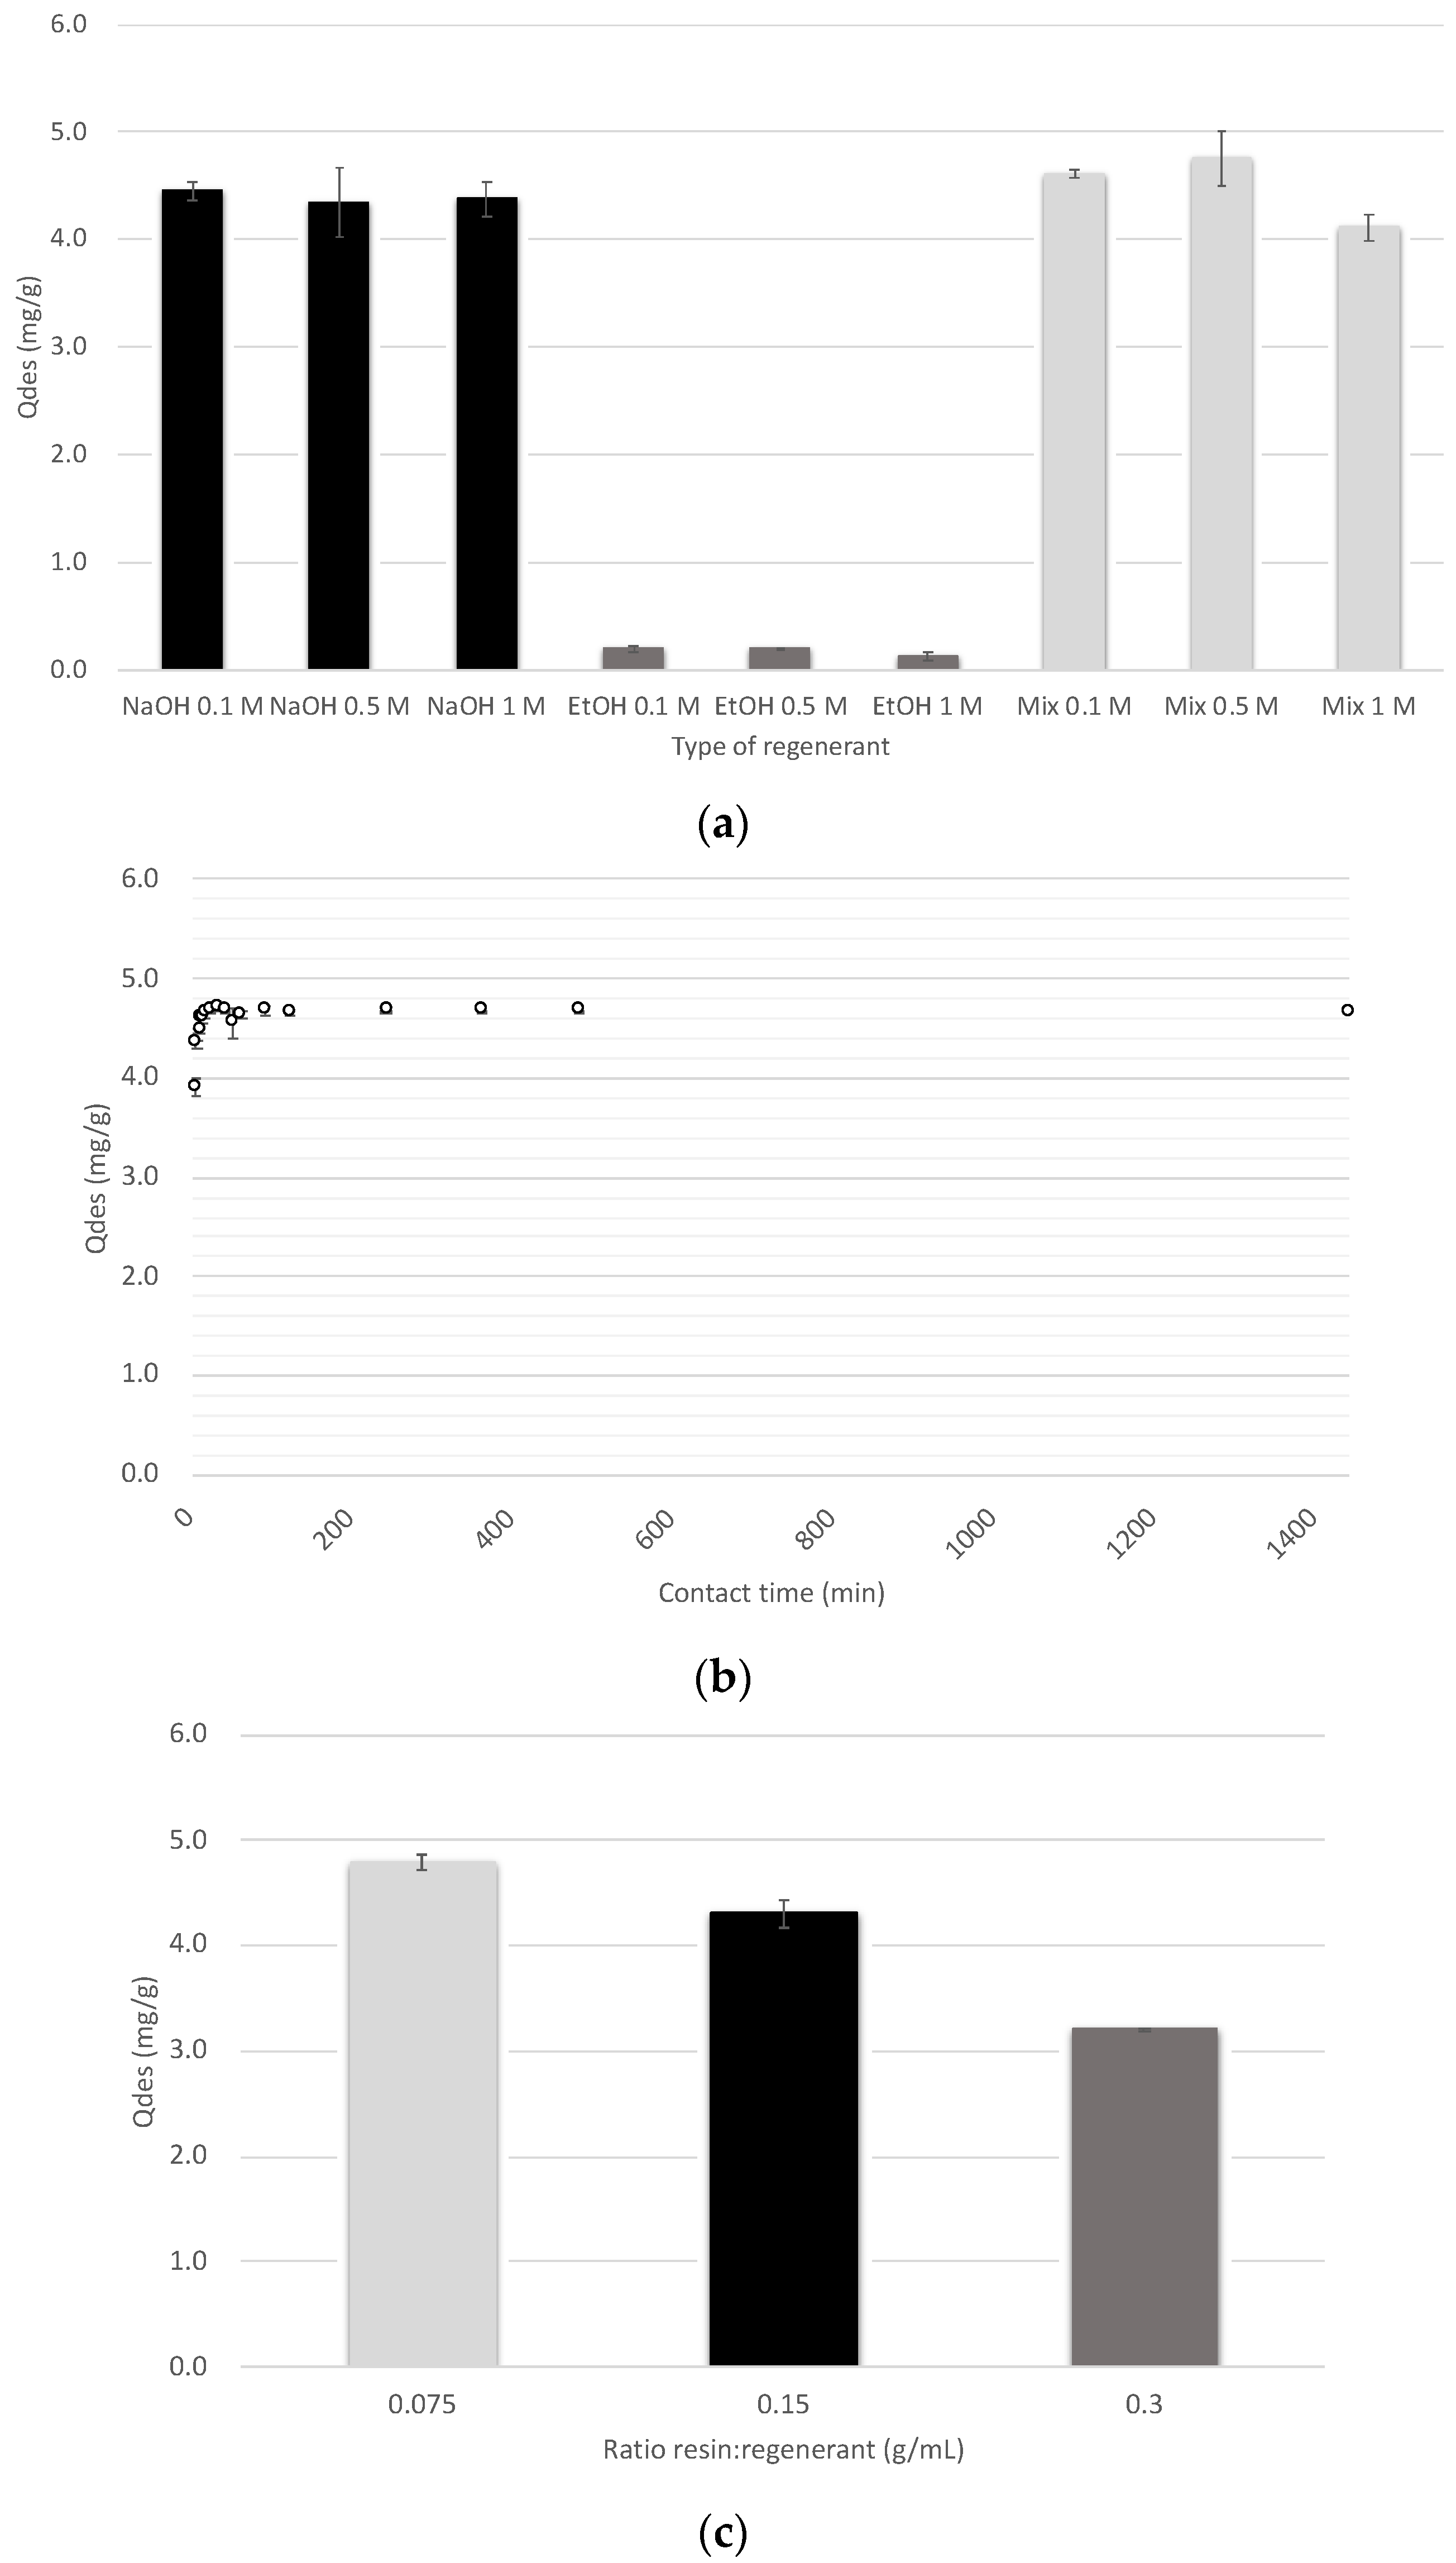
Three type of regeneration solutions (NaOH, ethanol and a mixture of both) at three different concentrations (0.1, 0.5 and 1 M) were evaluated in the desorption process of lactic acid from the A100 tertiary resin. The use of ethanol was based on the search for a more biocompatible and environmentally friendly solution to regenerate resins, taking into account that this technology will be used to treat biocompounds. Additionally, the use of mixtures of aqueous/organic solvents is recommended for the desorption of organic solutes from ion-exchange resins. Figure 5a shows the results obtained based on the desorption capacity. It can be observed that the best results were obtained with the mixture of NaOH/ethanol 0.5 M (4.75 ± 0.26 mg/g) and 0.1 M (4.61 ± 0.03 mg/g), followed by NaOH solutions (between 4.34 and 4.45 mg/g), and finally ethanol provided the lowest desorption capacities (<0.5 mg/g). This fact could be due to the fact that NaOH provides the necessary cations to regenerate the anionic exchange resin and release the lactate ion, while ethanol is a neutral molecule that is not able to perform the exchange properly. Similar results were obtained by other authors; for example, Cao et al. [17] tested organic solvents (methanol) to elute lactic acid adsorbed on Amberlite IRA 400 at pH 5, since methanol was a good solvent for washing step and it could reduce the product loss in washing step. The lactic acid recovery varied from 5.2%, using pure methanol, up to 54%, using 20% (v/v) methanol. However, Evangelista et al. [59] successfully used methanol as a regenerant and obtained a completely lactic acid recovery, but with a VI-15 resin. The VI-15 resin (Riedel-de-Haen, Seelze, Germany) is a copolymer of methylene-bis-acrylamide and imidazole groups (gel-type), whereas Amberlite IRA 400 is a strong basic gel-type anion exchange resin with quaternary ammonium groups and the matrix is a polystyrene divinylbenzene copolymer (macroreticular type). Therefore, different characteristics in the elution of lactic acid are expected when different types of resins were used.
In regard with the percentage of lactic acid recovery (based on the same average of adsorption capacity around 5.32 mg/g), it was possible to achieve 89% by using 0.5 M of the mixture NaOH/ethanol, followed by 87% with 0.1 M of the mixture NaOH/ethanol, and by the 0.5 M NaOH solution, recovering 86%. Taking into account an industrial point of view, Table 7 shows a brief economic study that was carried out to select the best regenerant for lactic acid recovery.
Among the three best lactic acid recoveries mentioned above, the one that provides the lowest cost (0.31 €/L) was the mixture of NaOH/ethanol at 0.1 M. However, it was observed that the lowest price of regenerant solution (0.16 €/L) was from using NaOH 0.1 M. For that reason, with this regenerant solution it could be saved twice for almost the same lactic acid recovery (84% vs. 87%). Therefore, the 0.1 M NaOH solution was selected as optimal for the following studies (contact time and solid/liquid ratio effect). This type of regenerant for lactic acid recovery is in agreement with other published works. For instance, Chen et al. [14] also used 0.1 M of NaOH solution as regenerant to recover lactic acid from fermentation of Lactobacillus delbrueckii by polyvinylpyridine resin (a weakly basic polymer). Additionally, the use of the NaOH cycle is the most efficient extraction and re-extraction route. However, in the desorption process with NaOH, sodium lactate is formed instead of lactic acid. The addition of HCl solution to covert the sodium lactate in lactic acid is necessary. This conversion could be described by the following equations (Equations (20) and (21)):
- (a)
- Desorption of lactic acid (HL) with NaOH:P-R2NH+ L− res + Na+OH− <==> P-R2Nres + Na+L− + H2O
- (b)
- Conversion of sodium lactate (NaL) to lactic acid (HL):Na+L− +H+Cl− <==> HL + Na+Cl−
Additionally, electrodialysis with bipolar membranes could also be used a downstream process to produce lactic acid solutions and if required latter being crystallized.
On the other hand, the desorption kinetic assay over 24 h is represented in Figure 5b. It can be seen that 30 min was sufficient time to achieve 4.62 mg/g as desorption capacity as well as the maximum lactic acid recovery (about 87%), using 0.1 M of NaOH as regenerant solution and a resin/regenerant ratio of 0.15 g/mL.
At the end, different resin/regenerant ratios were evaluated with 0.75, 1.5 and 3 g of resin fixing 10 mL of 0.1 M of NaOH as regenerant solution. These results are plotted in Figure 5c. It was observed that, for the same volume of regenerant solution, the use of less resin in the desorption process provided a slight increase in its capacity (being 4.8 mg/g the maximum). This value was not much higher when using the 0.15 g/mL ratio. Therefore, the latter is established as the optimum ratio for the desorption process.
This is a preliminary aiming to select the optimal resin and evaluate the behavior (isotherms and kinetics) with respect to an organic acid in order to apply it to a fermentative medium that contains competing ions. Therefore, ongoing research focuses on dynamic experiments, using real solutions.
In the global process of production of lactic acid, from fermentation broths in biotechnological reactors, ion-exchange should be considered as a stage with two main objectives: to selectively extract lactic acid and to reach the maximum concentration factor. It should be pointed out that that still not full-scale applications are described and then the identification of efficient ion-exchange resins are still needed. In addition, the integration of electrochemical membranes process in combination of crystallization could provide a promising train treatment for lactic acid recovery.
4. Conclusions
Lactic acid is a bioproduct worldwide used in the food, cosmetic and pharmaceutical sectors, but the bottleneck, from an industrial point of view, is its recovery from fermentation media. In this work, different anion exchange resins (A100, MN100, A200E and MP64) were evaluated for lactic acid downstream recovery. Among them, A100 resin, a weak base macroporous resin, provided the best results based on sorption capacity, lactic acid removal, desorption capacity and lactic acid recovery at two lactic acid concentrations (1 and 10 g/L). Afterwards, the sorption process was optimized by the Box–Behnken design, observing the maximum lactic acid removal value (85%) at pH 4, with a solid/liquid ratio of 0.15 g/mL and with a contact time of 1 h. Moreover, after analyzing the isotherm and kinetic parameters obtained for lactic acid sorption into A100 resin, it was observed that (i) the sorption process at equilibrium was well described by the Langmuir isotherm and was physically controlled; and (ii) the sorption process followed a pseudo-second-order kinetic model, with the existence of a high concordance between the experimental and theoretical sorption capacity. Finally, the desorption process optimization was as follows: resin/regenerant ratio of 0.15 g/mL, during 30 min, with 0.1 M of NaOH solution.
Author Contributions
Conceptualization, X.V., M.R., C.V. and J.L.C.; validation, X.V., M.R. and J.L.C.; formal analysis, X.V. and M.R.; investigation, X.V. and M.R.; resources, J.L.C.; data curation, X.V. and M.R.; writing—original draft preparation, X.V., M.R. and J.L.C.; writing—review and editing, X.V., M.R. and J.L.C.; visualization, X.V. and M.R.; supervision, X.V., M.R., C.V. and J.L.C.; project administration, J.L.C.; funding acquisition, J.L.C. All authors have read and agreed to the published version of the manuscript.
Funding
This research was funded by the R2MIT project (reference CTM2017-85346-R) financed by the Spanish Ministry of Economy and Competitiveness (MINECO) and the Catalan Government (reference 2017-SGR-312), Spain.
Institutional Review Board Statement
Not applicable.
Informed Consent Statement
Not applicable.
Data Availability Statement
The data presented in this study is available on request from the corresponding author.
Acknowledgments
X. Vecino acknowledges Spanish Ministry of Science and Innovation for her financial support under the project PID2019-103873RJ-I00. The authors would also like to acknowledge M. Parietti and J.M. Monge for their contribution to the project.
Conflicts of Interest
The authors declare no conflict of interest.
References
- Komesu, A.; de Oliveira, J.A.R.; da Silva Martins, L.H.; Maciel, M.R.W.; Filho, R.M. Lactic Acid Production to Purification: A Review. BioResources 2017, 12, 4364–4383. [Google Scholar] [CrossRef]
- Datta, R.; Tsai, S.P.; Bonsignore, P.; Moon, S.H.; Frank, J.R. Technological and Economic Potential of Poly(Lactic Acid) and Lactic Acid Derivatives. FEMS Microbiol. Rev. 1995, 16, 221–231. [Google Scholar] [CrossRef]
- Gao, C.; Ma, C.; Xu, P. Biotechnological Routes Based on Lactic Acid Production from Biomass. Biotechnol. Adv. 2011, 29, 930–939. [Google Scholar] [CrossRef] [PubMed]
- Alves de Oliveira, R.; Komesu, A.; Vaz Rossell, C.E.; Maciel Filho, R. Challenges and Opportunities in Lactic Acid Bioprocess Design—From Economic to Production Aspects. Biochem. Eng. J. 2018, 133, 219–239. [Google Scholar] [CrossRef]
- De Oliveira, R.A.; Filho, R.M.; Rossell, C.E.V. High Lactic Acid Production from Molasses and Hydrolysed Sugarcane Bagasse. Chem. Eng. Trans. 2016, 50, 307–312. [Google Scholar] [CrossRef]
- Hofvendahl, K.; Hahn-Hägerdal, B. Factors Affecting the Fermentative Lactic Acid Production from Renewable Resources. Enzyme Microb. Technol. 2000, 26, 87–107. [Google Scholar] [CrossRef]
- Reddy, G.; Altaf, M.; Naveena, B.J.; Venkateshwar, M.; Kumar, E.V. Amylolytic Bacterial Lactic Acid Fermentation—A Review. Biotechnol. Adv. 2008, 26, 22–34. [Google Scholar] [CrossRef]
- Gao, T.; Wong, Y.; Ng, C.; Ho, K. L-Lactic Acid Production by Bacillus Subtilis MUR1. Bioresour. Technol. 2012, 121, 105–110. [Google Scholar] [CrossRef]
- Castillo Martinez, F.A.; Balciunas, E.M.; Salgado, J.M.; Domínguez González, J.M.; Converti, A.; de Oliveira, R.P.S. Lactic Acid Properties, Applications and Production: A Review. Trends Food Sci. Technol. 2013, 30, 70–83. [Google Scholar] [CrossRef]
- Ouyang, J.; Ma, R.; Zheng, Z.; Cai, C.; Zhang, M.; Jiang, T. Open Fermentative Production of L-Lactic Acid by Bacillus Sp. Strain NL01 Using Lignocellulosic Hydrolyzates as Low-Cost Raw Material. Bioresour. Technol. 2013, 135, 475–480. [Google Scholar] [CrossRef]
- Okano, K.; Tanaka, T.; Ogino, C.; Fukuda, H.; Kondo, A. Biotechnological Production of Enantiomeric Pure Lactic Acid from Renewable Resources: Recent Achievements, Perspectives, and Limits. Appl. Microbiol. Biotechnol. 2010, 85, 413–423. [Google Scholar] [CrossRef]
- Abdel-Rahman, M.A.; Tashiro, Y.; Sonomoto, K. Recent Advances in Lactic Acid Production by Microbial Fermentation Processes. Biotechnol. Adv. 2013, 31, 877–902. [Google Scholar] [CrossRef] [PubMed]
- López-Garzón, C.S.; Straathof, A.J.J. Recovery of Carboxylic Acids Produced by Fermentation. Biotechnol. Adv. 2014, 32, 873–904. [Google Scholar] [CrossRef] [PubMed]
- Chen, C.C.; Ju, L.K. Adsorption Characteristics of Polyvinylpyridine and Activated Carbon for Lactic Acid Recovery from Fermentation of Lactobacillus Delbrueckii. Sep. Sci. Technol. 1998, 33, 1423–1437. [Google Scholar] [CrossRef]
- Monteagudo, J.M.; Aldavero, M. Production of L-Lactic Acid by Lactobacillus Delbrueckii in Chemostat Culture Using an Ion Exchange Resins System. J. Chem. Technol. Biotechnol. 1999, 74, 627–634. [Google Scholar] [CrossRef]
- Moldes, A.B.; Alonso, J.L.; Parajó, J.C. Resin Selection and Single-Step Production and Recovery of Lactic Acid from Pretreated Wood. Appl. Biochem. Biotechnol. Part A Enzym. Eng. Biotechnol. 2001, 95, 69–81. [Google Scholar] [CrossRef]
- Cao, X.; Yun, H.S.; Koo, Y.M. Recovery of L-(+)-Lactic Acid by Anion Exchange Resin Amberlite IRA-400. Biochem. Eng. J. 2002, 11, 189–196. [Google Scholar] [CrossRef]
- Moldes, A.B.; Alonso, J.L.; Parajó, J.C. Recovery of Lactic Acid from Simultaneous Saccharification and Fermentation Media Using Anion Exchange Resins. Bioprocess Biosyst. Eng. 2003, 25, 357–363. [Google Scholar] [CrossRef] [PubMed]
- Gluszcz, P.; Jamroz, T.; Sencio, B.; Ledakowicz, S. Equilibrium and Dynamic Investigations of Organic Acids Adsorption onto Ion-Exchange Resins. Bioprocess Biosyst. Eng. 2004, 26, 185–190. [Google Scholar] [CrossRef]
- Tong, W.Y.; Fu, X.Y.; Lee, S.M.; Yu, J.; Liu, J.W.; Wei, D.Z.; Koo, Y.M. Purification of L(+)-Lactic Acid from Fermentation Broth with Paper Sludge as a Cellulosic Feedstock Using Weak Anion Exchanger Amberlite IRA-92. Biochem. Eng. J. 2004, 18, 89–96. [Google Scholar] [CrossRef]
- Dethe, M.J.; Marathe, K.V.; Gaikar, V.G. Adsorption of Lactic Acid on Weak Base Polymeric Resins. Sep. Sci. Technol. 2006, 41, 2947–2971. [Google Scholar] [CrossRef]
- John, R.P.; Nampoothiri, K.M.; Pandey, A. Acid Recovery from Cassava Bagasse Based Fermented Medium Using Anion Exchange Resins. Braz. Arch. Biol. Technol. 2008, 51, 1241–1248. [Google Scholar] [CrossRef] [Green Version]
- Quintero, J.; Acosta, A.; Mejía, C.; Ríos, R.; Torres, A.M. Purification of Lactic Acid Obtained from a Fermentative Process of Cassava Syrup Using Ion Exchange Resins. Rev. Fac. Ing. 2012, 65, 139–151. [Google Scholar]
- Bishai, M.; De, S.; Adhikari, B.; Banerjee, R. A Platform Technology of Recovery of Lactic Acid from a Fermentation Broth of Novel Substrate Zizyphus Oenophlia. 3 Biotech 2015, 5, 455–463. [Google Scholar] [CrossRef] [Green Version]
- Cui, S.; Zhao, J.; Zhang, H.; Chen, W. High-Density Culture of Lactobacillus Plantarum Coupled with a Lactic Acid Removal System with Anion-Exchange Resins. Biochem. Eng. J. 2016, 115, 80–84. [Google Scholar] [CrossRef]
- Zhang, Y.; Qian, Z.; Liu, P.; Liu, L.; Zheng, Z.; Ouyang, J. Efficient in Situ Separation and Production of L-Lactic Acid by Bacillus Coagulans Using Weak Basic Anion-Exchange Resin. Bioprocess Biosyst. Eng. 2018, 41, 205–212. [Google Scholar] [CrossRef]
- Luongo, V.; Palma, A.; Rene, E.R.; Fontana, A.; Pirozzi, F.; Esposito, G.; Lens, P.N.L. Lactic Acid Recovery from a Model of Thermotoga Neapolitana Fermentation Broth Using Ion Exchange Resins in Batch and Fixed-Bed Reactors. Sep. Sci. Technol. 2019, 54, 1008–1025. [Google Scholar] [CrossRef] [Green Version]
- Halilibrahimoğlu, N.; İnci, İ.; Baylan, N. Lactic Acid Recovery from Water by Amberlite IRA-400. Desalin. Water Treat. 2019, 172, 190–198. [Google Scholar] [CrossRef]
- Ahmad, A.; Othman, I.; Taher, H.; Banat, F. Lactic Acid Recovery from Date Pulp Waste Fermentation Broth by Ions Exchange Resins. Environ. Technol. Innov. 2021, 22, 101438. [Google Scholar] [CrossRef]
- Purolite. Purolite A100-Product Data Sheet; Purolite: Barcelona, Spain, 2007. [Google Scholar]
- Purolite. Purolite MN100-Product Data Sheet; Purolite: Barcelona, Spain, 2019. [Google Scholar]
- Purolite. Purolite A200E-Product Data Sheet; Purolite: Barcelona, Spain, 2020. [Google Scholar]
- Lewatit. Lewatit MP 64-Product Data Sheet; Lanxess: Cologne, Germany, 2011. [Google Scholar]
- Box, G.E.P.; Behnken, D.W. Simplex-Sum Designs: A Class of Second Order Rotatable Designs Derivable from Those of First Order. Ann. Math. Stat. 1960, 31, 838–864. [Google Scholar] [CrossRef]
- Ferreira, S.L.C.; Bruns, R.E.; Ferreira, H.S.; Matos, G.D.; David, J.M.; Brand, G.C.; Silva, E.G.P.; Reis, P.S.; Souza, A.S.; Santos, W.N.L. Box-Behnken Design: An Alternative for the Optimization of Analytical Methods. Anal. Chim. Acta 2007, 597, 179–186. [Google Scholar] [CrossRef] [PubMed]
- Perez-Ameneiro, M.; Vecino, X.; Cruz, J.M.; Moldes, A.B. Physicochemical Study of a Bio-Based Adsorbent Made from Grape Marc. Ecol. Eng. 2015, 84, 190–193. [Google Scholar] [CrossRef]
- Langmuir, I. The Adsorption of Gases on Plane Surfaces of Mica and Platinum. J. Am. Chem. Soc. 1918, 40, 1361–1403. [Google Scholar] [CrossRef] [Green Version]
- Freundlich, H.M.F. Über Die Adsorption in Lösungen. J. Phys. Chem. 1906, 57, 385–470. [Google Scholar] [CrossRef]
- Dubinin, M.M.; Zaverina, E.D.; Radushkevich, L.V. Sorption and Structure of Active Carbons. J. Phys. Chem. 1947, 21, 1351–1362. [Google Scholar]
- Temkin, M.I.; Pyzhev, V. Kinetics of Ammonia Synthesis on Promoted Iron Catalysts. Acta Physiochem 1940, 12, 327–356. [Google Scholar]
- Perez-Ameneiro, M.; Vecino, X.; Barbosa-Pereira, L.; Cruz, J.M.; Moldes, A.B. Removal of Pigments from Aqueous Solution by a Calcium Alginate-Grape Marc Biopolymer: A Kinetic Study. Carbohydr. Polym. 2014, 101, 954–960. [Google Scholar] [CrossRef]
- Vecino, X.; Devesa-Rey, R.; Villagrasa, S.; Cruz, J.M.; Moldes, A.B. Kinetic and Morphology Study of Alginate-Vineyard Pruning Waste Biocomposite vs. Non Modified Vineyard Pruning Waste for Dye Removal. J. Environ. Sci. 2015, 38, 158–167. [Google Scholar] [CrossRef]
- Lagergren, S. About the Theory of So-Called Adsorption of Soluble Substances. Kungliga Svenska Vetenskapsakademiens. Handlingar 1898, 24, 1–39. [Google Scholar]
- Ho, Y.S.; Mckay, G. Pseudo-Second Order Model for Sorption. Process Biochem. 1999, 34, 451–465. [Google Scholar] [CrossRef]
- Chien, S.H.; Clayton, W.R. Application of Elovich Equation to the Kinetics of Phosphate Release and Sorption in Soils. Soil Sci. Soc. Am. J. 1980, 44, 265–268. [Google Scholar] [CrossRef]
- Weber, W.J.; Morris, J.C. Advances in Water Pollution Research. In Proceedings of the First International Conference on Water Pollution Research, Jerusalem, Israel, 18–23 June 1962; p. 231. [Google Scholar]
- Reig, M.; Vecino, X.; Hermassi, M.; Valderrama, C.; Gibert, O.; Cortina, J.L. Integration of Selectrodialysis and Solvent-Impregnated Resins for Zn(II) and Cu(II) Recovery from Hydrometallurgy Effluents Containing As(V). Sep. Purif. Technol. 2019, 229, 115818. [Google Scholar] [CrossRef]
- Cortina, J.L.; Meinhardt, E.; Roijals, O.; Martí, V. Modification and Preparation of Polymeric Adsorbents for Precious-Metal Extraction in Hydrometallurgical Processes. React. Funct. Polym. 1998, 36, 149–165. [Google Scholar] [CrossRef]
- Jadbabaei, N.; Ye, T.; Shuai, D.; Zhang, H. Development of Palladium-Resin Composites for Catalytic Hydrodechlorination of 4-Chlorophenol. Appl. Catal. B Environ. 2017, 205, 576–586. [Google Scholar] [CrossRef]
- Cortina, J.L.; Kautzmann, R.M.; Gliese, R.; Sampaio, C.H. Extraction Studies of Aurocyanide Using Macronet Adsorbents: Physico-Chemical Characterization. React. Funct. Polym. 2004, 60, 97–107. [Google Scholar] [CrossRef]
- Pürschel, M.; Worch, E.; Ender, V. Uptake of NOM Fractions by Anion-Exchange Resins in Demineralization Plants. Desalin. Water Treat. 2014, 52, 2987–2995. [Google Scholar] [CrossRef]
- Urbanowska, A.; Kabsch-Korbutowicz, M. The Efficiency of Macroporous Polystyrene Ion-Exchange Resins in Natural Organic Matter Removal from Surface Water. E3S Web Conf. 2017, 22. [Google Scholar] [CrossRef] [Green Version]
- Zhang, L.; Li, A.; Wang, J.; Lu, Y.; Zhou, Y. A Novel Aminated Polymeric Adsorbent for Removing Refractory Dissolved Organic Matter from Landfill Leachate Treatment Plant. J. Environ. Sci. 2009, 21, 1089–1095. [Google Scholar] [CrossRef]
- Urbanowska, A.; Kabsch-Korbutowicz, M. Isolation and Fractionation of Humic Substances Present in Water with the Use of Anion-Exchange Resins and Ultrafiltration. Brazilian J. Chem. Eng. 2018, 35, 1211–1217. [Google Scholar] [CrossRef]
- McKay, G.; Blair, H.S.; Gardner, J.R. Adsorption of Dyes on Chitin. I. Equilibrium Studies. J. Appl. Polym. Sci. 1982, 27, 3043–3057. [Google Scholar] [CrossRef]
- Kadirvelu, K.; Namasivayam, C. Agricultural By-Product as Metal Adsorbent: Sorption of Lead(II) from Aqueous Solution onto Coirpith Carbon. Environ. Technol. 2000, 21, 1091–1097. [Google Scholar] [CrossRef]
- Sivakumar, P.; Palanisamy, P.N. Adsorption Studies of Basic Red 29 by a Non-Conventional Activated Carbon Prepared from Euphorbia Antiquorum L. Int. J. ChemTech Res. 2009, 1, 502–510. [Google Scholar]
- Ndiaye, B.; Bustos, G.; Calvar, S.; Vecino, X.; Cruz, J.M.; Moldes, A.B.; Pérez-Cid, B. Selective Adsorption Capacity of Grape Marc Hydrogel for Adsorption of Binary Mixtures of Dyes. Water. Air. Soil Pollut. 2020, 231. [Google Scholar] [CrossRef]
- Evangelista, R.L.; Nikolov, Z.L. Recovery and Purification of Lactic Acid from Fermentation Broth by Adsorption. Appl. Biochem. Biotechnol. Part A Enzym. Eng. Biotechnol. 1996, 57–58, 471–480. [Google Scholar] [CrossRef] [Green Version]
Figure 1.
Resin selection based on (a) sorption capacity, (b) lactic acid removal, (c) desorption capacity and (d) lactic acid recovery at 1 and 10 g/L of initial lactic acid concentration. Different letters at the same lactic acid concentration indicate significant differences (p < 0.05).
Figure 1.
Resin selection based on (a) sorption capacity, (b) lactic acid removal, (c) desorption capacity and (d) lactic acid recovery at 1 and 10 g/L of initial lactic acid concentration. Different letters at the same lactic acid concentration indicate significant differences (p < 0.05).

Figure 2.
Lactic acid removal as an interaction between the solid/liquid ratio (x2) and pH (x1) setting time (x3) at (a) 1 h, (b) 5 h and (c) 9 h for A100 resin.
Figure 2.
Lactic acid removal as an interaction between the solid/liquid ratio (x2) and pH (x1) setting time (x3) at (a) 1 h, (b) 5 h and (c) 9 h for A100 resin.

Figure 3.
Equilibrium plots for the adsorption of lactic acid into the A100 resin: (a) Langmuir isotherm and (b) Freundlich isotherm.
Figure 3.
Equilibrium plots for the adsorption of lactic acid into the A100 resin: (a) Langmuir isotherm and (b) Freundlich isotherm.

Figure 4.
Variation of the lactic acid concentration on the A100 resin phase as a function of the contact time (1 g/L of lactic acid, resin/lactic acid ratio of 0.15 g/mL, pH 4).
Figure 4.
Variation of the lactic acid concentration on the A100 resin phase as a function of the contact time (1 g/L of lactic acid, resin/lactic acid ratio of 0.15 g/mL, pH 4).

Figure 5.
Effect of (a) type of regenerant, (b) contact time and (c) solid/liquid ratio in the desorption process of lactic acid by A100 resin.
Figure 5.
Effect of (a) type of regenerant, (b) contact time and (c) solid/liquid ratio in the desorption process of lactic acid by A100 resin.


Table 1.
Resins properties tested in this work.
| Resin | Type | Functional Group (Capacity) | Ionic Form | Matrix | Reference |
|---|---|---|---|---|---|
| A100 | Weak base macroporous | Tertiary amine (1.3 eq./L) | Free base | Polystyrene crosslinked with divinylbenzene | [30] |
| MN100 | Free base macroporous | Tertiary amine (0.1 eq./L) | Free base | Hyper-crosslinked polystyrene–divinylbenzene | [31] |
| A200E | Strong base gel | Quaternary ammonium (1.3 eq./L) | Cl− | Polystyrene crosslinked with divinylbenzene | [32] |
| MP64 | Weak base macroporous | Tertiary/quaternary amine (1.3 eq./L) | Free base/Cl− | Polystyrene | [33] |
Table 2.
Independent and dependent variables used in the Box–Behnken factorial design.
| Independent Variables | |||
|---|---|---|---|
| Units | Range of Variation | ||
| pH | - | 4–8 | |
| Resin/solution ratio | g/mL | 0.05–0.15 | |
| Contact time | h | 1–9 | |
| Dimensionless, coded independent variables | |||
| Nomenclature | Definition | Range of variation | |
| pH | x1 | (x1−6)/2 | (−1,1) |
| Resin/solution ratio | x2 | (x2−0.10)/0.05 | (−1,1) |
| Contact time | x3 | (x3−5)/4 | (−1,1) |
| Dependent Variables | |||
| Nomenclature | Units | ||
| Adsorption capacity | y1 | mg/g | |
| Lactic acid removal | y2 | % | |
| Desorption capacity | y3 | mg/g | |
| Lactic acid recovery | y4 | % | |
Table 3.
Study of the desorption process changing the type and concentration of regenerant, contact time and the solid/liquid ratio.
Table 3.
Study of the desorption process changing the type and concentration of regenerant, contact time and the solid/liquid ratio.
| Sorption Process | Desorption Process | ||||
|---|---|---|---|---|---|
| Initial Lactic Acid (g/L) | Solid/Liquid Ratio (g/mL) | Contact Time | Ratio Solid/Liquid (g/mL) | Contact Time | Parameter Tested |
| 1 | 0.15 | 30 min | 0.15 | 30 min | Type and concentration of the regenerant |
| 0.15 | 2 min–24 h | Contact time | |||
| 0.075–0.3 | 30 min | Solid/liquid ratio in desorption | |||
Table 4.
Coded independent variables (pH (x1), solid/liquid ratio (x2), contact time (x3)) values considered in this study and experimental results obtained for all dependent variables: sorption capacity (y1), removal of lactic acid (y2), desorption capacity (y3) and recovery of lactic acid (y4).
Table 4.
Coded independent variables (pH (x1), solid/liquid ratio (x2), contact time (x3)) values considered in this study and experimental results obtained for all dependent variables: sorption capacity (y1), removal of lactic acid (y2), desorption capacity (y3) and recovery of lactic acid (y4).
| Experiment | Independent Variables (Coded) | Dependent Variables | |||||
|---|---|---|---|---|---|---|---|
| x1 | x2 | x3 | y1 | y2 | y3 | y4 | |
| 1 | −1 | −1 | 0 | 27.89 | 68.50 | 20.22 | 72.52 |
| 2 | 0 | 0 | 0 | 13.90 | 73.39 | 11.47 | 82.52 |
| 3 | −1 | 0 | 1 | 16.62 | 82.30 | 12.33 | 74.22 |
| 4 | 0 | 0 | 0 | 13.80 | 72.75 | 11.23 | 81.39 |
| 5 | 1 | 0 | −1 | 13.26 | 63.67 | 11.57 | 87.26 |
| 6 | 0 | −1 | 1 | 22.49 | 59.24 | 18.79 | 83.55 |
| 7 | 1 | 0 | 1 | 13.45 | 64.97 | 11.83 | 88.01 |
| 8 | −1 | 1 | 0 | 11.54 | 85.27 | 8.79 | 76.18 |
| 9 | 0 | 0 | 0 | 13.72 | 72.35 | 11.93 | 86.97 |
| 10 | 0 | −1 | −1 | 22.72 | 59.74 | 19.08 | 83.97 |
| 11 | 0 | 1 | 1 | 9.71 | 76.77 | 8.04 | 82.85 |
| 12 | −1 | 0 | −1 | 15.60 | 76.62 | 12.78 | 81.94 |
| 13 | 0 | 1 | −1 | 9.66 | 76.52 | 8.15 | 84.35 |
| 14 | 1 | 1 | 0 | 10.19 | 73.32 | 8.13 | 79.78 |
| 15 | 1 | −1 | 0 | 21.73 | 52.19 | 17.76 | 81.72 |
Table 5.
Comparison of equilibrium parameters for Langmuir, Freundlich, Dubinin–Radushkevich and Temkin isotherms.
Table 5.
Comparison of equilibrium parameters for Langmuir, Freundlich, Dubinin–Radushkevich and Temkin isotherms.
| Langmuir Isotherm | Freundlich Isotherm | |||||
| r2 | qm | kL | RL | r2 | n | kF |
| (mg/g) | (mg/L) | (g/L) | (L/g) | |||
| 0.999 | 22.05 | 0.003 | 0.035–0.770 | 0.984 | 1.572 | 0.182 |
| Dubinin–Radushkevich Isotherm | Temkin Isotherm | |||||
| r2 | qm | E | r2 | B1 | kT | |
| (mg/g) | (mol2/J2) | (kJ/mol) | (J/mol) | (L/mg) | ||
| 0.662 | 13.02 | 76.771 | 0.081 | 0.858 | 5.599 | 0.034 |
Table 6.
Comparison of kinetic parameters for pseudo-first-order, pseudo-second-order, Chien–Clayton and intraparticle diffusion kinetic models.
Table 6.
Comparison of kinetic parameters for pseudo-first-order, pseudo-second-order, Chien–Clayton and intraparticle diffusion kinetic models.
| Pseudo-1st-Order Kinetic Model | |||
| K1 (L/g·min) | qe exp (mg/g) | qe calc (mg/g) | r2 |
| 0.063 | 5.45 | 0.13 | 0.774 |
| Pseudo-2nd-Order Kinetic Model | |||
| K2 (L/g·min) | qe exp (mg/g) | qe calc (mg/g) | r2 |
| 1.470 | 5.45 | 5.46 | 1.000 |
| Chien–Clayton Kinetic Model | |||
| α (mg/g·min) | β (g/mg) | r2 | |
| 6 × 10²⁰ | 9.81 | 0.705 | |
| Intraparticle Diffusion Model | |||
| KP (mg/g·min0.5) | C | r2 | |
| 0.160 | 4.87 | 0.844 | |
Table 7.
Lactic acid recovery as a function of the regenerant type and concentration, as well as its price.
Table 7.
Lactic acid recovery as a function of the regenerant type and concentration, as well as its price.
| Type of Regenerant | Lactic Acid Recovery (%) | Regenerant Solution Cost * (€/L) |
|---|---|---|
| NaOH 0.1 M | 84.0 ± 1.9 | 0.16 |
| NaOH 0.5 M | 85.6 ± 0.1 | 0.81 |
| NaOH 1 M | 82.3± 3.2 | 1.62 |
| Ethanol 0.1 M | 3.6 ± 0.5 | 0.24 |
| Ethanol 0.5 M | 3.8 ± 0.1 | 1.21 |
| Ethanol 1 M | 2.3 ± 0.7 | 2.42 |
| Mixture NaOH/Ethanol 0.1 M | 86.7 ± 0.7 | 0.31 |
| Mixture NaOH/Ethanol 0.5 M | 89.3 ± 2.5 | 1.57 |
| Mixture NaOH/Ethanol 1 M | 77.5 ± 2.3 | 3.13 |
* It is assumed a NaOH and ethanol price of 39.8 €/kg NaOH and 41.6 €/L ethanol, respectively according to a supplier company (e.g., Vidrafoc) at the lab-scale level.
Publisher’s Note: MDPI stays neutral with regard to jurisdictional claims in published maps and institutional affiliations. |
© 2021 by the authors. Licensee MDPI, Basel, Switzerland. This article is an open access article distributed under the terms and conditions of the Creative Commons Attribution (CC BY) license (https://creativecommons.org/licenses/by/4.0/).
Share and Cite
MDPI and ACS Style
Vecino, X.; Reig, M.; Valderrama, C.; Cortina, J.L. Ion-Exchange Technology for Lactic Acid Recovery in Downstream Processing: Equilibrium and Kinetic Parameters. Water 2021, 13, 1572. https://doi.org/10.3390/w13111572
AMA Style
Vecino X, Reig M, Valderrama C, Cortina JL. Ion-Exchange Technology for Lactic Acid Recovery in Downstream Processing: Equilibrium and Kinetic Parameters. Water. 2021; 13(11):1572. https://doi.org/10.3390/w13111572
Chicago/Turabian StyleVecino, X., M. Reig, C. Valderrama, and J. L. Cortina. 2021. "Ion-Exchange Technology for Lactic Acid Recovery in Downstream Processing: Equilibrium and Kinetic Parameters" Water 13, no. 11: 1572. https://doi.org/10.3390/w13111572
Note that from the first issue of 2016, this journal uses article numbers instead of page numbers. See further details here.