Article

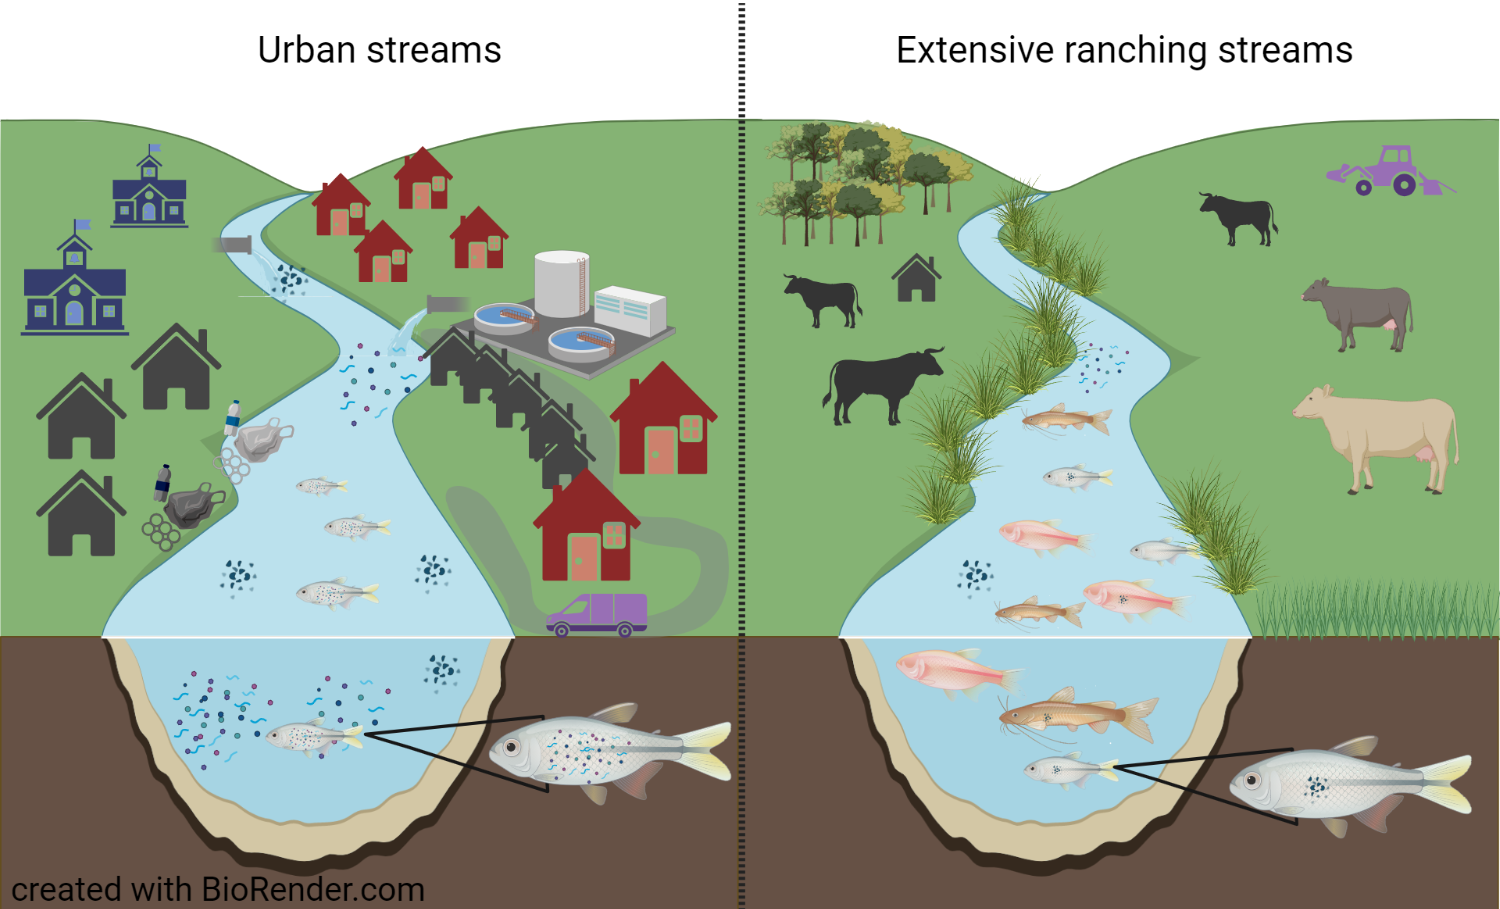
Incidence of Watershed Land Use on the Consumption of Meso and Microplastics by Fish Communities in Uruguayan Lowland Streams

by
Camila Vidal
1,
Juan Pablo Lozoya
2,
Giancarlo Tesitore
1,
Guillermo Goyenola
1 and
Franco Teixeira-de-Mello
1,*
1
Departamento de Ecología y Gestión Ambiental, Centro Universitario Regional Este, Maldonado 20000, CP, Uruguay
2
Centro Interdisciplinario Manejo Costero Integrado del Cono Sur, Centro Universitario Regional del Este, Maldonado 20000, CP, Uruguay
*
Author to whom correspondence should be addressed.
Water 2021, 13(11), 1575; https://doi.org/10.3390/w13111575
Submission received: 4 May 2021 / Revised: 25 May 2021 / Accepted: 30 May 2021 / Published: 2 June 2021
(This article belongs to the Special Issue Impacts of Human Activities and Climate Change on Freshwater Fish)

Abstract

:
Physical-chemical and biologicaldiversity of streams are influenced by the land use in their watersheds. Plastics currently make up the most important waste asset, representing an important part of the transported and accumulated material in water courses. This work analyzes the consumption of plastics debris by the fish communities in streams with two contrasting types of land use. We worked with threestreams impacted by urbanization and threeby extensive ranching. The stomach and intestinal contents of 309 individuals of 29 species were analyzed, by a modified alkaline digestion, and observed under a stereo microscope with polarized light. A total of 373 plastic itemswere found, of which the majority corresponded to fibers (318). A significant difference was found between the percentage of individuals that consumed plastic debrisbetween both systems (51.6% in ranchers and 76.6% in urban, p = 0.014 Mood’s Median), but no difference was found in the average ingested per individual. This study establishes the first baseline on plastic debris consumption by fish in Uruguayan streams, showing the extent of the plastic and microplastic pollution problem. Although there are differences between the analyzed sites, we also observed significant contamination in streams far from urbanization.

Graphical Abstract

1. Introduction

Rivers and streams reflect their geographic location, geomorphological and natural characteristics, and the human activities carried out in their hydrographic basins [1]. The different land uses, such as urbanization, industries and the various agricultural activities that may be developed in a watershed, condition and determine the wastes and pollutants that eventually end up reaching freshwater systems [2].
Particularly in the case of plastic wastes, their entry into inland water systems can occur through several paths, both from point or diffuse sources. Among the former we may include: (i) improper disposal direct to watercourses of their vicinity as a result of bad practices at users level [3,4], (ii) domestic wastewater (including existing treatment plants in the case of certain MPs for domestic use), (iii) failures in waste management procedures in recycling plants, industries and agricultural activities. Diffuse sources may include: (iv) urban runoff waters [5,6] as well as (v) airborn deposition arriving from urban or industrial areas [7]. Distance from population centers, industries and landfills certainly seem to be a determining factor increasing plastic waste inputs to freshwater systems [5,8,9].
Plastics are a type of pollutants that have gained interest in the last decade, both in fresh and marine systems, because of their worldwide distribution and their ecological consequences [10,11]. Despite having been identified in the early 1970s [12], it was not until the last decade that they have been considered as a significant emerging pollutant [13]. Plastics highly versatile and durable materials, with low production costs, generally made from organic synthetic polymers obtained mainly from oil. Due to these characteristics, their use is widespread throughout all industries, making them essential consumer goods in our daily lives [14]. However, because of their massive use and production, particularly of the so-called “single use plastics”, immense amounts of plastic wastes are generated, of which less than 15% is properly handled and recycled [15]. Their high chemical stability ensures long term environmental perseverance and cumulative dynamics.
Once in freshwater systems, and particularly in streams, plastics are exposed to the forces of the water currents that transport them downstream. Through this journey the friction acceleratestheir degradation and subsequent fractioning, thus increasing the number ofsmaller plastic particles (microplastics MPs <5 mm) available in the environment. This is mainly due to the increase in secondary MPs, generated from the fragmentation of larger wastes, as opposed to primary MPs, which are manufactured with smaller sizes [16,17]. Whatever the origin of these plastics debris, from the moment they take contact with the environment, and particularly when they reach lotic systems, a part gets trapped in sediment, rocks or vegetation, and some are transported downstream [18]. Thus, the transport of plastics and microplastics will be determined both by the hydrology and morphology of each stream, and by the characteristics of each plastic particle (density, shape, size), making them take pelagic or benthic transport routes [13,16]. Due to their slow decomposition rate, these wastes accumulate and successively fractionate to microscopic dimensions, and become an integral part of ecological systems, interacting and impacting biota [6,8,19].
This interaction with the fauna is further dependent on the characteristics of the biota (e.g., size, feeding habits, trophic groups), but the smaller fraction of plastic debris seems to be more available to fauna due to itssize [18,20]. Although several interactions have been described, probably the most important for both fish and their potential consumers, and therefore for the entire food web, is the ingestion of small plastic particles. This would not only imply a physical affectation due to direct lesions or a false satiety that would alter the growth and survival of the fishes. It has been shown that plastic debris can behave as a pollutant trap (e.g., POPs). These contaminants could bioaccumulate in organisms besides being transferred in the food web they can promote various toxic effects, including endocrine disturbance, oxidative and metabolic stress, enzyme activity, and cell necrosis [21,22,23]. The consequences can compromise the survival, growth, and reproduction [23,24]. Although rivers and streams are major carriers of these waste (up to 80% of what reaches the oceans [9]), there is not much information on the plastic transport and retention cycle, nor of their interaction withfauna in these systems [9,25]. Particularly for freshwater fish, although MPs consumption has been demonstrated, there is no clear evidence of possiblerelationships between the size of the fish and the amount, size or type of plastics debris ingested, nor the consequences of these interactions [4,26,27].
Given that this encounter between stream biota and plastic and microplastic debris is unfortunately unavoidable, the study of the possible ecological consequences of these interactions becomes of great environmental importance [28,29,30]. Both globally and for Uruguay [8,31], it appears urgent and very necessary to evaluate and analyze MPs pathways, fates, and impacts in freshwater systems. This is of particular interest to fish communities, since in addition to being an important source of food, fish also have a great importance to the ecosystem functioning of streams and rivers, as they can control the rest of the communities through predation, mediate nutrient flows, and can act as ecosystem engineers [32,33,34,35]. In this context, in which fish can bioaccumulate and biomagnify the different pollutants that enter in the stream food webs, our objective is to evaluate the fish community and the incidence of plastic debris in the diet of the species present insmall streams. In order to further evaluate the effect of human activities we compare streams that run through urban areas and areas of extensive cattle ranching. In this scenario, considering the implications of each land use, and that in our country most urban streams receive untreated sewage water [36], we expect to find a higher incidence of plastic pollution in the diet of fish belonging to urban watersheds.

2. Materials and Methods
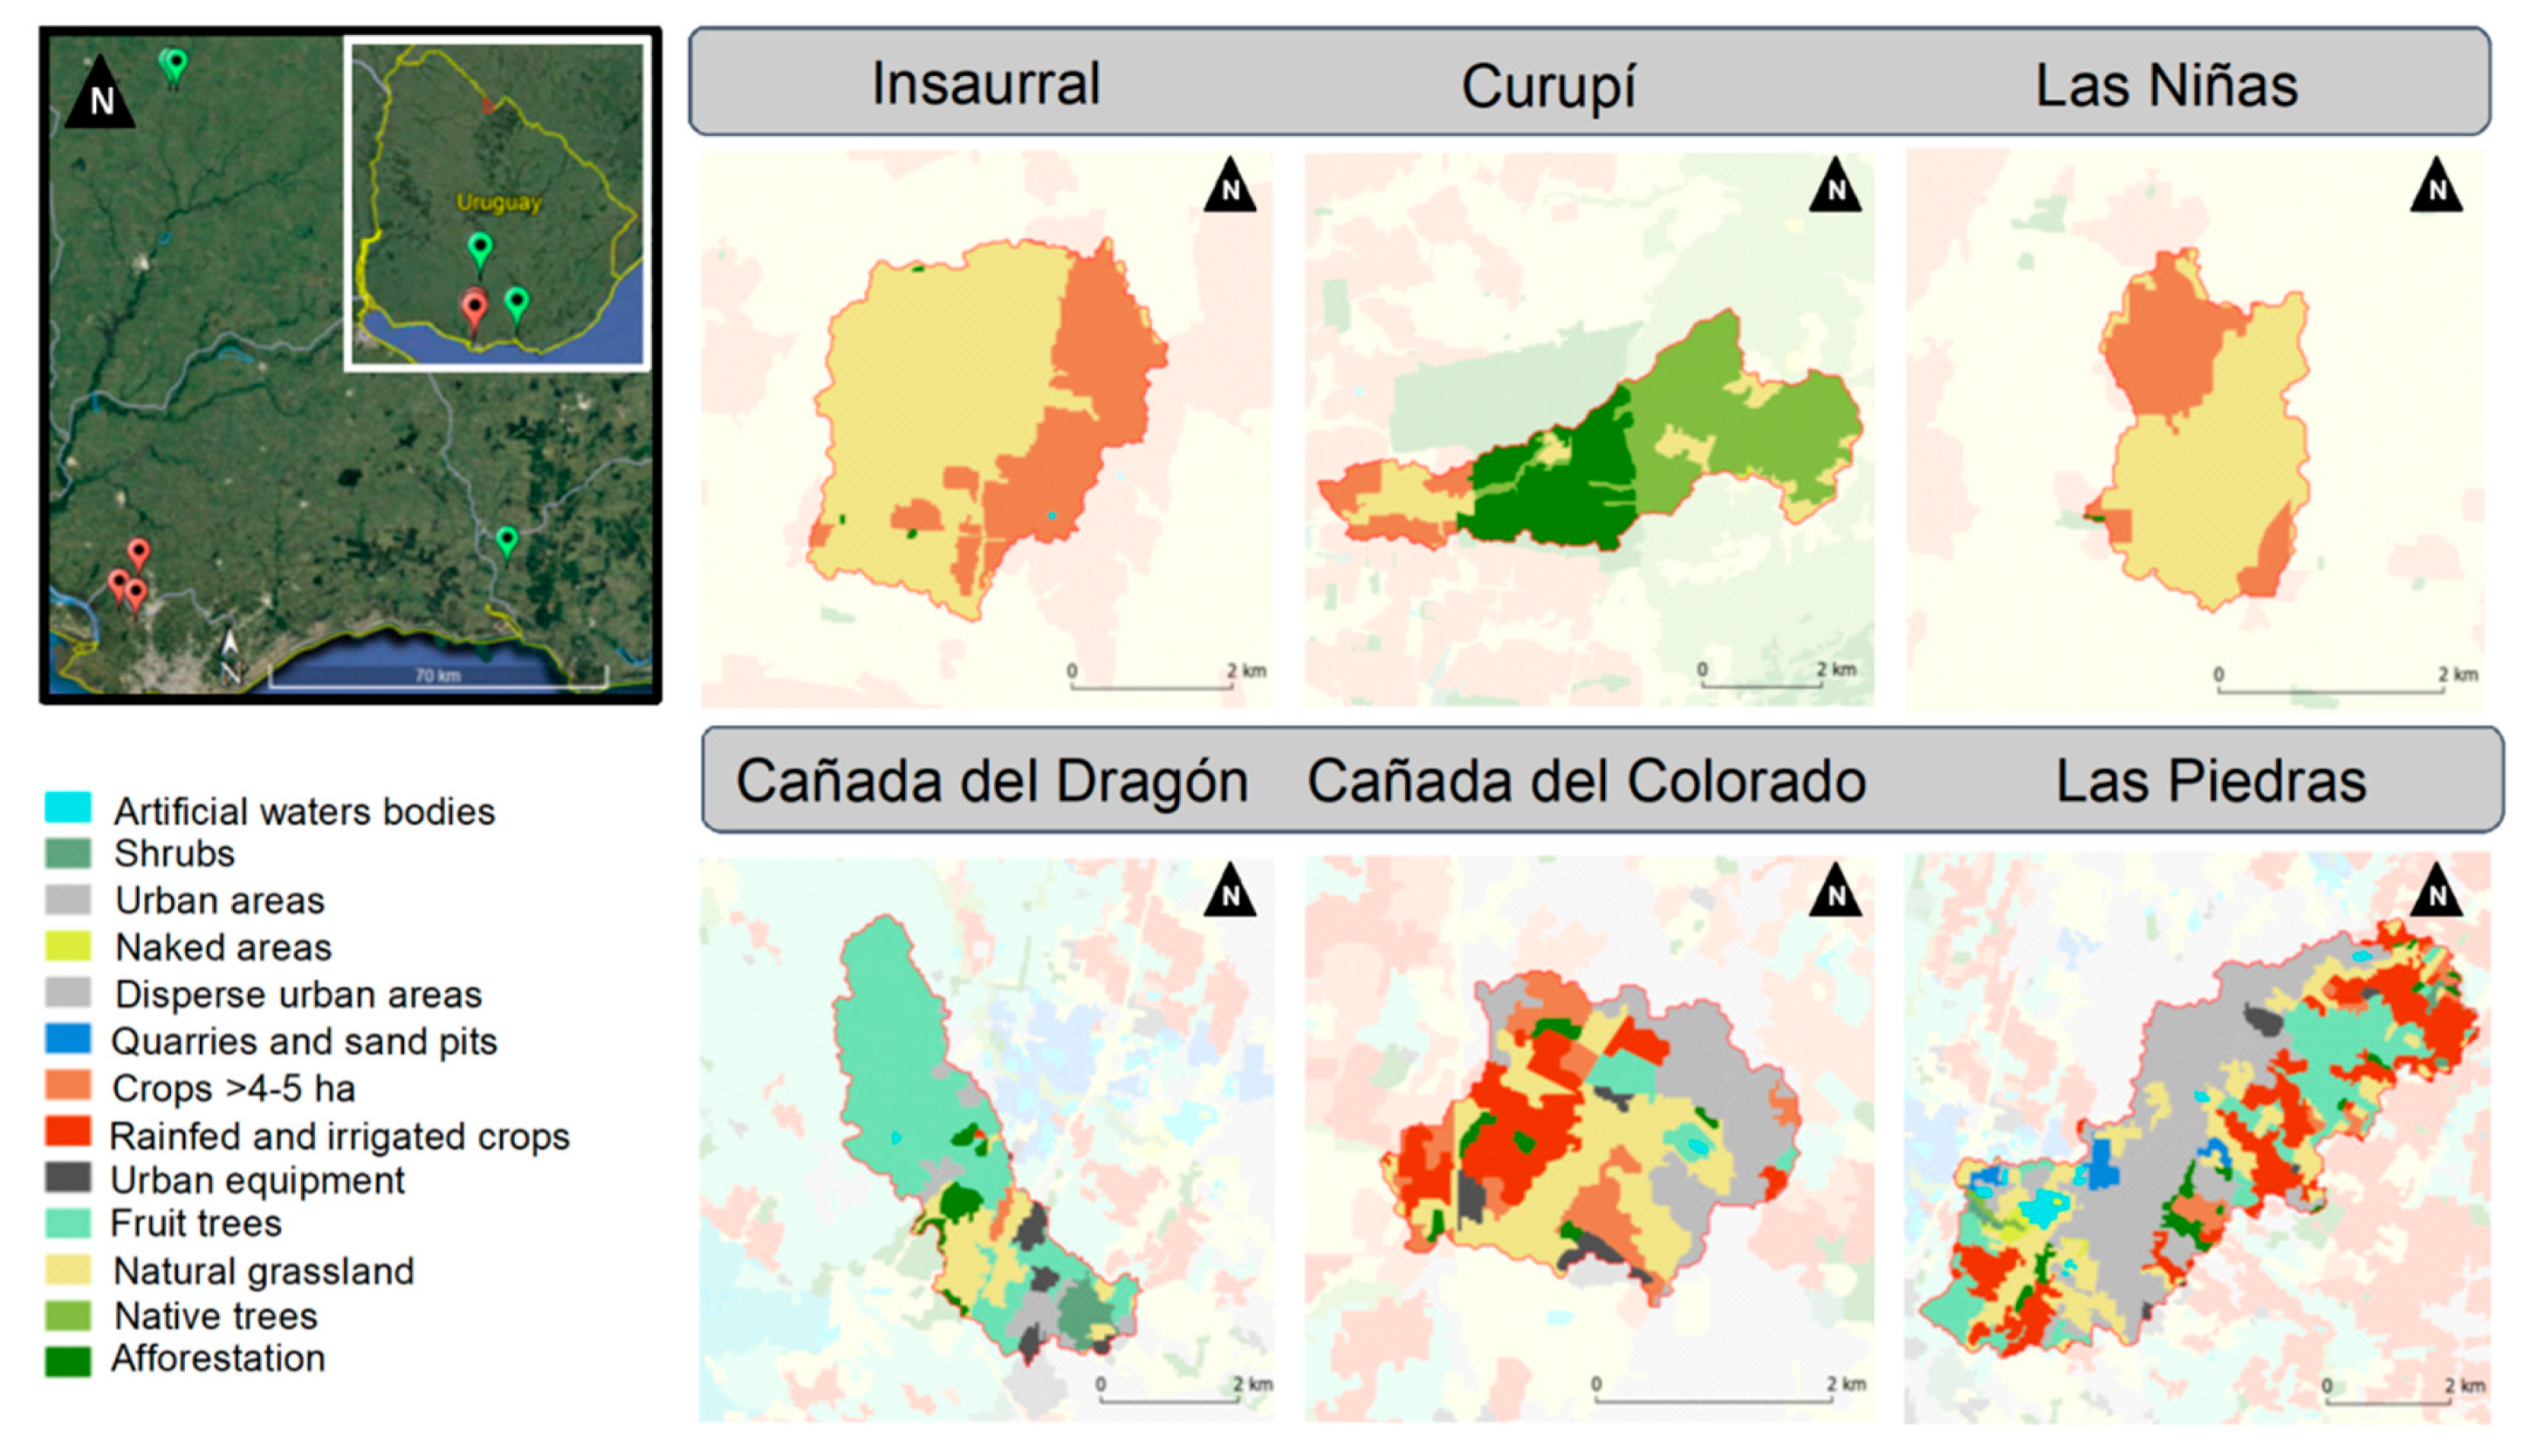
2.1. Study Sites

For this work we selected six lowland streams corresponding to southern Uruguay, located principally in areas with two different land use, three with a predominance of extensive ranching (Insaurral 33°47’07.1”S, 56°08’02.3”W, Curupí 34°40’26.9”S, 55°25’14.2”W and Las Niñas 34°40’18.3”S, 55°24’59.5”W) and three in urban or peri-urban areas (Cañada del Colorado 34°40’40.5”S, 56°14’50.4”W, Las Piedras 34°45’6.4”S,56°15’22.9”Wand Cañada del Dragón 34°43’58.8”S, 56°17’36.9”W) (Figure 1). All streams correspond to order 2 or 3 and belong to the Río de la Plata basin. For each sampling site, the drainage area was delimited using geographic information systems, and the information on ground cover was obtained from SIT-MVOTMA (former Ministerio de Vivienda Ordenamiento Territorial y Medio Ambiente from Uruguay/Ministry of Housing, Land Use Planning and the Environment).

2.2. Environmental and Fish Communities Sampling

The six selected sites were sampled in February 2017, measuring physicochemical parameters (i.e., conductivity, pH, temperature, dissolved oxygen) with a YSI-600OMS-V2 multiparameter sonde (Xylem Analytics, Yellow Springs, OH, USA.) and taking water samples which were refrigerated at 4 °C. Once in the laboratory, total phosphorus and total nitrogen were measured [37]. The morphology of the stream was characterized for each site by performing six cross transects every 10 m along 50 m of shoreline. For each of the transects, the width of the stream was measured, as well as the depth every 25 cm.
Fishes were collected by electrofishing along the same stream reach. The same three-person team applied 50 electric pulses for a maximum of 10 s, capturing fish with a hand net and placing all fishes in a bucket with water until the fishing was finished [38]. All collected individualswere euthanized with an overdose of a dilution of eugenol of 2 mL/L (dilution: 1 eugenol:10 ethanol) for 15 min. Individuals were immediately fixed in formaldehyde solution (10%) and finally preserved in ethanol (70%). All the fish caught were pooled into one sample per site, and in the laboratory fishes were classified to species level, weighed and measured (standard length), prior to dissection. Species were also classified into trophic groups using guides [39] and unpublished data from our laboratory. Richness, relative abundance, total biomass, and size distribution of individuals were calculated for every stream. Individuals and biomass density (ind.m−2 and g.m−2, respectively) were also estimated for each site, based on sampled area, mean abundance, and mean biomass following Teixeira-de-Mello et al. [38]. The fish collection and handling procedure was carried out following the approved Comisión Honoraria de Experimentación Animal (CHEA) protocol 603(101)-CEUA CURE.

2.3. Plastics Consumption

There is currently no consensus on a single classification for the study of plastics and their sub-fractions, which results in difficulties when it comes to contrasting data [40]. In this study we used one of the most widespread classifications, where microplastics (MPs) are defined as plastic items smaller than 5 mm in their longer axis and mesoplastics (MesoP) as those smaller than 2.5 cm [18,40,41]. Beyond their sizes, plastic debris can also be classified according to their origin into primary (those that since their manufacture already have a small size- for example pellets of microspheres found in cosmetics [42]) or secondary (those that originate from fragmentation of larger particles), although this classification is mainly used for MPs [14,18]. Considering their shape, they were classified in two large categories: fibers (when the particle is very elongated and lacks width and thickness of relevance) and fragments (rounded or angular particles, with irregular edges) [43]. Information about their size and colour was also documented. Plastic fibers or filaments make up one of the most abundant MPs groups today (50–90%), both in water and gut content [4,10,44].
In order to prevent potential airborne plastics contamination in the laboratory, all work surfaces and materials were cleaned with alcohol and miliQ water, the latter covered with aluminum foil, and all work was conducted avoiding the use of air conditioners to prevent particle movement. In addition, control blanks with miliQ water were set up at two stages; firstly when the tissues were chemically digested and later when the samples were observed under stereomicroscope and microscope. Each control was observed and analyzed after each sample analysis in the laboratory, and exchanged for a new one. If plastic items were found in the blanks, they were counted, photographed, measured and classified (shape and color). In the case of observing coincidences (shape and color) with the items found in the sample, the particles found in the blank plate were respectively discounted from the sample.
Regarding the fish, five individuals perspecies, or the total number of individuals in species with lower captures, were consideredin the analysis. In streams with low species diversity, the number of individuals was increased among those available up to 20. The removal of the digestive tract (gut or full intestine in those species that do not have a gut) was made through a ventral cut. The tissues of each digestive tract were digested following a modified alkaline digestion process [45], by adding a volume necessary to cover the sample (in the smallest samples a minimum of 25 mL was used) of 10% KOH solution in a 150 mL glass Erlenmeyer (previously rinsed with alcohol and miliQ water and covered with aluminum foil until use). Finally, these Erlenmeyer flasks, again covered with aluminum, were placed in an oven at 60 °C for 12 h. With these samples, a blank Erlenmeyer was prepared containing 25 mL of 10% KOH solution, that was also covered with aluminum and placed in the oven, to be later analyzed for procedure control.
The contents of the Erlenmeyer were subsequently filtered (100 microns mesh) and the retained materials were transferred to glass Petri dishes using miliQ water and observed under a stereomicroscope (SZX7, 56×, Olympus, Tokyo, Japan). During the observation the Petri dishes remained closed at all times, and when a possible plastic item was found, it was measured and photographed. Later the particle was extracted and analyzed under anEclipse 50i microscope (type 104, Nikon, Tokyo, Japon) equipped with a polarized light filter (Ascer 2015, Nikon, Tokyo, Japon) to confirm that it was indeed aplastic, and was stored in a 2 mL eppendorf tube. Polarized light allows us to identify polymers such as polyethylene, polypropylene and polyethylene terephthalate, because they are anisotropic materials. These materials appear bright while other materials appear completely dark [46]. In the case of particles that were not optically active under polarized light, the ‘hot needle’ technique was also used to evaluate their response [46,47]. Once confirmed asa plastic item, the particles were classified into fibers or fragments, and were also measured based on their maximum length and separated according to their size and color.

2.4. Estimation of Plastics at Species and Community Level

The presence of plastic debris was accounted per analyzed individual, per stream, and per land use group. Average presence of plastic items per individual and land use group were calculated, as well as the average presence per species.
With the obtained calculation of plastic items per fish and per fish biomass we extrapolated the information at the community level. Starting off the data of plastic items consumed per individual biomass, the average per gram of individual analyzed was obtained, for each species. This value is then extrapolated to the total weight collected per each species, to obtain a value of plastic items weighted per gram per species. The sum of the data for each species allowed us to estimate the total amount of plastic consumed per unit area (m2). This estimation allowed us to obtain the amount of plastic per square meter (items·m−2) corrected by biomass. The same procedure, considering the mean number of plastic items per individual of each species, and the density estimate for each stream (ind.m−2), allowed us to estimate the amount of plastic per square meter for the whole community (items·m−2) corrected by density of individuals.

3. Statistical Analysis

To assess if there were differences between the two land use categories, using three replicates for eachfish community we compared density, richness, biomass, and for water parámeters pH, dissolved oxygen, phosphorus, nitrogen and temperature, using Mood’s median test. This test compares medians between groups and can be applied to groups without normal distribution and heterogeneity of variance [48].
For plastics both fibers and fragments were treated as one group. Three approaches were used to evaluate possible differences between the two land use categories. (i) On the one hand, a generalized linear mixed model of the negative binomial family was used to evaluate the relation between the number of plastic items per individual (count variable) with the land use type and the individual’s trophic group (categorical variables). (ii) On the other hand, the presence/absence of plastics in each sample (binomial variable) was analyzed based on the explanatory variables used in the previous model. In order to compare this relationship, a generalized linear mixed model of the binomial family was fitted. (iii) Finally, the number of plastic items per gram of fish (continuous numerical variable) was compared on one side between Urban and Extensive Ranching, and on the other hand between the same trophic group from different land use. Both analyses were carried out using a Generalized Linear Mixed Model (GLMM) from the log normal family. However, these analyses could not be performed for Invertivorous and Piscivorous due to the different body size ranges between land uses for these trophic groups. In all cases, the identity of the species was used as a random variable seeking to eliminate the possible correlation between data obtained for the same species.
Cnesterodon decemmaculatus was selected for specific analysis as it was the only species that occured in all sites. In this way, a GLMM from the binomial family, using the site identity as a random variable and stream type as fixed effect was generated. Using this analysis we compared if there were differences in the probability of plastic ocurrence between Urban and Extensive Ranching streams for C. decemmaculatus.All these analyzes were carried out using free software R [49]. The generalized mixed models were fitted using the “lme4” package [50]. Residual analysis was carried out using the DHARMa package in the case of GLMM from the binomial family [51].

4. Results

All lowland streams are of similar watershed area, width and depth (Table 1). The order of urban streams is lower, which may be due to the practice of piping the lower orders (one and two) in urban areas. In the Extensive Ranching group (ER), there’s a predominance of coverage by natural herbaceous areas (mean 50.7% ± 30.3%), native forest (15.8% ± 27.3%) and pastures (24.0% ± 13.2%). While in the watershed of the Urban (Ur) streams, there are important urban areas (25.3% ± 11.1%), predominantly irrigated and rainfed crops (41.3% ± 19.8%) and in third place the natural herbaceous (21.7% ± 8.1%). There were significant differences between both groups for dissolved oxygen, pH, nitrogen and phosphorus (Mood’s median, Chi2 = 6, p = 0.014), and non-significant differences for temperature (Mood’s median, Chi2 = 0.67, p = 0.41).

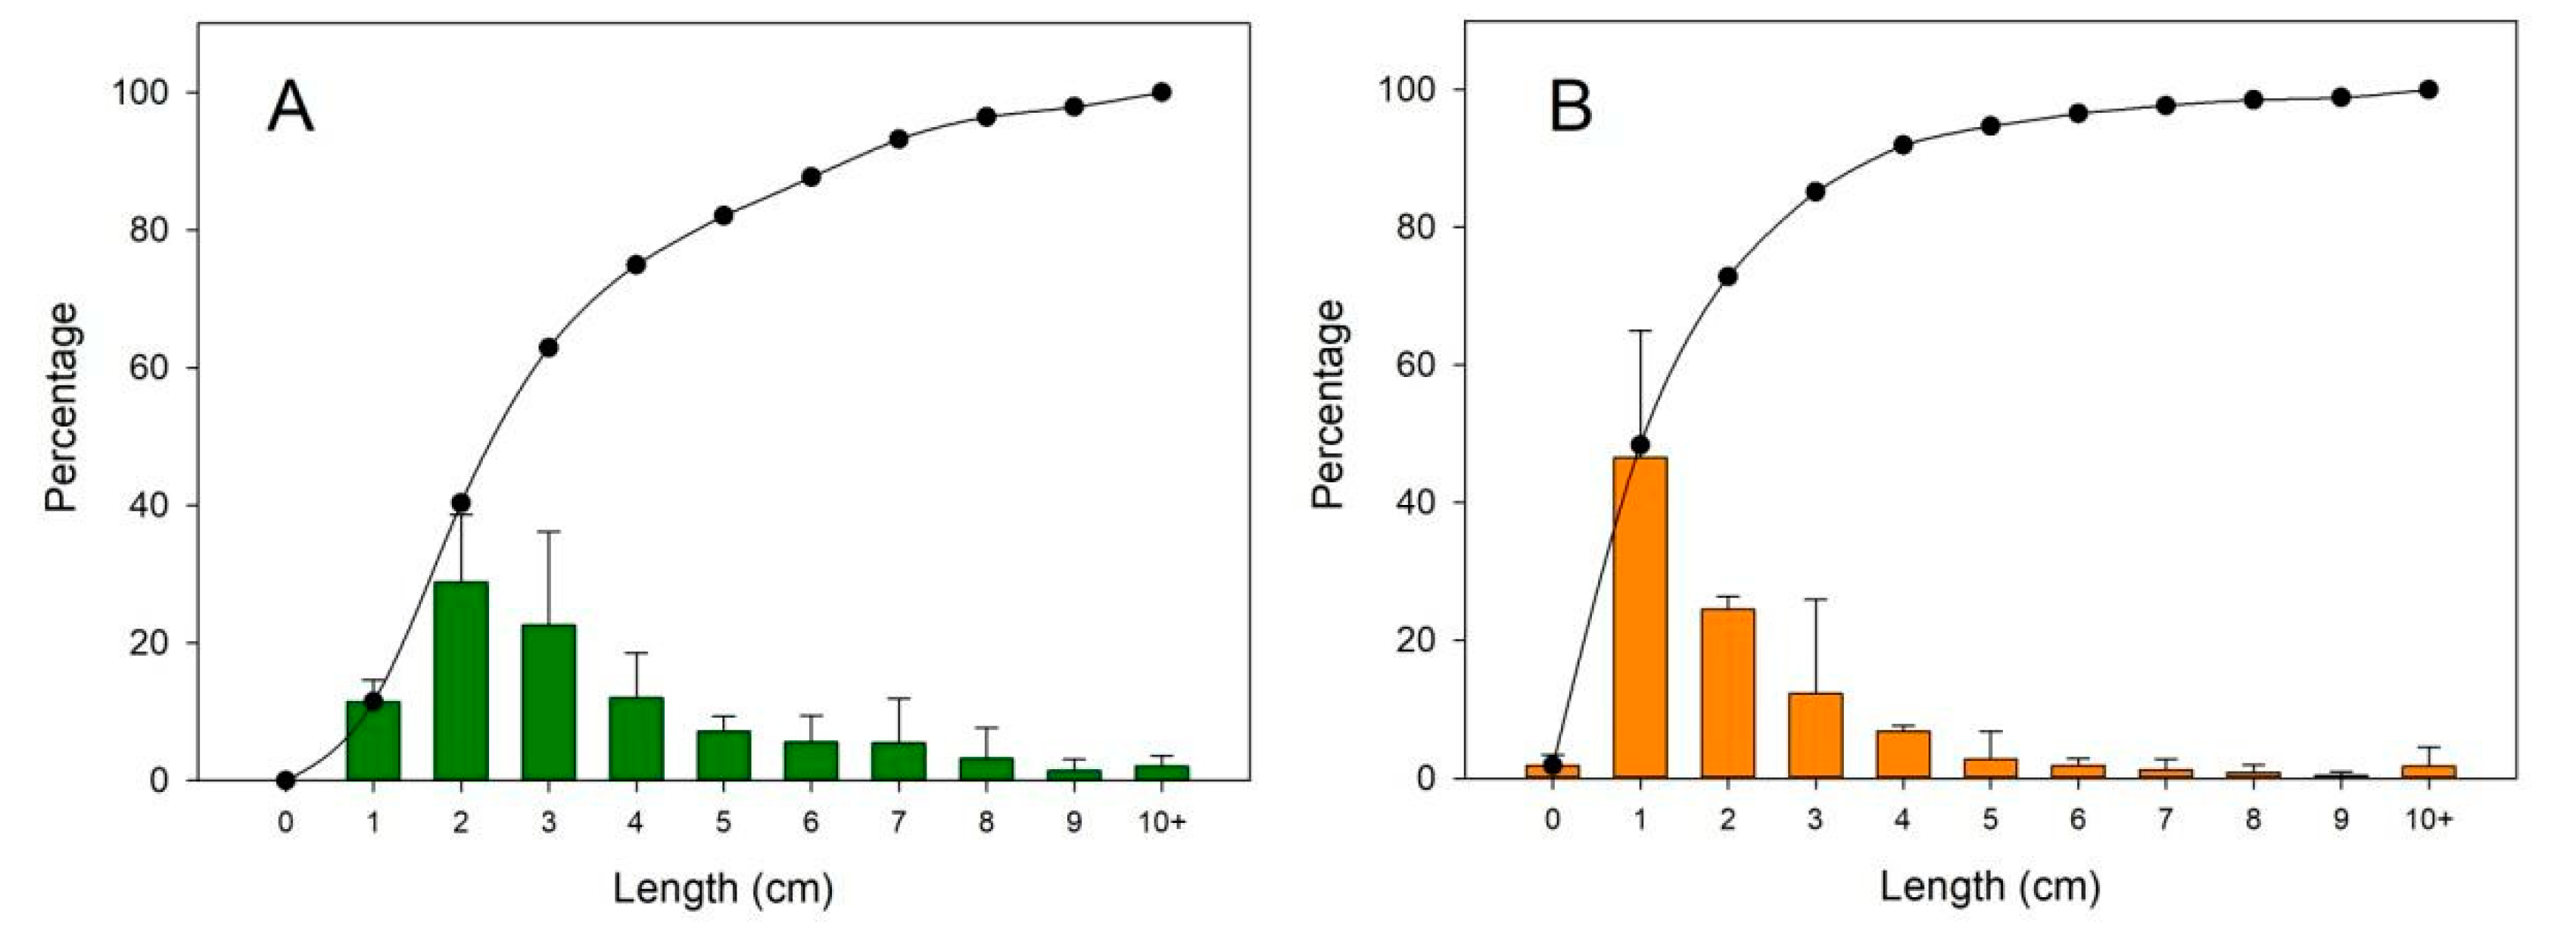
4.1. Fish Communities
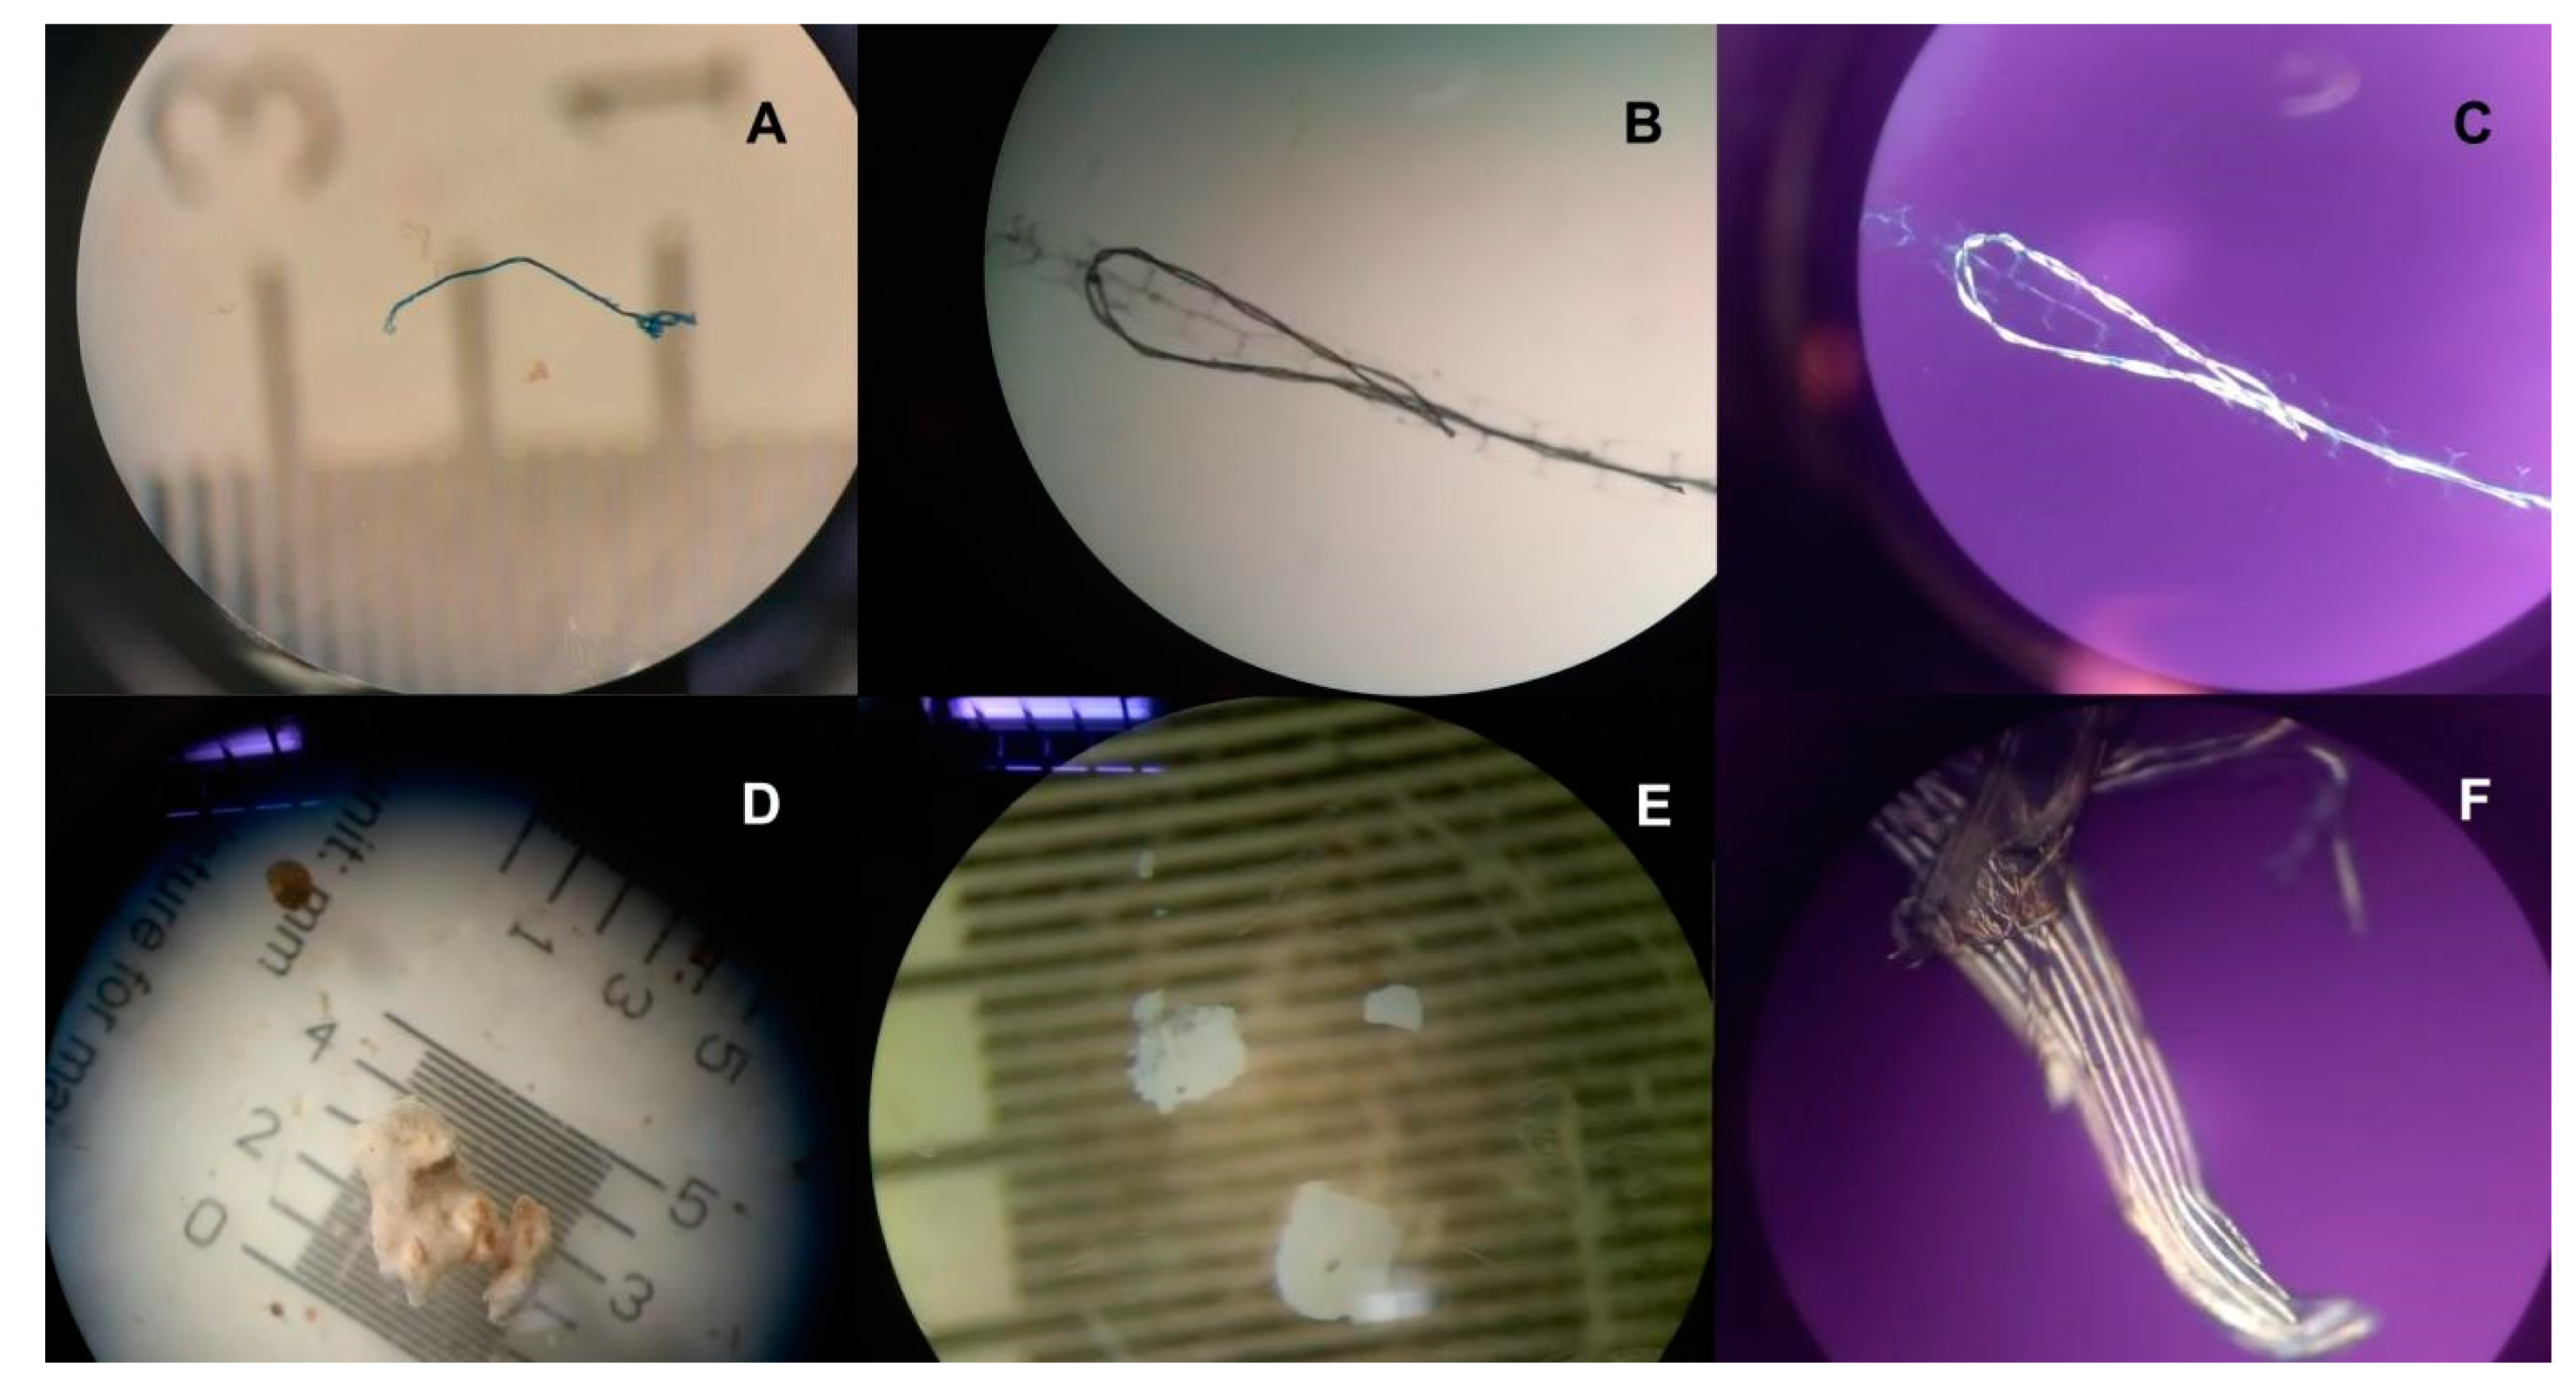
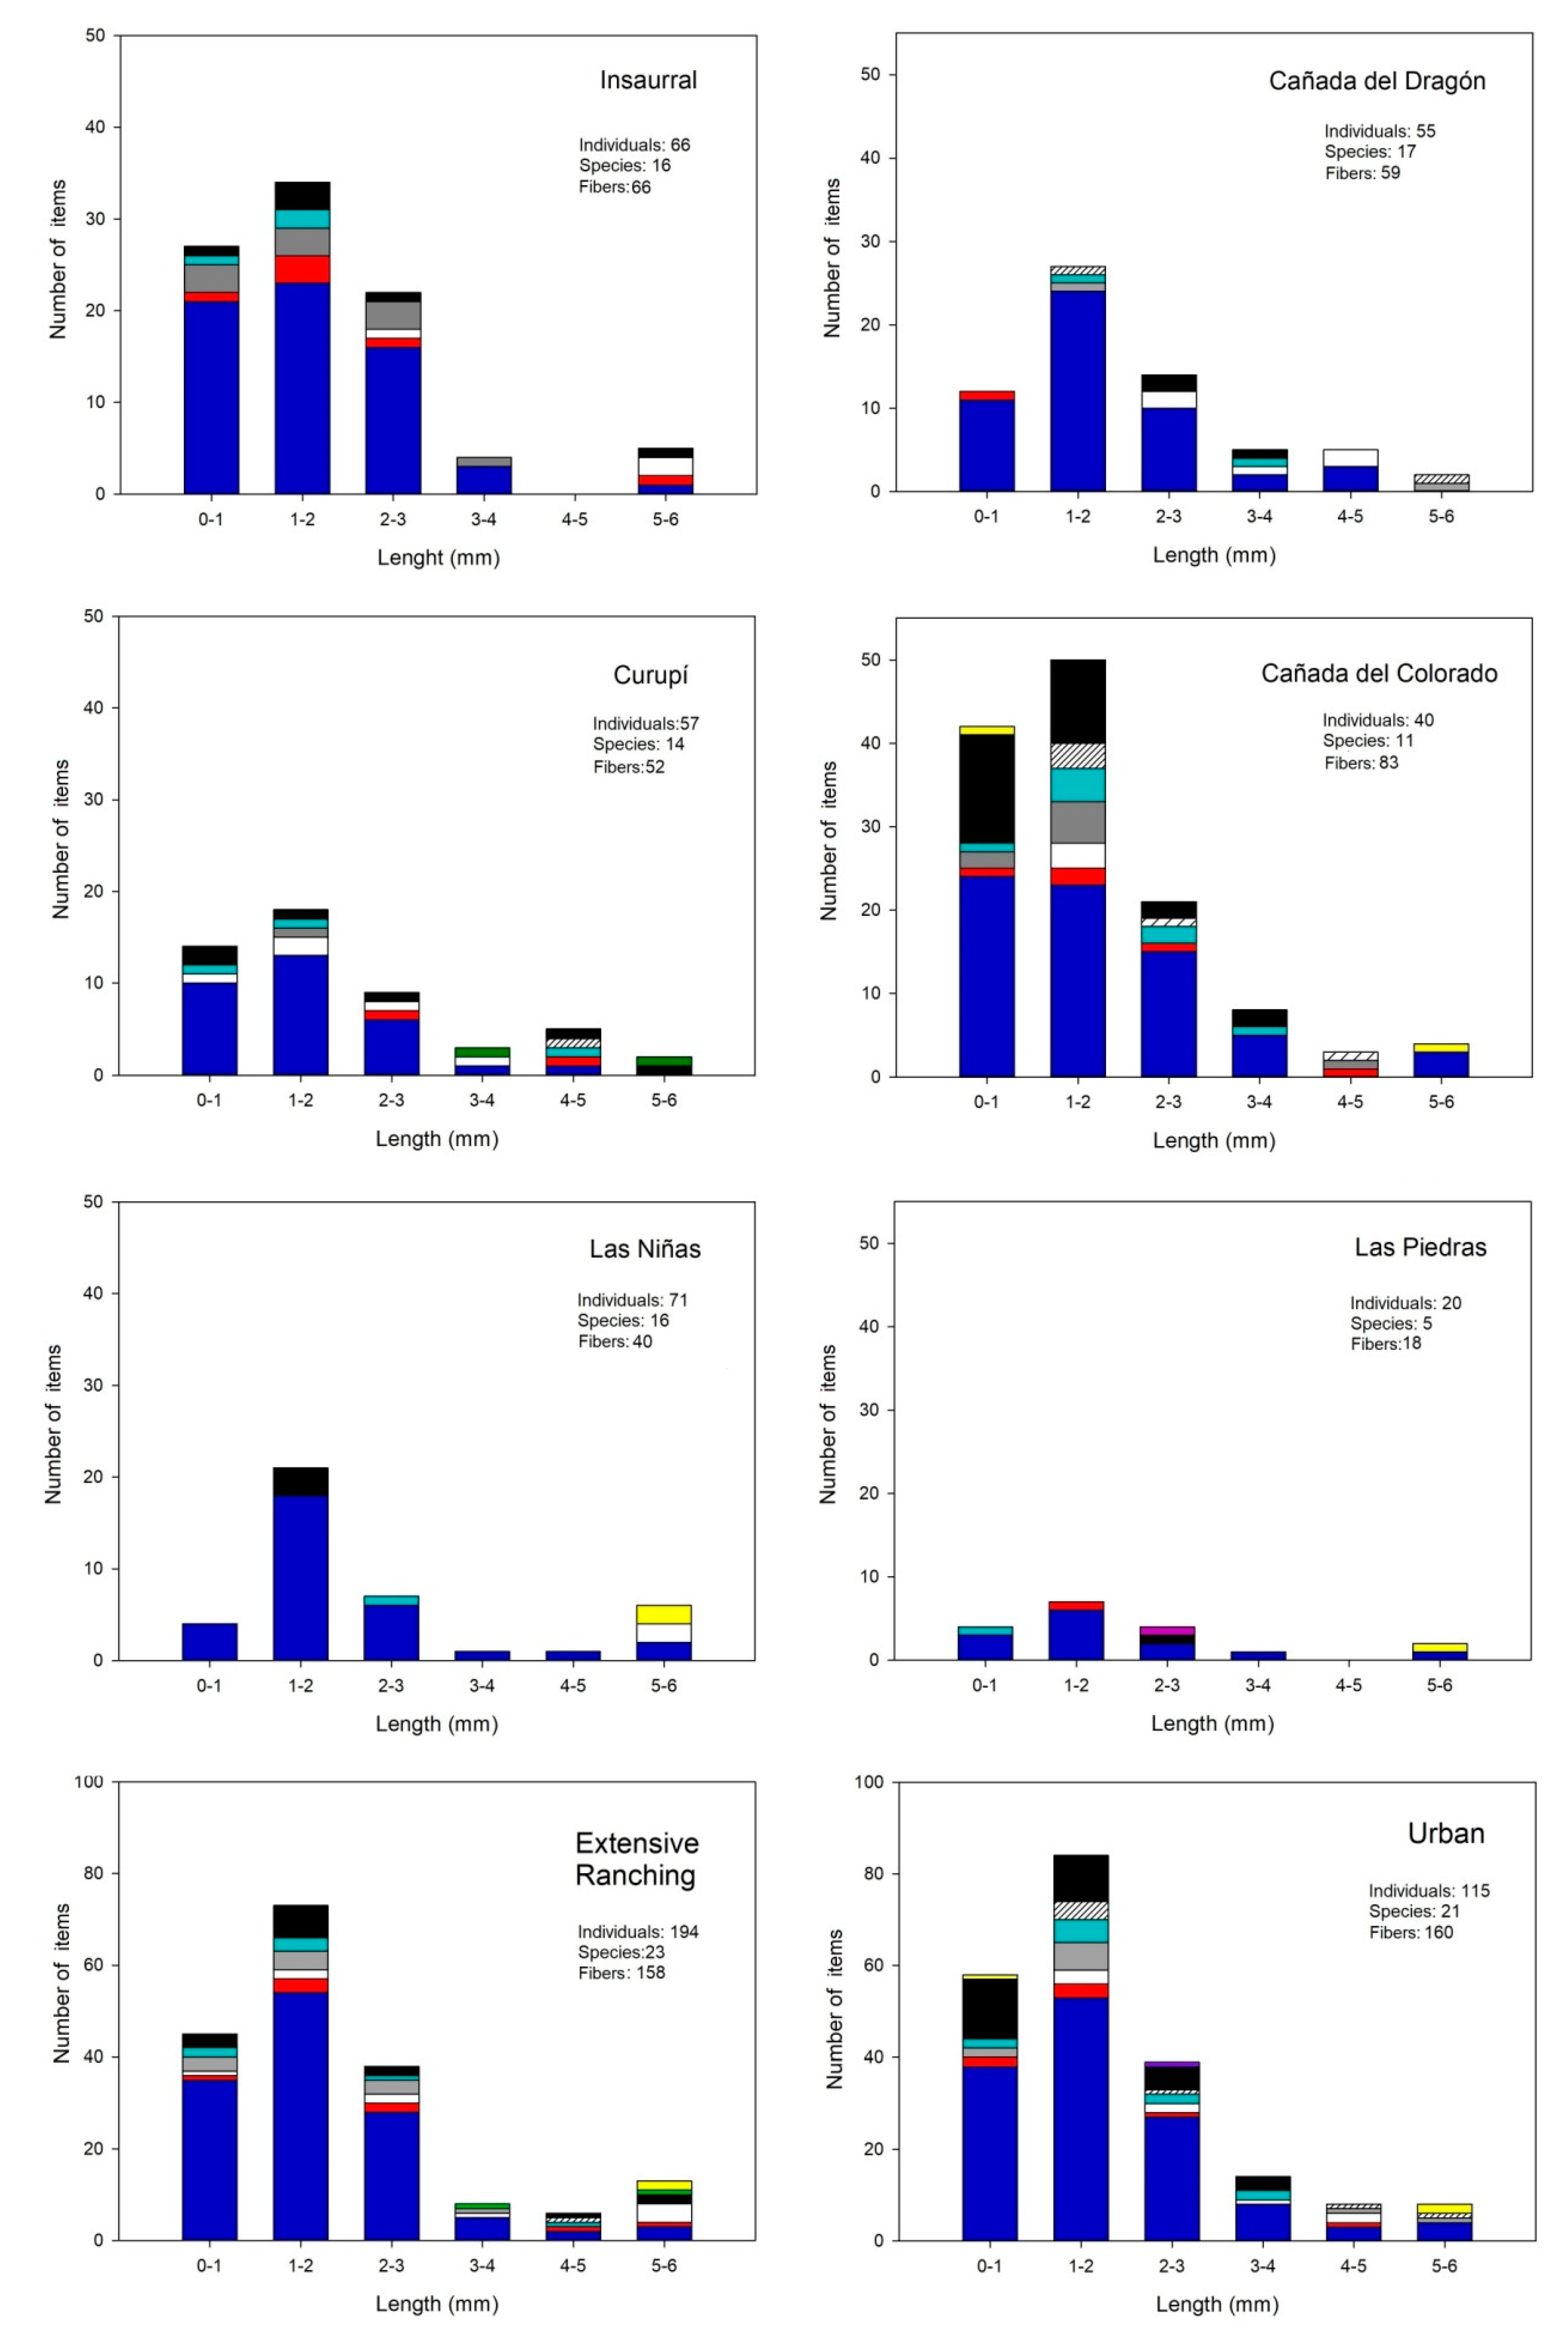
A total of 29 species of fish were found in the six sampled streams, with an average of 15 (±1) species in ER streams and 11 (±6) in Ur streams (with non-significant differences). The species found belong to four trophic groups: invertivores (11), detritivores (6), omnivores (11) and piscivores (1) (Annex 1).
The ER streams presented a significantly higher biomass than the Ur streams (8.64 ± 1.95 g.m−2 and 1.52 ± 0.45 g.m−2, respectively) (Mood’s median, Chi2 = 6, p = 0.014). However, the density of individuals didn’t present a significant difference between Ur (10.0 ± 11.0 ind.m−2) and ER streams (7.65 ± 4.26 ind.m−2) (Mood’s median, Chi2 = 0.67, p = 0.41).
The order with the highest relative abundance in ER streams was Characiformes (55.53 ± 18.65), while in the Ur streams it was Cyprinodontiformes (62.90 ± 35.94). The species with the highest relative abundance for the first stream group were Cnesterodon decemmaculatus (21.0 ± 8.7), Characidium rachovii (11.8 ± 11.5) and Ectrepopterus uruguayensis (9.5 ± 10.4). In Urban streams they were C. decemmaculatus (53.6 ± 49.7), Phalloceros caudimaculatus (9.0 ± 15.6) and Bryconamericus iheringii (7.5 ± 12.2). The only one present in all systems was the tolerant species C. decemmaculatus (Table 2).
Regarding size distribution, ER streams contained fish communities with longer individuals compared to the communities of Ur streams. In ER streams 90% of the individuals were smaller than 6 cm and 25% while in Ur systems, 90% of the individuals were smaller than 4 cm (Figure 2A,B, respectively).

4.2. Plastic Debris

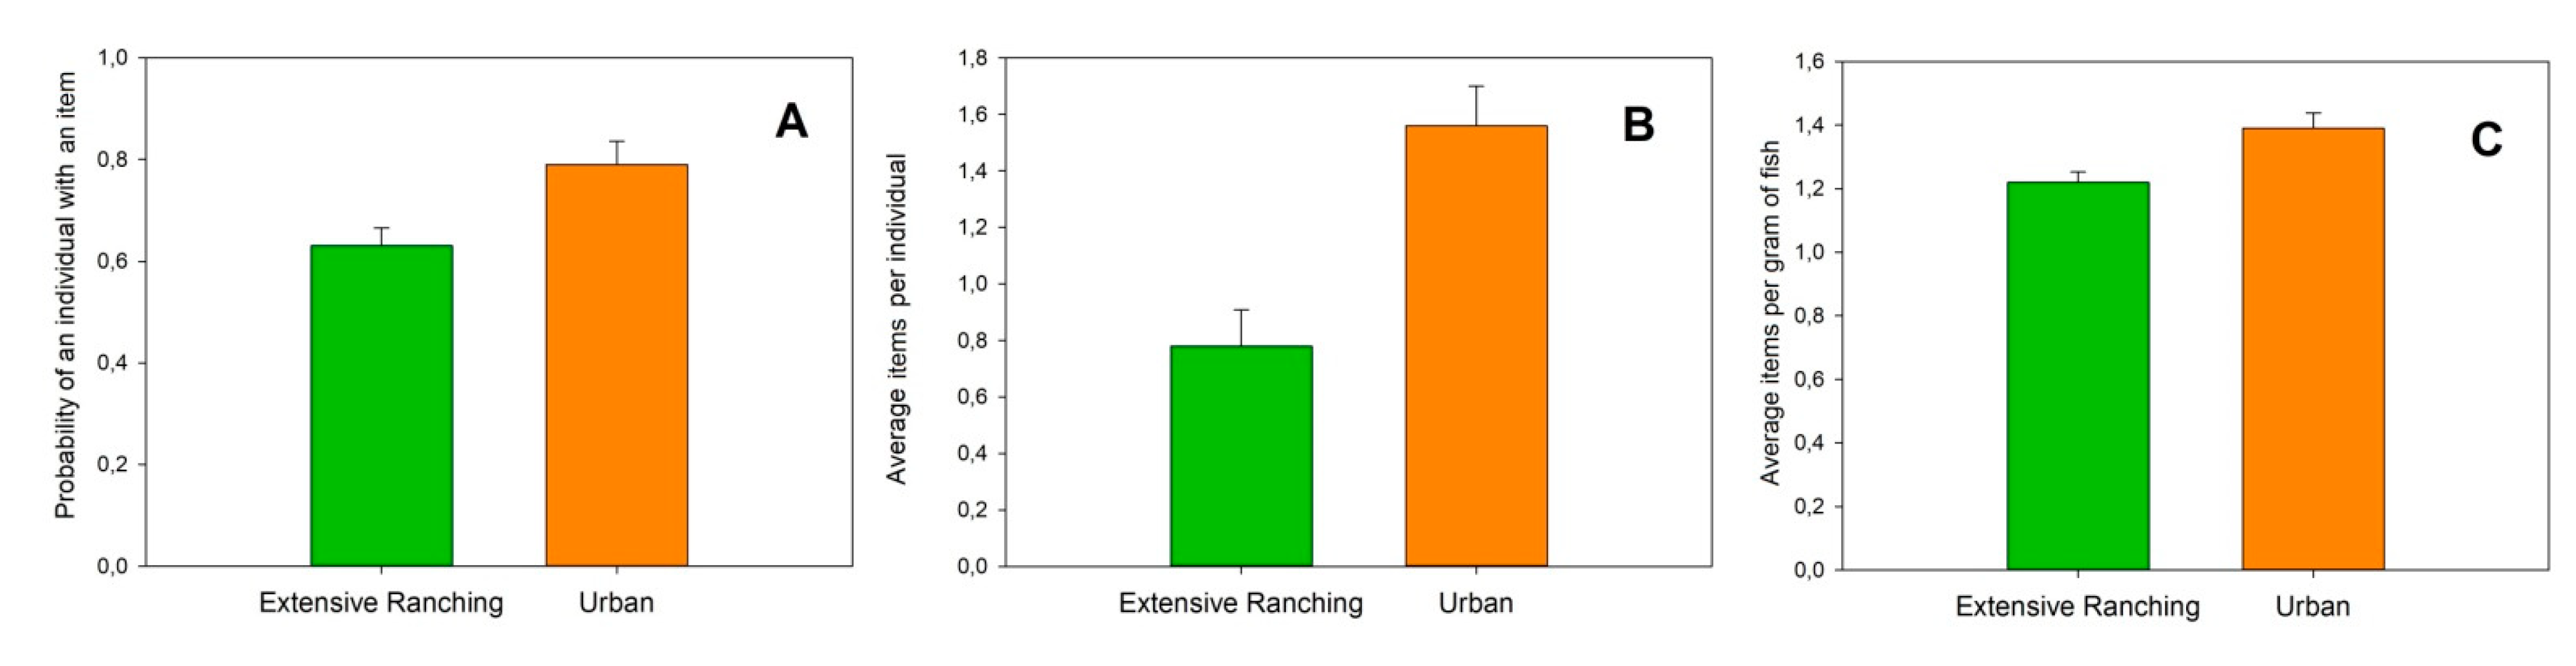
4.2.1. Community Level and Land Use

The analysis of plasticdebris included 309 individuals of 29 species, from the six streams. Plastics were found in all streams and in 60% of the gut content analyzed (189 individuals of 309 analyzed), adding up to a total of 373 items, of which 85% were fibers (318) and 15% fragments (55) (Figure 3). This dominance of fibers was also found within each land use group, with 93.4% (±4.9) of the items found in ER streams and 82.3% (±7.1) in Ur streams. Fragments, however, were more abundant in Ur streams. Regarding the frequency of occurrence of these two types of plastics in fish digestive tract, 59% of the individuals presented fibers, while only 9% presented fragments. The most frequent color among fibers was blue (67%), and white for fragments (87%) (Figure 4). Of the total of items collected, 5.1% (19 items) measured between 5–6 mm (63% were fibers and 37% fragments), of these 59% correspond to ER systems and 41% to Ur. The most abundant size between items under 5 mm was between 1–2 mm for both types of systems (40% ER and 36% Ur).
The gut contents of ER streams account the 46% of the total registered plastic particles (172 items, Insaurral 20%, Curupí 15%, Las Niñas 11%, from the total items), and the remaining 54% was registered in Ur streams (201 items, Cañada del Dragón 20%, Cañada del Colorado 29%, Las Piedras 5%).
The probability that one fish contains plastic items was significantly higher in the Ur streams in comparison with ER streams (0.78 and 0.55, respectively; ANOVA, F = 8.15, p = 0.004) (Figure 5A). Regarding the number of plastic itemsper individual, the model shows that the mean number ofitems per individual is also significantly higher in the Ur streams in comparison with ER streams (1.76 and 0.90, respectively) (ANOVA, F = 8.15, p = 0.004) (Figure 5B). Based on the results of plastic items in gut content, an estimation of the number of items per gram of individual for each of the groups of streams showed significantly higher values in Ur streams (mean = 1.39) than in ER streams (mean = 1.22) (ANOVA, F = 8.19, p = 0.004) (Figure 5C).
From the results of the abundance of plastics in the gut content and the fish density (individuals and biomass per square meter), an estimation of the number of plastic items consumed per square meter at the moment of sampling was obtained (Table 3). Although no significant differences were observed between the two types of systems for the plastics estimated per fish biomass per square meter (items.m−2) nor by plastics estimated per individual per square meter (items.m−2) (in both cases Mood’s Media, Chi2 = 0.67, p = 0.41), a trend of higher density was observed in the Urban group (Table 3).

4.2.2. Trophic Level Group Analysis

When taking account of the number of plastic items per trophic group, no differences were detected between groups (Chi2 =3.77, p = 0.437). However, differences were found when comparing trophic groups from different land use systems. Both comparisons showed higher results in urban systems for Omnivores and Detritivores. The average mean value for Omnivores was 1.99 items·g−1 in Urban streams meanwhile it was 1.39 items·g−1 in Extensive Ranching streams (ANOVA, F = 20.26, p < 0.05). In the Detritivorous case, the mean value in Urban systems was 1.49 items·g−1, while in Extensive Ranching systems the mean value was 1.08 items·g−1 (ANOVA, F = 4.66, p = 0.05).

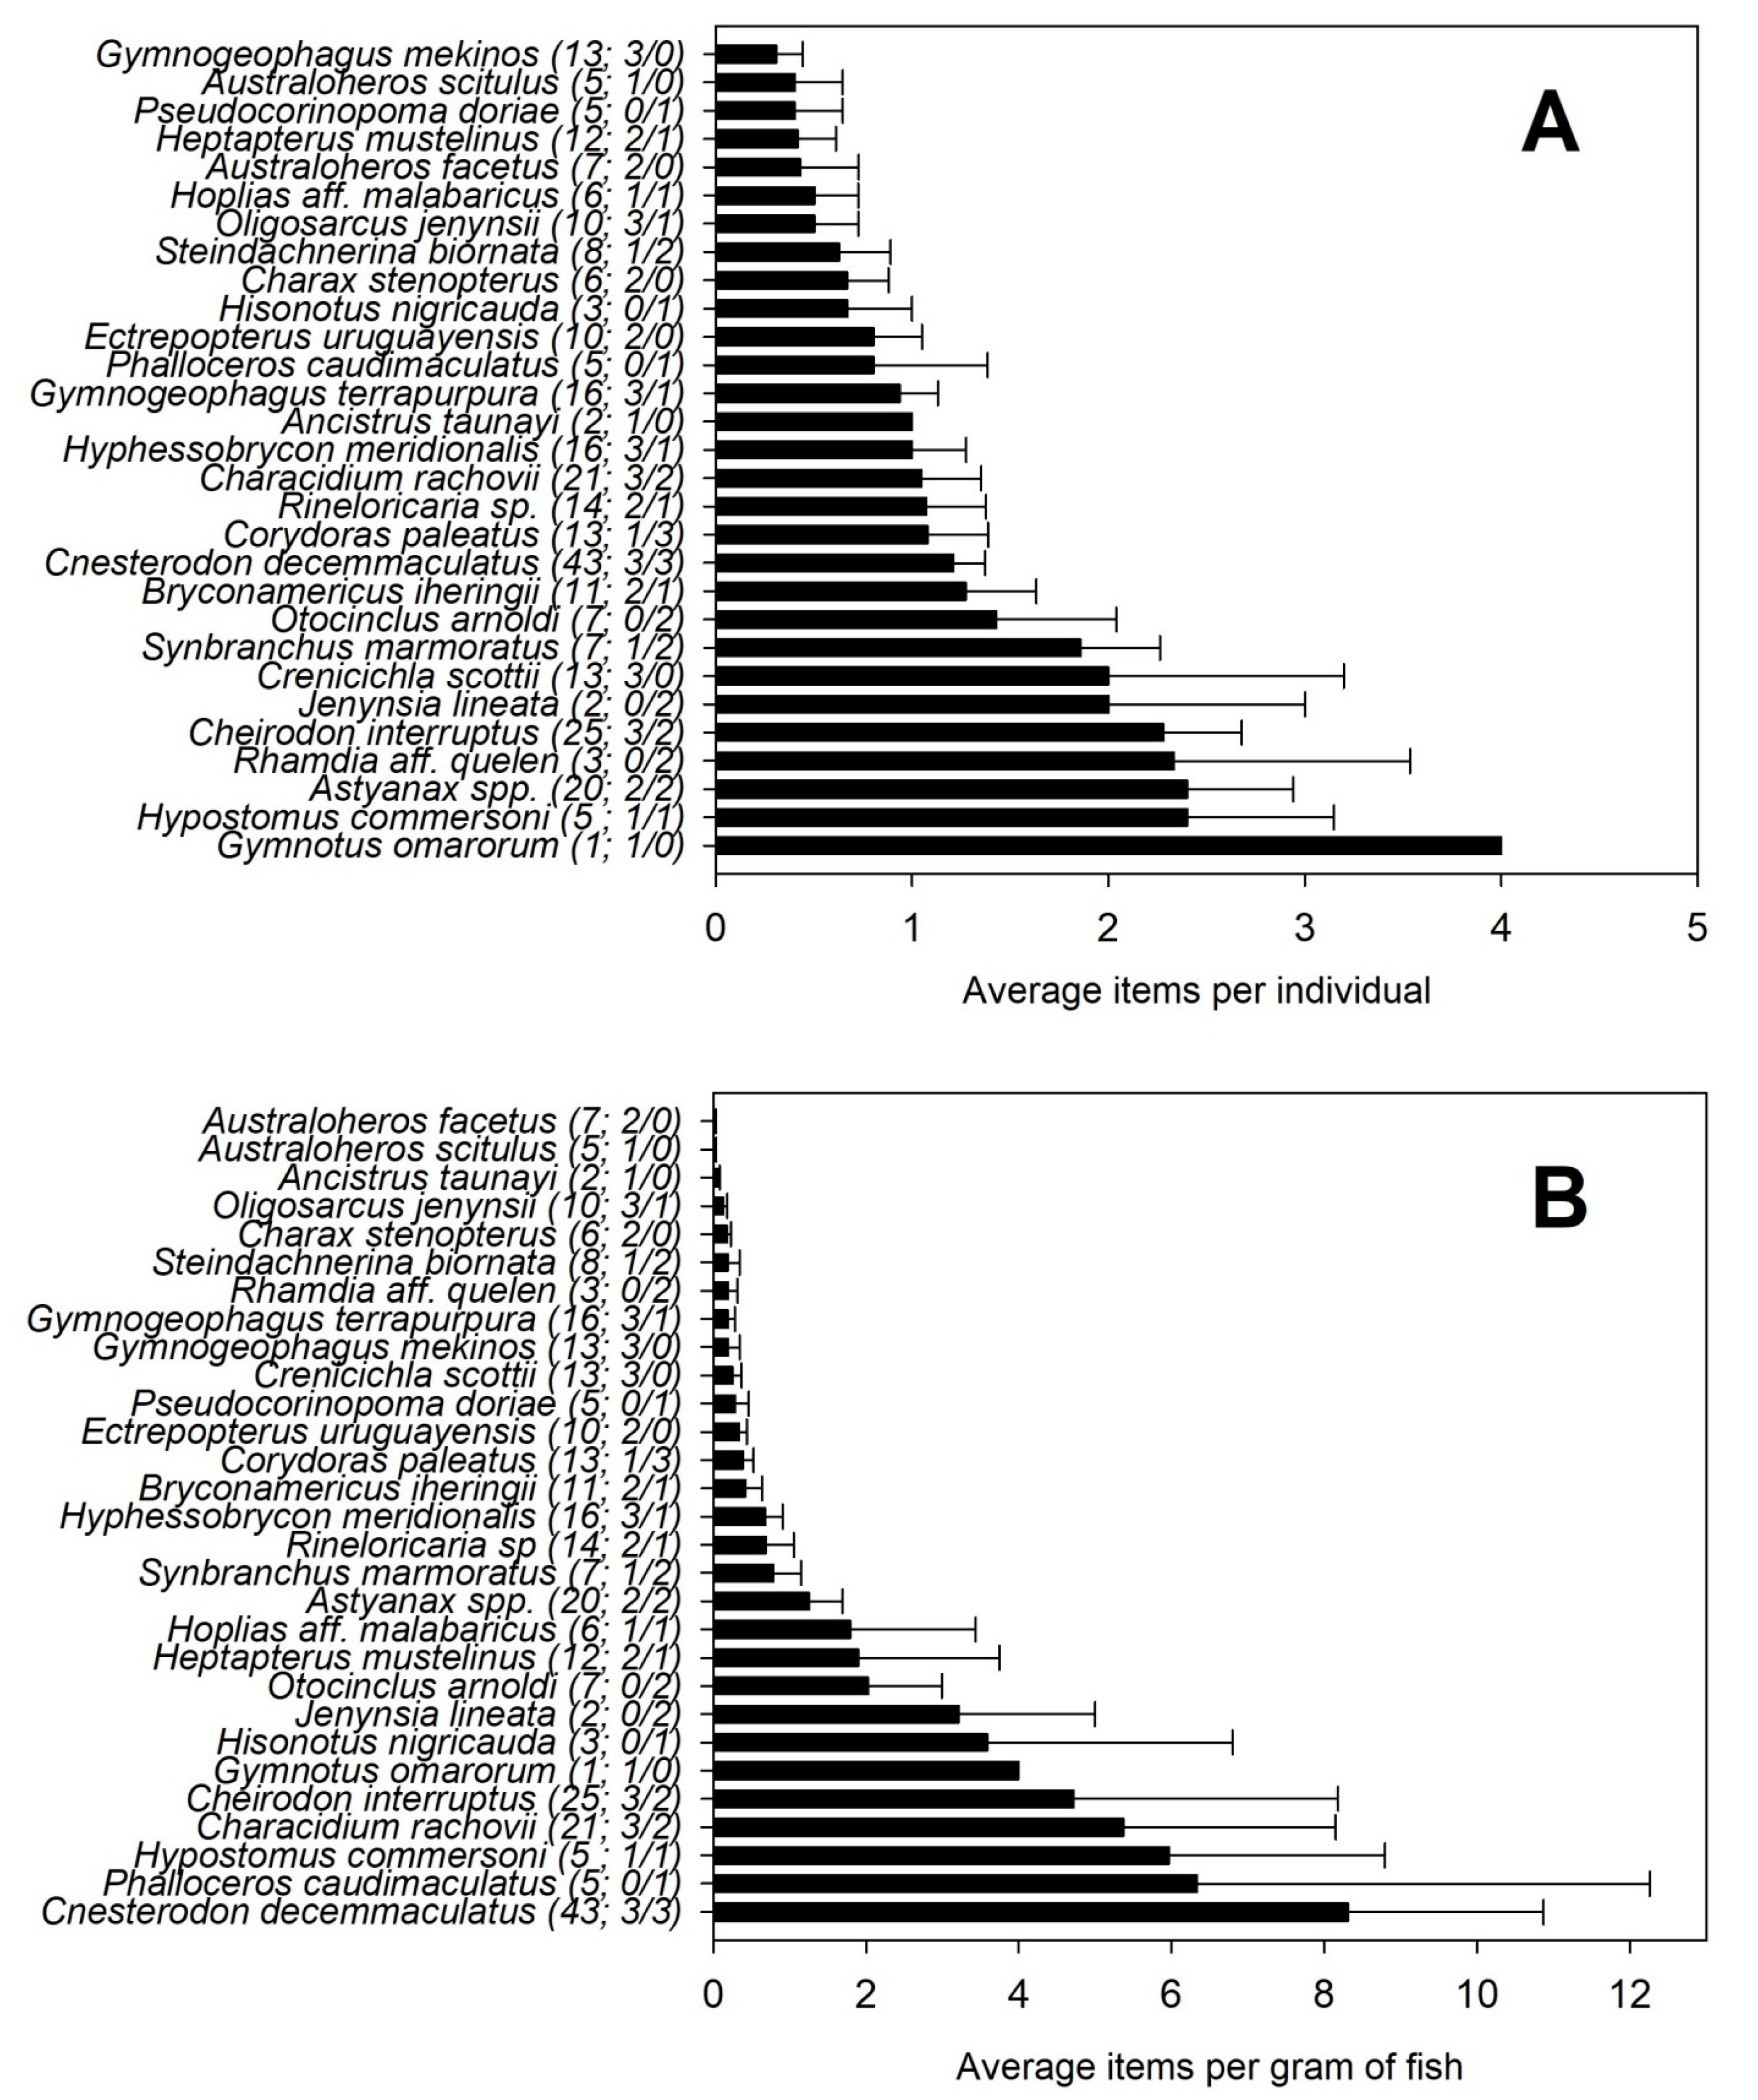
4.2.3. Species and Individual Level

A qualitative analysis of the consumption of plastic debris at the species level was carried out integrating all the individuals analyzed, regardless of the site in which they were collected. Because not all species were present in both types of systems, it was not possible to carry statistical comparisons.
All the species analyzed presented plastic items in at least one of the individuals analyzed. Hypostomus commersoni was the only species that presented at least one item in all the individuals analyzed, and the one that showed the highest average number of particles per individual (2.4 items·ind−1) in at least three individuals.
At the individual level, the highest number of fibers was found in a Crenicichlascotti with (16 items) in the Insaurral stream (ER group), while the highest number of fragments were found in two individuals of Astyanax spp. (seven items each) at the Cañada del Colorado stream (Ur group).
The species with the lowest meannumber of plastic items per gram of individual was Australoheros facetus (0.021 items·g−1), while Cnesterodon decemmaculatus was the one with the highest amount (8.3 items·g−1, Figure 6B). Cnesterodon decemmaculatus was present at all sites, and the GLMM analysis carried out didn’t show any significant differences in the mean number of plastics between land use groups (i.e., ER and Ur) (ANOVA; F = 0.14; p = 0.71).

5. Discussion

This work analyzes for the first time the incidence of plastic debris in the gut content in stream fish communitiesin Uruguay, including the potential effect of land use. Being the first antecedent in Uruguay, the results obtained from this research are of utmost importance due to the limited information available on the incidence of microplastics at the fish community levelin streams at international level.
The streams analyzed presented both physico-chemical and fish communities with differential characteristics. The studied Uruguayan systems affected by urbanization tend to have poorer water quality than extensive ranching streams, and less diverse fish communities, characterized by fish of a smaller size, as has been reported in previous studies [51]. Regarding the incidence ofplastic pollution, urban and peri-urban systems presented a higher percentage of fish that consumed plastic debrisand a significantly higher amount of items per gram of fish, compared to extensive ranching systems.
A great variety of plastics were found in the analyzed streams, regarding size, shape, and coloration. Both fibers and fragments were present in all sites and thus in both types of systems, although to a greater extent in the streams from the Urban group, supporting the hypothesis about the greater contribution and consumption by the communities of these streams. The high percentage of fibers with respect to fragments or other types of plastic debris is consistent with the bibliography, as fibers have been documented as the most common and even the only form found in some cases [4,13]. Although fibers are considered less harmful relative to fragments in terms of their consequences to the digestive system (lacking sharp edges or thickness that could lead to blockages), they would be more likely to accumulate in the digestive system [18].
Regarding the color of the plastics found, a predominance of blue fiber is consistent with previous data from the region and world trends [4,13,25,52,53,54,55]. This prevalence of blue colored fibers could be associated with the resistance of this colour to UV radiation degradation [56]. In the case of the fragments, the predominant color was white, coinciding with data from more distant areas [54] but not with previous results for the region, where the highest abundance found was of blue fragments [13]. According to Wang et al. [20], a higher consumption of white MPs could be not only due to its greater availability but also to its similarity in coloration with certain types of zooplankton, being able to generate in some species an active consumption. However, it is not yet clear how shape, density and coloration of the plastic debris relates to selectivity and feeding habits of different species of fish [20,57].
In agreement with our expected results, we found a higher percentage of individuals with plastic debris in Urban streams. This coincides with recent studies carried out in Brazil which show a positive relationship between the incidence of MPs by the fish community and the urbanization area [13]. Although in our case we also found higher amounts in the urban systems, the percentage of individuals taht consume plastic items was much higher than the reported by García et al. [6] for the Ivaí river in the state of Paraná (37% in Brazil versus 76% in Uruguay). Regarding non-urban systems, studies in the region report values of 28% [6] and 50% [58] of individuals with presence of MPs, which are similar to those obtained in our Extensive Ranching systems analyzed (51.6 ± 9.8%, adding MPs and MesoPs).
When analyzing the average number of items consumed in both streams groups, no significant differences were found, suggesting that at an individual level the fishes of Ur systems would not necessarily consume more plastic than those of ER systems. Although this was not expected, it is possible that the potential contribution of plastic debris by the activities carried out in ER systems may have been underestimated. In this sense, environments outside urbanized areas may be receiving significant contributions of MPs from multiple sources, both poor waste disposal in the area, contribution of the productive activities in the watershed, or the atmospheric deposition [9,59]. Recent studies have also described significant concentrations of MPs in undeveloped and remote areas [7,59]. The physical and meteorological patterns behind paths and fates of small plastic debris are yet to be fully understood, but it is clear that once suspended they can be transported from a few hundreds of kilometers, favoring the presence of these particles in areas with less human activity than the one from which they originated [59]. It is common to consider that a water course is influenced by the activities that take place directly in its watershed, but in future research it may be necessary to consider external factors and activities carried further away from them since the arrival by atmospheric deposition can represent an important source of entry of MPs into aquatic systems. Another factor that may be explaining why at the individual level there would be no differences in plastic consumption between Ur and ER streams is the possible existence of a “consumption threshold”. This threshold has recently been documented, and would be given by passive consumption and a common general concentration of MPs that could be masking the expected relationship of maximum levels of MPs consumption in Ur streams [56,60]. In this sense, it is crucial to complement gut content analysis with sediment and water analysis, in order to determine what is the offer of plastic debris, and particularly MPs, in the environment and thus understand more integrally the dynamics of interaction.
There is scarce research on the consumption of plastics at a community level in freshwater environments and thus this study proposes a new level of analysis, evaluating in two different and complementary ways, the possible load of MPs and MesoPsin the community (estimate by density of fish ind·m−2 and by total biomass of fish g·m−2). These results show an increase in the plastic items load for both estimates in urban sites, which is consistent with our hypothesis. These density estimates could allow us to extrapolate up to the load of “active plastic” or plastic circulating in food chains. However, different estimates of plastic load (items·m−2) are obtained depending on whether we start from individuals (ind·m−2) or biomass (g·m−2) even from the same stream. These results suggest that variations in the size of individuals and species may be affecting their relationship with plastic consumption. A smaller body size could make a species more vulnerable, compared to bigger species, which at first sight do not show a higher average consumption of plastics, but there is a higher ratio of particles per gram.Although at first glance its average consumption may not be higher and may even be much lower than that of a larger species, its item load per gram could be much higher. In this context, it is also relevant to include the analysis of the presence and concentration of contaminants associated with plastic debris [20,22]. In this sense, equal consumption of plastics per individual, assuming the same pollutant load per plastic consumed, would imply greater consequences in the smallest individuals due to a higher ratio of pollutant load to biomass, and therefore a greater risk due to this anthropogenic hazard. This could be also particularly important for early stages of development and juvenile individuals regardless of species [61]. Although this first approach still needs to be pushed forward and refined in other studies, combining it, for example, with the analysis of the load/supply of plastic debris from water, sediment and other compartments, or the analysis of contaminants related to plastics, it would may give a systemic vision of this pollution.
Considering the study case of C. decemmaculatus, there were no significant differences in the consumption of MPs between ER and Ur systems, so this small omnivorous species would be affected regardless of land use. Like most, this species showed a higher incidence of fibers rather than fragments, probably because the fibers can be easier to consume by having only one dominant dimension [56]. When considering the consumption of plastics in respect to the body weight C. decemmaculatus had the highest incidence rates. These results would support the hypothesis that smaller species would be more vulnerable even when their individual loads of plastic (items.ind−1)are not among the highest, due to a high incidence in respect to their biomass (items.g−1).These results can support the hypothesis that some species might be more vulnerable to consumption of plastic debris, although they do not show the higher averages of ingestion at the individual level, as it has been seen with other vertebrates [61].
Due to the variety of shapes and colorations of the plastics debris, as already mentioned, it is possible that some of these are consumed intentionally by being confused with food. Based on experimental results it has been observed that MPs are transferred and biomagnified in the trophic chain, and different eating habits may have different rates of MPs consumption, either directly or indirectly, exposing them to different consequences [13,27,45]. One of the most common and studied consequences of the intake of MPs in a variety of taxonomic groups is the accumulation in the digestive tract, which causes a false sensation of satiety and thus a deterioration in nutrient absorption, growth, metabolic rates and reproductive performance [13,60]. Recent studies have begun to analyze the physiological impacts that could result from MPs consumption, particularly in peptides and enzymes related to digestion, which may also affect fish at muscular and nerve function level [62,63,64]. Some studies have observed that between 2 and 40% of the individuals analyzed had ingested between one and seven plastic particles [45]. Compromise in predatory capabilities could be primarily detrimental in piscivorous species, being able to have effects in top down controls and in trophic networks, affecting ecosystem functioning [63,65].
Regarding MPs consumption and trophic habits, although the current evidence is not yet clear, generalist habits seem to expose individuals to a greater number of environmental compartments, and thus to greater exposure to a potential consumption of MPs [4,13,54]. Previous studies in South America found positive relationships between omnivory habits and the consumption of MPs [13,45], but our results do not show any significant differences in the mean number of items per fish and per gram between trophic groups. It is important to highlight that some authors are questioning the intentionality in the ingestion of MPs, and due to the variability of the omnivorous habit, it is possible that individuals passively ingest small plastic debris when foraging for food or along with their prey, so they could be more susceptible to ingestion of MPs [56,64,66,67].
From the hypothesis raised in this work we can conclude that the land use has an impact on the consumption of plastics by fish communities of lowland streams of Uruguay. This is evident from the highest number of individuals who presented plastic debris and the highest amount of items per gram in Urban streams. These results indicate a greater impact of plastic pollution on these systems, which is consistent with the bibliography analyzed. This work also proposes a new way to quantify and relativize the incidence ofplastics, both from estimates of density at the community level and consumption with respect to the number of individuals and their biomass. Beginning to use this type of estimations would make it possible to unify the data and make comparisons of communities, estimating the loads of plastic debris and also understand the intake at individual levels in these systems, both at trophic groups level and of species. The development, use and improvement of this kind of estimation would allow to unify data and achieve comparisons at the community level, estimating plastic loads at system level but also understanding intake at the individual level, and therefore at the level of species and trophic groups. Understanding these dynamics would help to estimate the plastic load circulating in streams and its balance, including what enters from watersheds and what could potentially reach estuaries and ultimately seas and oceans. The problem of plastics and microplastics pollution is of great interest and concern worldwide, therefore it is necessary to continue deepening the understanding of the relationship between these waste and biota, and especially in continental water courses, which have been relegated so far in the face of marine studies.

Author Contributions

Conceptualization, F.T.-d.-M., C.V. and J.P.L.; Data curation, C.V., G.T. and J.P.L.; Formal analysis, C.V. and G.T.; Funding acquisition, G.G.; Investigation, C.V., G.G., F.T.-d.-M. and J.P.L.; Methodology, C.V. and F.T.-d.-M.; Project administration, F.T.-d.-M.; Supervision, F.T.-d.-M. and J.P.L.; Writing—original draft, C.V. and F.T.-d.-M.; Writing—review & editing, C.V., G.T., G.G., F.T.-d.-M. and J.P.L. All authors have read and agreed to the published version of the manuscript.

Funding

Funding acquisition, Guillermo Goyenola, Franco Teixeira-de-Mello and Juan Pablo Lozoya.

Data Availability Statement

The datasets used and/or analysed during the current study are available from the corresponding author on reasonable request.

Acknowledgments

Fish sampling in Canelones’ streams was associated with the biomonitoring within the framework of the collaboration agreement between CURE/Universidad de la República and the Intendencia Departamental de Canelones. We would like to thank the technicians who collaborated in the field sampling of the macro project: Maite Burwood; Clementina Calvo; Carmen Casás; Laura Capuccio; Carlos Iglesias; Agustina Linazza; Daniela Olsson; Pablo Raftopulos; Lucía Urtado and Nicolás Vidal. Evelyn Krojmal, Bárbara Defeo and Gissell Lacerot provided laboratory support. FTM, GG and JPL gratefully acknowledge the support of the “Programa de Desarrollo de las Ciencias Básicas” PEDECIBA (Geociencias and Biología) and the “Sistema Nacional de Investigadores” (SNI-ANII). Finally, we would like to thank the two anonymous reviewers who helped to improve the quality of the manuscript, as well as the special issue editors Pietro Volta and Erik Jeppesen who invited us to participate in this issue.

Conflicts of Interest

The authors declare that they have no conflicts of interest.

References

  1. Wetzel, R.G.; Likens, G.E. Limnological Analyses, 3rd ed.; Springer: Berlin/Heidelberg, Germany, 2000. [Google Scholar]
  2. Allan, D.J.; Castillo, M.M. Stream Ecology: Structure and Function of Running Waters, 2nd ed.; Springer: Berlin/Heidelberg, Germany, 2007. [Google Scholar]
  3. Wagner, M.; Scherer, C.; Alvarez-Muñoz, D.; Brennholt, N.; Bourrain, X.; Buchinger, S.; Fries, E.; Grosbois, C.; Klasmeier, J.; Marti, T.; et al. Microplastics in freshwater ecosystems: What we know and what we need to know. Environ. Sci. Eur. 2014, 26, 12. [Google Scholar] [CrossRef] [Green Version]
  4. Pazos, R.S.; Maiztegui, T.; Colautti, D.C.; Paracampo, A.H. Microplastics in gut contents of coastal freshwater fish from Río de la Plata estuary. Mar. Pollut. Bull. 2017, 122, 85–90. [Google Scholar] [CrossRef]
  5. Horton, A.A.; Dixon, S.J. Microplastics: An introduction to environmental transport processes. WIREs Water. 2017, 5, e1268. [Google Scholar] [CrossRef] [Green Version]
  6. Sá, L.C.; Oliveira, M.; Ribeiro, F.; Lopes Rocha, T.; Futter, M.N. Studies of the effects of microplastics on aquatic organisms: What do we know and where should we focus our efforts in the future? Sci. Total Environ. 2018, 645, 1029–1039. [Google Scholar] [PubMed]
  7. Wright, S.L.; Ulke, J.; Font, A.; Chan, K.L.A.; Kelly, F.J. Atmospheric microplastic deposition in an urban environment and an evaluation of transport. Environ. Int. 2019, 136, 105411. [Google Scholar] [CrossRef]
  8. Lozoya, J.P.; Teixeira de Mello, F.; Carrizo, D.; Weinstein, F.; Olivera, Y.; Cedrés, F.; Pereira, M.; Fossati, M. Plastic and microplastics on recreational beaches in Punta del Este (Uruguay): Unseen critical residents? Environ. Pollut. 2016, 218, 913–941. [Google Scholar] [CrossRef]
  9. Bellasi, A.; Binda, G.; Pozzi, A.; Galafassi, S.; Volta, P.; Bettinetti, R. Microplastic Contamination in Freshwater Environments: A Review, Focusing on Interactions with Sediments and Benthic Organisms. Environments 2020, 7, 30. [Google Scholar] [CrossRef] [Green Version]
  10. Dris, R.; Imhof, H.; Sanchez, W.; Gasperi, J.; Galgani, F.; Tassin, B.; Laforsch, C. Beyond the ocean: Contamination of freshwater ecosystems with (micro-) plastic particles. Environ. Chem. 2015, 12, 539–550. [Google Scholar] [CrossRef]
  11. Mason, S.A.; Daily, J.; Aleid, G.; Ricotta, R.; Smith, M.; Donnelly, K.; Knauff, R.; Edwards, W.; Hoffman, M.J. High levels of pelagic plastic pollution within the surface waters of Lakes Erie and Ontario. J. Great Lakes Res. 2020, 2, 277–288. [Google Scholar] [CrossRef]
  12. Carpenter, E.J.; Smith, K.L. Plastics on the Sargasso Sea Surface. Science 1972, 175, 1240–1241. [Google Scholar] [CrossRef]
  13. Garcia, T.D.; Cardozo, A.L.P.; Quirino, B.A.; Yofukuji, K.Y.; Ganassin, M.; Dos Santos, N.; Fugi, R. Ingestion of microplastic by fish of different feeding habits in urbanized and non-urbanized streams in Southern Brazil. Water Air Soil Pollut. 2020, 231, 434. [Google Scholar] [CrossRef]
  14. Druis, K.; Coors, A. Microplastics in the aquatic and terrestrial environment: Sources (with a specific focus on personal care products), date and effects. Environ. Sci. Eur. 2016, 28, 1–25. [Google Scholar]
  15. World Economic Forum; Ellen MacArthur Foundation and McKinsey & Company. The New Plastics Economy—Rethinking the future of plastics. 2016. Available online: http://www.ellenmacarthurfoundation.org/publications (accessed on 4 February 2021).
  16. Eerkes-Medrano, D.; Thompson, R.C.; Aldridge, D.C. Microplastics in freshwater systems: A review of the emerging threats, identification of knowledge gaps and prioritisation of research needs. Water Res. 2015, 75, 63–82. [Google Scholar] [CrossRef]
  17. Pedà, C.; Caccamo, L.; Fossi, M.C.; Gai, F.; Andaloro, F.; Genovese, L.; Perdichizzi, A.; Romeo, T.; Marcchiolo, G. Intestinal alterations in European sea bass Dicentrarchuslabrax (Linnaeus, 1758) exposed to microplastics: Preliminary results. Environ. Pollut. 2016, 212, 251–256. [Google Scholar] [CrossRef]
  18. Wagner, M.; Lambert, S. Freshwater microplastics, emerging environmental contaminants? In The Handbook of Environmental Chemistry; Springer Open: Berlin/Heidelberg, Germany, 2018; Volume 58. [Google Scholar]
  19. Bergmann, M.; Gutow, L.; Klages, M. Marine Anthropogenic Litter; Springer International Publishing: Berlin/Heidelberg, Germany, 2015. [Google Scholar]
  20. Wang, W.; Ge, J.; Yu, X. Bioavailability and toxicity of microplastics to fish species: A review. Ecotoxicol. Environ. Saf. 2020, 189, 109913. [Google Scholar] [CrossRef] [PubMed]
  21. Oliveira, M.; Ribeiro, A.; Hylland, K.; Guilhermino, L. Single and combined effects of microplastics and pyrene on juveniles (0+ group) of the common goby Pomatoschistusmicrops (Teleosteo, Gobiidae). Ecol. Indic. 2013, 34, 641–647. [Google Scholar] [CrossRef]
  22. Rochman, C.M.; Hoh, E.; Kurobe, T.; Teh, S.J. Ingested plastic transfers hazardous chemicals to fish and induces hepatic stress. Sci. Rep. 2013, 3, 3263. [Google Scholar] [CrossRef] [PubMed]
  23. Mazurais, D.; Ernande, B.; Quazuguel, P.; Severe, A.; Huelvan, C.; Madec, L.; Mouchel, O.; Soudant, P.; Robbens, J.; Huvet, A.; et al. Evaluation of the impact of polyethylene microbeads ingestion in European sea bass (Dicentrarchuslabrax) larvae. Mar. Environ. Res. 2015, 112, 78–85. [Google Scholar] [CrossRef] [Green Version]
  24. Nobre, C.R.; Santana, M.F.M.; Maluf, A.; Cortez, F.S.; Cesar, A.; Pereira, C.D.S.; Turra, A. Assessment of microplastic toxicity to embryonic development of the sea urchin Lytechinus variegatus (Echinodermata: Echinoidea). Mar. Pollut. Bull. 2015, 92, 99–104. [Google Scholar] [CrossRef]
  25. Dris, R.; Gasperi, J.; Rocher, V.; Saad, M.; Renault, N.; Tassin, B. Microplastic contamination in an urban area: A case study in Greater Paris. Environ. Chem. 2015, 12, 592–599. [Google Scholar] [CrossRef]
  26. Tosetto, L.; Williamson, J.E.; Brown, C. Trophic transfer of microplastics does not affect fish personality. Anim. Behav. 2017, 123, 159–167. [Google Scholar] [CrossRef]
  27. Fischer, E. Final Report: Distribution of Microplastics in Marine Species of Wadden Sea along the Coastline of Schleswig-Holstein; University of Hamburg: Hamburg, Germany, 2019. [Google Scholar]
  28. Derraik, J.G.B. The pollution of the marine environment by plastic debris: A review. Mar. Pollut. Bull. 2002, 44, 842–852. [Google Scholar] [CrossRef]
  29. Lenzi, J.; Burgues, M.F.; Carrizo, D.; Machín, E.; Teixeira de Mello, F. Plastic ingestion by a generalist seabird on the coast of Uruguay. Mar. Pollut. Bull. 2016, 107, 71–76. [Google Scholar] [CrossRef]
  30. Burgues, M.F.; Lenzi, J.; Machín, E.; Genta, L.; Teixeira de Mello, F. Temporal Variation of Kelp Gull’s (Larusdominicanus) fiet on a coastal island of the Rio de la Plata estuary, Uruguay: Refuse as an alternative food source. Waterbirds 2020, 43, 65. [Google Scholar] [CrossRef]
  31. Azevedo-Santos, V.M.; Geslaine, R.L.; Gonçalves, P.; Andrade, M.; Lima, F.; Pelicice, F.M. Plastic ingestion by fish: A global assessment. Environ. Pollut. 2019, 255, 112994. [Google Scholar] [CrossRef]
  32. Flecker, A.S.; Taylor, B.W.; Bernhardt, J.; Hood, J.; Cornwell, W.K.; Cassatt, S.R.; Vanni, M.J.; Altman, N.S. Interactions between herbivorous fishes and limiting nutrients in a tropical stream ecosystem. Ecology 2002, 83, 1831–1844. [Google Scholar] [CrossRef]
  33. Vanni, M.J. Preface: When and where do fish have strong effects on stream ecosystem processes? Am. Fish. Soc. Symp. 2010, 73, 531–538. [Google Scholar]
  34. Villéger, S.; Brosse, S.; Mouchet, M.; Mouillot, D.; Vanni, M.J. Functional ecology of fish: Current approaches and future challenges. Aquat. Sci. 2017, 79, 783–801. [Google Scholar] [CrossRef]
  35. Silva, I.; Naya, D.; Teixeira de Mello, F.; D’Anatro, A.; Tesitore, G.; Clavijo, C.; Gonzáles-Bergonzoni, I. Fish vs. Aliens: Predatory fish regulate populations of Limnopernafortunei mitigating impacts on native macroinvertebrate communities. Hydrobiologia 2021, 848, 2281–2301. [Google Scholar] [CrossRef]
  36. Alvareda, E.; Lucas, C.; Paradiso, M.; Piperno, A.; Gamazo, P.; Erasun, V.; Russo, P.; Saracho, E.; Banega, R.; Sapriza, G.; et al. Water quality evaluation of two urban streams in Northwest Uruguay: Are national regulations for urban stream quality sufficient? Environ. Monit. Assess. 2020, 192, 661. [Google Scholar] [CrossRef]
  37. Valderrama, J.C. The simultaneous analysis of total nitrogen and total phosphorus in natural waters. Mar. Chem. 1981, 10, 109–122. [Google Scholar] [CrossRef]
  38. Teixeira de Mello, F.; Kristensen, E.A.; Meerhoff, M.; González- Bergonzoni, I.; Baattrup-Pedersen, A.; Iglesias, C.; Kristensen, P.B.; Mazzeo, N.; Jeppesen, E. Monitoring fish communities in wadeable lowland streams: Comparing the efficiency of electrofishing methods at contrasting fish assemblages. Environ. Monit. Assess. 2014, 186, 1665–1677. [Google Scholar] [CrossRef]
  39. Teixeira de Mello, F.; González-Bergonzoni, I.; Loureiro, M. Peces de Agua dulce del Uruguay; PPR-MGAP: Montevideo, Uruguay, 2011; p. 188. [Google Scholar]
  40. Hartmann, N.B.; Hüffer, T.; Thompson, R.C.; Hassellöv, M.; Verschoor, A.; Daugaard, A.E.; Rist, S.; Karlsson, T.; Brennholt, N.; Cole, M.; et al. Are we speaking the same language? Recommendations for a definition and categorization framework for plastic debris. Environ. Sci. Technol. 2019, 53, 1039–1047. [Google Scholar] [CrossRef] [Green Version]
  41. GESAMP. Guidelines for the Monitoring and Assessment of Plastic Litter in the Ocean; Kershaw, P.J., Turra, A., Galgani, F., Eds.; IMO/FAO/UNESCO-IOC/UNIDO/WMO/IAEA/UN/UNEP/UNDP/ISA Joint Group of Experts on the Scientific Aspects of Marine Environmental Protection; United Nations Office Nairobi (UNON): Nairobi, Kenya, 2019; Volume 99, p. 130. [Google Scholar]
  42. Chang, M. Reducing microplastics from facial exfoliating cleansers in wastewater through treatment versus consumer product decisions. Mar. Pollut. Bull. 2015, 101, 330–333. [Google Scholar] [CrossRef]
  43. Hidalgo-Ruiz, V.; Gutow, L.; Thompson, R.C.; Thiel, M. Microplastics in the Marine Environment: A review of the Methods Used for Identification and Quantification. Environ. Sci. Technol. 2012, 46, 3060–3075. [Google Scholar] [CrossRef] [PubMed]
  44. Barletta, M.; Lima, A.R.A.; Costa, M.F. Distribution sources and consequences of nutrients, persistent organic pollutants, metals and microplastics in South American estuaries. Sci. Total Environ. 2019, 651, 1199–1218. [Google Scholar] [CrossRef]
  45. Dehaut, A.; Cassone, A.L.; Frére, L.; Hermabessiere, L.; Himber, C.; Rinnert, E.; Riviére, G.; Lambert, C.; Soudant, P.; Huvet, A.; et al. Microplastics in seafood: Benchmark protocol for their extraction and characterization. Environ. Pollut. 2016, 215, 223–233. [Google Scholar] [CrossRef] [PubMed] [Green Version]
  46. Sierra, I.; Rodríguez Chialanza, M.; Faccio, R.; Carrizo, D.; Fornaro, L.; Pérez-Parada, A. Identification of microplastics in wastewater samples by means of polarized light optical microscopy. Environ. Sci. Pollut. Res. Int. 2019, 27, 7409–7419. [Google Scholar] [CrossRef] [PubMed]
  47. Lusher, A.; Welden, N.A.; Cole, M. Sampling, isolating and identifying microplastics ingested by fish and invertebrates. Anal. Methods. 2016, 9, 1346. [Google Scholar]
  48. Hammer, Ø. PAST: Paleontological Statistics, Version 3.25; Reference manual; Natural History Museum, University of Oslo: Oslo, Norway, 2019. [Google Scholar]
  49. R Core Team. R: A language and environment for statistical computing. In R Foundation for Statistical Computing; R Core Team: Vienna, Austria, 2020. [Google Scholar]
  50. Bates, D.; Mächler, M.; Bolker, B.; Walker, S. Fitting Linear Mixed-Effects Models Using lme4. J. Stat. Softw. 2015, 67, 1–48. [Google Scholar] [CrossRef]
  51. Harting, F. DHARMa: Residual Diagnostics for Hierarchical (Multi-Level/Mixed) Regression Models. 2020. Available online: http://florianhartig.github.io/DHARMa/ (accessed on 4 February 2021).
  52. Benejam, L.; Teixeira de Mello, F.; Meerhoff, M.; Loureiro, M.; Jeppesen, E.; Brucet, S. Assessing effects of change in land use on sixe-related variables of fish in subtropical streams. Can. Sci. Publ. 2015, 73, 547–556. [Google Scholar] [CrossRef]
  53. Güven, O.; Gökdağ, K.; Jovanović, B.; Kideyş, A.E. Microplastic litter composition of the Turkish territorial waters of the Mediterranean Sea, and its occurrence in the gastrointestinal tract of fish. Environ. Pollut. 2017, 223, 286–294. [Google Scholar] [CrossRef] [PubMed]
  54. Herrera, A.; Ŝtindlová, A.; Martínez, I.; Rapp, J.; Romero-Kutzner, V.; Samper, M.D.; Montoto, T.; Aguiar-González, B.; Paclard, T.; Gómez, M. Microplastic ingestion by Atlantic chub mackerel (Scombercolias) in the Canary Islands coast. Mar. Pollut. Bull. 2019, 139, 127–135. [Google Scholar] [CrossRef]
  55. Dos Santos, T.; Bastian, R.; Felden, J.; Rauber, A.M.; Reynalte-Tataje, D.A.; Teixeira de Mello, F. First record of microplastics in two freshwater fish species (Iheringhthyslabrosus and Astyanax lacustris) from the middle section of the Uruguay River, Brazil. Acta Limnol. Bras. 2020, 32. [Google Scholar] [CrossRef]
  56. Martí, E.; Martin, C.; Galli, M.; Echevarría, F.; Duarte, C.M.; Cózar, A. The colors of the ocean plastics. Environ. Sci. Technol. 2020, 54, 6594–6601. [Google Scholar] [CrossRef]
  57. Roch, S.; Friedrich, C.; Brinker, A. Uptake routes of microplastics in fishes: Practical and theoretical approaches to test existing theories. Sci. Rep. 2020, 10, 3896. [Google Scholar] [CrossRef]
  58. Andrade, M.C.; Winemiller, K.O.; Barbosa, P.S.; Fortunati, A.; Chelazzi, D.; Cincinelli, A.; Giarrizzo, T. First account of plastic pollution impacting freshwater fishes in the Amazon: Ingestion of plastic debris by piranhas and other serrasalmids with diverse feeding habits. Environ. Pollut. 2019, 244, 766–773. [Google Scholar] [CrossRef]
  59. Allen, S.; Allen, D.; Phoenix, V.R.; Le Roux, G.; Durántez Jiménez, P.; Simonneau, A.; Binet, S.; Galop, D. Atmospheric transport and deposition of microplastics in a remote mountain catchment. Nat. Geosci. 2019, 12, 339–344. [Google Scholar] [CrossRef]
  60. Foley, C.J.; Feiner, Z.S.; Malinich, T.D.; Höök, T.O. A meta-analysis of the effects of exposure to microplastics on fish and aquatic invertebrates. Sci. Total Environ. 2018, 631–632, 550–559. [Google Scholar] [CrossRef] [Green Version]
  61. Hu, L.; Chernick, M.; Hinton, D.E.; Shi, H. Microplastics in small waterbodies and tadpoles from Yangtze River Delta, China. Environ. Sci. Technol. 2018, 52, 8885–8893. [Google Scholar] [CrossRef]
  62. Wen, X.; Du, C.; Xu, P.; Zeng, G.; Huang, D.; Yin, L.; Tin, Q.; Hu, L.; Wan, J.; Zhang, J.; et al. Microplastic pollution in surface sediments of urban water areas in Changsha, China: Abundance, composition, surface textures. Mar. Pollut. Bull. 2018, 136, 414–423. [Google Scholar] [CrossRef] [PubMed]
  63. Jovanović, B. Ingestion of microplastics by fish and it’s potential consequences from a physical perspective. Integr. Environ. Assess. Manag. 2017, 13, 510–515. [Google Scholar] [CrossRef] [PubMed]
  64. Galloway, T.S.; Cole, M.; Lewis, C. Interactions of microplastic debris throughout the marine ecosystem. Nat. Ecol. Evol. 2017, 1, 0116. [Google Scholar] [CrossRef]
  65. Mizraji, R.; Ahrendt, C.; Perez-Venegas, D.; Vargas, J.; Pulgar, J.; Aldana, M.; Ojeda, F.P.; Duarte, C.; Galbán-Malagón, C. Is the feeding type related with the content of microplastics in intertidal fish gut? Mar. Pollut. Bull. 2017, 1–2, 498–500. [Google Scholar] [CrossRef]
  66. Phillips, M.B.; Bonner, T.H. Occurrence and amount of microplastic ingested by fishes in watersheds of the Gulf of Mexico. Mar. Pollut. Bull. 2015, 100, 264–269. [Google Scholar] [CrossRef]
  67. Murphy, F.; Russell, M.; Ciaran, E.; Quinn, B. The uptake of macroplastic & microplastic by demersal & pelagic fish in the Northeast Atlantic around Scotland. Mar. Pollut. Bull. 2017, 122, 353–359. [Google Scholar]
Figure 1. Map of the study area including the watersheds of the six sampled streams. The first row corresponds to the watersheds of the Extensive Ranching streams, while the bottom row shows the watershed of the Urban streams. Colours corresponding to land uses.
Water 13 01575 g001
Figure 2. Histograms of the lengths of sampled individuals according to two different land use: (A) in green corresponds to Extensive Ranching systems and (B) in orange corresponds to Urban systems. The curve represents the cumulative percentage of individuals of each size. In all cases individuals longer than 10 cm were included in the last category.
Water 13 01575 g002
Figure 3. Variety of fibers (AC) and fragments (DF) recovered from digestions of digestive tract contents of fish. C and F show the reaction of the items to exposure to polarized light (optical active).
Water 13 01575 g003
Figure 4. Size distribution of the plastic fibers found and their colours for each stream and for the groups (Extensive Ranching and Urban). Each graph also contains information about the amount of individuals analyzed, species and fibers collected.
Water 13 01575 g004
Figure 5. (A) Mean and standard deviation of the probability of collecting a fish containing at least one plastic itemin Extensive Ranching and Urban streams. (B) Mean and standard deviation of the number of plastic itemsper individual for Extensive Ranching and Urban streams. (C) Average number of plastic items per gram of fish and their deviation for Extensive Ranching and Urban streams.
Water 13 01575 g005
Figure 6. (A) Average of plastic items per individual per species, with its standard deviation. (B) Average of plastic itemsper gram of individual. Both graphs present the species in increasing order. In parentheses next to each species name, appears the amount of individuals analyzed, and secondly, how many sites within each group was the species collected, for Extensive Ranching and Urban streams respectively.
Water 13 01575 g006
Table 1. Main characteristics of the 6 streams analyzed, mean and standard deviation per group. The streams are separated in two groups according to the main activity carried out in their watershed: Extensive Ranching (Insaurral, Curupí and Las Niñas) and Urban (Cañada del Dragón, Cañada del Colorado and Las Piedras).
Extensive Ranching Urban
InsaurralCurupíLas NiñasAverageC. del DragónC. del ColoradoLas PiedrasAverage
Watershed (km2)14.4216.324.42111.7 ± 6.411.216.06325.8314.4 ± 10.3
Order333-212-
Average width (m)1.673.031.972.2 ± 0.72.331.574.132.7 ± 1.3
Average depth (m)0.190.450.340.32 ±0. 130.450.250.320.34 ± 0.10
Land use (%)
Urban area0.05000.02 ± 0.0313.1729.0334.5225.6 ± 11.1
Natural grassland67.6615.7668.750.7 ± 30.314.0630.2620.7521.7 ± 8.1
Riverine forest047.37015.8 ± 27.34.650.021.222.0 ± 2.4
Rainfed and irrigated crop000062.6423.4237.7541.3 ± 19.8
Pastures32.18.8131.1224 ± 13.21.114.42.926.1 ± 7.2
Afforestation0.1928.070.189.5 ± 16.14.372.872.843.4 ± 0.9
Physico-chemical parameters
Dissolved oxygen8.788.22119.3 ± 1.55.725.053.784.9 ± 1.0
pH8.287.898.418.2 ± 0.37.387.437.667.5 ± 0.1
Total Nitrogen (µg/L)497275673481.7 ± 199258471706478.3 ± 224
Total Phosphorus (µg/L)7067701170882 ± 2512689133058623293.7 ± 2325
Temperature (⁰C)24.425.4623.724.5 ± 0.923.1423.5325.2824 ± 11
Table 2. Main characteristics of the communities of the 6 streams analyzed. Mean is presented for each stream, and mean and standard deviation (SD) per land use group. Relative abundance of each species per stream is presented.
Extensive RanchingUrban
InsaurralCurupíLas NiñasMean ± SDC. del DragónC. del ColoradoLas PiedrasMean ± SD
Richness16141615.3 ± 1.21711511 ± 6.0
Biomass (g/m2)10.847.117.978.6 ± 1.91.941.571.051.5 ± 0.5
Density (ind/m2)11.112.898.957.7 ± 4.24.243.1222.7910.1 ± 11.1
Relative abundance of species (%)
Cnesterodon decemmaculatus12.8530.1819.8321.0 ± 8.70.986099.753.6 ± 49.7
Characidium rachovii5.914.472511.8 ± 11.51.47301.5 ± 1.5
Ectrepopterus uruguayensis7.97020.659.5 ± 10.40000.00 ± 0
Astyanax sp.5.4117.883.268.9 ± 7.910.781006.9 ± 6.0
Bryconamericus iheringii23.3901.368.3 ± 13.121.57107.5 ± 12.2
Australoheros facetus12.088.370.547.0 ± 5.90000.00 ± 0
Cheirodon interruptus11.315.032.726.4 ± 4.510.78605.6 ± 5.4
Hyphessobrycon meridionalis0.762.238.974.0 ± 4.44.9001.6 ± 2.8
Gymnogeophagus terrapurpura5.143.912.453.8 ± 1.40.9800.050.3 ± 0.6
Heptapterus mustelinus6.434.4703.6 ± 3.30.98000.3 ± 0.6
Gymnogeophagus mekinos1.037.821.363.4 ± 3.80000.00 ± 0
Crenicichla scottii3.345.580.823.3 ± 2.40000.00 ± 0
Steindachnerina biornata005.982.0 ± 3.50.98100.7 ± 0.6
Rineloricaria sp.2.062.2301.4 ± 1.20903.0 ± 5.2
Australoheros scitulus0.2603.531.3 ± 1.90000.00 ± 0
Charax stenopterus03.350.271.2 ± 1.90000.00 ± 0
Oligosarcus jenynsii0.511.121.631.1 ± 0.60.49000.2 ± 0.3
Synbranchus marmoratus01.6800.6 ± 1.00.49301.2 ± 1.6
Hoplias argentinensis001.630.5 ± 0.90.49000.2 ± 0.3
Ancistrus taunayi01.1200.4 ± 0.70000.00 ± 0
Corydoras paleatus0.77000.3 ± 0.46.8640.153.7 ± 3.4
Hypostomus commersoni00.5600.2 ± 0.30000.00 ± 0
Pseudocorynopoma doriae0.26000.1 ± 0.24.9001.6 ± 2.8
Hisonotus nigricauda0.26000.1 ± 0.21.47000.5 ± 0.9
Gymnotus omarorum0.26000.1 ± 0.20000.00 ± 0
Phalloceros caudimaculatus0000.0 ± 026.96009.0 ± 15.6
Otocinclus arnoldi0000.0 ± 02.4500.050.8 ± 1.4
Rhamdia aff. quelen0000.0 ± 00.49200.8 ± 1.0
Jenynsia lineata0000.0 ± 0010.050.4 ± 0.6
Table 3. Plastic density calculated per square meter for each site estimated by fish biomass and density. The first three streams correspond to Extensive Ranching systems (Insaurral, Curupí and Las Niñas) and the final three to Urban systems (Cañada del Dragón, Cañada del Colorado and Las Piedras).
Streamsitems.m−2 Estymate by Biomassitems.m−2 Estymate by Density
Insaurral2.412.7
Curupí1.23.1
Las Niñas1.25.8
Cañada del Dragón1.65.7
Cañada del Colorado1.97.4
Las Piedras3.224.4
Publisher’s Note: MDPI stays neutral with regard to jurisdictional claims in published maps and institutional affiliations.

