
Distribution, Drivers, and Threats of Aluminum in Groundwater in Nova Scotia, Canada


1
Sterling Hydrology Research Group, Department of Earth and Environmental Sciences, Dalhousie University, Halifax, NS B3H 4R2, Canada
2
Nova Scotia Department of Energy and Mines, Halifax, NS B3J 2T9, Canada
*
Author to whom correspondence should be addressed.
Water 2021, 13(11), 1578; https://doi.org/10.3390/w13111578
Submission received: 30 April 2021
/
Revised: 28 May 2021
/
Accepted: 30 May 2021
/
Published: 2 June 2021
(This article belongs to the Special Issue Endangered Freshwater Ecosystems: Threats and Conservation Needs)
Abstract
:Increased rates of acid deposition derived from the burning of fossil fuels over the last century have resulted in the acidification and increase in aluminum (Al) levels in freshwaters and soils in sensitive areas. While the acidification of surface waters such as lakes and rivers has been extensively studied, the acidification status and resulting Al concentrations in groundwater are poorly understood. Here we aim to describe the distribution of Al in groundwater across the province of Nova Scotia, Canada. We investigate the hydrogeological conditions that influence Al concentrations in groundwater and compare Al concentrations to legislated threshold levels for human and aquatic health. We found groundwater Al concentrations to be highest in areas underlain by plutonic and metamorphic bedrock types as well as surficial aquifers, with pH and organic carbon concentrations having the strongest correlation with groundwater Al concentrations. Few samples exceed the maximum acceptable concentration of 2900 µg/L released by Health Canada (2021), but these exceedances are important to highlight given the challenges with respect to Al treatment in private domestic wells and our evolving understanding of Al impacts to human health. High concentrations of Al in groundwater may also be exported to surface waters such as rivers and lakes, where they can be harmful to aquatic populations such as Atlantic salmon (Salmo salar). We recommend that private well owners test their water supplies for Al, and that further studies on Al export from groundwater to surface water be carried out in the most high-risk areas coincident with important Atlantic salmon river watersheds.
1. Introduction
During the last century, increased rates of acid deposition, mainly derived from the burning of fossil fuels, have resulted in the acidification of soils and freshwaters in sensitive regions around the globe [1,2,3,4]. Studies have also shown groundwater acidification in response to anthropogenic activities (e.g., mining, blasting of rock) [5,6]. Drought can also generate acidity through the oxidation of sulfidic material to sulfuric material during water table declines and the subsequent mobilization of this acidity during rewetting e.g., [4,7,8]. This phenomenon could be exacerbated by climate change as many jurisdictions are experiencing increased frequency of summer drought [9] or longer-term water level declines [10]. One of the most problematic effects of acidification has been the increased release of aluminum (Al) from soils and sediment to freshwaters. The link between acid deposition and increased concentrations of Al in rivers and lakes has been well documented [2] but the acidification status and resulting Al concentrations in groundwater have been less studied.
Aluminum is the Earth’s most abundant metallic element, comprising about 8% by weight of the Earth’s outer crust [11], typically occurring as alumino-silicate minerals in soils, sediments, and rocks. Because Al is a common component of clay minerals (e.g., kaolinite), it is especially abundant in fine-grained rocks such as shales, mudstones, siltstones, and metamorphosed equivalents (e.g., slate, phyllite, and schist). Although these metamorphosed fine-grained rocks contain abundant muscovite, biotite, and other alumino-silicate minerals, adalusite (the main aluminum-bearing mineral) has been previously targeted for mineral exploration [12] in the fine-grained units of the Halifax Group. Granitoid rocks in Nova Scotia also commonly contain alumino-silicate minerals, such as muscovite, biotite, and cordierite [13]. Although alumino-silicates tend to be resistant to chemical weathering and insoluble in groundwater at typical pH conditions (6–8), in low pH environments, Al can be leached from soils and minerals in rocks and transported by groundwater flow as inorganic monomeric Al (Al3+) or dissolved Al complexes such as AlF3, Al(OH)3, AlPO4, and Al2(SO4)3 to well water supplies and freshwater systems [14].
Elevated concentrations of Al can lead to numerous threats to freshwater ecosystems. If released to rivers and lakes, cationic species of Al (Ali) are toxic to fish species such as Atlantic salmon (Salmo salar) [15,16], as well as other aquatic species such as mollusks, invertebrates [17], and frogs [18]. In addition, the presence of elevated levels of Al in areas where people rely on groundwater as a source of drinking water could lead to human health issues such as Alzheimer’s disease [19,20], especially in private domestic water wells where well owners are responsible for ensuring their water is safe to drink. High levels of Al in water supplies can also increase the risk for patients with chronic kidney disease of developing dialysis encephalopathy [21], especially when combined with other sources of aluminum exposure (e.g., food, consumer products, soil). Elevated Al concentrations in watersheds supplying drinking water can cause complications for water treatment plants [22].
Acceptable values for the concentration of Al in drinking water vary in the literature, however Health Canada recently established a new maximum acceptable concentration (MAC) of 2900 µg/L of Al in drinking water (previously there was no MAC for Al) based on the latest toxicological and epidemiological evidence [22]. In comparison, the World Health Organization (WHO) had earlier published a recommended threshold for human health effects of 900 µg/L [23]. The previous threshold recommended by the WHO was based on a provisional tolerable weekly intake (PTWI) of 1 mg of Al per kg of body weight per day. This PTWI has since been revised to 2 mg of Al per kg of body weight per day, based on new information from a key study by Poirier et al. (2011) [24], that was also used to establish the new Canadian guideline [22]. The potential human health effects of Al in drinking water are still highly debated; however, some studies have shown links between Al exposure and neurological disorders such as Alzheimer’s disease [19,20], as well as increased health risks for people with chronic kidney disease [21,25]. For private, individual, or small water supplies it can be challenging to remove Al from drinking water because there are few effective treatment options available, although distillation or reverse osmosis treatment may be effective at removing Al under some conditions [22,26]. A site-specific assessment is generally recommended to determine viable treatment options for Al mitigation.
Freshwater systems should be viewed as a continuum from groundwater recharge to surface water discharge. Numerous studies have shown that interactions between groundwater and surface waters affect the geochemical characteristics of surface water, including pH and Eh, which in turn affect the mobility of various naturally occurring metals [27,28,29,30]. It is well known that the solubility of Al increases with increasing acidity [14,31]. Shallow unconfined surficial aquifer systems, or fast recharging crystalline bedrock aquifer systems, are associated with more acidic, less chemically evolved groundwater and therefore greater potential for Al dissolution and transport. Elevated groundwater concentrations of dissolved organic carbon (DOC) can also contribute to groundwater acidification [14]. Conversely, groundwater in contact with carbonate rocks is associated with higher pH and alkalinity compared to other aquifer types [32] and these areas may be less susceptible to elevated Al in groundwater.
There are few studies of the distribution of Al in groundwater, in part due to its low solubility under the typical range of pH in most aquifers [14] and because safe drinking water limits tend to be high compared to dissolved concentrations of the metal typically found in groundwater. The median concentration of Al in a regional survey of groundwater quality in southern areas of the province of Quebec was 5 µg/L, ranging from <1 µg/L to 25,000 µg/L [33] whereas Al concentrations ranged from <25 µg/L to 10,000 µg/L in the neighboring province of New Brunswick [34]. An understanding of the hydrogeochemical conditions associated with elevated Al concentrations in groundwater is important to understanding where freshwater aquatic life may be at higher risk of Al impacts. Areas that have both a high concentration of Al in groundwater and a large proportion of groundwater contribution to surface waters are at a greater risk for elevated Al levels in these systems, especially in areas with acid-sensitive aquifers, including pure sand aquifers [35] or granite rock aquifers with poor buffering capacity [14].
Export of Al in groundwater to rivers via baseflow discharge is particularly concerning for cold-water fish species such as salmonids. Groundwater inputs to streams provide important fish habitat known as cold water refugia [36,37,38]. During periods of summer thermal stress, inputs of colder groundwater to a river can allow cold water fish to survive when ambient river temperatures would otherwise be too warm [37,38,39,40]. These refugia will become increasingly important as climate change shifts ambient stream temperatures higher and water level declines from over-pumping result in decreasing groundwater baseflow contributions [41]. Climate studies suggest that as the planet warms, cold water fish will experience a significant loss of freshwater habitat that is thermally suitable [38]. The survival of fish populations may depend on the number and quality of cold water refugia available [37,39]. If the groundwater supplying these cold water refugia has concentrations of toxic Ali that exceed the threshold for aquatic health, these important refugia for salmonids would threaten their survival. An extensive review of toxicological and geochemical literature by the European Inland Fisheries Advisory Council found that 15 µg/L is the threshold above which Ali concentrations will have negative impacts on aquatic health [42].
Here, we aim to increase our understanding of the patterns and controls of groundwater Al concentrations across the province of Nova Scotia, Canada. We will use an existing database of well water chemistry to investigate the hydrogeological conditions that influence Al concentrations in groundwater, including bedrock aquifer type and several key water chemistry parameters, such as pH, total organic carbon (TOC), and calcium (Ca) concentrations, and compare Al concentrations to various threshold levels over which human or aquatic health may be impacted.
2. Materials and Methods
To characterize the acidification and Al status of Nova Scotia groundwater, we extracted a dataset of relevant parameters (Al, Ca, pH, TOC, and turbidity) from the Nova Scotia Groundwater Chemistry database (NSGCDB) [43]. The NSGCDB is maintained by the Nova Scotia Department of Energy and Mines and consists mostly of non-domestic, untreated (raw) well water sample results from across the province, collected between 1954 and the present, from wells intercepting both bedrock and surficial aquifers. Most drilled wells in Nova Scotia are less than 100 m deep, intercepting fractured bedrock aquifers, with about 6 to 12 m of casing to keep unconsolidated sediments from collapsing and the bedrock section left as an open hole [44].The NSGCDB was compiled from various federal, provincial, and municipal data sources of ambient groundwater chemistry, including water quality monitoring data from government buildings with well water supplies, community well water surveys, and Nova Scotia Department of Environment and Climate Change groundwater chemistry data from registered public drinking water supplies, pumping tests, municipal groundwater supplies, and provincial observation wells; well construction information is available for about 30% of the well sample data. Analytical methods vary, but Al concentrations were typically analyzed using ICP-MS as a total metal digest of an unfiltered water sample, as recommended for assessments of drinking water quality. Note that DOC is not typically measured in standard analyses of groundwater quality and so TOC was used as an indicator parameter. Although the quality of the well water chemistry data used in the analysis varies due to inconsistent sampling and laboratory analytical methods, it is still considered useful for detecting regional-scale (e.g., >1:50,000) trends.
Only untreated, and suspected untreated, well water samples where the laboratory detection limit was no greater than 10 µg/L were retained in the dataset. Where multiple sample results were available for a given well location, the most recent Al result was used in the analysis. Left-censored data (i.e., values less than the laboratory detection limit are not known) with multiple detection limits were included in the dataset, and therefore survival (non-parametric) analysis methods were applied. The Al data were plotted on the Province’s Groundwater Regions Map [45], which subdivides the province into five major bedrock groundwater regions based on bedrock geology mapping [46], using ArcGISTM10 [47] geographic information system software, and a groundwater region was assigned to each water sample. Uncertainty associated with the assignment of bedrock groundwater regions to well water samples increases near geologic boundaries due to factors such as map scale, interpolation of geologic boundaries, and gradational contacts between units. Water samples located near these boundaries were therefore carefully reviewed, and stratigraphy information from well logs was consulted where it was available to verify the assignment of the groundwater region. Statistical summaries of Al in well water concentrations were produced for each of the bedrock groundwater regions, while overlying surficial till units and aquifers were treated as a single surficial groundwater region.
Exceedance rates were calculated for the range of published Al thresholds for aquatic and human health. Most jurisdictions have published operational thresholds for Al levels, but these mainly apply to municipal water systems. For example, the US EPA encourages utilities to maintain Al concentrations below 50 µg/L in drinking water, but their secondary maximum contaminant level (i.e., the recommended but non-enforceable guideline) is flexible and allows for concentrations up to 200 µg/L [17]. The WHO guideline indicates that Al concentrations above 100 µg/L may impact water colour, and that all municipal treatment systems should maintain Al concentrations below 200 µg/L [23]. The operational guideline from Health Canada also allows for Al concentrations of up to 100 µg/L, while a new health-based guideline from Health Canada of 2900 µg/L was released in 2021 [22]. The WHO previously established a health-based limit of 900 µg/L [23]. In comparison, the Canadian guideline for the protection of freshwater aquatic life for long-term concentrations of aluminum is much lower, ranging from 5 µg/L, where the pH of water is <6.5, to 100 µg/L, where the pH of water is ≥6.5. Due to the varying thresholds found in the literature, we calculated exceedance rates for four different Al limits: 10 µg/L, 100 µg/L, 900 µg/L, and 2900 µg/L.
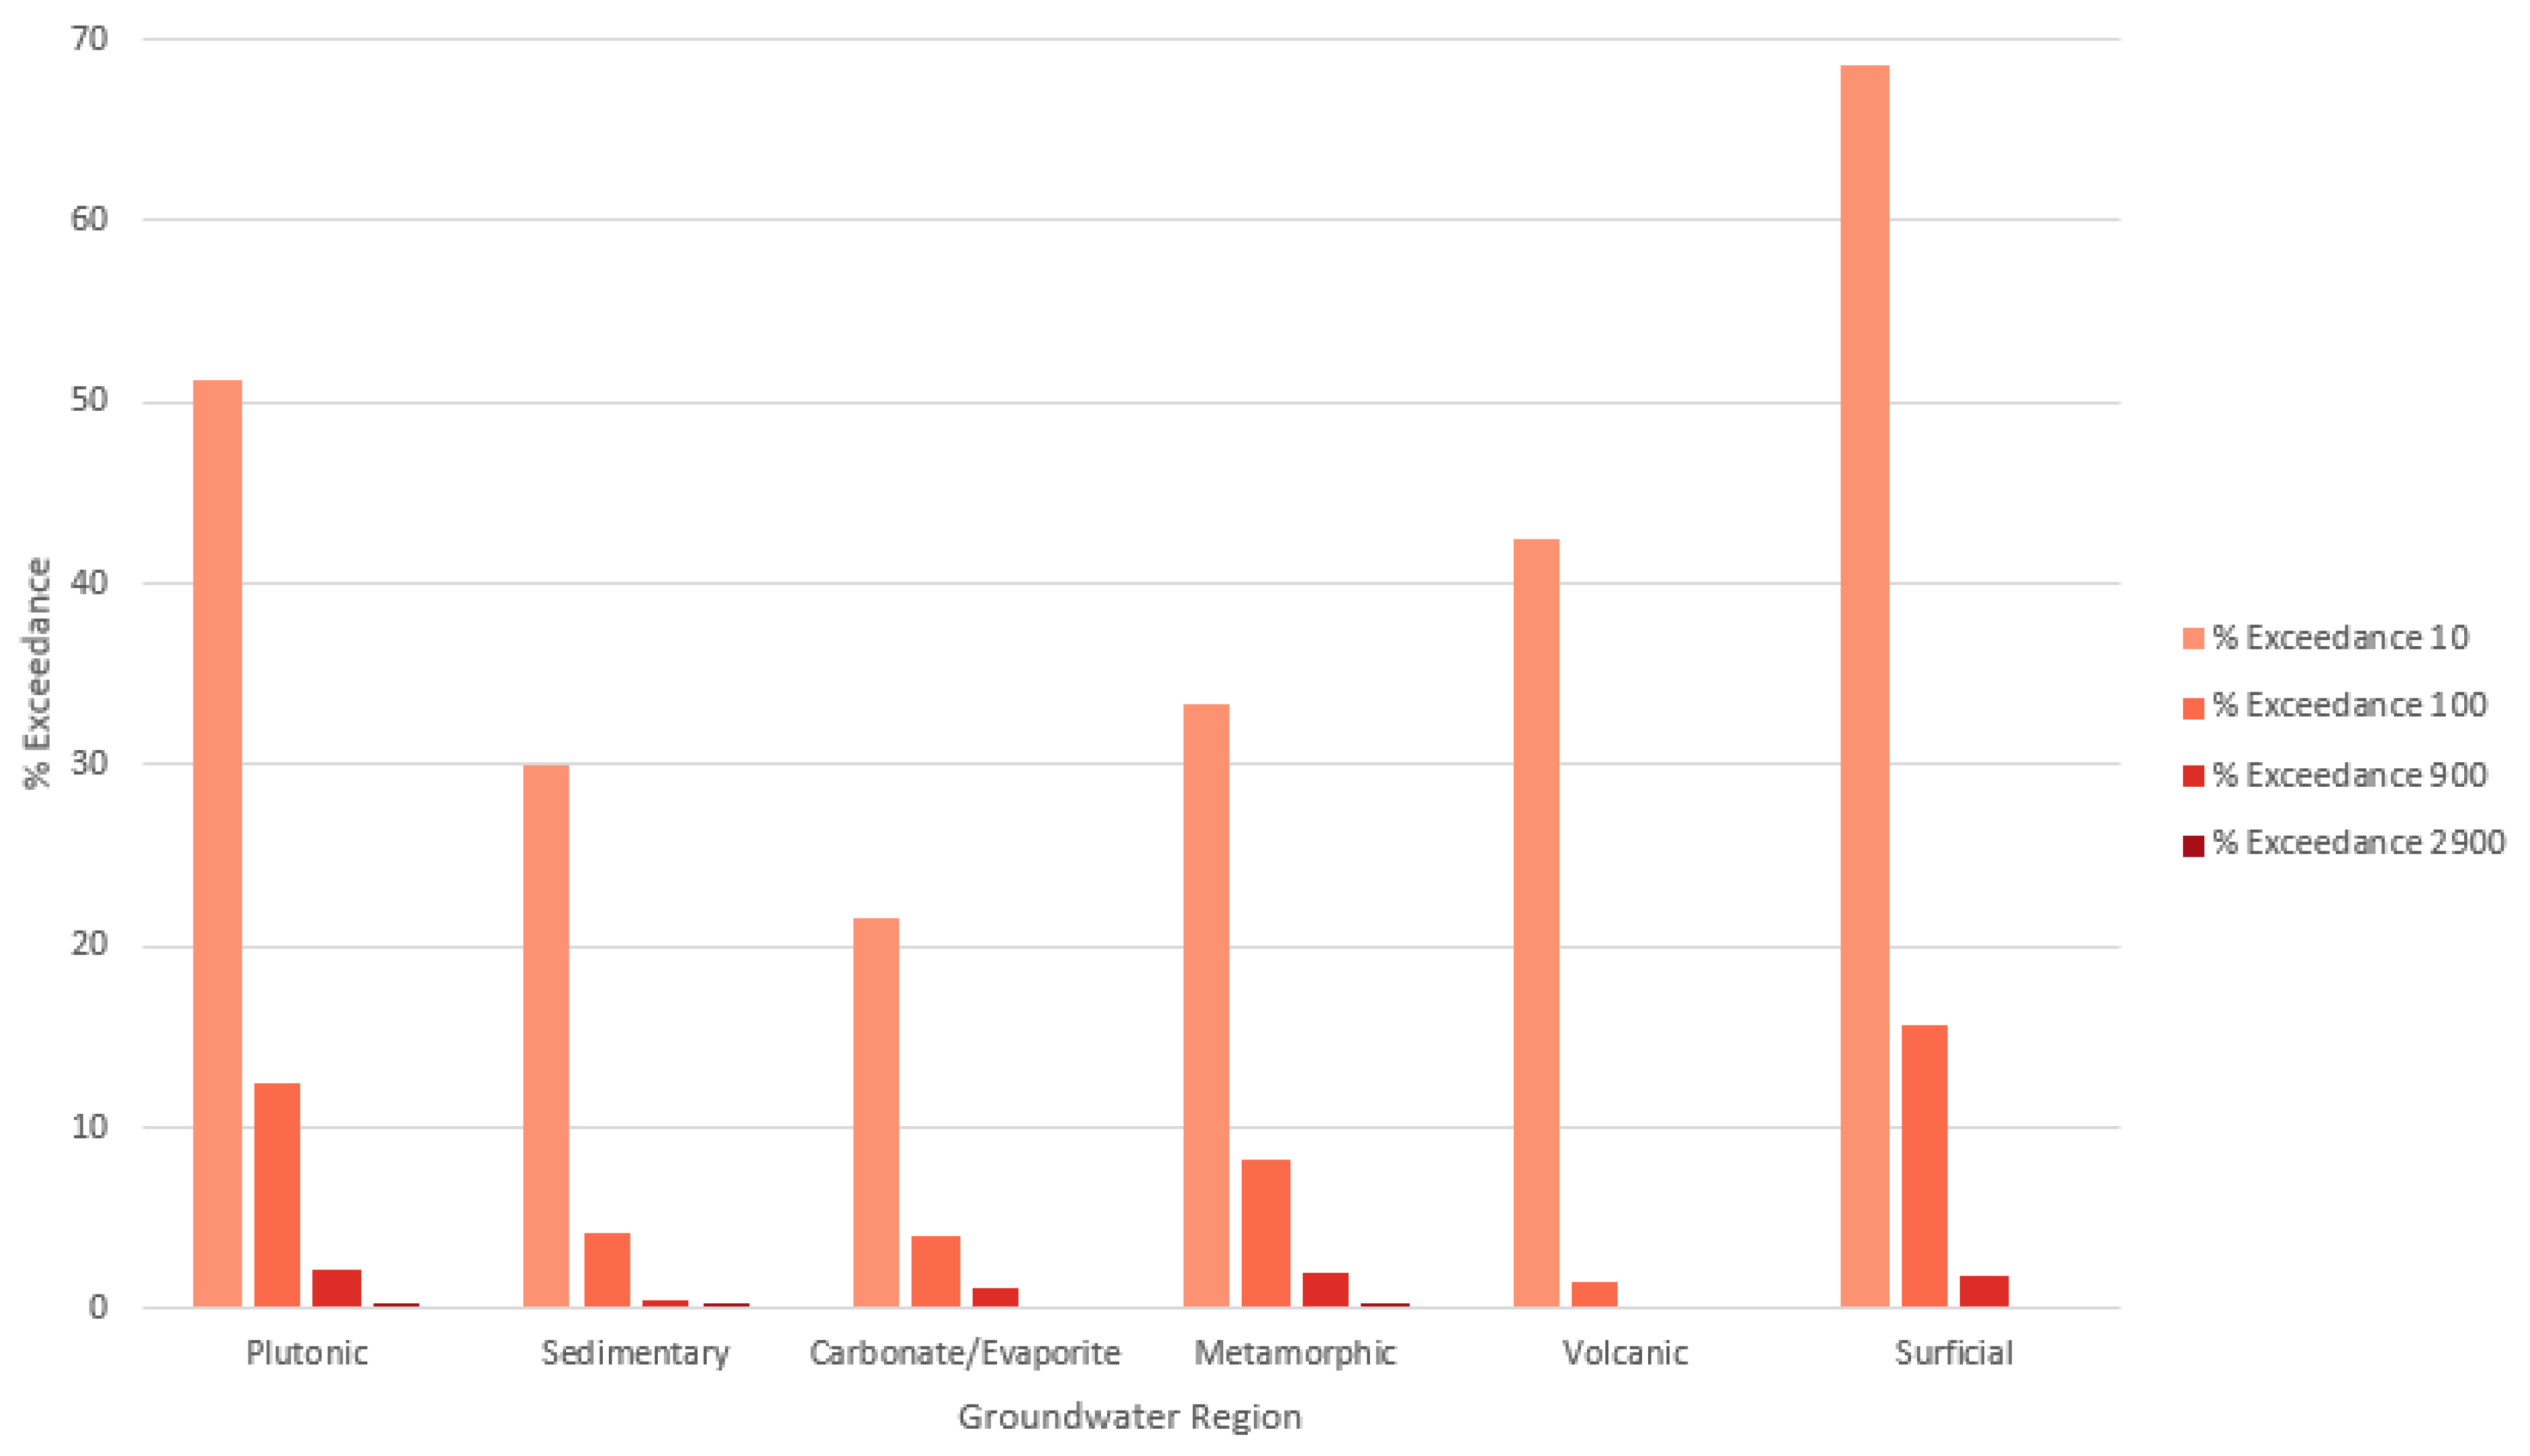
Using the Kaplan–Meier method, statistical summaries of Al concentrations in well water were produced for each groundwater region (Table 1). Exceedance rates for the four Al thresholds in each groundwater region were also calculated (Table 1, Figure 1). The Peto and Peto modification of the Gehan–Wilcoxon test was used to determine whether groupings of samples by groundwater region, well type, and turbidity level were statistically different populations. A pairwise comparison test to compare medians was applied to evaluate stochastic dominance within the groupings. A Kendall’s tau test was used to test for relationships between Al concentrations and various other water chemistry parameters. A multivariate regression was computed using maximum likelihood estimation to model the relationship between Al and other water chemistry parameters. Statistical analyses were carried out in R version 4.0.3 using the Nondetects and Data Analysis for Environmental Data (NADA) package [48].
3. Results
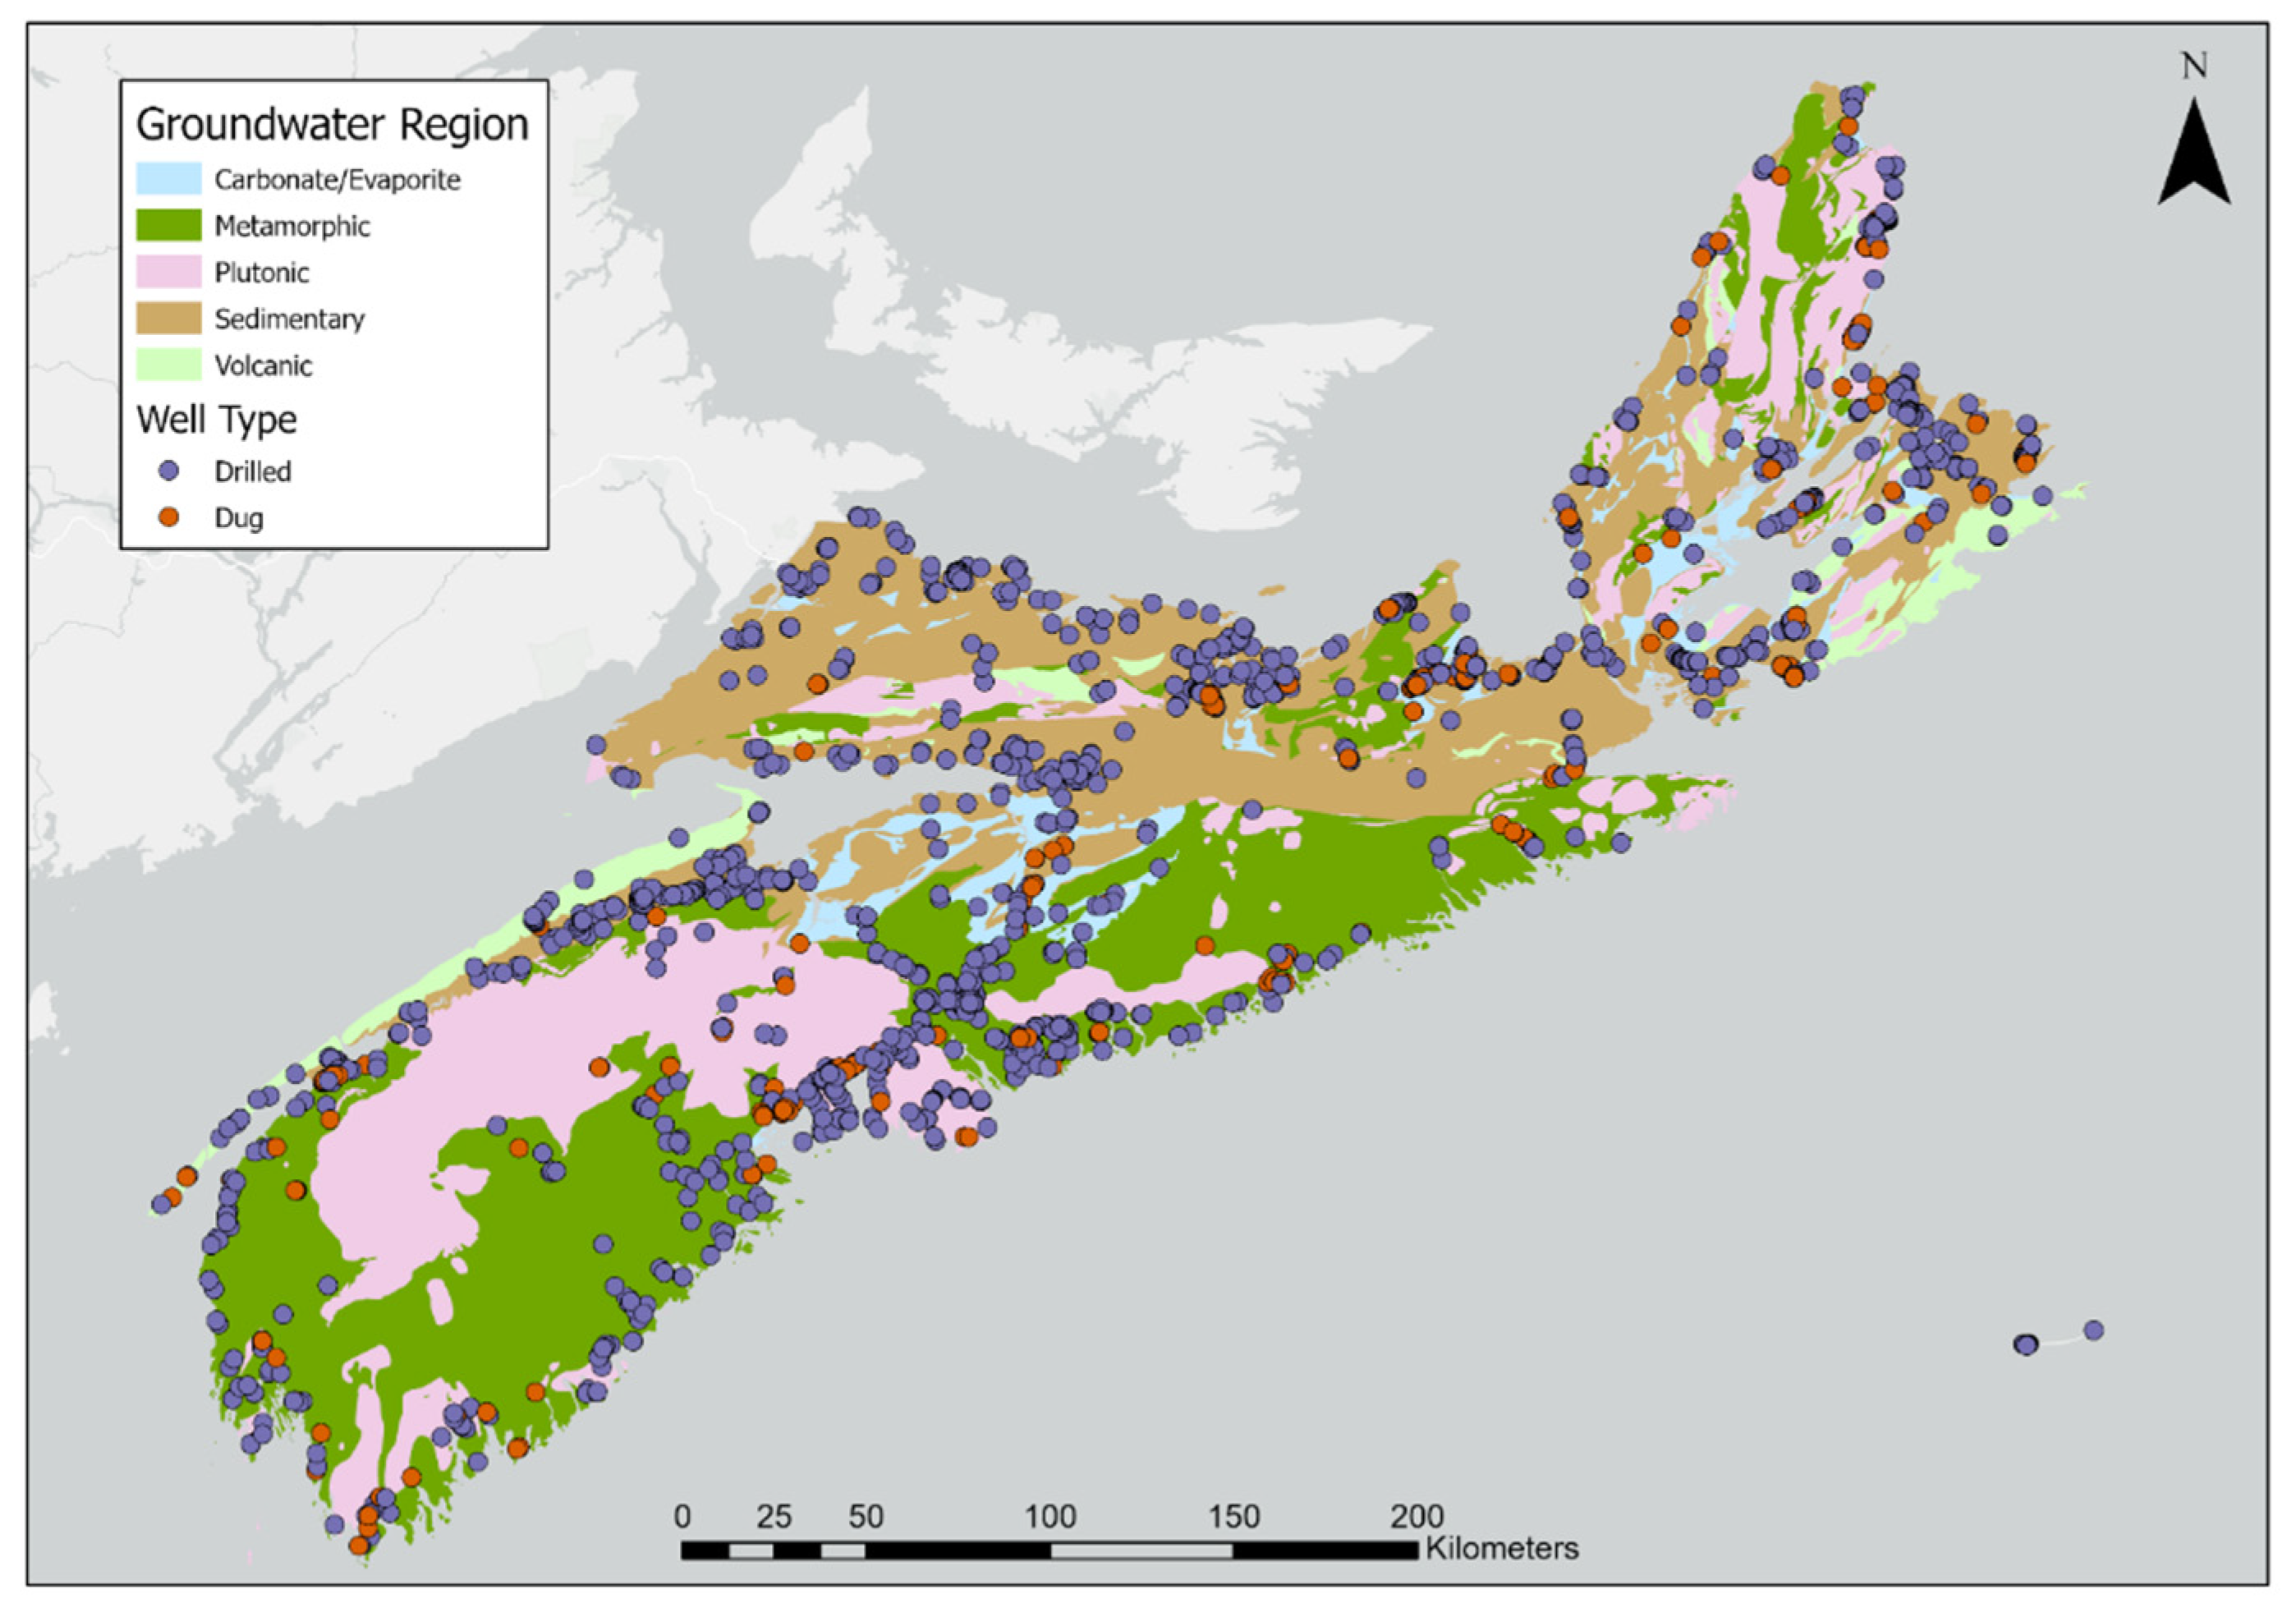
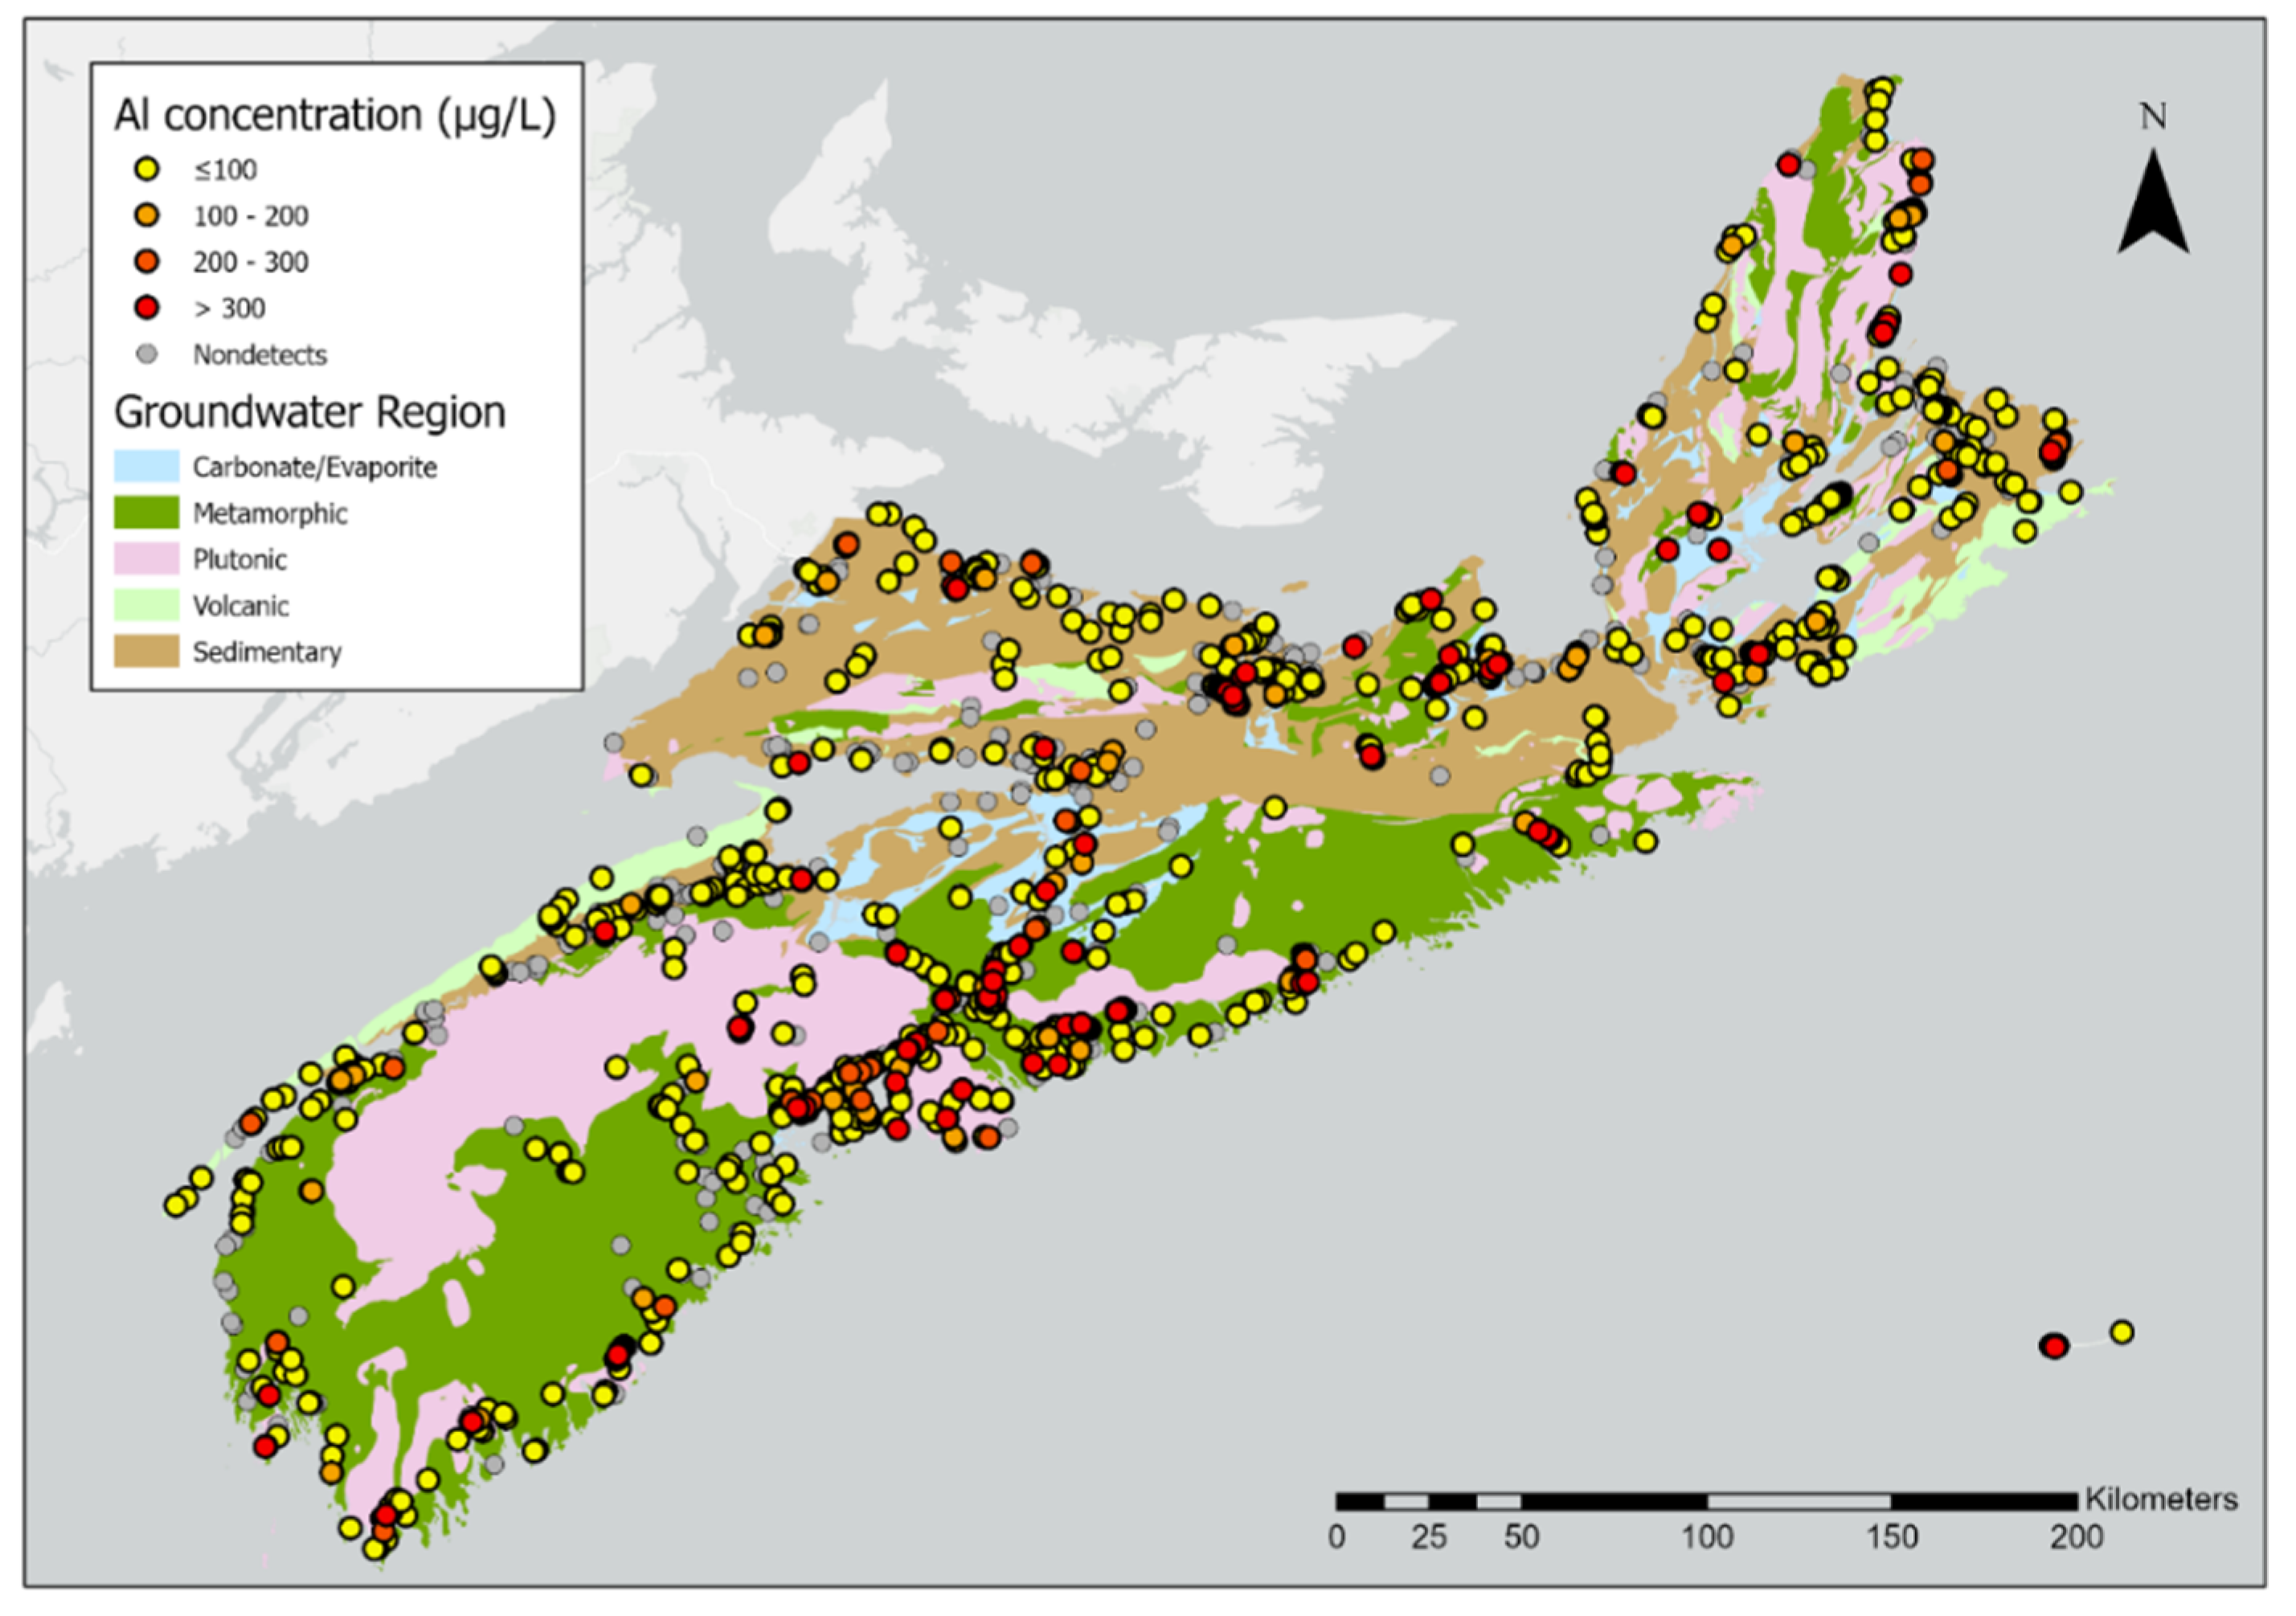
A total of 2518 Al in well water samples were used in the analysis (Figure 2). Of these, 2081 (83%) samples were from drilled wells (mostly bedrock aquifers), and 437 (17%) samples were from dug wells (surficial aquifers) (Figure 2). Concentrations of Al in groundwater wells across Nova Scotia range from <1–5270 µg/L. Statistical summaries of the data classified by groundwater region show that the highest Al concentrations are generally associated with the plutonic groundwater region, followed closely by the surficial and metamorphic groundwater regions (Table 1, Figure 3). The average Al concentrations in the remaining regions are much lower. The overall province-wide exceedance rates range from 41% to 0.24%, depending on the Al threshold applied (Table 1, Figure 1).
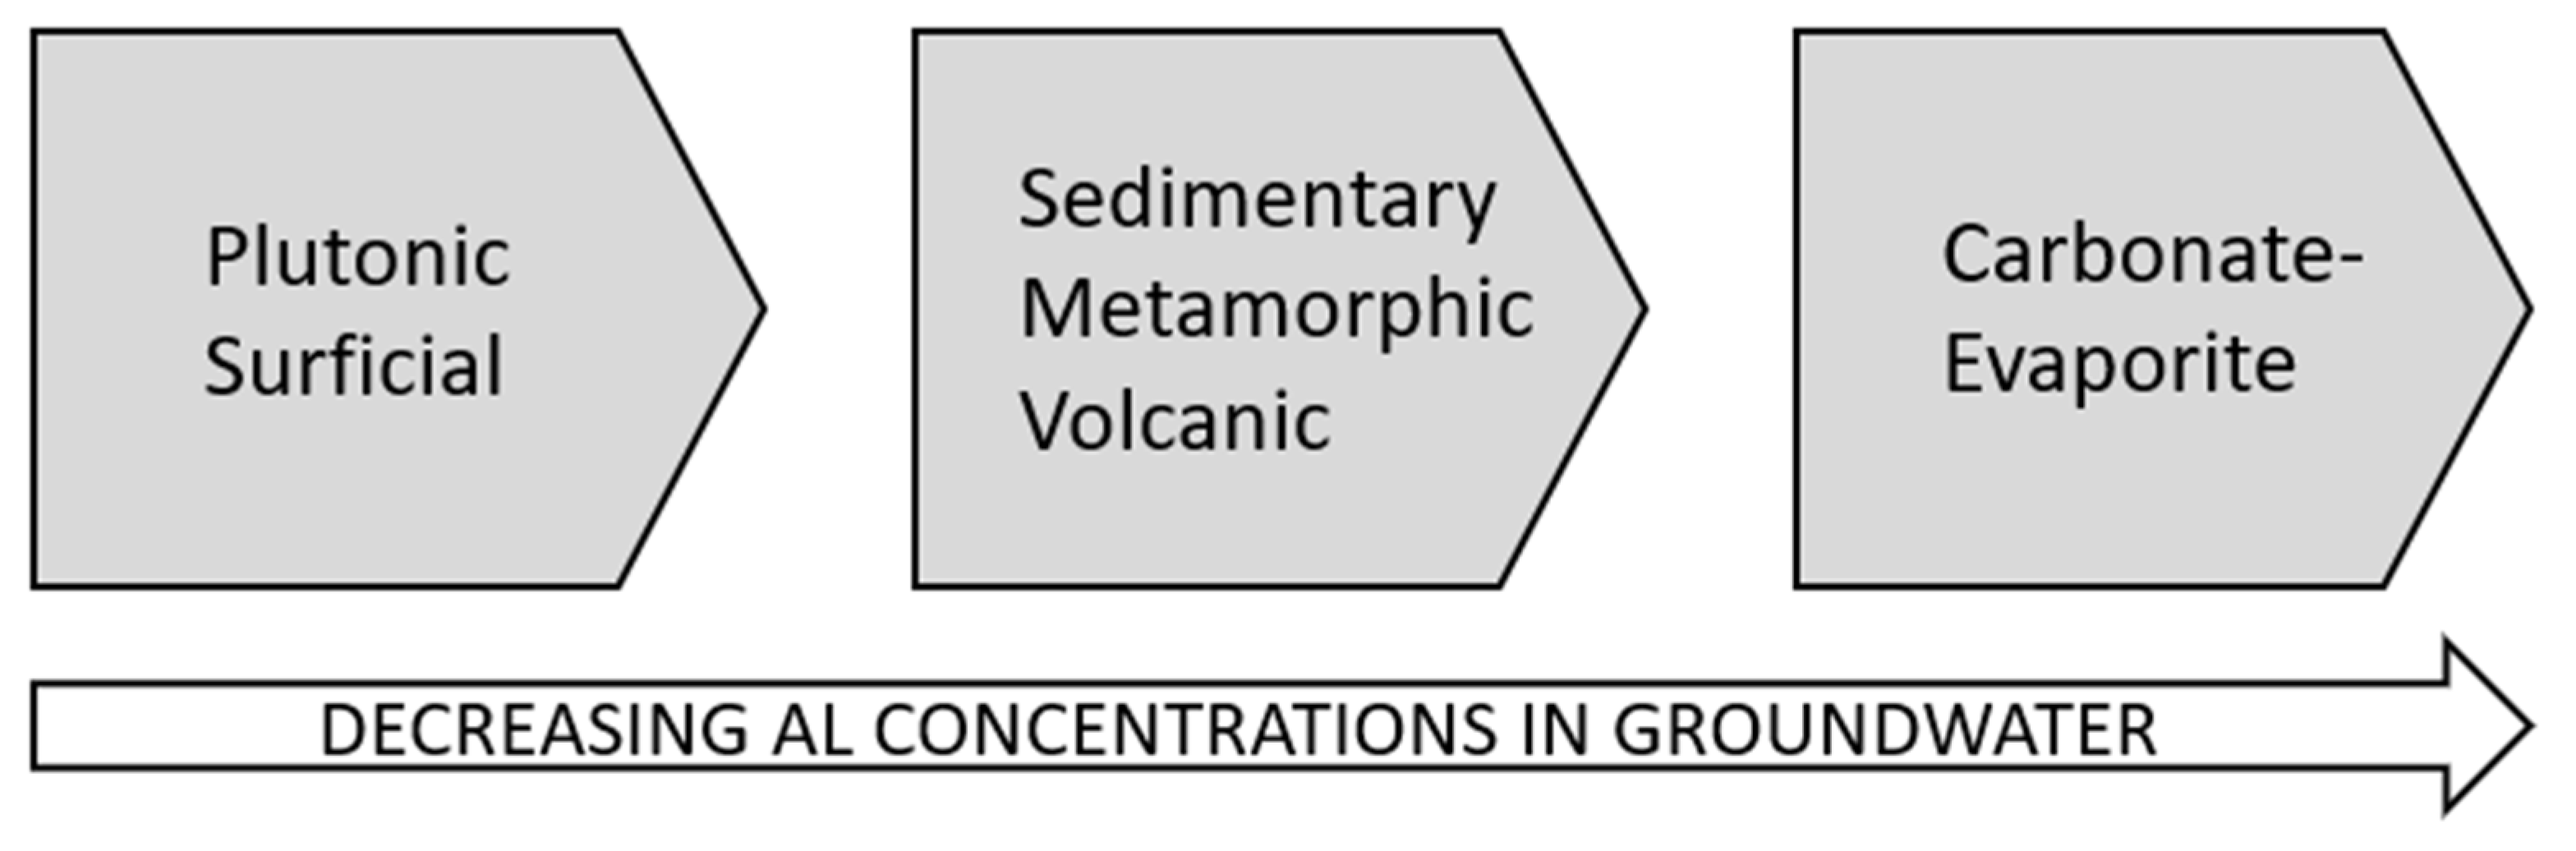
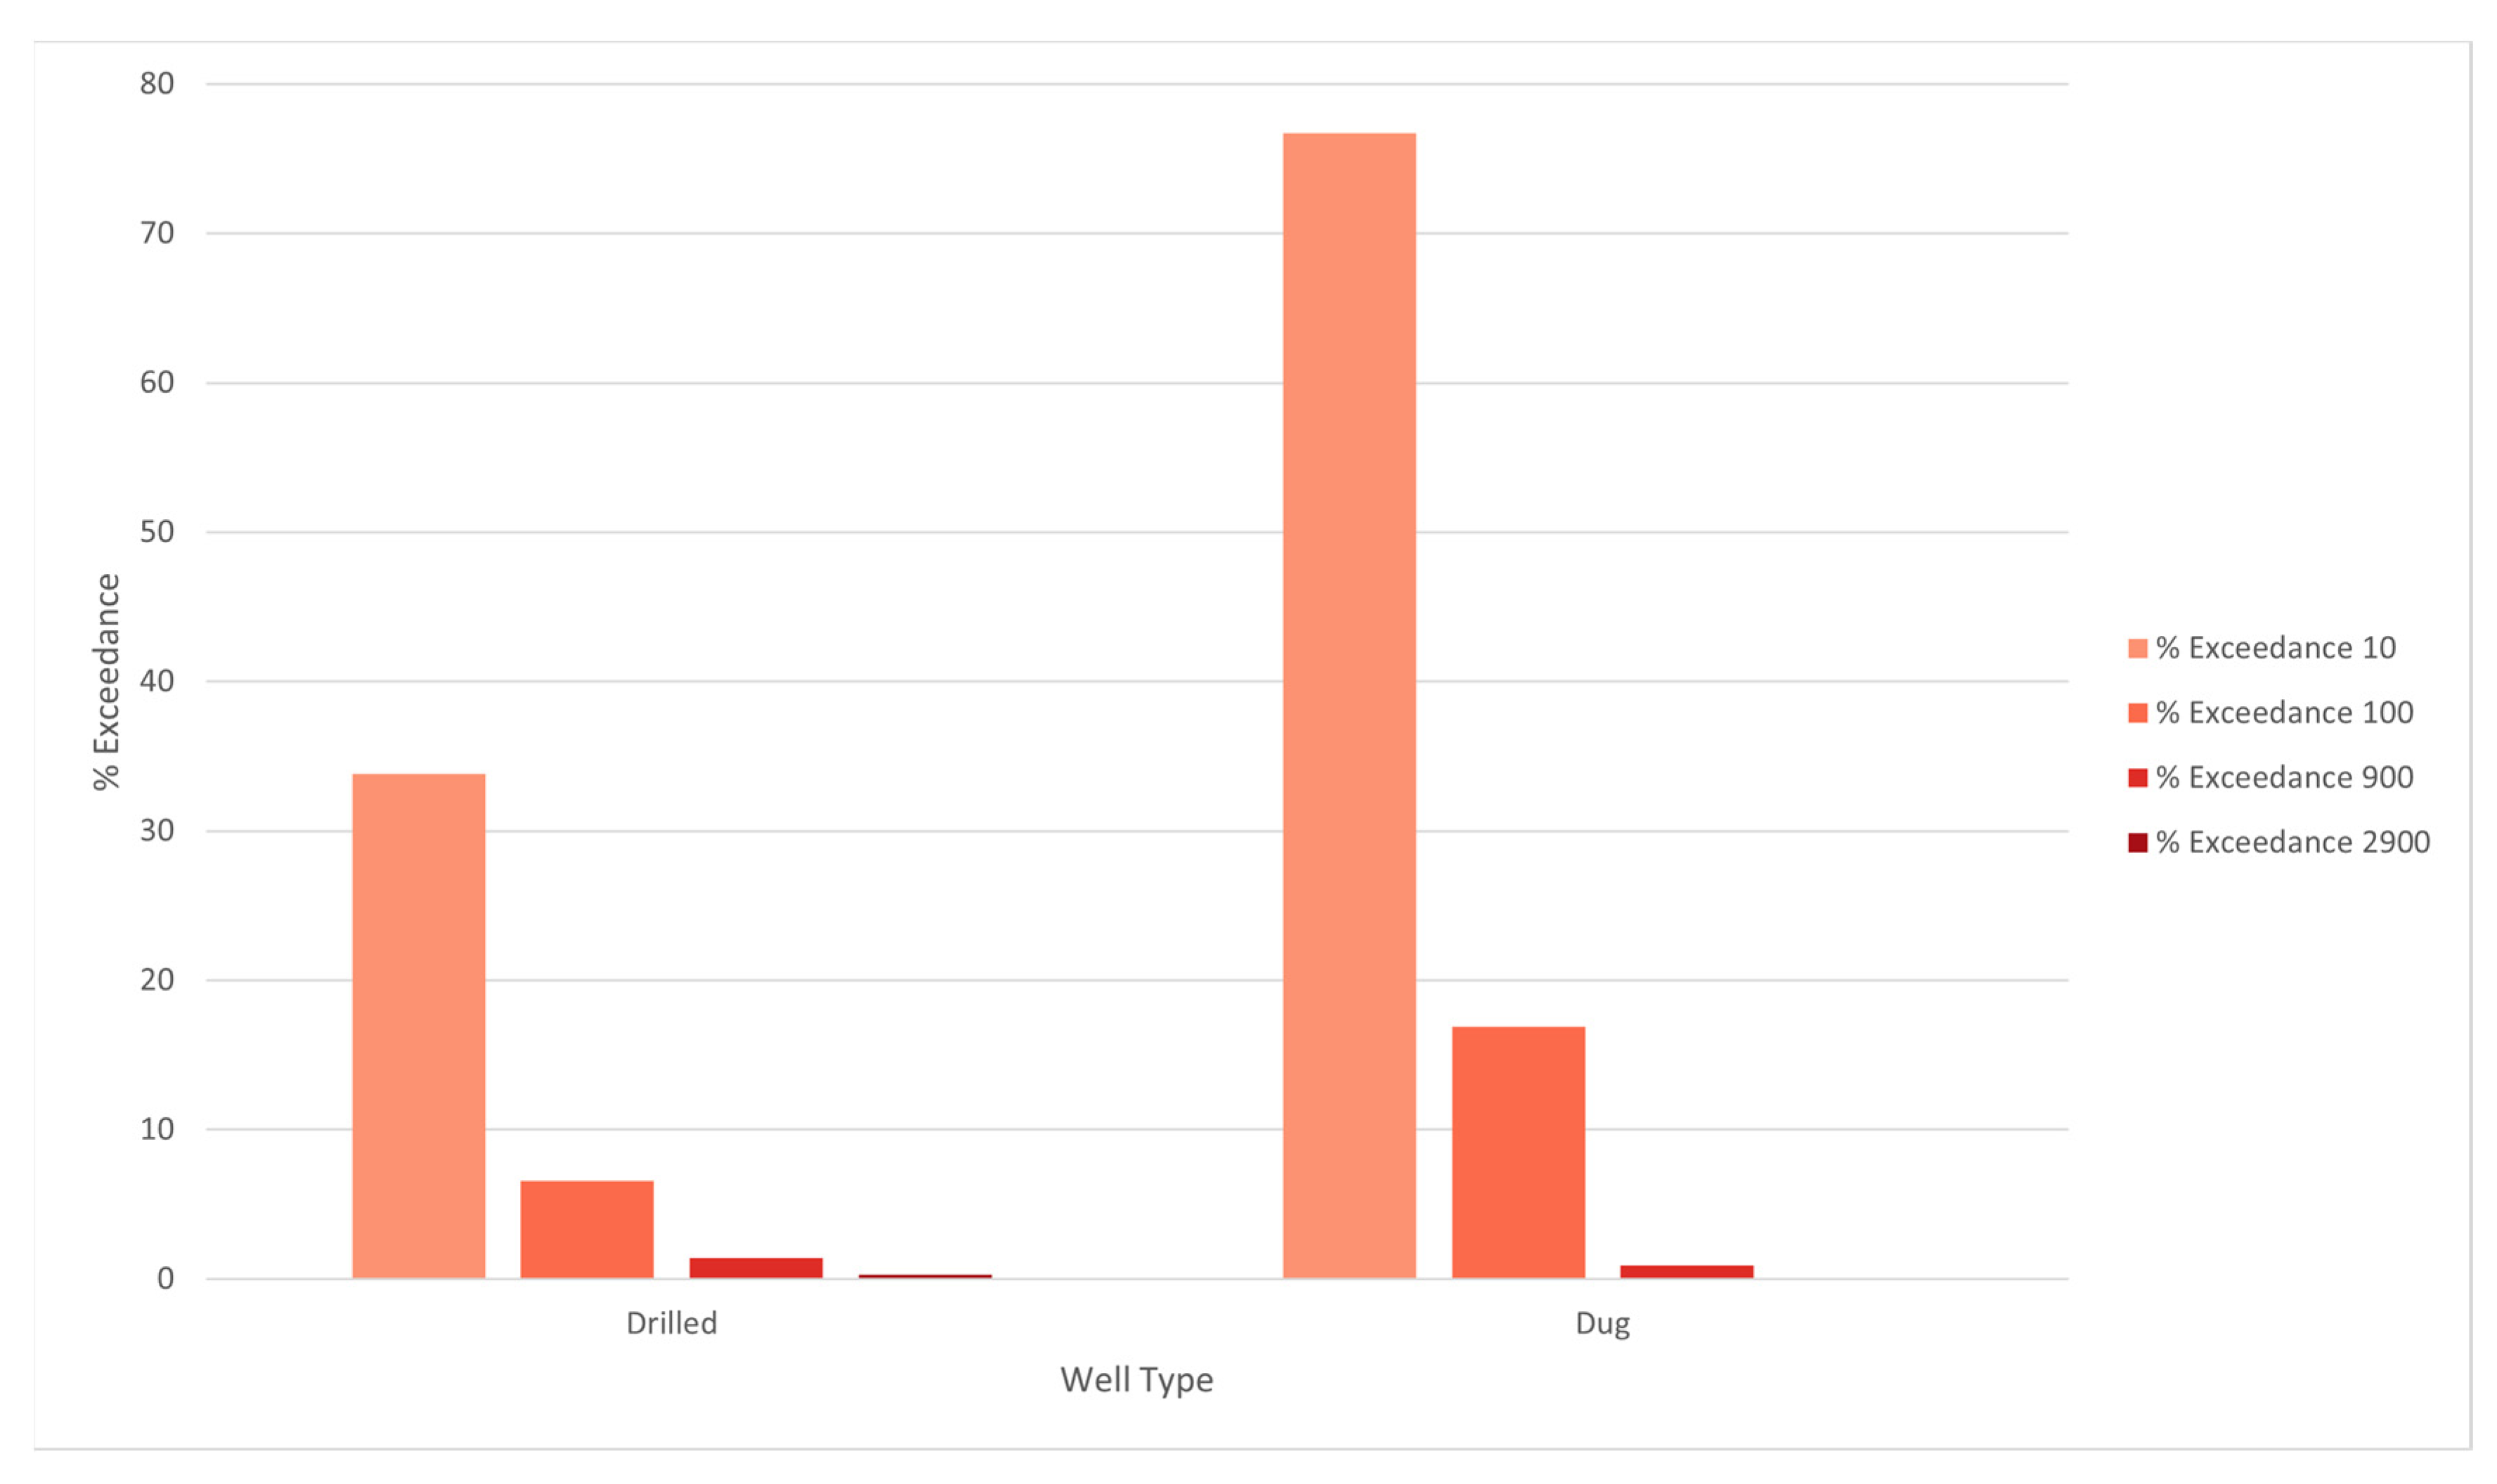
After pairwise comparison of Al concentrations across the groundwater regions, the plutonic and surficial groundwater regions were interpreted to have significantly higher concentrations (p < 0.05) than all other regions, whereas the carbonate-evaporite groundwater region had lower concentrations than all other regions (Table 2). There was no significant difference interpreted between Al populations for metamorphic, sedimentary, and volcanic groundwater regions (Table 2, Figure 4). The Peto and Peto test showed a significant difference in Al concentrations between well types (drilled vs. dug, p < 0.0001).
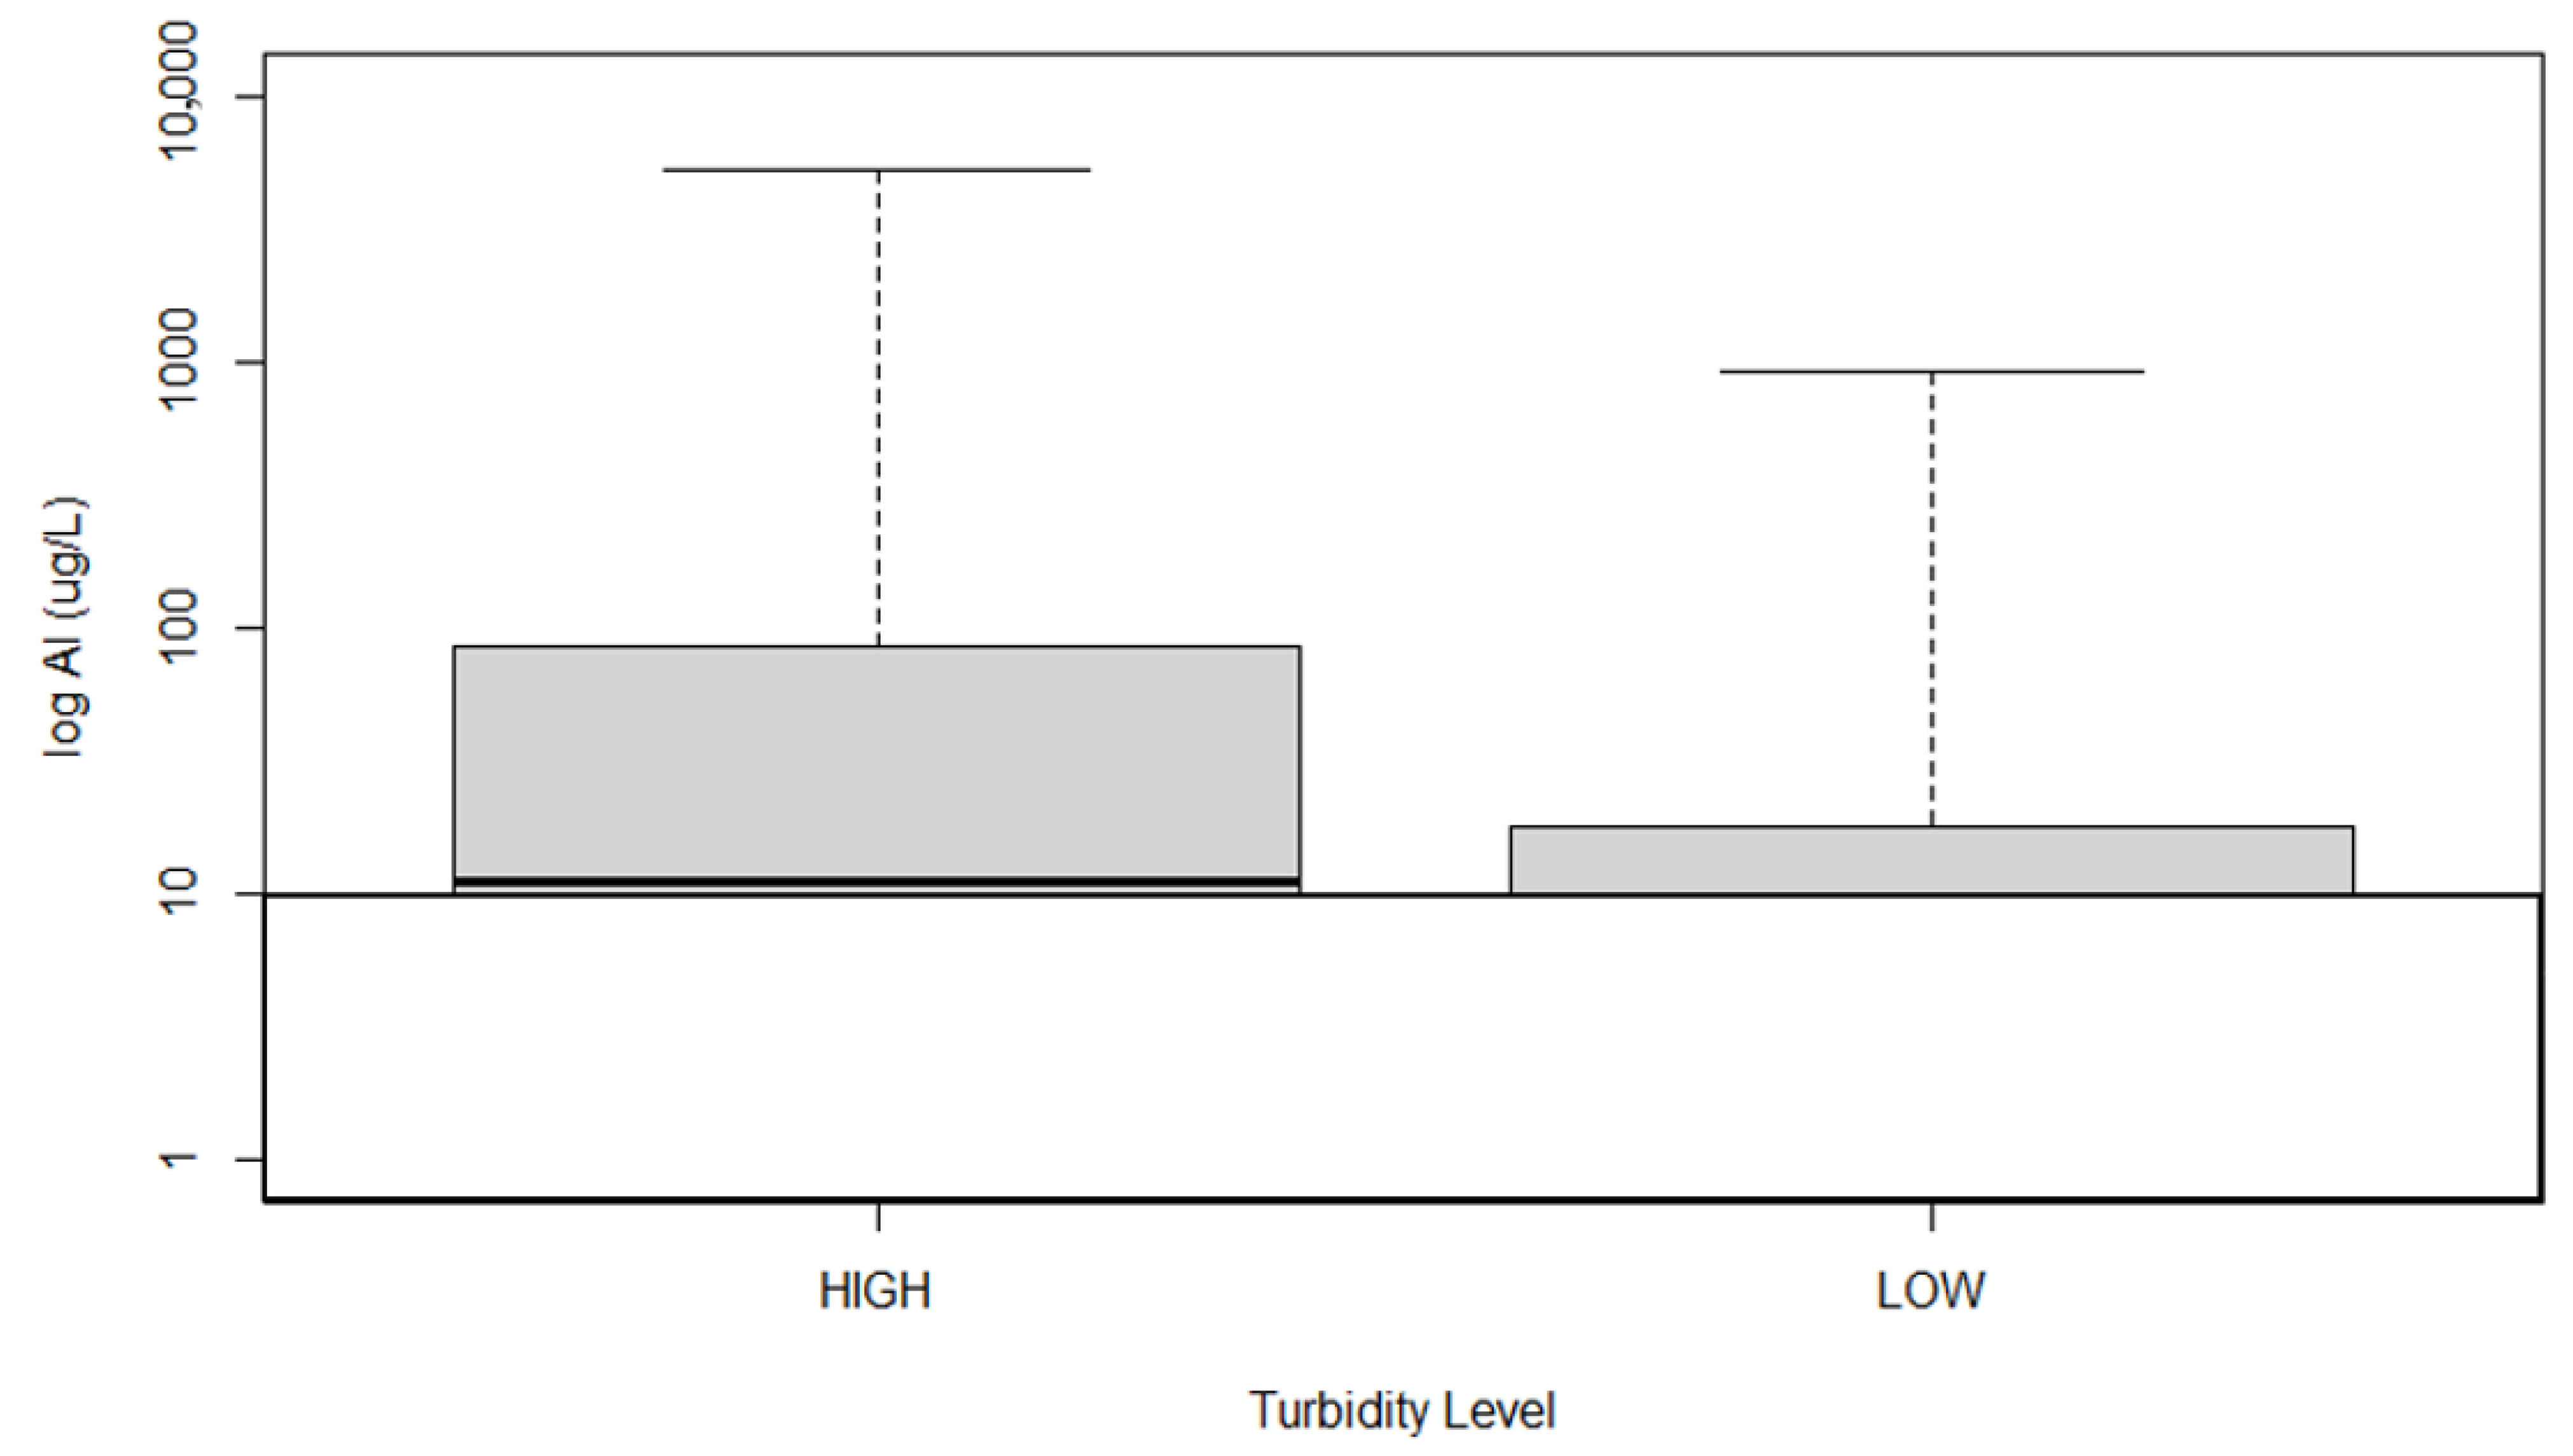
The Kendall’s tau test and linear regression models showed that pH was the water chemistry parameter most significantly related to Al concentrations, followed by TOC and Ca concentrations, and turbidity levels (Table 3). pH and Ca are negatively correlated with Al concentrations, while TOC and turbidity are positively correlated with Al concentrations (Table 3). A Peto and Peto test showed a significant difference (p < 0.0001) between samples with elevated turbidity (i.e., turbidity ≥ 5 NTU) and samples with lower turbidity (i.e., turbidity < 5 NTU) (Figure 5). A multivariate regression model using maximum likelihood estimation containing all four of the key water chemistry variables was found to be highly significant (p < 0.0001).
4. Discussion
The highest concentrations of Al detected in Nova Scotia exceed the MAC for human health established by Health Canada [22]. Although few samples exceeded the Health Canada MAC (Figure 1), these exceedances are important to highlight given the limited available options for water treatment. About 42% of the population, or 386,000 persons, province-wide rely on private wells for their domestic water supply [49]. Based on the distribution of private wells in Nova Scotia and the percent exceeding the Al MAC, it is estimated that there are about 500 to 1000 private wells in the province that may have Al exceeding safe limits. The maximum tolerable level of Al in water may be much lower for people with chronic kidney disease. Davison et al., (1982) [26] found that patients treated with home dialysis had a higher likelihood of developing dialysis dementia if the Al concentration in the water supply was >80 µg/L. About 10% of the well water samples in this study exceed this value.
The observed significant negative relationship between Al and both pH and Ca indicates the importance of pH controls and geological buffering capacity on Al mobility in groundwater, whereas the significant positive relationship with TOC suggests that groundwater acidification due to the release of humic acids from decaying organic matter may promote Al mobilization (Table 3). Statistical summaries of the data classified by groundwater region show that the highest Al concentrations are generally associated with the plutonic groundwater region, followed closely by the surficial and metamorphic groundwater regions. These results also indicate a strong pH control on Al levels in water wells in the province. Nova Scotia’s surficial aquifers and crystalline fractured bedrock aquifers (e.g. plutonic and metamorphic rock types) are associated with less chemically evolved groundwater with lower pH and calcium (Table 1b) compared to other groundwater regions in the province, indicating more acidic groundwater conditions (and less buffering capacity) and therefore greater potential for Al dissolution and transport. Similarly, dug wells, which receive younger, more acidic, less chemically evolved groundwater flow, were associated with higher Al concentrations compared to drilled wells (Figure 6). Conversely, well water samples from alkaline carbonate/evaporite aquifers (Table 1b) had a lower likelihood of elevated Al occurring in well water. While the sedimentary groundwater region was generally associated with lower Al concentrations compared to the plutonic and surficial regions, there were also several very high Al concentrations (>2000 µg/L) detected in sedimentary bedrock aquifers (Table 1). Most of these very high Al concentrations, however, were also associated with elevated turbidity due to insufficient well development following drilling (e.g., test well), which can result in elevated Al when the water sample is not filtered prior to acidification (Figure 5). A total metal digest of an unfiltered water sample is typically is recommended for assessments of drinking water quality to determine the total amount of contaminant that may be ingested.
The distribution of Al concentrations in Nova Scotia groundwater is comparable to those reported in previous studies in the provinces of Quebec and New Brunswick. For example, about 9.4% of Al results exceeded 100 µg/L in a 1994–2007 compilation of groundwater chemistry data from New Brunswick [34] compared to 8.3% in Nova Scotia. The results tend to follow spatial trends in corrosive groundwater, where private well users in areas of high potential groundwater corrosivity (i.e., acid-sensitive areas) may also encounter elevated concentrations of lead and copper [32]. These areas may also be at risk for toxic levels of Ali in groundwater that could potentially be exported to surface waters. The presence of drumlins, which typically contain carbonate-rich tills, may locally moderate low pH conditions in surrounding bedrock and surficial aquifers [50].
The water samples were analyzed for either dissolved or total Al, depending on whether the samples were filtered or not. As noted above, unfiltered samples with high particulate amounts can result in higher levels of Al and other metals [51] compared to filtered samples due to the dissolution of any Al contained in the particulate matter. We therefore cannot gain a clear understanding of the potential levels of toxic Ali in Nova Scotia’s groundwater from this data. However, a study of Ali concentrations in Nova Scotia’s rivers found that samples where the Ali concentration exceeded the threshold for aquatic health had dissolved Al concentrations ranging from 113–560 µg/L [52]. About 8% of our samples either fall within or greatly exceed this range.
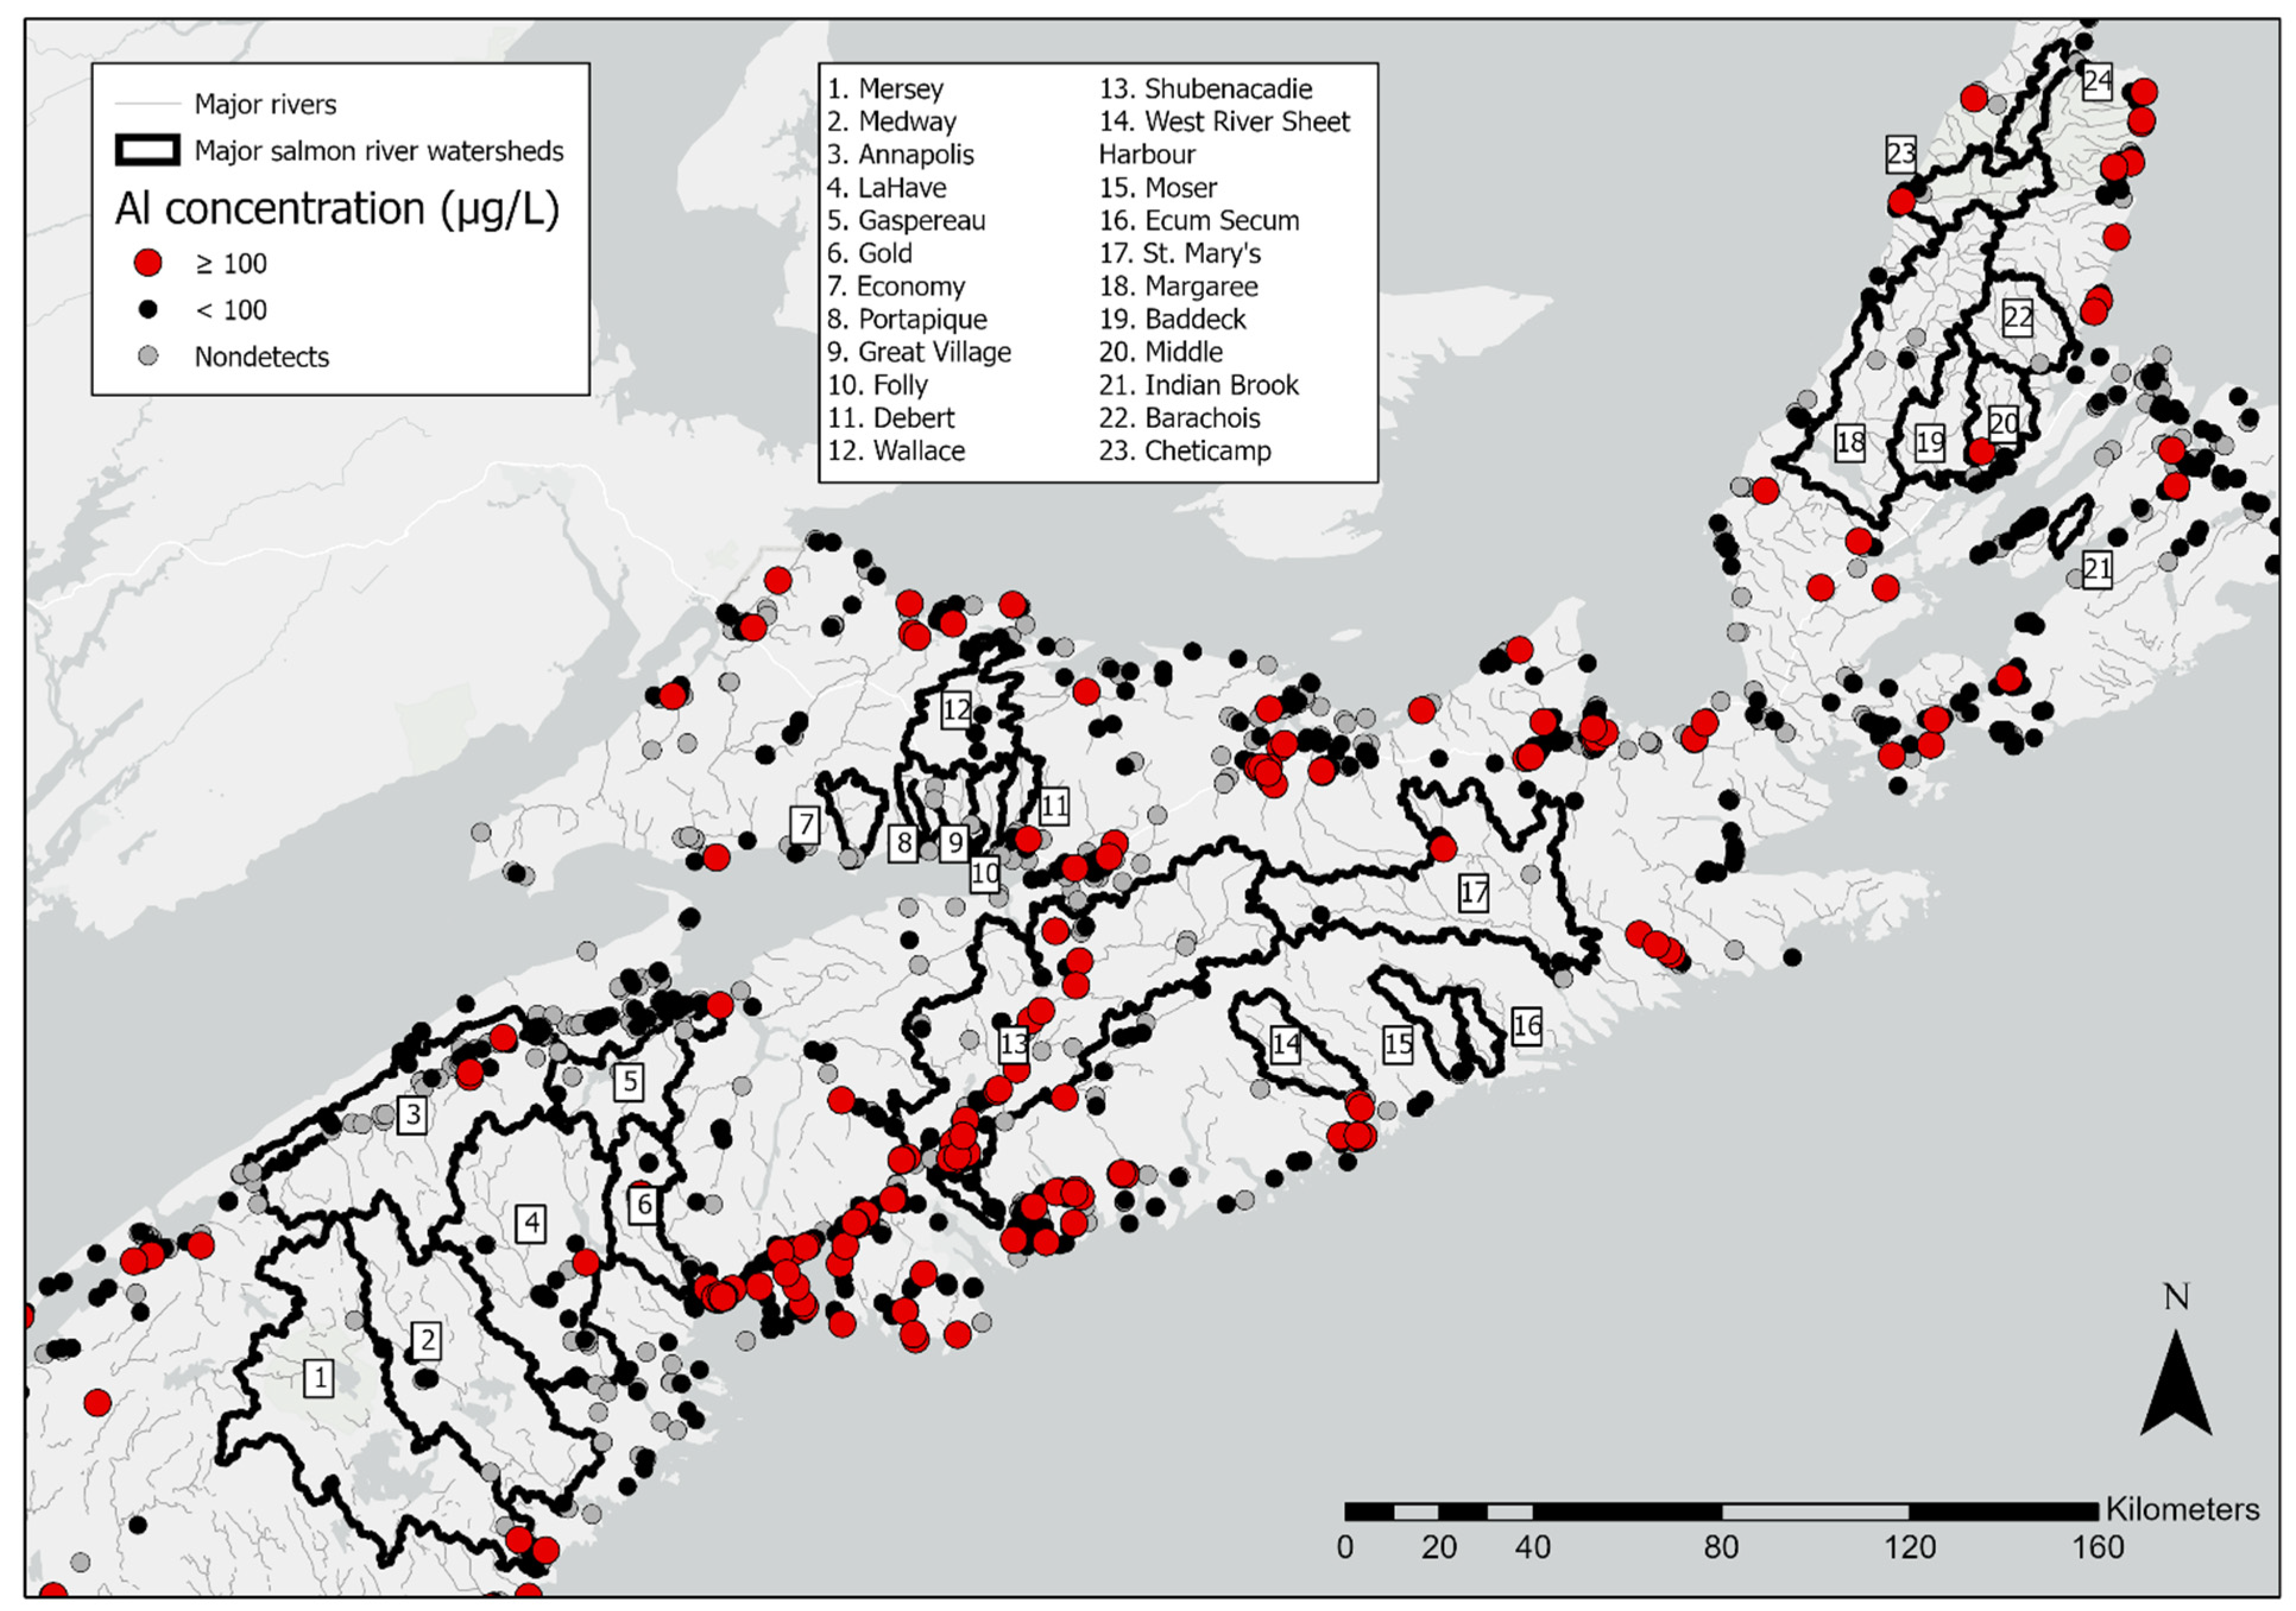
The distribution of Al in groundwater can be used to inform more detailed studies of groundwater export of Al to surface water, including installation of seepage meters and Al sampling of baseflow. Three notable salmon rivers where groundwater Al concentrations are known to be high are the Shubenacadie River, Gold River, and LaHave River (Figure 7). Many other important salmon rivers lack widespread groundwater sampling in their watersheds. However, there are several others that lie within high-risk bedrock regions, such as areas primarily underlain by plutonic and metamorphic bedrock types (Figure 7). These include the Mersey, Gaspereau, Barachois, and Chéticamp rivers. These watershed areas should be high priority locations for further studies of groundwater export of Al to surface water. Locations of high-risk areas for Al export from groundwater to surface water may also be refined based on the presence of drumlins, which may buffer acidic groundwater and mitigate Al transport [50]. As there are few sites with long-term pH records available, future studies could also focus on long-term pH trends in groundwater in the identified high priority watersheds. Groundwater quality monitoring programs should consider incorporating DOC measurements to better understand the relationship between dissolved organic carbon and groundwater acidification.
We recommend future study of the effect of drought on groundwater acidification status, especially in the face of climate change and the potential for increased frequency of summer drought in Nova Scotia [9]. Previous studies have shown that groundwater acidification has worsened in response to drought when sulfidic material is oxidized to sulfuric material and then mobilized during rewetting [4,7,8], but this relationship has not yet been studied in Nova Scotia. We recommend that private well owners be strongly encouraged to test for Al, especially in areas considered to be at higher risk of low pH or corrosive groundwater (i.e., areas underlain by the plutonic and metamorphic bedrock regions) [53]. Owners of dug wells are also at higher risk for elevated Al in well water and should test their water supply for Al concentrations. The relationship between elevated turbidity and Al suggests that physical filtration techniques may be effective in partially reducing total concentrations of aluminum in drinking water.
The spatial coverage is not regularly distributed across the province and is biased towards more developed areas of Nova Scotia, where water wells and chemistry data are more readily available. The compiled water chemistry data spans a period of 40 years and comes from a variety of sources ranging from samples collected by water supply owners to well water quality surveys conducted by groundwater professionals. Hence, sampling and laboratory analytical methods are not consistent across the dataset. Field measurements of relevant geochemical parameters, such as dissolved oxygen, pH and Eh, were not part of the dataset. Analysis of seasonal or temporal Al trends is not possible with the dataset because there is typically only one sampling event per well. The well samples were collected most often in the summer (47% of samples), followed by 26% in the spring, 21% in the fall and only 6% in the winter. We recommend future study on seasonal trends of Al in wells, particularly in shallow dug wells, because seasonal patterns in Al concentrations have been identified in surface waters in Nova Scotia [54].
5. Conclusions
This study describes the acidification status and resulting Al concentrations in Nova Scotia’s groundwater, leading to a greater understanding of areas where private well water, in addition to surface waters such as rivers and lakes, may be at risk. Al concentrations in some areas of Nova Scotia are high enough that they may present a risk to both aquatic and human health. A small number of samples exceed the Health Canada MAC of 2900 µg/L, but these results highlight the need for routine well water testing for Al and other metals by private well users, which account for about 42% of Nova Scotia’s drinking water supplies. Furthermore, Al concentrations as low as 80 µg/L may have negative health impacts for people with chronic kidney disease [26]. The results show that Al concentrations in groundwater commonly exceed the threshold for toxicity to aquatic life such as Atlantic salmon, which is important in freshwater systems receiving significant inputs of groundwater. This issue will become even more important as the climate warms and cold-water fish species become more dependent on groundwater-fed areas of streams for their survival.
Al concentrations vary significantly with groundwater region (bedrock aquifer type), with the highest Al concentrations occurring in plutonic and metamorphic bedrock aquifers, along with the province’s surficial aquifers. The present analysis demonstrated regional-scale trends, although it should be noted that there is significant spatial heterogeneity in Al concentrations due to factors such as the availability of Al-containing minerals in contact with groundwater flow and the susceptibility of these minerals to weathering, along with variability in the geochemical conditions influencing Al mobility (e.g., pH, availability of complexing ions).
The observed relationships between pH, Ca and TOC all show the importance of pH controls on Al release and mobilization in groundwater. The province’s map of potential corrosivity of groundwater [51] may be useful in highlighting acid-sensitive areas where there is a higher likelihood of elevated Al in groundwater. We recommend that all private well users (but especially those in high-risk areas) test their water supply for Al. The results of this study can be used in support of risk communication efforts to promote routine testing of private wells for metals, including Al. Future studies should focus on the export of Al from groundwater to surface water in high-risk areas, especially those areas that host rivers containing significant populations of Atlantic salmon.
Author Contributions
Conceptualization, S.M.S.; methodology, S.M.S. and G.W.K..; formal analysis, K.A.H.; investigation, K.A.H.; data curation, G.W.K.; writing—original draft preparation, K.A.H. and G.W.K.; writing—review and editing, G.W.K., S.M.S. and K.A.H.; visualization, K.A.H. All authors have read and agreed to the published version of the manuscript.
Funding
This research was partially funded by an NSERC Discovery Grant.
Institutional Review Board Statement
Not applicable.
Informed Consent Statement
Not applicable.
Data Availability Statement
The data presented in this study are available on request from the author author [email protected]. The data are available in part at https://fletcher.novascotia.ca/DNRViewer/?viewer=Groundwater, accessed on 1 June 2021.
Acknowledgments
The authors would like to acknowledge the contributions made to this study by Abby Millard, who provided initial work on the analysis of the data and Chris White for his helpful comments on mineral occurrences of Al in Nova Scotia.
Conflicts of Interest
The authors declare no conflict of interest.
References
- Baekken, T.; Kroglund, F.; Lindstrom, E.-A.; Carvalho, L. Acidification of rivers and lakes. In Indicators and Methods for the Ecological Status Assessment under the Water Framework Directive: Linkage between Chemical and Biological Quality of Surface Waters; Solimini, A.G., Cardoso, A.C., Heiskanen, A.-S., Eds.; Institute for Environment and Sustainability: Ispra, Italy, 2006; pp. 117–132. [Google Scholar]
- Clair, T.A.; Hindar, A. Liming for the Mitigation of Acid Rain Effects in Freshwaters: A Review of Recent Results. Environ. Rev. 2005, 13, 91–128. [Google Scholar] [CrossRef]
- Hesthagen, T.; Sevaldrud, I.H.; Berger, H.M. Assessment of Damage to Fish Populations in Norwegian Lakes Due to Acidification. Ambio 1999, 28, 112–117. [Google Scholar]
- Knutsson, G. Acidification Effects on Groundwater—Prognosis of the Risks for the Future. In Future Groundwater Resources at Risk (Proceedings of the Helsinki Conference, June 1994); IAHS Press: Wallingford, UK, 1994. [Google Scholar]
- Fox, D.L. Prediction of Acid Rock Drainage (ARD) from Sulphidic Slates Using GIS Analysis of Rnineralogical, Geochemical, Magnetic and Geological Parameters: A Test Case in Southern Nova Scotia. Ph.D. Thesis, Dalhousie University, Halifax, Nova Scotia, 1999. [Google Scholar]
- Keefe, M.; Turnbull, L.; White, C.E. Acid Rock Drainage and Manganese in Rock Units Surrounding the Town of Bridgewater’s Water Supply, Lunenburg County, Nova Scotia. In Geoscience and Mines Branch, Report of Activities 2017–2018; Report ME 2018-001; Nova Scotia Department of Energy and Mines: Halifax, NS, Canada, 2018; pp. 23–31. [Google Scholar]
- Appleyard, S.; Cook, T. Reassessing the Management of Groundwater Use from Sandy Aquifers: Acidification and Base Cation Depletion Exacerbated by Drought and Groundwater Withdrawal on the Gnangara Mound, Western Australia. Hydrogeol. J. 2009, 17, 579–588. [Google Scholar] [CrossRef]
- Mosley, L.M.; Palmer, D.; Leyden, E.; Cook, F.; Zammit, B.; Shand, P.; Baker, A.W.; Fitzpatrick, R. Acidification of Floodplains Due to River Level Decline during Drought. J. Contam. Hydrol. 2014, 161, 10–23. [Google Scholar] [CrossRef] [PubMed]
- Kennedy, G.; Drage, J.; Check, G. Development of Indices to Assess the Potential Impact of Drought to Private Wells in Nova Scotia. In Proceedings of the GeoOttawa 2017, Ottawa, ON, Canada, 30 September–2 October 2017. 8p. [Google Scholar]
- Perrone, D.; Jasechko, S. Dry Groundwater Wells in the Western United States. Environ. Res. Lett. 2017, 12, 104002. [Google Scholar] [CrossRef]
- Hem, J.D. Study and Interpretation of the Chemical Characteristics of Natural Water; U.S. Geological Survey Water-Supply Paper 2254; Department of the Interior: Alexandria, VA, USA, 1985. [Google Scholar]
- Smeltzer, D. Loon Lake Andalusite Project, Guysborough County, Nova Scotia, Till Sample Program and Outcrop Analyses; Nova Scotia Department of Natural Resources: Halifax, NS, Canada, 1996; 16p. [Google Scholar]
- MacDonald, M.A.; Horne, R.J.; Corey, M.C.; Ham, L.J. An Overview of Recent Bedrock Mapping and Follow-up Petrological Studies of the South Mountain Batholith, Southwestern Nova Scotia, Canada. Atl. Geol. 1992, 28, 7–28. [Google Scholar] [CrossRef] [Green Version]
- Driscoll, C.T.; Schecher, W.D. The Chemistry of Aluminum in the Environment. Environ. Geochem. Health 1990, 12, 28–49. [Google Scholar] [CrossRef]
- Exley, C.; Chappell, J.S.; Birchall, J.D. A Mechanism for Acute Aluminium Toxicity in Fish. J. Theor. Biol. 1991, 151, 417–428. [Google Scholar] [CrossRef]
- Nilsen, T.O.; Ebbesson, L.O.; Kverneland, O.G.; Kroglund, F.; Finstad, B.; Stefansson, S.O. Effects of Acidic Water and Aluminum Exposure on Gill Na, K -ATPase α-Subunit Isoforms, Enzyme Activity, Physiology and Return Rates in Atlantic Salmon (Salmo Salar L.). Aquat. Toxicol. 2010, 97, 250–259. [Google Scholar] [CrossRef]
- U.S. Environmental Protection Agency. 2018 Edition of the Drinking Water Standards and Health Advisories Tables; U.S. Environmental Protection Agency: Washington, DC, USA, 2018.
- Lacoul, P.; Freedman, B.; Clair, T. Effects of Acidification on Aquatic Biota in Atlantic Canada. Environ. Rev. 2011, 19, 429–460. [Google Scholar] [CrossRef]
- Flaten, T.P. Aluminium as a Risk Factor in Alzheimer’s Disease, with Emphasis on Drinking Water. Brain Res. Bull. 2001, 55, 187–196. [Google Scholar] [CrossRef]
- Martyn, C.N.; Osmond, C.; Edwardson, J.A.; Barker, D.; Harris, E.C.; Lacey, R.F. Geographical Relation between Alzheimer’s Disease and Aluminium in Drinking Water. Lancet 1989, 333, 61–62. [Google Scholar] [CrossRef]
- Wills, M.R.; Savory, J. Water Content of Aluminum, Dialysis Dementia, and Osteomalacia. Environ. Health Perspect. 1985, 63, 141–147. [Google Scholar] [CrossRef]
- Health Canada. Guidelines for Canadian Drinking Water Quality: Guideline Technical Document—Aluminum; Health Canada: Ottawa, ON, Canada, 2021; 72p, ISBN 978-0-660-37115-3. [Google Scholar]
- World Health Organization. Aluminium in Drinking-Water; Background Document for Development of WHO Guidelines for Drinking-Water Quality; WHO Press: Geneva, Switzerland, 2010. [Google Scholar]
- Poirier, J.; Semple, H.; Davies, J.; Lapointe, R.; Dziwenka, M.; Hiltz, M.; Mujibi, D. Double-Blind, Vehicle-Controlled Randomized Twelve-Month Neurodevelopmental Toxicity Study of Common Aluminum Salts in the Rat. Neuroscience 2011, 193, 338–362. [Google Scholar] [CrossRef]
- Panhwar, A.H.; Kazi, T.G.; Naeemullah; Afridi, H.I.; Shah, F.; Arain, M.B.; Arain, S.A. Evaluated the Adverse Effects of Cadmium and Aluminum via Drinking Water to Kidney Disease Patients: Application of a Novel Solid Phase Microextraction Method. Environ. Toxicol. Pharmacol. 2016, 43, 242–247. [Google Scholar] [CrossRef] [PubMed]
- Davison, A.M.; Oli, H.; Walker, G.S.; Lewins, A.M. Water Supply aluminium concentration, dialysis dementia, and effect of reverse-osmosis water treatment. Lancet 1982, 320, 785–787. [Google Scholar] [CrossRef]
- Goodsell, T.H.; Carling, G.T.; Aanderud, Z.T.; Nelson, S.T.; Fernandez, D.P.; Tingey, D.G. Thermal Groundwater Contributions of Arsenic and Other Trace Elements to the Middle Provo River, Utah, USA. Environ. Earth Sci. 2017, 76, 268. [Google Scholar] [CrossRef]
- Hagerthey, S.E.; Kerfoot, W.C. Groundwater Flow Influences the Biomass and Nutrient Ratios of Epibenthic Algae in a North Temperate Seepage Lake. Limnol. Oceanogr. 1998, 43, 1227–1242. [Google Scholar] [CrossRef]
- Hoehn, E. Solute Exchange between River Water and Groundwater in Headwater Environments. Hydrol. Water Resour. Ecol. Headwaters 1998, 7, 165–172. [Google Scholar]
- Shaw, G.D.; White, E.S.; Gammons, C.H. Characterizing Groundwater–Lake Interactions and Its Impact on Lake Water Quality. J. Hydrol. 2013, 492, 69–78. [Google Scholar] [CrossRef]
- Hansen, B.K.; Postma, D. Acidification, Buffering, and Salt Effects in the Unsaturated Zone of a Sandy Aquifer, Klosterhede, Denmark. Water Resour. Res. 1995, 31, 2795–2809. [Google Scholar] [CrossRef]
- Kennedy, G. Potential Corrosivity of Groundwater in Nova Scotia and Its Association with Lead in Private Well Water; Open File Report ME 2019-002; Nova Scotia Department of Energy and Mines: Halifax, Nova Scotia, 2019; 22p. [Google Scholar]
- Bondu, R.; Cloutier, V.; Rosa, E.; Roy, M. An Exploratory Data Analysis Approach for Assessing the Sources and Distribution of Naturally Occurring Contaminants (F, Ba, Mn, As) in Groundwater from Southern Quebec (Canada). Appl. Geochem. 2020, 114, 104500. [Google Scholar] [CrossRef]
- Government of New Brunswick. New Brunswick Groundwater Chemistry Atlas: 1994-2007; Environmental Reporting Series; New Brunswick Department of Environment: Fredericton, NB, Canada, 2008. [Google Scholar]
- de Meyer, C.M.C.; Rodríguez, J.M.; Carpio, E.A.; García, P.A.; Stengel, C.; Berg, M. Arsenic, Manganese and Aluminum Contamination in Groundwater Resources of Western Amazonia (Peru). Sci. Total Environ. 2017, 607–608, 1437–1450. [Google Scholar] [CrossRef]
- Briggs, M.A.; Lane, J.W.; Snyder, C.D.; White, E.A.; Johnson, Z.C.; Nelms, D.L.; Hitt, N.P. Shallow Bedrock Limits Groundwater Seepage-Based Headwater Climate Refugia. Limnologica 2018, 68, 142–156. [Google Scholar] [CrossRef]
- Ebersole, J.L.; Liss, W.J.; Frissell, C.A. Thermal Heterogeneity, Stream Channel Morphology, and Salmonid Abundance in Northeastern Oregon Streams. Can. J. Fish. Aquat. Sci. 2003, 60, 1266–1280. [Google Scholar] [CrossRef]
- Kurylyk, B.L.; MacQuarrie, K.T.B.; Linnansaari, T.; Cunjak, R.A.; Curry, R.A. Preserving, Augmenting, and Creating Cold-Water Thermal Refugia in Rivers: Concepts Derived from Research on the Miramichi River, New Brunswick (Canada). Ecohydrology 2015, 8, 1095–1108. [Google Scholar] [CrossRef]
- Berman, C.H.; Quinn, T.P. Behavioural Thermoregulation and Homing by Spring Chinook Salmon, Oncorhynchus Tshawytscha (Walbaum), in the Yakima River. J. Fish. Biol. 1991, 39, 301–312. [Google Scholar] [CrossRef]
- Sutton, R.J.; Deas, M.L.; Tanaka, S.K.; Soto, T.; Corum, R.A. Salmonid Observations at a Klamath River Thermal Refuge under Various Hydrological and Meteorological Conditions. River Res. Appl. 2007, 23, 775–785. [Google Scholar] [CrossRef]
- de Graaf, I.E.M.; Gleeson, T.; (Rens) van Beek, L.P.H.; Sutanudjaja, E.H.; Bierkens, M.F.P. Environmental Flow Limits to Global Groundwater Pumping. Nature 2019, 574, 90–94. [Google Scholar] [CrossRef] [PubMed]
- Howells, G.; Dalziel, T.; Reader, J.P.; Solbe, J.F. EIFAC Water Quality Criteria for European Freshwater Fish: Report on Aluminium. Chem. Ecol. 1990, 4, 117–173. [Google Scholar] [CrossRef]
- Nova Scotia Department of Energy and Mines Nova Scotia Groundwater Atlas Well Water Chemistry. 2021. Available online: https://fletcher.novascotia.ca/DNRViewer/?viewer=Groundwater (accessed on 27 May 2021).
- Nova Scotia Environment and Climate Change Nova Scotia Well Logs Database. 2020. Available online: https://novascotia.ca/natr/meb/geoscience-online/groundwater_about.asp (accessed on 1 June 2021).
- Kennedy, G.W.; Drage, J. Groundwater Regions Map of Nova Scotia; Nova Scotia Department of Natural Resources: Halifax, NS, Canada, 2008. [Google Scholar]
- Keppie, J.D. Geological Map of the Province of Nova Scotia; Nova Scotia Department of Natural Resource: Halifax, NS, Canada, 2000. [Google Scholar]
- ESRI. ArcGIS Desktop: Release 10; Environmental Systems Research Institute: Redlands, CA, USA, 2011. [Google Scholar]
- R Core Team. R: A Language and Environment for Statistical Computing; R Foundation for Statistical Computing: Vienna, Austria, 2020; Available online: https://www.R-project.org/ (accessed on 1 June 2021).
- Kennedy, G.; Polegato, A. Where Does Our Tap Water Come From? An Analysis of Domestic Water Source and Supply Demographics in Nova Scotia; Open File Report ME 2016-006; Nova Scotia Department of Natural Resources: Halifax, NS, Canada, 2017; 18p. [Google Scholar]
- Utting, D.; Goodwin, T. Lake-Sediment Geochemistry and Its Influence on Lake Alkalinity, Southwest Nova Scotia. In Mineral Resources Branch, Report of Activities 2007; Report ME 2008-1; Nova Scotia Department of Natural Resources: Halifax, NS, Canada, 2008; pp. 105–111. [Google Scholar]
- Dyck, W.; Chatterjee, A.K.; Gemmell, D.E.; Murricane, K. Well Water Trace Element Reconnaissance, Eastern Maritime Canada. J. Geochem. Explor. 1976, 6, 139–162. [Google Scholar] [CrossRef]
- Sterling, S.M.; MacLeod, S.; Rotteveel, L.; Hart, K.; Clair, T.A.; Halfyard, E.A.; O’Brien, N.L. Ionic Aluminium Concentrations Exceed Thresholds for Aquatic Health in Nova Scotian Rivers, Even during Conditions of High Dissolved Organic Carbon and Low Flow. Hydrol. Earth Syst. Sci. 2020, 24, 4763–4775. [Google Scholar] [CrossRef]
- Nova Scotia Department of Energy and Mines, Relative Risk of Corrosive Groundwater in Drilled Water Wells. 2021. Available online: https://fletcher.novascotia.ca/DNRViewer/index.html?viewer=Drilled_Corrosive_Groundwater_NS.Relative_Corrosivity_of_Groundwater_in_Drilled_Water_Wells (accessed on 1 June 2021).
- Rotteveel, L.; Sterling, S.M. Five Aluminum Seasonality Regimes Identified in Chronically Acidified Rivers of Nova Scotia. Environ. Sci. Technol. 2020, 54, 807–817. [Google Scholar] [CrossRef] [PubMed]
Figure 1.
Percentage of samples in each groundwater region that exceed each aluminum threshold (10 µg/L, 100 µg/L, 900 µg/L, and 2900 µg/L).
Figure 1.
Percentage of samples in each groundwater region that exceed each aluminum threshold (10 µg/L, 100 µg/L, 900 µg/L, and 2900 µg/L).

Figure 2.
Distribution of aluminum in well water samples and well types compared to the bedrock groundwater regions of Nova Scotia.
Figure 2.
Distribution of aluminum in well water samples and well types compared to the bedrock groundwater regions of Nova Scotia.

Figure 3.
Aluminum concentrations in water wells compared to the bedrock groundwater regions of Nova Scotia.
Figure 3.
Aluminum concentrations in water wells compared to the bedrock groundwater regions of Nova Scotia.

Figure 4.
Groupings of groundwater regions with significant differences in associated Al concentrations using the Peto and Peto modification of the Gehan–Wilcoxon test.
Figure 4.
Groupings of groundwater regions with significant differences in associated Al concentrations using the Peto and Peto modification of the Gehan–Wilcoxon test.

Figure 5.
Censored boxplot showing difference in comparison of Al concentrations grouped by samples with high (i.e., >=5 NTU) and low (i.e., <5 NTU) turbidity. A Peto and Peto test showed this difference to be statistically significant (p < 0.0001). Data are censored so the portion of the plot below the maximum detection limit in the dataset (e.g., 10 µg/L) is not shown.

Figure 6.
Percentage of samples of each well type that exceed each aluminum threshold (10 µg/L, 100 µg/L, 900 µg/L, and 2900 µg/L).
Figure 6.
Percentage of samples of each well type that exceed each aluminum threshold (10 µg/L, 100 µg/L, 900 µg/L, and 2900 µg/L).

Figure 7.
Aluminum concentrations in water wells compared to important salmon river watersheds.


Table 1.
For each groundwater region, (a) the percentage of Al samples exceeding various thresholds and (b) statistical summaries of Al concentrations with median calcium and pH shown for comparison.
Table 1.
For each groundwater region, (a) the percentage of Al samples exceeding various thresholds and (b) statistical summaries of Al concentrations with median calcium and pH shown for comparison.
| (a) | |||||||
| Groundwater Region | Count Observations | Count Detects 1 | % Detects | % Exceed 10 | % Exceed 100 | % Exceed 900 | % Exceed 2900 |
| Plutonic | 320 | 230 | 71.9% | 51.2% | 12.5% | 2.19% | 0.31% |
| Sedimentary | 954 | 439 | 46.0% | 30.0% | 4.19% | 0.52% | 0.31% |
| Carbonate/Evaporite | 176 | 57 | 32.4% | 21.6% | 3.98% | 1.14% | 0.00% |
| Metamorphic | 458 | 250 | 54.6% | 33.4% | 8.30% | 1.96% | 0.22% |
| Volcanic | 66 | 41 | 62.1% | 42.4% | 1.51% | 0.00% | 0.00% |
| Surficial | 544 | 435 | 80.0% | 68.6% | 15.6% | 1.84% | 0.18% |
| TOTAL | 2518 | 1452 | 57.7% | 41.2% | 8.34% | 1.31% | 0.24% |
| (b) | |||||||
| Groundwater Region | K—M 2 Mean | Min | Median | 95th Percentile | Max | Median Ca (mg/L) | Median pH |
| Plutonic | 92.66 | 1.0 | 10.0 | 370 | 5270 | 17.3 | 7.32 |
| Sedimentary | 36.56 | 1.0 | <10 | 75 | 4700 | 37.0 | 7.9 |
| Carbonate/Evaporite | 30.98 | 1.0 | <10 | 72 | 1300 | 66.9 | 8.00 |
| Metamorphic | 73.28 | 0.25 | <10 | 347 | 3060 | 24.1 | 7.68 |
| Volcanic | 18.08 | 1.0 | <10 | 60 | 220 | 25.9 | 7.77 |
| Surficial | 90.58 | 1.0 | 19.0 | 330 | 3400 | 18 | 6.92 |
1 Count of the Al results that are greater or equal to the laboratory detection limit. 2 K–M: Kaplan–Meier.
Table 2.
P-values from pairwise comparison of aluminum concentrations with groundwater regions. Values significant at the 5% significance level are bolded.
Table 2.
P-values from pairwise comparison of aluminum concentrations with groundwater regions. Values significant at the 5% significance level are bolded.
| Carbonate/Evaporite | Metamorphic | Plutonic | Sedimentary | Surficial | |
|---|---|---|---|---|---|
| Metamorphic | <0.0001 | - | - | - | - |
| Plutonic | <0.0001 | 0.0009 | - | - | - |
| Sedimentary | <0.0001 | 0.3480 | <0.0001 | - | - |
| Surficial | <0.0001 | <0.0001 | <0.0001 | <0.0001 | - |
| Volcanic | <0.0001 | 0.3170 | 0.0490 | 0.0690 | <0.0001 |
Table 3.
Slope and p-values from maximum likelihood regression models of relationships between Al concentration and other water chemistry parameters.
Table 3.
Slope and p-values from maximum likelihood regression models of relationships between Al concentration and other water chemistry parameters.
| Parameter | Slope | p-Value |
|---|---|---|
| pH | −1.059 | 2.15 × 10−49 |
| TOC | 0.199 | 2.19 × 10⁻²⁰ |
| Ca | −0.0059 | 4.50 × 10⁻¹² |
| Turbidity | 0.00515 | 3.01 × 10⁻⁸ |
Publisher’s Note: MDPI stays neutral with regard to jurisdictional claims in published maps and institutional affiliations. |
© 2021 by the authors. Licensee MDPI, Basel, Switzerland. This article is an open access article distributed under the terms and conditions of the Creative Commons Attribution (CC BY) license (https://creativecommons.org/licenses/by/4.0/).
Share and Cite
MDPI and ACS Style
Hart, K.A.; Kennedy, G.W.; Sterling, S.M. Distribution, Drivers, and Threats of Aluminum in Groundwater in Nova Scotia, Canada. Water 2021, 13, 1578. https://doi.org/10.3390/w13111578
AMA Style
Hart KA, Kennedy GW, Sterling SM. Distribution, Drivers, and Threats of Aluminum in Groundwater in Nova Scotia, Canada. Water. 2021; 13(11):1578. https://doi.org/10.3390/w13111578
Chicago/Turabian StyleHart, Kristin A., Gavin W. Kennedy, and Shannon M. Sterling. 2021. "Distribution, Drivers, and Threats of Aluminum in Groundwater in Nova Scotia, Canada" Water 13, no. 11: 1578. https://doi.org/10.3390/w13111578
Note that from the first issue of 2016, this journal uses article numbers instead of page numbers. See further details here.