
Potential Use of Treated Wastewater as Groundwater Recharge Using GIS Techniques and Modeling Tools in Dhuleil-Halabat Well-Field/Jordan


1
Department of Civil Engineering, Al al-Bayt University, Mafraq 25113, Jordan
2
Department of Chemical Engineering, College of Engineering, Qatar University, Doha 122104, Qatar
3
Department of Civil Engineering, The Hashemite University, P.O. Box 330127, Zarqa 13133, Jordan
*
Author to whom correspondence should be addressed.
Water 2021, 13(11), 1581; https://doi.org/10.3390/w13111581
Submission received: 23 April 2021
/
Revised: 29 May 2021
/
Accepted: 30 May 2021
/
Published: 3 June 2021
(This article belongs to the Special Issue Applied Groundwater Modelling for Water Resources Management and Protection)
Abstract
:Due to limited rainfall and precipitations, different developing countries depend on groundwater (G.W.) resources to challenge water scarcity. This practice of continuous and excessive G.W. pumping has led to severe water shortages and deteriorated water quality in different countries. Recharging of treated wastewater (TWW) into G.W. provides a critical solution for solving water scarcity, extending the well’s service life, and maintaining the G.W. supply. However, effective injection practice requires accurate tools and methods to determine the best location for groundwater recharge (GWRC). This work offers a new tool based on GIS–Multi-Criteria Analysis to identify the potential site and locations for GWRC with TWW. The developed methodology was applied to one of the most used well-field areas in Jordan (Dhuleil-Halabat). The G.W. flow for the B-B2/A7 formation system in the area of study was simulated using Processing Modflow (version 8.0). The analysis combined six thematic maps produced following the environmental, technical, and economic criteria to draw conclusions and recommendations. Both steady and transient conditions were used to predict the future changes that might occur under different stresses and after continuous GWR. The study evaluated three possible scenarios of artificial GWRC to evaluate the process efficiency and determine the effect on the water table level. The results revealed that only 0.05% (0.14 Km2) of the total surface area of 450 Km2 is suitable for GWRC. A GWRC with TWW at a rate of 3.65 Mm3/year (MCMY) would provide a good G.W. table recovery to 39.68 m in the year 2025, maintain a steady-state water table ≥ of 50.77 m for up to six years, and secure water supply for future generations. The proposed methodology can be used as a useful tool that can be applied to regulate the GWRC practice worldwide.
1. Introduction
Groundwater (G.W.) has been used as the main water supply in arid and semi-arid areas of highly populated countries. However, the continuous pumping at a rate greater than the natural recharge significantly reduced the water table and decreased the availability of water. Continuous monitoring showed that the low annual precipitation slows down the natural recharge of these aquifers. Artificial groundwater recharge (GWRC) was highlighted as unique and sustainable G.W. management to preserve the water table and extend the service life of the aquifers [1,2]. In this context, the managed aquifer recharge (MAR) is a planned water recharge for subsequent recovery and maintaining G.W. supplies [3,4,5,6,7]. Several techniques were used in MAR, including injection wells, aquifer storage and recovery (ASR), and infiltration basins. Zhang and Kanyerere [7] presented a review of the most current MAR practices. The review evaluates the importance of MAR in maintaining the service life of aquifers. It was highlighted in this review that the concept of MAR might have stemmed over two thousand years. This review also identified the common problems and challenges that render MARs from systematic clogging mechanism and prevention to theoretical seepage and infiltration calculations as well as purification mechanism and the use of big data and artificial intelligence. Bouwer [8] presented a work that focuses on the design of a system for artificial GWRC considering infiltration rates and the unsaturated zone between the land surface and the aquifer to establish adequate permeability and fast treatment. Asano and Cotruvo [9] presented a review that discusses the GWRC recharge and its management with a focus on the health and regulatory aspects of this practice using reclaimed municipal wastewater. The review shows some uncertainties concerning health risk considerations when reclaimed municipal wastewater is used for GWRC, especially when a large portion of the wastewater is recharged into the G.W. In the present work, the term MAR is referred to as artificial GWRC through recharging the basins with TWW.
GWRC only occurs when a sufficient amount of water is available to flow underneath the ground and infiltrate into the saturated zone [8,10,11]. The selection of suitable sites for MAR is dependent upon several factors, including occurrence and movement of G.W., hydrogeological factors of the recharge area (structure, slope, drainage, pattern, landform, land use/land cover), and climate [12,13,14,15]. Thus, it is important to consider these factors while exploring the potential for GWRC.
The selection of the most appropriate locations for GWRC with TWW depends on different criteria (environmental, technical, and economic) as outlined in Table 1. The environmental criteria include the residential areas as well as the water supply resources. In contrast, the technical criteria deal with soil characteristics, aquifer depth, land use, and slope, as well as the soil type and texture. The economic criteria, on the other hand, include the cost of pipes and pumping devices. Spatial analysis has been introduced as a powerful tool for identifying the suitable and ideal areas for the development and application of MAR. The site selection, in general, can be determined by integrating and weighing the geospatial data characterizing the study area according to the aims of the research. A geographic information system–multicriteria decision analysis (GIS-MCDA) has been developed for different settings and scales around the world to support the selection of MAR sites [15,16,17,18,19,20,21,22,23]. The geophysical imaging approach was widely used for assessing, improving, and identifying the highest permeability areas that are appropriate for aquifer artificial recharge in MAR sites [24,25].
Artificial GWRC with TWW is becoming increasingly important as a G.W. management alternative. Various suitability criteria have been presented throughout the research literature [26,27,30,32,33,34,35,36,37,38,39]. For example, high-quality TWW is a steadily and widely available natural resource that can be used in GWRC as a vital alternative to sustain G.W. potential, resource conservation, and management of large volumes of wastewater. During this process, the TWW is infiltrated through the unsaturated zone, where it undergoes a natural purification process and maintains the supply of high-quality G.W. Previous works have highlighted different challenges for GWRC practice, including the effect of recharged volume of TWW as well as water quality parameters on the quality of the produced G.W. [9,40,41,42]. Although different research works have shown that obtaining a direct measurement of the precise amount of the TWW to be recharged is nearly impossible, other research works have suggested the use of indirect methods or the development of sophisticated models/tools that can be used for such objective [21,31].
The G.W. modeling techniques have become appropriate tools to simulate the behavior of G.W. systems and to achieve optimum management and uses. Besides this, these modeling techniques play an important role in assessing the MAR scenarios and screening the potential GWRC locations. Ringleb et al. [5] had collected and evaluated 216 studies published over the past 30 years addressing the importance of G.W. modeling in MAR practical applications.
The aforementioned literature indicated that GWRC could be amongst the possible solution to resolves water scarcity and secure clean, safe, and steady water resources for the coming generation. There is limited research on the use of indirect methods in determining the volume and location of TWW as a potential source for artificial GWRC. As such, there is a knowledge gap on the topics related to (1) the use of artificial GWRC with TWW for the management of G.W. aquifers in water scarcity countries, (2) the development of sophisticated models and tools to determine the required volume of GWRC, and (3) utilizing restricted water resources efficiently and allocating the G.W. resources properly.
Given that, the present study aims to investigate the use of GIS-based multi-criteria analysis to identify potential site locations for GWRC with TWW. This case study was carried in the Dhuleil-Halabat well-field in Jordan (30.5852° N, 36.2384° E), which sits on the eastern highland of the country inside the Amman Zarqa Basin (AZB). Jordan is one of the water-poorest countries in the world due to the limited annual rainfall amount, which has shown high fluctuation from year to year. On the other hand, the high temperatures during the summer have increased the evaporation rate from surface water, creating big stress on the regularly available water. Presently, the available per capita freshwater in Jordan is around 85 L/day, which is significantly low compared with the international standards and other countries. According to the Water Stress Index (WSI)—defined as the value of annual rainfall divided by the total population (m3/capita/year)—a value ≥1800 reflects the norm, while a value ≤1700 reflects existing stress, a value <1000 reflects scarcity, and a value <500 is described absolute scarcity. On the WSI, Jordan has a value of 450, which is classified as absolute scarcity [43]. It is predicted that the difference between water supply and demand will increase in the coming 15 years, which will increase the harsh daily realities and make it difficult to access safe water resources. This will certainly impact human needs, the country’s improvement, and could hinder the development in the industrial, agricultural, and economic sectors. In the mid-1960s, the G.W. from the Dhuleil-Halabat well-field was extracted from six wells and increased to 113 wells in 2019. Previous research work related to Dhuleil-Halabat well-field has focused on the use of G.W. modeling, GWRC, sources of pollution, aquifer characterization, and determining the water quality parameters of the [44,45,46,47,48,49,50,51,52,53]. Due to over-pumping, the aquifer equilibrium was disrupted, and the volume of G.W. decreased, which also led to a decrease in the quality of the G.W. The model developed in this study can be used as a useful tool to control and manage the volumes and location of the TWW that could be used in the artificial GWRC of this area for economic and resource preservation purposes.
2. Material and Methods
2.1. Study Area and Climate Conditions
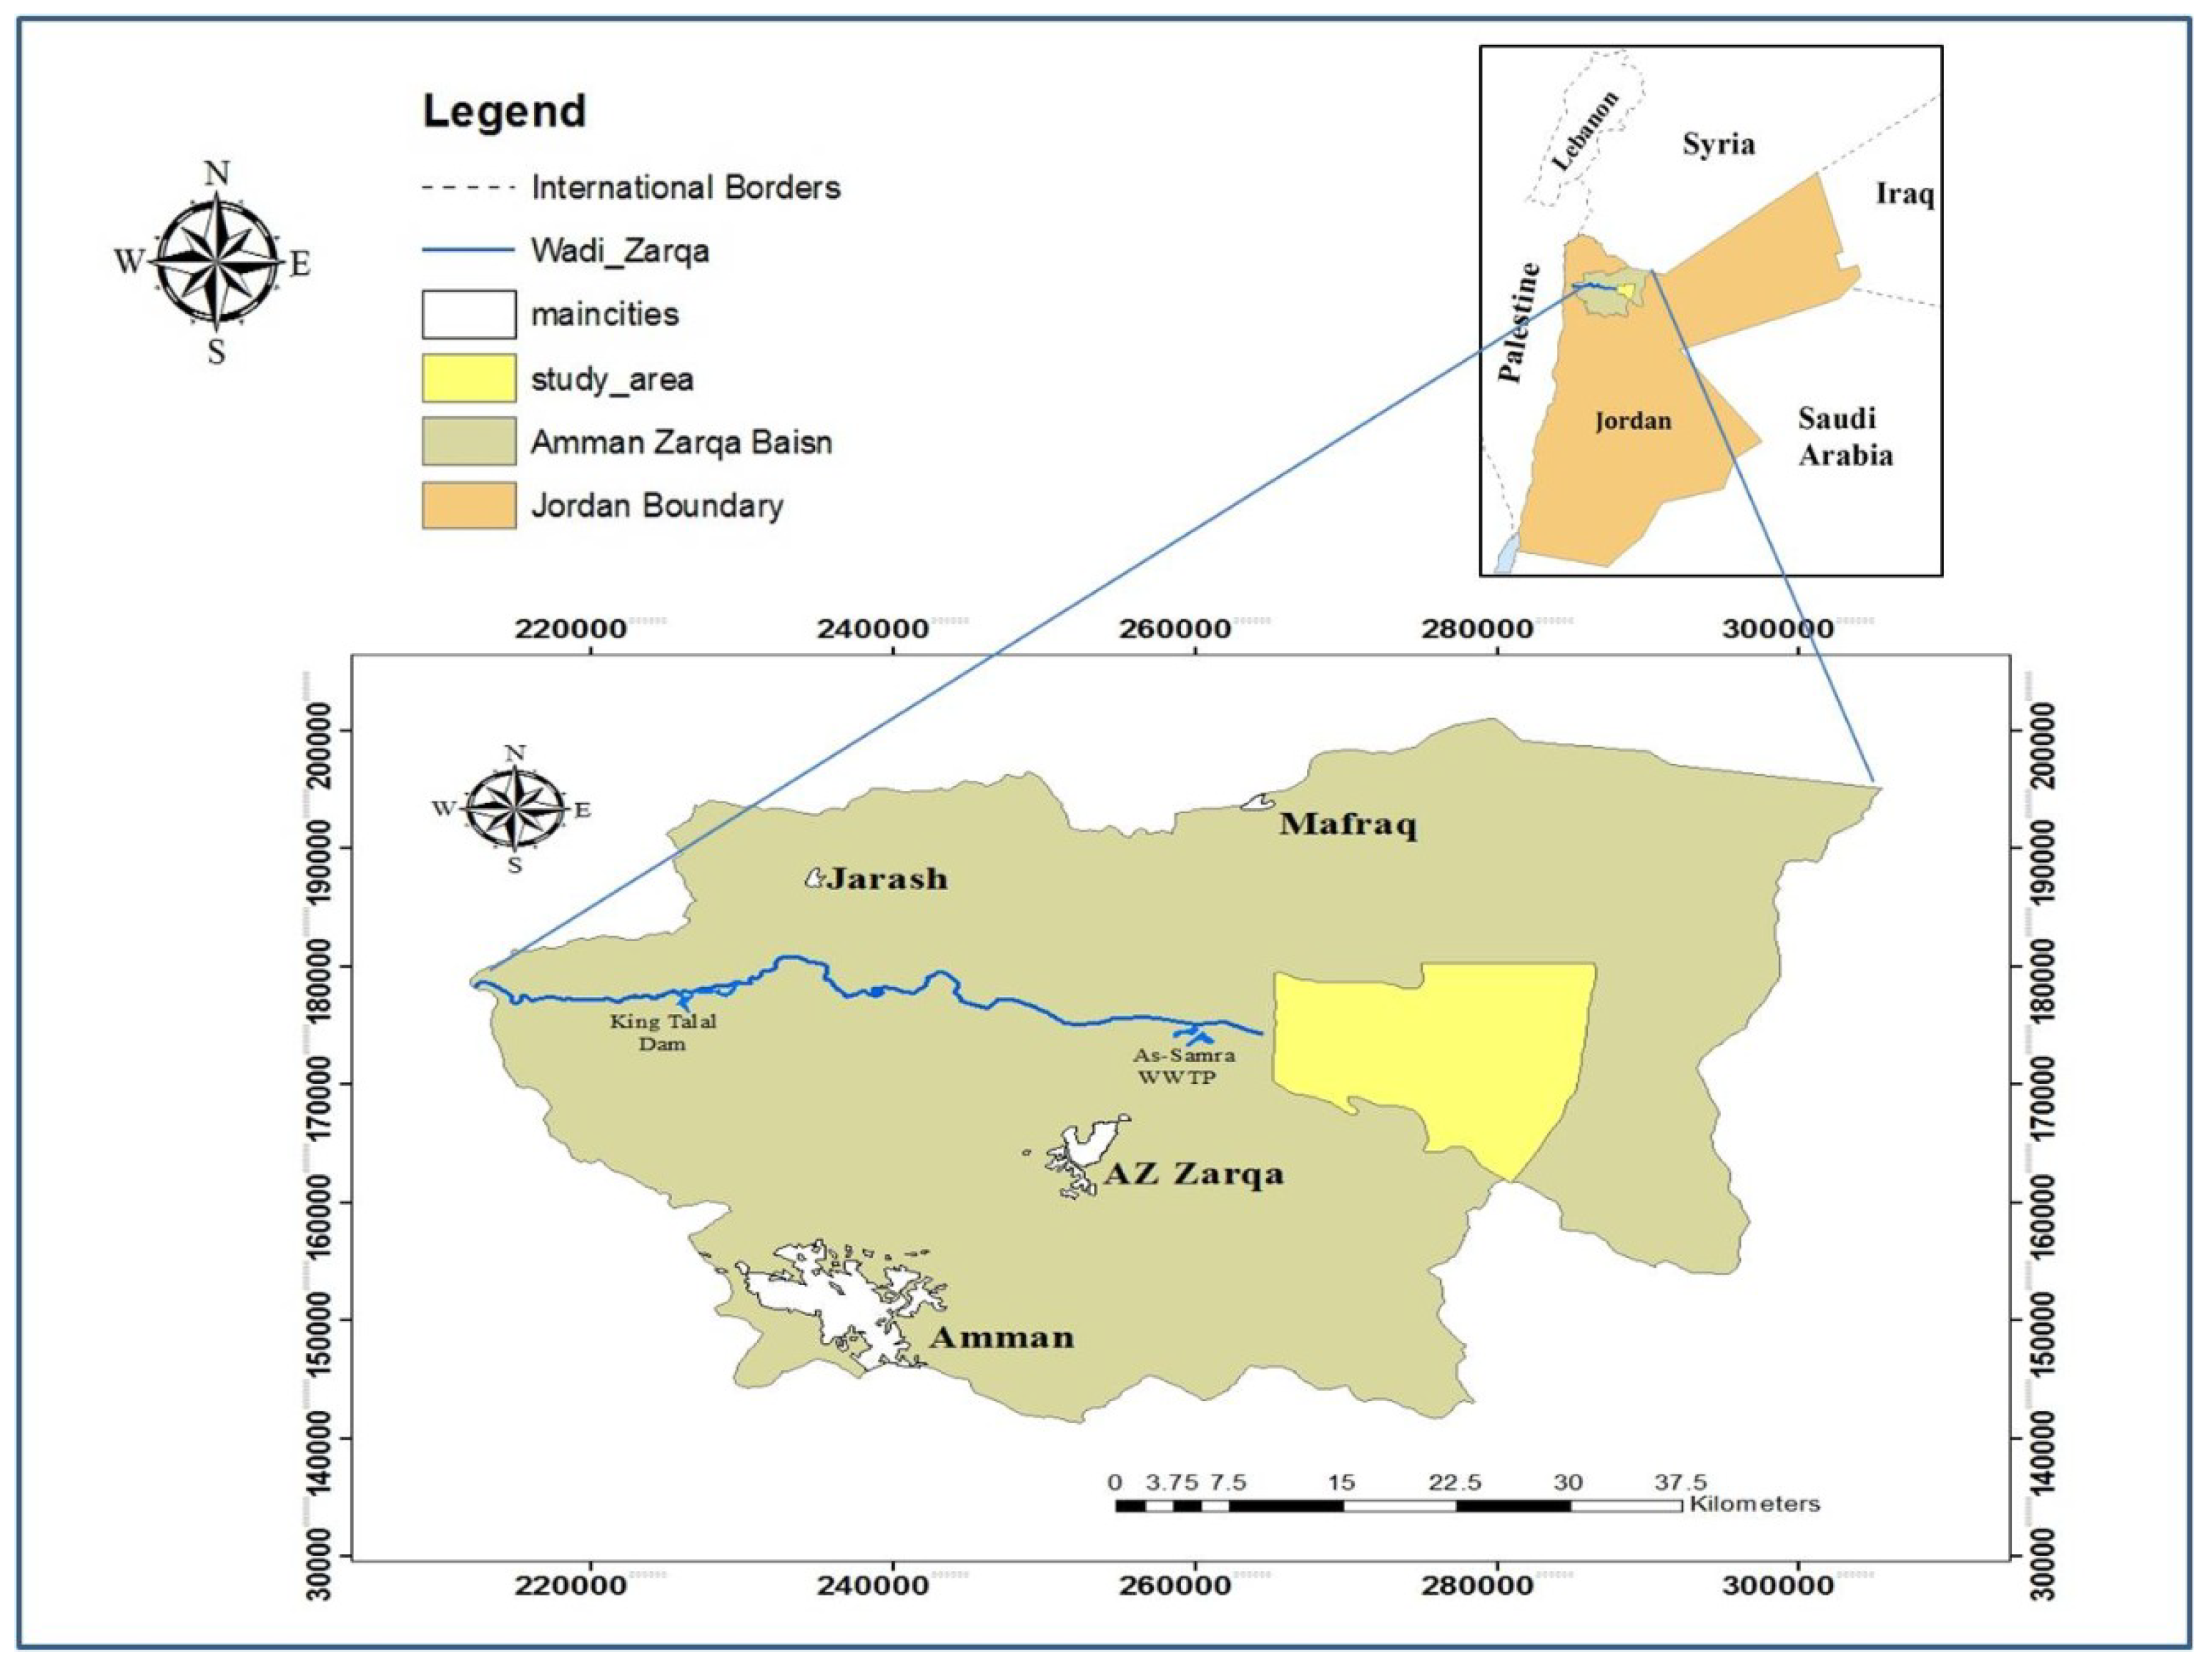
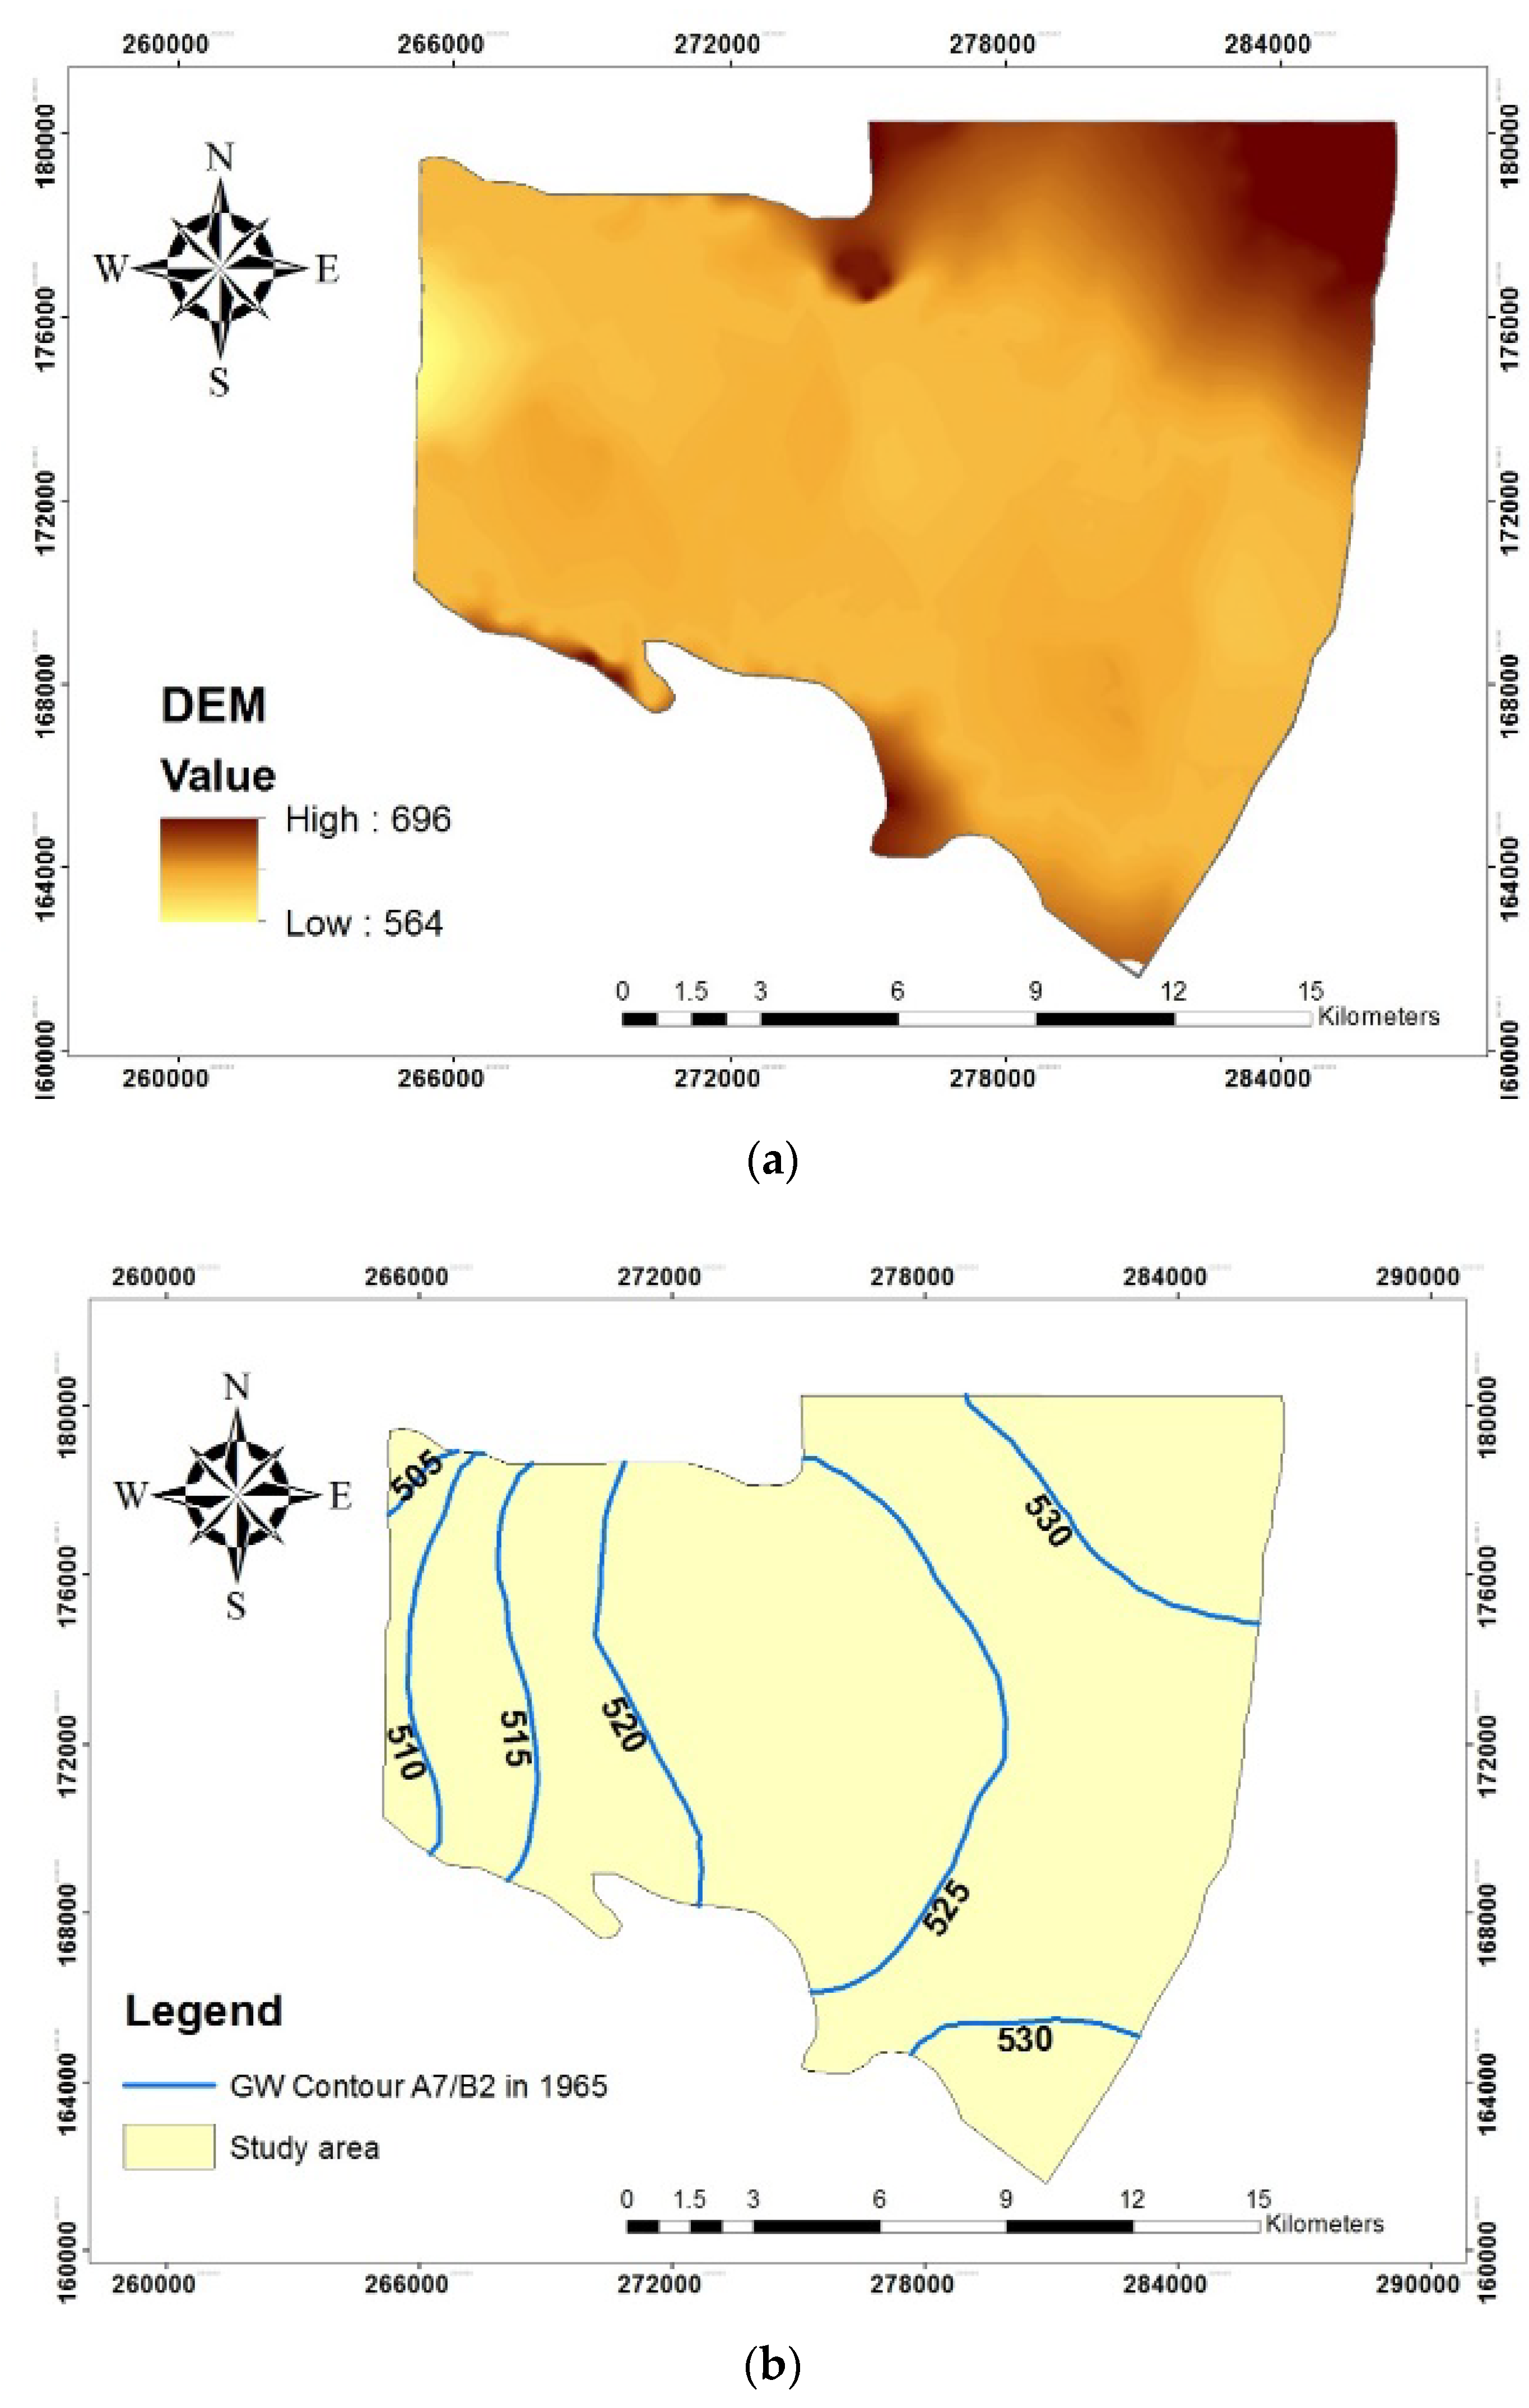
Figure 1 presents the study area, Dhuleil-Halabat well-field (260 to 290 East and 165 to 180 North) according to the Palestine Grid, which is situated to the northeast of the capital Amman and covers an area of approximately 450 km2. This area is mainly located in the AZB and stretches from Khirbet As-Samra in the west to Qaa’ Khanna in the east [54]. The topography of the study area is irregular with elevated ranges between 580 m and 700 m above the mean sea level (AMSL) as indicated in Figure 2a.
The climate of this area is characterized by warm summers and cold winters (i.e., Sahara type), with average precipitation in the range of 120 mm/year in the southeastern part to 160 mm/year in the northwest area. The monthly rainfall distribution has the highest values during the rainy season in December (an average of 29 mm) and January (an average of 33 mm), and a sharp decrease occurs between March and May (4–20 mm). The monthly variation in temperature peak up in July (min 18 °C, max 44 °C, average 28 °C) and decrease in January (min 5 °C, max 23 °C, average 10 °C). The annual surface evaporation rate, based on a class-A-pan test, ranges from 2450 to 3850 mm/year with an average value of 2949 mm/year, varying between. The monthly evaporation rate ranges from 116 mm in January to 395 mm in July. Most of the rainfall occurs during very short intervals and forms flash flooding events. The volume of runoff in this area was estimated using the runoff coefficient for wet, dry, and average conditions to be 2.2 MCMY [53].
2.2. Properties of the Aquifer System
The main aquifers in this study are the Basalt aquifer and the underlying Amman-Wadi Es Sir aquifer (B2/A7). Both aquifers are part of a combined system (B-B2/A7 formation) as they are directly connected. The basalt aquifer is restricted to the eastern area and a channel crossing the study area is the central area in the west–east direction. Typically, basaltic aquifers are characterized by hydraulic anisotropy and discontinuous heterogeneity. The large variations consist in the hydraulic conductivity of basalt aquifer systems. However, the B2/A7 aquifer is the most important in Jordan because of its vast reaches and favorable aquifer properties (high karstification) as described by Margane et al. [55].
The G.W. flow to the area comes from Jabal Al Arab in Syria, which is diverted to the G.W. divide. This divide was previously recognized within the framework of the G.W. assessment of Northern Jordan [55]. The divide was explained as a local recharge mound. In 1965, the G.W. gradient in the area was likely 0.0015. An inflow component comes from the East Amman area, which reaches the study area south of the Halabat well-field. The G.W. flow in the area of study in 1965 is presented in Figure 2b. The current G.W. gradient in this area is 0.004. In 1965 the G.W. flow came from the south/southeast and had a gradient of 0.002. In the western portion of the study area, the current G.W. gradient is shallow, whereas, in 1965, the G.W. was flowing westward with a gradient of 0.0024. The previous observations show that, due to the heavy exploitation, the Dhuleil-Halabat G.W. gradients have vastly changed over the past four decades.
The basalt aquifer overlies the B2/A7 aquifer in the Wadi Dhuleil area where it is hydraulically connected to it. The thickness of the basalt aquifer is in the range of a few meters up to more than 200 m. Until roughly 40 years ago, the basalt flows reached the Wadi Zarqa where the Sukhneh springs discharged water from the basalt aquifer. The transmissivity of the basalt aquifer was determined by several wells [53]. The transmissivity ranges between 10 and 100 m2/d, while the hydraulic conductivity is between 0.2 and 31.1 m/d.
The B2/A7 aquifer extends over much of Jordan and has a high permeability, large storage capacity, and receives GWRC from precipitation. The thickness of the B2/A7 formations can reach up to more than 300 m in the Dhuleil-Halabat region. Numerous exploratory wells were drilled in the Dhuleil-Halabat area and were used to determine the hydraulic characteristics of the B2/A7 aquifer [53]. The transmissivity of the B2/A7 aquifer was determined by performing the pumping test for several wells, and the results indicate that the transmissivity ranges between 476 and 3400 m2/d, while the hydraulic conductivity is between 14.7 and 47.6 m/d [53].
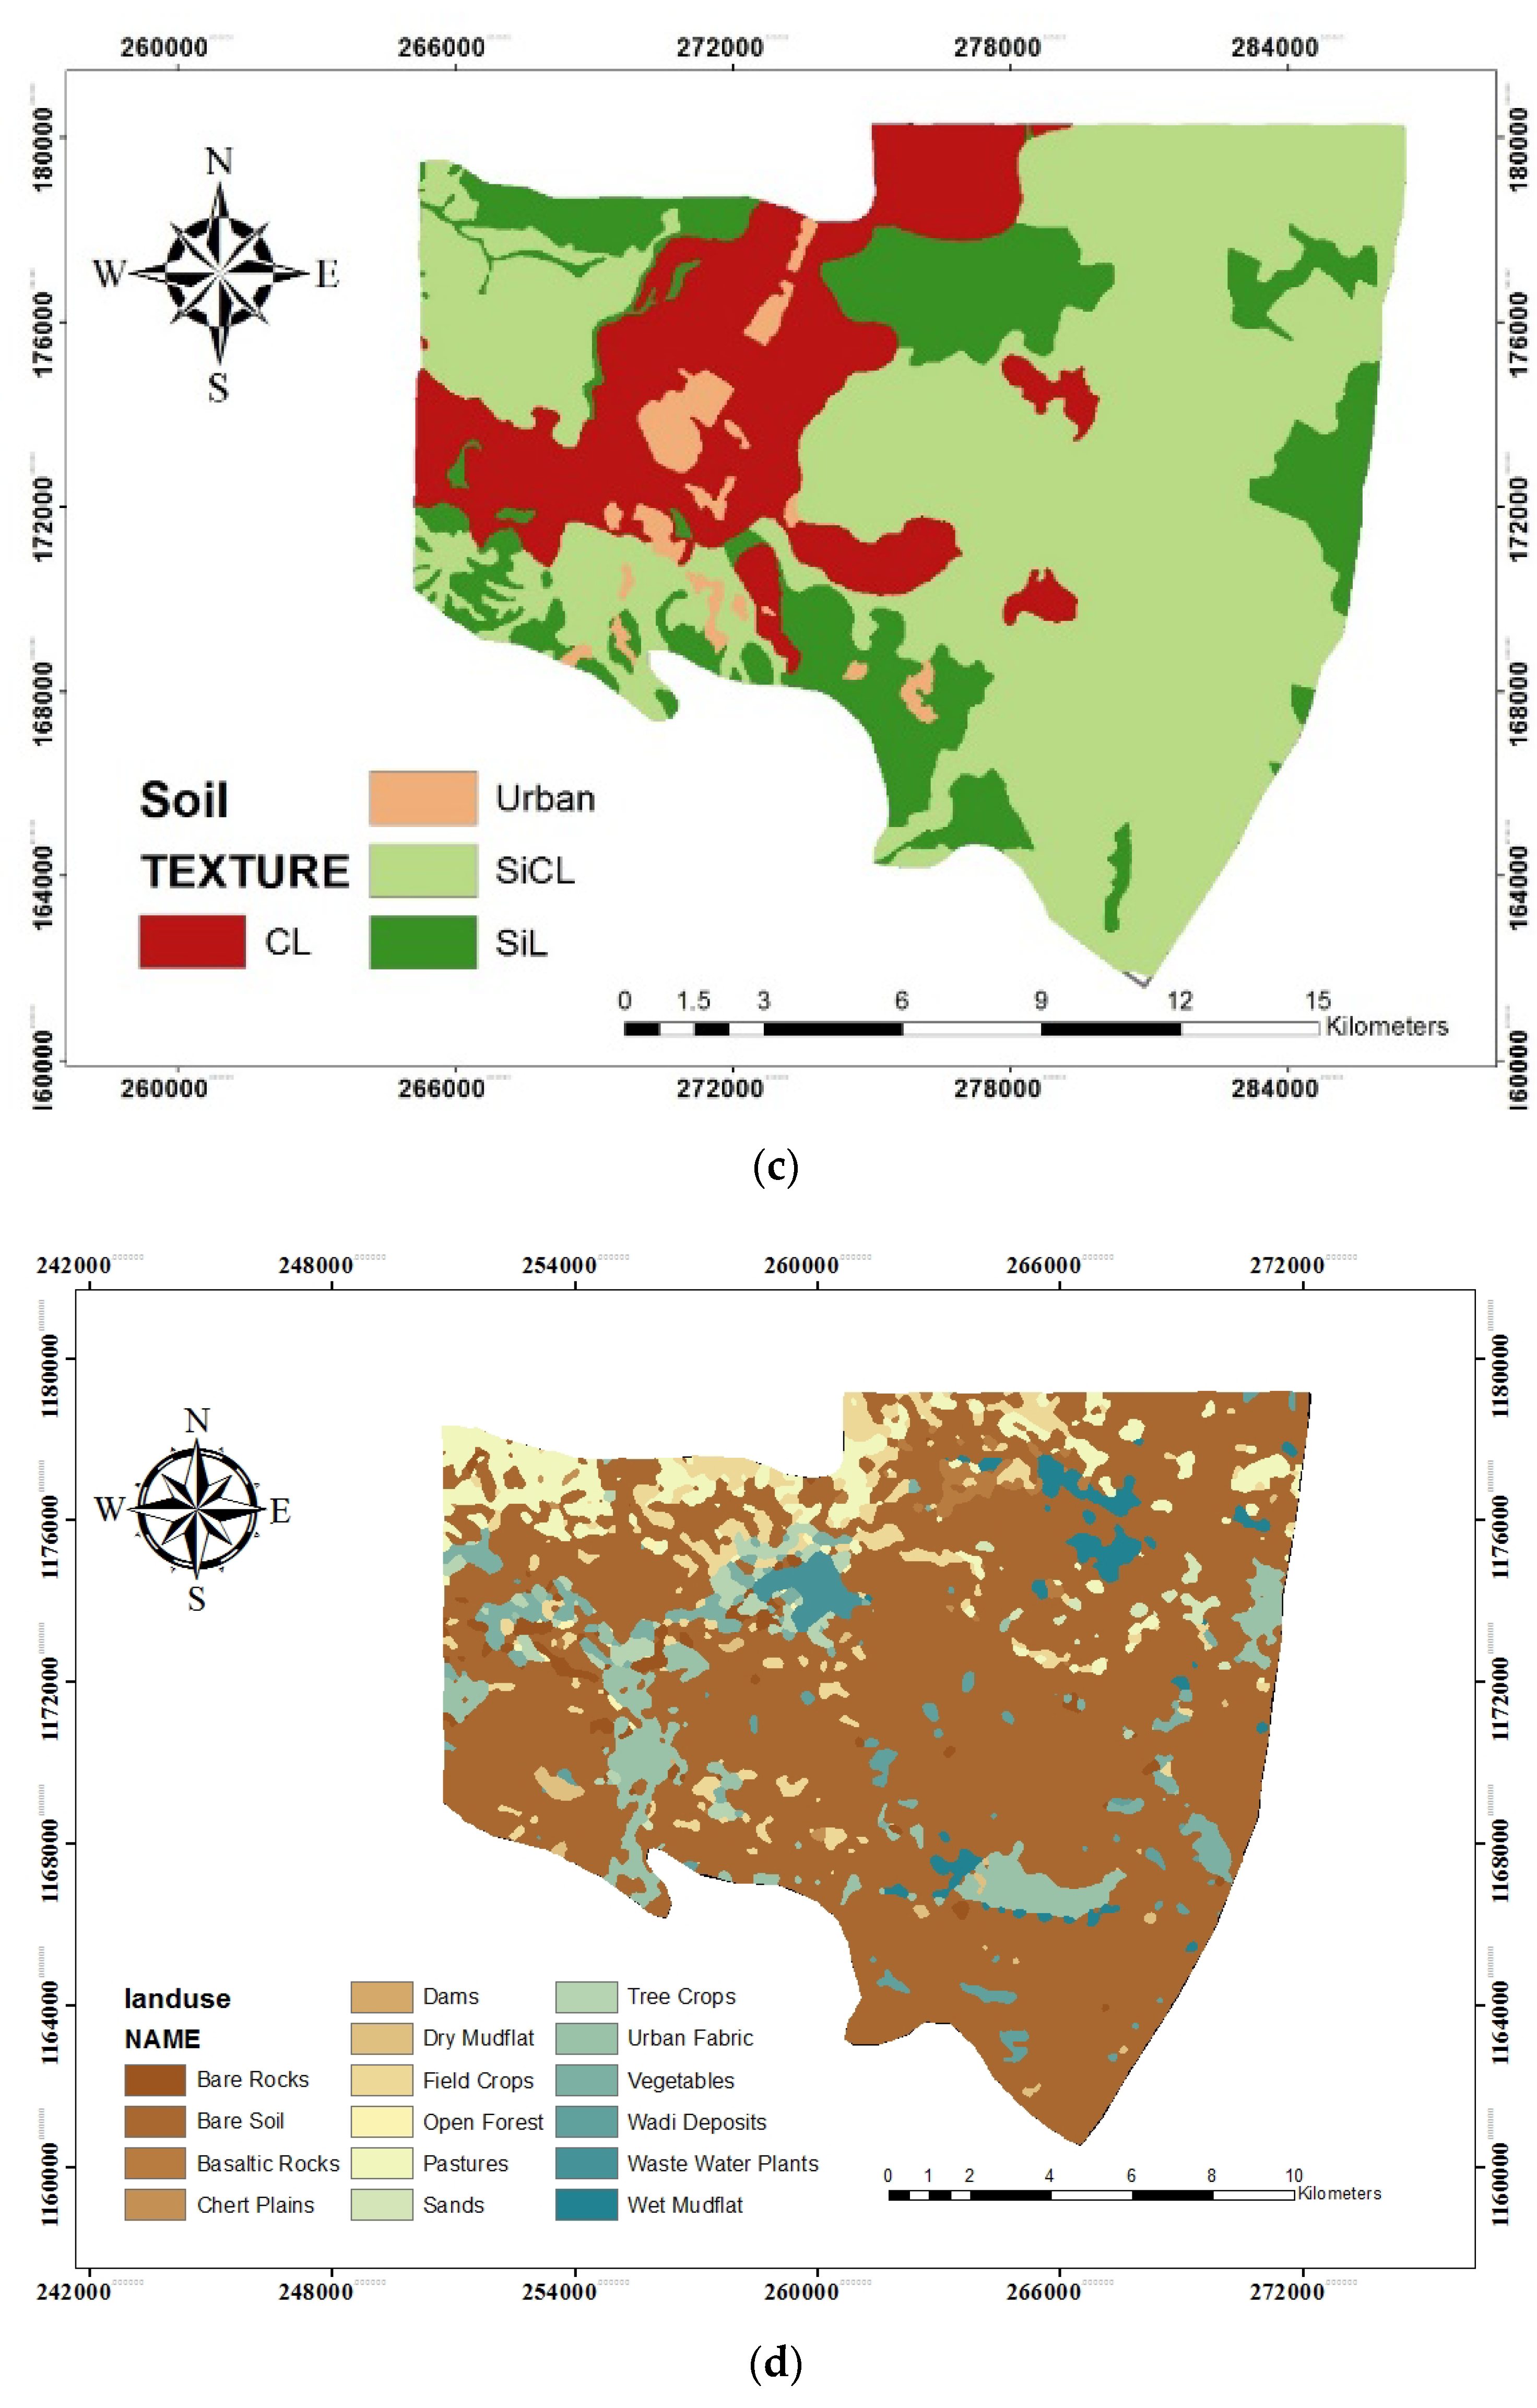
According to the Water Authority, the amount of G.W. extraction from this well-field was around 4.5 MCM in 1965 and reached up to 27.5 MCM in 1994 [53]. From 1994 to 2007, no further wells were put into operation, and the extraction decreased to 15.5 MCM yearly. Thereafter, the extraction remained constant until 2019. The reduction of extraction in the subsequent years results from the high decline in water levels and less productivity of the wells. The soil types in the Dhuleil-Halabat area are mostly uniform, which can be divided based on soil texture into four groups: Sand (6.97%), Silty Clay (36.73%), Silty Loam (45.15%), and Clay (11.15%), as exemplified in Figure 2c. The land use of the study area is composed of 78.07% bare soil, including urbanized areas, 9.33% field crops, tree crops, and vegetables, and 5.17% of the study area is pastureland (Figure 2d).
2.3. Data Preparation
ArcGIS 10.3 software was used to prepare the requisite GIS input files. Data sets from various data sources and providers in Jordan were compiled. The data sets included:
- (1)
- Digital Elevation Model (DEM) of 30 m was downloaded from USGS Earth Explorer (https://earthexplorer.usgs.gov/ (accessed on 25 April 2020)).
- (2)
- Soil data categorized based on the United States Department of Agriculture (USDA) classification system.
- (3)
- The land use and vegetation types of the Dhuleil-Halabat area were obtained and updated from the MWI, which was produced in 1994 and updated in 2019 (Figure 2d).
- (4)
- DEM and ArcGIS 10.3 (Spatial Analyst Extension) were used to obtain the slope information. Figure 2a exhibits the slope map that was produced for this region as well as how the overall slope in the study area is changing from west to east, showing where hills cover a wide area in the west and around the study area.
2.4. Data Analysis
Each criterion thematic map was transformed into raster form with 30 m resolution using spatial analysis (Table 1). Each pixel (30 m × 30 m) in the selected raster thematic map was assigned a value (0 or 1) according to the suitability criteria. Those coded with 1 are suitable for recharging, and those coded with 0 are unsuitable for recharging. The raster calculator tool in ArcGIS 10.3 was used to perform a Boolean operating analysis between the grid cells for each thematic map to produce a final suitability map for the recharging basin.
3. Groundwater Recharge (GWRC) Modeling
3.1. Groundwater Flow Modeling
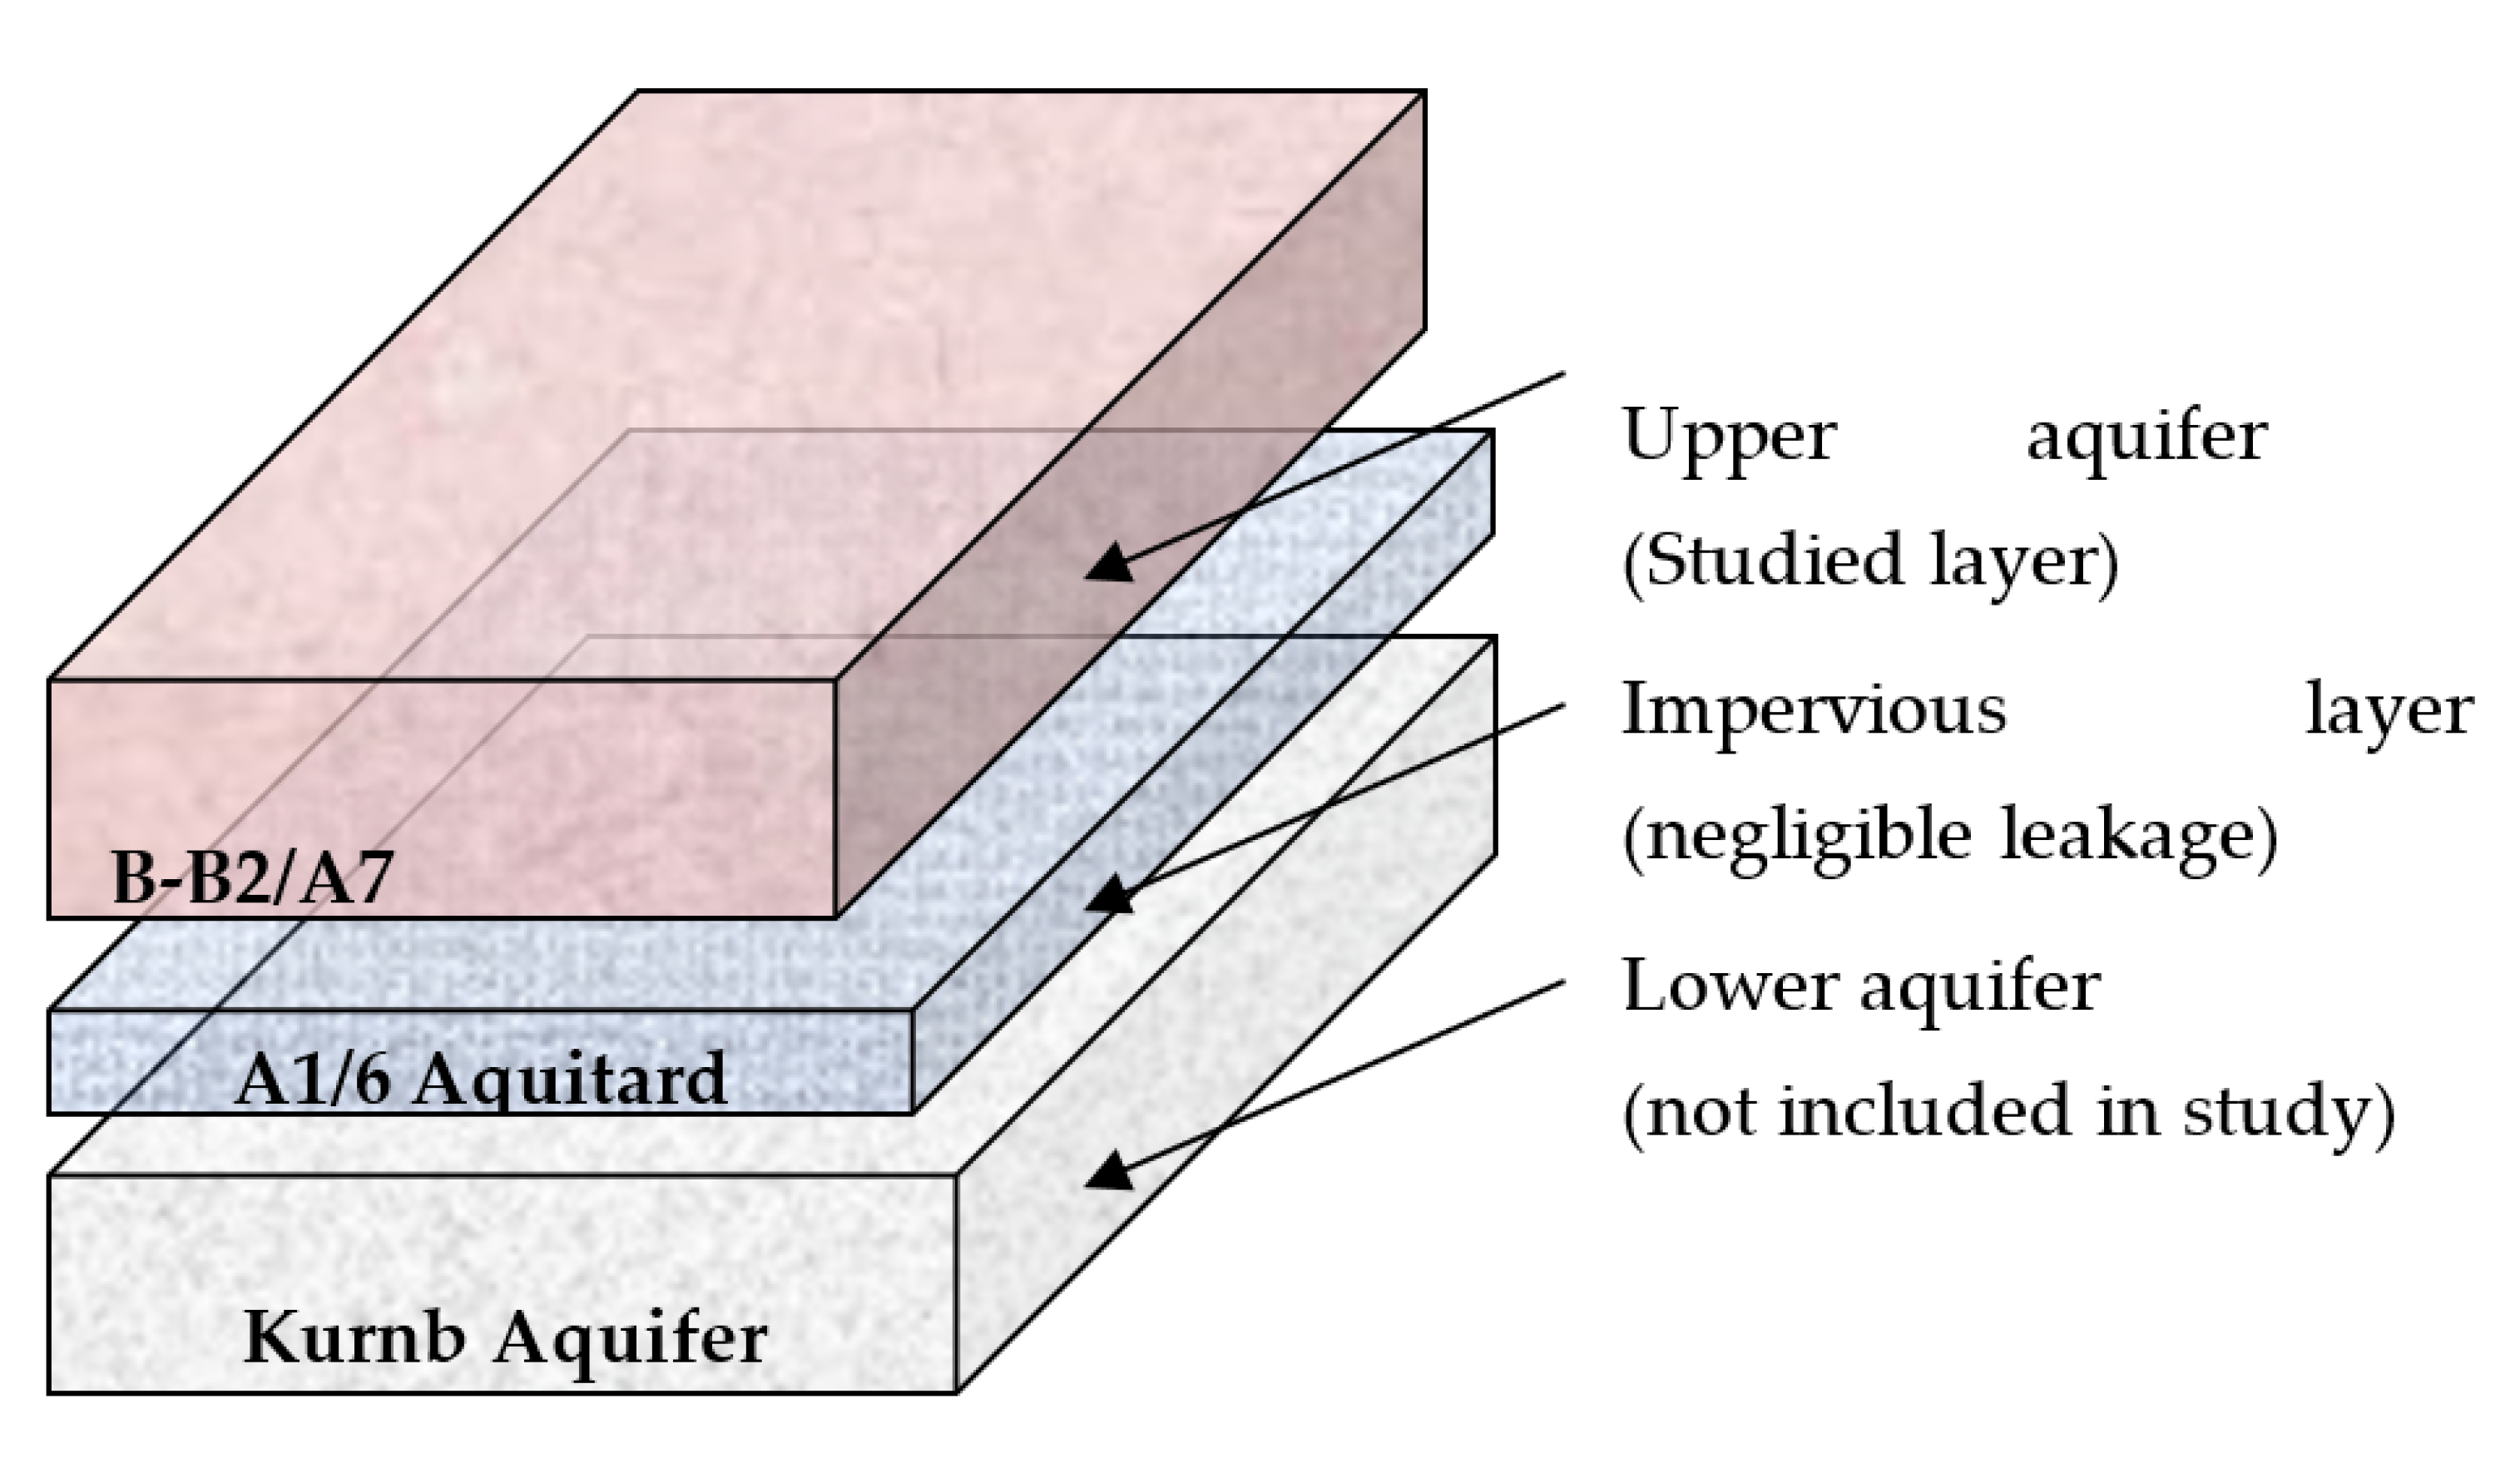
The processing Modflow (PM) version 8.0 was used to investigate the behavior and response of groundwater flow following GWRC with TWW [56]. The model was developed based on simplification or extraction of the complex physical reality and its processes. As the validity of the forecast data depends upon how close the model is to the actual field conditions, high-quality field data was used to validate the used model. The two aquifers in the Dhuleil- Halabat region (B-B2/A7 and Kurnub) were divided by the Lower Ajlun Aquitard (A1/6) layer, as shown in Figure 3. All the withdraws were assigned to B-B2/A7 formation, while the Kurnub aquifer in most parts of Dhuleil-Halabat was set off operation. Under such circumstances, the analysis is only conducted on the B-B2/A7 formation.
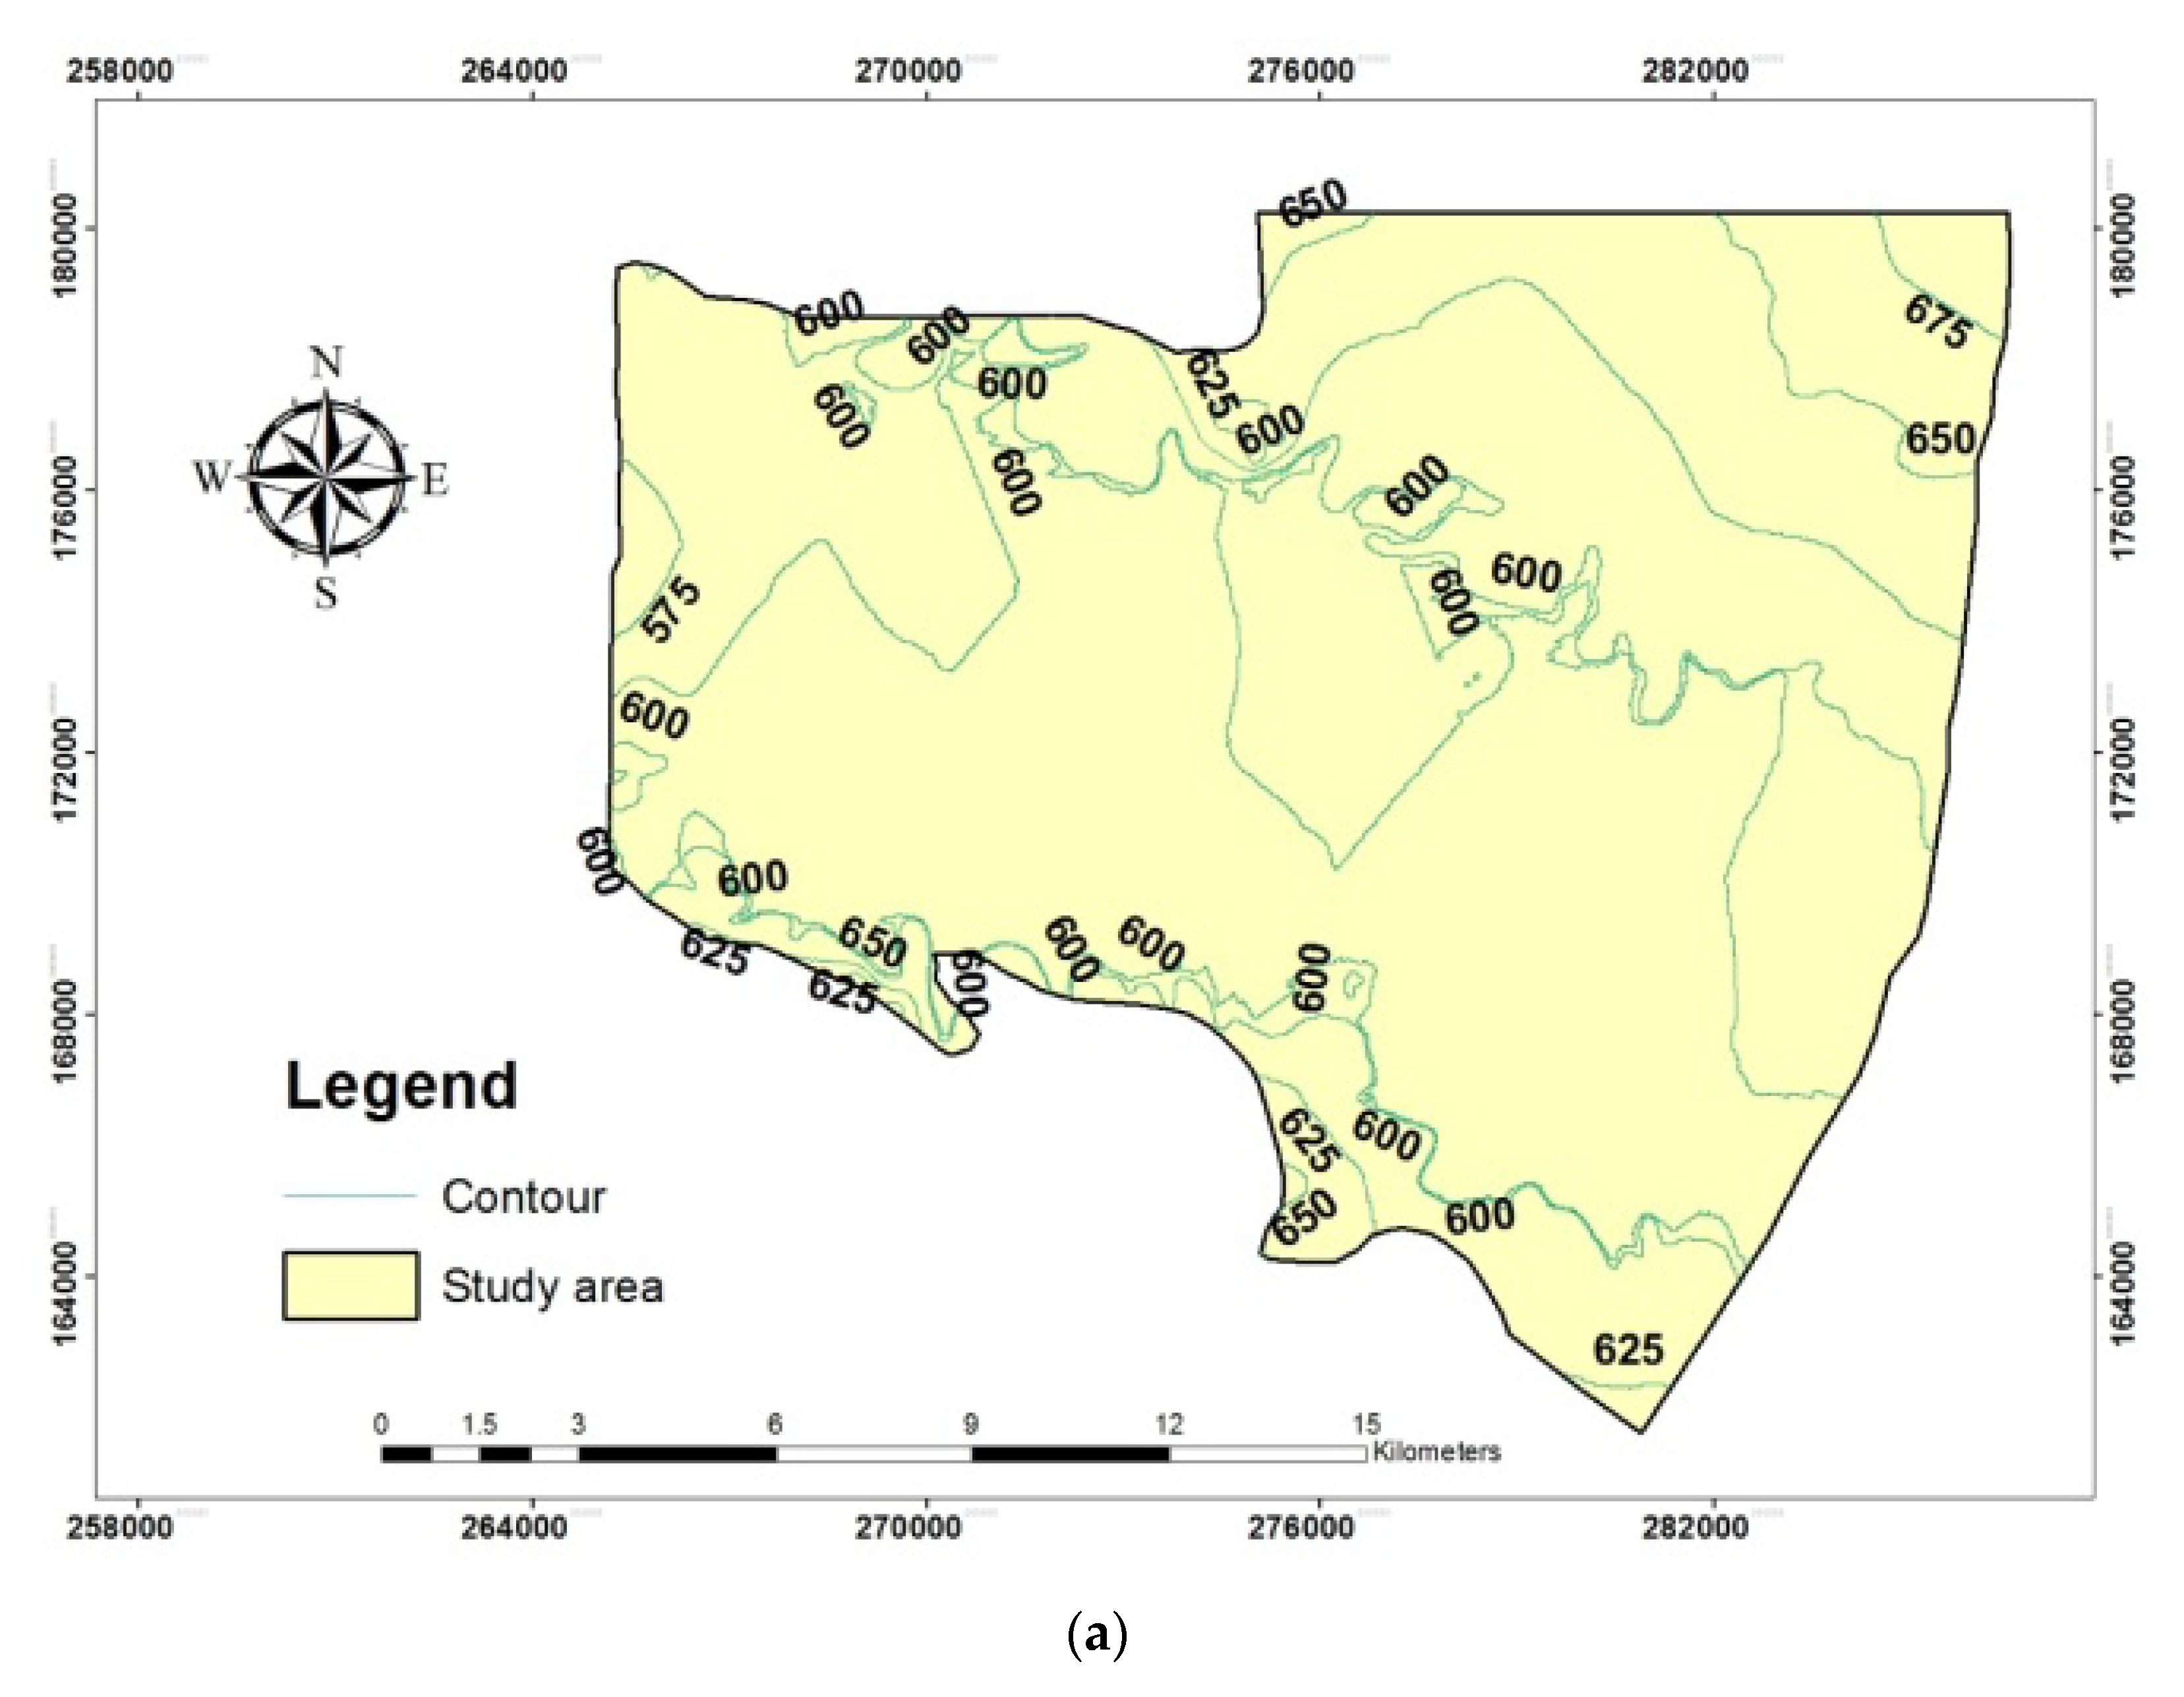
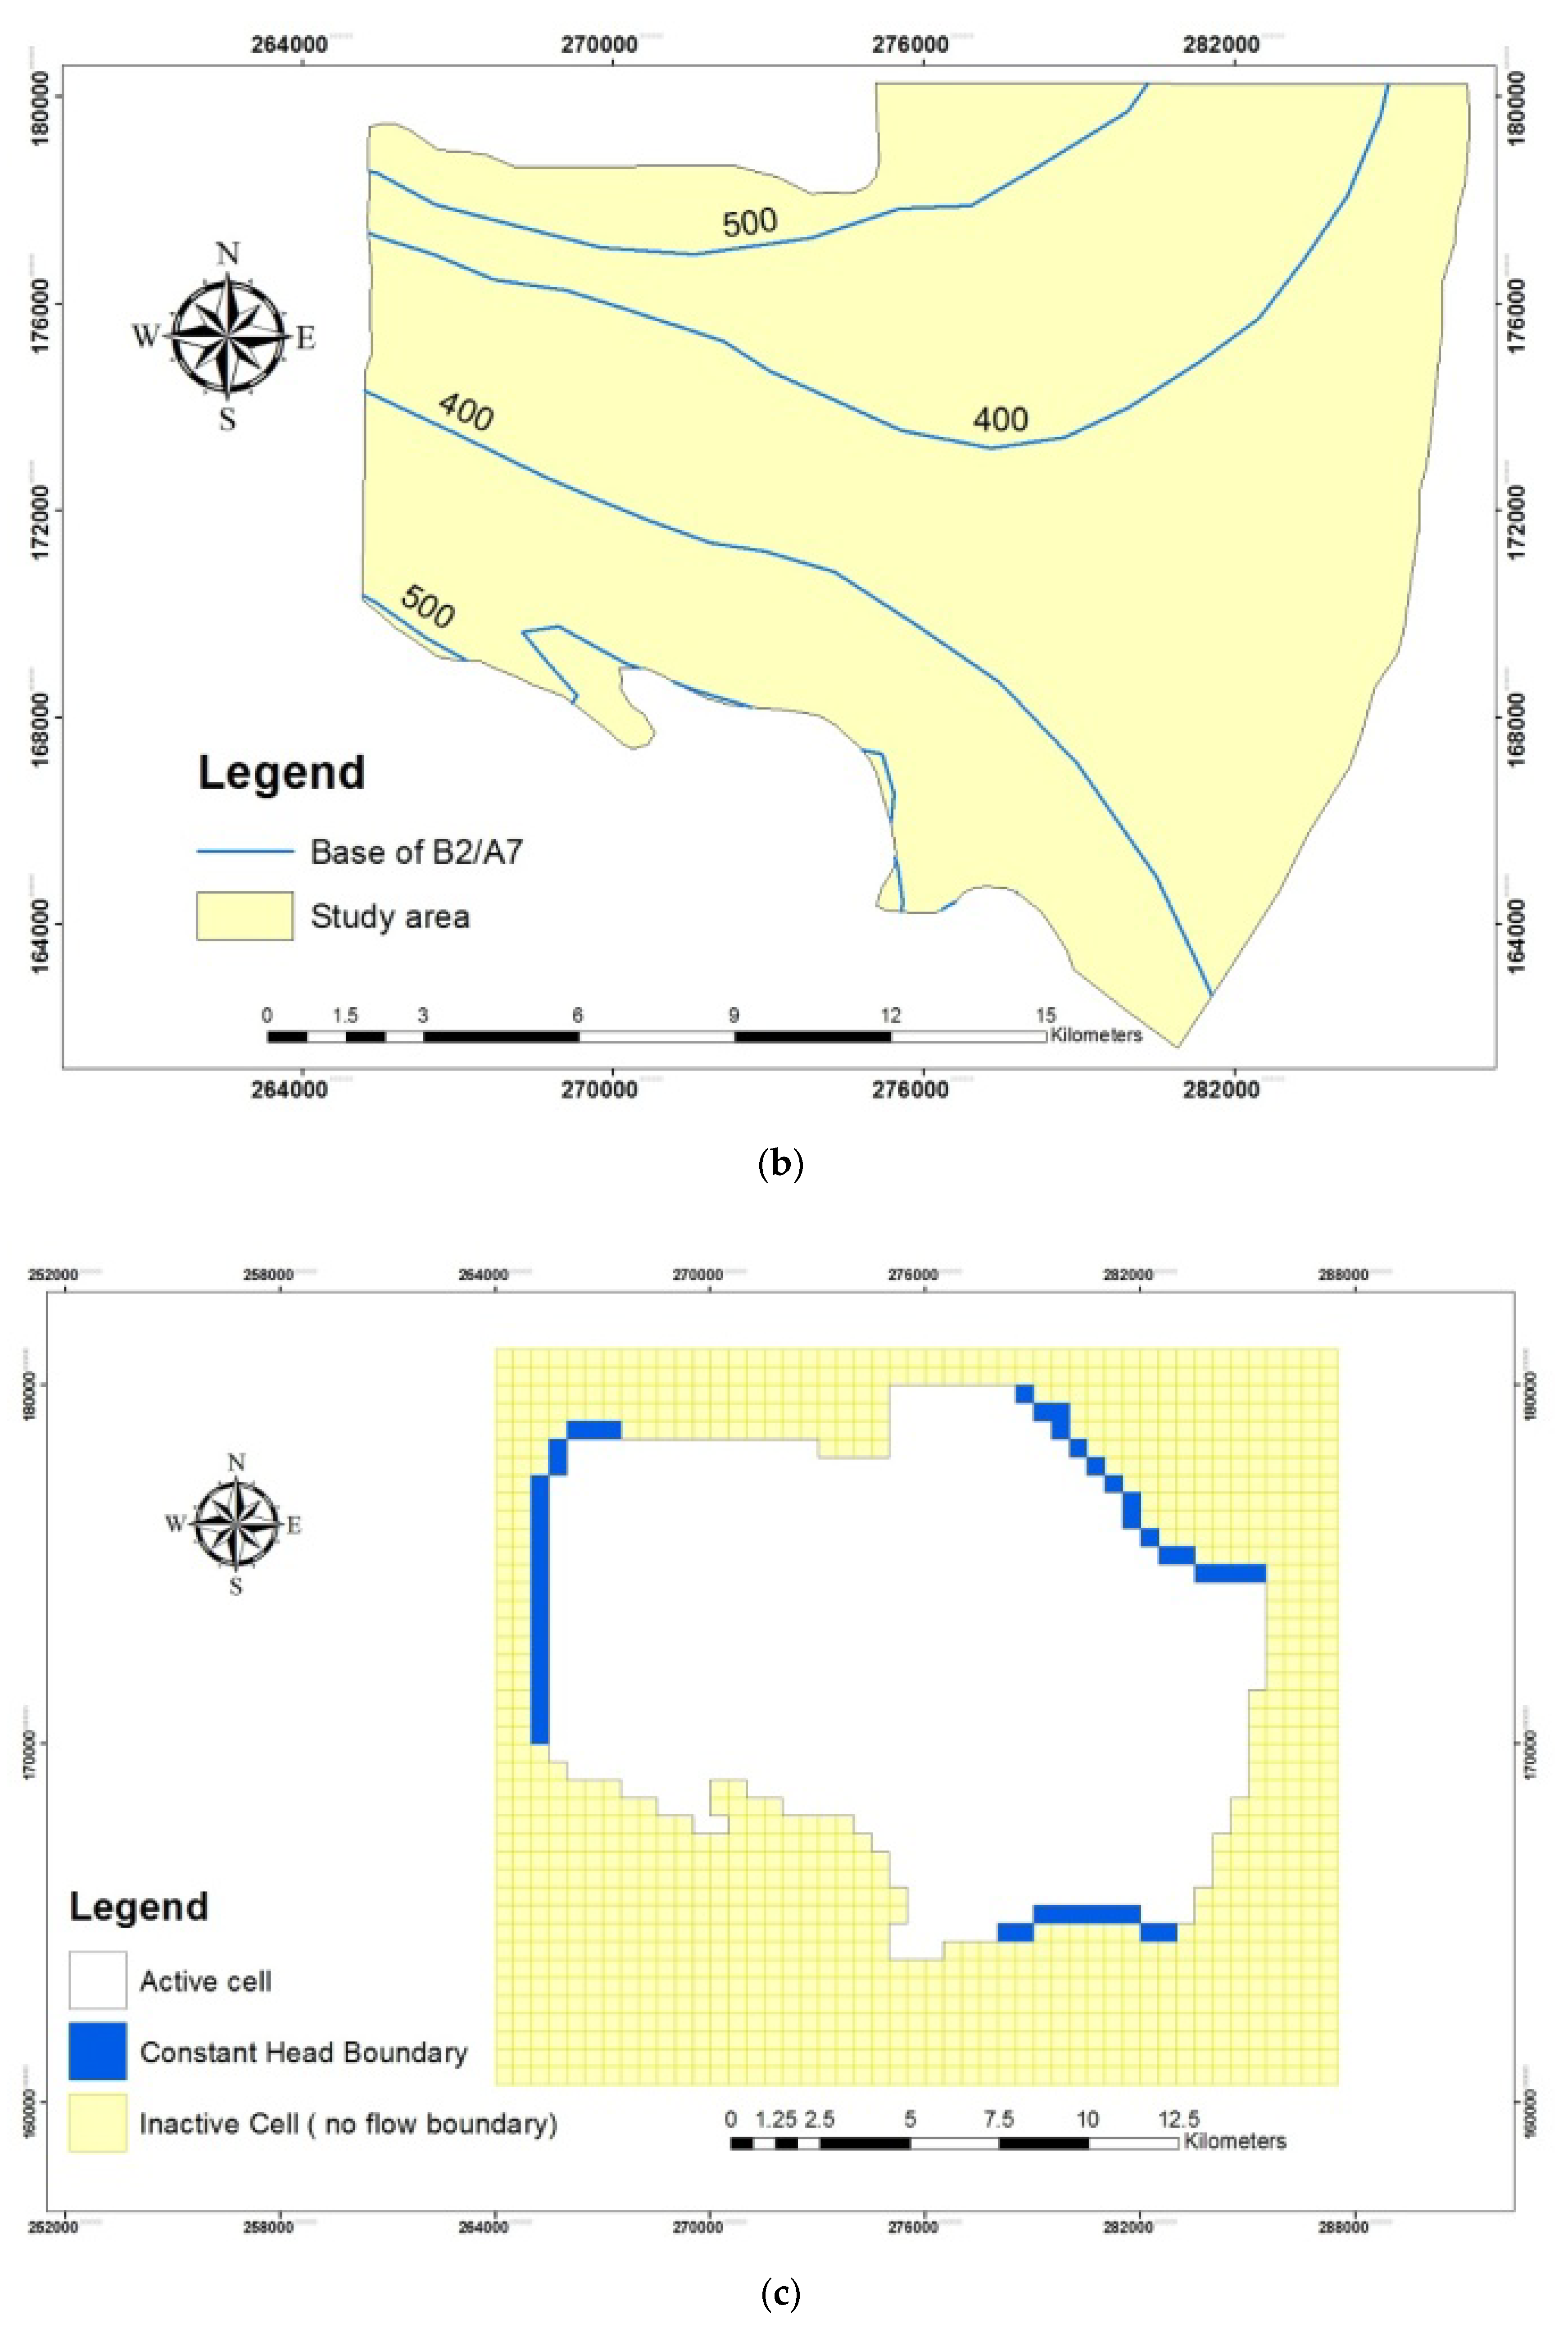
The domain of the model was set between 265,000, 160,000 (in the left lower corner), and 290,000, 180,000 (in the upper right corner) according to the Palestine Grid. The domain was discretized using 40 rows by 50 columns with a grid size of 500 m by 500 m, producing 2000 cells in the model layer. The topographical maps of the studied area and the base contour map of the B-B2/A7 formation are presented in Figure 4a,b. The top and bottom elevations of the model domain were derived from geological maps [57]. These values were compared to well-logs obtained from previously drilled wells throughout the study area. The B-B2/A7 formations have a thickness of approximately 516 m and 200 m, respectively.
Based on the net flow of the G.W. and the structural maps of the B-B2/A7 formation, the constant head boundary was assumed in the north-eastern, south-eastern, and western areas of the model domain with 530 m, 530 m, and 505 m water levels, respectively. Dry spots in the north and south of the study area were considered a no-flow boundary (Figure 4c). The initial condition for the current model was identified based on the water level contour lines in the equilibrium phase before the aquifer disturbance due to pumping. Based on the available data, the water level in 1965 was chosen as the initial condition to calibrate the model in the steady-state condition (Figure 2b).
Based on previous research literature and pumping tests, the horizontal hydraulic conductivity (HHK) values in the B-B2/A7 formation was ranged between 0.043 and 250 m/day [53,58]. The HHK values were modified during the calibration of the model. The isohyetal map for the precipitation distribution in the study area for normal conditions was used for estimating the natural recharge, as shown in Figure 4d [56]. The normal year conditions were assumed and applied for all of the years of the calibration period. The average recharge percent was calculated to be 3.7% of the rainfall based on the standardized precipitation index approach (SPI) [59].
3.2. Groundwater Flow Model Calibration
A. Steady-State Calibration
The model calibration was achieved through the trial and error method. The procedure includes adjusting the hydraulic parameters during the sequential runs and carrying out calculations until the computed water levels match the actual water level contours [60,61,62].
B. Transient Calibration and Validation
In the transient calibration, the simulated head and the HHK values that were obtained from steady-state calibration were used. The transient calibration was achieved by changing the specific yield and storage values. The transient calibration of the area was performed using the existing water-level data from two observation wells (AL1043 and AL2698) for the period 1989–2017. The available data for the period 1988–2008 was used for the model calibration, while the available data for the period 2009–2019 was used for the model validation.
C. Model Prediction
The transient model was used to perform the predictive simulations and the sustainability of the G.W. system. After the transient calibration, three different future prediction scenarios were developed up to the year 2035. The scenarios considered the water level change in the aquifer system as follows:
- (1)
- A calibrated model works up to the year 2035 without any artificial GWRC while maintaining the current extraction rates constant for the years 2025, 2030, and 2035.
- (2)
- A calibrated model works up to 2035 with an artificial GWRC at a rate of 1.825 mm3/year) and the current extraction rates are constantly up to 2035.
- (3)
- A calibrated model works up to 2035 with an artificial GWRC at a rate of 3.65 mm3/year) and the current extraction rates are constantly up to 2035.
4. Results and Discussion
4.1. WWTP Characterization
As-Samra wastewater treatment plant (WWTP), which opened in 2005 with activated sludge technology, is the largest treatment processed in Jordan, serving 60% of the Jordanian population [62]. The design capacity of this process is 360,000 m3/day [62]. Table 2 presents the effluent water quality parameters from As-Samra WWTP. It can be seen that most of the water quality parameters comply with Jordanian standards for GWRC except for the Chemical Oxygen Demand (COD). With such good effluents characteristics, clogging in the infiltration basin is anticipated. However, this form of clogging is relatively simple to remedy with routine basin maintenance [63,64,65]. The excess COD can be effectively and reliably removed from treated water during the long-term operation of MAR systems (Infiltration Basin). Different researchers have proven that more than 50% of COD could be removed at the top 30 cm of the soil layers [65,66,67,68].
4.2. GIS Analysis
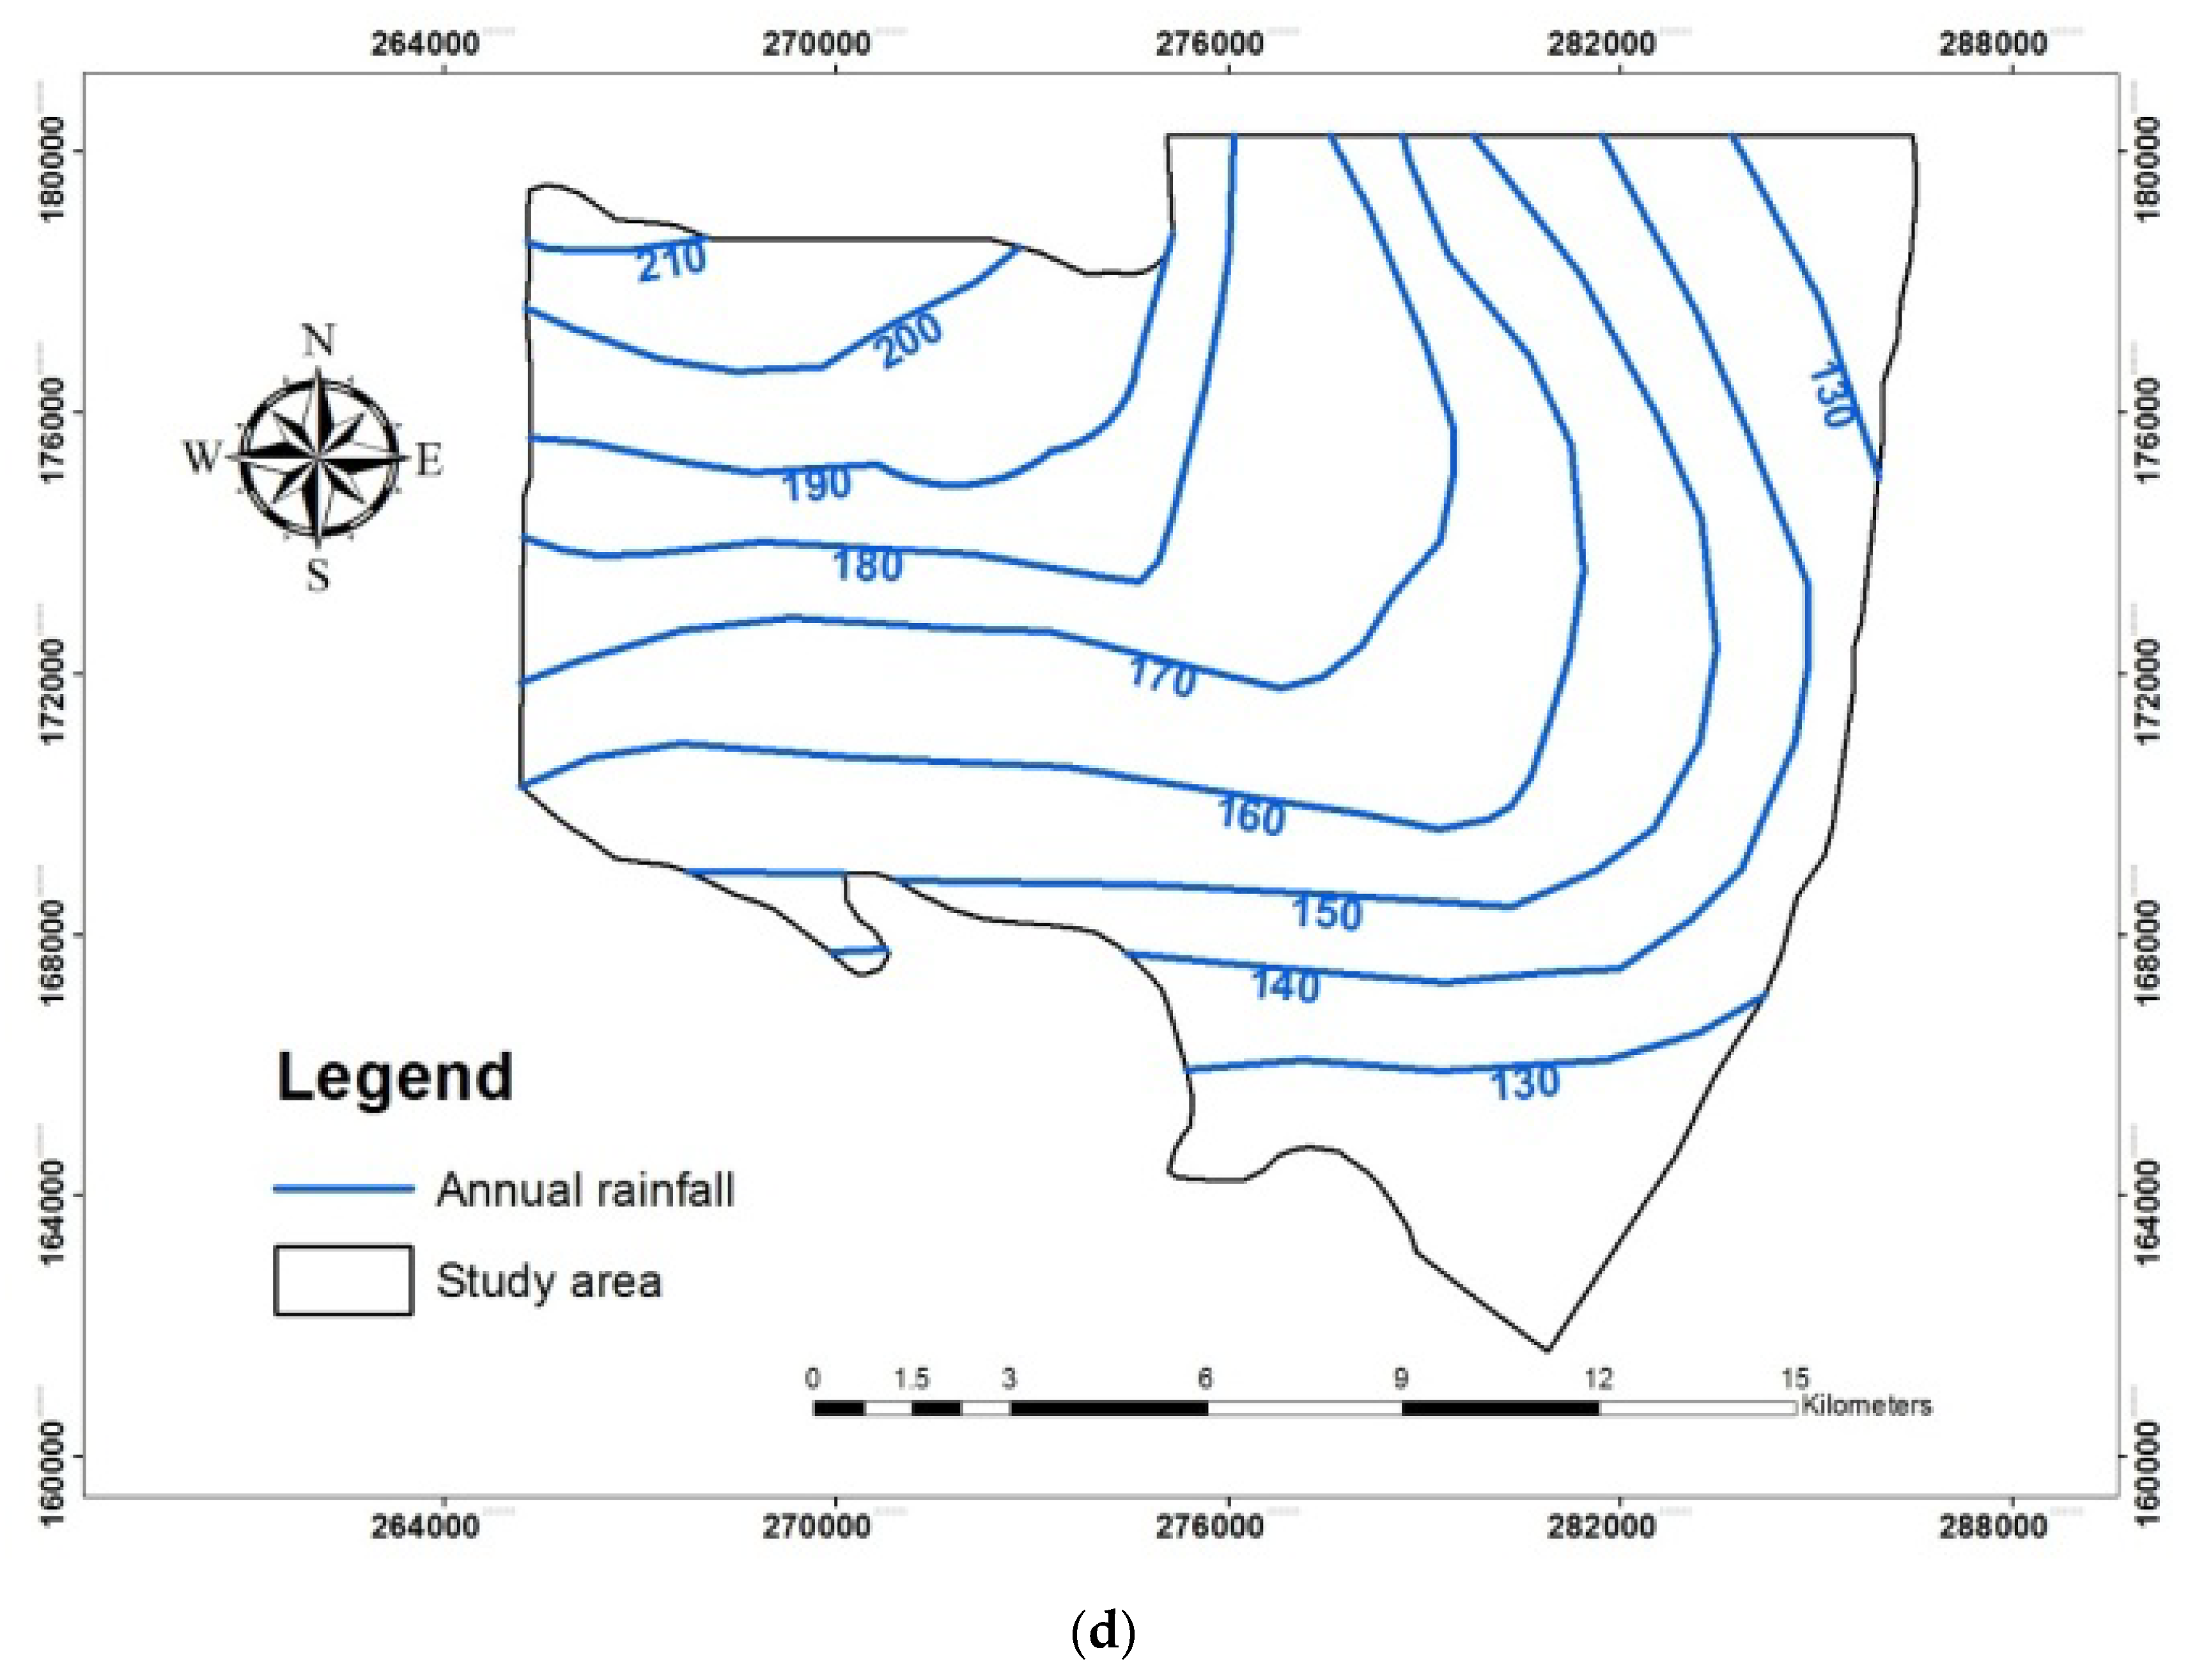
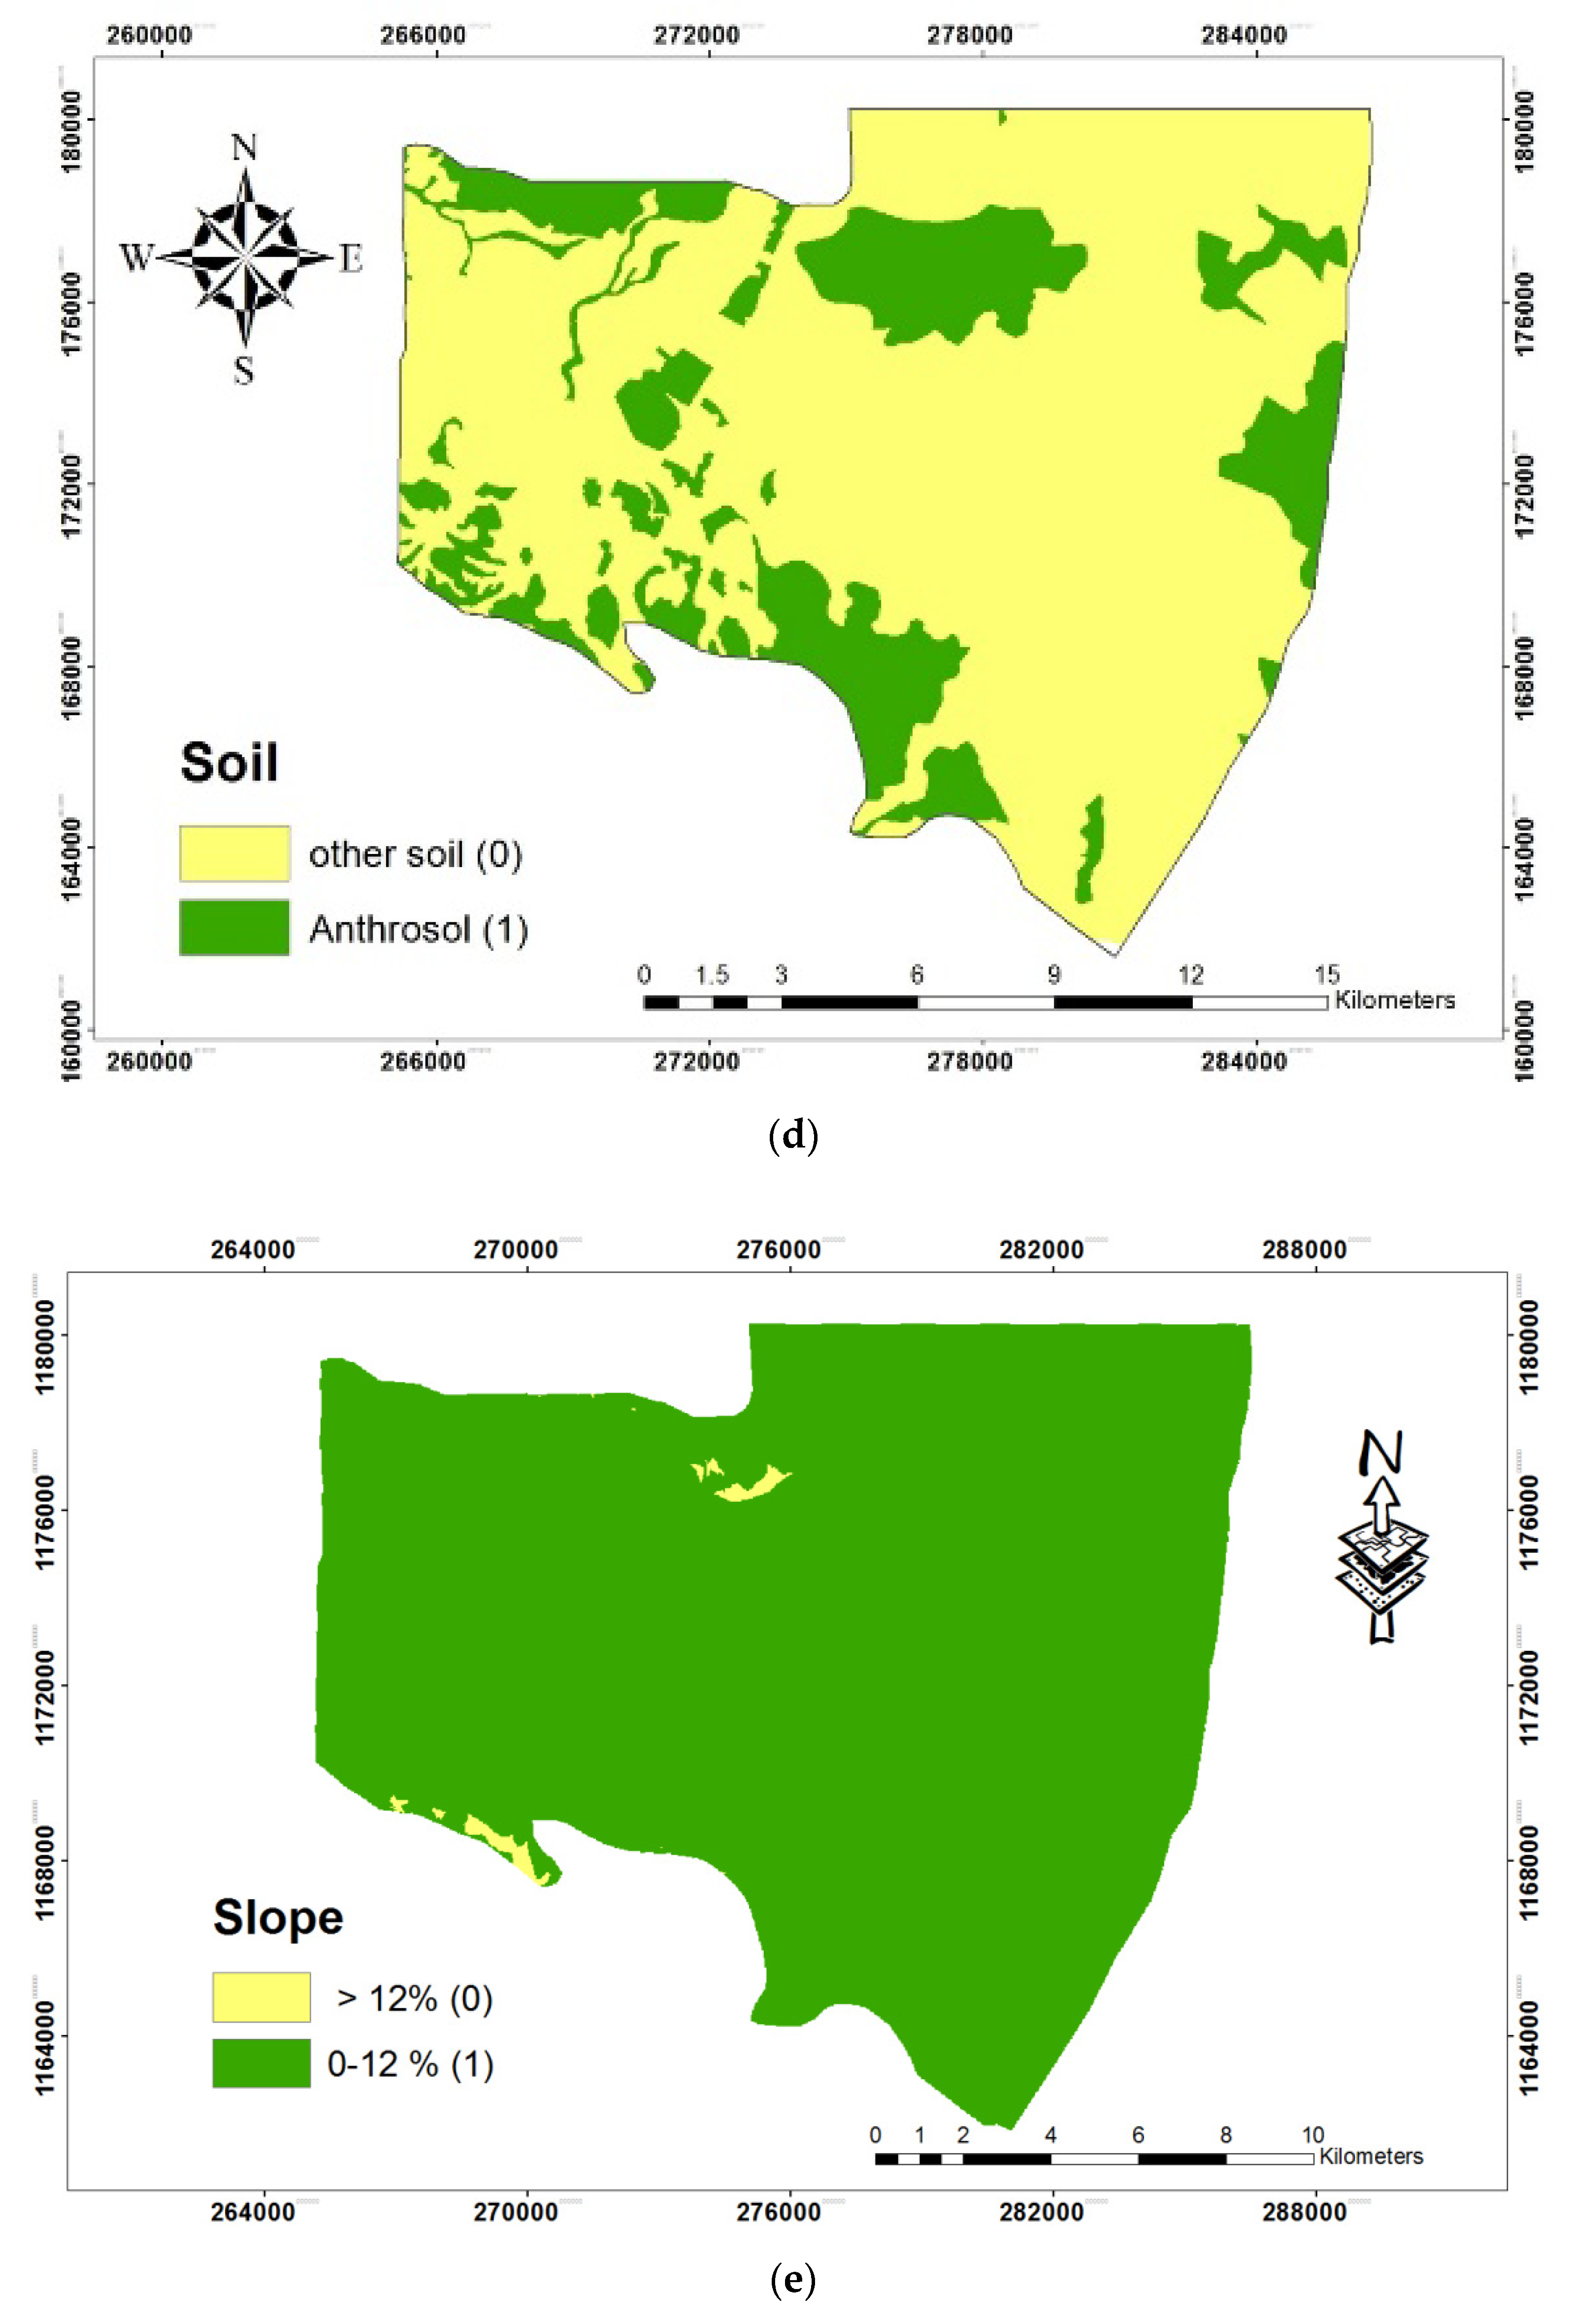
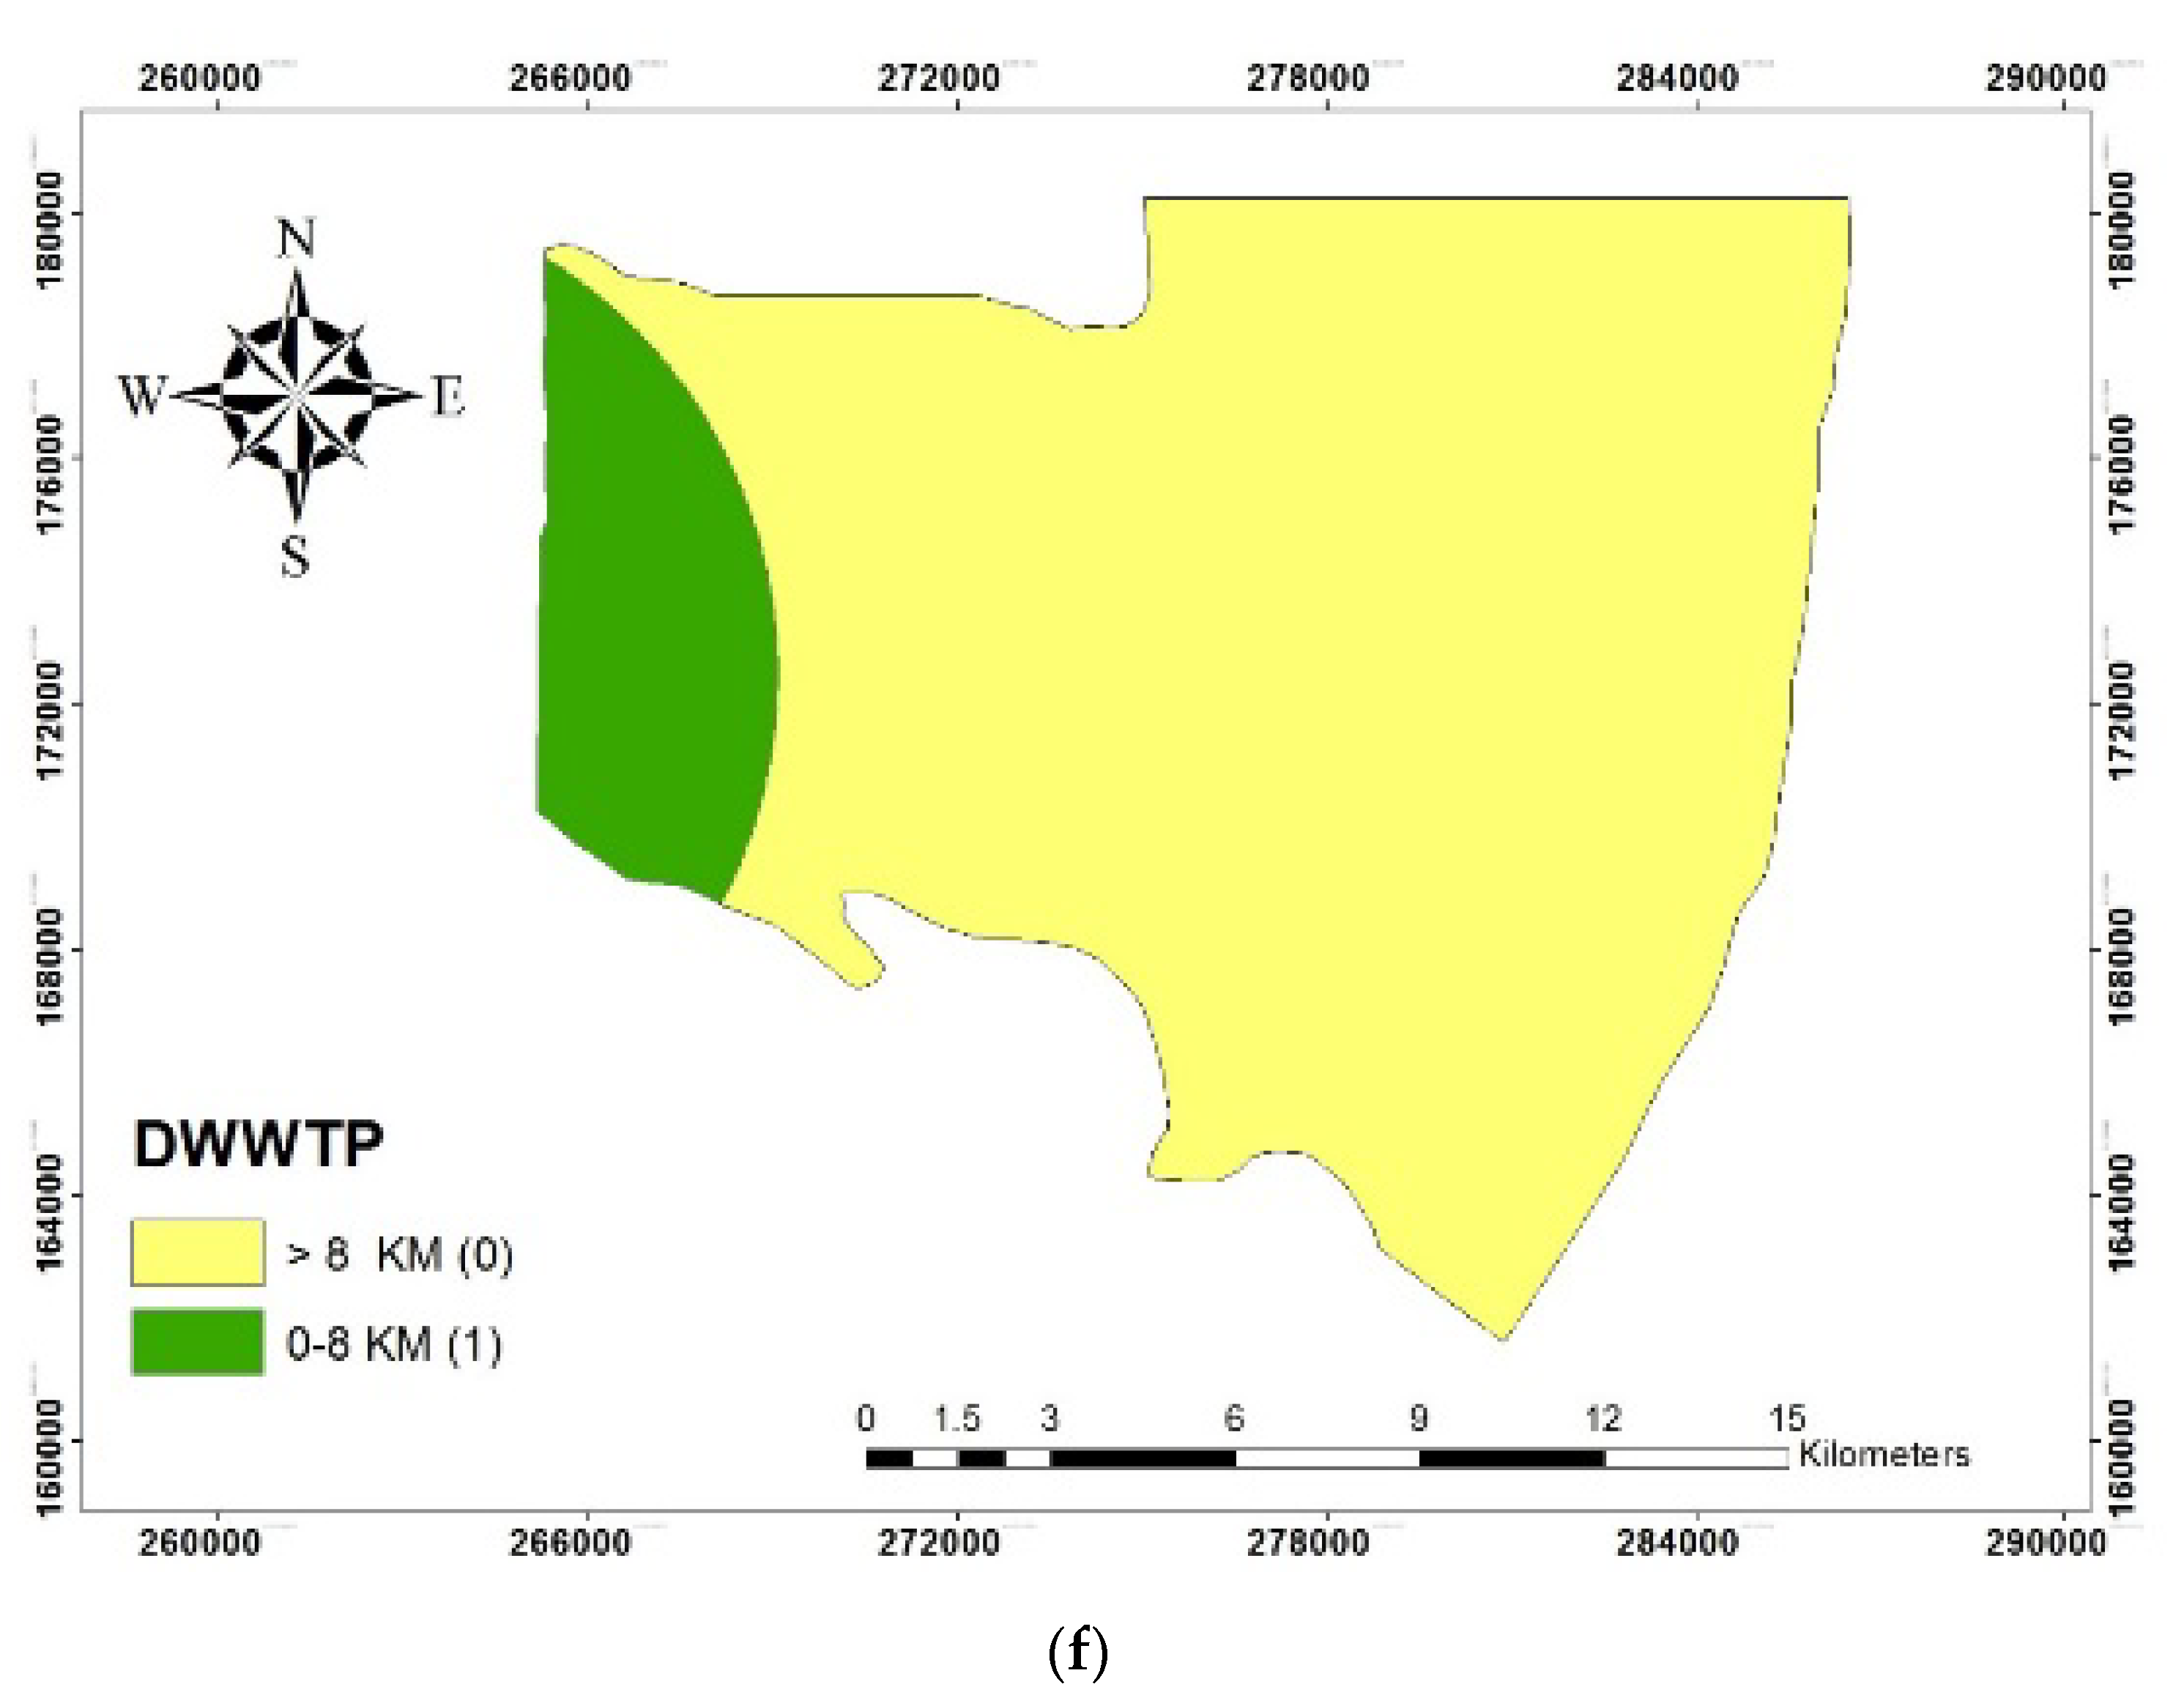
Figure 5 presents the six thematic maps categorized as water points (W.P.), urban areas (U.A.), land use (L.U.), soil type (T.S.), slopes (S), and WWTP distance (DWWTP) generated using ArcGIS 10.3 (spatial analysis tool). For each thematic map, the acceptable areas were coded as 1 and the rejected areas were coded as 0. Figure 5a,b present the environmental criteria which include a buffer area of 100 m radius for water consumption wells and a 200 m radius for the residential area, both of which were coded as 0. Figure 5c presents the slope thematic map for the study area, which was reclassified into two categories. The first category was related to the slopes with a value less than or equal to 12% (coded as 1), while the second category was related to the slopes with values >12% (coded as 0). The soil texture was identified as 1 for and 0 for the rest of the areas, as shown in Figure 5d. The suitable water table depth for GWRC must have a static G.W. level of at least 5 m below the ground to have a sufficient unsaturated zone for W.W. purification. Results showed all parts of the study area were considered suitable and coded as 1.
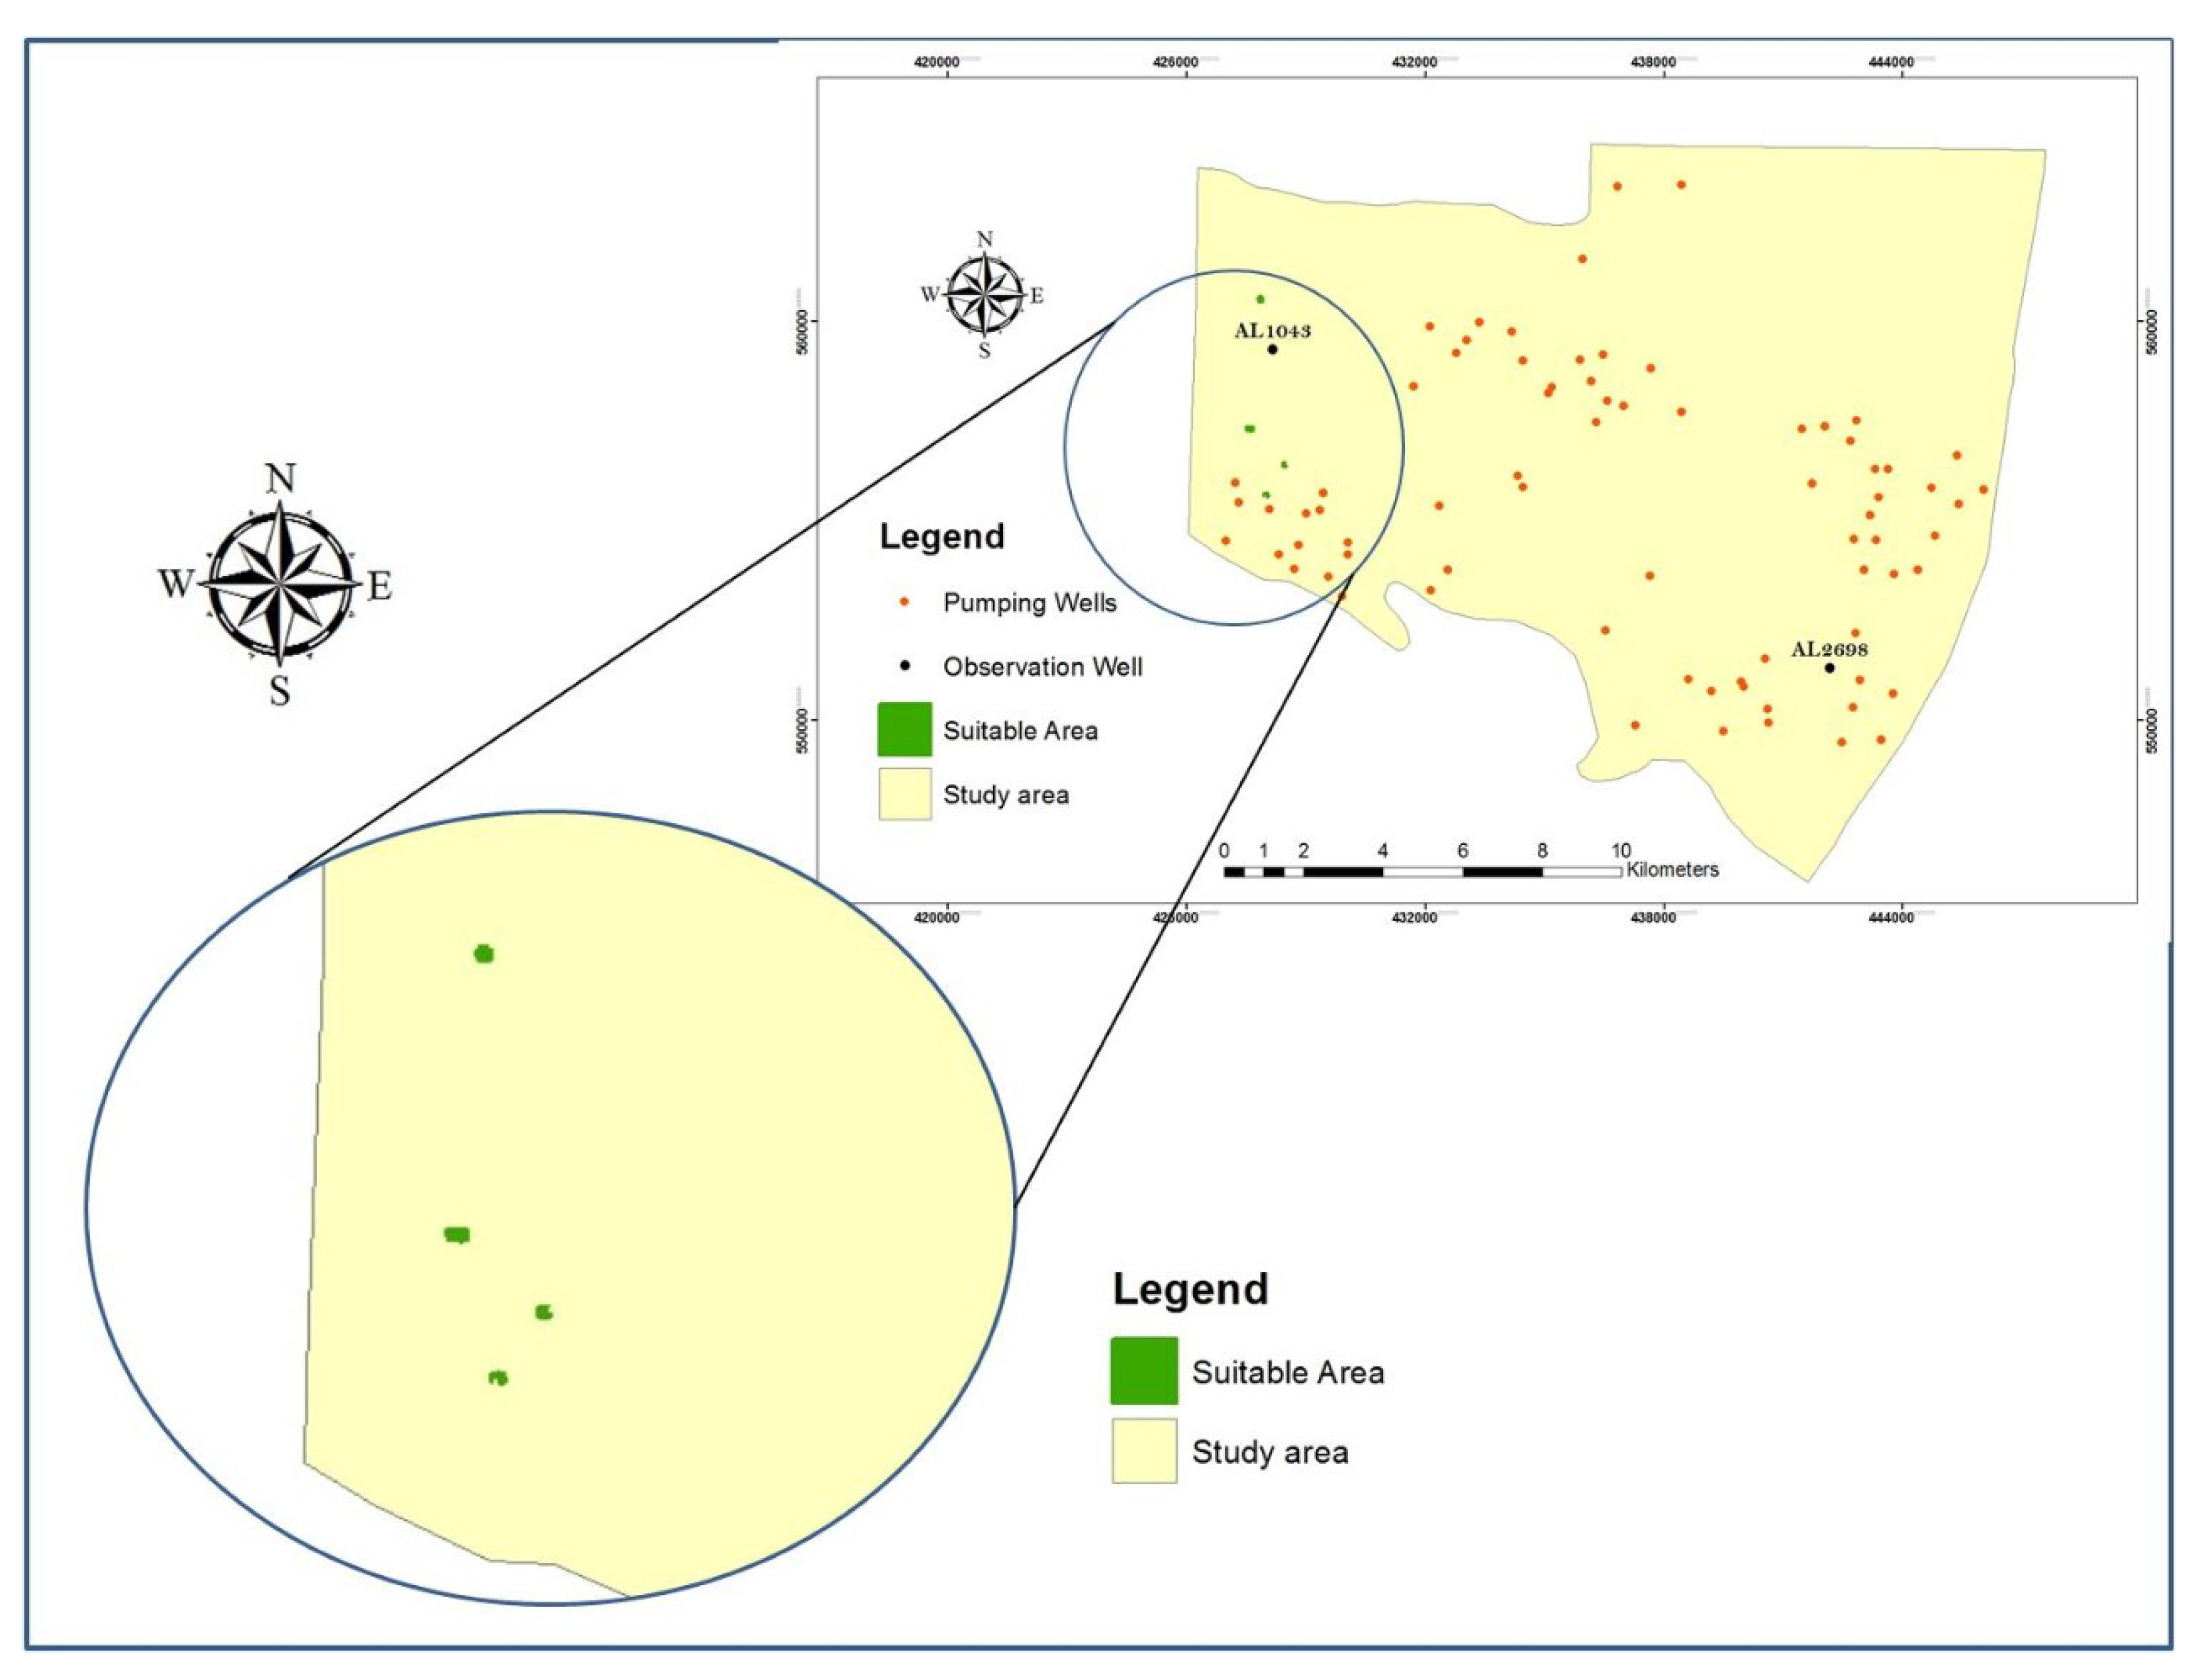
The land use thematic map of the studied area was produced considering all of the bush areas (i.e., uncultivated areas) as a suitable site for recharging and coded as 1 as presented in Figure 5e. The economic criteria include an 8 km buffer zone around the four WWTPs, which are coded as 1 as shown in Figure 5f. The raster GIS maps were generated using the raster calculator to create the suitability map for the GWRC basins (Figure 6). Table 3 outlines the suitable area for GWRC and the percentage from total area based on each criterion. It was observed that water point is suitable for about 97.86% of the total land area. Up to 99.5% of the studied area, ~267.29 km2 has the required slope, 97.97% of the studied area ~263.03 km2 has the required urban contribution, and 97.86% of the area (262.76 km2) has the right water points. However, only 55.56% of this land (≈149.19 km2) has the required soil texture, and just 7.96% of the land (18.68 km2) has a good opportunity in terms of close WWTP.
A GIS-based MCDA, combined with sensitivity analysis, informs decision-makers about which criteria are genuinely required and how the results are affected by weight changes. Consequently, it can maximize the criterion combination, adjust the conceptual framework, and minimize the deviation, leading to enhanced and more persuasive results, which will be considered in future research.
4.3. Groundwater Flow Model Calibration
4.3.1. Steady-State Calibration
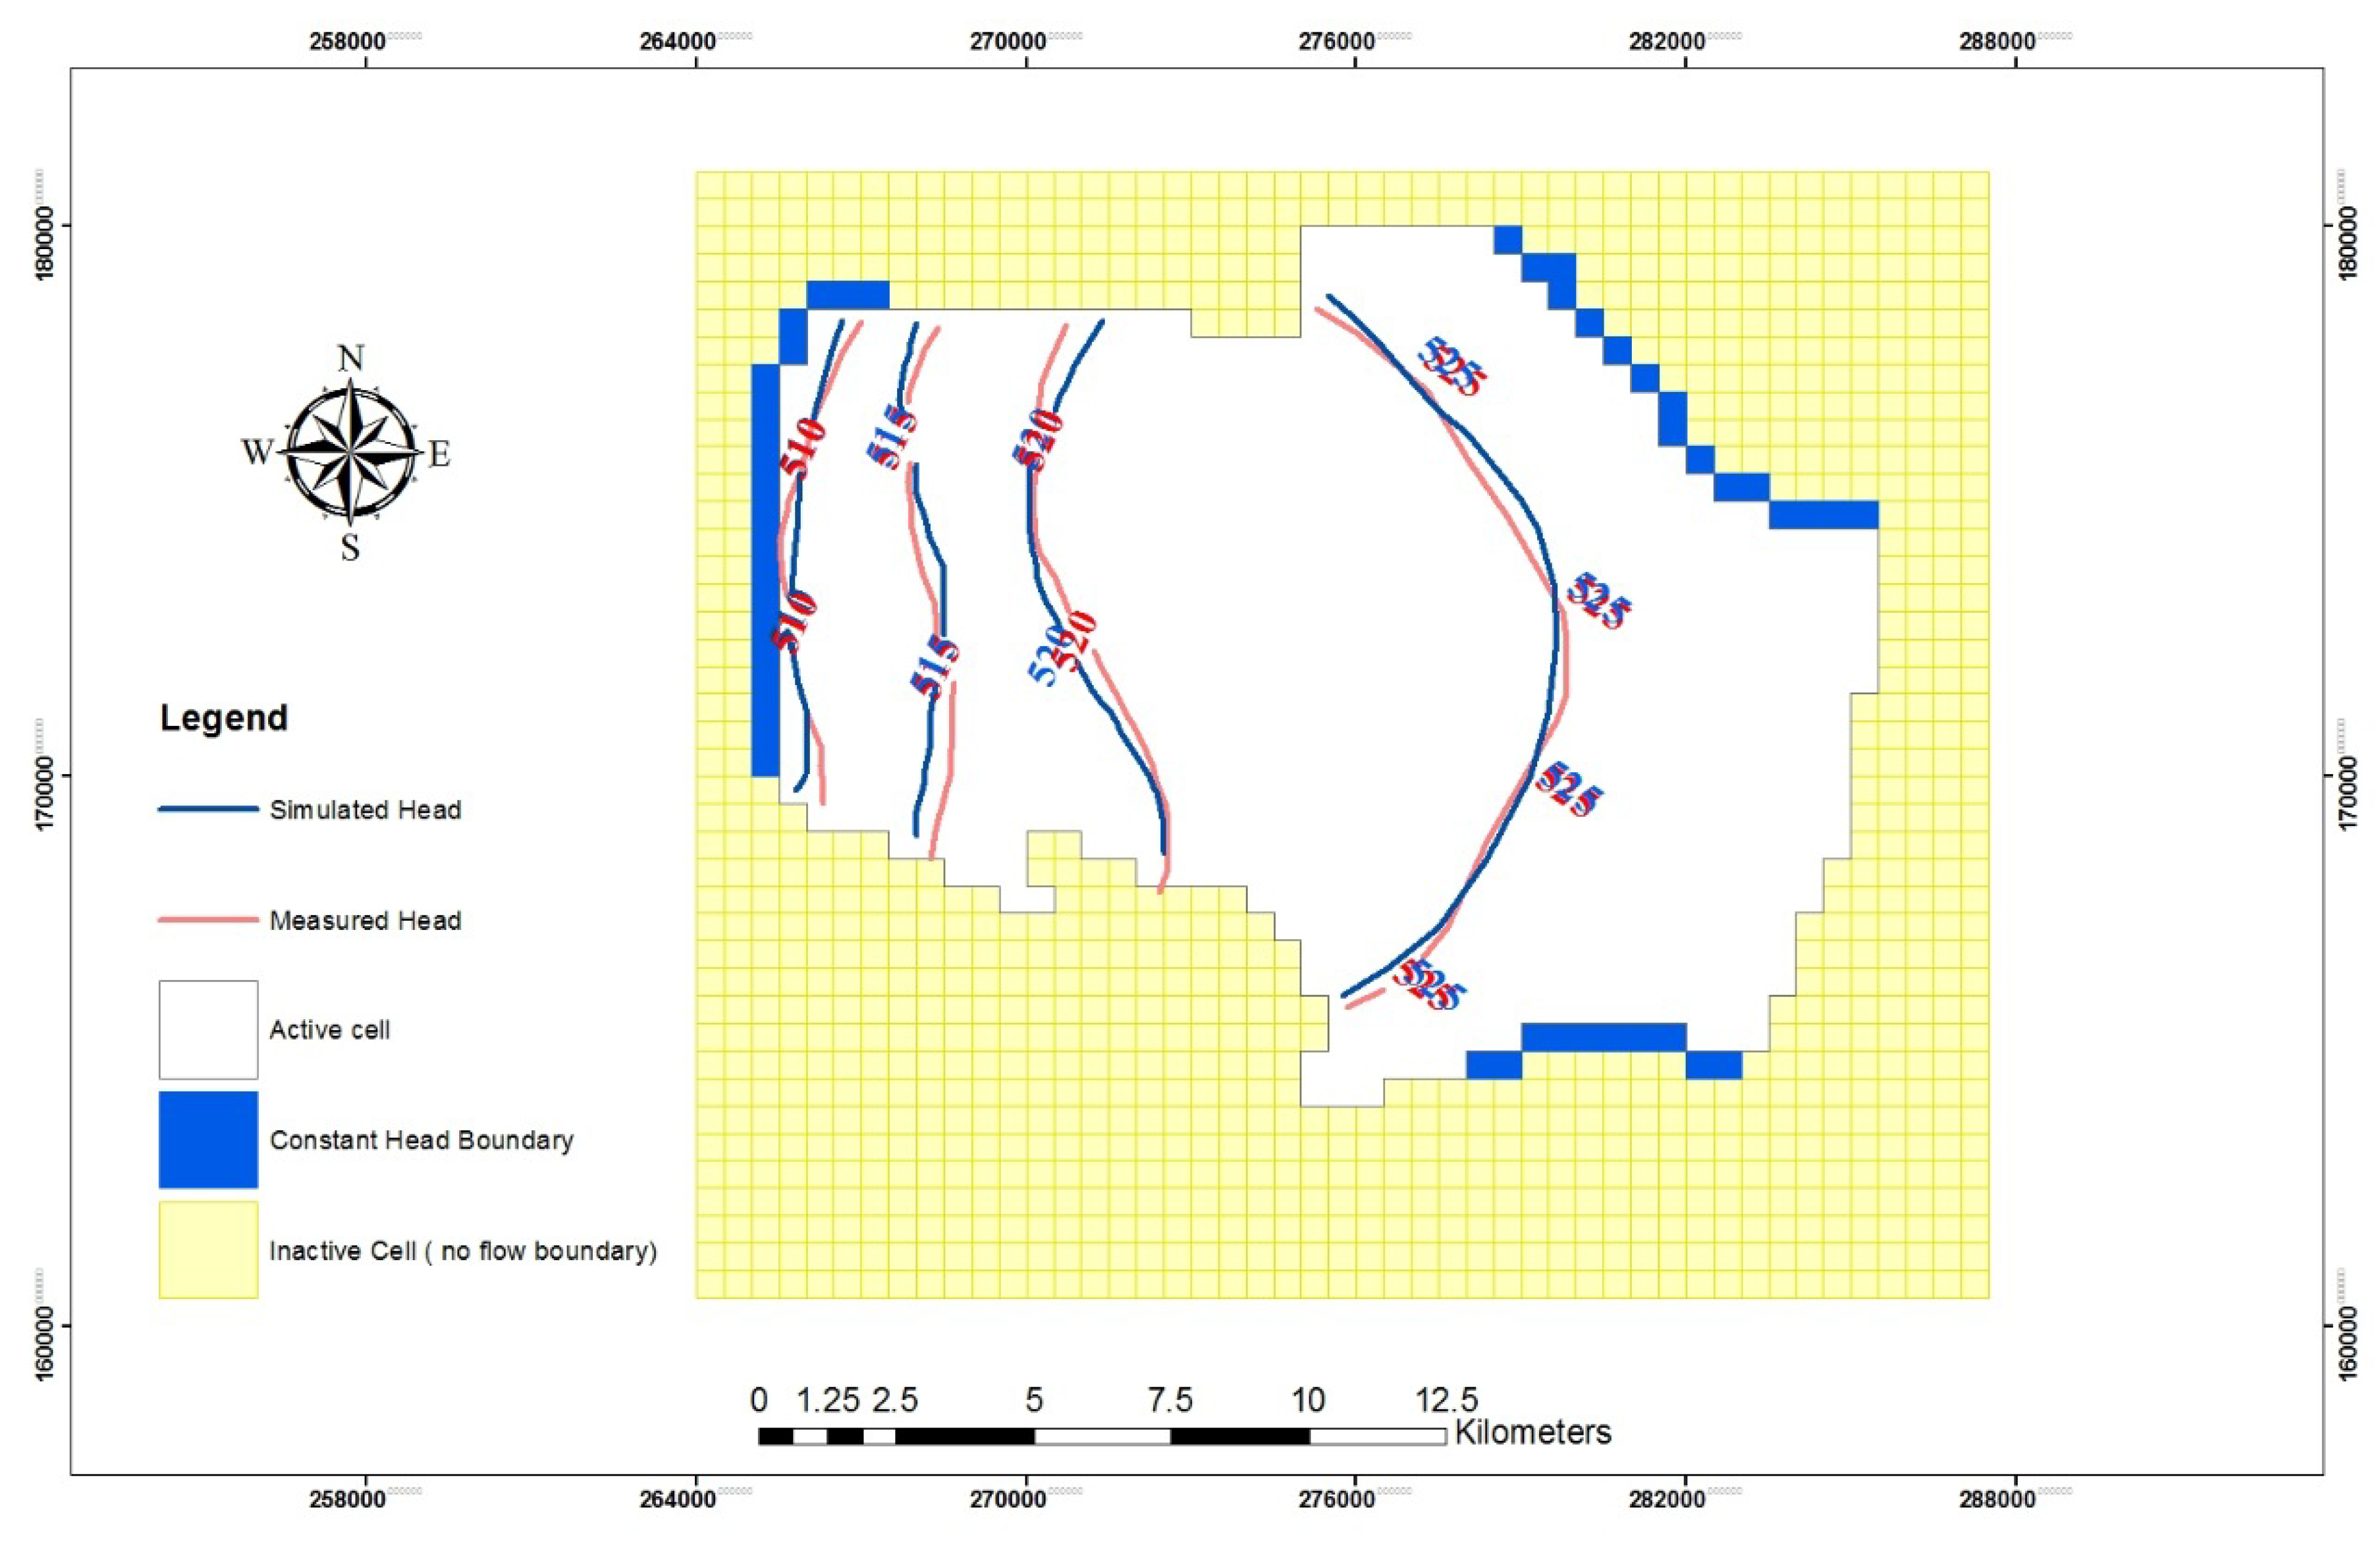
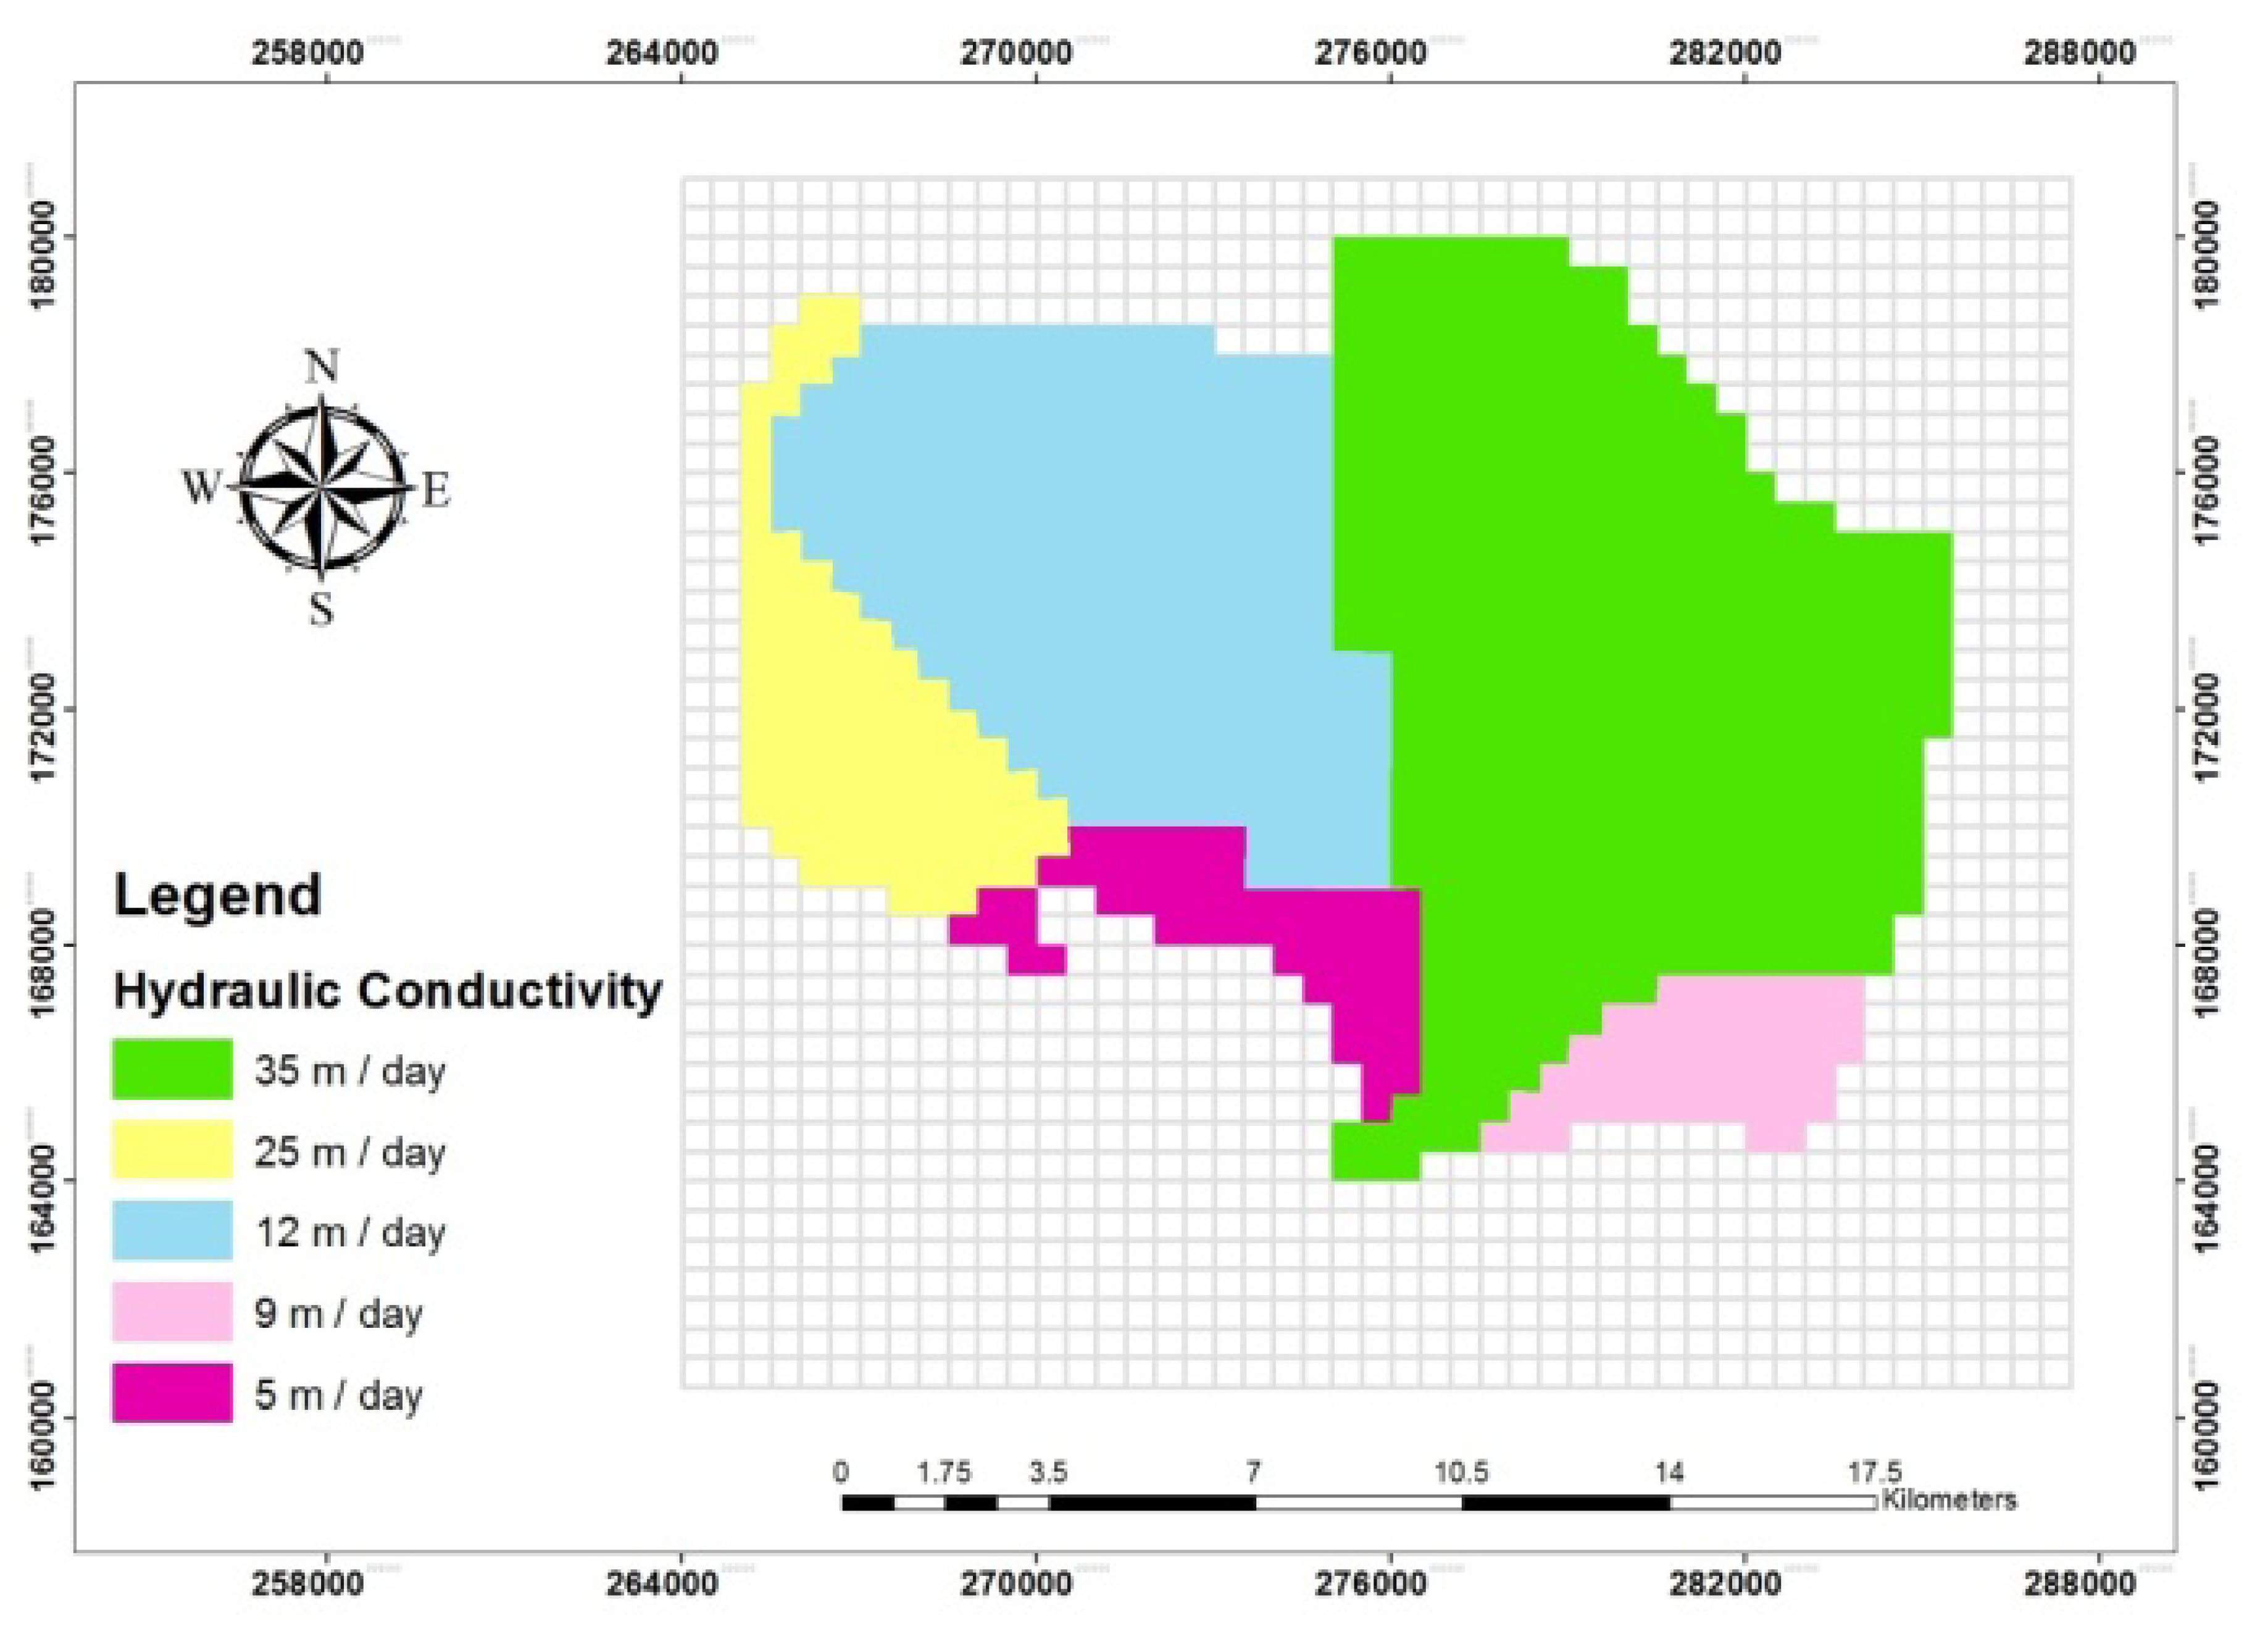
Figure 7 presents the comparison between the actual and the computed water level contour map for the B-B2/A7 formation in the Dhuleil-Halabat region produced by Modflow. Previously reported data on the HHK [51,53,55,58] and pumping tests [69] were used as initial values in the steady-state simulation. After that, the HHK values were continuously updated during the calibration process of the model. Results from the calibration phase revealed that the HHK values for the study area range between 5 and 35 m/day. Low conductivity values of 9 and 5 m/day were noticed on the south-central and south-west sides of the area (see Figure 8).
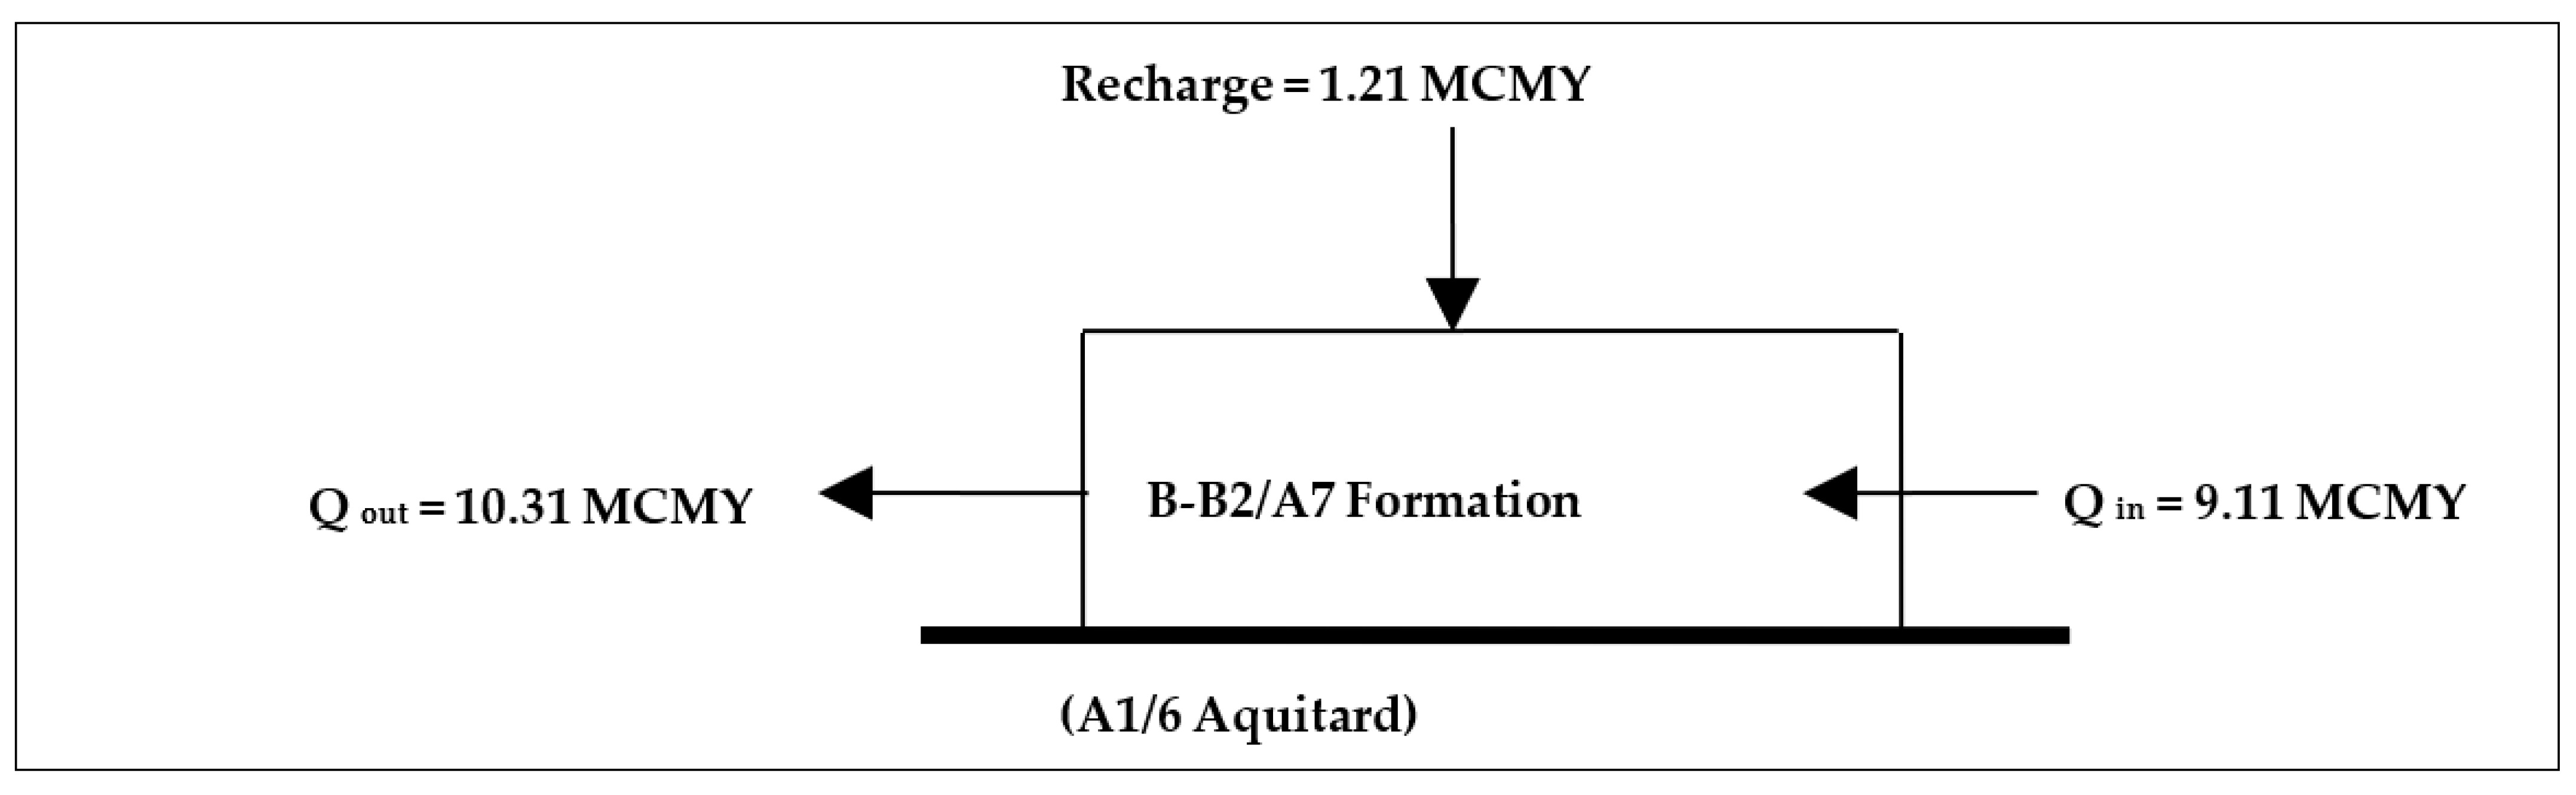
Conversely, high conductivity values ~35 and 25 m/day were observed in the East and West regions, respectively (Figure 8). The water balance for the B-B2/A7 formation at the steady-state conditions (Figure 9) indicates that the inflow is greater than the outflow by 0.01 MCMY with a discrepancy of 0.19%. The calculated total recharge amount for the study area was determined to be 10.32 MCMY (9.11 MCMY) with inflow from Jebal Al Arab and Azraq basin (i.e., southern constant head boundary (Figure 4c), and 1.21 MCM from the areal recharge. In contrast, the outflow from the eastern boundary towards Wadi Zarqa was determined to be 10.31 MCMY. In 1994, when the pumping reached 27.5 MCMY, a large amount of water flowing to pumping wells comes from G.W. storage. This causes a rapid decrease in the G.W. levels and creates a great hydraulic gradient around pumping wells. So, the hydraulic gradient forces G.W. to flow towards the pumping wells and reduces G.W. discharge to the western boundary, and creates recharge from the eastern and southern constant head boundary. With extra pumping and increasing the hydraulic gradient, the capture (low discharge and high recharge) increased and eventually equaled the pumping rate of 15.5 MCM in around 35 years as determined from Modflow calculations. In this situation, the capture sustains the pumping rate, and no more G.W. storage is removed. A new equilibrium state is achieved at a sustainable yield of 15.5 MCMY instead of 10.31 MCMY as calculated by steady-state calibration processes.
4.3.2. Transient Calibration and Validation
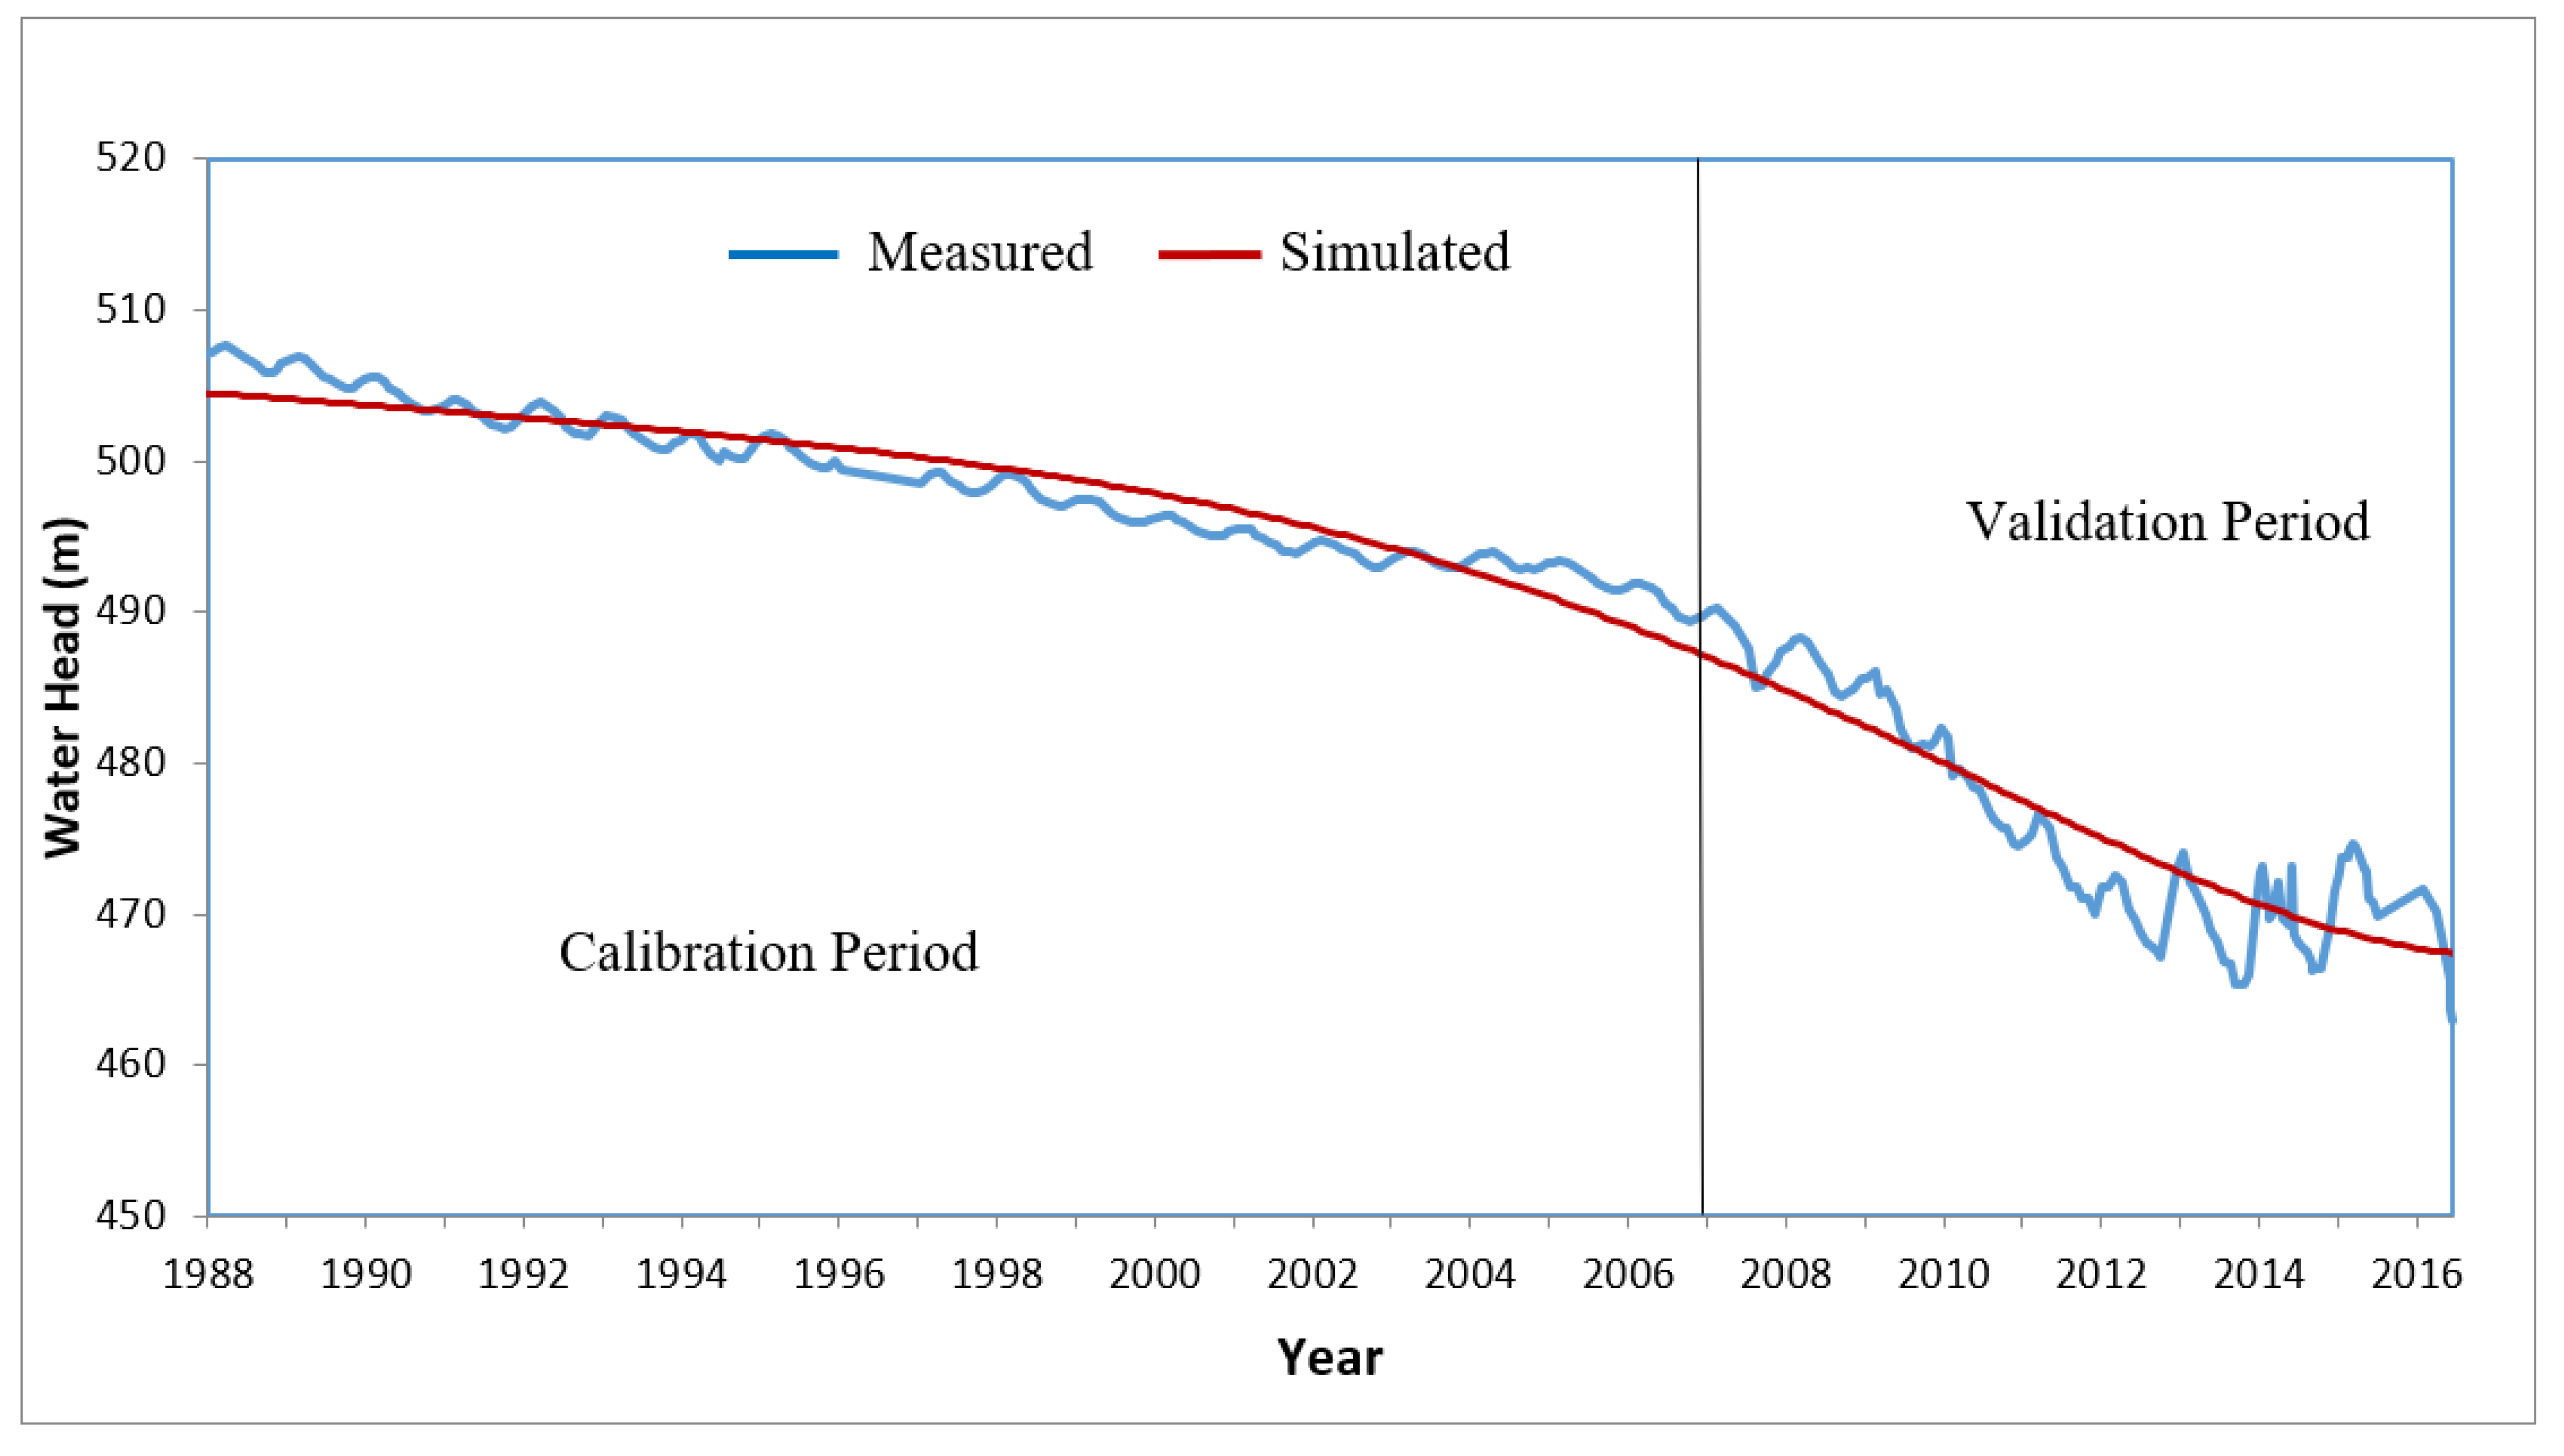
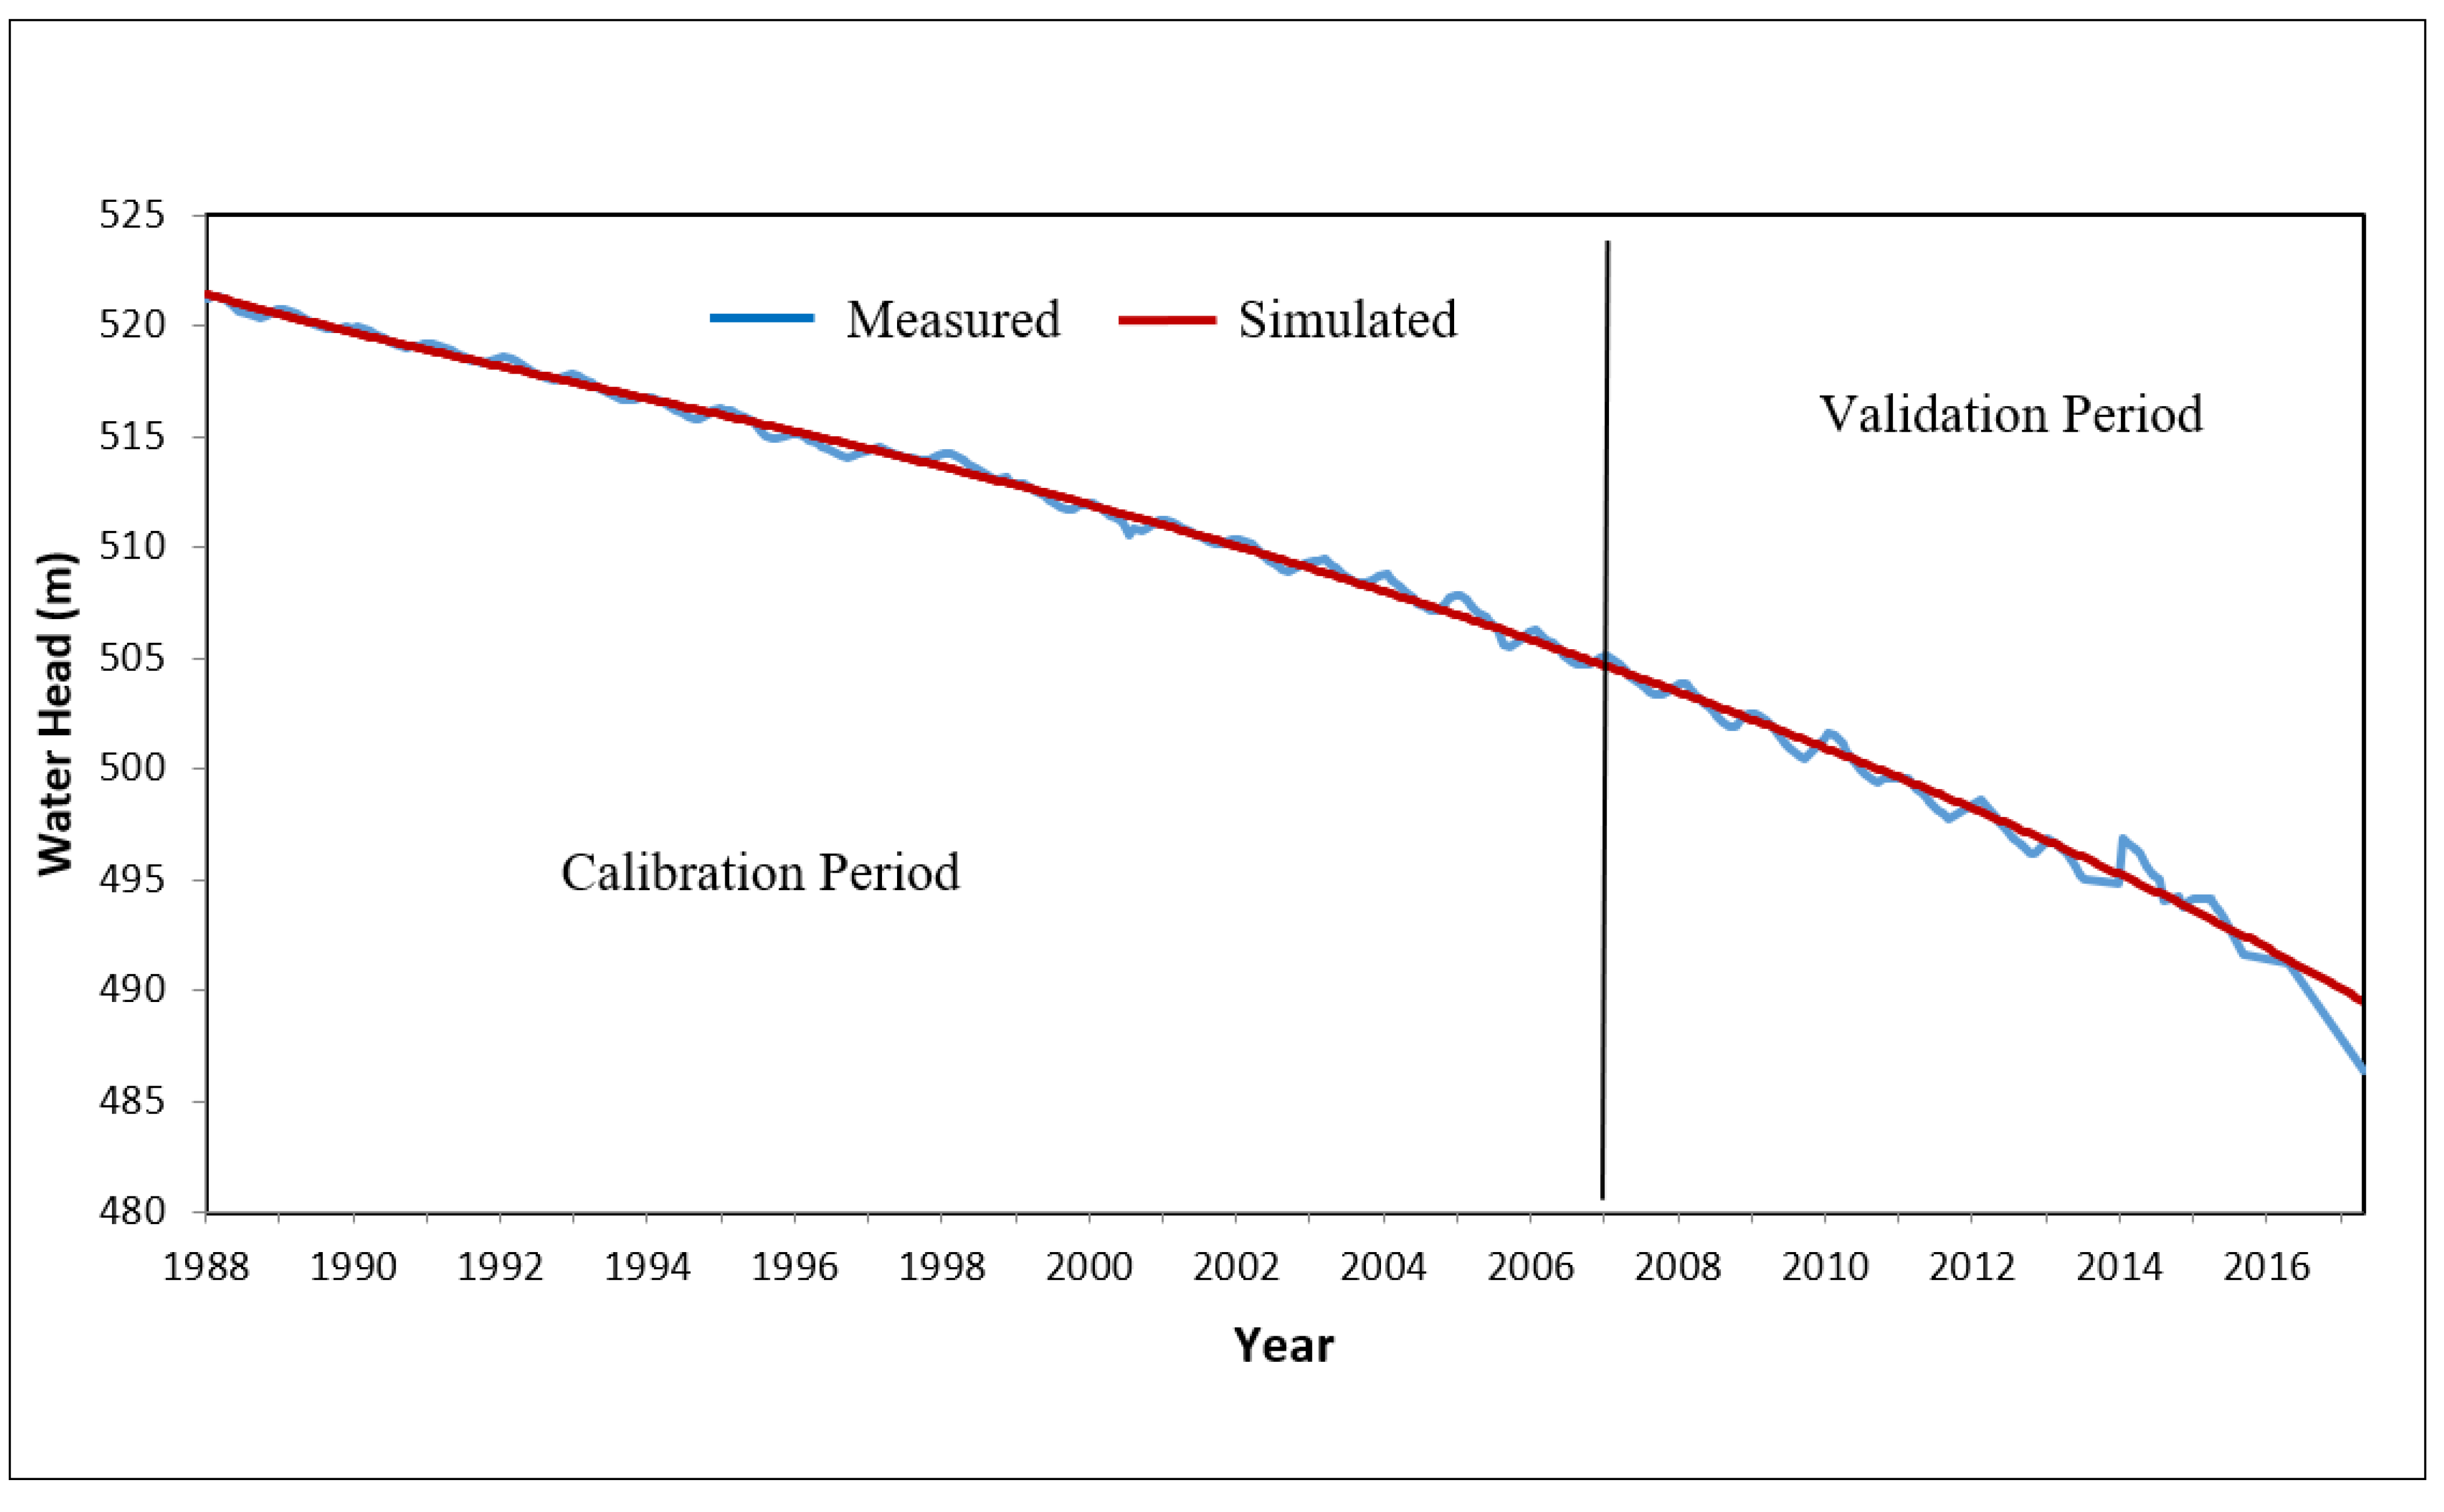
The transient calibration was achieved by changing the specific yield and storage values and perform several computer runs until the observed and simulated heads matched. Calculations determined that the average specific storage and average specific yields were 1.36 × 10⁻⁴ m−1 and 0.025, respectively. Figure 10 and Figure 11 compare the observed versus simulated fluctuations in G.W. heads in two observation well stations (AL1043 and AL2698). Results showed a good agreement between the observed and simulated fluctuations, confirming the accuracy of the developed model. There are very low differences between the measured and simulated G.W. heads in both the calibration and validation stages because of withdrawals in the model domain. It is clear that the water levels in the two observation wells are strongly influenced by the G.W. extraction from the surrounding pumping wells.
4.3.3. Model Evaluation
The calibration processes (steady-state and transient) between the measured and simulated heads were quantitatively assessed and are outlined in Table 4. The results in Table 4 show that the developed model successfully predicts the measured values for both wells. The statistical analysis showed that the maximum and minimum residual of the three measurements ranged between 0.765 to 4.799 and −0.815 to −4.683, respectively. The RMSE showed very low values (0.463 to 0.736) and R2 values close to one (0.931 to 0.996). The quantitative measurements provide a different way of assessing the calibration results beyond the visualized results previously provided. Typically, these measurements indicate that the match between the measured and simulated heads for the calibration process is more accurate than the validation process. This result was anticipated as the calibration stage for the hydraulic conductivity specific yield values hanged until the best fit was reached. However, for the validation stage, the calibrated values from the calibration stage were used. The grid size of 500 m by 500 m was used for steady-state calibration as the spatial resolution of data, and the monthly temporal resolution of data was used for the calculation of performance metrics (Transient State).
4.3.4. Model Prediction
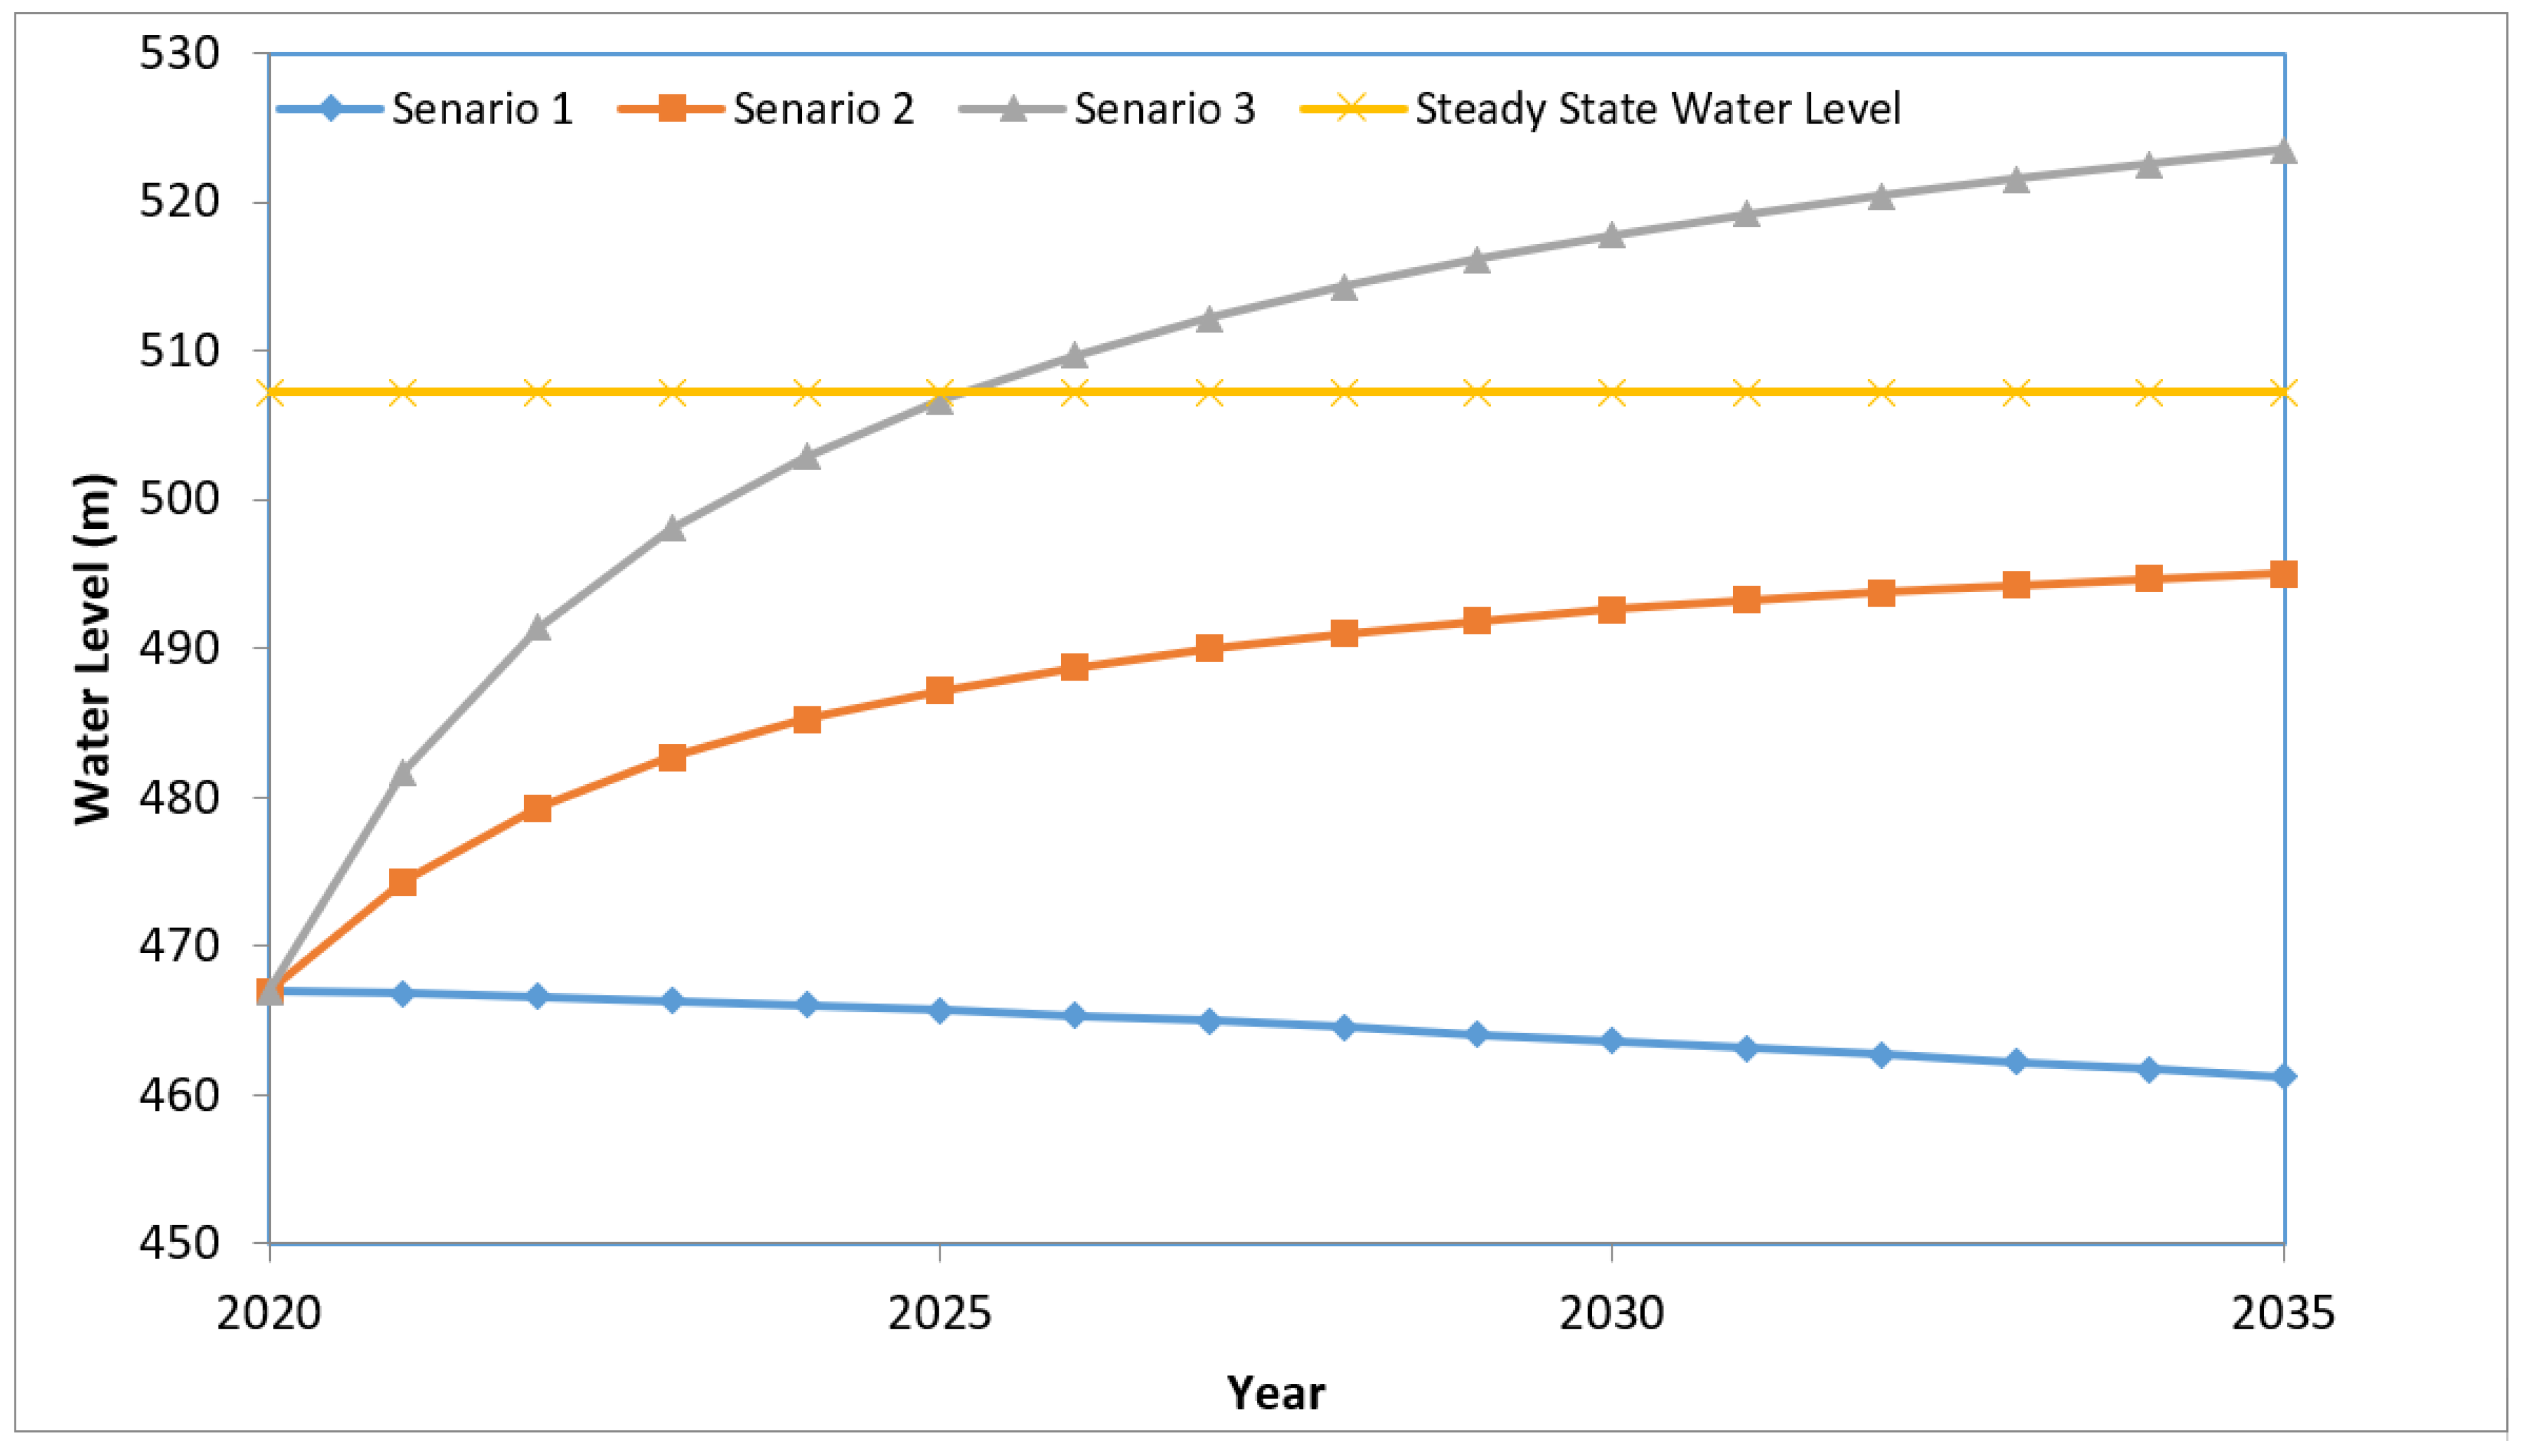
Figure 12 presents the model prediction for the three studied scenarios at the observation well (AL1043). The model was used to predict and assess the sustainability of the future GWRC as per the proposed scenario up to the year 2035. For the first scenario, which assumed constant G.W. withdrawal for 2025, 2030, and 2035 without any artificial GWRC recharge, the results showed that the maximum drawdown would be concentrated in the Southern region, where many of the pumping wells exist. These wells would reach roughly 70.12, 75.17, and 78.28 m in the years 2025, 2030, and 2035, respectively. The model also predicted that in 2030 there would be some dry areas in the South-West region with no-flow (dry areas), which are the areas that had saturation thickness ≤ of 35 m in 1965. For the second scenario assume artificial GWRC at a rate of 1.825 Mm3/year while keeping the current extraction rates constant up to the year 2035. The results indicated that the maximum drawdown would replicate scenario 1, as the average distance between the recharging sites and the location of the maximum drawdowns is 20 km (see Figure 6). The results also showed that with such practice the G.W. levels at observation well AL1043 would increase by roughly 12.82, 25.63, and 28.07 m in 2025, 2030, and 2035, respectively. The obtained results suggest an interesting recharging rate that will preserve the G.W. supply and sustain water resources. The results of the third scenario (Artificial GWRC at a rate of 3.65 MCMY and constant extraction rate up to the year 2035) show that the maximum drawdown would replicate scenario 1, as the average distance between the recharging sites and the location of maximum drawdowns is 20 km. With this scenario, the G.W. level at observation well AL1043 would increase by about 39.68, 50.77, and 56.50 m in the years 2025, 2030, and 2035, respectively. Besides this, the water level near the recharging site would reach a steady state in 2025 and maintain a constant as outlined in Figure 12.
The obtained results (see Figure 12) suggest a good strategy for sustainable maintenance of the G.W. via recharge with TWW. This strategy has several advantages, including the management of excess volumes of TWW that cannot be used for irrigation or landscaping and sustainable GWRC to maintain resources for the future generation. Although scenarios 2 and 3 show promising results in maintaining the G.W. up to 2035, the effect of water quality parameters on the produced G.W. and the cost associated with this practice required further investigation. Studying the fate and transport of different constituents in the TWW as a function of time is of great interest and would be the focus of our research work in the future. Besides this, developing a well-defined procedure for the injection and distribution of the TWW within the recharge area still requires further investigation. It is also worth mentioning that, herein, the proposed model work focused on simulation in the upper aquifer. The lower layer and the unsaturated zone were not included in this study. It will be highly encouraged to develop simulation work to cover these areas and verify the results. The effect of the unsaturated zone on hydrologic problems is often ignored or treated with crude approximations due to the scarcity of data in this zone. During the GWRC process, the recharging water typically reaches an aquifer by flowing through an unsaturated zone overlying it. Due to localized recharge processes, analytical and numerical models for coupled unsaturated–saturated flow models have received little attention. It was assumed during the use of the GWRC package from MODFLOW software that all the infiltrated water is transmitted to the water table as recharge. With such an assumption, the recharged flow can locally increase the water table more than the case which considers the flow through the unsaturated zone.
5. Conclusions
A case study was developed to identify the potential site location for G.W. recharge in Dhuleil-Halabat in Jordan. Six thematic maps were produced following environmental, technical, and economic criteria. The G.W. recharge potential procedure is demonstrated using the GIS-based multicriteria, which include different G.W. recharge potential factors. Three-dimensional G.W. flow models were used to calculate the G.W. budget, aquifer characteristics, and predict the aquifer response to water levels for the coming 15 years (up to 2035). Out of the 450 Km2 of the study area, the potential site for the G.W. recharge area was determined to be 0.14 km2 of the Eastern region.
The horizontal hydraulic conductivities of the aquifer (B-B2/A7) ranged between 5 and 35 m/day. The distribution of horizontal conductivity is irregular due to the complexity of the aquifer. The total GWRC, inflow from the eastern boundary through the basalt of the B-B2/A7 of the aquifer, and infiltrations due to rainfall were 10.32 MCMY, 9.11 MCMY, and 1.21 MCMY, respectively. The outflow across the western boundary reaches up to 10.31 MCMY towards Wadi Zarqa. According to the transient state calibration, the specific storage and the specific yield of the B-B2/A7 aquifer were found to be 1.36 × 10⁻⁴ m−1 and 2.5%, respectively. The optimal use of G.W. resources should not exceed 15.5 MCMY.
Lastly, three scenarios were performed to predict the aquifer system response to GWRC with TWW. The results exemplified that Artificial GWRC at a rate of 3.65 MCMY and constant extraction rate up to 2035 has the best results in terms of aquifer recharging, maintaining a steady-state G.W. level of 39.68 m extends the well-field service life, and manages high volumes of excess TWW. In contrast, withdrawal without a recharge is the least effective due to high G.W.
Author Contributions
M.S., conceptualization, methodology, software, and writing. F.A., writing—original draft. T.A.-R., GIS, writing—review and editing. All authors have read and agreed to the published version of the manuscript.
Funding
This research received no external funding.
Institutional Review Board Statement
Not applicable.
Informed Consent Statement
Not applicable.
Data Availability Statement
Not applicable.
Acknowledgments
The authors also gratefully acknowledge the financial support provided by the Qatar University International Research Collaboration Co-funds (IRCC-2020-011). The statements made herein are solely the responsibility of the authors.
Conflicts of Interest
The authors declare no conflict of interest.
References
- Custodio, E. Aquifer overexploitation: What does it mean? Hydrogeol. J. 2002, 10, 254–277. [Google Scholar] [CrossRef]
- Wendt, D.E.; Van Loon, A.F.; Scanlon, B.R.; Hannah, D.M. Managed aquifer recharge as a drought mitigation strategy in heavily-stressed aquifers. Environ. Res. Lett. 2021, 16, 014046. [Google Scholar] [CrossRef]
- Maliva, R.; Missimer, T. Managed aquifer recharge. In Arid Lands Water Evaluation and Management; Springer: Berlin/Heidelberg, Germany, 2012; pp. 559–630. ISBN 978-553-642-29104-29103. [Google Scholar]
- O’Leary, D.R.; Izbicki, J.A.; Moran, J.E.; Meeth, T.; Nakagawa, B.; Metzger, L.; Bonds, C.; Singleton, M.J. Movement of water infiltrated from a recharge basin to wells. Groundwater 2012, 50, 242–255. [Google Scholar] [CrossRef] [PubMed]
- Ringleb, J.; Sallwey, J.; Stefan, C. Assessment of managed aquifer recharge through modeling—A review. Water 2016, 8, 579. [Google Scholar] [CrossRef] [Green Version]
- Dillon, P.; Stuyfzand, P.; Grischek, T.; Lluria, M.; Pyne, R.; Jain, R.; Bear, J.; Schwarz, J.; Wang, W.; Fernandez, E. Sixty years of global progress in managed aquifer recharge. Hydrogeol. J. 2019, 27, 1–30. [Google Scholar] [CrossRef] [Green Version]
- Zhang, H.; Xu, Y.; Kanyerere, T. A review of the managed aquifer recharge: Historical development, current situation and perspectives. Phys. Chem. Earth Parts A/B/C 2020, 118–119, 102887. [Google Scholar] [CrossRef]
- Bouwer, H. Artificial recharge of groundwater: Hydrogeology and engineering. Hydrogeol. J. 2002, 10, 121–142. [Google Scholar] [CrossRef] [Green Version]
- Asano, T.; Cotruvo, J.A. Groundwater recharge with reclaimed municipal wastewater: Health and regulatory considerations. Water Res. 2004, 38, 1941–1951. [Google Scholar] [CrossRef]
- Page, D.; Barry, K.; Regel, R.; Kremer, S.; Pavelic, P.; Vanderzalm, J.; Dillon, P.; Rinck-Pfeifer, S.; Pitman, C. The aquifer storage, transfer and recovery project in Salisbury, South Australia. In Water Reclamation Technologies for Safe Managed Aquifer Recharge; Kazner, C., Wintgens, T., Dillon, P., Eds.; IWA Publishing: London, UK, 2012. [Google Scholar]
- Yeh, H.-F.; Cheng, Y.-S.; Lin, H.-I.; Lee, C.-H. Mapping groundwater recharge potential zone using a GIS approach in Hualian River, Taiwan. Sustain. Environ. Res. 2016, 26, 33–43. [Google Scholar] [CrossRef] [Green Version]
- Jaiswal, R.; Mukherjee, S.; Krishnamurthy, J.; Saxena, R. Role of remote sensing and GIS techniques for generation of groundwater prospect zones towards rural development--an approach. Int. J. Remote Sens. 2003, 24, 993–1008. [Google Scholar] [CrossRef]
- Magesh, N.S.; Chandrasekar, N.; Soundranayagam, J.P. Delineation of groundwater potential zones in Theni district, Tamil Nadu, using remote sensing, GIS and MIF techniques. Geosci. Front. 2012, 3, 189–196. [Google Scholar] [CrossRef] [Green Version]
- Ahmadi, M.; Mahdavirad, H.; Bakhtiari, B. Multi-criteria analysis of site selection for groundwater recharge with treated municipal wastewater. Water Sci. Technol. 2017, 76, 909–919. [Google Scholar] [CrossRef] [PubMed]
- Dabral, S.; Sharma, N.; Bhatt, B.; Joshi, J.P. A geospatial technique for demarcating ground water recharge potential zones: A study of Mahi-Narmada Inter stream region, Gujarat. Int. J. Geomat. Geosci. 2013, 4, 177. [Google Scholar]
- Thapa, R.; Gupta, S.; Guin, S.; Kaur, H. Assessment of groundwater potential zones using multi-influencing factor (MIF) and GIS: A case study from Birbhum district, West Bengal. Appl. Water Sci. 2017, 7, 4117–4131. [Google Scholar] [CrossRef]
- Ghayoumian, J.; Ghermezcheshme, B.; Feiznia, S.; Noroozi, A.A. Integrating GIS and DSS for identification of suitable areas for artificial recharge, case study Meimeh Basin, Isfahan, Iran. Environ. Geol. 2005, 47, 493–500. [Google Scholar] [CrossRef]
- Aydin, N.Y.; Kentel, E.; Duzgun, H.S. GIS-based site selection methodology for hybrid renewable energy systems: A case study from western Turkey. Energy Convers. Manag. 2013, 70, 90–106. [Google Scholar] [CrossRef]
- Rahman, M.A.; Rusteberg, B.; Uddin, M.S.; Lutz, A.; Saada, M.A.; Sauter, M. An integrated study of spatial multicriteria analysis and mathematical modelling for managed aquifer recharge site suitability mapping and site ranking at Northern Gaza coastal aquifer. J. Environ. Manag. 2013, 124, 25–39. [Google Scholar] [CrossRef]
- Escalante, E.F.; Gil, R.C.; San Miguel Fraile, M.Á.; Serrano, F.S. Economic assessment of opportunities for managed aquifer recharge techniques in Spain using an Advanced Geographic Information System (GIS). Water 2014, 6, 2021–2040. [Google Scholar] [CrossRef] [Green Version]
- Russo, T.A.; Fisher, A.T.; Lockwood, B.S. Assessment of managed aquifer recharge site suitability using a GIS and modeling. Groundwater 2015, 53, 389–400. [Google Scholar] [CrossRef] [Green Version]
- Bonilla Valverde, J.P.; Blank, C.; Roidt, M.; Schneider, L.; Stefan, C. Application of a GIS multi-criteria decision analysis for the identification of intrinsic suitable sites in Costa Rica for the application of managed aquifer recharge (MAR) through spreading methods. Water 2016, 8, 391. [Google Scholar] [CrossRef]
- Parimalarenganayaki, S. Managed Aquifer Recharge in the Gulf Countries: A Review and Selection Criteria. Arab. J. Sci. Eng. 2020, 46, 1–15. [Google Scholar] [CrossRef] [PubMed]
- Behroozmand, A.A.; Auken, E.; Knight, R. Assessment of managed aquifer recharge sites using a new geophysical imaging method. Vadose Zone J. 2019, 18, 1–13. [Google Scholar] [CrossRef] [Green Version]
- Sendrós, A.; Himi, M.; Lovera, R.; Rivero, L.; Garcia-Artigas, R.; Urruela, A.; Casas, A. Geophysical Characterization of Hydraulic Properties around a Managed Aquifer Recharge System over the Llobregat River Alluvial Aquifer (Barcelona Metropolitan Area). Water 2020, 12, 3455. [Google Scholar] [CrossRef]
- Pedrero, F.; Albuquerque, A.; Amado, L.; Marecos do Monte, H.; Alarcón, J. Analysis of the reclamation treatment capability of a constructed wetland for reuse. Water Pract. Technol. 2011, 6. [Google Scholar] [CrossRef]
- Smith, J.E. Process Design Manual for Land Treatment of Municipal Wastewater; EPA: Washington, DC, USA, 2006.
- Kallali, H.; Anane, M.; Jellali, S.; Tarhouni, J. GIS-based multi-criteria analysis for potential wastewater aquifer recharge sites. Desalination 2007, 215, 111–119. [Google Scholar] [CrossRef]
- Asano, T.; Burton, F.; Leverenz, H.; Tsuchihashi, R.; Tchobanoglous, G. Water Reuse: Issues, Technologies, and Applications; McGraw-Hill Education: New York, NY, USA, 2007; ISBN-13 978-0071459273. [Google Scholar]
- Silva, F.; Albuquerque, A.; Marecos do Monte, H.; Cavaleiro, V.; Carvalho, A. Site selection for reclaimed water infiltration using GIS tools. In Proceedings of the IWA Regional Conference on Wastewater Purification and Reuse, Creta, Greece, 28–30 March 2012. [Google Scholar]
- Aish, A.M.; Batelaan, O.; De Smedt, F. Distributed recharge estimation for groundwater modeling using WetSpass model, case study—Gaza strip, Palestine. Arab. J. Sci. Eng. 2010, 35, 155. [Google Scholar]
- Pedrero, F. Sustainable Irrigation Management with Reclaimed Water. Ph.D Thesis, Universidad Politécnica de Cartagena, Cartagena, Spain, 2010. [Google Scholar]
- Silva, F. Study of Reclaimed Water Potential for Aquifer Recharge Using GIS. Master’s Thesis, Department of Civil Engineering, University of Beira Interior, Covilha, Portugal, 2011. (In Portuguese). [Google Scholar]
- Reed, S.; Wallace, A.; Bouwer, H.; Enfield, C.; Stein, C.; Thomas, R. Process design manual for land treatment of municipal wastewater: Supplement on rapid infiltration and overland flow: US EPA Center for Environmental Research Information. Rep. EPA 1984, 625, 1–81. [Google Scholar]
- Masciopinto, C.; Palmisano, V.; Tangorra, F.; Vurro, M. A decision support system for artificial recharge plant. Water Sci. Technol. 1991, 24, 331–342. [Google Scholar] [CrossRef]
- Balkema, A.; Preisig, H.; Otterpohl, R.; Lambert, A.; Weijers, S. Developing a model based decision support tool for the identification of sustainable treatment options for domestic wastewater. Water Sci. Technol. 2001, 43, 265–269. [Google Scholar] [CrossRef]
- Angelakis, A.N.; Bontoux, L.; Lazarova, V. Challenges and prospectives for water recycling and reuse in EU countries. Water Supply 2003, 3, 59–68. [Google Scholar] [CrossRef]
- Adenso-Dıaz, B.; Tuya, J.; Goitia, M. EDSS for the evaluation of alternatives in waste water collecting systems design. Environ. Model. Softw. 2005, 20, 639–649. [Google Scholar] [CrossRef]
- Bixio, D.; Wintgens, T. Water Reuse System Management Manual-Manual, AQUAREC; Directorate-General for Research, European Commission Brussels: Brussels, Belgium, 2006. [Google Scholar]
- Pavelic, P.; Dillon, P.J.; Nicholson, B.C. Comparative evaluation of the fate of disinfection byproducts at eight aquifer storage and recovery sites. Environ. Sci. Technol. 2006, 40, 501–508. [Google Scholar] [CrossRef] [PubMed]
- Singh, A.; Srivastav, S.; Kumar, S.; Chakrapani, G.J. A modified-DRASTIC model (DRASTICA) for assessment of groundwater vulnerability to pollution in an urbanized environment in Lucknow, India. Environ. Earth Sci. 2015, 74, 5475–5490. [Google Scholar] [CrossRef]
- Dillon, P.; Page, D.; Vanderzalm, J.; Toze, S.; Simmons, C.; Hose, G.; Martin, R.; Johnston, K.; Higginson, S.; Morris, R. Lessons from 10 years of experience with Australia’s risk-based guidelines for managed aquifer recharge. Water 2020, 12, 537. [Google Scholar] [CrossRef] [Green Version]
- Gheewala, S.; Silalertruksa, T.; Nilsalab, P.; Lecksiwilai, N.; Sawaengsak, W.; Mungkung, R.; Ganasut, J. Water stress index and its implication for agricultural land-use policy in Thailand. Int. J. Environ. Sci. Technol. 2018, 15, 833–846. [Google Scholar] [CrossRef]
- Abu Obeid, H. Hydrogeology of Wadi Dhuleil Area-Technical Report; NRA: Amman, Jordan, 1967. [Google Scholar]
- Patners, R. Digital Model of the Shallow Aquifer of the Wadi Dhuleil Area of East Jordan; Water Authority of Jordan: Amman, Jordan, 1971.
- Abu Obeid, H. Salinization of Groundwater in Dhuleil-Hallabat Area-Technical Report; NRA: Amman, Jordan, 1973. [Google Scholar]
- Abu Obeid, H. Water Situation in Dhuleil-Hallabat Area Technical Report; Water Authority of Jordan: Amman, Jordan, 1985.
- Rimawi, O. Hydrogeochemistry and isotope hydrology of the ground and surface water in North Jordan (North-Northeast of Mafraq, Dhuleil-Hallabat, Azraq Basin). Ph.D. Thesis, Technical University of Munich, Munich, Germany, 1985. [Google Scholar]
- Al-Zabet, T. Two Dimensional Finite Element Model for Groundwater Flow of Dhuleil-Hallabat Syste. Master’s Thesis, University of Jordan, Amman Governorate, Jordan, 1993. [Google Scholar]
- Bajjali, W. Using ArcView to determine the origin of groundwater salinity in Dhuleil, Halabat, and Samra area of Jordan. In Proceedings of the ESRI User Conference, San Diego, CA, USA, 8–11 July 2019. [Google Scholar]
- Al-Mahamid, J. Three Dimensional Numerical Model for Groundwater Flow and Contamination Transport of Dhuleil-Hallaqbat Aquifer System. Master’s Thesis, Faculty of Graduate Studies, University of Jordan, Amman Governorate, Jordan, 1998. [Google Scholar]
- Ministry of Water and Irrigation, Option for Artificial Groundwater Recharge with Reclaimed Water in the Amman Zarqa Basin and Jordan Valley-Technical Report. Available online: https://www.google.com.hk/url?sa=t&rct=j&q=&esrc=s&source=web&cd=&cad=rja&uact=8&ved=2ahUKEwjB46_R7_fwAhWKwosBHcMYCUoQFjAAegQIAxAD&url=http%3A%2F%2Fpdf.usaid.gov%2Fpdf_docs%2FPnacp561.pdf&usg=AOvVaw2TAvCUy8h0RDfZxzRz9jyj (accessed on 2 June 2021).
- Shawaqfeh, E. Development of Three Dimensional Groundwater Model for Dhuleil Area/Amman–Zarqa Basin. Master’s Thesis, Ordan University of Science and Technology, Irbid, Jordan, 2005. [Google Scholar]
- Bender, F. Geology of Jordan; Geburuder Borntraeger: Berlin, Germany, 1974. [Google Scholar]
- Margane, A.; Hobler, M.; Almomani, M.; Subah, A. Contributions to the Hydrogeology of Northern and Central-JORDAN; Schweizerbart Science Publishers: Stuttgart, Germany, 2002. [Google Scholar]
- Chiang, W.H.; Kinzelbach, W. Pre- and Postprocessors for Simulation of Flow and Contaminants Transport in Groundwater Systems with MODFLOW, MODPATH and MT3D (Processing Modflow), Version 8; Windows: Hamburg/Heidelberg, Germany, 2013. [Google Scholar]
- Margane, A.; Hobler, M. Groundwater Resources of Northern Jordan, Structural Features of the Main Hydrogeological Units in Northern Jordan; Technical Report for Water Authority of Jordan; BGR: Amman, Jordan, 1994. [Google Scholar]
- Hatamleh, R.; Shawaqfah, M. Development of Groundwater Model for the Rijam Aquifer/Jafer Basin, Jordan. Jordan J. Civ. Eng. 2018, 12, 369–378. [Google Scholar]
- Bloomfield, J.; Marchant, B. Analysis of groundwater drought building on the standardized precipitation index approach. Hydrol. Earth Syst. Sci. 2013, 17, 4769–4787. [Google Scholar] [CrossRef] [Green Version]
- Anderson, M.; Woessner, W. Applied groundwater modeling: Simulation of flow and Advection transport Academic Press. In Applied Ground Water Modeling: Simulation of Flow and Advective Transport; Academic Press: Cambridge, MA, USA, 1992. [Google Scholar]
- Spitz, K.; Moreno, J. A Practical Guide to Groundwater and Solute Transport Modeling; John Wiley and Sons: Hoboken, NJ, USA, 1996; ISBN 978-0-471-13687-3. [Google Scholar]
- Myszograj, S.; Qteishat, O. Operate of As-Samra wastewater treatment plant in Jordan and suitability for water reuse. Inżynieria Ochr. Sr. 2011, 14, 29–40. [Google Scholar]
- Megdal, S.B.; Dillon, P.; Seasholes, K. Water banks: Using managed aquifer recharge to meet water policy objectives. Water 2014, 6, 1500–1514. [Google Scholar] [CrossRef] [Green Version]
- Heir, O. Artificial Recharge of Groundwater with Recycled Municipal Wastewater in the Pajaro Valley. Master’s Thesis, University of San Francisco, San Francisco, CA, USA, 2016. [Google Scholar]
- Quanrud, D.M.; Hafer, J.; Karpiscak, M.M.; Zhang, J.; Lansey, K.E.; Arnold, R.G. Fate of organics during soil-aquifer treatment: Sustainability of removals in the field. Water Res. 2003, 37, 3401–3411. [Google Scholar] [CrossRef]
- Bunsri, T.; Sivakumar, M.; Hagare, D. Transport and biotransformation of organic carbon and nitrate compounds in unsaturated soil conditions. Water Sci. Technol. 2008, 58, 2143–2153. [Google Scholar] [CrossRef] [PubMed] [Green Version]
- Pan, W.; Xiong, Y.; Huang, Q.; Huang, G. Removal of Nitrogen and COD from Reclaimed Water during Long-Term Simulated Soil Aquifer Treatment System under Different Hydraulic Conditions. Water 2017, 9, 786. [Google Scholar] [CrossRef] [Green Version]
- JSMO—Jordan Standards and Metrology Organization. Water-Reclaimed Domestic Wastewater No. JS 893. 2018. Available online: http://www.jsmo.gov.jo/en/Eservices/Pages/SearchResults.aspx (accessed on 25 April 2019).
- Ministry of Water and Irrigation. Groundwater Basins Directorate Open Files; Ministry of Water and Irrigation: Amman, Jordan, 2019.
Figure 1.
Location map of the study area.

Figure 2.
(a) Digital Elevation Model. (b) Water level contour map in 1965. (c) Soil Texture. (d) Land Use.
Figure 2.
(a) Digital Elevation Model. (b) Water level contour map in 1965. (c) Soil Texture. (d) Land Use.


Figure 3.
Conceptual model of the study area.

Figure 4.
(a) Topographical map. (b) Base map of B2/A7. (c) Boundary conditions. (d) The long-term average of rainfall.
Figure 4.
(a) Topographical map. (b) Base map of B2/A7. (c) Boundary conditions. (d) The long-term average of rainfall.


Figure 5.
(a) Water Points thematic map. (b) Urban Areas thematic map. (c) Land Use thematic map. (d) Soil thematic maps. (e) Slope thematic map. (f) Distance from WWTP thematic map.
Figure 5.
(a) Water Points thematic map. (b) Urban Areas thematic map. (c) Land Use thematic map. (d) Soil thematic maps. (e) Slope thematic map. (f) Distance from WWTP thematic map.


Figure 6.
Suitability map for the GWRC basins in the study area.

Figure 7.
Map of the observed and simulated water levels for the B-B2/A7 formation (steady-state calibration).
Figure 7.
Map of the observed and simulated water levels for the B-B2/A7 formation (steady-state calibration).

Figure 8.
Map of the calibrated HHK for the B-B2/A7 formation.

Figure 9.
Water balance of the model domain at the steady-state conditions.

Figure 10.
The comparison of observed and simulated fluctuations in G.W. heads in the observation well (AL1043).
Figure 10.
The comparison of observed and simulated fluctuations in G.W. heads in the observation well (AL1043).

Figure 11.
The comparison of observed and simulated fluctuations in the G.W. heads in the observation well (AL 2698).
Figure 11.
The comparison of observed and simulated fluctuations in the G.W. heads in the observation well (AL 2698).

Figure 12.
Model prediction for the three scenarios at the observation well (AL1043).


Table 1.
Environmental, technical, and economic criteria used for the selection of the appropriate locations for GWRC (adapted from [26]).
Table 1.
Environmental, technical, and economic criteria used for the selection of the appropriate locations for GWRC (adapted from [26]).
| Criteria | Restrictions |
|---|---|
| Environmental | The limitations set to prevent the pollution by infiltration of treated wastewater and direct interaction with human settlements: the safeguard distance was set at:
|
| Technical | The slope of the recharging basins should be between 0 and 12 percent. Higher slopes would increase runoff, soil erosion, soil instability, and replenishment costs [27]. Soil texture: the recharging basins should be situated in permeable soils to allow for high infiltration rates and suitable wastewater treatment [27,28,29,30]. The unsaturated zone should be greater than 5 m to avoid G.W. contamination [29]. Low permeability is highly recommended in this zone to restrict the downward movement of water and clog the soil. Soil Types: Rocky soil should be avoided except for Anthrosol soils because at depths ≥ 1 m it permits infiltration at a rate of 1 m/s. The remaining contaminants are largely eliminated mainly within the top one meter [31]. Aquifer depth: A G.W. level of at least five meters below the ground surface is recommended to provide an adequate distance for TWW purifications [28,30,31,32]. Land Use: All uncultivated zones (e.g., bush area) have been considered for GWRC. |
| Economic | The cost includes the piping system with a maximum distance of 8 km as well as transporting of the TWW to the recharging site [28,30,33]. |
Table 2.
Effluent water quality parameters from As-Samra WWTP.
| Parameters | As Samra | JS 893/2006 * |
|---|---|---|
| E.coli (MPN/100 mL) | 8 ± 3 | 1000 |
| PO4 (mg/L) | 7.77 ± 1.23 | 15.00 |
| NO3 (mg/L) | 28.00 ± 0.51 | 30.00 |
| T-N (mg/L) | 14.88 ± 3.34 | 45.00 |
| NH4 (mg/L) | 1.23 ± 0.23 | 5.00 |
| TDS (mg/L) | 902.33 ± 21.45 | 1500 |
| TSS (mg/L) | 17.71 ± 4.22 | 50.00 |
| COD (mg/L) | 53.96 ± 10.13 | 50.00 |
| BOD5(mg/L) | 8.36 ± 2.11 | 15.00 |
| pH | 7.42 | 6–9 |
* JSMO, 2018. Jordan Standards and Metrology Organization. Water-reclaimed domestic wastewater no. JS 893.
Table 3.
Selected suitable area for GWRC basins based on each criterion.
| Criterion | Suitable Area for Each Criterion (Km2) | % from the Total Area |
|---|---|---|
| Slope | 267.29 | 99.50 |
| Soil | 149.19 | 55.56 |
| Land use | 197.98 | 73.36 |
| Urban | 263.03 | 97.97 |
| Water point | 262.76 | 97.86 |
| DWWTP | 18.69 | 7.96 |
| Suitability | 0.14 | 0.05 |
Table 4.
Regression indicators between measured and simulated heads.
| Indicators | Max. Residual | Min. Residual | ME | MAE | RMSE | R2 |
|---|---|---|---|---|---|---|
| Model value (Steady State Calibration) | 1.164 | −4.683 | 0.113 | 0.530 | 0.728 | 0.994 |
| Model value (AL1043) (Transite Calibration) | 1.348 | −3.307 | −0.030 | 0.461 | 0.679 | 0.972 |
| Model value (AL1043) (Transite Validation) | 4.799 | −4.061 | 0.062 | 0.542 | 0.736 | 0.931 |
| Model value (AL2698) (Transient Calibration) | 0.765 | −0.815 | −0.003 | 0.215 | 0.463 | 0.996 |
| Model value (AL2698) (Transient Validation) | 1.234 | −1.037 | 0.008 | 0.395 | 0.629 | 0.984 |
| Ideal value | 0.0 | 0.0 | 0.0 | 0.0 | 0.0 | 1.0 |
Publisher’s Note: MDPI stays neutral with regard to jurisdictional claims in published maps and institutional affiliations. |
© 2021 by the authors. Licensee MDPI, Basel, Switzerland. This article is an open access article distributed under the terms and conditions of the Creative Commons Attribution (CC BY) license (https://creativecommons.org/licenses/by/4.0/).
Share and Cite
MDPI and ACS Style
Shawaqfah, M.; Almomani, F.; Al-Rousan, T. Potential Use of Treated Wastewater as Groundwater Recharge Using GIS Techniques and Modeling Tools in Dhuleil-Halabat Well-Field/Jordan. Water 2021, 13, 1581. https://doi.org/10.3390/w13111581
AMA Style
Shawaqfah M, Almomani F, Al-Rousan T. Potential Use of Treated Wastewater as Groundwater Recharge Using GIS Techniques and Modeling Tools in Dhuleil-Halabat Well-Field/Jordan. Water. 2021; 13(11):1581. https://doi.org/10.3390/w13111581
Chicago/Turabian StyleShawaqfah, Moayyad, Fares Almomani, and Taleb Al-Rousan. 2021. "Potential Use of Treated Wastewater as Groundwater Recharge Using GIS Techniques and Modeling Tools in Dhuleil-Halabat Well-Field/Jordan" Water 13, no. 11: 1581. https://doi.org/10.3390/w13111581
Note that from the first issue of 2016, this journal uses article numbers instead of page numbers. See further details here.