
Temperature Dependence of Freshwater Phytoplankton Growth Rates and Zooplankton Grazing Rates


Department of Environmental Sciences, College of the Coast and Environment, Louisiana State University, Baton Rouge, LA 70803, USA
*
Author to whom correspondence should be addressed.
Water 2021, 13(11), 1591; https://doi.org/10.3390/w13111591
Submission received: 22 May 2021
/
Revised: 2 June 2021
/
Accepted: 2 June 2021
/
Published: 4 June 2021
(This article belongs to the Special Issue Algae: Indices of Water and Ecological Quality)
Abstract
:Phytoplankton growth rates and zooplankton grazing rates were estimated on 16 occasions over a period of 17 months in University Lake, a highly eutrophic lake on the campus of Louisiana State University. Phytoplankton growth rates and chlorophyll a concentrations averaged 1.0 ± 0.2 d−1 and 240 ± 120 mg m−3, respectively. Chlorophyll a concentrations were at or above the inflection point of the Holling type I curve that described the relationship between zooplankton grazing rates and chlorophyll a concentrations. In most cases, it was necessary to dilute lake water by more than a factor of 4 before zooplankton grazing rates became sensitive to chlorophyll a concentrations. Chlorophyll a concentrations were positively correlated with temperature and were roughly fourfold higher at 30 °C than at 15 °C. An analysis of the temperature dependence of the growth rates and grazing rates in this study and 87 other paired estimates of limnetic phytoplankton growth rates and zooplankton grazing rates revealed virtually identical temperature dependences of growth rates and grazing rates that were very similar to the temperature dependence predicted by the metabolic theory of ecology. Phytoplankton growth rates exceeded zooplankton grazing rates by 0.13 ± 0.05 d−1 at all temperatures over a temperature range of 8.5–31.5 °C. The Q10 for both phytoplankton growth rates and zooplankton grazing rates was 1.5 over that temperature range.
1. Introduction
In 1972, Eppley published a now-classic paper [1] in which he concluded, based on analysis of an extensive dataset of growth rates of approximately 130 species or clones of freshwater and marine algae in culture, that at temperatures below 40 °C, the maximum growth rates of phytoplankton increase exponentially with temperature. Eppley [1] estimated the Q10 for the maximum growth rate to be 1.88. Subsequent studies of phytoplankton growth rates as a function of temperature by Goldman and Carpenter [2] and Bissinger et al. [3] were consistent with a Q10 of 1.88. However, Kremer et al. [4] have recently concluded, based on an extensive analysis of laboratory cultures of diatoms, dinoflagellates, green algae, and cyanobacteria, that the Q10 for phytoplankton growth is 1.53 rather than 1.88. Kremer et al.’s [4] analysis was based on application of the so-called metabolic theory of ecology (MTE), and when they reanalyzed the Eppley [1] data accounting for “functional group and mass”, they concluded that the temperature dependence implied by those data was very similar to the results of their MTE analysis.
The studies of Eppley [1], Goldman and Carpenter [2], Bissinger et al. [3], and Kremer et al. [4] were all based on studies of laboratory cultures. No similar studies of the temperature dependence of the growth rates of natural phytoplankton populations have been carried out. In the work reported here, we measured the growth rates of the phytoplankton in a shallow, naturally eutrophic lake in which the temperature varies from roughly 14 to 31 °C [5]. Because of the highly eutrophic status of the lake, we assumed that phytoplankton growth rates were not limited by nutrient concentrations, and we hypothesized that the Q10 of the growth rates would be either 1.53 or 1.88. The methodology we used allowed us to estimate both phytoplankton growth rates and zooplankton grazing rates, and we extended the analysis by including 87 paired estimates of phytoplankton growth rates and zooplankton grazing rates in other lakes.
2. Materials and Methods
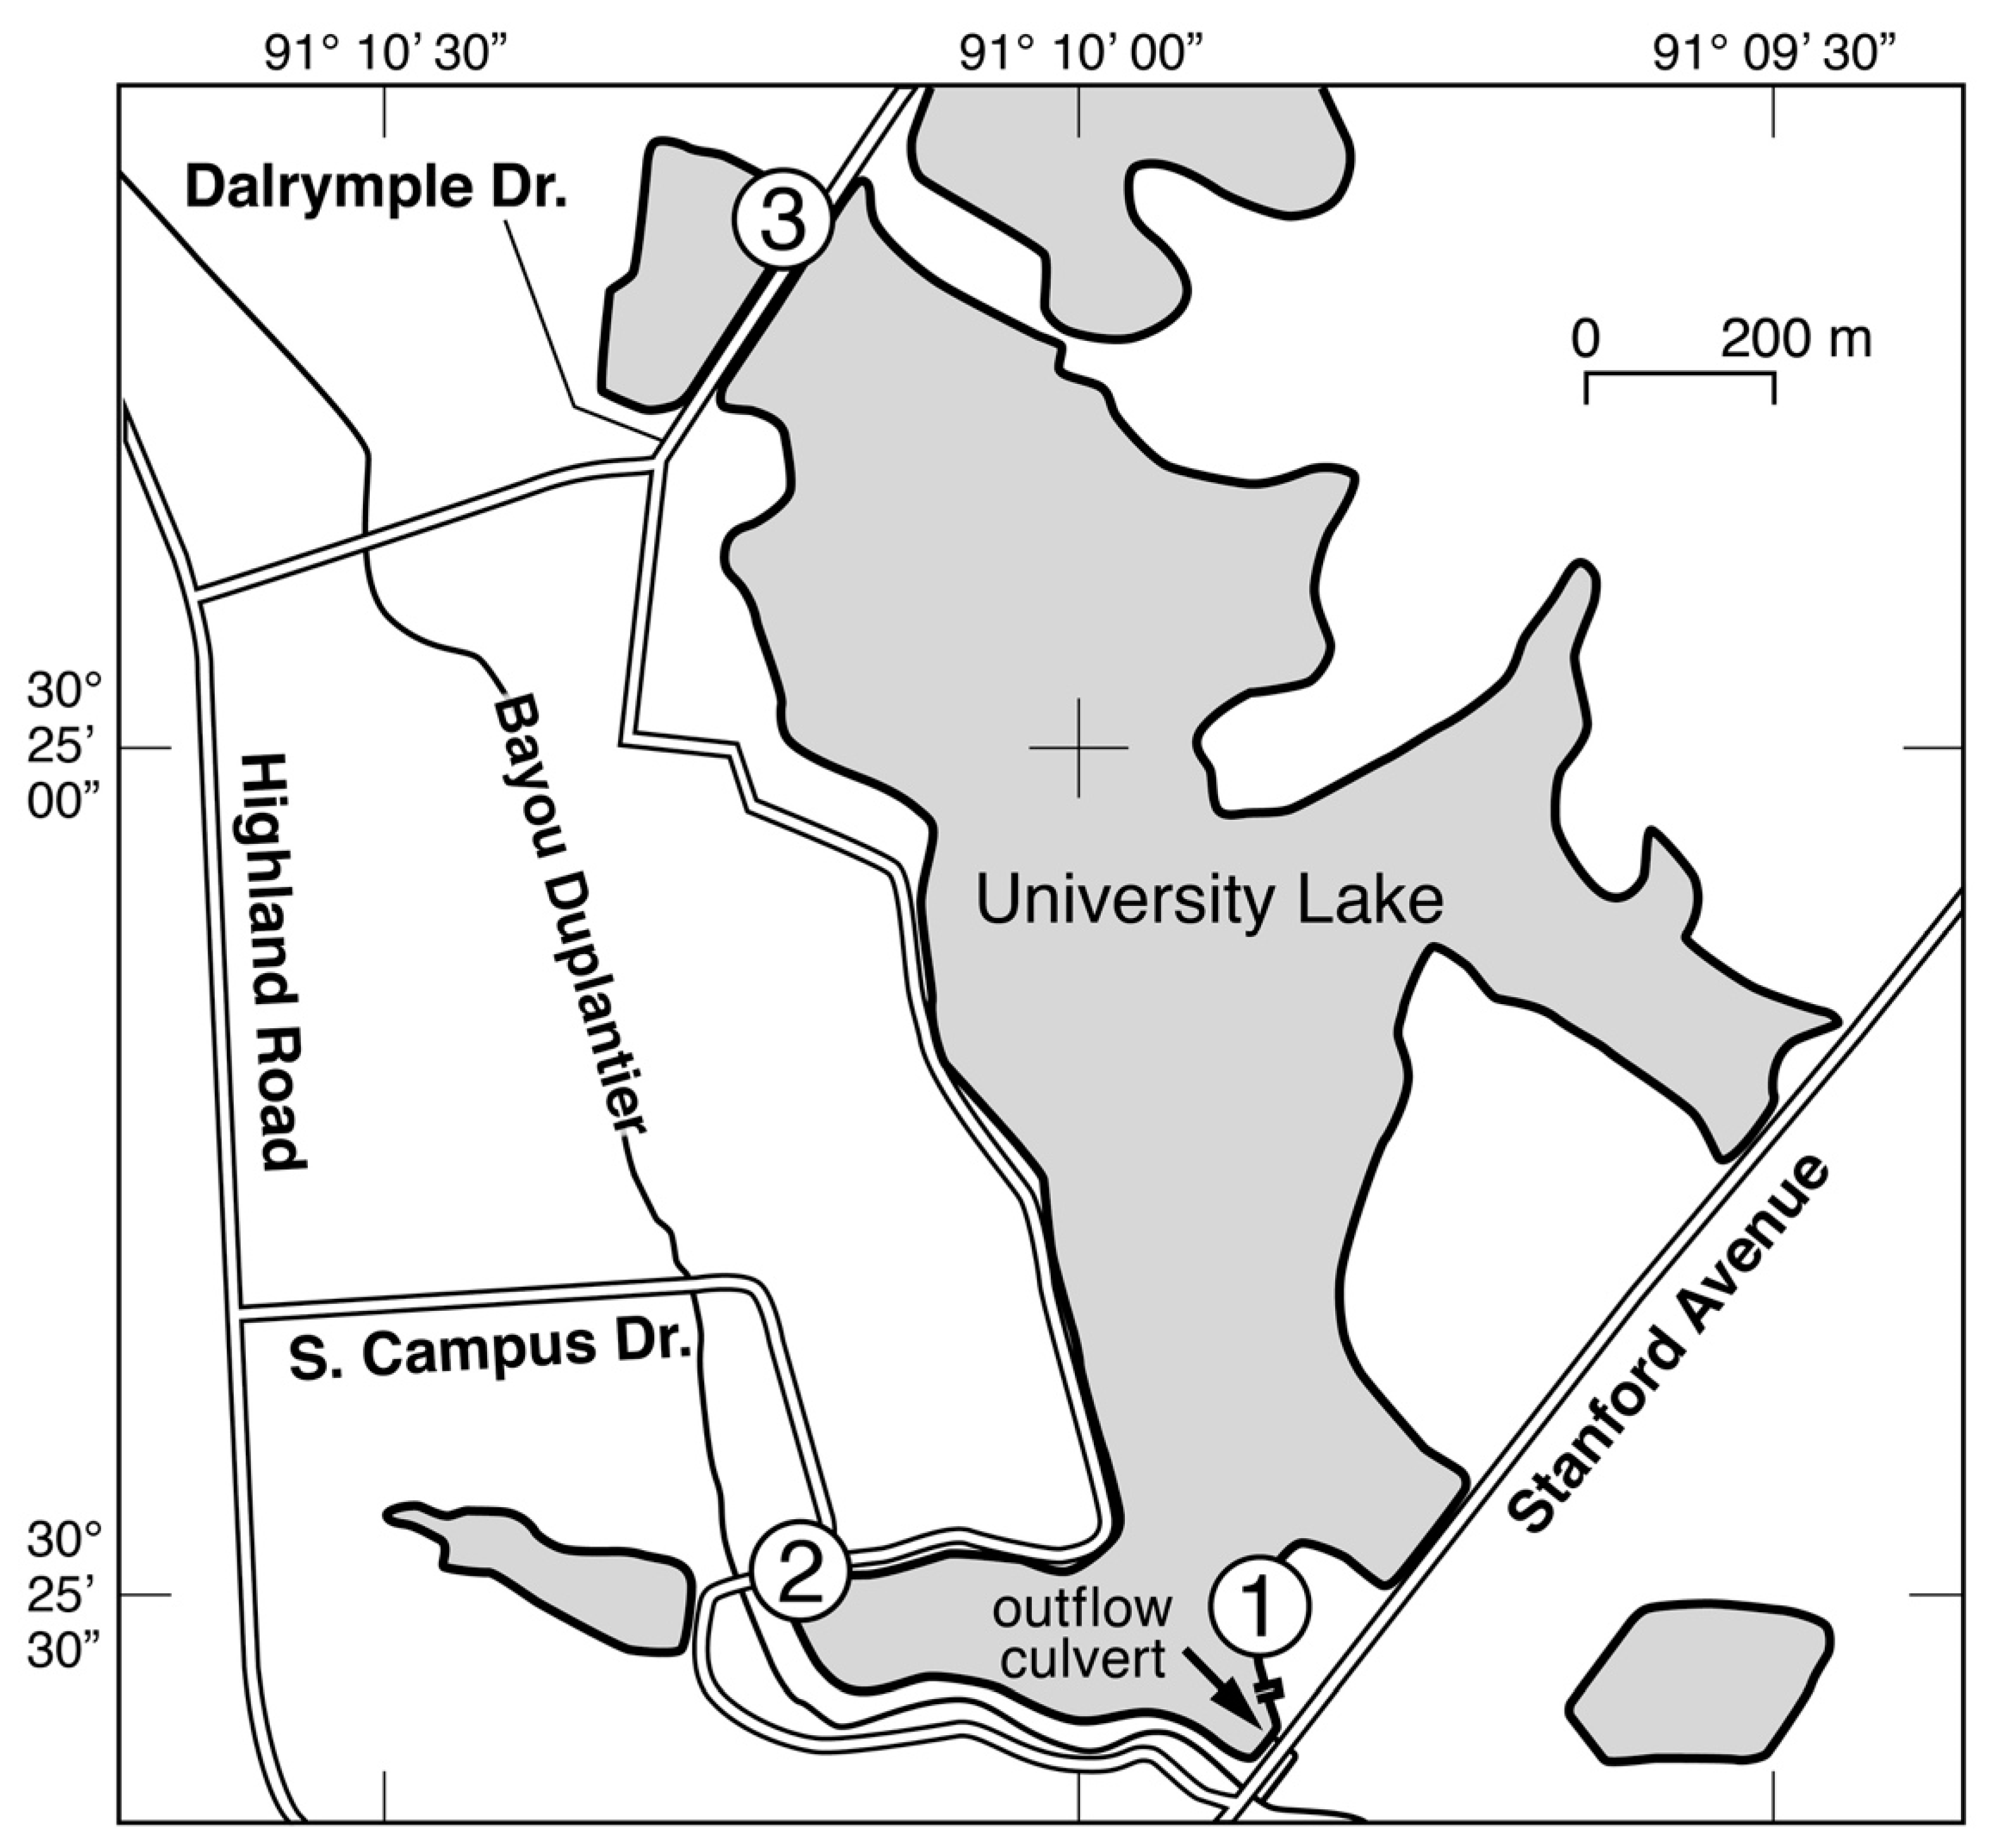
The studies were carried out in University Lake on the campus of Louisiana State University (Figure 1). The lake has an area of ~80 ha, an average depth of 0.86 m, and a hydraulic retention time of ~50 days [5]. Concentrations of ammonium, nitrate, phosphate, and chlorophyll a (chl a) in the lake average ~4 µM, 0.2 µM, 0.5 µM, and 75 µg L−1, respectively. Diagnostic pigment analyses have indicated that more than 80% of the chl a in the lake is accounted for by Chlorophyceae and Cyanophyceae [5].
We used the dilution technique originally developed by Landry and Hassett [6] to estimate phytoplankton growth rates and zooplankton grazing rates in the lake. The technique has traditionally assumed that zooplankton grazing rates are directly proportional to the concentration of phytoplankton, and based on that assumption, dilution of a natural sample of water by filtrate of that same water would be expected to reduce zooplankton grazing rates in a proportional manner. A graph of the net exponential rate of increase of the phytoplankton (i.e.,
) versus the fraction (f) of unfiltered water should therefore be linear with a value equal to the phytoplankton growth rate (μ) at f = 0 and a negative slope, the magnitude of which is the zooplankton grazing rate (g) in the undiluted water. Both μ and g have units of inverse time.
Some dilution experiments, however, have produced relationships between the net exponential rate of increase of phytoplankton and f that are distinctly nonlinear [7,8,9], and in these cases, nonlinear models of the relationship between per capita zooplankton grazing rates and phytoplankton concentrations, such as Holling type I or II models [10,11], have been used [7,12]. The simplest nonlinear formulation is a piecewise linear or Holling type I function. In that case, the zooplankton per capita grazing rate is a linear function of the phytoplankton concentration, in accordance with Landry and Hassett [6], for phytoplankton concentrations below the breakpoint in the piecewise linear model. As a result of the hypereutrophic condition of University Lake, we hypothesized that dilution experiments would reveal that the relationship between phytoplankton concentrations and zooplankton grazing rates in the lake was highly nonlinear.
A total of 16 dilution experiments were conducted with water from University Lake from 15 October 2018 to 16 March 2020. One liter of water was collected by submerging a one-liter, pre-cleaned polyethylene bottle just below the surface of the water adjacent to a dock near the outlet from the lake to Bayou Duplantier (Figure 1). The temperature of the water was measured at the time of sampling to the nearest 0.1 °C with a thermometer that had been calibrated at 0 °C and 100 °C. The sample bottle was returned to the laboratory within 10 minutes for processing.
In the laboratory, triplicate 10-mL samples for initial chl a analysis were filtered onto 25 mm Whatman GF/F filters with a nominal pore size of 0.7 µm. The filters were wrapped in aluminum foil and stored in a freezer for subsequent analysis.
For dilution experiments, 450 mL of whole lake water was filtered through a glass fiber filter with a nominal porosity of 1.6 µm at a vacuum pressure of 100–200 mm Hg. Concentrations of chlorophyll a (chl a) in the filtrate were not significantly different from zero (t-test, p = 0.29). The filtrate was combined with unfiltered lake water via serial dilutions. Triplicate 25-mL volumes of unfiltered lake water and lake water diluted by 2, 4, 8, 16, 32, and on four occasions 64-fold were prepared for incubation and transferred to 60 mL borosilicate glass incubation bottles. Because chl a concentrations in the lake were never less than 40 mg L−1, the chl a concentrations in the bottles diluted 32-fold were at least 1.25 mg L−1 and were therefore at least ~15 times the chl a concentrations in the surface waters of an oligotrophic ocean site such as Station ALOHA (https://hahana.soest.hawaii.edu/hot/hot_jgofs.html; accessed 2 June 2021). Thus, we felt that the 60-mL bottles contained a representative sample of the phytoplankton in the lake. However, we cannot rule out the possibility that the abundance of uncommon organisms (e.g., large grazers) in the incubation bottles was not representative of their abundance in the lake. The 18 bottles were placed end-to-end in three rows of a temperature-controlled water bath mounted on a rocker table so that the water in each bottle could slosh back and forth as the table rocked. One of the triplicate bottles corresponding to each of the six treatments was placed in each of the three rows. The temperature of the water bath was identical to the temperature of the lake water at the time the sample was collected. The cultures were illuminated on a light:dark cycle of 14 hours of light followed by 10 hours of dark. The irradiance on the bottles varied between 38 (bottles furthest from the light bank) to 182 (bottles closest to the light bank) µmol photons m−2 s−1 of visible light (400–700 nm wavelength) from a bank of cool-white fluorescent lamps. Based on the average chl a concentration in the lake (~240 mg m−3, Table A1 in Appendix A) and a mean spectral extinction coefficient of 0.014 m2 mg−1 chl a [13], the ratio of these irradiances corresponded to a depth interval of about half the mean depth of University Lake. The averages of the chl a concentrations in the three incubation bottles corresponding to each treatment were used to estimate phytoplankton growth rates and zooplankton grazing rates.
The incubations were terminated after 24 h by filtering the contents of each bottle through 0.7-µm Whatman GF/F filters. The filters, including the three taken for the initial chl a concentration, were then extracted in methanol overnight. Filter debris was removed from the extracts via filtration (Whatman GF/F), and the absorbances of the extracts were measured at 664 nm (chl a) and 750 nm (background) with a Cary-50 UV-Visible spectrophotometer (Agilent Technologies, Santa Clara, CA, USA). Paired comparisons in which filter debris was removed via filtration versus grinding with a mortar and pestle followed by centrifugation produced chl a concentrations that were not significantly different (p = 0.55). The concentrations of chl a were determined assuming a chl a specific absorption coefficient at 664 nm of 74.75 g−1 cm−1 [14]. The chl a concentrations in the three replicates of each treatment were averaged, and the ratio of the final to the initial chl a concentration in each treatment was the criterion used to calculate growth rates and grazing rates.
In none of the 16 dilution experiments was the logarithm of the ratio of the final to initial chl a concentration a linear function of the fraction of unfiltered lake water. In most cases, it was necessary to dilute the water by more than a factor of 4 before the ratio began to change systematically. We tried fitting Holling type I (piecewise linear) and Holling type II (rectangular hyperbola) grazing rate functions to the data and found that the Holling type I consistently gave a better fit to the data. Because the grazing rate of the zooplankton depended on the phytoplankton concentration, we integrated the differential equations describing the rate of change of the chl a concentrations with the Holling type I model in one-hour time steps from time 0 to time 24 hours using a simple Euler integration as follows:
where D is the dilution factor (i.e., 1, 2, 4, 8, 16, 32, or 64), Gmax is the maximum grazing rate of the zooplankton in the absence of dilution (µg chl a L−1 h−1), K is the chl a concentration at which the grazing rate equals one-half Gmax/D (µg chl a L−1), µ is the phytoplankton growth rate (h−1), P0 is the chl a concentration at the start of the one-hour time interval (µg chl a L−1), and Δt equals 1 hr. Values of µ, Gmax, and K were chosen to give the best fit in a least-squares sense to the ratios of the final to initial chl a concentrations.
If P0 > 2K, P = P0 + (µ × P0 − Gmax/D)Δt
If P0 < 2K, P = P0 + [µ × P0 − Gmax/D × P0/(2K)]Δt
3. Results
Figure 2 shows the final/initial ratios of chl a concentrations as a function of the fraction of diluted lake water for the experiment conducted on 6–7 November 2018. Note that it was necessary to dilute the lake water in this case by a factor of 16 before chl a concentrations started to increase. This result was qualitatively typical of the 16 dilution experiments (Table A1, Appendix A). The mean and median of the coefficients of determination (R2) between the experimental final/initial chl a ratios and those predicted by integrating the Holling type I model were 0.89 and 0.90, respectively. The temperature of the water was positively correlated with both chl a concentrations (Spearman r = 0.49, p = 0.05) and K values (Spearman r = 0.54, p = 0.03). Net phytoplankton growth rates (i.e., natural logarithms of final/initial chl a concentrations) in undiluted lake water were not significantly different from zero (t-test, p = 0.10).
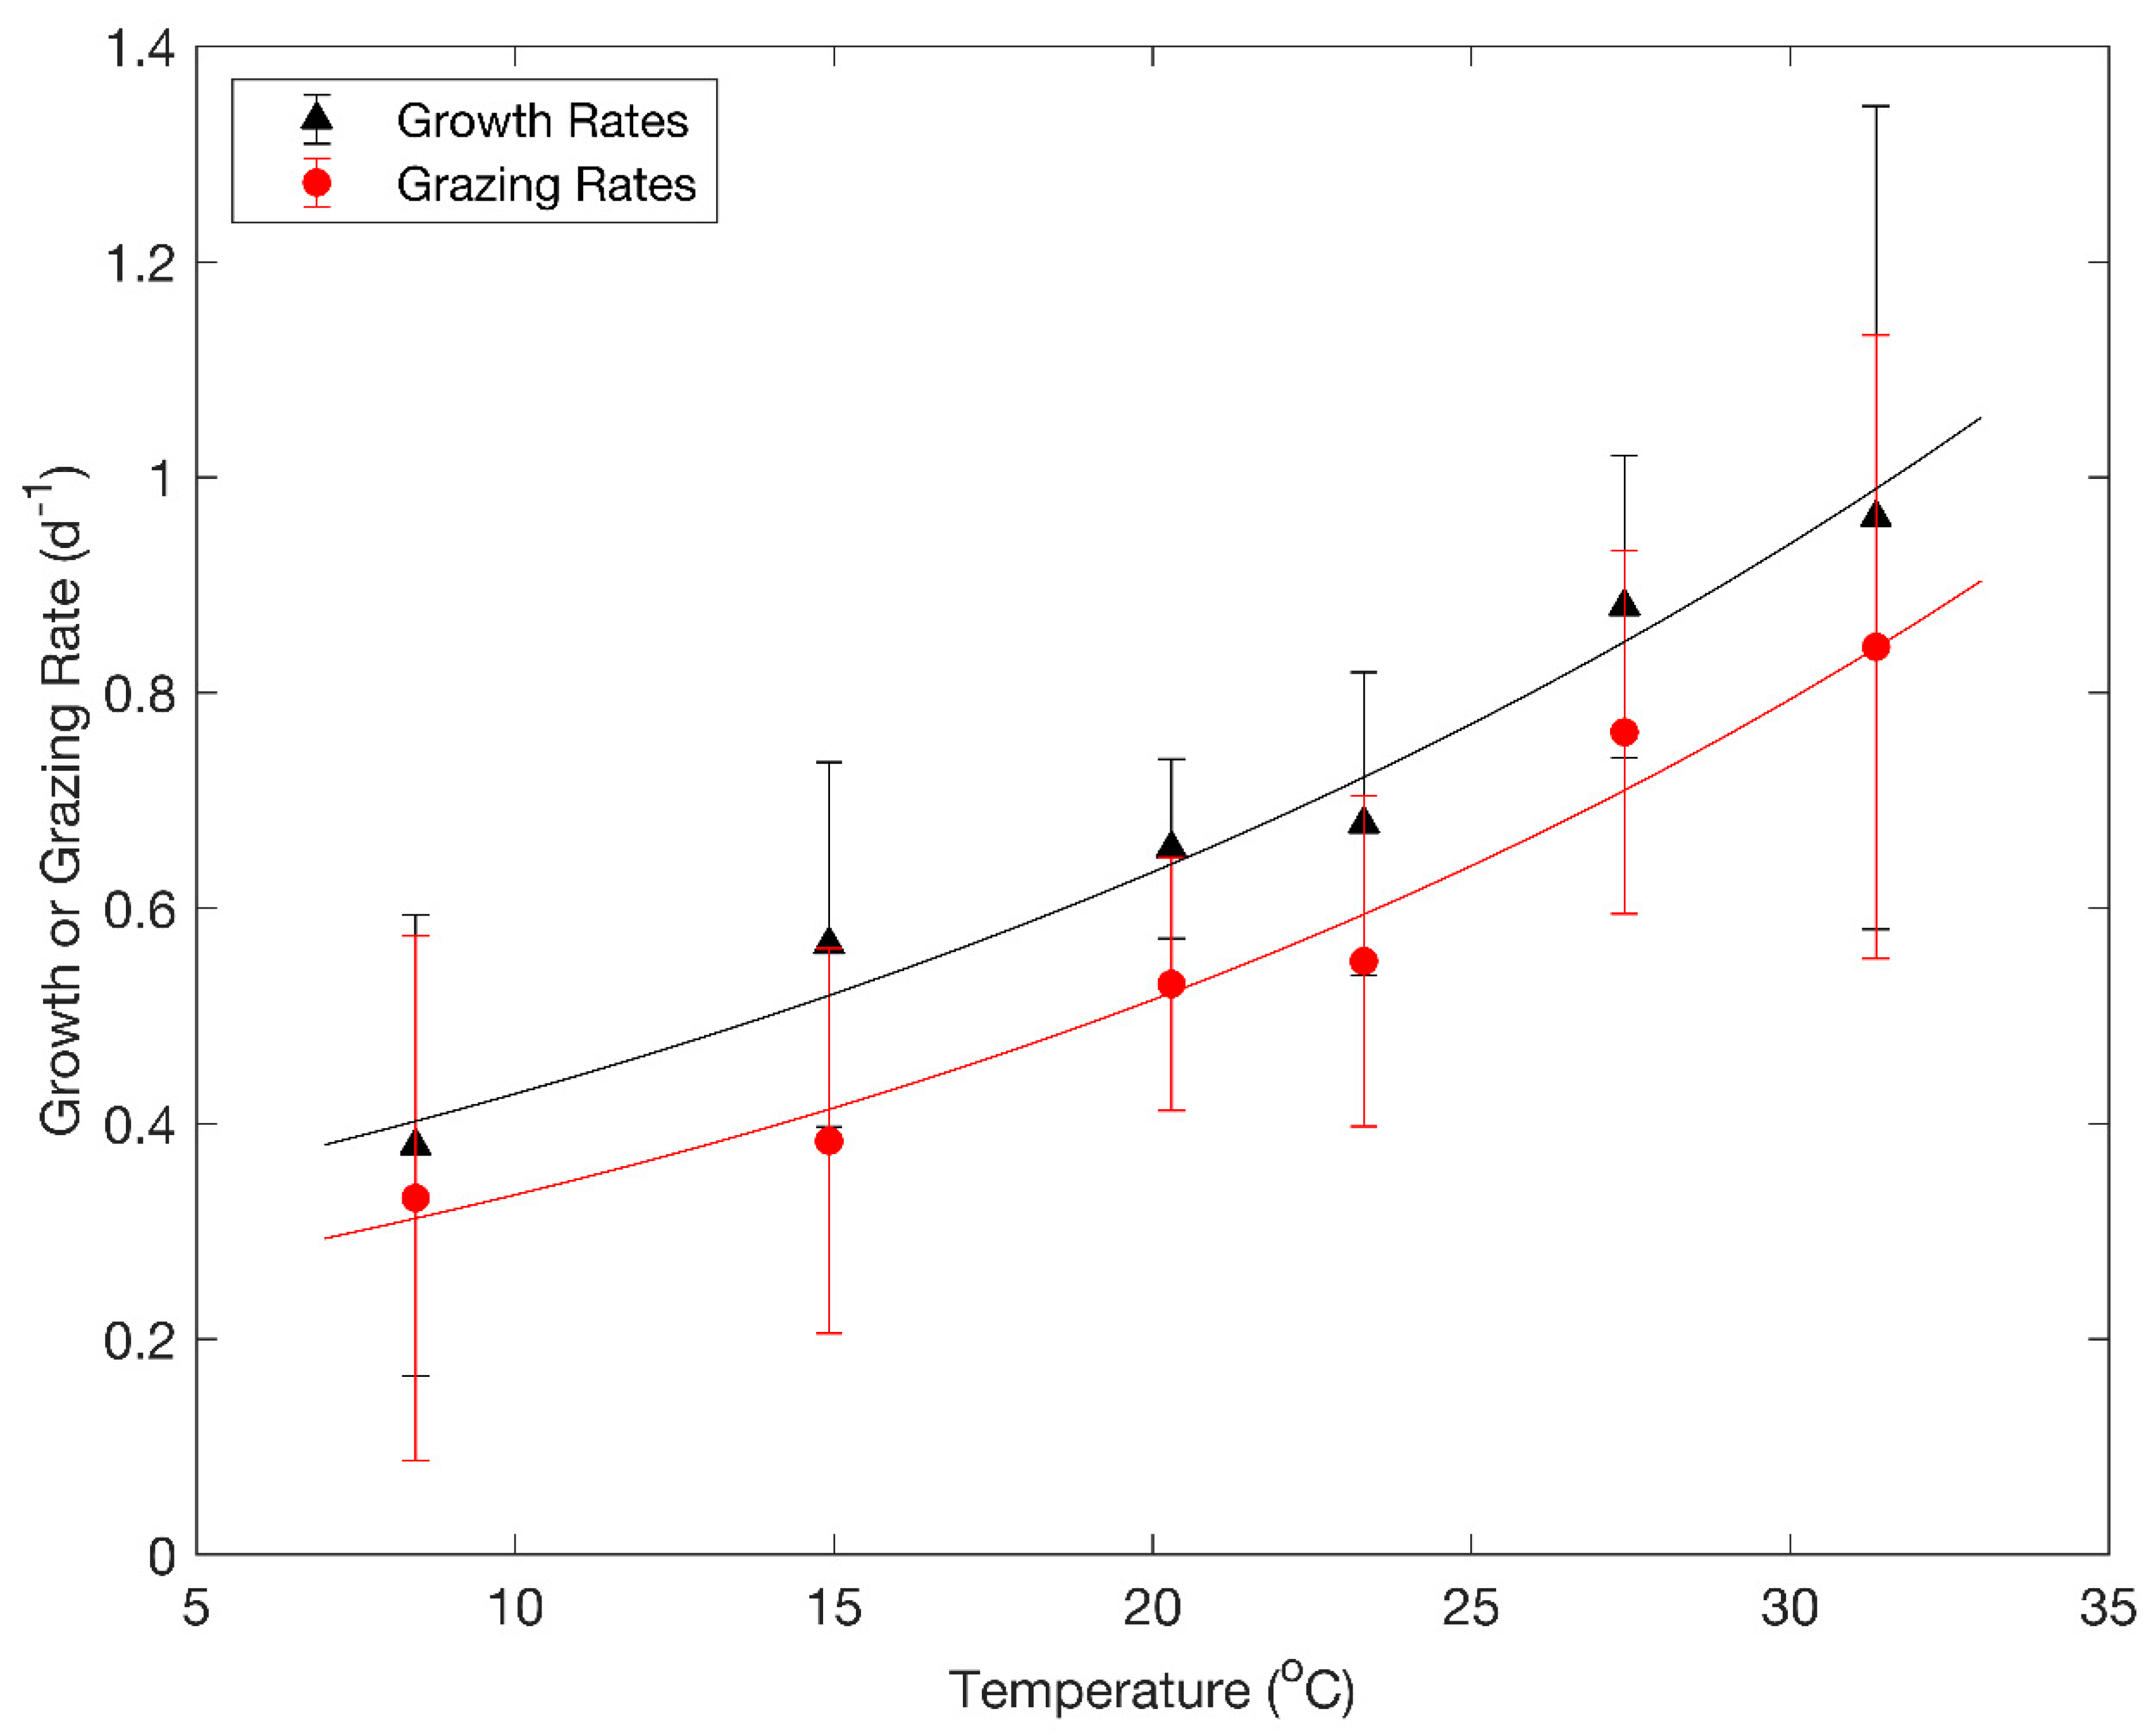
To explore the temperature dependence of phytoplankton growth rates and zooplankton grazing rates in limnetic systems, we combined the results of our 16 experiments with 87 paired estimates of phytoplankton growth rates and zooplankton grazing rates reported by Boyer et al. [15], Lavrentyev et al. [16], Tadonleke and Sime-Ngando [17], Adrian et al. [18], Griniene et al. [19], Staniewski et al. [20], Sterner et al. [21], Tijdens et al. [22], Twiss et al. [23], Weisse et al. [24], Davis et al. [25], and Collos et al. [26]. The principal difference between these earlier studies and ours was that the biomass of phytoplankton in University Lake was far above the range of concentrations within which the relationship between zooplankton grazing and phytoplankton biomass is linear. We binned the data into roughly equal temperature intervals (Figure 3) and found that there were highly significant correlations between the mean temperatures and mean growth rates and between the mean temperatures and mean grazing rates (Figure 3, Spearman r = 1.0, p = 0.0028 in both cases).
A nonparametric sign test of the 87 + 16 = 103 paired µ and g rates revealed that phytoplankton growth rates consistently exceeded zooplankton grazing rates (p = 0.00145). The average difference was 0.13 ± 0.05 d−1. Because phytoplankton can be removed from a system by mechanisms other than zooplankton grazing (e.g., viral lysis, sinking, apoptosis), it seems logical that phytoplankton growth rates would tend to exceed zooplankton grazing rates if overall gains and losses are in balance.
We fit ordinary least squares regression lines to the logarithms of the mean growth rates and mean grazing rates in Figure 3. The slopes of the regression lines were 0.0393 and 0.0433 °C−1. Neither slope was significantly different from the slope of 0.0425 °C−1 associated with a Q10 of 1.53 (t-test, p<0.05), but both slopes were significantly different from the slope of 0.063 °C−1 associated with a Q10 of 1.88 (t-test, p > 0.90). The estimated Q10 values for the growth rates and grazing rates were 1.48 and 1.54, respectively.
4. Discussion
The temperature dependence of phytoplankton growth rates and zooplankton grazing rates are obviously of interest with respect to the anticipated effects of global warming. Predictions of the effects of temperature on the growth rates of phytoplankton communities based on studies of unialgal cultures are confounded by the fact that there are systematic differences in the growth rates of phytoplankton cells as a function of cell size and between functional groups. Within functional groups, large cells tend to grow more slowly than small cells [27,28,29,30], and between functional groups, the order of growth rates is green algae > diatoms > cyanobacteria > dinoflagellates [4]. Kremer et al. [4] have argued that when allowance is made for differences associated with functional groups and cell size, reassessment of the growth rate data analyzed by Eppley [1] gives an exponent of ~0.048 °C−1 rather than 0.063 °C−1. Metabolic rates are assumed to be more temperature-sensitive for heterotrophs than autotrophs because the activation energy is greater for respiration (0.65 ev) than for photosynthesis (0.32 ev) [31,32], and this expectation has been supported by studies of natural plankton populations [33]. It might therefore be expected that zooplankton grazing rates would be more temperature-sensitive than phytoplankton growth rates, but our analysis indicated that the temperature sensitivities of the two were very similar (Figure 3). A logical explanation for this similarity is that over a timeframe on the order of several weeks, the gains and losses of phytoplankton biomass must approximately balance. The grazing rate of zooplankton estimated with the dilution method is the product of the grazing rate per unit biomass of the zooplankton and the biomass of the zooplankton. The former may be more temperature-sensitive than the growth rate of the phytoplankton, but that temperature sensitivity can be tempered by compensating changes of zooplankton biomass. Our analysis (Figure 3) indicates that the resultant temperature sensitivities of limnetic zooplankton grazing rates and the growth rates of natural communities of phytoplankton are very similar and in accordance with expectations based on the metabolic theory of ecology.
Numerous models of primary production in aquatic systems have assumed a Q10 of 1.88 for phytoplankton growth rates in accordance with Eppley [1] to parameterize satellite observation algorithms and predict the responses of aquatic systems to climate change [34,35,36,37,38,39]. The results of this study of natural freshwater phytoplankton communities and the extensive analysis of studies of unialgal cultures by Kremer et al. [4] suggest that a Q10 of 1.88 is probably too high for phytoplankton growth rates; a Q10 of 1.53 is a more realistic estimate.
Author Contributions
Conceptualization, E.L.; methodology, E.L.; validation, E.L. and J.P.; formal analysis, J.P.; investigation, J.P.; resources, E.L.; data curation, J.P.; writing—original draft preparation, J.P.; writing—review and editing, E.L.; supervision, E.L.; project administration, E.L.; funding acquisition, E.L. All authors have read and agreed to the published version of the manuscript.
Funding
This research received no external funding.
Data Availability Statement
Conflicts of Interest
The authors declare no conflict of interest.
Appendix A

Table A1.
Summary of results of 16 dilution experiments conducted in University Lake.
| Date | Initial Chlorophyll (mg L−1) | Temp. (°C) | μ (d−1) 1 | g (d−1) 2 | Gmax (mg chl a L−1 d−1) 3 | K (mg chl a L−1) 4 | R2 5 |
|---|---|---|---|---|---|---|---|
| 10/15/18 | 372 | 26.2 | 0.95 | 1.10 | 408 | 21 | 0.895 |
| 10/26/18 | 156 | 20.3 | 2.1 | 2.00 | 312 | 8 | 0.876 |
| 11/6/18 | 148 | 22.2 | 2.65 | 2.59 | 384 | 3 | 0.967 |
| 11/12/18 | 137 | 16.8 | 0.75 | 0.70 | 96 | 1.5 | 0.839 |
| 11/18/18 | 96.7 | 11 | 1.5 | 1.49 | 144 | 1 | 0.915 |
| 12/3/18 | 87 | 14 | 0.2 | 0.28 | 24 | 5 | 0.722 |
| 1/17/19 | 65.5 | 12.8 | 2.6 | 2.56 | 168 | 4.5 | 0.958 |
| 2/22/19 | 40.1 | 20.3 | 0.6 | 0.60 | 24 | 1 | 0.946 |
| 4/26/19 | 2012 | 23.6 | 0.35 | 0.62 | 1248 | 400 | 0.834 |
| 6/27/19 | 232 | 30.5 | 0.35 | 0.31 | 72 | 102 | 0.858 |
| 9/10/19 | 376 | 33 | 0.3 | 0.38 | 144 | 67 | 0.966 |
| 9/19/19 | 337 | 30.3 | 1.35 | 1.42 | 480 | 69.5 | 0.999 |
| 9/22/19 | 114 | 31.6 | 1.85 | 1.26 | 144 | 9.5 | 0.989 |
| 11/12/19 | 177 | 11 | 0.4 | 0.54 | 96 | 30.5 | 1.0 |
| 2/26/20 | 56.1 | 15.7 | 0.4 | 0.43 | 24 | 8.5 | 0.63 |
| 3/16/20 | 60.7 | 24.2 | 0.2 | 0.40 | 24 | 4.5 | 0.86 |
1 phytoplankton growth rate. 2 zooplankton grazing rate in undiluted water (= Gmax ÷ initial chlorophyll concentration). 3 zooplankton grazing rate when chl a concentration exceeds 2K in undiluted water. 4 chlorophyll concentration when zooplankton grazing rate is half Gmax/D. 5 fraction of variance of final/initial chl a concentrations explained by model.
Table A2.
Summary of 87 paired phytoplankton growth rates and zooplankton grazing rates that were combined with results of this study (Table A1) to produce Figure 3.
| Temperature (°C) | Phytoplankton Growth Rate (d−1) | Zooplankton Grazing Rate (d−1) | Reference |
|---|---|---|---|
| 22 | 1.23 | 1.79 | [18] |
| 9 | 1.28 | 1.62 | [18] |
| 11 | 0.7 | 0.1 | [15] |
| 11 | 0.4 | −0.3 | [15] |
| 10 | 0.9 | 0.2 | [15] |
| 19 | 1.2 | 0.3 | [15] |
| 16 | 0 | −0.1 | [15] |
| 15 | −1.3 | −1.5 | [15] |
| 16 | −0.7 | −1.3 | [15] |
| 21 | −0.2 | −1.1 | [15] |
| 20 | 0.8 | 0.4 | [15] |
| 22 | 0.9 | 0 | [15] |
| 25 | 0.4 | 0.3 | [15] |
| 22 | 1 | 0.5 | [15] |
| 20 | 1.1 | 0.8 | [15] |
| 16 | 0.9 | 0.6 | [15] |
| 13 | 0.9 | 0.7 | [15] |
| 6 | −0.8 | −0.9 | [15] |
| 18.6 | 1.33 | −1.83 | [19] |
| 18.6 | 0.19 | −0.35 | [19] |
| 21 | −0.1 | 0.03 | [16] |
| 21 | 0 | 0 | [16] |
| 17 | −0.05 | 0.3 | [16] |
| 21 | 0.34 | 0.07 | [16] |
| 21 | 0.96 | 1.34 | [16] |
| 17 | 0.87 | 0.51 | [16] |
| 21 | 0.26 | 0.21 | [16] |
| 21 | 0.1 | 0.17 | [16] |
| 17 | 1.42 | 0.27 | [16] |
| 21 | 0.43 | 0.33 | [16] |
| 21 | 0.16 | 0.4 | [16] |
| 17 | 0.6 | 0 | [16] |
| 21 | 0.32 | 0 | [16] |
| 21 | 0.16 | 0.11 | [16] |
| 17 | 0.91 | 0.27 | [16] |
| 21 | 0.5 | 0.25 | [16] |
| 21 | 0.18 | 0.1 | [16] |
| 17 | 1.34 | 0.69 | [16] |
| 21 | 0.51 | 0.53 | [16] |
| 21 | 0.32 | 0.45 | [16] |
| 17 | 0.29 | 1.13 | [16] |
| 19.2 | 0.19 | 0.32 | [20] |
| 19.2 | 1.87 | 2.79 | [20] |
| 19.2 | 1.51 | 1.65 | [20] |
| 19.2 | 1.7 | 1.01 | [20] |
| 15 | 0.09 | 0.07 | [21] |
| 20 | 0.37 | 0.26 | [21] |
| 20.2 | 0.78 | 0.87 | [21] |
| 15 | 0.24 | 1.01 | [21] |
| 20 | 1.22 | 1.34 | [21] |
| 20.2 | 1.66 | 1.92 | [21] |
| 20.7 | 0.38 | 0.27 | [17] |
| 18.6 | 0.73 | 0.62 | [17] |
| 22.1 | 1.15 | 0.66 | [17] |
| 21.4 | 0.69 | 0.42 | [17] |
| 23.2 | 0.43 | 0.21 | [17] |
| 24 | 0.37 | 0.28 | [17] |
| 21.3 | 0.52 | 0.42 | [17] |
| 19.6 | 0.23 | 0.16 | [17] |
| 20.7 | 0.5 | 0.04 | [17] |
| 18.6 | 0.34 | 0.06 | [17] |
| 22.1 | 0.19 | 0.02 | [17] |
| 21.4 | 0.3 | 0.04 | [17] |
| 23.2 | 0.25 | 0.059 | [17] |
| 24 | 0.18 | 0.07 | [17] |
| 21.3 | 0.44 | 0.04 | [17] |
| 19.6 | 0.23 | 0.03 | [17] |
| 18 | 0.58 | 0.52 | [22] |
| 18 | 2.32 | 2.29 | [22] |
| 21 | 1.07 | 1.93 | [23] |
| 21 | 0.74 | 0.88 | [23] |
| 21 | 0.33 | 0.28 | [23] |
| 21 | 0.5 | 1.6 | [23] |
| 21 | 0.31 | 0.67 | [23] |
| 21 | 0.68 | 0.18 | [23] |
| 8.5 | 0.312 | 0.264 | [24] |
| 8.5 | 0.264 | 0.144 | [24] |
| 8.5 | 0.144 | 0.264 | [24] |
| 8.5 | 0.48 | 0.528 | [24] |
| 8.5 | 0.456 | 0.528 | [24] |
| 28 | 0.61 | 0.58 | [26] |
| 28 | 1.08 | 0.61 | [26] |
| 24 | 0.25 | 0.37 | [25] |
| 24 | 0.47 | 0.68 | [25] |
| 24 | 0.8 | 0.3 | [25] |
| 24 | 0.74 | 0.69 | [25] |
| 24 | 0.65 | 0.38 | [25] |
References
- Eppley, R.W. Temperature and phytoplankton growth in the sea. Fish. Bull. 1972, 70, 1063–1085. [Google Scholar]
- Goldman, J.C.; Carpenter, E.J. Kinetic approach to effect of temperature on algal growth. Limnol. Oceanogr. 1974, 19, 756–766. [Google Scholar] [CrossRef]
- Bissinger, J.E.; Montagnes, D.J.S.; Harples, J.; Atkinson, D. Predicting marine phytoplankton maximum growth rates from temperature: Improving on the Eppley curve using quantile regression. Limnol. Oceanogr. 2008, 53, 487–493. [Google Scholar] [CrossRef]
- Kremer, C.T.; Thomas, M.K.; Litchman, E. Temperature- and size-scaling of phytoplankton population growth rates: Reconciling the Eppley curve and the metabolic theory of ecology. Limnol. Oceanogr. 2017, 62, 1658–1670. [Google Scholar] [CrossRef]
- Norris, B.; Laws, E.A. Nutrients and Phytoplankton in a Shallow, Hypereutrophic Urban Lake: Prospects for Restoration. Water 2017, 9, 11. [Google Scholar]
- Landry, M.R.; Hassett, R.P. Estimating the grazing impact of marine micro-zooplankton. Mar. Biol. 1982, 67, 283–288. [Google Scholar] [CrossRef]
- Evans, G.T.; Paranjape, M.A. Precision of estimates of phytoplankton growth and microzooplankton grazing when the functional-response of grazers may be nonlinear. Mar. Ecol. Prog. Ser. 1992, 80, 285–290. [Google Scholar] [CrossRef]
- Gallegos, C.L. Microzooplankton grazing on phytoplankton in the Rhode River, Maryland - nonlinear feeding kinetics. Mar. Ecol. Prog. Ser. 1989, 57, 23–33. [Google Scholar] [CrossRef]
- Moigis, A.G. The clearance rate of microzooplankton as the key element for describing estimated non-linear dilution plots demonstrated by a model. Mar. Biol. 2006, 149, 743–762. [Google Scholar] [CrossRef]
- Holling, C.S. The components of predation as revealed by a study of small-mammal predation of the European pine sawfly. Can. Entomol. 1959, 91, 293–320. [Google Scholar] [CrossRef]
- Holling, C.S. Some characteristics of simple types of predation and parasitism. Can. Entomol. 1959, 91, 385–398. [Google Scholar] [CrossRef]
- Chen, B.; Laws, E.A.; Liu, H.; Huang, B. Estimating microzooplankton grazing half-saturatiion constants from dilution experiments with nonlinear feeding kinetics. Limnol. Oceanogr. 2014, 59, 639–644. [Google Scholar] [CrossRef] [Green Version]
- Atlas, D.; Bannister, T.T. Dependence of mean spectral extinction coefficient of phytoplankton on depth, water color, and species. Limnol. Oceanogr. 1980, 25, 157–159. [Google Scholar] [CrossRef]
- Holm-Hansen, O.; Riemann, B. Chlorophyll a determination: Improvements in methodology. Oikos 1978, 30, 438–447. [Google Scholar] [CrossRef]
- Boyer, J.; Rollwagen-Bollens, G.; Bollens, S.M. Microzooplankton grazing before, during and after a cyanobacterial bloom in Vancouver Lake, Washington, USA. Aquat. Microb. Ecol. 2011, 64, 163–174. [Google Scholar] [CrossRef] [Green Version]
- Lavrentyev, P.J.; Vanderploeg, H.A.; Franzé, G.; Chacin, D.H.; Liebig, J.R.; Johengen, T.H. Microzooplankton distribution, dynamics, and trophic interactions relative to phytoplankton and quagga mussels in Saginaw Bay, Lake Huron. J.Great Lakes Res. 2014, 40, 95–105. [Google Scholar] [CrossRef]
- Tadonleke, R.D.; Sime-Ngando, T. Rates of growth and microbial grazing mortality of phytoplankton in a recent artificial lake. Aquat. Microb. Ecol. 2000, 22, 301–313. [Google Scholar] [CrossRef]
- Adrian, R.; Wickham, S.A.; Butler, N.M. Trophic interactions between zooplankton and the microbial community in contrasting food webs: The epilimnion and deep chlorophyll maximum of a mesotrophic lake. Aquat. Microb. Ecol. 2001, 24, 83–97. [Google Scholar] [CrossRef] [Green Version]
- Griniene, E.; Sulcius, S.; Kuosa, H. Size-selective microzooplankton grazing on the phytoplankton in the Curonian Lagoon (SE Baltic Sea). Oceanologia 2016, 58, 292–301. [Google Scholar] [CrossRef] [Green Version]
- Staniewski, M.A.; Short, C.M.; Short, S.M. Contrasting Community versus Population-Based Estimates of Grazing and Virus-Induced Mortality of Phytoplankton. Microb. Ecol. 2012, 64, 25–38. [Google Scholar] [CrossRef]
- Sterner, R.W.; Chrzanowski, T.H.; Elser, J.J.; George, N.B. Sources of nitrogen and phosphorus supporting the growth of bacterioplankton and phytoplankton in an oligotrophic Canadian shield lake. Limnol. Oceanogr. 1995, 40, 242–249. [Google Scholar] [CrossRef]
- Tijdens, M.; Van de Waal, D.B.; Slovackova, H.; Hoogveld, H.L.; Gons, H.J. Estimates of bacterial and phytoplankton mortality caused by viral lysis and microzooplankton grazing in a shallow eutrophic lake. Freshw. Biol. 2008, 53, 1126–1141. [Google Scholar] [CrossRef]
- Twiss, M.R.; Campbell, P.G.C.; Auclair, J.C. Regeneration, recycling, and trophic transfer of trace metals by microbial food-web organisms in the pelagic surface waters of Lake Erie. Limnol. Oceanogr. 1996, 41, 1425–1437. [Google Scholar] [CrossRef]
- Weisse, T.; Müller, H.; Pinto-Coelho, R.M.; Schweizer, A.; Springmann, D.; Baldringer, G. Response of the microbial loop to the phytoplankton spring bloom in a large prealpine lake. Limnol. Oceanogr. 1990, 35, 781–794. [Google Scholar] [CrossRef] [Green Version]
- Davis, T.W.; Koch, F.; Marcoval, M.A.; Wilhelm, S.W.; Gobler, C.J. Mesozooplankton and microzooplankton grazing during cyanobacterial blooms in the western basin of Lake Erie. Harmful Algae 2012, 15, 26–35. [Google Scholar] [CrossRef]
- Collos, Y.; Vaquer, A.; Johnston, A.M.; Pons, V.; Bibent, B.; Richard, S. Carbon fixation, ammonium uptake and regeneration in an equatorial lake: Biological versus physical control. J. Plankton Res. 2001, 23, 263–270. [Google Scholar] [CrossRef]
- Chisholm, S.W. Phytoplankton size. In Primary Productivity and Biogeochemical Cycles in the Sea; Falkowski, P.G., Woodhead, A.D., Eds.; Plenum Press: New York, NY, USA, 1992; pp. 213–237. [Google Scholar]
- Laws, E.A. The importance of respiration losses in controlling the size distribution of marine phytoplankton. Ecology 1975, 56, 419–426. [Google Scholar] [CrossRef]
- Maranon, E. Inter-specific scaling of phytoplankton production and cell size in the field. J. Plankton Res. 2008, 30, 157–163. [Google Scholar] [CrossRef] [Green Version]
- Maranon, E. Cell Size as a Key Determinant of Phytoplankton Metabolism and Community Structure. Annu. Rev. Mar. Sci. 2015, 7, 241–264. [Google Scholar] [CrossRef] [Green Version]
- Allen, A.P.; Gillooly, J.F.; Brown, J.H. Linking the global carbon cycle to individual metabolism. Funct. Ecol. 2005, 19, 202–213. [Google Scholar] [CrossRef]
- Lopez-Urrutia, A.; San Martin, E.; Harris, R.P.; Irigoien, X. Scaling the metabolic balance of the oceans. PNAS 2006, 103, 8739–8744. [Google Scholar] [CrossRef] [Green Version]
- Rose, J.M.; Caron, D.A. Does low temperature constrain the growth rates of heterotrophic protists? Evidence and implications for algal blooms in cold waters. Limnol. Oceanogr. 2007, 52, 886–895. [Google Scholar] [CrossRef]
- Doney, S.C.; Glover, D.M.; Najjar, R.G. A new coupled, one-dimensional biological-physical model for the upper ocean: Applications to the JGOFS Bermuda Atlantic Time-series Study (BATS) site. Deep Sea Res. Part II 1996, 43, 591–624. [Google Scholar] [CrossRef]
- Laws, E.A.; Falkowski, P.G.; Smith, W.O.J.; Ducklow, H.; McCarthy, J.J. Temperature effects on export production in the open ocean. Glob. Biogeochem. Cycles 2000, 14, 1231–1246. [Google Scholar] [CrossRef] [Green Version]
- Palmer, J.R.; Totterdell, I.J. Production and export in a global ocean ecosystem model. Deep Sea Res. Part I Oceanogr. Res. Pap. 2001, 48, 1169–1198. [Google Scholar] [CrossRef]
- Taucher, J.; Oschlies, A. Can we predict the direction of marine primary production change under global warming? Geophys. Res. Lett. 2011, 38, 6. [Google Scholar] [CrossRef] [Green Version]
- Toseland, A.; Daines, S.J.; Clark, C.R.; Kirkham, A.; Strauss, J.; Uhlig, C.; Lenton, T.M.; Valentin, K.; Pearson, G.A.; Moulton, V.; et al. The impact of temperature on marine phytoplankton resource allocation and metabolism. Nat. Clim. Chang. 2013, 3, 979–984. [Google Scholar] [CrossRef]
- Stock, C.A.; Dunne, J.P.; John, J.G. Global-scale carbon and energy flows through the marine planktonic food web: An analysis with a coupled physical-biological model. Prog. Oceanogr. 2014, 120, 1–28. [Google Scholar] [CrossRef]
Figure 1.
Map of University Lake. Water samples for dilution experiments were collected from a dock adjacent to site 1. Tick marks on abscissa and ordinate indicate west latitude and north longitude, respectively. Figure taken from Norris and Laws [5]. Direction of north is directly upward.
Figure 1.
Map of University Lake. Water samples for dilution experiments were collected from a dock adjacent to site 1. Tick marks on abscissa and ordinate indicate west latitude and north longitude, respectively. Figure taken from Norris and Laws [5]. Direction of north is directly upward.

Figure 2.
Results of the dilution experiment with University Lake water conducted on 6–7 November 2018. Triangles are experimental data. The smooth curve is the result of numerically integrating Equations. 1–2 with constants chosen to give the best fit in a least-squares sense to the data. Note that the abscissa is scaled so that the intervals between the diluted fractions are equal.

Figure 3.
Phytoplankton growth rates (µ, d−1) and zooplankton grazing rates (g, d−1) from this study and from the rates reported by Boyer et al. [15], Lavrentyev et al. [16], Tadonleke and Sime-Ngando [17], Adrian et al. [18], Griniene et al. [19], Staniewski et al. [20], Sterner et al. [21], Tijdens et al. [22], Twiss et al. [23], Weisse et al. [24], Davis et al. [25], and Collos et al. [26]. Data have been binned into six temperature intervals of 5–11, 11–18, 18–22, 22–26, 26–30, and 30–35 °C. Symbols indicate mean values in each interval, and error bars are standard errors of the means. Solid curves are simple exponential functions of temperature fit to the growth rates (black) and grazing rates (red) and correspond to Q10 values of 1.48 and 1.54, respectively. In the experiments conducted in University Lake, g equaled Gmax divided by the initial chl a concentration.

Publisher’s Note: MDPI stays neutral with regard to jurisdictional claims in published maps and institutional affiliations. |
© 2021 by the authors. Licensee MDPI, Basel, Switzerland. This article is an open access article distributed under the terms and conditions of the Creative Commons Attribution (CC BY) license (https://creativecommons.org/licenses/by/4.0/).
Share and Cite
MDPI and ACS Style
Pulsifer, J.; Laws, E. Temperature Dependence of Freshwater Phytoplankton Growth Rates and Zooplankton Grazing Rates. Water 2021, 13, 1591. https://doi.org/10.3390/w13111591
AMA Style
Pulsifer J, Laws E. Temperature Dependence of Freshwater Phytoplankton Growth Rates and Zooplankton Grazing Rates. Water. 2021; 13(11):1591. https://doi.org/10.3390/w13111591
Chicago/Turabian StylePulsifer, Jennifer, and Edward Laws. 2021. "Temperature Dependence of Freshwater Phytoplankton Growth Rates and Zooplankton Grazing Rates" Water 13, no. 11: 1591. https://doi.org/10.3390/w13111591
Note that from the first issue of 2016, this journal uses article numbers instead of page numbers. See further details here.