
Hydraulic and Technological Investigations of a Phenomenon Responsible for Increase of Major Head Losses in Exploited Cast-Iron Water Supply Pipes


Abstract
:
1. Introduction
- δt—resistivity rise coefficient of a pipeline after t years of exploitation;
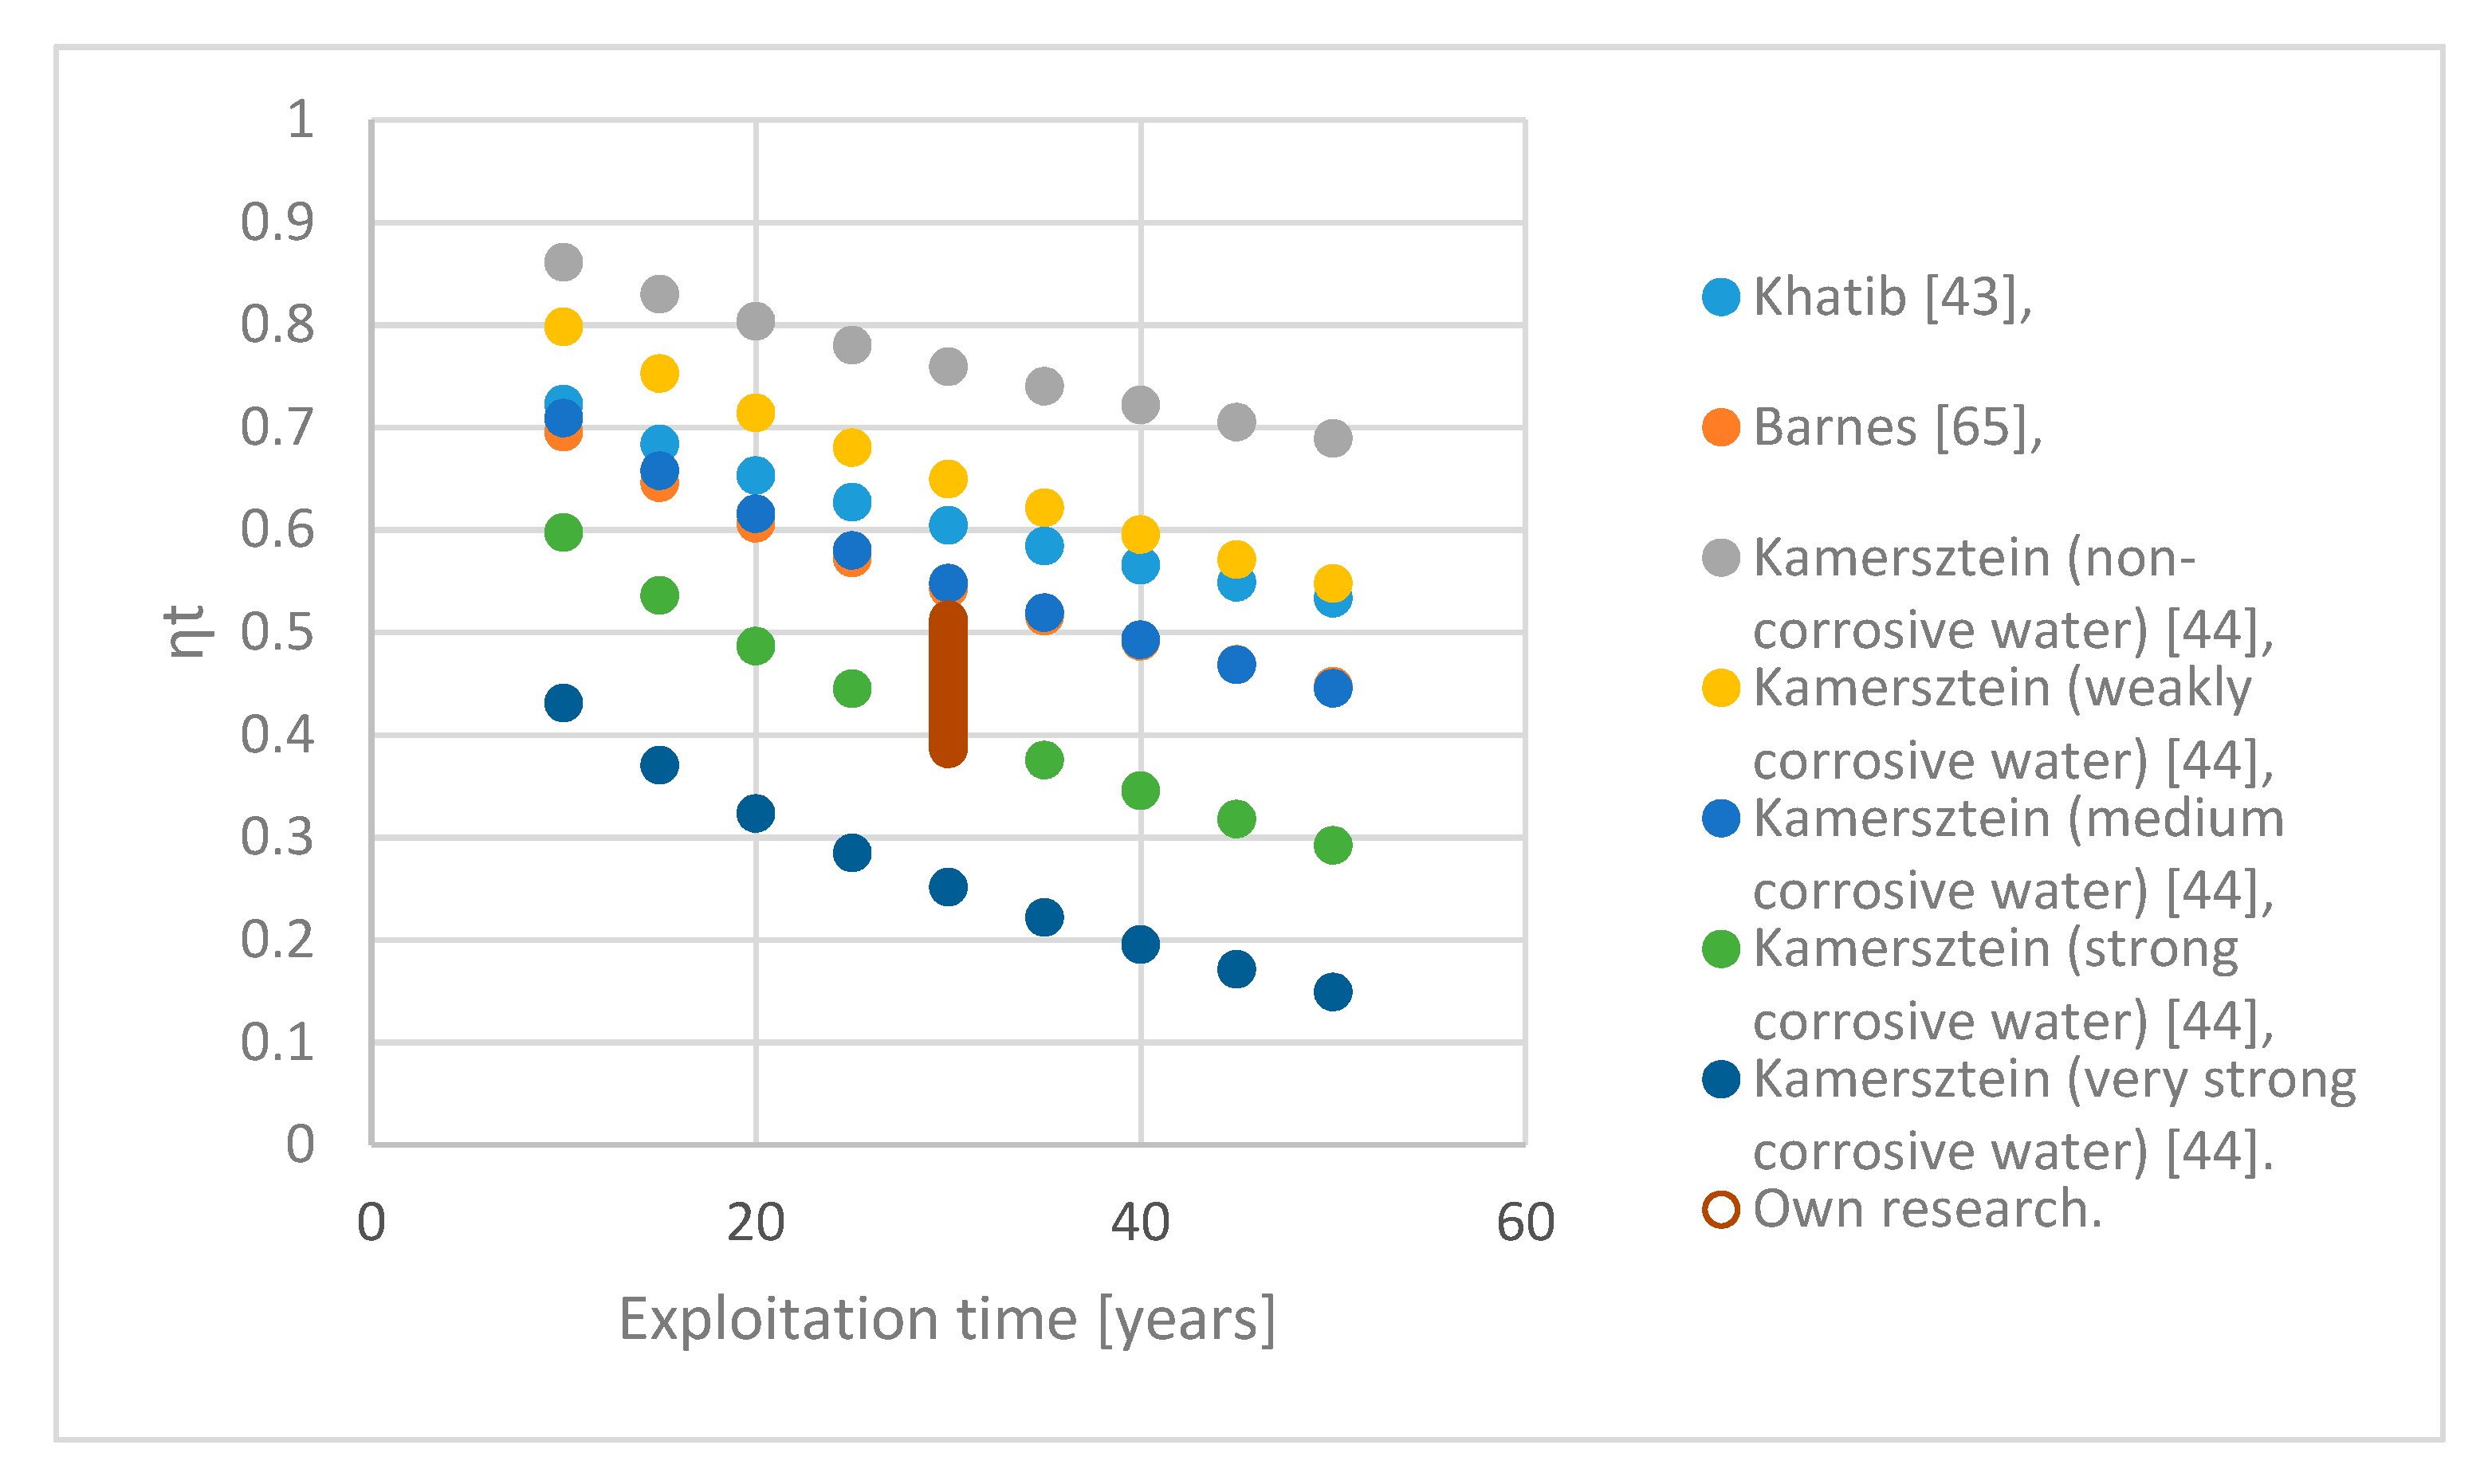
- ηt—flowability (efficiency) drop coefficient of a pipeline after t years of exploitation;
- Co, Ct—resistivity of a new pipeline and a pipeline after t years of exploitation, s2/m6;
- Mo, Mt—flowability of a new pipeline and a pipeline after t years of exploitation, s2/m6;
- λo, λt—friction loss coefficient of a new pipeline and a pipeline after t years of exploitation;
- do, dt—internal diameter of a new pipeline and equivalent diameter of a pipeline after t years of exploitation.
2. Materials and Methods
- Δp—pressure difference in the investigated pipeline section, Pa;
- Σξ—sum of the local hydraulic loss coefficients;
- λ—major head loss coefficient;
- l—pipeline length, m;
- d—pipeline diameter, m;
- Q—flow rate, m3/s;
- ρ—water density, kg/m3.
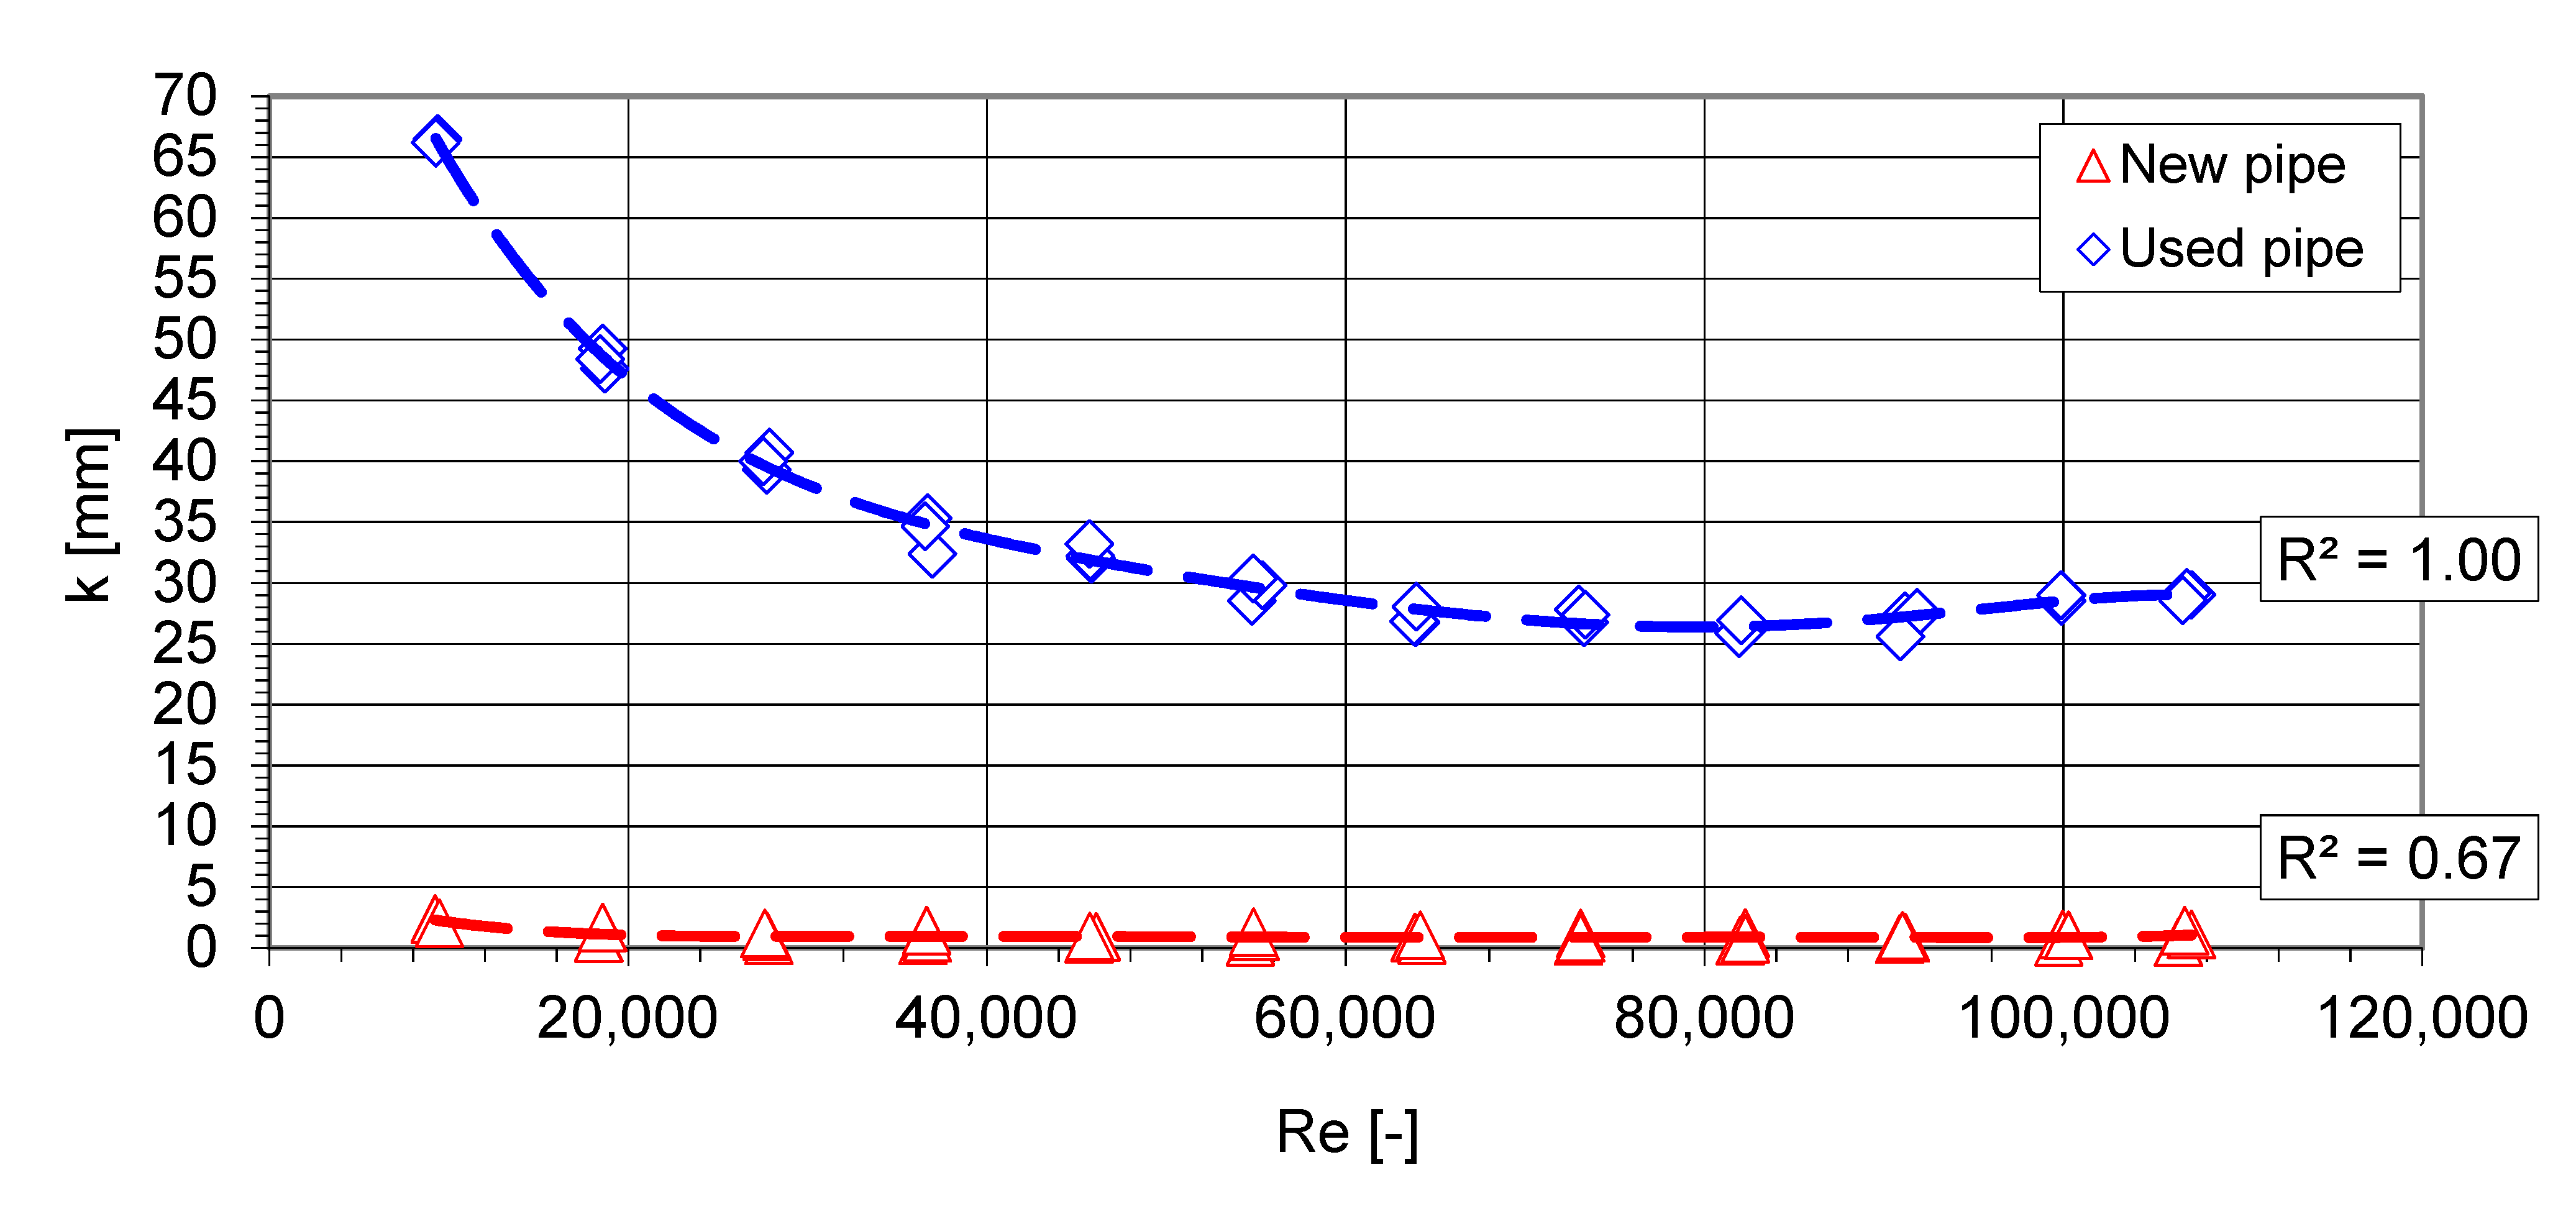
- Re—Reynolds number;
- ε—relative roughness.
- k—absolute roughness of an internal wall of the pipeline, [m].
- υ—kinematic viscosity coefficient, m2/s.
3. Results
4. Discussion
5. Conclusions
Author Contributions
Funding
Institutional Review Board Statement
Informed Consent Statement
Data Availability Statement
Conflicts of Interest
References
- Wichowski, P.; Rutkowska, G.; Kamiński, N.; Trach, Y. Analysis of water consumption in the campus of Warsaw University of Life Sciences in years 2012–2016. J. Ecol. Eng. 2019, 20, 193–202. [Google Scholar] [CrossRef]
- Safe Piped Water Managing Microbial Water Quality in Piped Distribution Systems; Richard, A. (Ed.) IWA Publishing: London, UK, 2004. [Google Scholar]
- Guidelines for Drinking-water Quality: Incorporating 1st and 2nd Addenda, 3rd ed.; World Health Organization: Geneva, Switzerland, 2008; Volume 1, ISBN 978 92 4 154761 1. Available online: https://www.who.int/water_sanitation_health/dwq/fulltext.pdf (accessed on 22 March 2021).
- U.S. Environmental Protection Agency (EPA). Water Quality Standards Handbook: Chapter 3: Water Quality Criteria; EPA-823-B-17-001; EPA: Washington, DC, USA, 2017. Available online: https://www.epa.gov/sites/production/files/2014-10/documents/handbook-chapter3.pdf (accessed on 22 March 2021).
- Guidelines for Drinking-Water Quality. Guidelines for Drinking-Water Quality: Incorporating First Addendum, 3rd ed.; World Health Organization: Geneva, Switzerland, 2020; Volume 1, Available online: https://www.who.int/water_sanitation_health/dwq/gdwq0506.pdf (accessed on 22 March 2021).
- Hu, J.; Dong, H.; Xu, Q.; Ling, W.; Qu, J.; Qiang, Z. Impacts of water quality on the corrosion of cast iron pipes for water distribution and proposed source water switch strategy. Water Res. 2018, 129, 428–435. [Google Scholar] [CrossRef]
- Ravi Shankar, A.; Anandkumar, B.; Thinaharan, C.; George, R.P.; Rooby, J.; Philip, J.; Kamachi Mudali, U. Corrosion Evaluation of Buried Cast Iron Pipes Exposed to Fire Water System for 30 years. Trans. Indian Inst. Met. 2020, 73, 9–21. [Google Scholar] [CrossRef]
- Beech, I.B.; Sunner, J. Biocorrosion: Towards understanding interactions between biofilms and metals. Curr. Opin. Biotechnol. 2004, 15, 181–186. [Google Scholar] [CrossRef]
- Teng, F.; Guan, Y.T.; Zhu, W.P. Effect of biofilm on cast iron pipe corrosion in drinking water distribution system: Corrosion scales characterization and microbial community structure investigation. Corros. Sci. 2008, 50, 2816–2823. [Google Scholar] [CrossRef]
- Usher, K.M.; Kaksonen, A.H.; Cole, I.; Marney, D. Critical review: Microbially influenced corrosion of buried carbonsteel pipes. Int. Biodeterior. Biodegrad. 2014, 93, 84–106. [Google Scholar] [CrossRef]
- Xu, D.; Li, Y.; Gu, T. Mechanistic modeling of biocorrosion caused by biofilms of sulfatereducing bacteria and acid producing bacteria. Bioelectrochemistry 2016, 110, 52–58. [Google Scholar] [CrossRef]
- Liu, G.; Zhang, Y.; Knibbe, W.J.; Feng, C.; Liu, W.; Medema, G.; van der Meer, W. Potential impacts of changing supply-water quality on drinking water distribution: A review. Water Res. 2017, 116, 135–148. [Google Scholar] [CrossRef]
- Li, M.; Liu, Z.; Chen, Y. Physico-chemical Characteristics of Corrosion Scales from Different Pipes in Drinking Water Distribution Systems. Water 2018, 10, 931. [Google Scholar] [CrossRef] [Green Version]
- Pelka, H. On the effect of some chemical properties of water on the hydraulic resistance of pipes. Ochr. Sr. 1985, 2–3, 19–24. [Google Scholar]
- Echavez, G. Increase in losses coefficient with age for small diameter pipes. J. Hydraul. Eng. 1997, 2, 157–159. [Google Scholar] [CrossRef]
- Siwoń, Z.; Cieżak, J.; Bogaczewicz, S. On the Increase of Hydraulic Resistance in Cast Iron and Steel Pipes of the Water Supply Network for the City of Wrocław. Ochr. Sr. 1998, 20(4), 21–26. [Google Scholar]
- Annus, I.; Vassiljev, A. Different approaches for calibration of an operational water distribution system containing old pipes. Procedia Eng. 2015, 119, 526–534. [Google Scholar] [CrossRef] [Green Version]
- McNeill, L.S.; Edwards, M. Iron pipe corrosion in distribution systems. J. Am. Water Work. Assoc. 2001, 93, 88–100. [Google Scholar] [CrossRef]
- Rajeev, P.; Kodikara, J.; Robert, D.; Zeman, P.; Rajani, B. Factors contributing to large diameter water pipe failure. Water Asset. Manage. Int. 2014, 10, 9–14. [Google Scholar]
- U.S. Environmental Protection Agency (EPA). 2006 Community Water System Survey. EPA 815-R-09-001; US Environmental Protection Agency: Washington, DC, USA, 2009. Available online: https://nepis.epa.gov/Exe/ZyPDF.cgi?Dockey=P1009JJI.txt (accessed on 24 January 2021).
- AWWA. Buried No Longer: Confronting America’s Water Infrastructure Challenge; American Water Works Association Research Foundation: Denver, CO, USA, 2011. [Google Scholar]
- Grigg, N.S. Secondary Impacts of Corrosion Control on Distribution System and Treatment Plant Equipment; Water Research Foundation: Denver, CO, USA, 2010. [Google Scholar]
- Philibert, M.; Mendaza, S.; Zraick, F.; Rabaud, B. Predicting the effect of water quality on water distribution cast iron and steel pipes using two novel indices. Sci. Technol. Water Suppl. 2018, 18, 524–538. [Google Scholar]
- Lewicki, Z. Calculation of hydraulic losses in pipes of water supply networks. (Obliczanie strat hydraulicznych w przewodach czynnych sieci wodociągowych). University of Science and Technology in Zielona Góra. Sci. Issues 1978, 51, 65–82. (In Polish) [Google Scholar]
- Mielcarzewicz, E.W. Calculation of Water Supply Systems. (Obliczanie Systemów Zaopatrzenia w Wodę); GWF: Arkady, Warsaw, Poland, 2000; pp. 47–69. (In Polish) [Google Scholar]
- Colebrook, C.F.; White, C.M. Experiments with fluid friction in roughened pipes. Proc. R. Soc. A Math. Phys. Eng. Sci 1937, 161, 367–381. [Google Scholar]
- Shashi Menon, E. Transmission Pipeline Calculations and Simulations Manual, 1st ed.; Gulf Professional Publishing; Elsevier Inc.: Amsterdam, The Netherlands, 2015; p. 612. [Google Scholar]
- Malcolm, J.; Brandt, K.; Johnson, M.; Elphinston, A.J.; Ratnayaka, D.D. Twort’s Water Supply, 7th ed.; Elsevier Ltd.: Amsterdam, The Netherlands, 2017; pp. 581–619. [Google Scholar]
- Brkić, D. Review of explicit approximations to the Colebrook relation for flow friction. J. Pet. Sci. Eng. 2011, 77, 34–48. [Google Scholar] [CrossRef] [Green Version]
- Brkić, D. A note on explicit approximations to Colebrooks friction factor in rough pipes under highly turbulent cases. Int. J. Heat Mass Transf. 2016, 93, 513–515. [Google Scholar] [CrossRef]
- Kalenik, M. Empirical Formulas for Calculation of Negative Pressure Difference in Vacuum Pipelines. Water 2015, 7, 5284–5304. [Google Scholar] [CrossRef] [Green Version]
- Kalenik, M. Real Values of Local Resistance Coefficient During Flow of Water Through Welded Polypropylene Elbows. Ochr. Sr. 2019, 41, 23–30. [Google Scholar]
- Wichowski, P.; Siwiec, T.; Kalenik, M. Effect of the Concentration of Sand in a Mixture of Water and Sand Flowing through PP and PVC Elbows on the Minor Head Loss Coefficient. Water 2019, 11, 828. [Google Scholar] [CrossRef] [Green Version]
- Kalenik, M.; Chalecki, M.; Wichowski, P. Real Values of Local Resistance Coefficients during Water Flow through Welded Polypropylene T-Junctions. Water 2020, 12, 895. [Google Scholar] [CrossRef] [Green Version]
- Ono, A.; Kimura, N.; Kamide, H.; Tobita, A. Influence of elbow curvature on flow structure at elbow outlet under high Reynolds number condition. Nucl. Eng. Des. 2011, 41, 4409–4419. [Google Scholar] [CrossRef]
- Csizmadia, P.; Hős, C. CFD-based estimation and experiments on the loss coefficient for Bingham and power-law fluids through diffusers and elbows. Comp. Fluids 2014, 99, 116–123. [Google Scholar] [CrossRef]
- Dutta, P.; Nandi, N. Effect of Reynolds number and curvature ratio on single phase turbulent flow in pipe bends. Mech. Mech. Eng. 2015, 19, 5–16. [Google Scholar]
- Dutta, P.; Saha, S.K.; Nandi, N.; Pal, N. Numerical study on flow separation in 90° pipe bend under high Reynolds number by k-ε modelling. Int. J. Eng. Sci. Technol. 2016, 19, 904–910. [Google Scholar] [CrossRef] [Green Version]
- Chowdhury, R.R.; Alam, M.M.; Sadrul Islam, A.K.M. Numerical modeling of turbulent flow through bend pipes. Mech. Eng. Res. J. 2016, 10, 14–19. [Google Scholar]
- Colebrook, C.F.; White, C.M. The reduction of currying capacity of pipes with age. J. Civ. Eng. 1937, 1, 99–118. [Google Scholar]
- Mohebbi, H.; Li, C.Q. Experimental Investigation on Corrosion of Cast Iron Pipes. Int. J. Corros. 2011, 2011, 1–17. [Google Scholar] [CrossRef]
- Korte, J.W.; Bodarwe, H. Eine Grundsätzliche Gesichtspunkte zur Berechnung von Wasserversorgungsnetzen; GWF: Essen, Germany, 1958; pp. 117–1184. [Google Scholar]
- Khatib, A. Research on hydraulic efficiency of water pipes. Ph.D. thesis, University of Technology, Wroclaw, Poland, 1992. [Google Scholar]
- Kamersztejn, A.G. Mieroprijatija po Sochranieniju Propusknoj Sposobnosti Wodoprowodnych Trub; GWF: Strojizdat, Moscow, Russia, 1950. [Google Scholar]
- Malesinska, A.; Chudzicki, J. Change in Hydraulic Resistance of Water Supply Pipes Being Renovated with Polyethylene Pipes. Ochr. Sr. 2014, 36, 29–35. [Google Scholar]
- Abdel-Monim, Y.K.; Ead, S.A.; Shabayek, S.A. Effect of time on pipe roughness. 17th Canadian Hydrotechnical Conference. CSCE 2005, 2005, 1–10. [Google Scholar]
- Kandlikar, S.G.; Schmitt, D.; Carrano, A.L.; Taylor, J.B. Characterization of surface roughness effects on pressure drop in singlephase flow in minichannels. Phys. Fluids 2005, 17, 10. [Google Scholar] [CrossRef] [Green Version]
- DIN 19210:1984. Methods for Measurement of Fluid Flow—Differential Pressure Piping for Flow Measurement Devices; German standard DIN 19210; Deutsches Institut fur Normung E.V. (DIN): Berlin, Germany, 1984; pp. 1–6. [Google Scholar]
- PN-76 M-34034:1976. Principles of Calculating Pressure Losses; Polish standard PN-76 M-34034; Polish Committee for Standardization: Warsaw, Poland, 1976; pp. 1–25. [Google Scholar]
- Corrosion Manual for Internal Corrosion of Water Distribution Systems; United States Environmental Protection Agency: Washington, DC, USA, 1984.
- Melidis, P.; Sanosidou, M.; Mandusa, A.; Ouzounis, K. Corrosion control by using indirect methods. Desalination 2007, 213, 152–158. [Google Scholar] [CrossRef]
- Amouei, A.; Fallah, H.; Asgharnia, H.; Bour, R.; Mehdinia, M. Evaluation of corrosion and scaling potential of drinking waterresources in Noor city (Iran) by using stability indice. Koomesh 2016, 18, 326–333. [Google Scholar]
- Abbasnia, A.; Alimohammadi, M.; Mahvi, A.H.; Nabizadeh, R.; Yousefi, M.; Mohammadi, A.A.; Pasalari, H.; Mirzabeigi, M. Assessment of groundwater quality and evaluation of scaling and corrosiveness potential of drinking water samples in villages of Chabahr city, Sistan and Baluchistan province in Iran. Data Brief 2018, 16, 182–192. [Google Scholar] [CrossRef] [PubMed]
- Langelier, W.F. The analytical control of anti-corrosion water treatment. J. Am. Water Works Assoc. 1936, 28, 1500–1521. [Google Scholar] [CrossRef]
- Ryznar, J.W. A new index for determining the amount of calcium carbonate scale formed by water. J. Am. Water Works Assoc. 1944, 36, 472–486. [Google Scholar] [CrossRef]
- García-Ávila, F.; Ramos-Fernández, L.; Pauta, D.; Quezada, D. Evaluation of water quality and stability in the drinking water distribution network in the Azogues city, Ecuador. Data Brief 2018, 18, 111–123. [Google Scholar] [CrossRef]
- Taghavi, M.; Mohammadi, M.H.; Radfard, M.; Fakhri, Y.; Javane, S. Assessment of scaling and corrosion potential of drinking water resources of Iranshahr. MethodsX 2019, 6, 278–283. [Google Scholar] [CrossRef] [PubMed]
- Shahzad, A.; James, W. Loss in Carrying Capacity of Water Mains due to Encrustation and Biofouling, and Application to Walkerton, Ontario. J. Water Manag. Model. 2002, volume 10, 303–324. [Google Scholar] [CrossRef]
- Christensen, R.T. Age Effects on Iron-Based Pipes in Water Distribution Systems. All Graduate Theses and Dissertations (dissertation submitted in partial fulfillment of the requirements for the degree of doctor); Utah State University: Logan, UT, USA, 2009; p. 505. Available online: https://digitalcommons.usu.edu/etd/505 (accessed on 11 January 2021).
- Rollmann, P.; Spindler, K. Explicit representation of the implicit Colebrook-White equation. Case Stud. Therm. Eng. 2015, 5, 41–47. [Google Scholar] [CrossRef] [Green Version]
- Pimenta, B.D.; Robaina, A.D.; Peiter, M.X.; Mezzomo, W.; Kirchner, J.H.; Ben, L.H.B. Performance of explicit approximations of the coefficient of head loss for pressurized conduits. Revista Brasileira de Engenharia Agrícola e Ambiental 2018, 22, 301–307. [Google Scholar] [CrossRef] [Green Version]
- Cengel, Y.A.; Cimbala, J.M. Fluid Mechanics, 1st ed.; McGraw-Hill: New York, NY, USA, 2006; pp. 321–398. [Google Scholar]
- Shaikh, M.M.; Massan, S.urR.; Wagan, A.I. A new explicit approximation to Colebrook’s friction factor in rough pipes under highly turbulent cases. Int. J. Heat Mass Transf. 2015, 88, 538–543. [Google Scholar] [CrossRef]
- Oktaba, W. Elements of Mathematical Statistics and Experimental Methodology; PWN: Warszawa, Poland, 1980; p. 310. [Google Scholar]
- Barnes, A.A. Untersuchungen uber die Reibungsziffer Betribsrauher Rohre; GWF: Essen, Germany, 1959; pp. 289–295. [Google Scholar]
- Boxall, J.; Saul, A.; Skipworth, P. Modeling for hydraulic capacity. J. Am. Water Works Assoc. 2004, 96, 161–169. [Google Scholar] [CrossRef]
- Kaur, K.; Annus, I.; Vassiljev, A.; Kändler, N. Determination of Pressure Drop and Flow Velocity in Old Rough Pipes. Proceedings 2018, 2, 590. [Google Scholar] [CrossRef] [Green Version]
- Amouei, A.; Asgharnia, H.; Fallah, H.; Miri, S.; Momeni, H. Evaluating corrosion and scaling potential of drinking water supplies in Juybar, North of Iran. Iran. J. Health Sci. 2017, 5(2), 11–18. [Google Scholar] [CrossRef] [Green Version]
- Shankar, B.S. Determination of Scaling and corrosion tendencies of water through the use of Langelier and Ryznar Scholars Journal of Engineering and Technology (SJET). Sch. J. Eng. Tech. 2014, 2014, 123–127. [Google Scholar]
- Vasconcelos, H.C.; Fernández-Pérez, B.M.; González, S.; Souto, R.M.; Santana, J.J. Characterization of the Corrosive Action of Mineral Waters from Thermal Sources: A Case Study at Azores Archipelago, Portugal. Water 2015, 7, 3515–3530. [Google Scholar] [CrossRef]
- Biglari, H.; Saeidi, M.; Rahdar, S.; Narooie, M.R.; Salimi, A.; Khaksefidi, R.; Baneshi, M.M.; Ahamadabadi, M.; Alipour, V. Evaluation of corrosion and scaling tendency indices in zahedan groundwater resources. IIOAB J. 2016, 7, 523–528. [Google Scholar]


| Determination | Unit | Parameter |
|---|---|---|
| Temperature | °C | 12.6 |
| Reaction | pH | 7.23 |
| Conductivity | μS∙cm−1 | 666 |
| Color | mg Pt∙dm−3 | 3 |
| Turbidity | NTU | 0.5 |
| Nitrates | mg NO3−∙dm−3 | 1.82 |
| Chlorides | mg Cl−∙dm−3 | 70.12 |
| Sulphates | mg SO42−∙dm−3 | 169.86 |
| Ammonium ion | mg NH4+∙dm−3 | 0.04 |
| General acidity | mval∙dm−3 | 0.54 |
| General basicity | mval∙dm−3 | 4.48 |
| General basicity | mg CaCO3∙dm−3 | 224.2 |
| Alkaline basicity | mval∙dm−3 | 0.00 |
| General hardness | mval∙dm−3 | 7.81 |
| General hardness | mg CaCO3∙dm−3 | 390.85 |
| Carbonate hardness | mg CaCO3∙dm−3 | 224.46 |
| Non-carbonate hardness | mg CaCO3∙dm−3 | 166.65 |
| Calcium hardness | mval∙dm−3 | 6.34 |
| Magnesium hardness | mval∙dm−3 | 1.45 |
| Calcium | mg Ca2+∙dm−3 | 126.98 |
| Magnesium | mg Mg2+∙dm−3 | 17.61 |
| Manganese | mg Mn2+∙dm−3 | 0.01 |
| Iron | mg Fe∙dm−3 | 0.03 |
| Free CO2 | mg CO2∙dm−3 | 27.60 |
| Aggressive CO2 | mg CO2∙dm−3 | 2.86 |
| Dissolved oxygen | mg O2∙dm−3 | 2.89 |
| COD—KMnO4 | mg O2∙dm−3 | 1.25 |
| Dry residue | mg∙dm−3 | 605.43 |
| Residue after roasting | mg∙dm−3 | 365.30 |
| Surface state and Exploitation Conditions | Roughness k 10−3 [m] |
|---|---|
| New | 0.25–1.0 |
| new, bituminized | 0.10–0.15 |
| Asphalted | 0.12–0.30 |
| water pipes in exploitation | 1.4 |
| pipes in exploitation, corroded | 1.0–1.5 |
| with sediments | 1.0–1.5 |
| with considerable sediments | 2.0–4.0 |
| purified after several years of exploitation | 0.3–1.5 |
| severely corroded | ≤3.0 |
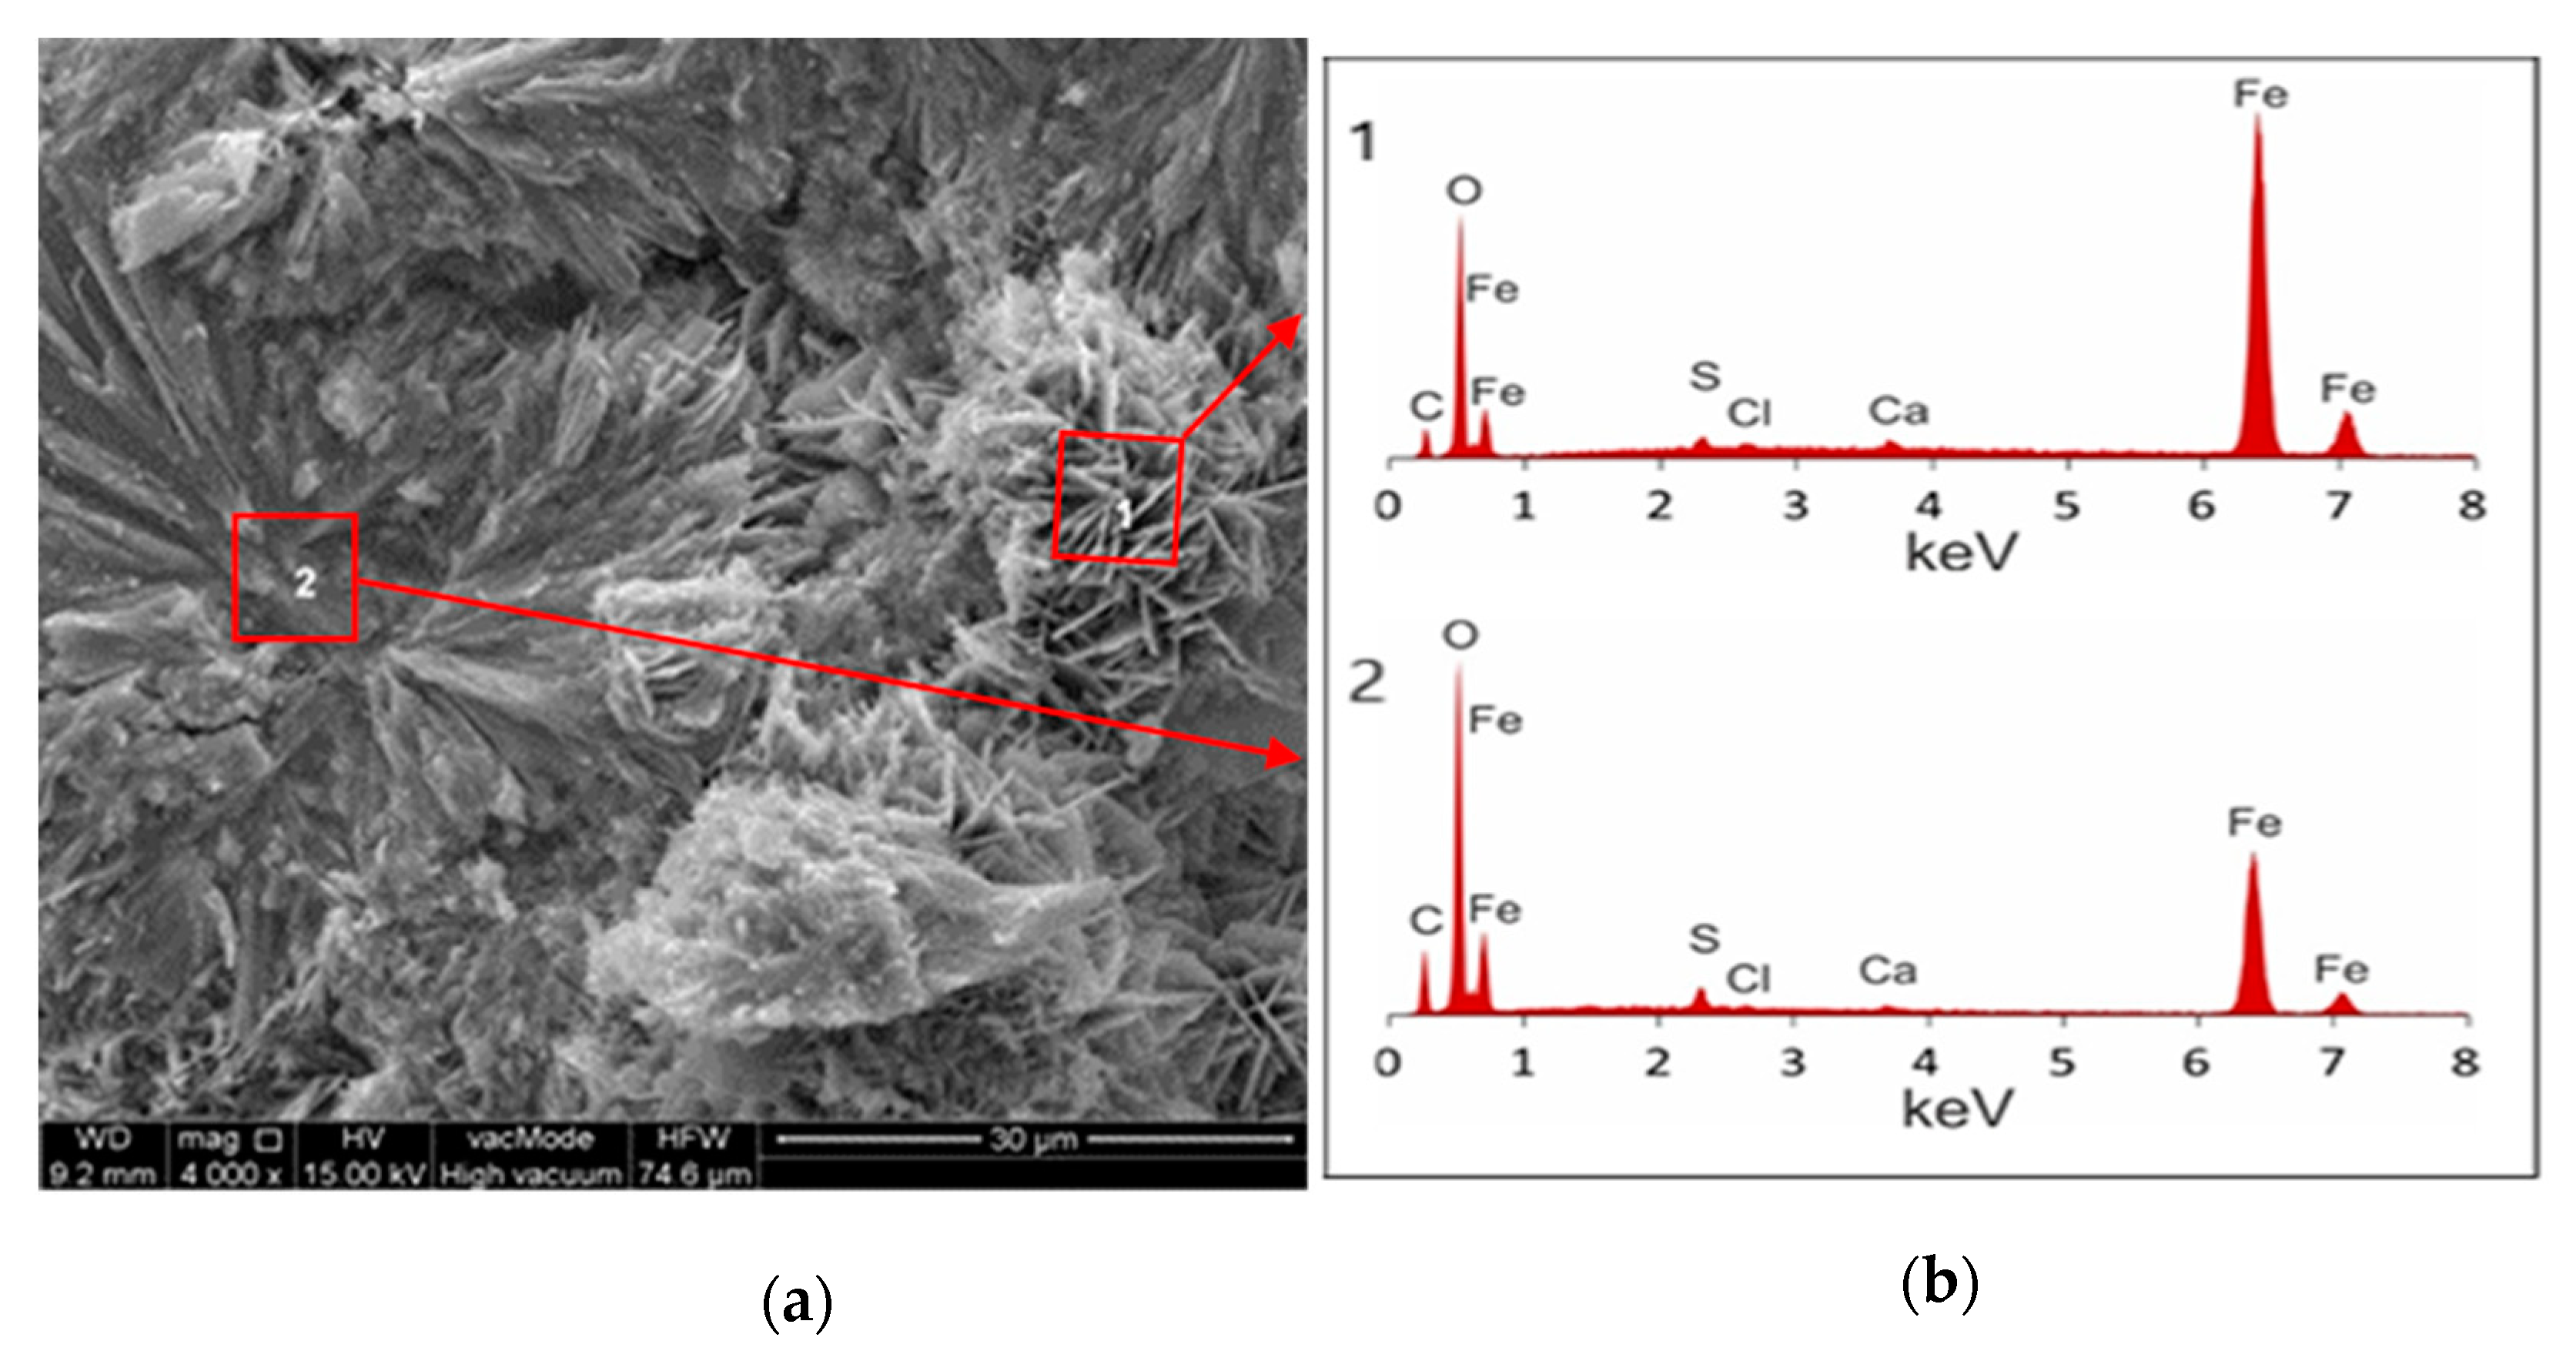
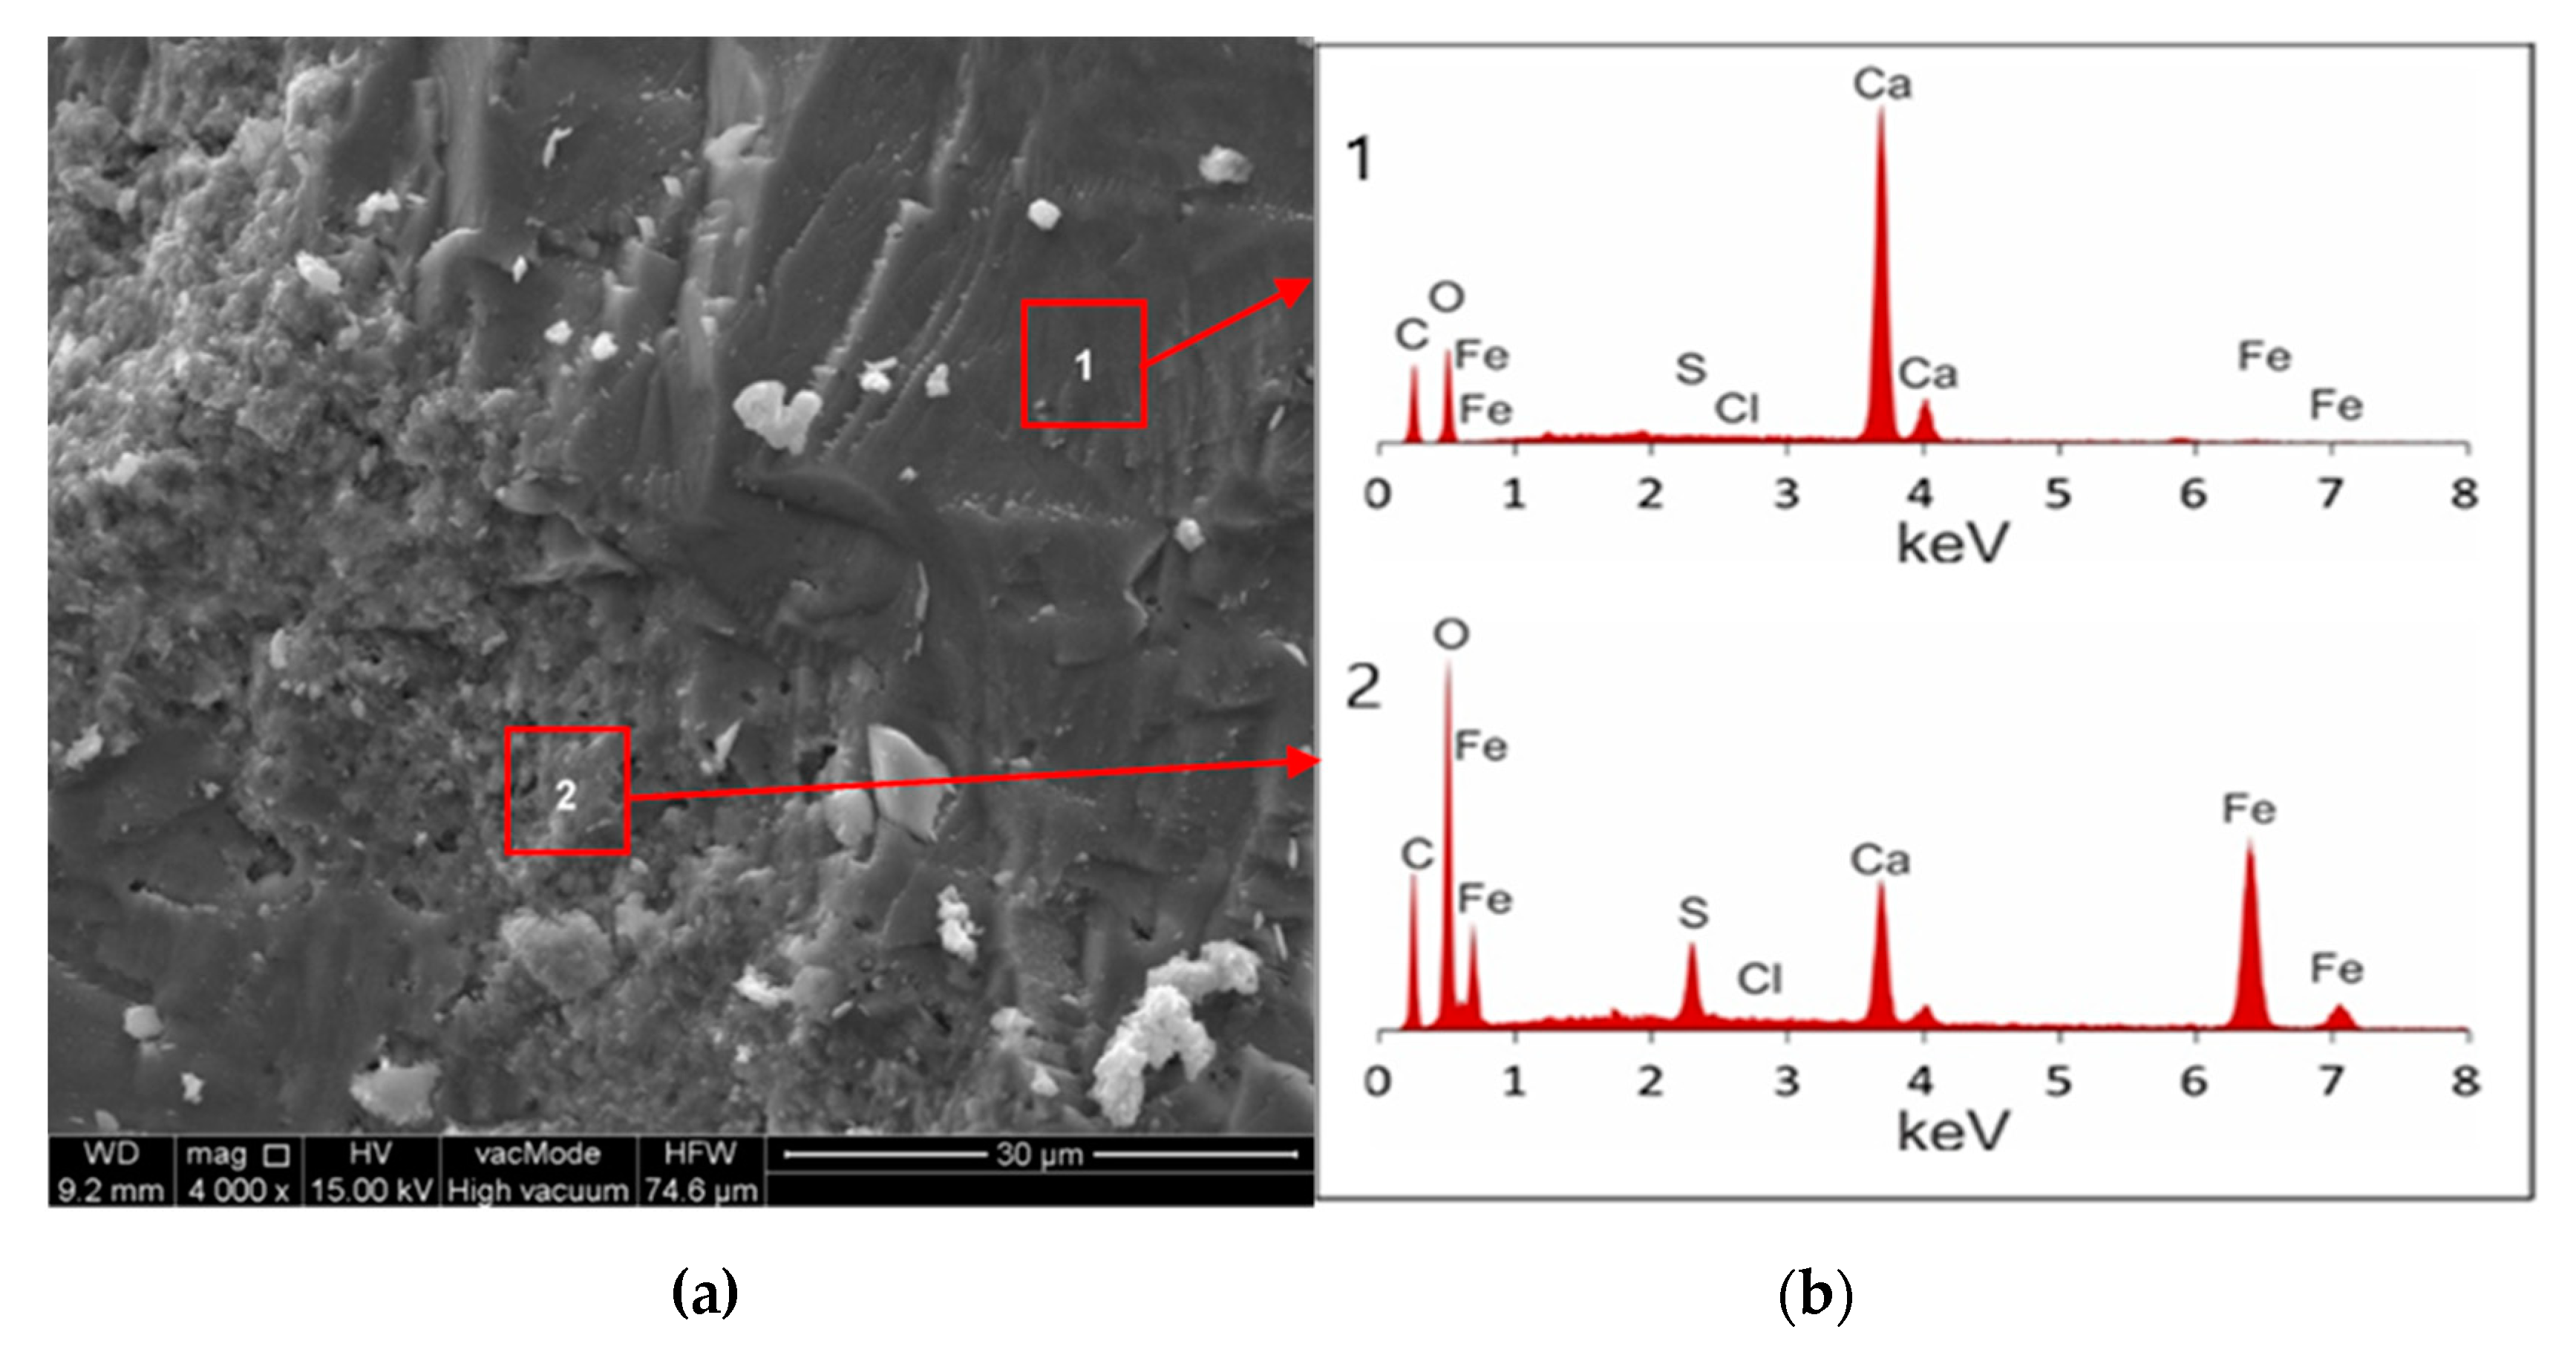
| Tested Substance | Outer Layer | Inner Layer | ||||||
|---|---|---|---|---|---|---|---|---|
| 1 | 1 | 2 | 2 | 1 | 1 | 2 | 2 | |
| SO3 | 1.11 | 2.14 | 5.55 | 10.26 | 0.38 | 0.27 | 8.77 | 12.87 |
| Cl2O | 0.38 | 0.69 | 0.54 | 0.92 | 0.26 | 0.17 | 0.17 | 0.23 |
| CaO | 0.85 | 2.35 | 1.07 | 2.84 | 97.35 | 98.84 | 14.65 | 30.70 |
| Fe2O3 | 97.66 | 94.81 | 92.83 | 85.99 | 2.01 | 0.72 | 76.40 | 56.20 |
| Component | Na2O | MgO | Al2O3 | SiO2 | P2O5 | SO3 | K2O | CaO | TiO2 | Fe2O3 | |
|---|---|---|---|---|---|---|---|---|---|---|---|
| % | 0 | 0 | 0.17 | 2.07 | 0.44 | 1.19 | 0 | 0.23 | 0.02 | 94.06 |
| Type of the Pipe | Mean Value | Standard Deviation | Obtained Student’s t-test Value |tcal| | Obtained Probability Value pcal | Student’s t-statistics Value Read from the Tables for p = 0.05 and v = 34 tα = 0.05 |
|---|---|---|---|---|---|
| New pipe | 0.899 | 0.266 | −99.726 | 5.668∙10−25 | 2.101 * |
| Exploited pipe | 27.593 | 1.126 |
Publisher’s Note: MDPI stays neutral with regard to jurisdictional claims in published maps and institutional affiliations. |
© 2021 by the authors. Licensee MDPI, Basel, Switzerland. This article is an open access article distributed under the terms and conditions of the Creative Commons Attribution (CC BY) license (https://creativecommons.org/licenses/by/4.0/).
Share and Cite
Wichowski, P.; Kalenik, M.; Lal, A.; Morawski, D.; Chalecki, M. Hydraulic and Technological Investigations of a Phenomenon Responsible for Increase of Major Head Losses in Exploited Cast-Iron Water Supply Pipes. Water 2021, 13, 1604. https://doi.org/10.3390/w13111604
Wichowski P, Kalenik M, Lal A, Morawski D, Chalecki M. Hydraulic and Technological Investigations of a Phenomenon Responsible for Increase of Major Head Losses in Exploited Cast-Iron Water Supply Pipes. Water. 2021; 13(11):1604. https://doi.org/10.3390/w13111604
Chicago/Turabian StyleWichowski, Piotr, Marek Kalenik, Agnieszka Lal, Dariusz Morawski, and Marek Chalecki. 2021. "Hydraulic and Technological Investigations of a Phenomenon Responsible for Increase of Major Head Losses in Exploited Cast-Iron Water Supply Pipes" Water 13, no. 11: 1604. https://doi.org/10.3390/w13111604