Article

Picocyanobacterial Contribution to the Total Primary Production in the Northwestern Pacific Ocean

1
Marine Ecosystem Research Center, Korea Institute of Ocean Science and Technology, Busan 49111, Korea
2
College of Marine and Environmental Sciences, Tianjin University of Science and Technology, Tianjin 300457, China
3
Department of Biological Oceanography, Leibniz Institute for Baltic Sea Research Warnemuende, 18119 Rostock, Germany
4
Department of Oceanography, Pusan National University, Busan 46241, Korea
5
South Sea Fisheries Research Institute, National Institute of Fisheries Science, Yeosu-si 59780, Korea
*
Author to whom correspondence should be addressed.
Water 2021, 13(11), 1610; https://doi.org/10.3390/w13111610
Submission received: 16 April 2021 / Revised: 4 June 2021 / Accepted: 4 June 2021 / Published: 7 June 2021
(This article belongs to the Special Issue Marine Nitrogen Fixation and Phytoplankton Ecology)

Abstract

:
Picocyanobacteria (Prochlorococcus and Synechococcus) play an important role in primary production and biogeochemical cycles in the subtropical and tropical Pacific Ocean, but little biological information on them is currently available in the North Pacific Ocean (NPO). The present study aimed to determine the picocyanobacterial contributions to the total primary production in the regions in the NPO using a combination of a dual stable isotope method and metabolic inhibitor. In terms of cell abundance, Prochlorococcus were mostly dominant (95.7 ± 1.4%) in the tropical Pacific region (hereafter, TP), whereas Synechococcus accounted for 50.8%–93.5% in the subtropical and temperate Pacific region (hereafter, SP). Regionally, the averages of primary production and picocyanobacterial contributions were 11.66 mg C m−2·h−1 and 45.2% (±4.8%) in the TP and 22.83 mg C m−2·h−1 and 70.2% in the SP, respectively. In comparison to the carbon, the average total nitrogen uptake rates and picocyanobacterial contributions were 10.11 mg N m−2·h−1 and 90.2% (±5.3%) in the TP and 4.12 mg N m−2·h−1 and 63.5%, respectively. These results indicate that picocyanobacteria is responsible for a large portion of the total primary production in the region, with higher contribution to nitrogen uptake rate than carbon. A long-term monitoring on the picocyanobacterial variability and contributions to primary production should be implemented under the global warming scenario with increasing ecological roles of picocyanobacteria.

1. Introduction

Phytoplankton are major biological components as primary producers in marine ecosystems. Marine phytoplankton not only account for a significant proportion of global primary production, but also are an important food source in marine ecosystems and a potential moderator of global carbon cycle at the ocean–atmosphere interface [1]. Distribution, abundance, and diversity of phytoplankton differ greatly among dominant water masses in the various oceanic regions, which are closely related to physiochemical properties. In addition, long-term research on the limiting factors (e.g., temperature, nutrients, and light regime) of phytoplankton has reported that biological and ecological changes resulted from variations of these factors such as increasing of seawater temperature and reinforcement of stratification [2,3]. Primary production is widely used as one of key biological factors for understanding the regional differences in basic environmental and biological conditions such as thermohaline properties, nutrients, chlorophyll-a, etc. [4,5,6,7,8].
The Pacific Ocean, due to its vastness extending from tropical regions to both the boundaries of polar oceans, is subjected to have distinctive climatic conditions at its various regions [4]. In the northwestern Pacific Ocean (NPO), the physico-chemical conditions are mainly influenced by North Equatorial Current, Kuroshio Current, Tsushima Warm Current, and pelagic/coastal water intrusions at the coastal zones in the East China Sea (ECS). In terms of phytoplankton community, autotrophic picoplankton communities were more abundant in the NPO than large-sized phytoplankton and heterotrophic bacteria [9,10]. Lee et al. [10] reported that autotrophic plankton (mainly pico-sized phytoplankton) comprised up to 80% of the total phytoplankton biomass in the euphotic zone, whereas the contribution of heterotrophic bacteria was 6–21% of phytoplankton biomass in the NPO. Furthermore, a few research works reported that picoplankton including pico-sized cyanobacteria (Prochlorococcus and Synechococcus) have been a significant component of biomass and primary production in the subtropical and tropical Pacific Ocean [11,12,13,14,15,16,17].
In general, Prochlorococcus exhibits a wide adaptation for the variability in light or nutrient conditions, whereas they are often observed to be limited by high temperature in the water column [16,18,19,20,21,22,23]. Other cyanobacterial species such as Synechococcus have relatively eurythermal characteristics and extend to low salinity waters. Hence, Synechococcus are widely distributed around the world ocean from tropical to polar waters with a high biomass in the upper euphotic zone [22,24]. Recently, it was reported that abundance and distribution of the small-sized autotrophic plankton communities including cyanobacteria, Prochlorococcus, and Synechococcus, increase in various oceans with global warming, which indicates that this issue is not limited to a local scale anymore [25,26].
Normally, the primary production by picophytoplankton (i.e., picocyanobacteria and picoeukaryotes) is estimated through filter fractionation [7,27,28,29,30,31]. However, it is difficult to distinguish carbon and/or nitrogen uptake rates between picocyanobacteria (Prochlorococcus and Synechococcus) and picoeukaryotes. Moreover, the fractionation in natural samples makes it difficult to physically separate picophytoplankton from heterotrophic bacteria, in case of nitrogen uptake [32]. Previous studies used metabolic inhibitors to partition the relative contributions of eukaryotes and prokaryotes in marine systems [33,34,35]. For example, cycloheximide inhibits the function of the 80-S ribosome of eukaryotes [36], whereas streptomycin specifically inhibits protein synthesis on the 70-S ribosome in bacteria [37]. Thus, these metabolic inhibitors could be effective in separating target organisms from non-target organisms [32]. Middelburg and Nieuwenhuize [34,35] successfully partitioned autotrophic and heterotrophic activity using metabolic inhibitors. Fouilland et al. [32] also applied metabolic inhibitors to partition the uptakes of nitrate, ammonium, and urea between prokaryotic and eukaryotic phytoplankton. As a result, they quantitatively reported the contribution of heterotrophic bacteria to nitrogen uptake [32].
In present study, a metabolic inhibitor (cycloheximide) based on the method of Fouilland et al. [32] was applied to measure picocyanobacterial contribution to the total primary production, since the inhibitor can remove the eukaryotes and directly determine only carbon and nitrogen uptake rates by picocyanobacteria in the samples. The objectives of this study were as follows: (1) to determine carbon and nitrogen uptake rates by picocyanobacteria and (2) to evaluate picocyanobacterial contribution to the primary production in the regions (subtropical-temperate Pacific region and tropical Pacific region) in the NPO.

2. Materials and Methods

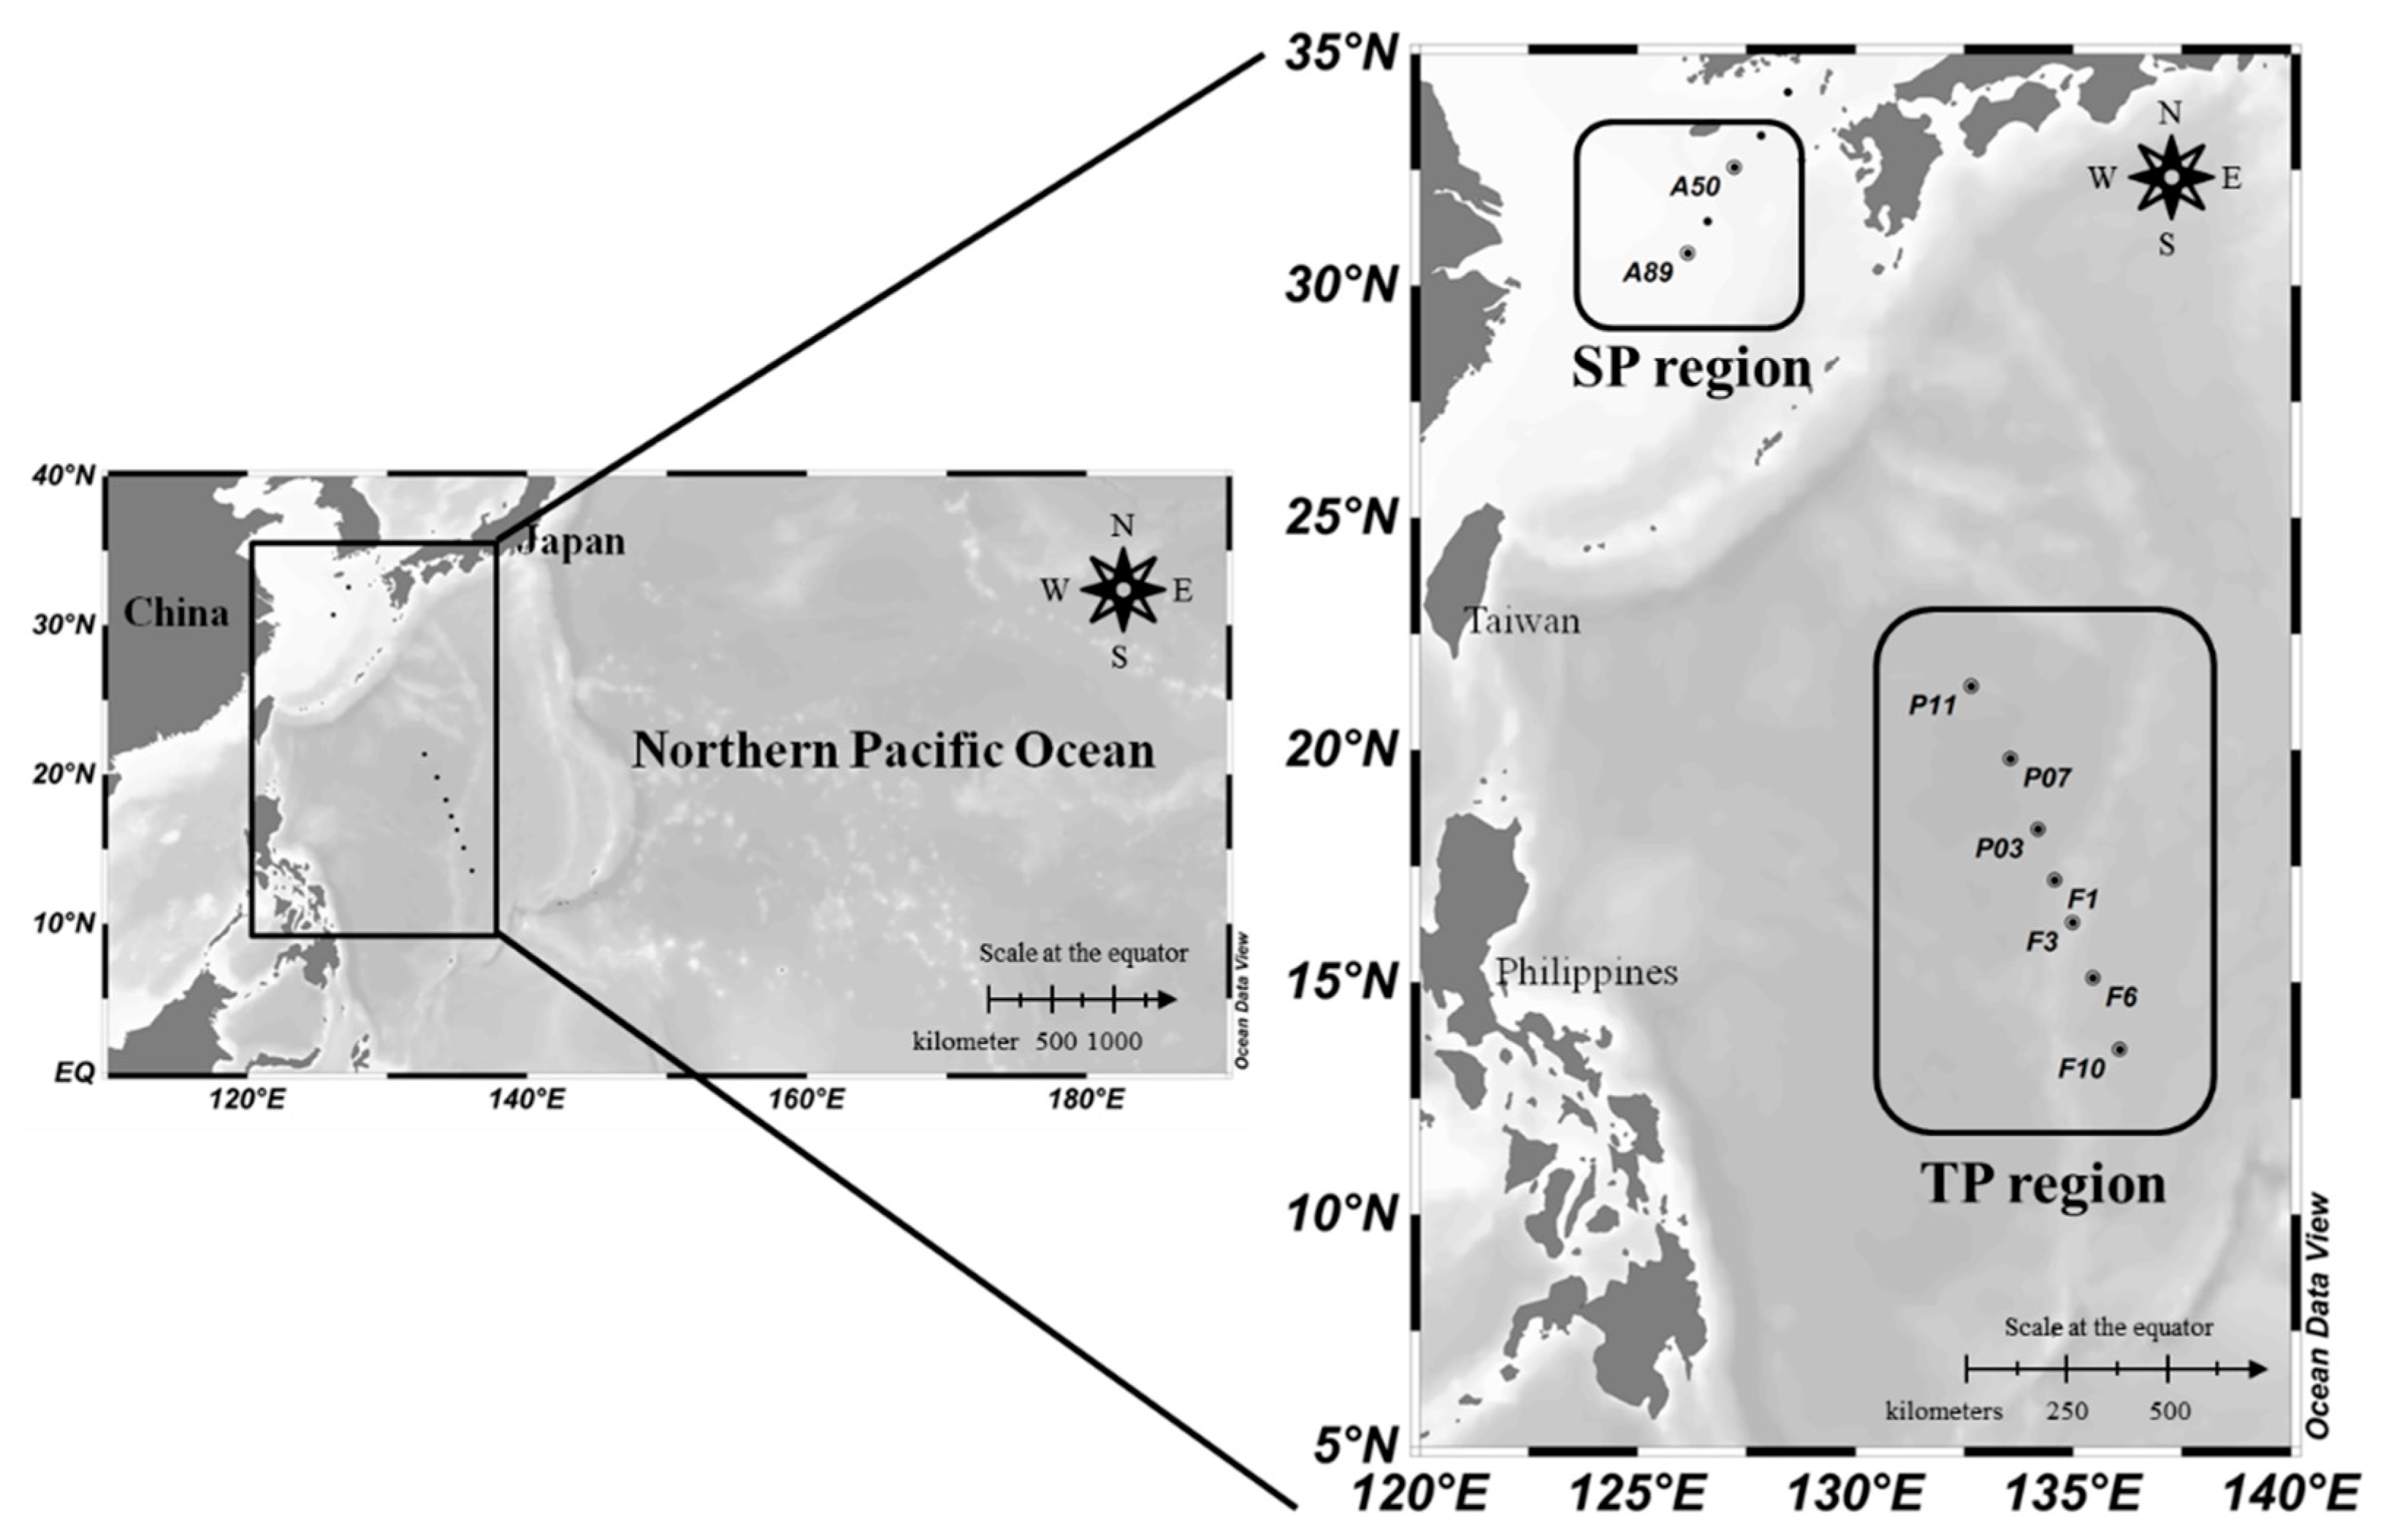
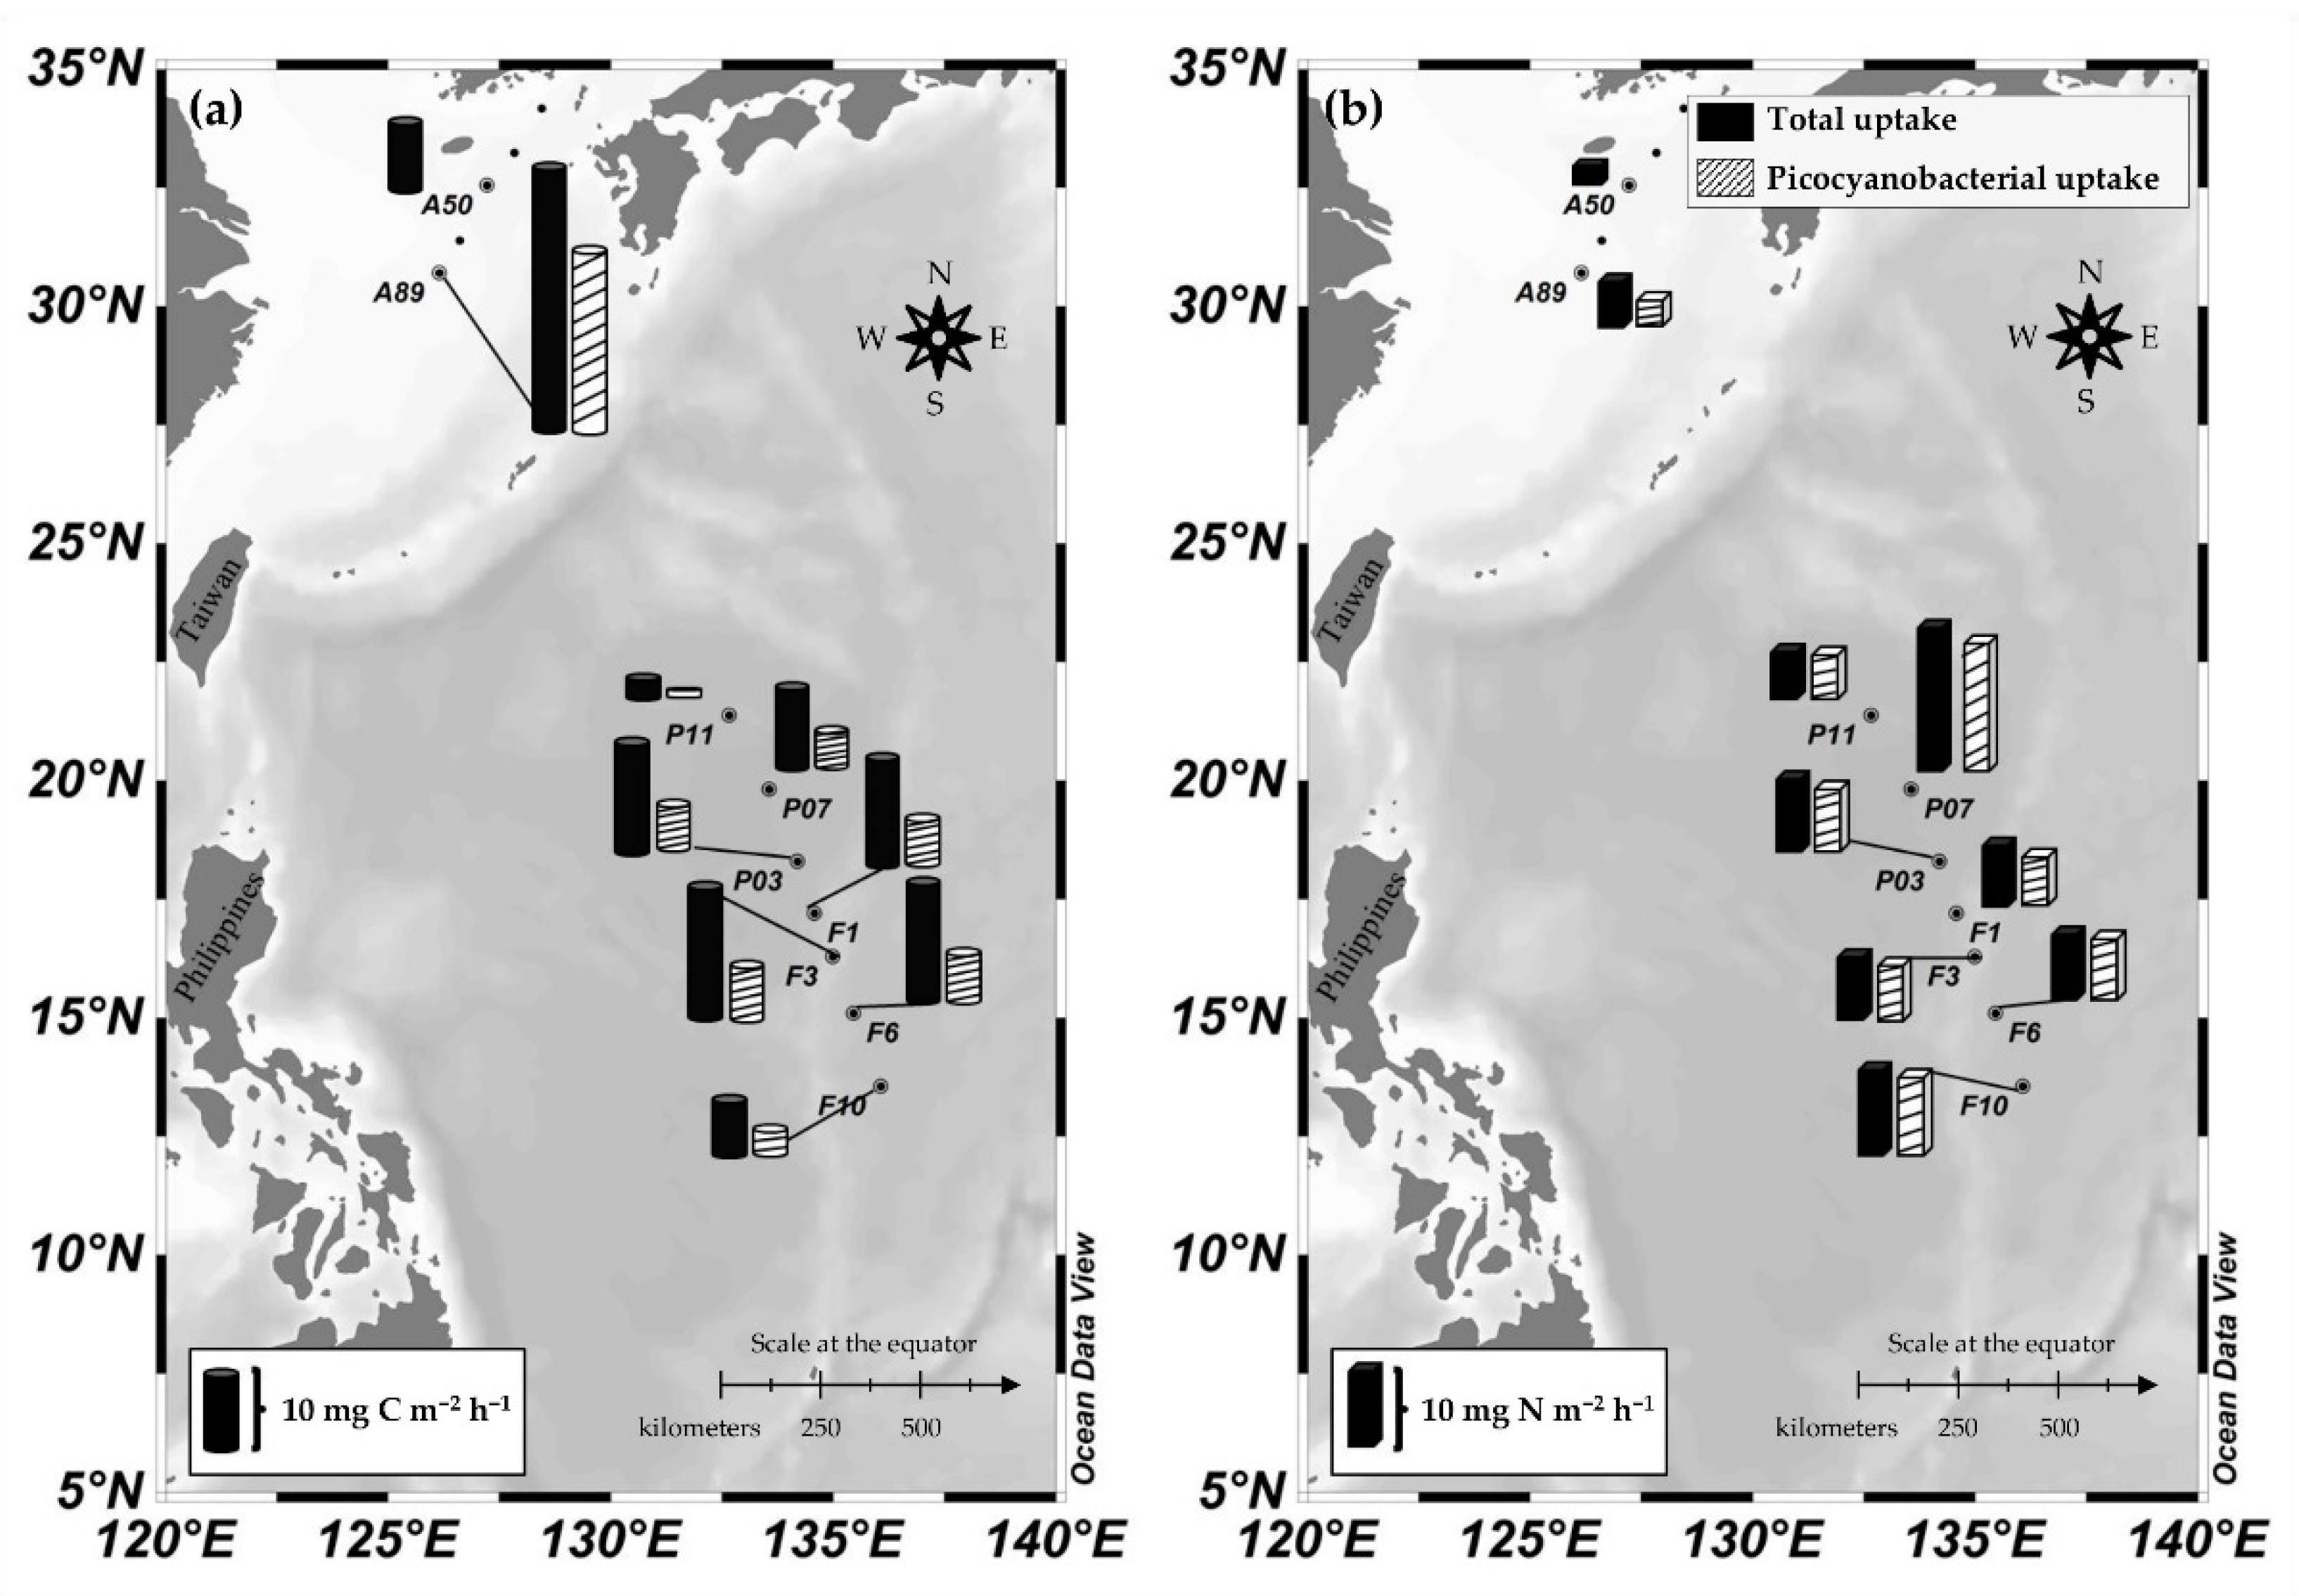
2.1. Study Area and Sample Collection

The present study was conducted at 9 stations in the NPO during the POSEIDON cruise (13 May–4 June 2014) (Figure 1). In order to understand characteristics of primary productivity under the different environmental conditions in the NPO, our productivity stations were divided into two regions; the subtropical and temperate Pacific region (SP; A89 and A50), mainly affected by the coastal water of the ECS and tropical Pacific region (TP; F10, F06, F03, F01, P03, P07, and P11), which are influenced by the Tsushima Warm Current, North Equatorial Current, and Kuroshio Current. Seawater samples from water column up to 1% light depths were collected using 10 L Niskin sampling bottles on the R/V Onnuri of the Korea Institute of Ocean Science and Technology (KIOST, Busan, Korea). The physical parameters (temperature and salinity) were determined using a Sea-Bird 911plus system (Sea-Bird, Inc., Brooklyn, NY, USA).

2.2. Measurements for Biomass and Abundance of Phytoplankton and Nutrient Concentrations

Chlorophyll-a (Chl-a) and phytoplankton abundance, as well as nutrient concentrations were measured at the 9 productivity stations. One liter of seawater for Chl-a concentrations presenting for phytoplankton biomass was filtered onto 25 mm GF/F filters. The filters were stored in a deep freezer and extracted within a month using 6 mL of 95% acetone by the method of Parsons et al. [38]. The final extracts were analyzed using a 10 AU fluorometer (Turner Design Inc., San Jose, CA, USA). Seawater samples for the enumeration and identification of major pico-sized phytoplankton groups (<2 μm) were counted by flow cytometry (BD Accury C6, BD Biosciences Inc., Mountain View, CA, USA) after staining with mixture of yellow-green and UV beads by the method of Olson et al. [39]. Nutrient data were provided by KIOST based on the standard colorimetric procedure [38].

2.3. Carbon and Nitrogen Uptake Rate Measurements

Total carbon and nitrogen uptake rates were measured at the 9 different stations using a 13C-15N dual isotope tracer technique that has been applied in various oceans [27,40,41,42,43]. Seawater samples at 6 light depths (100%, 50%, 30%, 12%, 5%, and 1% of light intensity at surface) were collected from Niskin samplers to 1 L polycarbonate bottles covered with different LEE film screens (LEE Filters, Inc., Hampsire, UK) that corresponded to the different light levels. Further, the water samples were injected with enriched solutions of 13C (NaH13CO3) and 15N (K15NO3 or 15NH4Cl) (less than 10% of the ambient concentrations) followed by deck incubation for 4 h. Hourly picocyanobacterial carbon and nitrogen uptake rates were measured at all the stations except station A50 in the SP using the dual isotope technique. For measuring the picocyanobacterial carbon and nitrogen uptake rates, the autotrophic eukaryotes were inhibited by a metabolic inhibitor (cycloheximide), which blocks the cytoplasmic protein biosynthesis in 80-S ribosome of phytoplankton (eukaryotes) [32]. All the bottles were incubated in deck incubators along with primary productivity sample bottles for 4 h.
After incubation, seawater samples (0.5 L) for the carbon and nitrogen uptake rates were filtered onto the pre-combusted 25 mm GF/F filters. The filters were immediately frozen in the deep freezer until the analysis. Prior to the mass spectrometric analysis, samples were thawed, dried overnight, and packed in tin capsules. Particulate organic carbon (POC)/nitrogen (PON) and the amount of 13C and 15N were determined by Finnigan Delta + XL mass spectrometer at the Stable Isotope Facility, University of Alaska Fairbanks (UAF), USA after HCl fuming during 24 h for removing carbonate. Samples of analyzed total carbon and nitrogen uptake rates were calculated by using the methods of Hama et al. [44] and Dugdale and Goering [45]. Dark carbon uptake rates were subtracted for considering the heterotrophic bacterial process [46]. Because the carbon uptake rates from dark bottles were subtracted from the light bottles for removal of heterotrophic productivity without light, we assumed that only the contributions of autotrophic bacterial (i.e., picocyanobacterial) communities were obtained for the primary productivity.

3. Results

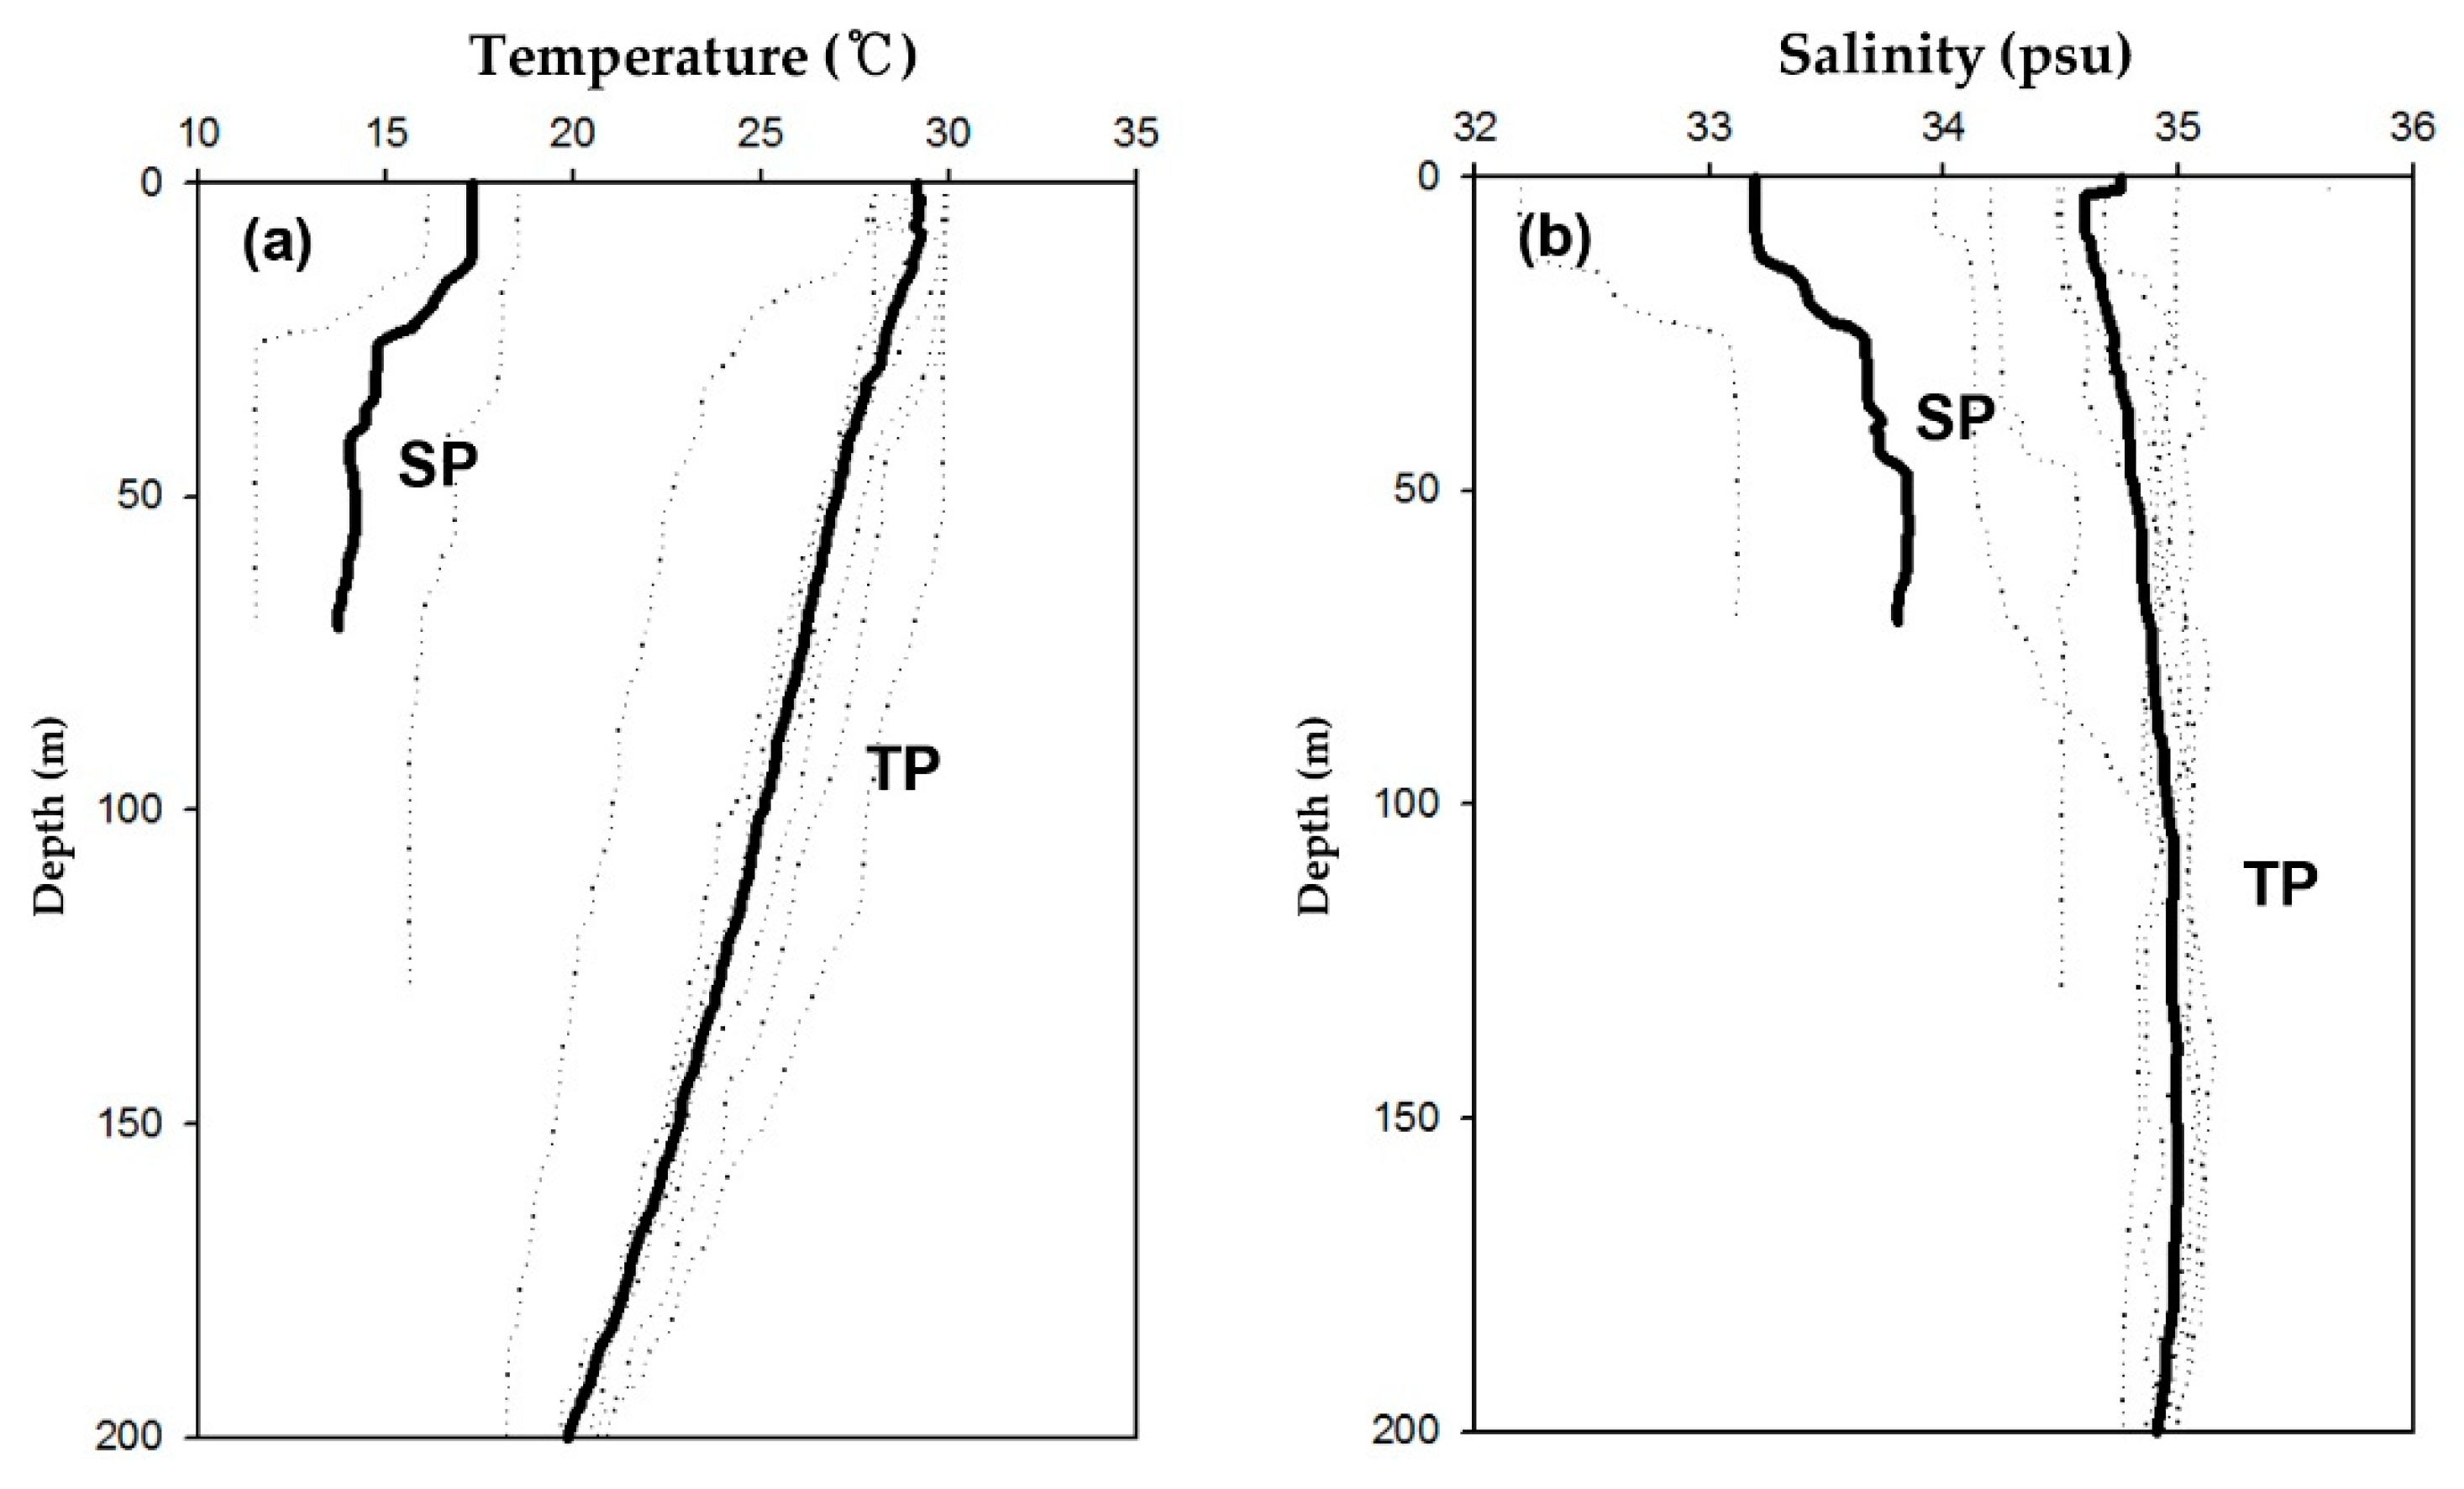
3.1. Physiochemical Structures in Water Column

Vertical profiles of temperature and salinity from all the stations in the NPO are shown in Figure 2. Surface temperature and salinity at the stations in the TP were higher than those in the SP. The average temperature and salinity in the upper water column were 17.3 °C and 33.2 psu in the SP, respectively, whereas they were 29.1 °C (S.D. = ±0.92 °C) and 34.8 psu (S.D. = ±0.52 psu) for TP, respectively.
Generally, nutrient concentrations were depleted in both TP and SP regions except for 1% light depths (Figure 3). The mean nitrate concentrations within the euphotic zone were 0.13 (S.D. = ±0.35 µM) and 0.84 µM (S.D. = ±1.80 µM) in the TP and the SP, respectively. Ammonium concentrations were consistently low at euphotic zones of all the stations. The mean ammonium concentrations in the TP and the SP were 0.14 (S.D. = ±0.07 µM) and 0.18 µM (S.D. = ±0.03 µM), respectively. The euphotic depths at the stations in the TP were deeper than those in the SP (t-test, p < 0.05). The mean euphotic depths were 127.4 m (S.D. = ±16.5 m) and 35.0 m in the TP and the SP, respectively (Table 1).

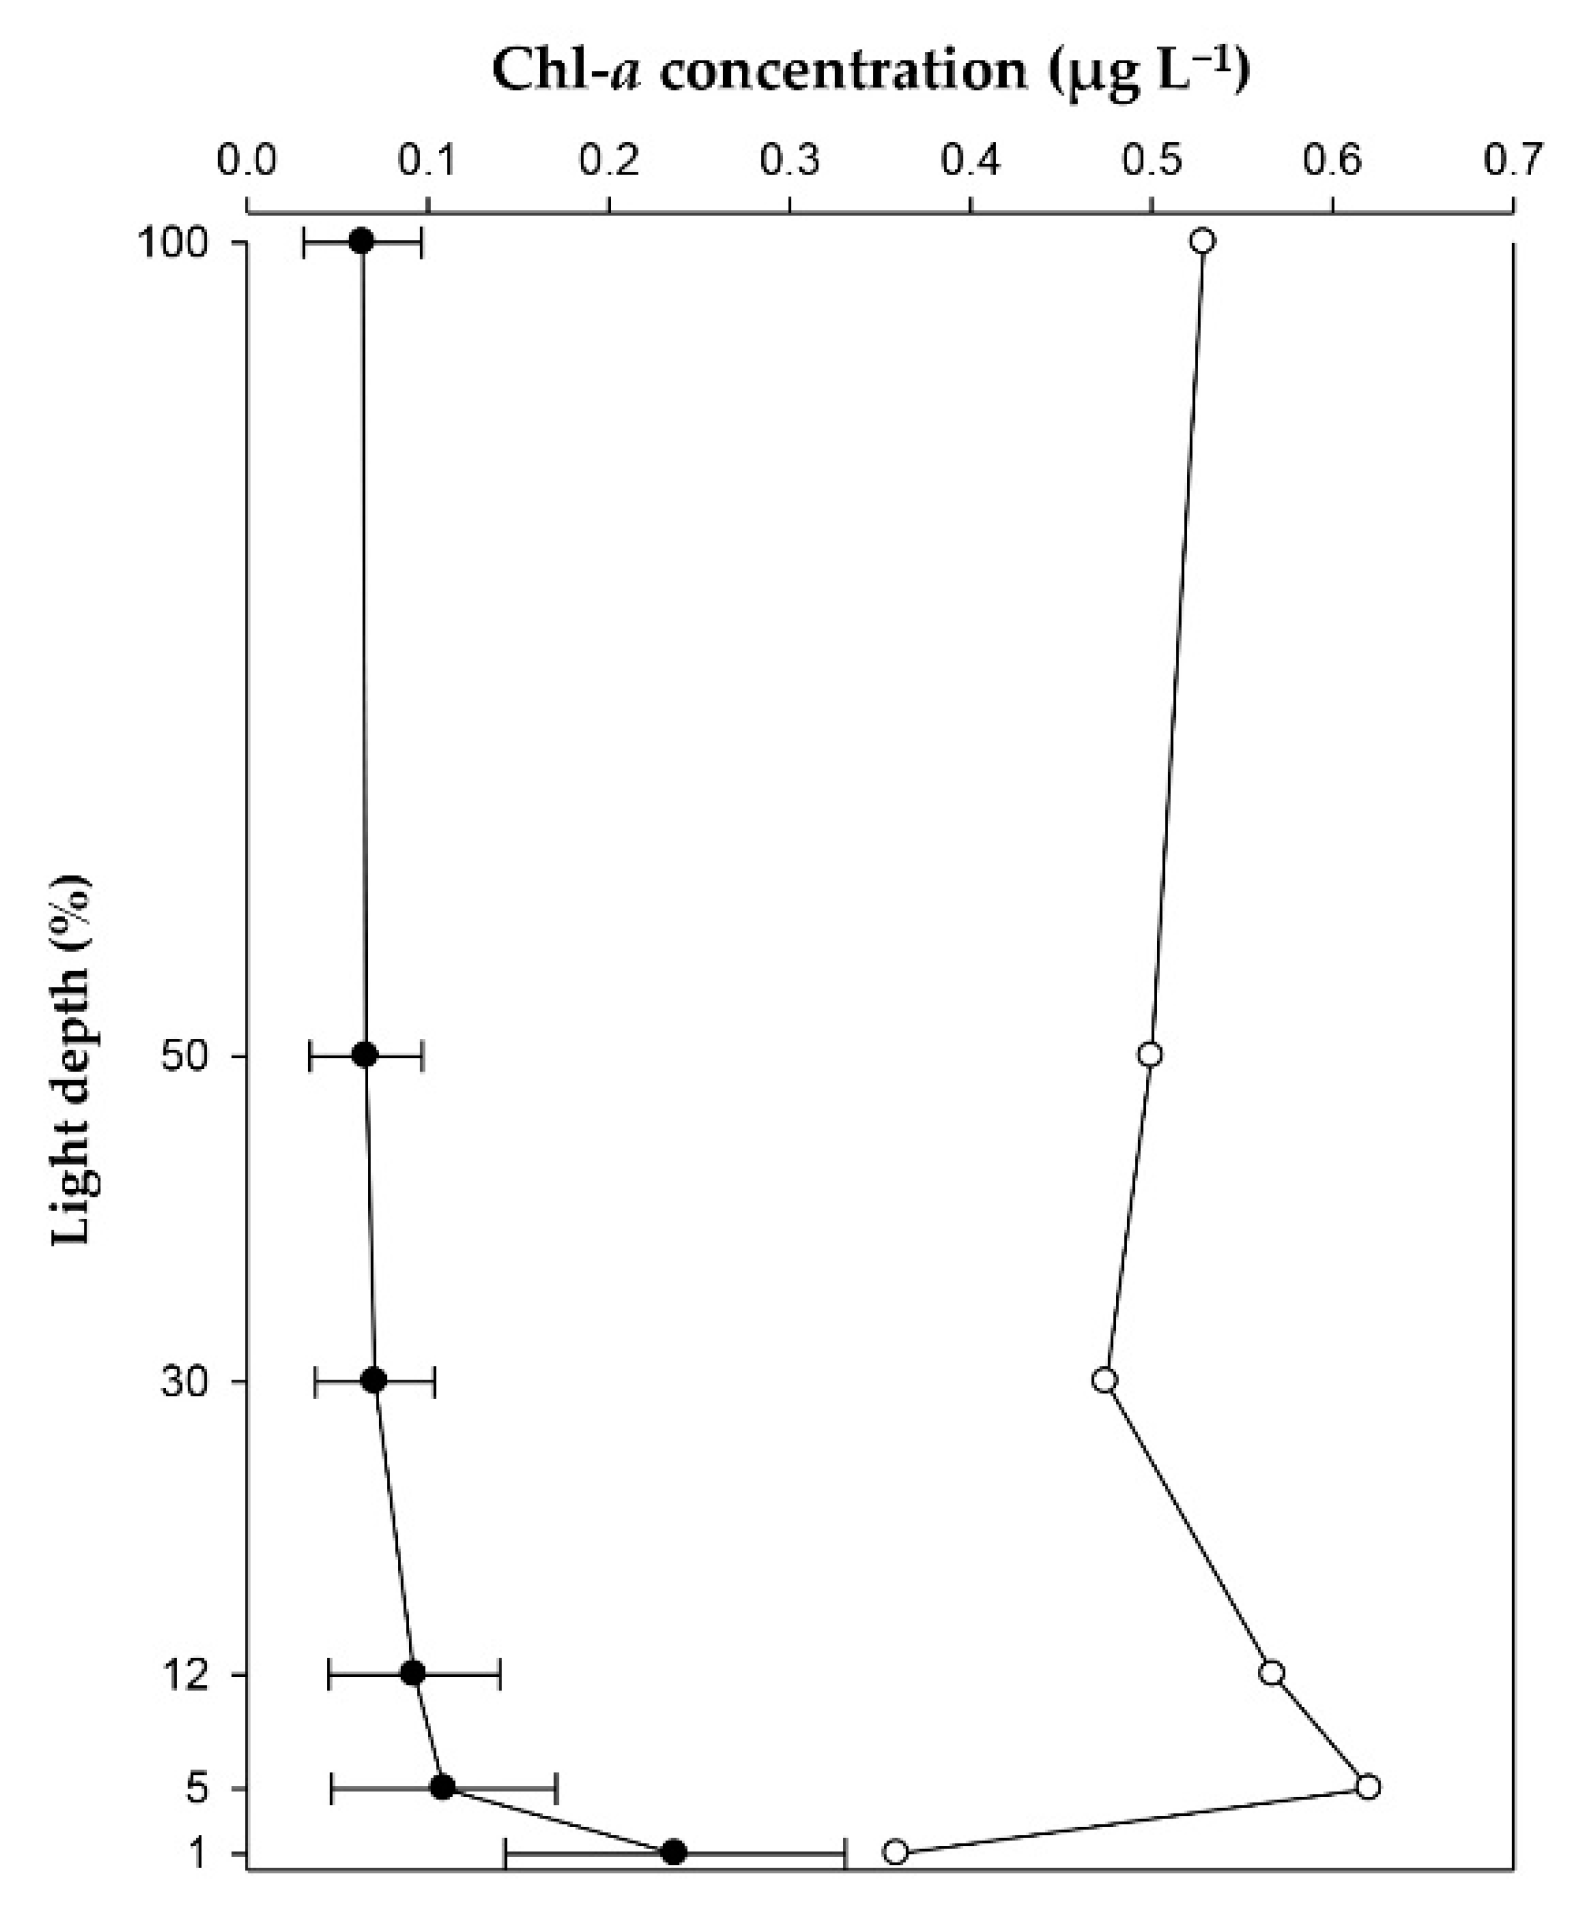
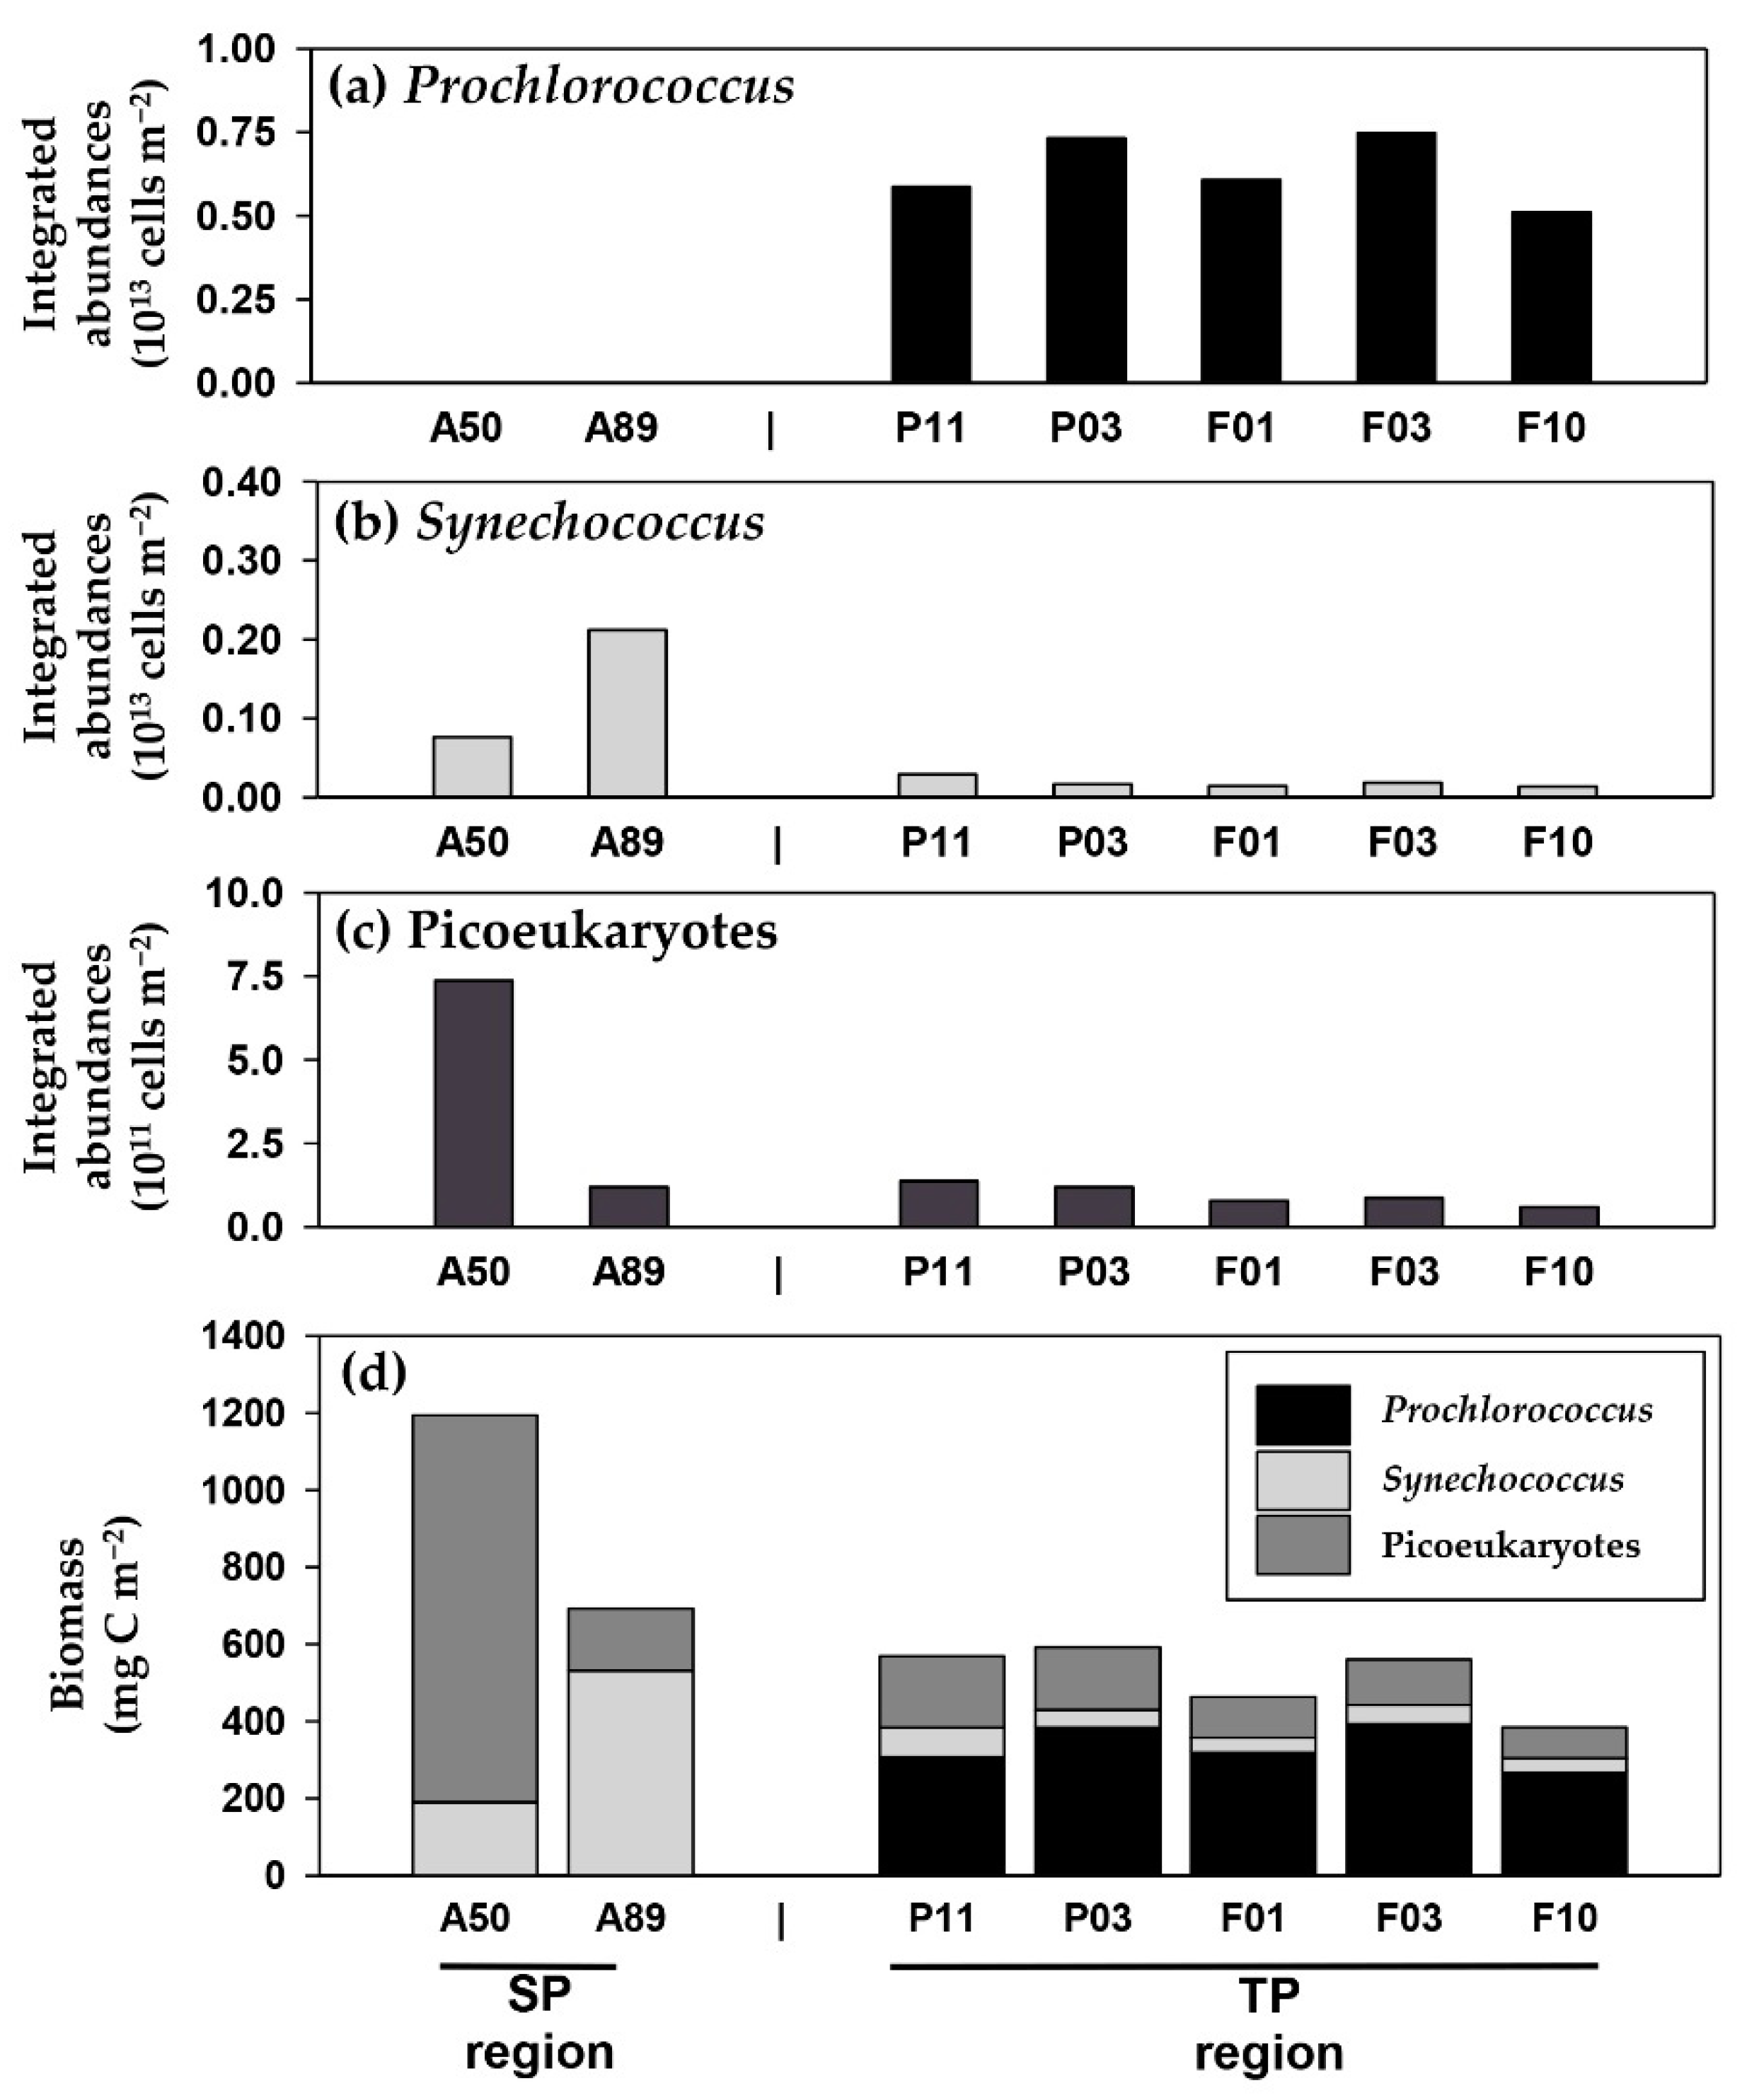
3.2. Distribution of Phytoplankton in Water Column

The average euphotic depth-integral total Chl-a concentrations were 15.0 (S.D. = ±6.6 mg Chl-a m−2) and 18.1 mg Chl-a m−2 in the TP and SP, respectively (Table 2). Although the integral total Chl-a concentrations were not significantly different between the TP and SP locations (Table 2), the vertical distributions of Chl-a were obviously different between the two locations (Figure 4). Deep chlorophyll maximum (DCM) layers, in which the Chl-a concentrations were significantly (t-test, p < 0.01) higher compared to those at the surface, were observed at the bottom (1% light depth) of the euphotic zone in the TP. However, no substantial DCM layers were found in the SP (Figure 4).
The cell abundance of autotrophic plankton, including picocyanobacteria (Synechococcus and Prochlorococcus) and picoeukaryotes, were different between the TP and the SP (Figure 5). The average depth-integral abundance of Synechococcus, Prochlorococcus, and picoeukaryotes in the TP were 1.85 × 10¹¹ (S.D. = ±0.64 × 10¹¹ cells m−2), 0.64 × 10¹³ (S.D. = ±0.10 × 10¹³ cells m−2), and 0.96 × 10¹¹ cells m−2 (S.D. = ±0.31 × 10¹¹ cells m−2), respectively (Figure 5). In the SP, the cell abundance of Synechococcus and picoeukaryotes were 14.4 × 10¹¹ and 4.28 × 10¹¹ cells m−2, respectively. No Prochlorococcus were generally found in the SP except some at 46 m of A89 (Figure 5). Consequently, Prochlorococcus (mean ± S.D. = 95.7 ± 1.4%), Synechococcus (mean ± S.D. = 2.8 ± 1.0%), and picoeukaryotes (mean ± S.D. = 1.4 ± 0.4%) contributed the plankton community in the TP. In contrast, Synechococcus accounted for 93.5% and 50.8%, whereas picoeukaryotes were 5.2% and 49.2% at A89 and A50 in the SP, respectively.

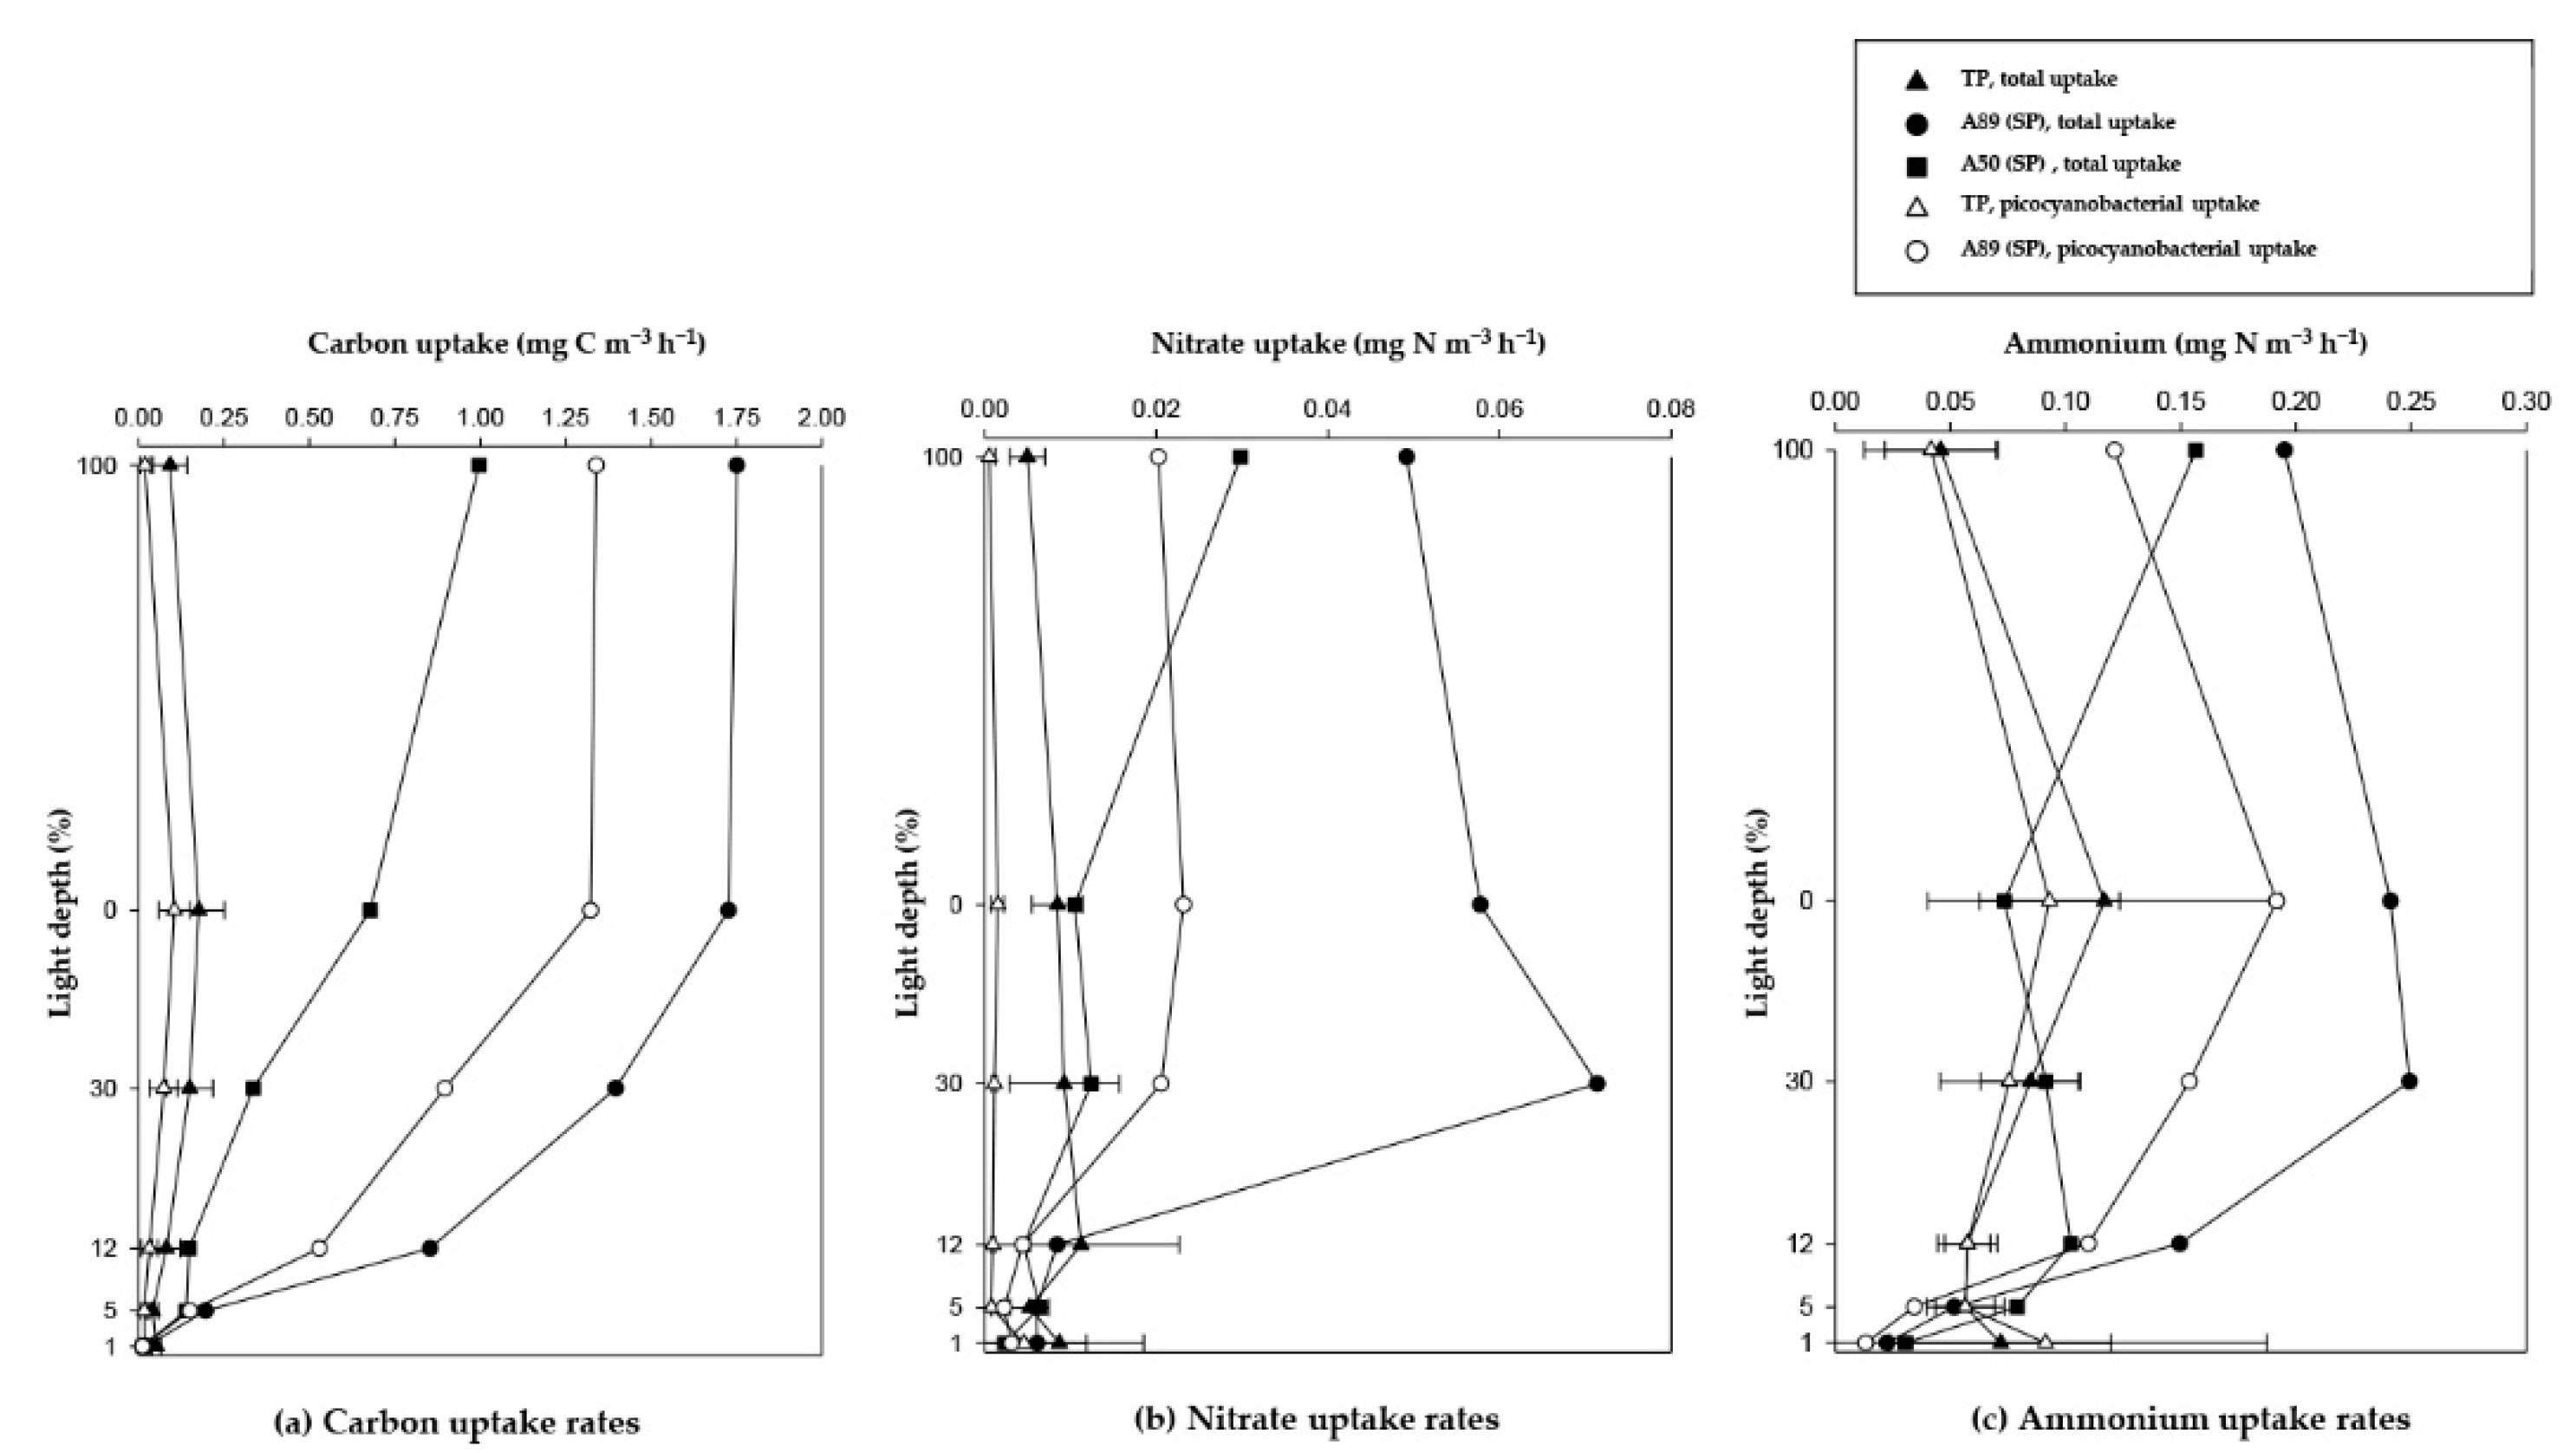
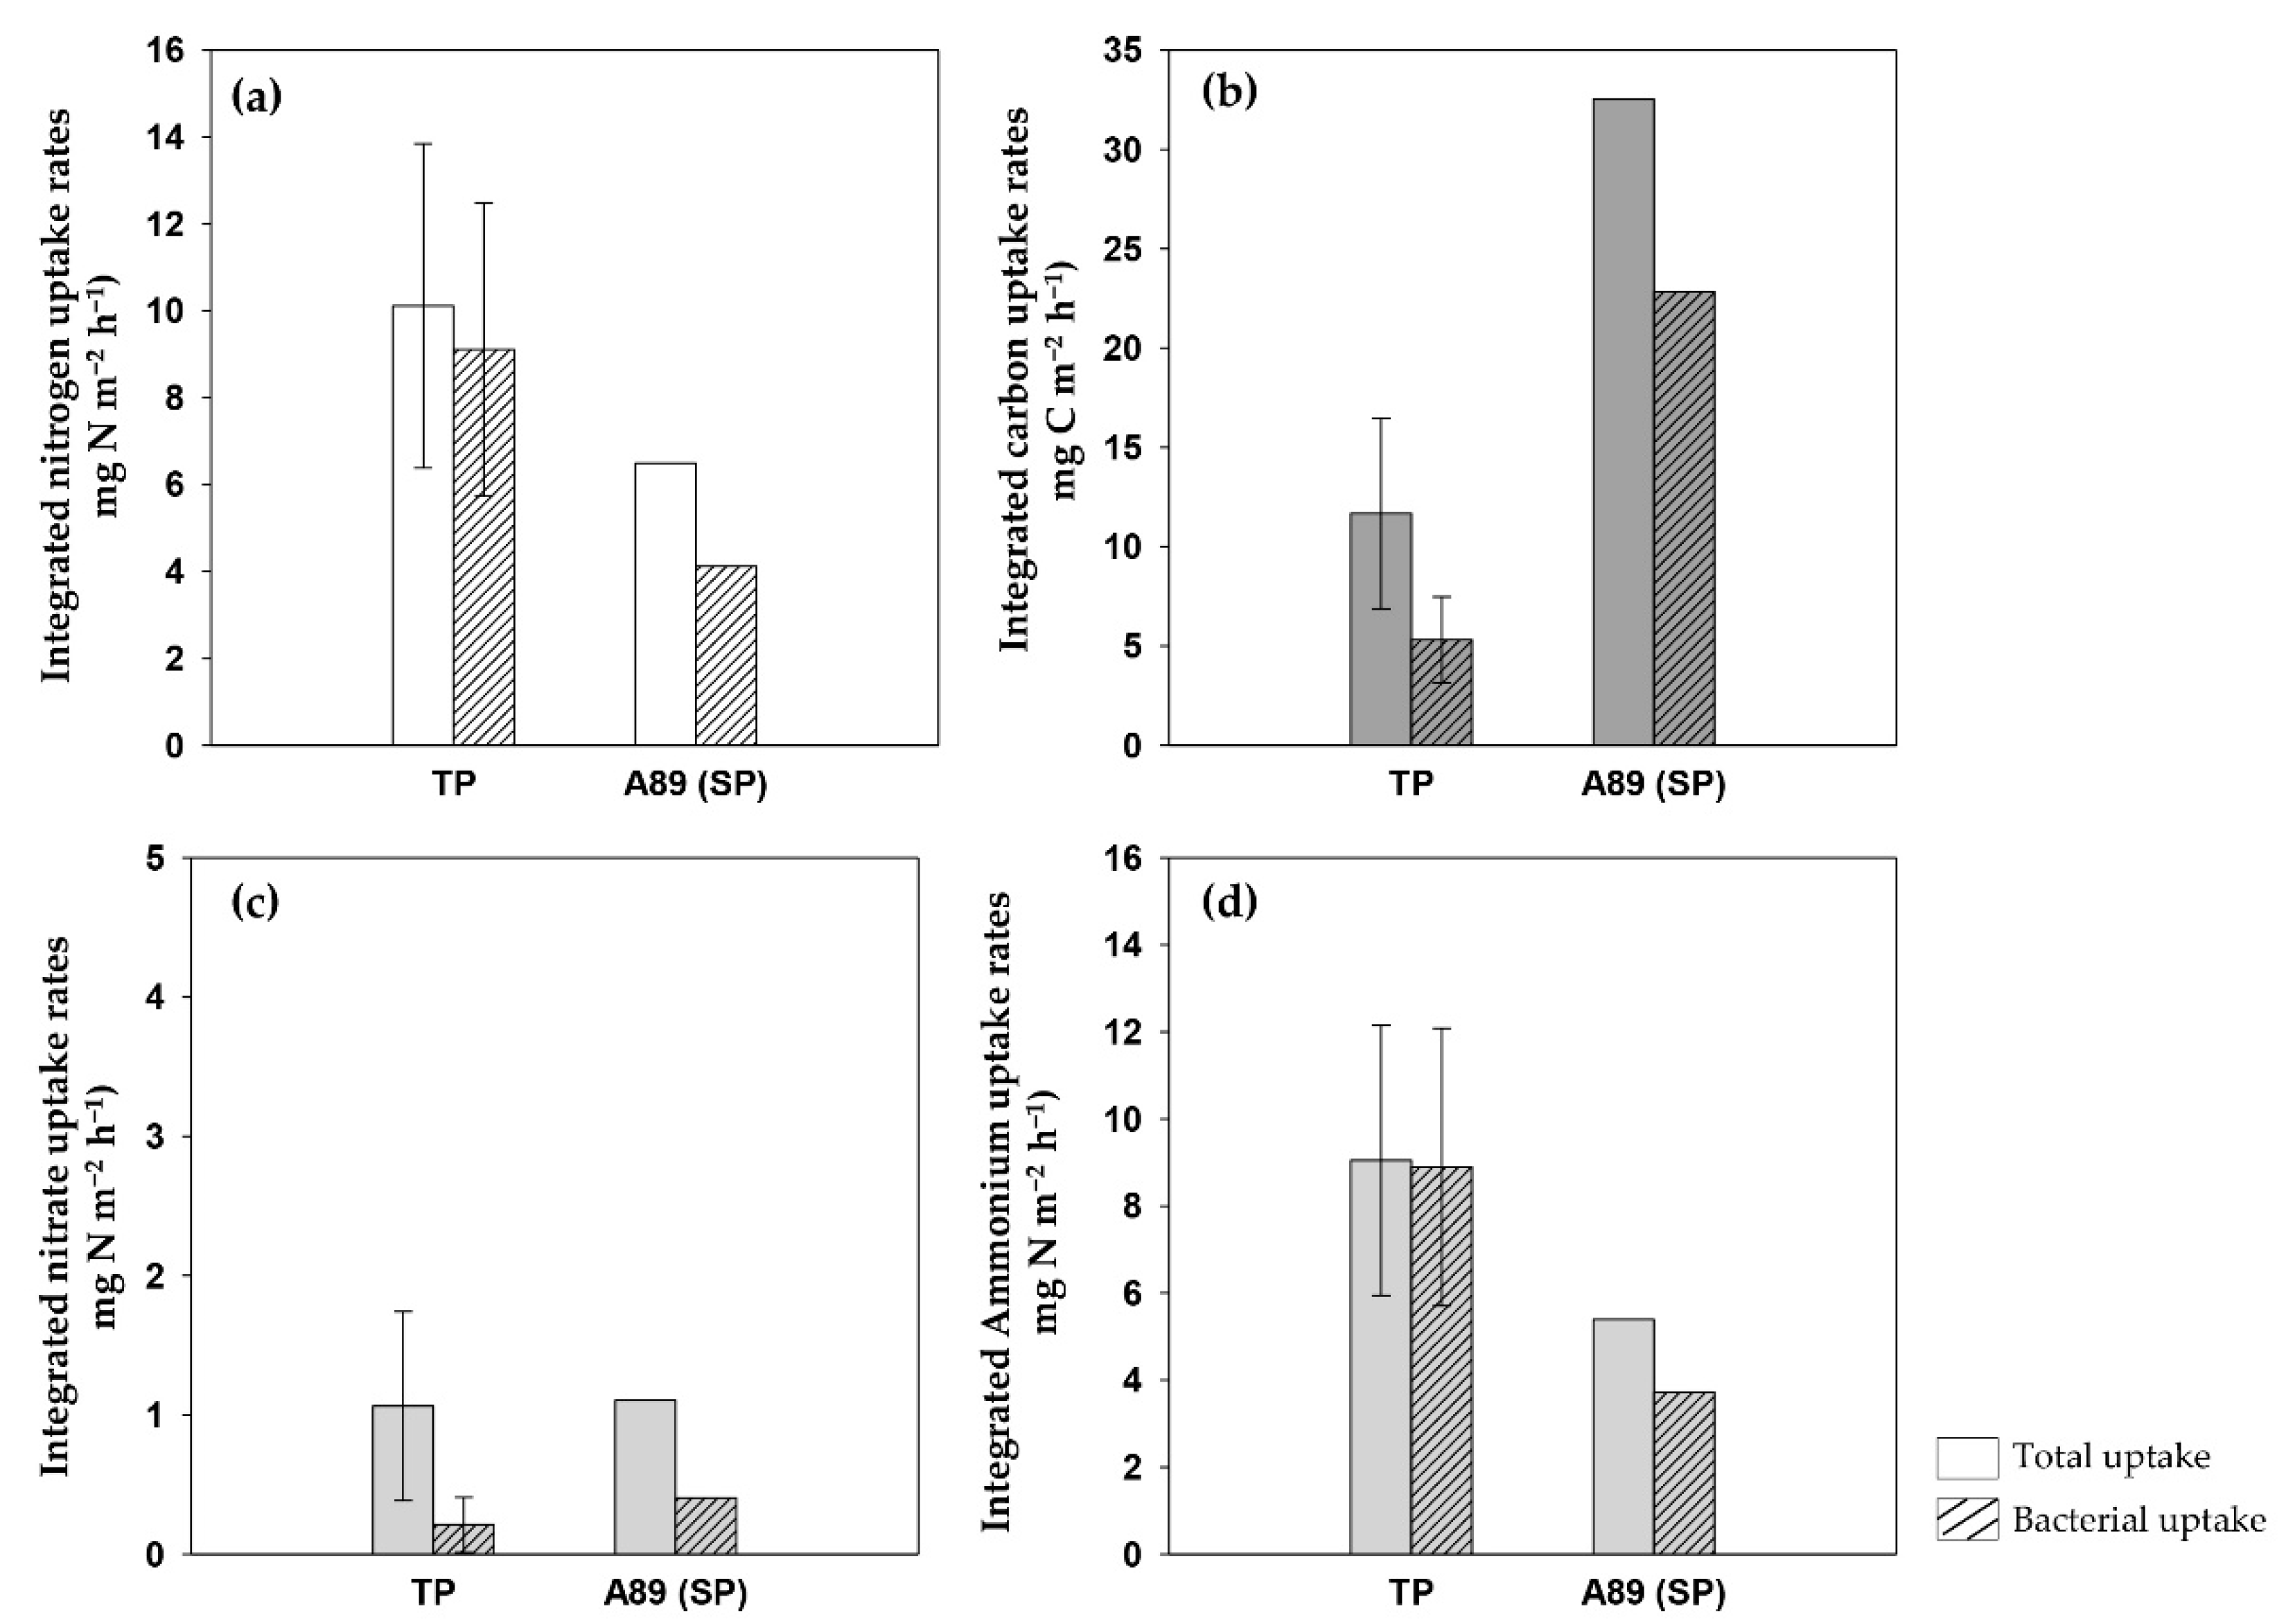
3.3. Total Carbon and Nitrogen Uptake Rates in the NPO

The largest carbon uptake rate was at 100% light depth at each station in the SP, whereas in the TP, the largest rate was observed at 30–50% light depths (Figure 6a). The lowest carbon uptake rate was found at the chlorophyll-maximum layer corresponding to 1% light depth in the SP. The average rates of carbon uptake at each light depth were significantly higher in the SP (t-test, p < 0.05) than in the TP. The ranges of depth-integrated carbon uptake rates in the TP and SP were 3.29–16.89 mg C m−2·h−1 with an average of 11.66 mg C m−2·h−1 and 9.17–32.54 mg C m−2·h−1 with an average of 20.85 mg C m−2·h−1, respectively (Figure 7a and Table 2). Based on our dark carbon uptake rates in this study, the heterotrophic contributions to the total primary productions were 1.5% (S.D. = ±0.7%) and 8.7% (S.D. = ±12.8%) for the SP and the TP, respectively.
Nitrogen uptake rates did not show any significant pattern with light depths as carbon uptake rates (Figure 6b,c). The depth-integrated nitrogen (nitrate+ammonium) uptake rates in the TP and SP ranged from 6.52 to 17.96 mg N m−2·h−1 with an average of 10.11 mg N m−2·h−1 and from 2.98 mg N m−2·h−1 to 6.50 mg N m−2·h−1 with an average of 4.74 mg N m−2·h−1, respectively (Figure 7b and Table 2). In detail, the mean of nitrate and ammonium uptake rates in the TP were 1.06 mg N m−2·h−1 and 9.05 mg N m−2·h−1, respectively, whereas those in the SP were 0.69 mg N m−2·h−1 and 4.05 mg N m−2·h−1, respectively. Ammonium uptake rates were substantially higher than nitrate uptake rates in both regions.

3.4. Picocyanobacterial Carbon and Nitrogen Uptakes in the NPO

The average rates of picocyanobacterial carbon uptakes showed similar trends like vertical abundance profiles of these predominant species (Figure 8). Vertical profiles of picocyanobacterial carbon, nitrate, and ammonium uptake rates showed similar trends as those of the uptake rates by total phytoplankton community at each light depth (Figure 6). Picocyanobacterial carbon uptake rates integrated from the euphotic depths were 5.31 mg C m−2·h−1 (S.D. = ±2.16 mg C m−2·h−1) in the TP, whereas the integrated carbon uptake rates by picocyanobacteria at the A89 (SP) was 22.8 mg C m−2·h−1 (Figure 9a). The average rates of picocyanobacterial carbon uptake at each light gradient were significantly higher in the SP (Table 3; t-test, p < 0.05). Integrated hourly picocyanobacterial nitrogen uptake rates were 6.32–16.16 mg N m−2·h−1 with an average of 9.10 mg N m−2·h−1 in the TP and 4.12 mg N m−2·h−1 at the A89 in the SP (Figure 7b and Figure 9b). The average nitrate uptake rates by picocyanobacterial communities in the TP and A89 (SP) were 0.21 mg N m−2·h−1 (S.D. = ±0.20 mg N m−2·h−1) and 0.40 mg N m−2·h−1, respectively, whereas the average ammonium uptake rates of picocyanobacterial communities were 8.89 mg N m−2·h−1 (S.D. = ±3.18 mg N m−2·h−1) and 3.72 mg N m−2·h−1, respectively (Table 3). Picocyanobacterial ammonium uptake rates were more than the nitrate uptake rates in the NPO (Figure 9c,d).

4. Discussion

In this study, the abundance of picophytoplankton was different between the TP and the SP (Figure 5). Prochlorococcus were not found but Synechococcus and picoeukaryotes co-occurred in the SP, whereas Prochlorococcus were the dominant picophytoplankton population in the TP. The difference in abundance of dominant population observed in the TP and the SP might be due to different physico-chemical properties as the result of the major currents. Because distribution and abundance of phytoplankton in the euphotic zone can be altered by the hydrological conditions of the seawater, these physiochemical properties are determined by the major currents [47,48,49,50]. In fact, the TP is directly influenced by North Equatorial Current, whereas the SP is influenced mainly by the Kuroshio Current, Tsushima Warm Current, and coastal fresh water, respectively [16,51]. According to Choi et al. [24], the picocyanobacterial distribution in the NPO was distinguished along the physical and chemical properties of the water masses. In this study, the water depth in the SP was shallow and had lower temperature and salinity than the TP (Figure 2), whereas the TP was a typical high-temperature oligotrophic water. Since Prochlorococcus have been found to be more abundant in the oligotrophic conditions because of their ecological plasticity with respect to requirements of nutrients and light [18,52,53,54,55], Prochlorococcus could be dominant under temperature and oligotrophic TP. According to previous studies [12,55], Synechococcus are usually dominant in the mesotrophic seawater or shallow waters. Thus, Synechococcus and picoeukaryotes could be abundant in relatively mesotrophic and shallow SP, which is consistent with previous study from the western Pacific Ocean [54].
In terms of carbon biomasses estimated from the average carbon contents [56,57], Prochlorococcus contributed 66.1% to the total phytoplankton in the TP (Figure 5d). In the SP, Synechococcus were 76.4% at A89 and picoeukaryotes were 84.0% at A50, respectively. Especially, the carbon biomass contribution of picoeukaryotes was higher than that of Synechococcus at the A50, although picoeukaryotes had lower cell abundances than Synechococcus, because picoeukaryotes have higher carbon contents compared to Synechococcus.
Based on the hourly carbon uptake rates by total phytoplankton, which were estimated in this study, the average daily primary productivities were 0.15 g C m−2·d−1 (S.D. = ±0.06 g C m−2·d−1) and 0.29 g C m−2·d−1 in the TP and SP, respectively (Table 4). Our daily primary productivities fell within the range of previous studies in both regions [4,5,51]. In the TP, Taniguchi [4] reported 0.09 g C m−2·d−1 in the North Equatorial Current (Table 4). Kwak et al. [5] observed a relatively higher range of daily primary productivity from 0.17 to 0.23 g C m−2·d−1 in the western Pacific Ocean (Table 4). For the SP, the average daily primary productivity obtained from this study is comparable with those from other previous studies [5,51]. Gong et al. [51] reported 0.31 ± 0.16 g C m−2·d−1 and 0.52 ± 0.32 g C m−2·d−1 during early spring and summer, respectively (Table 4). Our daily primary productivity is nearly identical to the daily production (0.28 g C m−2·d−1) reported by Kwak et al. [5] (Table 4).
Daily total ammonium uptake rates were calculated by multiplying hourly nitrogen uptake rates and each photoperiod [58] in this study. The average daily total ammonium uptake rates were higher than total nitrate uptakes in the euphotic zone of both regions. The average daily total ammonium and nitrate uptake rates were 0.16 g N m−2·d−1 (S.D. = ±0.06 g N m−2·d−1) and 0.01 g N m−2·d−1 (S.D. = ±0.01 g N m−2·d−1) in the TP, respectively (Table 4). In the SP, the daily total ammonium and nitrate uptake rates were 0.07 g N·m−2 d−1 and 0.01 g N m−2·d−1 at A89, respectively (Table 4). Accordingly, average f-ratios ([nitrate uptake rate]/[nitrate+ammonium uptake rate], [59]) were 0.10 (S.D. = ±0.03) and 0.13 in the TP and SP (Table 2), respectively, as a result of prominent ammonium uptakes. This indicates that a main nitrogen source for growth of total autotrophic plankton was mainly supported by regenerated ammonium in this region during our observation period.
In this study, the average picocyanobacterial contributions to the total primary productivity accounted for 45.2% (S.D. = ±4.8%) in the TP and 70.2% in the A89 (SP) (Figure 9a). Glover et al. [12] reported that contribution of Synechococcus to the total primary production, which varies from 6% to 46% in different water masses in the northwestern Atlantic Ocean. In contrast, Liu et al. [15] observed a high contribution of Prochlorococcus up to 82% to the primary production at Station ALOHA in the subtropical North Pacific Ocean.
Based on each nitrate and ammonium uptake rate, the average picocyanobacterial f-ratios were 0.02 (S.D. = ±0.01) and 0.10 in the TP and A89 (SP), respectively (Table 3). This result suggests that picocyanobacterial communities strongly depended on a regenerated nitrogen source (i.e., ammonium) or N2 fixation in our study area during the observation period. From the comparison of f-ratios between the total phytoplankton and picocyanobacterial communities, we found that picocyanobacterial f-ratios were substantially lower compared to those of the total phytoplankton communities in the two regions (Table 2 and Table 3).
Depth integrated hourly nitrogen uptake rates of picocyanobacterial communities were 9.10 mg N m−2·h−1 (S.D. = ±3.73 mg N m−2·h−1) and 4.12 mg N m−2·h−1 in the TP and the A89 (SP), respectively (Figure 9). The total nitrogen uptake rates at the same regions were 10.11 mg N m−2·h−1 and 6.50 mg N m−2·h−1, respectively. Given the nitrogen uptake rates, the average picocyanobacterial contributions to the total nitrogen uptake rates were 90.2% (S.D. = ±5.3%) and 63.5% in the TP and the A89 (SP), respectively, in this study. These picocyanobacterial contributions to the total nitrogen uptake rates are substantially higher than those to the total carbon uptake rates of the total plankton communities in TP. However, the nitrogen utilization by heterotrophic bacteria can be important since the heterotrophic bacteria account for a large fraction of nitrogen uptake in the global ocean including the Arctic Ocean [32,60,61]. Although we are incapable of distinguishing each contribution for nitrogen uptake between heterotrophic bacteria and picocyanobacteria from this study using a metabolic inhibitor (cycloheximide) blocking only photosynthetic eukaryotes, we need to consider the heterotrophic bacterial nitrogen utilization from the nitrogen contributions in future studies. Apart from this, the potential N2 fixation by cyanobacteria can vary with environmental conditions, particularly nutrient stoichiometry [62]. When the NH4+ concentration is relatively higher than phosphorous, the nitrogenase activity can be stopped and photosynthesis can be activated. On the other hand, if the NH4+:P ratio is lower than the Redfield’s ratio, N2 fixation can be a more major process than primary production. So, the contribution of picocyanobacteria towards the total primary production can be underestimated in that case. Furthermore, when autotrophic primary production is stopped by the inhibitor, the competition for nutrients in the samples may be lesser than one with autotrophic activity and, hence, the primary production rates by picocyanobacteria could be overestimated. Currently, there are some uncertainties for estimating picocyanobacterial contributions to the primary production and nitrogen uptake rates. Therefore, the combined approaches using several different applications are highly important for further future studies on cyanobacterial ecological roles in various oceans.

5. Summary and Conclusions

In this study, we measured picocyanobacterial contribution to the carbon and nitrogen uptake rates by total phytoplankton in the regions of the NPO. There are different abundances and biomasses of dominant species in the TP and the SP regions. Prochlorococcus and Synechococcus were abundant in the TP and the SP regions, respectively. The picocyanobacterial contributed 45.2% (S.D. = ±4.8%) to primary production by total picophytoplankton in the TP, whereas the picocyanobacterial contribution was about 70.2% in the SP. The picocyanobacterial community is believed to be more important in terms of nitrogen uptake rates since they could contribute about 90.2% (S.D. = ±5.3%) to the total nitrogen uptake rates by picophytoplankton in both regions.
The importance of picoplankton including cyanobacteria has been raised continuously in research regarding the global ocean [25,63,64]. In particular, the picocyanobacterial Prochlorococcus and Synechococcus have significant ecological positions in the biomass and production in the ocean, but the relative contributions of these organisms to primary productivity are different under various environmental conditions [22]. Under the global warming scenario, picoplankton contribution relative to large plankton will increase in the strongly stratified upper ocean [3]. This climate change will result in increasing distribution, abundance, and contributions to primary production of picocyanobacteria, especially in tropical and subtropical oceans and, consequently, will cause large impacts on the global ocean ecosystem and biogeochemical cycles [26]. Therefore, more measurements under various environmental conditions are needed to better understand the role of picocyanobacterial in the ecosystem.

Author Contributions

Conceptualization, H.-W.L., J.-H.N. and S.-H.L.; methodology, H.-W.L., P.S.B. and S.-H.L.; validation, H.-W.L., J.-H.N. and S.-H.L.; formal analysis, H.-W.L., J.-H.N., D.-H.C., J.-J.K., J.-H.L. and K.-W.K.; investigation, H.-W.L., J.-H.N. and D.-H.C.; writing—original draft preparation, H.-W.L.; writing—review and editing, M.Y., P.S.B. and S.-H.L.; visualization, J.-J.K., J.-H.L., K.-W.K. and H.-K.J.; supervision, S.-H.L. All authors have read and agreed to the published version of the manuscript.

Funding

This research was supported by the National Research Foundation of Korea (NRF) grant funded by the Korean government (MSIT; NRF-2019R1A2C1003515) and partly by the Korea Institute of Ocean Science and Technology (KIOST; PE99923).

Institutional Review Board Statement

Not applicable.

Informed Consent Statement

Not applicable.

Data Availability Statement

Not applicable.

Acknowledgments

We thank the captain and crew members of the R/V Onnuri for their outstanding assistance. Especially, we very much appreciate the KIOST for providing CTD and nutrient data. Finally, we thank the anonymous reviewers who greatly improved an earlier version of manuscript.

Conflicts of Interest

The authors declare no conflict of interest.

References

  1. Behrenfeld, M.J.; Randerson, J.T.; McClain, C.R.; Feldman, G.C.; Los, S.O.; Tucker, C.J.; Falkowski, P.G.; Field, C.B.; Frouin, R.; Esaias, W.E.; et al. Biospheric primary production during an ENSO transition. Science 2001, 291, 2594–2597. [Google Scholar] [CrossRef] [Green Version]
  2. Howarth, R.W. Nutrient Limitation of Net Primary Production in Marine Ecosystems. Annu. Rev. Ecol. Syst. 1988, 19, 89–110. [Google Scholar] [CrossRef]
  3. Morán, X.A.G.; López-Urrutia, Á.; Calvo-Díaz, A.; LI, W.K.W. Increasing importance of small phytoplankton in a warmer ocean. J. Glob. Chang. Biol. 2010, 16, 1137–1144. [Google Scholar] [CrossRef]
  4. Taniguchi, A. Geographical variation of primary production in the Western Pacific Ocean and adjacent seas with reference to the inter-relations between various parameters of primary production. Mem. Fac. Fish. Hokkaido Univ. 1972, 19, 1–33. [Google Scholar]
  5. Kwak, J.H.; Hwang, J.; Choy, E.J.; Park, H.J.; Kang, D.J.; Lee, T.; Chang, K.I.; Kim, K.R.; Kang, C.K. High primary productivity and f-ratio in summer in the Ulleung basin of the East/Japan Sea. Deep-Sea Res. I 2013, 79, 74–785. [Google Scholar] [CrossRef]
  6. Lee, S.H.; Yun, M.S.; Kim, B.K.; Saitoh, S.; Kang, C.K.; Kang, S.H.; Whitledge, T. Latitudinal carbon productivity in the Bering and Chukchi Seas during the summer in 2007. Cont. Shelf Res. 2013, 59, 28–36. [Google Scholar]
  7. Lee, S.H.; Yun, M.S.; Kim, B.K.; Joo, H.T.; Kang, S.H.; Kang, C.K.; Whitledge, T.E. Contribution of small phytoplankton to total primary production in the Chukchi Sea. Cont. Shelf Res. 2013, 68, 43–50. [Google Scholar] [CrossRef]
  8. Kim, B.K.; Joo, H.T.; Song, H.J.; Yang, E.J.; Lee, S.H.; Hahm, D.; Rhee, T.S.; Lee, S.H. Large seasonal variation in phytoplankton production in the Amundsen Sea. Polar Biol. 2015, 38, 319–331. [Google Scholar] [CrossRef]
  9. Fuhrman, J.A.; Hagström, Å. Bacterial and Archaeal Community Structure and its Patterns. In Microbial Ecology of the Oceans, 2nd ed.; Kirchman, D.L., Ed.; Wiley-Blackwell: Hoboken, NJ, USA, 2008; pp. 45–90. [Google Scholar]
  10. Lee, C.R.; Choi, K.H.; Kang, H.K.; Yang, E.J.; Noh, J.H.; Choi, D.H. Biomass and trophic structure of the plankton community in subtropical and temperate waters of the northwestern Pacific Ocean. J. Oceanogr. 2012, 68, 473–482. [Google Scholar] [CrossRef]
  11. Li, W.K.W.; Rao, D.V.S.; Harrison, W.G.; Smith, J.C.; Cullen, J.J.; Irwin, B.; Platt, T. Autotrophic picoplankton in the tropical ocean. Science 1983, 219, 292–295. [Google Scholar] [CrossRef]
  12. Glover, H.E.; Campbell, L.; Prezelin, B.B. Contribution of Synechococcus spp. to size-fractioned primary productivity in three water masses in the Northwest Atlantic Ocean. Mar. Biol. 1986, 91, 193–203. [Google Scholar] [CrossRef]
  13. Vaulot, D. The Cell Cycle of Phytoplankton: Coupling Cell Growth to Population Growth. In Molecular Ecology of Aquatic Microbes; NATO ASI Series (Series G: Ecological Sciences); Joint, I., Ed.; Springer: Berlin/Heidelberg, Germany, 1995. [Google Scholar] [CrossRef]
  14. Chavez, F.P.; Buck, K.R.; Service, S.K.; Newton, J.; Barber, R.T. Phytoplankton variability in the central and eastern tropical pacific. Deep Sea Res. II 1996, 43, 835–870. [Google Scholar] [CrossRef]
  15. Liu, H.; Nolla, H.A.; Campbell, L. Prochlorococcus growth rate and contribution to primary production in the equatorial and subtropical North Pacific Ocean. Aquat. Microb. Ecol. 1997, 12, 39–47. [Google Scholar] [CrossRef] [Green Version]
  16. Choi, D.H.; Selph, K.E.; Noh, J.H. Niche partitioning of picocyanobacterial lineages in the oligotrophic northwestern Pacific Ocean. Algae 2015, 30, 223–232. [Google Scholar] [CrossRef]
  17. Bhavya, P.S.; Min, J.O.; Kim, M.S.; Jang, H.K.; Kim, K.; Kang, J.J.; Lee, J.H.; Lee, D.; Jo, N.; Kim, M.J.; et al. A Review on Marine N2 Fixation: Mechanism, Evolution of Methodologies, Rates, and Future Concerns. Ocean Sci. J. 2019, 54, 515–528. [Google Scholar] [CrossRef]
  18. Vaulot, D.; Partensky, F.; Neveux, J.; Mantoura, R.F.C.; Llewellyn, C.A. Winter presence of prochlorophytes in surface waters of the northwestern Mediterranean Sea. Limnol. Oceanogr. 1990, 35, 1156–1164. [Google Scholar] [CrossRef]
  19. Chisholm, S.W.; Frankel, S.L.; Goericke, R.; Olson, R.J.; Palenik, B.; Waterbury, J.B.; West-Johnsrud, L.; Zettler, E.R. Prochlorococcus marinus nov. gen. nov. sp.: An oxyphototrophic marine prokaryote containing divinyl chlorophyll a and b. Arch. Microbiol. 1992, 157, 297–300. [Google Scholar] [CrossRef]
  20. Goericke, R.; Welschmeyer, N.A. The marine prochlorophyte Prochlorococcus contributes significantly to phytoplankton biomass and primary production in the Sargasso Sea. Deep-Sea Res. I 1993, 40, 2283–2294. [Google Scholar] [CrossRef]
  21. Landry, M.R.; Kirshtein, J.; Constantinou, J. Abundances and distributions of picoplankton populations in the central equatorial pacific from 12° N to 12° S, 140° W. Deep-Sea Res. II 1996, 43, 871–890. [Google Scholar] [CrossRef]
  22. Partensky, F.; Blanchot, J.; Vaulot, D. Differential distribution of Prochlorococcus and Synechococcus in oceanic waters: A review. Ocean. Monaco-Numero Spec. 1999, 19, 457–476. [Google Scholar]
  23. Zinser, E.R.; Johnson, Z.I.; Coe, A.; Karaca, E.; Veneziano, D.; Chisholm, S.W. Influence of light and temperature on Prochlorococcus ecotype distributions in the Atlantic Ocean. Limnol. Oceanogr. 2007, 52, 2205–2220. [Google Scholar] [CrossRef]
  24. Choi, D.H.; Noh, J.H.; An, S.M.; Choi, Y.R.; Lee, H.; Ra, K.; Kim, D.; Rho, T.; Lee, S.H.; Kim, K.T.; et al. Spatial distribution of cold-adapted Synechococcus during spring in seas adjacent to Korea. Algae 2016, 31, 231–241. [Google Scholar] [CrossRef] [Green Version]
  25. Barber, R.T. Picoplankton do some heavy lifting. Science 2007, 315, 777–778. [Google Scholar] [CrossRef]
  26. Flombaum, P.; Gallegos, J.L.; Gordillo, R.A.; Rincón, J.; Zabala, L.L.; Jiao, N.; Karl, D.M.; Li, W.K.W.; Lomas, M.W.; Veneziano, D.; et al. Present and future global distributions of the marine Cyanobacteria Prochlorococcus and Synechococcus. Proc. Natl. Acad. Sci. USA 2013, 110, 9824–9829. [Google Scholar] [CrossRef] [Green Version]
  27. Lee, S.H.; Joo, H.T.; Lee, J.H.; Lee, J.H.; Kang, J.J.; Lee, H.W.; Lee, D.; Kang, C.K. Seasonal carbon uptake rates of phytoplankton in the northern East/Japan Sea. Deep-Sea Res. II 2017, 143, 45–53. [Google Scholar] [CrossRef]
  28. Lee, S.H.; Kim, B.K.; Lim, Y.J.; Joo, H.T.; Kang, J.J.; Lee, D.; Park, J.; Ha, S.Y.; Lee, S.H. Small phytoplankton contribution to the standing stocks and the total primary production in the Amundsen Sea. Biogeosciences 2017, 14, 3705–3713. [Google Scholar] [CrossRef] [Green Version]
  29. Jang, H.K.; Kang, J.J.; Lee, J.H.; Kim, M.; Ahn, S.H.; Jeong, J.Y.; Yun, M.S.; Han, I.S.; Lee, S.H. Recent Primary Production and Small Phytoplankton Contribution in the Yellow Sea during the Summer in 2016. Ocean Sci. J. 2018, 53, 509–519. [Google Scholar] [CrossRef]
  30. Kang, J.J.; Jang, H.K.; Lim, J.H.; Lee, D.; Lee, J.H.; Bae, H.; Lee, C.H.; Kang, C.K.; Lee, S.H. Characteristics of Different Size Phytoplankton for Primary Production and Biochemical Compositions in the Western East/Japan Sea. Front. Microbiol. 2020, 11, 1–16. [Google Scholar] [CrossRef]
  31. Sarma, V.V.S.S.; Chopra, M.; Rao, D.N.; Priya, M.M.R.; Rajula, G.R.; Lakshmi, D.S.R.; Rao, V.D. Role of eddies on controlling total and size-fractionated primary production in the Bay of Bengal. Cont. Shelf Res. 2020, 204, 104186. [Google Scholar] [CrossRef]
  32. Fouilland, E.; Gosselin, M.; Rivkin, R.B.; Vasseur, C.; Mostajir, B. Nitrogen uptake by heterotrophic bacteria and phytoplankton in Arctic surface waters. J. Plankton Res. 2007, 29, 369–376. [Google Scholar] [CrossRef] [Green Version]
  33. Wheeler, P.A.; Kirchman, D.L. Utilization of inorganic and organic nitrogen by bacteria in marine systems. Limnol. Oceanogr. 1986, 31, 998–1009. [Google Scholar] [CrossRef] [Green Version]
  34. Middelburg, J.J.; Nieuwenhuize, J. Nitrogen uptake by heterotrophic bacteria and phytoplankton in the nitrate-rich Thames estuary. Mar. Ecol. Prog. Ser. 2000, 203, 13–21. [Google Scholar] [CrossRef]
  35. Middelburg, J.J.; Nieuwenhuize, J. Uptake of dissolved inorganic nitrogen in turbid, tidal estuaries. Mar. Ecol. Prog. Ser. 2000, 192, 79–88. [Google Scholar] [CrossRef] [Green Version]
  36. Vazquez, D. Inhibitors of protein synthesis. FEBS Lett. 1974, 40, S63–S84. [Google Scholar] [CrossRef] [Green Version]
  37. Jacoby, G.A.; Gorini, L. The Effect of Streptomycin and Other Aminoglycoside Antibiotics on Protein Synthesis. In Antibiotics; Gottlieb, D., Shaw, P.D., Eds.; Springer: Berlin/Heidelberg, Germany, 1967. [Google Scholar] [CrossRef]
  38. Parsons, T.R.; Maita, Y.; Lalli, C.M. A Manual of Chemical and Biological Methods for Seawater Analysis; Pergamon Press: New York, NY, USA, 1984. [Google Scholar]
  39. Olson, R.J.; Shalapyonok, A.; Sosik, H.M. An automated submersible flow cytometer for analyzing pico- and nanophytoplankton: FlowCytobot. Deep-Sea Res. I 2003, 50, 301–315. [Google Scholar] [CrossRef]
  40. Lee, S.H.; Whitledge, T.E.; Kang, S.H. Recent carbon and nitrogen uptake rates of phytoplankton in Bering Strait and the Chukchi Sea. Cont. Shelf Res. 2007, 27, 2231–2249. [Google Scholar] [CrossRef]
  41. Song, H.J.; Kim, K.; Lee, J.H.; Ahn, S.H.; Joo, H.M.; Jeong, J.Y.; Yang, E.J.; Kang, S.H.; Yun, M.S.; Lee, S.H. In-situ Measured Carbon and Nitrogen Uptake Rates of Melt Pond Algae in the Western Arctic Ocean, 2014. Ocean Sci. J. 2018, 53, 107–117. [Google Scholar] [CrossRef]
  42. Lim, Y.J.; Kim, T.W.; Lee, S.H.; Lee, D.; Park, J.; Kim, B.K.; Kim, K.; Jang, H.K.; Bhavya, P.S.; Lee, S.H. Seasonal Variations in the Small Phytoplankton Contribution to the Total Primary Production in the Amundsen Sea, Antarctica. J. Geophys. Res. Oceans. 2019, 124, 8324–8341. [Google Scholar] [CrossRef]
  43. Yun, M.S.; Kim, Y.; Jeong, Y.; Joo, H.T.; Jo, Y.H.; Lee, C.H.; Bae, H.; Lee, D.; Bhavya, P.S.; Kim, D.; et al. Weak Response of Biological Productivity and Community Structure of Phytoplankton to Mesoscale Eddies in the Oligotrophic Philippine Sea. J. Geophys. Res. Oceans 2020, 125, e2020JC016436. [Google Scholar] [CrossRef]
  44. Hama, T.; Miyazaki, T.; Ogawa, Y.; Iwakuma, T.; Takahashi, M.; Otsuki, A.; Ichimura, S. Measurement of photosynthetic production of a marine phytoplankton population using a stable 13C isotope. Mar. Biol. 1983, 73, 31–36. [Google Scholar] [CrossRef]
  45. Dugdale, R.C.; Goering, J.J. Uptake of New and Regenerated Forms of Nitrogen in Primary Productivity. Limnol. Oceanogr. 1967, 12, 196–206. [Google Scholar] [CrossRef] [Green Version]
  46. Gosselin, M.; Levasseur, M.; Wheeler, P.A.; Horner, R.A.; Booth, B.C. New measurements of phytoplankton and ice algal production in the Arctic Ocean. Deep Sea Res. Part II Top. Stud. Ocean. 1997, 44, 1623–1644. [Google Scholar] [CrossRef]
  47. Furuya, K.; Kurita, K.; Odate, T. Distribution of phytoplankton in the East China sea in the winter of 1993. J. Oceanogr. 1996, 52, 323–333. [Google Scholar] [CrossRef]
  48. Gibb, S.W.; Barlow, R.G.; Cummings, D.G.; Rees, N.W.; Trees, C.C.; Holligan, P.; Suggett, D. Surface phytoplankton pigment distributions in the Atlantic Ocean: An assessment of basin scale variability between 50° N and 50° S. Prog. Oceanogr. 2000, 45, 339–368. [Google Scholar] [CrossRef]
  49. Platt, T.; Bouman, H.; Devred, E.; Fuentes-Yaco, C.; Sathyendranath, S. Physical forcing and phytoplankton distributions. Sci. Mar. 2005, 69, 55–73. [Google Scholar] [CrossRef] [Green Version]
  50. Liu, X.; Huang, B.; Huang, Q.; Wang, L.; Ni, X.; Tang, Q.; Sun, S.; Wei, H.; Liu, S.; Li, C.; et al. Seasonal phytoplankton response to physical processes in the southern Yellow Sea. J. Sea Res. 2015, 95, 45–55. [Google Scholar] [CrossRef]
  51. Gong, G.C.; Wen, Y.H.; Wang, B.W.; Liu, G.J. Seasonal variation of chlorophyll a concentration, primary production and environmental conditions in the subtropical East China Sea. Deep-Sea Res. II 2003, 50, 1219–1236. [Google Scholar] [CrossRef]
  52. Moore, L.R.; Chisholm, S.W. Photophysiology of the marine cyanobacterium Prochlorococcus: Ecotypic differences among cultured isolates. Limnol. Oceanogr. 1999, 44, 628–638. [Google Scholar] [CrossRef] [Green Version]
  53. Moore, L.R.; Post, A.F.; Rocap, G.; Chisholm, S.W. Utilization of different nitrogen sources by the marine cyanobacteria Prochlorococcus and Synechococcus. Limnol. Oceanogr. 2002, 47, 989–996. [Google Scholar] [CrossRef]
  54. Zhao, S.; Wei, J.; Yue, H.; Xiao, T. Picophytoplankton abundance and community structure in the Philippine Sea, western Pacific. Chin. J. Oceanol. Limnol. 2010, 28, 88–95. [Google Scholar] [CrossRef]
  55. Choi, D.H.; Noh, J.H.; Hahm, M.S.; Lee, C.M. Picocyanobacterial abundances and diversity in surface water of the northwestern Pacific Ocean. Ocean Sci. J. 2011, 46, 265–271. [Google Scholar] [CrossRef]
  56. Charpy, L.; Blanchot, J. Photosynthetic picoplankton in French Polynesian atoll lagoons: Estimation of taxa contribution to biomass and production by flow cytometry. Mar. Ecol. Prog. Ser. 1998, 162, 57–70. [Google Scholar] [CrossRef] [Green Version]
  57. Blanchot, J.; André, J.M.; Navarette, C.; Neveux, J.; Radenac, M.H. Picophytoplankton in the equatorial pacific: Vertical distributions in the warm pool and in the high nutrient low chlorophyll conditions. Deep-Sea Res. I 2001, 48, 297–314. [Google Scholar] [CrossRef]
  58. McCarthy, J.J.; Garside, C.; Nevins, J.L.; Barber, R.T. New production along 140 degrees W in the equatorial Pacific during and following the 1992 El Niño event. Deep-Sea Res. II 1996, 43, 1065–1093. [Google Scholar] [CrossRef]
  59. Eppley, R.W.; Peterson, B.J. Particulate organic matter flux and planktonic new production in the deep ocean. Nature 1979, 282, 677–680. [Google Scholar] [CrossRef]
  60. Kirchman, D.L. The uptake of inorganic nutrients by heterotrophic bacteria. Microb. Ecol. 1994, 28, 225–271. [Google Scholar] [CrossRef]
  61. Rodrigues, R.M.N.V.; Williams, P.J.L.B. Inorganic nitrogen assimilation by picoplankton and whole plankton in a coastal ecosystem. Limnol. Oceanogr. 2002, 47, 1608–1616. [Google Scholar] [CrossRef]
  62. Bhavya, P.S.; Kumar, S.; Gupta, G.V.M.; Sudheesh, V.; Sudharma, K.V.; Varrier, D.S.; Dhanya, K.R.; Saravanane, N. Nitrogen Uptake Dynamics in a Tropical Eutrophic Estuary (Cochin, India) and Adjacent Coastal Waters. Estuaries Coasts 2016, 39, 54–67. [Google Scholar] [CrossRef]
  63. Waterbury, J.B.; Watson, S.W.; Guillard, R.R.; Brand, L.E. Widespread occurrence of a unicellular, marine, planktonic, cyanobacterium. Nature 1979, 227, 293–294. [Google Scholar] [CrossRef]
  64. Chisholm, S.W.; Olson, R.J.; Zettler, E.R.; Goericke, R.; Waterbury, J.B.; Welschmeyer, N.A. A novel free-living prochlorophyte occurs at high cell concentrations in the oceanic euphotic zone. Nature 1988, 334, 340–343. [Google Scholar] [CrossRef]
Figure 1. Sampling station in the two sampled regions of the northwestern Pacific Ocean; TP: tropical Pacific, SP: subtropical and temperate Pacific.
Water 13 01610 g001
Figure 2. Vertical profiles of temperature (a), salinity (b) in the northwestern Pacific Ocean. Solid line represents average temperature and salinity in the TP and SP regions, respectively.
Water 13 01610 g002
Figure 3. Vertical profiles of nitrate (a) and ammonium (b) concentrations averaged from each region (TP, closed circles; SP, open circles). SDs are shown by bars. Data courtesy of KIOST.
Water 13 01610 g003
Figure 4. Vertical profiles of chlorophyll-a concentrations in the TP (closed circles) and SP (open circles) regions. SDs are shown by bars.
Water 13 01610 g004
Figure 5. Integrated abundance of Prochlororoccus (a), Synechococcus (b), and picoeukaryotes (c) in the euphotic zone. Biomass of Prochlororoccus, Synechococcus, and picoeukaryotes in the euphotic zone (d) in the euphotic zone.
Water 13 01610 g005
Figure 6. Vertical profiles of the total carbon and nitrogen absolute uptake rates (TP, closed triangles; A89, closed circles; A50, closed squares) and picocyanobacterial carbon and nitrogen absolute uptake rates (TP, open triangles; A89, open circles) in the TP and SP regions in the North Pacific Ocean. SDs are shown by bars. Carbon uptake rates (a), Nitrate uptake rates (b), and Ammonium uptake rates (c).
Water 13 01610 g006
Figure 7. Regional distribution of total carbon and nitrogen uptake rates ((a), left) and picocyanobacterial carbon and nitrogen uptake rates ((b), right) in the northwestern Pacific Ocean. Bars with diagonal stripes indicate carbon and nitrogen uptake rates of picocyanobacterial communities.
Water 13 01610 g007
Figure 8. Comparison of the uptake rates for total (closed circles) and bacterial (open circles) carbon uptake with the abundances of the predominant species (closed triangles) in the northwestern Pacific Ocean. TP (a) and SP (b). SDs are shown by bars.
Water 13 01610 g008
Figure 9. Picocyanobacterial contribution to total carbon and nitrogen uptake rates (primary productivity) in the TP and SP regions of the northwestern Pacific Ocean. Unicolor bars indicate total uptake of each uptake rate, whereas other bars with diagonal stripes indicate picocyanobacterial uptake rates. SDs are shown by bars. Integrated nitrogen uptake rates (a), Integrated carbon uptake rates (b), Integrated nitrate uptake rates (c), and Integrated ammonium uptake rates (d).
Water 13 01610 g009
Table 1. The environmental conditions in the TP and SP regions of the northwestern Pacific Ocean.
TPSP
MeanS.D.MeanS.D.
Temperature in the surface (°C)29.10.917.3-
Temperature in the euphotic depth (°C)26.72.315.32.3
Salinity in the surface (psu)34.80.533.2-
Salinity in the euphotic zone (psu)34.80.633.90.6
Nitrate in the euphotic zone (µM)0.130.350.841.8
Ammonium in the euphotic depth (µM)0.140.070.180.03
Euphotic depth (m)127.416.535-
Table 2. Chlorophyll-a, C/N ratio, f-ratio, carbon, and nitrogen (nitrate and ammonium) uptake rates by total phytoplankton communities in the TP and SP regions of the northwestern Pacific Ocean.
TPSP
MeanS.D.nMeanS.D.n
Integrated total Chlorophyll-a (mg Chl-a m−2)156.6718.1-2
C/N ratio (atom/atom)111.879.8-2
Carbon specific uptake (h−1)0.0015080.001034420.0049510.00406912
Carbon absolute uptake (mg C m−3·h−1)0.0990.068420.6880.65312
Integrated carbon uptake (mg C m−2·h−1)11.664.8720.85-2
Nitrate specific uptake (h−1)0.0006320.000435420.0010970.00109612
Nitrate absolute uptake (mg NO3 m−3·h−1)0.0079870.006853420.0220840.02405812
Integrated nitrate uptake (mg NO3- m−2·h−1)1.060.6870.69-2
Ammonium specific uptake (h−1)0.0067560.003664420.0063550.00317912
Ammonium absolute uptake (mg NH4+ m−3·h−1)0.0722520.044304420.1202350.07765112
Integrated ammonium uptake (mg NH4+ m−2·h−1)9.053.174.05-2
Nitrogen specific uptake (h−1)0.0073880.004099420.0074520.00425512
Nitrogen absolute uptake (mg N m−2·h−1)0.080.047420.1420.112
Integrated nitrogen uptake (mg N m−2·h−1)10.112.4974.74-2
f-ratio0.10.0370.13-2
Table 3. Carbon and nitrogen (nitrate and ammonium) uptake rates by picocyanobacterial communities in the TP and SP regions of the northwestern Pacific Ocean.
TPSP (A89)
MeanSDnMeanSDn
Picocyanobacterial carbon specific uptake (h−1)0.0006950.000548420.0044040.0030656
Picocyanobacterial carbon absolute uptake (mg C m−3·h−1)0.0440.043420.7080.5736
Integrated picocyanobacterial carbon uptake (mg C m−2·h−1)5.312.16722.83-1
Picocyanobacterial nitrate specific uptake (h−1)0.0001040.000174420.000470.0003486
Picocyanobacterial nitrate absolute uptake (mg NO3 m−3·h−1)0.0015770.003138420.0122960.009976
Integrated picocyanobacterial nitrate uptake (mg NO3 m−2·h−1)0.210.270.4-1
Picocyanobacterial ammonium specific uptake (h−1)0.0050730.002693420.0044970.0025186
Picocyanobacterial ammonium absolute uptake (mg NH4+ m−3·h−1)0.0705310.046278420.1040540.0686116
Integrated picocyanobacterial ammonium uptake (mg NH4+ m−2·h−1)8.893.1873.72-1
Integrated picocyanobacterial nitrogen uptake (mg N m−2·h−1)9.13.3774.12-1
Picocyanobacterial f-ratio0.020.0170.1-1
Table 4. Comparison of daily primary productivity with previous studies in the northwestern Pacific Ocean.
RegionReferencesCarbon Uptake RatesNitrate Uptake RatesAmmonium Uptake Rates
Average ± SD
(g C m−2·d−1)
Average ± SD
(g N m−2·d−1)
Average ± SD
(g N m−2·d−1)
Season
TPTaniguchi (1972)0.09--Winter
Kwak et al. (2013)0.2--Summer
In this study0.15 ± 0.060.01 ± 0.010.16 ± 0.01Late spring
SPGong et al. (2003)0.31 ± 0.16--Early spring
0.52 ± 0.32--Summer
Kwak et al. (2013)0.28--Summer
In this study0.45 (A89)0.02 (A89)0.10 (A89)Late spring
0.13 (A50)0.01 (A50)0.05 (A50)
Publisher’s Note: MDPI stays neutral with regard to jurisdictional claims in published maps and institutional affiliations.

