
Nearshore Fish Species Richness and Species–Habitat Associations in the St. Clair–Detroit River System

 , ,
, ,
Abstract
:1. Introduction
2. Materials and Methods
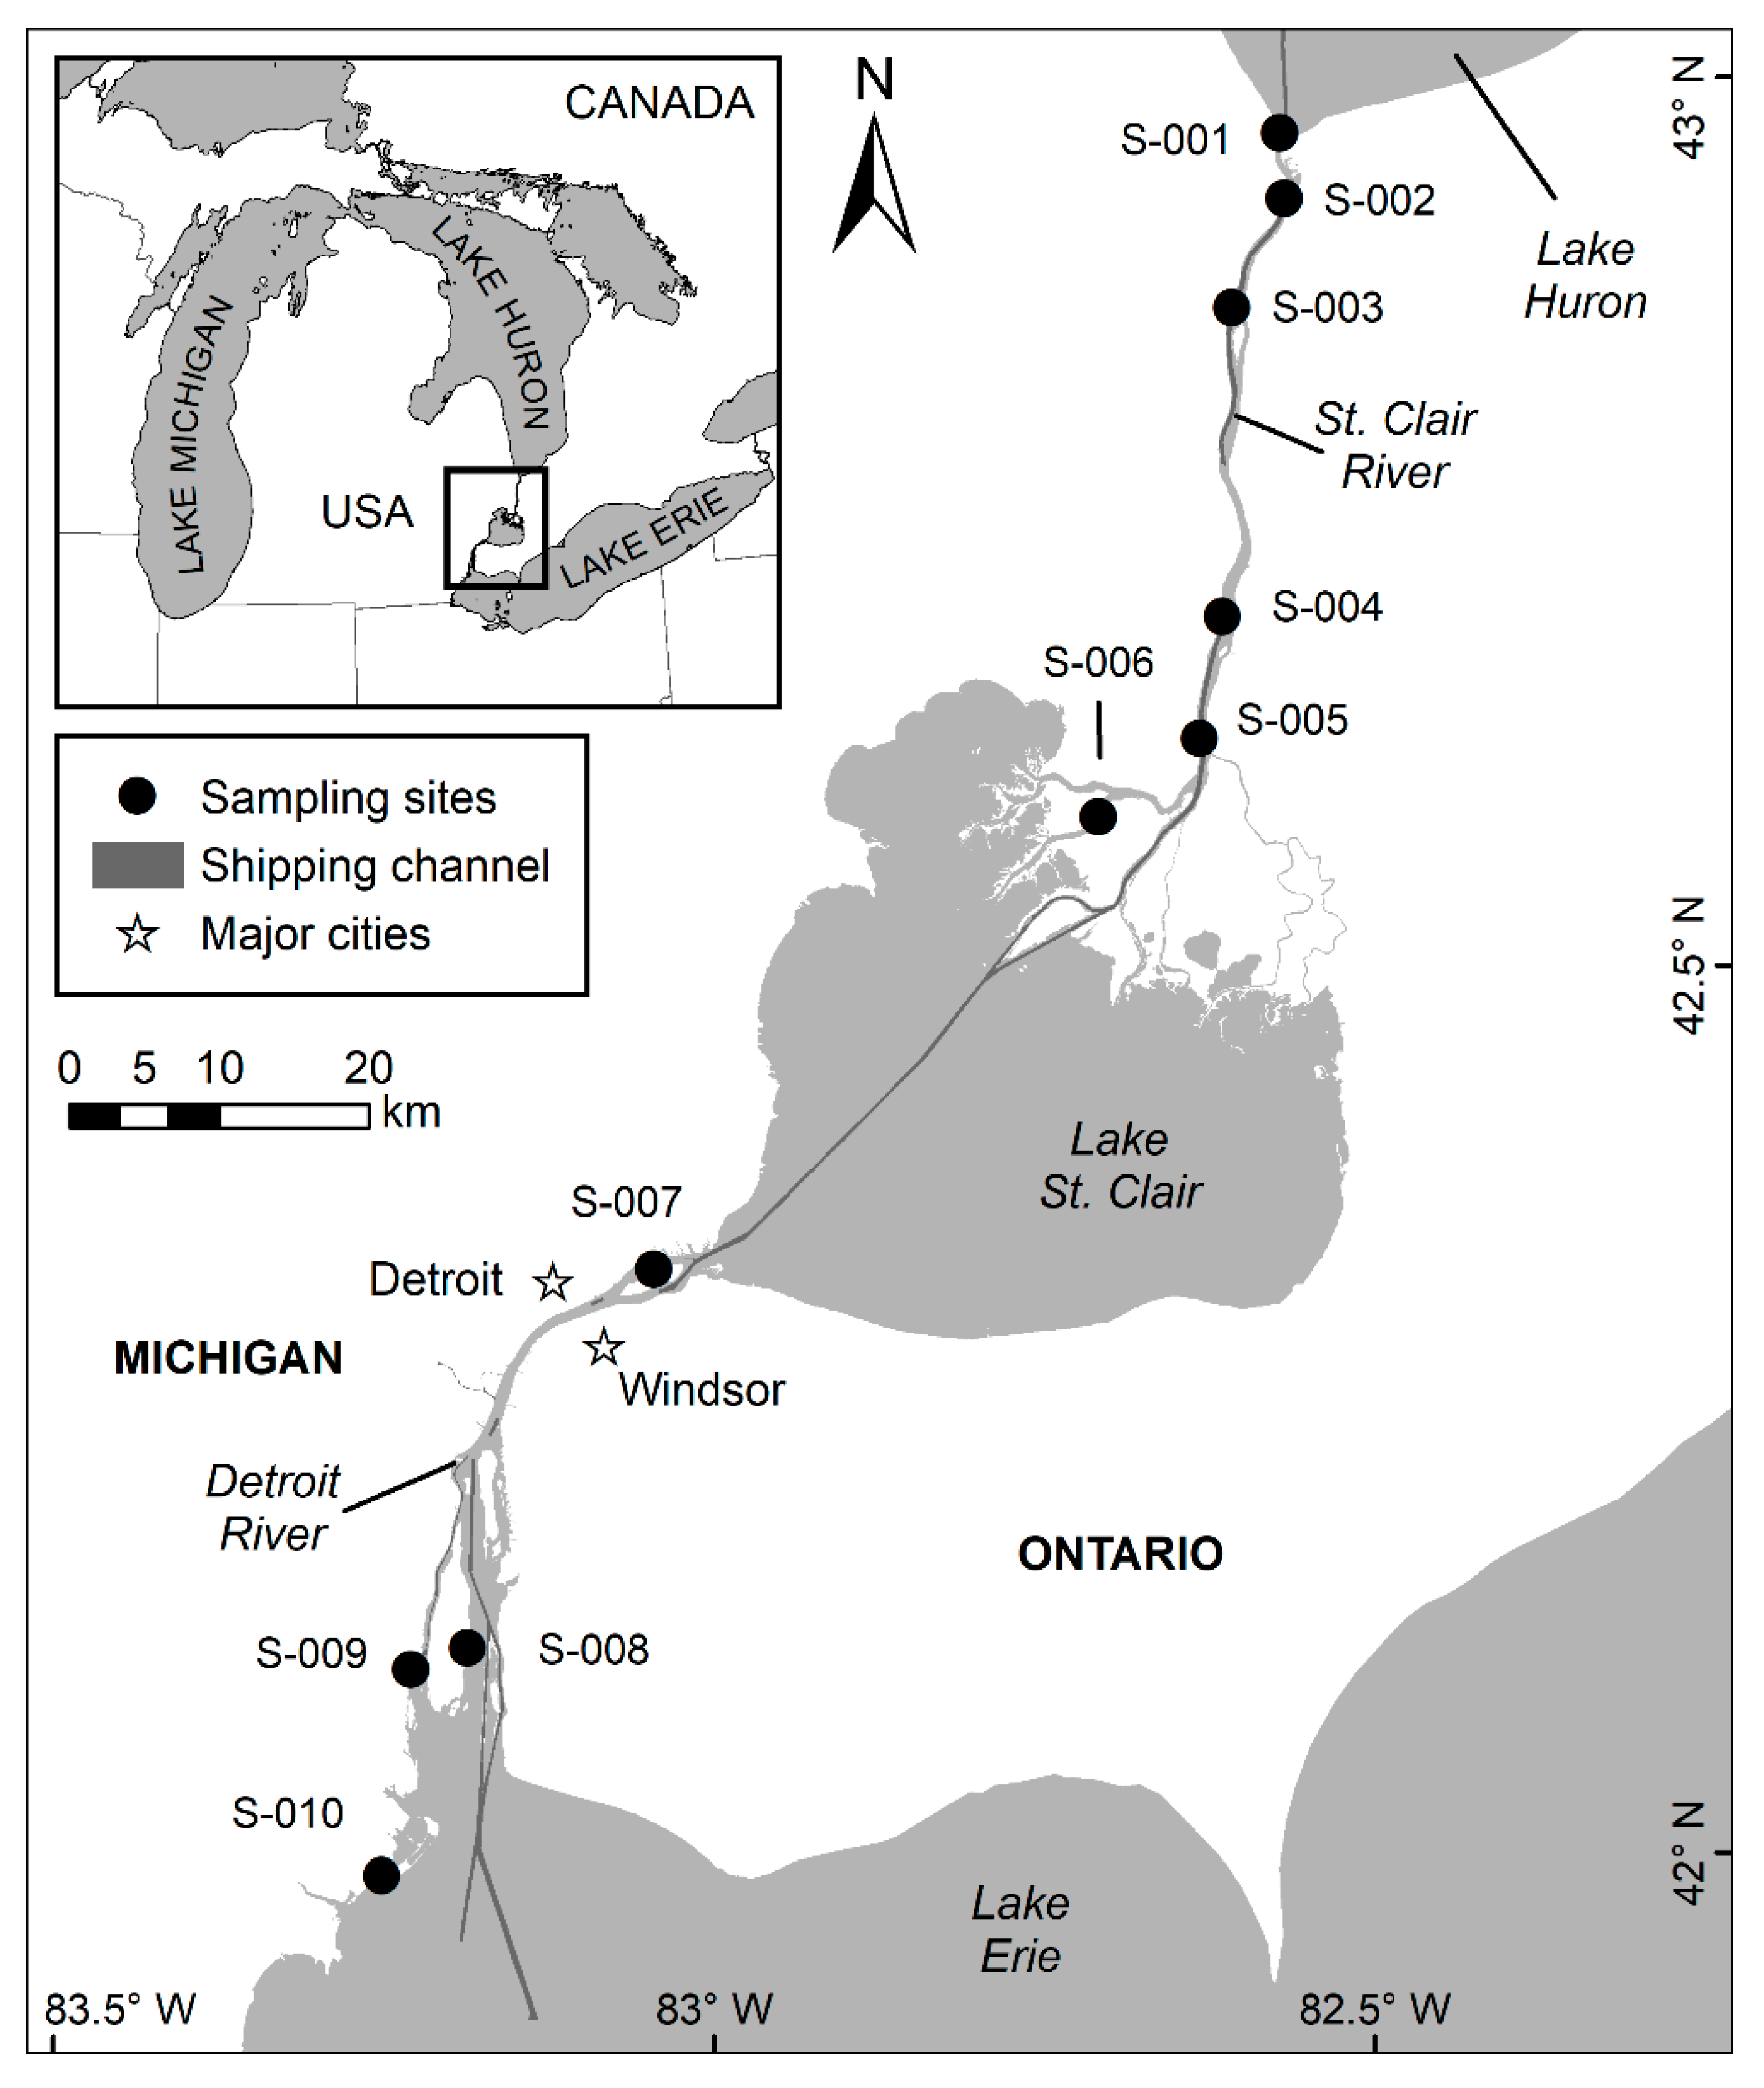
2.1. Study Area
2.2. Data Collection
2.3. Data Analysis
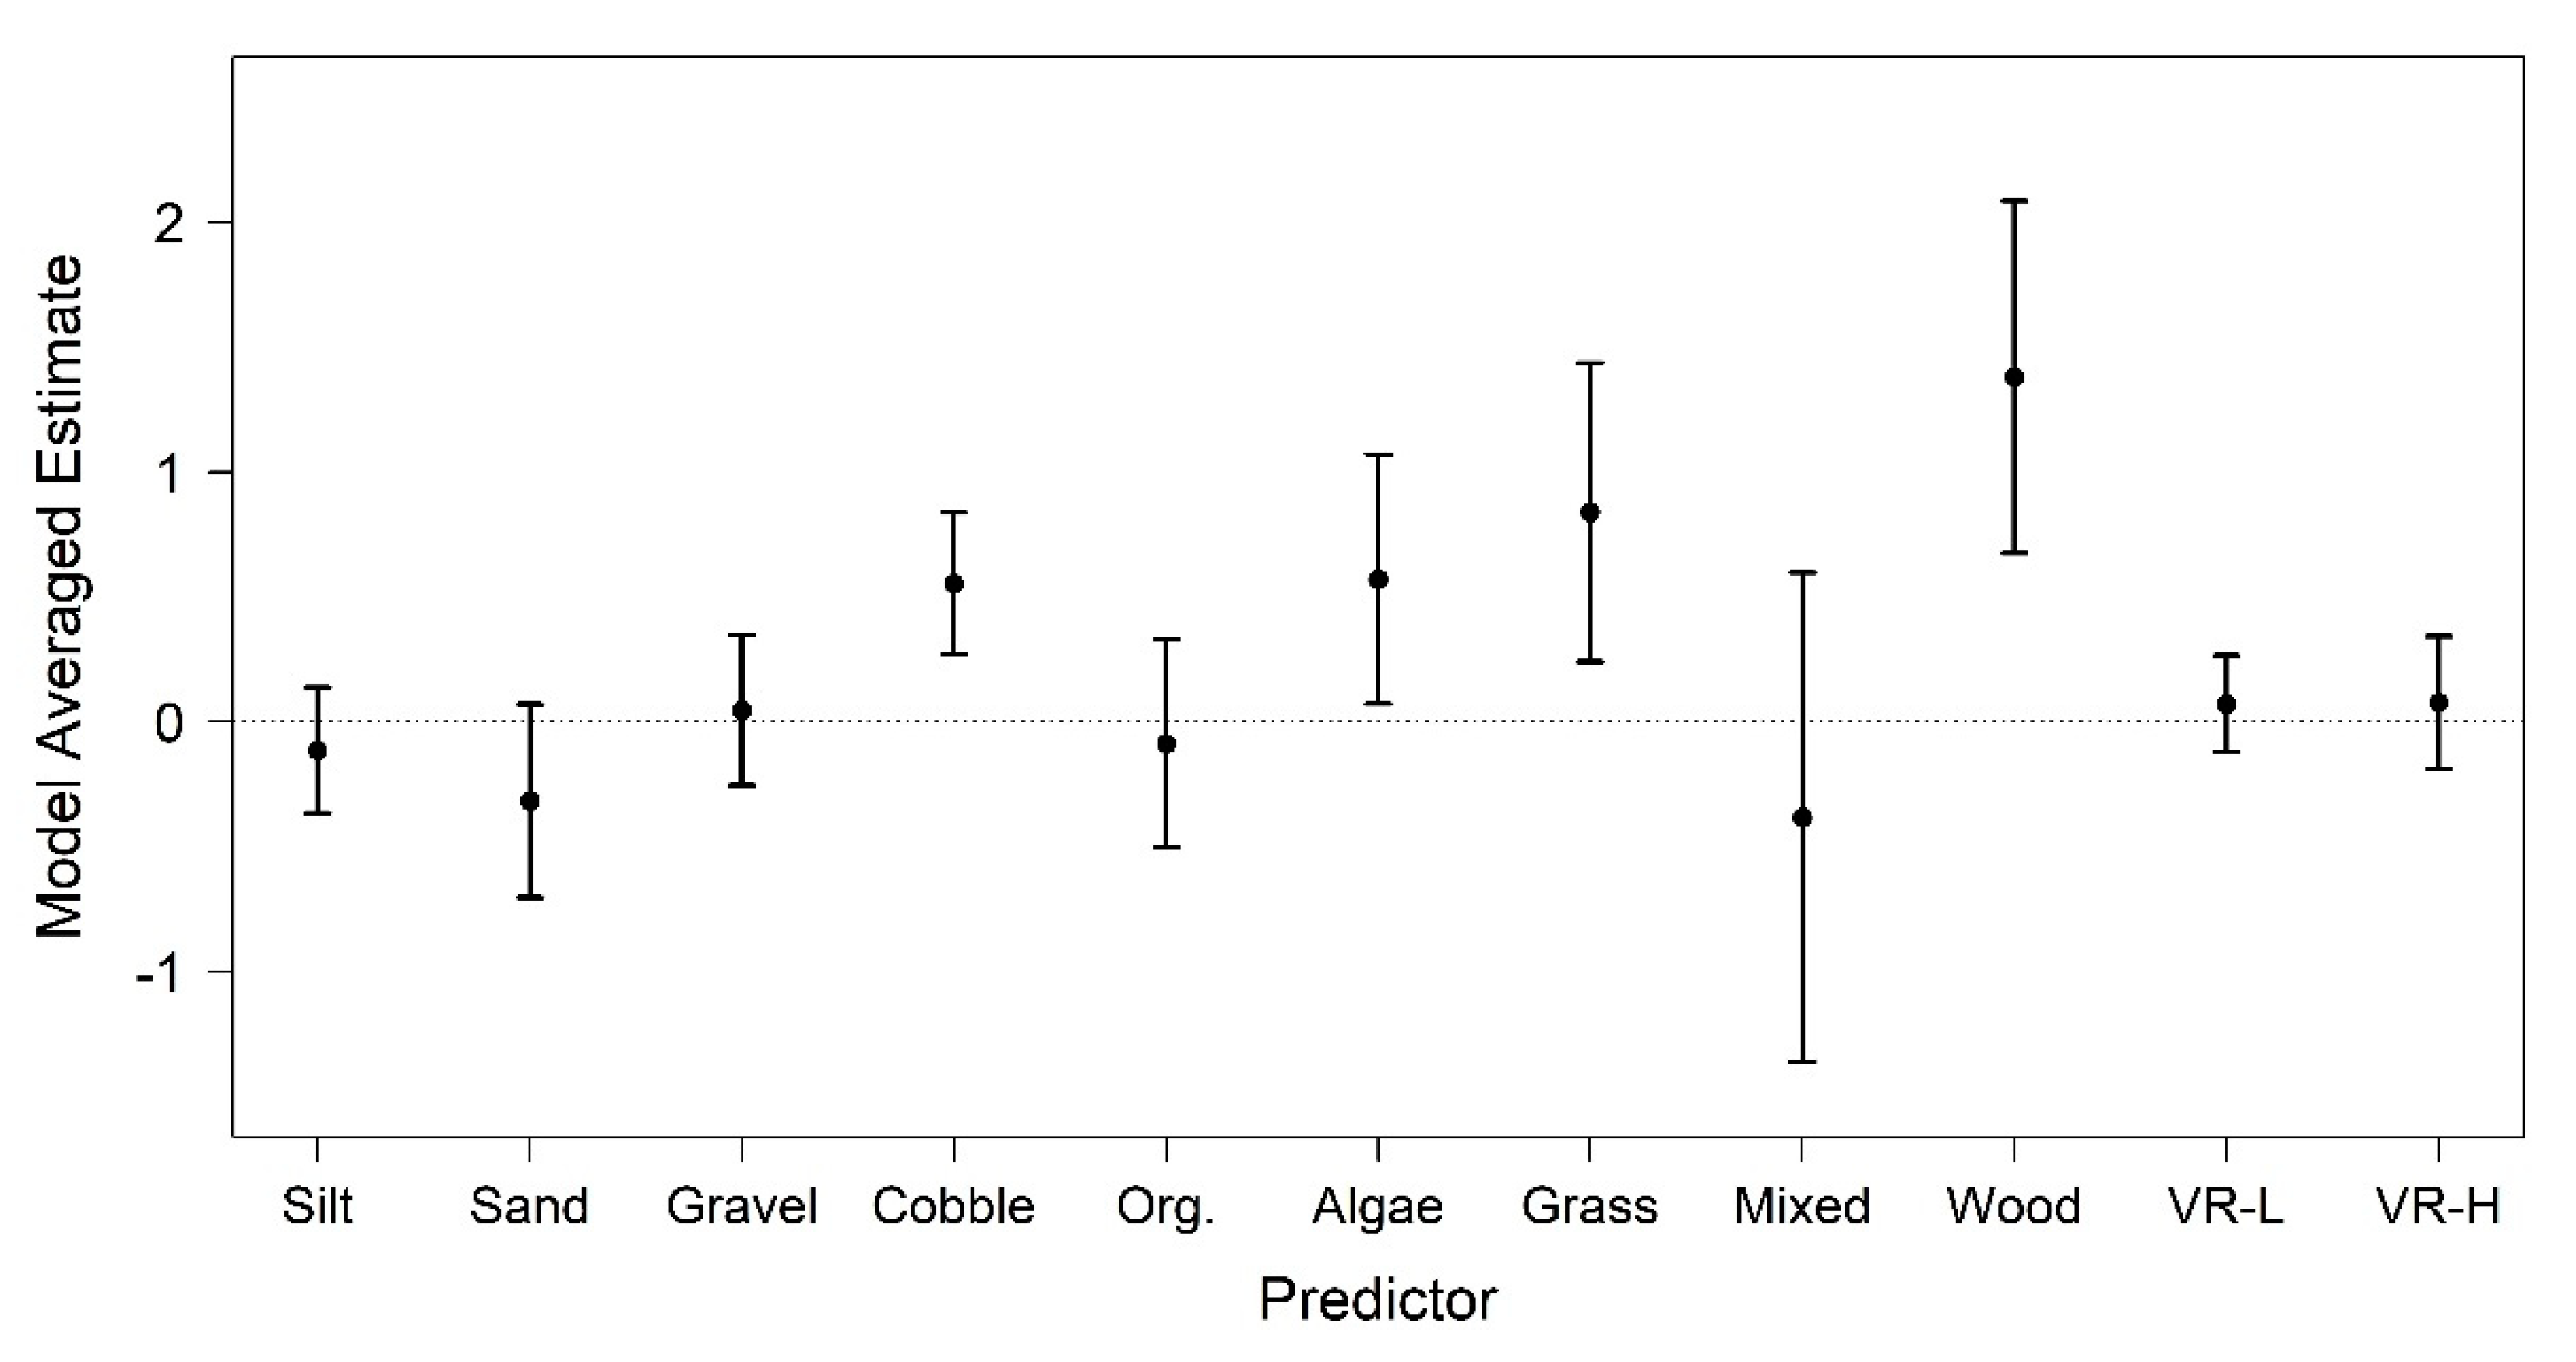
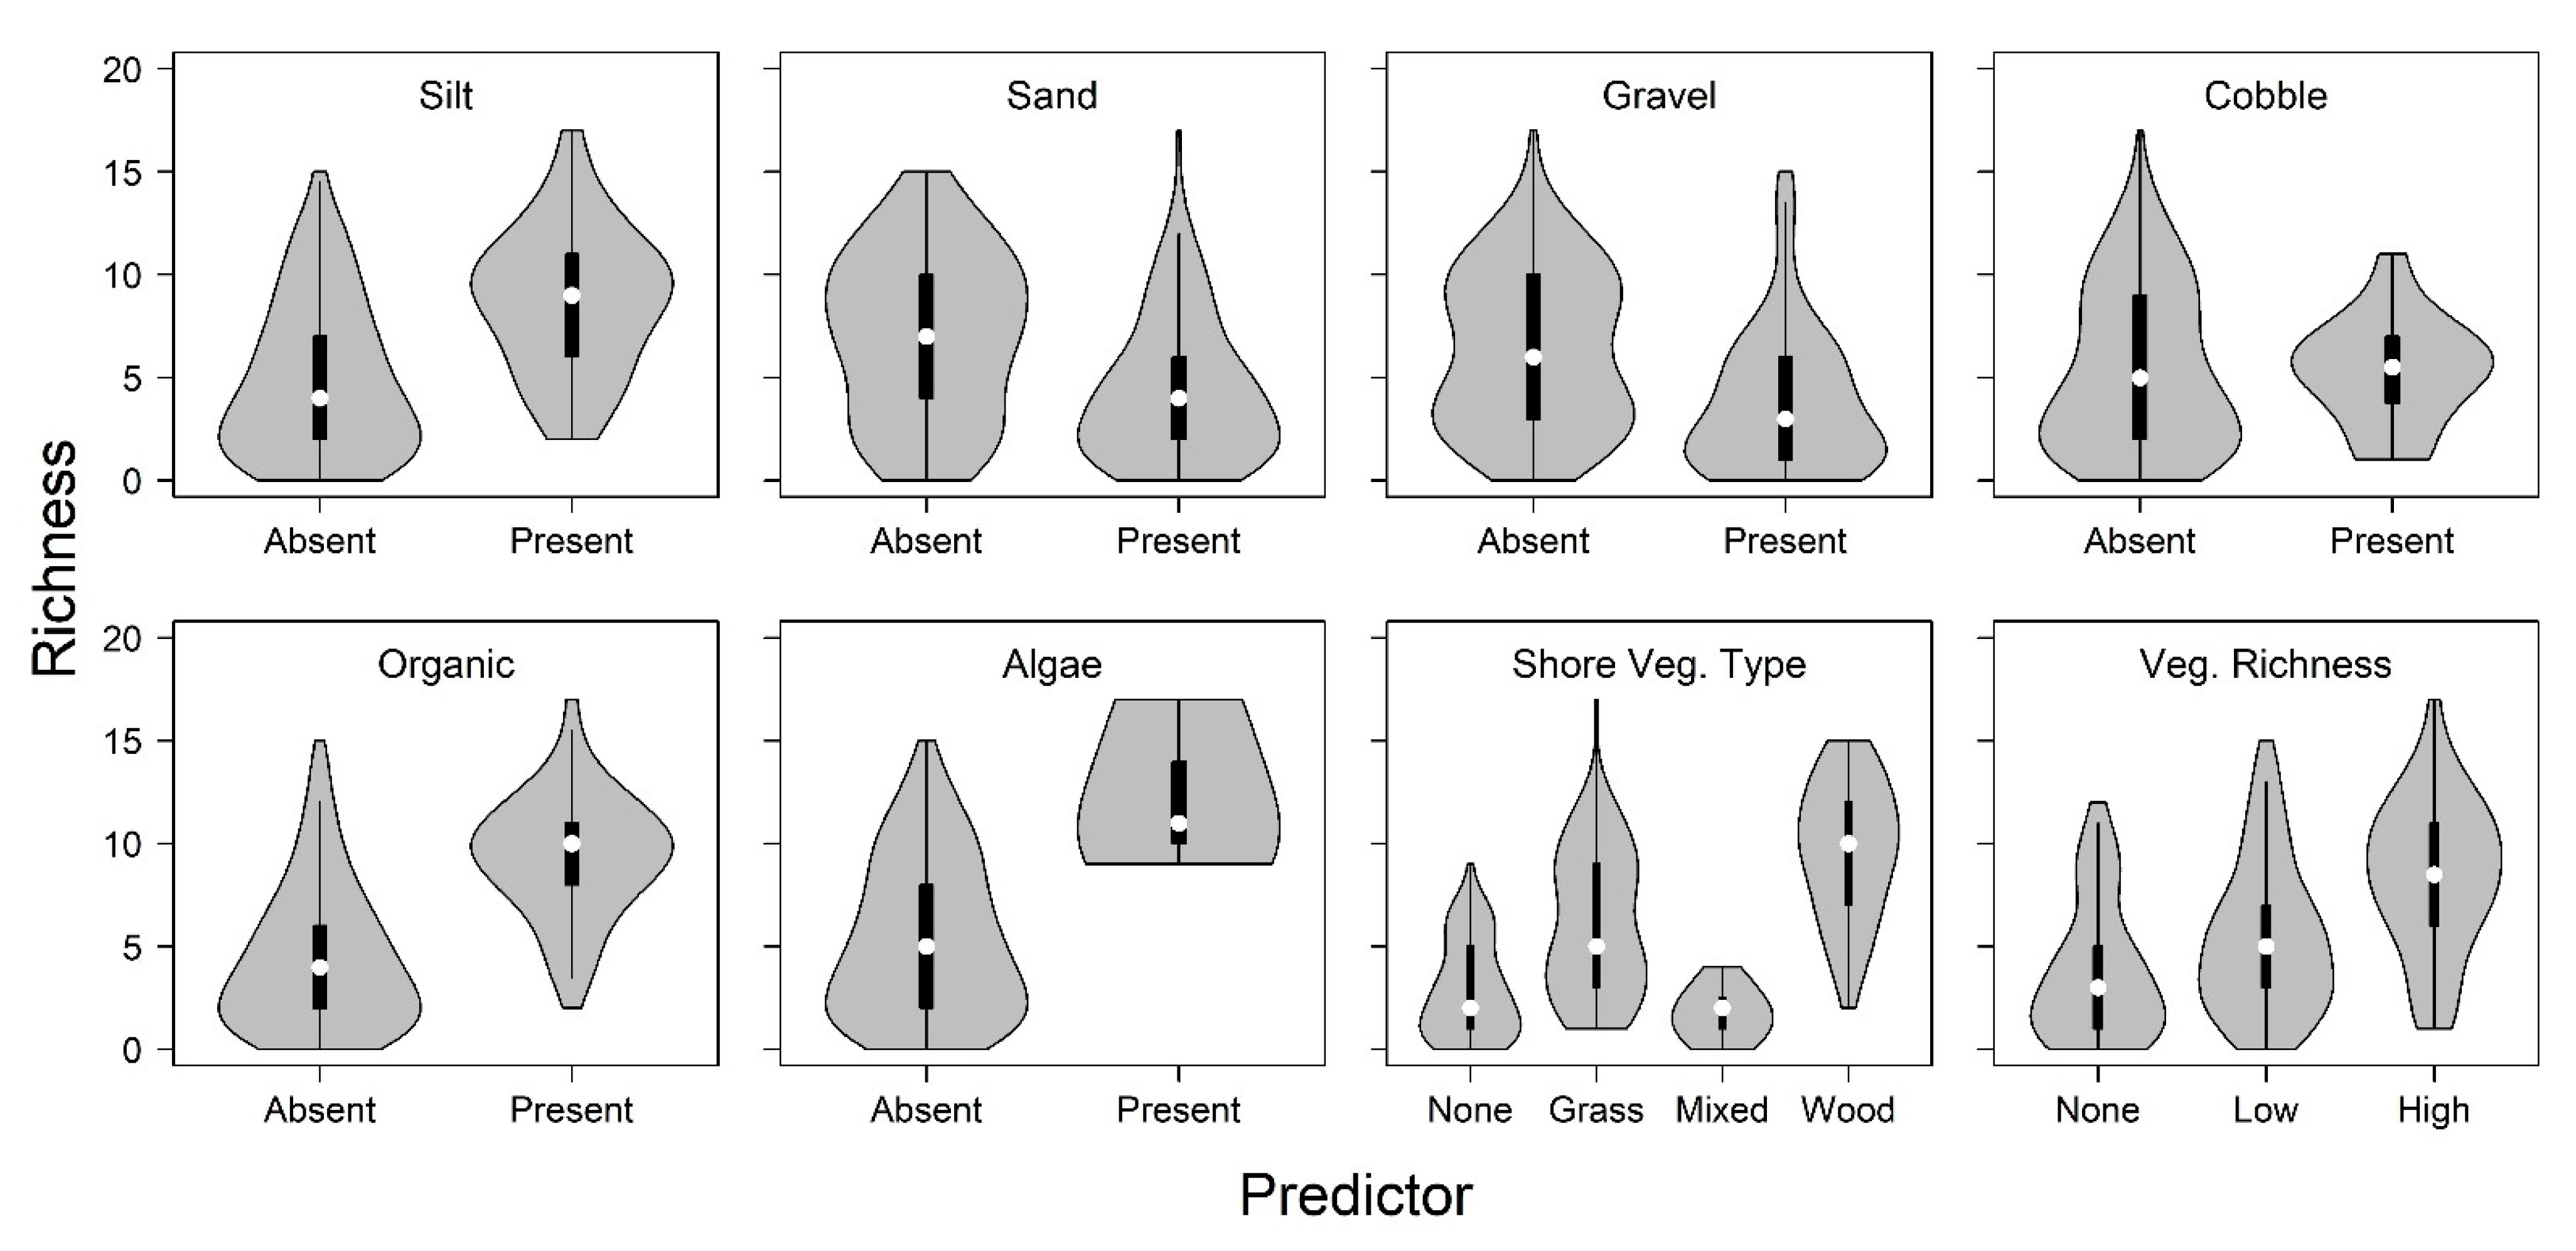
3. Results
4. Discussion
Supplementary Materials
Author Contributions
Funding
Institutional Review Board Statement
Informed Consent Statement
Data Availability Statement
Acknowledgments
Conflicts of Interest
References
- Junk, W.J.; Bayley, P.B.; Sparks, R.E. The flood pulse concept in river-floodplain systems. In Proceedings of the International Large River Symposium, Honey Harbour, ON, Canada, 14–21 September 1986; Canadian Special Publication of Fisheries and Aquatic Sciences. NRC Research Press: Ottawa, ON, Canada, 1989; pp. 110–127. [Google Scholar]
- Schiemer, F.; Keckeis, H.; Reckendorfer, W.; Winkler, G. The “Inshore Retention Concept” and Its Significance for Large Rivers. Arch. Hydrobiol. Suppl. Large Rivers 2001, 135, 509–516. [Google Scholar] [CrossRef]
- Thorp, J.H.; Delong, M.D. The Riverine Productivity Model: An Heuristic View of Carbon Sources and Organic Processing in Large River Ecosystems. Oikos 1994, 70, 305–308. [Google Scholar] [CrossRef]
- Copp, G.H. Microhabitat Use of Fish Larvae and 0(+) Juveniles in a Highly Regulated Section of the River Great Ouse. Regul. Rivers-Res. Manag. 1997, 13, 267–276. [Google Scholar] [CrossRef]
- Goodyear, C.D.; Edsall, T.A.; Ormsby-Dempsey, D.M.; Moss, G.D.; Polanski, P.E. Atlas of Spawning and Nursery Areas of Great Lakes Fishes; US Fish and Wildlife Service: Washington, DC, USA, 1982.
- Lapointe, N.W.R.; Corkum, L.D.; Mandrak, N.E. Seasonal and Ontogenic Shifts in Microhabitat Selection by Fishes in the Shallow Waters of the Detroit River, a Large Connecting Channel. Trans. Am. Fish. Soc. 2007, 136, 155–166. [Google Scholar] [CrossRef]
- Lapointe, N.W.R.; Corkum, L.D.; Mandrak, N.E. Macrohabitat Associations of Fishes in Shallow Waters of the Detroit River. J. Fish. Biol. 2010, 76, 446–466. [Google Scholar] [CrossRef] [PubMed]
- Grenouillet, G.; Pont, D.; Olivier, J.M. Habitat Occupancy Patterns of Juvenile Fishes in a Large Lowland River: Interactions with Macrophytes. Arch. Für Hydrobiol. 2000, 149, 307–326. [Google Scholar] [CrossRef]
- Grenouillet, G.; Pont, D.; Seip, K.L. Abundance and Species Richness as a Function of Food Resources and Vegetation Structure: Juvenile Fish Assemblages in Rivers. Ecography 2002, 25, 641–650. [Google Scholar] [CrossRef] [Green Version]
- Pinter, N.; Jemberie, A.A.; Remo, J.W.F.; Heine, R.A.; Ickes, B.S. Cumulative Impacts of River Engineering, Mississippi and Lower Missouri Rivers. River Res. Appl. 2009, 26, 546–571. [Google Scholar] [CrossRef]
- Richter, B.D.; Braun, D.P.; Mendelson, M.A.; Master, L.L. Threats to Imperiled Freshwater Fauna. Conserv. Biol. 1997, 11, 1081–1093. [Google Scholar] [CrossRef]
- Sparks, R.E. Need for Ecosystem Management of Large Rivers and Their Floodplains. BioScience 1995, 45, 168–182. [Google Scholar] [CrossRef]
- Derecki, J.A. Detroit River, Physical and Hydraulic Characteristics; GLERL Contribution No. 417; National Oceanic and Atmospheric Administration Great Lakes Environmental Research Laboratory: Ann Arbor, MI, USA, 1984.
- Hondorp, D.W.; Roseman, E.F.; Manny, B.A. An Ecological Basis for Future Fish Habitat Restoration Efforts in the Huron-Erie Corridor. J. Gt. Lakes Res. 2014, 40, 23–30. [Google Scholar] [CrossRef]
- Bennion, D.H.; Manny, B.A. Construction of Shipping Channels in the Detroit River: History and Environmental Consequences; US Geological Survey: Ann Arbor, MI, USA, 2011.
- Manny, B.A.; Edsall, T.A.; Jaworski, E. The Detroit River, Michigan: An. Ecological Profile; US Fish and Wildlife Service, National Fisheries Research Center-Great Lakes: Ann Arbor, MI, USA, 1988.
- Hartig, J.H.; Bennion, D. Historical Loss and Current Rehabilitation of Shoreline Habitat along an Urban-Industrial River-Detroit River, Michigan, USA. Sustainability 2017, 9, 828. [Google Scholar] [CrossRef] [Green Version]
- Manny, B.A. Setting priorities for conserving and rehabilitating Detroit River habitats. In Honoring our Detroit River: Caring for Our Home; Hartig, J.H., Ed.; Cranbrook Institute of Science: Bloomfield Hills, MI, USA, 2003; pp. 121–139. [Google Scholar]
- Francis, J.T.; Chiotti, J.A.; Boase, J.C.; Thomas, M.V.; Manny, B.A.; Roseman, E.F. A Description of the Nearshore Fish Communities in the Huron—Erie Corridor Using Multiple Gear Types. J. Gt. Lakes Res. 2014, 40, 52–61. [Google Scholar] [CrossRef]
- International Joint Commission. Great Lakes Water Quality Agreement: Protocol Amending the Agreement Between Canada and the United States of America on Great Lakes Water Quality, 1978, as Amended on October 16, 1983, and on November 18, 1987: Signed September 7, 2012, Entered into Force February 12, 2013; Environment Canada and United States Environment Protection Agency, Great Lakes National Program Office: Gatineau, QC, USA; Chicago, IL, USA, 2012; p. 54.
- Ontario Ministry of the Environment (OME); Michigan Department of Natural Resources (MDNR). Detroit River Remedial Action Plan. Stage 1; OME Detroit/St.Clair/St. Marys Rivers Project and MDNR Surface Water Quality Division Great Lakes and Environmental Assessment Section: Sarnia, ON, Canada; Lansing, MI, USA, 1991; p. 504.
- Green, N.D.; Cargnelli, L.; Briggs, T.; Drouin, R.; Child, M.; Esbjerg, J.; Valiante, M.; Henderson, T.; McGregor, D.; Munro, M. (Eds.) Detroit River Canadian Remedial Action Plan. Stage 2 Report; Detroit River Canadian Cleanup: Essex, ON, Canada, 2010; p. 170. [Google Scholar]
- Esman, L.A. The Michigan Department of Environmental Quality Biennial Remedial Action Plan. Update for the Detroit River of Area of Concern; Michigan Department of Environmental Quality: Lansing, MI, USA, 2008; p. 18.
- Crandall, J.D.; Bach, L.B.; Rudd, N.; Stern, M.; Barry, M. Response of Larval Lost River and Shortnose Suckers to Wetland Restoration at the Williamson River Delta, Oregon. Trans. Am. Fish. Soc. 2008, 137, 402–416. [Google Scholar] [CrossRef]
- Toft, J.D.; Ogston, A.S.; Heerhartz, S.M.; Cordell, J.R.; Flemer, E.E. Ecological Response and Physical Stability of Habitat Enhancements along an Urban Armored Shoreline. Ecol. Eng. 2013, 57, 97–108. [Google Scholar] [CrossRef]
- Beechie, T.J.; Sear, D.A.; Olden, J.D.; Pess, G.R.; Buffington, J.M.; Moir, H.; Roni, P.; Pollock, M.M. Process-Based Principles for Restoring River Ecosystems. BioScience 2010, 60, 209–222. [Google Scholar] [CrossRef] [Green Version]
- Palmer, M.A.; Bernhardt, E.S.; Allan, J.D.; Lake, P.S.; Alexander, G.; Brooks, S.; Sudduth, E. Standards for Ecologically Successful River Restoration. J. Appl. Ecol. 2005, 42, 208–217. [Google Scholar] [CrossRef]
- Niemeijer, D.; de Groot, R.S. A Conceptual Framework for Selecting Environmental Indicator Sets. Ecol. Indic. 2008, 8, 14–25. [Google Scholar] [CrossRef]
- Derosier, A.L.; Hanshue, S.K.; Wehrly, K.E.; Farkas, J.K.; Nichols, M.J. Michigan’s Wildlife Action Plan. (2015–2025); Michigan Department of Natural Resources: Lansing, MI, USA, 2015.
- Roseman, E.F.; Thompson, P.A.; Farrell, J.M.; Mandrak, N.E.; Stepien, C.A. Conservation and Management of Fisheries and Aquatic Communities in Great Lakes Connecting Channels. J. Great Lakes Res. 2014, 40, 1–6. [Google Scholar] [CrossRef]
- Fischer, J.L.; Bennion, D.; Roseman, E.F.; Manny, B.A. Validation of a Spatial Model Used to Locate Fish Spawning Reef Construction Sites in the St. Clair—Detroit River System. J. Great Lakes Res. 2015, 41, 1178–1184. [Google Scholar] [CrossRef]
- Edsall, T.A.; Manny, B.A.; Raphael, N. The St. Clair River and Lake St. Clair, Michigan: An. Ecological Profile. Biological Report 85(7.3); U.S. Fish and Wildlife Service: Washington, DC, USA, 1988.
- Hatcher, C.O.; Nester, R.T.; Muth, K.M. Using Larval Fish Abundance in the St. Clair and Detroit Rivers to Predict Year-Class Strength of Forage Fish in Lakes Huron and Erie. J. Great Lakes Res. 1991, 17, 74–84. [Google Scholar] [CrossRef]
- Wentworth, C.K. A Scale of Grade and Class Terms for Clastic Sediments. J. Geol. 1922, 30, 377–392. [Google Scholar] [CrossRef]
- Crow, G.E.; Hellquist, C.B. Aquatic and Wetland Plants of Northeastern North. America: A Revised and Enlarged Edition of Norman C Fassett’s A Manual of Aquatic Plants Volume I: Pteridophytes, Gymnosperms, and Angiosperms: Dicotyledons; University of Wisconsin Press: Madison, WI, USA, 2000. [Google Scholar]
- Crow, G.E.; Hellquist, C.B. Aquatic and Wetland Plants of Northeastern North. America: A Revised and Enlarged Edition of Norman C Fassett’s A Manual of Aquatic Plants Volume II: Angiosperms: Monocotyledons; University of Wisconsin Press: Madison, WI, USA, 2000. [Google Scholar]
- Montgomery, D.C.; Peck, E.A.; Vining, G.G. Introduction to Linear Regression Analysis, 5th ed.; John Wiley & Sons Inc.: Hoboken, NJ, USA, 2012. [Google Scholar]
- Dormann, C.F.; Elith, J.; Bacher, S.; Buchmann, C.; Carl, G.; Carré, G.; Marquéz, J.R.G.; Gruber, B.; Lafourcade, B.; Leitão, P.J.; et al. Collinearity: A Review of Methods to Deal with It and a Simulation Study Evaluating Their Performance. Ecography 2013, 36, 27–46. [Google Scholar] [CrossRef]
- Wasserstein, R.L.; Lazar, N.A. The ASA’s Statement on p-Values: Context, Process, and Purpose. Am. Stat. 2016, 70, 129–133. [Google Scholar] [CrossRef] [Green Version]
- McElreath, R. Statistical Rethinking: A Bayesian Course with Examples in R and Stan; Chapman & Hall/CRC Press: Boca Raton, FL, USA, 2016. [Google Scholar]
- Qian, S.S.; Craig, J.K.; Baustain, M.M.; Rabalais, N.N. A Bayesian Hierarchical Modeling Approach for Analyzing Observational Data from Marine Ecological Studies. Mar. Pollut. Bull. 2009, 58, 1916–1921. [Google Scholar] [CrossRef]
- Symonds, M.R.E.; Mousalli, A. A Brief Guide to Model Selection, Multimodel Inference and Model Averaging in Behavioural Ecology and Akaike’s Information Criterion. Behav. Ecol. Sociobiol. 2011, 65, 13–21. [Google Scholar] [CrossRef]
- Burnham, K.P.; Anderson, D.R. Model. Selection and Multimodel Inference: A Practical Information-Theoretic Approach, 2nd ed.; Springer: New York, NY, USA, 2002. [Google Scholar]
- R Core Team. R: A Language and Environment for Statistical Computing; R Foundation for Statistical Computing: Vienna, Austria, 2020. [Google Scholar]
- Brooks, M.E.; Kristensen, K.; van Benthem, K.J.; Magnusson, A.; Berg, C.W.; Nielsen, A.; Skaug, H.J.; Maechler, M.; Bolker, B.M. GlmmTMB Balances Speed and Flexibility among Packages for Zero-Inflated Generalized Linear Mixed Modeling. R J. 2017, 9, 378–400. [Google Scholar] [CrossRef] [Green Version]
- Bolker, B.M.; Brooks, M.E.; Clark, C.J.; Geange, S.W.; Poulsen, J.R.; Stevens, M.H.H.; White, J.S. Generalized Linear Mixed Models: A Practical Guide for Ecology and Evolution. Trends Ecol. Evol. 2009, 24, 127–135. [Google Scholar] [CrossRef]
- Burnham, K.P.; Anderson, D.R. Multimodel Inference: Understanding AIC and BIC in Model Selection. Sociol. Methods Res. 2004, 33, 261–304. [Google Scholar] [CrossRef]
- Anderson, D.R. Multimodel inference. In Model Based Inference in the Life Sciences: A Primer on Evidence; Springer: New York, NY, USA, 2008; pp. 105–124. [Google Scholar]
- Larkin, D.J.; Beck, M.W.; Bajer, P.G. An Invasive Fish Promotes Invasive Plants in Minnesota Lakes. Freshw. Biol. 2020, 65, 1608–1621. [Google Scholar] [CrossRef]
- Cilleros, K.; Allard, L.; Vigouroux, R.; Brosse, S. Disentangling Spatial and Environmental Determinants of Fish Species Richness and Assemblage Structure in Neotropical Rainforest Streams. Freshw. Biol. 2017, 62, 1707–1720. [Google Scholar] [CrossRef]
- Oksanen, J.; Blanchet, F.G.; Friendly, M.; Kindt, R.; Legendre, P.; McGlinn, D.; Minchin, P.R.; O’Hara, R.B.; Simpson, G.L.; Solymos, P.; et al. Vegan: Community Ecology Package; R Foundation for Statistical Computing: Vienna, Austria, 2018. [Google Scholar]
- Fischer, J.L.; Roseman, E.F.; Ross, J.E.; DeBruyne, R.L.; Hilling, C.D. Seine Collection Data along the Michigan Shoreline of the St. Clair-Detroit River System 2013–2019; U.S. Geological Survey: Reston, VA, USA, 2021. [CrossRef]
- Sarkar, U.K.; Bain, M.B. Priority Habitats for the Conservation of Large River Fishes in the Ganges River Basin. Aquat. Conserv. Mar. Freshw. Ecosyst. 2007, 17, 349–359. [Google Scholar] [CrossRef]
- Jennings, M.J.; Bozek, M.A.; Hatzenbeler, G.R.; Emmons, E.E.; Staggs, M.D. Cumulative Effects of Incremental Shoreline Habitat Modification on Fish Assemblages in North Temperate Lakes. N. Am. J. Fish. Manag. 1999, 19, 18–27. [Google Scholar] [CrossRef]
- Ross, J.E. A Coastal Monitoring Program for a Large Lake Fish Community: The First Step in Capturing Long-Term Trends and Addressing Evolving Questions. Master’s Thesis, The University of Toledo, Toledo, OH, USA, 2013. [Google Scholar]
- Lorian, C.M.; Kennedy, B.P. Riparian Forest Buffers Mitigate the Effects of Deforestation on Fish Assemblages in Tropical Headwater Streams. Ecol. Appl. 2009, 19, 468–479. [Google Scholar] [CrossRef]
- Stauffer, J.C.; Goldstein, R.M.; Newman, R.M. Relationship of Wooded Riparian Zones and Runoff Potential to Fish Community Composition in Agricultural Streams. Can. J. Fish. Aquat. Sci. 2000, 57, 307–316. [Google Scholar] [CrossRef]
- Wallace, J.B.; Eggert, S.L.; Meyer, J.L.; Webster, J.R. Stream Invertebrate Productivity Linked to Forest Subsidies: 37 Stream-Years of Reference and Experimental Data. Ecology 2015, 96, 1213–1228. [Google Scholar] [CrossRef] [PubMed]
- Dolloff, C.A.; Warren, M.L., Jr. Fish relationships with large wood in small streams. In The Ecology and Management of Wood in World Rivers Symposium 37; Gregory, S.V., Boyer, K.L., Gurnell, A.M., Eds.; American Fisheries Society: Bethesda, MD, USA, 2003; pp. 179–193. [Google Scholar]
- Andreoli, A.; Chiarada, E.A.; Cislaghi, A.; Bischetti, B.G.; Comiti, F. Roots Reinforcement by Riparian Trees in Restored Rivers. Geomorphology 2020, 370, 107389. [Google Scholar] [CrossRef]
- Chen, C.W.; Weintraub, L.; Olmsted, L.; Goldstein, R.A. Decision Framework for Sediment Control in Muddy Creek Watershed. J. Am. Water Resour. Assoc. 2004, 40, 1553–1562. [Google Scholar] [CrossRef]
- Polvi, L.E.; Wohl, E.; Merritt, D.M. Modeling the Functional Influence of Vegetation Type on Streambank Cohesion. Earth Surf. Process. Landf. 2014, 39, 1245–1258. [Google Scholar] [CrossRef]
- Growns, I.; Gehrke, P.C.; Astles, K.L.; Pollard, D.A. A Comparison of Fish Assemblages Associated with Different Riparian Vegetation Types in the Hawkesbury-Nepean River System. Fish. Manag. Ecol. 2003, 10, 209–220. [Google Scholar] [CrossRef]
- Fischer, J.L.; Roseman, E.F.; Mayer, C.M.; Qian, S. Effectiveness of Shallow Water Habitat Remediation for Improving Fish Habitat in a Large Temperate River. Ecol. Eng. 2018, 123, 54–64. [Google Scholar] [CrossRef]
- Werner, E.E.; Gilliam, J.F.; Hall, D.J.; Mittelbach, G.G. An Experimental Test of the Effects of Predation Risk on Habitat Use in Fish. Ecology 1983, 64, 1540–1548. [Google Scholar] [CrossRef]
- Dewey, M.R.; Richardson, W.B.; Zigler, S.J. Patterns of Foraging and Distribution of Bluegill Sunfish in a Mississippi River Backwater: Influence of Macrophytes and Predation. Ecol. Freshw. Fish. 1997, 6, 8–15. [Google Scholar] [CrossRef]
- Richardson, W.B.; Zigler, S.J.; Dewey, M.R. Bioenergetic Relations in Submerged Aquatic Vegetation: An Experimental Test of Prey Use by Juvenile Bluegills. Ecol. Freshw. Fish. 1998, 7, 1–12. [Google Scholar] [CrossRef]
- Manny, B.A.; Roseman, E.F.; Kennedy, G.; Boase, J.C.; Craig, J.M.; Bennion, D.H.; Read, J.; Vaccaro, L.; Chiotti, J.; Drouin, R.; et al. A Scientific Basis for Restoring Fish Spawning Habitat in the St. Clair and Detroit Rivers of the Laurentian Great Lakes. Restor. Ecol. 2015, 23, 149–156. [Google Scholar] [CrossRef] [Green Version]
- Madsen, J.D.; Chambers, P.A.; James, W.F.; Koch, E.W.; Westlake, D.F. The Interaction between Water Movement, Sediment Dynamics and Submersed Macrophytes. Hydrobiologia 2001, 444, 71–84. [Google Scholar] [CrossRef]
- Schiemer, F.; Keckeis, H.; Winkler, G.; Flore, L. Large Rivers: The Relevance of Ecotonal Structure and Hydrological Properties for the Fish Fauna. River Syst. 2001, 12, 487–508. [Google Scholar] [CrossRef]
- Welcomme, R.L. River Fisheries; Food and Agriculture Organisation of the United Nations: Rome, Italy, 1985; p. 330. [Google Scholar]
- Pritt, J.J.; Roseman, E.F.; Ross, J.E.; DeBruyne, R.L. Using Larval Fish Community Structure to Guide Long-Term Monitoring of Fish Spawning Activity. N. Am. J. Fish. Manag. 2015, 35, 241–252. [Google Scholar] [CrossRef]
- Herdendorf, C.E.; Raphael, C.N.; Jaworski, E. The Ecology of Lake St. Clair Wetlands: A Community Profile. Biological Report 85(7.7); US Fish and Wildlife Service: Washington, DC, USA, 1986; p. 187.
- McDonald, E.A.; McNaught, A.S.; Roseman, E.F. Use of Main Channel and Two Backwater Habitats by Larval Fishes in the Detroit River. J. Great Lakes Res. 2014, 40, 69–80. [Google Scholar] [CrossRef]
- Whittingham, M.J.; Stephens, P.A.; Bradbury, R.B.; Freckleton, R.P. Why Do We Still Use Stepwise Modelling in Ecology and Behavior? J. Anim. Ecol. 2006, 75, 1182–1189. [Google Scholar] [CrossRef]
- Pierce, C.L.; Rasmussen, J.B.; Leggett, W.C. Sampling Littoral Fish with a Seine: Corrections for Variable Capture Efficiency. Can. J. Fish. Aquat. Sci. 1990, 47, 1004–1010. [Google Scholar] [CrossRef]
- Figueiredo, B.R.S.; Mormul, R.P.; Thomaz, S.M. Swimming and Hiding Regardless of the Habitat: Prey Fish Do Not Choose between a Native and Non-Native Macrophyte Species as a Refuge. Hydrobiologia 2015, 746, 285–290. [Google Scholar] [CrossRef]
- Lechner, A.; Keckeis, H.; Schludermann, E.; Loisl, F.; Humphries, P.; Glas, M.; Tritthart, M.; Habersack, H. Shoreline Configurations Affect Dispersal Patterns of Fish Larvae in a Large River. ICES J. Mar. Sci. 2014, 71, 930–942. [Google Scholar] [CrossRef] [Green Version]
- Dolan, C.R.; Miranda, L.E. Immobilization Thresholds of Electrofishing Relative to Fish Size. Trans. Am. Fish. Soc. 2003, 132, 696–976. [Google Scholar] [CrossRef]
- Hubbs, C.L.; Lagler, K.F.; Smith, G.R. Fishes of the Great Lakes Region, Revised ed.; University of Michigan: Ann Arbor, MI, USA, 2010. [Google Scholar]


| Site | 2013 | 2014 | 2015 | 2016 | 2017 | 2018 | 2019 | Total |
|---|---|---|---|---|---|---|---|---|
| S-001 | 156 (4) | 736 (5) | 507 (5) | 10 (4) | 148 (5) | 1 (4) | 142 (8) | 1700 (35) |
| S-002 | - | 381 (1) | 26 (2) | 25 (1) | 215 (3) | 1 (2) | 18 (2) | 666 (11) |
| S-003 | 893(4) | 2438 (5) | 218 (5) | 385 (4) | 8939 (4) | 188 (4) | 340 (4) | 13,401 (30) |
| S-004 | 192 (4) | 203 (4) | 104 (5) | 148 (4) | 723 (4) | 57 (4) | 3199 (4) | 4626 (29) |
| S-005 | 74 (4) | 120 (4) | 311 (5) | 219 (4) | 636 (4) | 21 (4) | 167 (4) | 1548 (29) |
| S-006 | 1835 (4) | 1013 (5) | 689 (3) | 220(5) | 1338 (3) | 506 (4) | - | 5601 (24) |
| S-007 | 386 (4) | 59 (5) | 282 (5) | 17 (5) | 10 (4) | 87 (4) | 167 (5) | 1008 (32) |
| S-008 | 652 (3) | 343 (2) | 170 (3) | 407 (3) | 110 (3) | 241 (3) | 159 (3) | 2082 (20) |
| S-009 | - | 1007 (5) | 947 (5) | 242 (5) | 260 (4) | 295 (4) | 718 (5) | 3469 (28) |
| S-010 | 798 (4) | 729 (5) | 814(4) | 861 (5) | 513 (4) | 337 (4) | 298 (5) | 4350 (31) |
| Total | 4986 (30) | 7029 (38) | 4068 (42) | 2534 (40) | 12,892 (38) | 1734 (37) | 5208 (44) | 38,451 (269) |
| Site | 2013 | 2014 | 2015 | 2016 | 2017 | 2018 | 2019 |
|---|---|---|---|---|---|---|---|
| S-001 | Gr | Gr | Gr | Gr | Sa, Gr | Sa, Gr | Sa, Gr |
| S-002 | - | Gr | Gr | Gr | Sa, Gr | Sa, Gr | Sa, Gr |
| S-003 | Gr | Gr | Gr | Gr | Sa, Co | Sa, Gr | Sa, Gr, Co |
| S-004 | Sa | Sa | Sa | Sa | Sa, Co | Sa | Sa, Gr, Co |
| S-005 | Sa | Sa | Sa | Sa | Sa, Co | Sa, Gr | Sa, Gr |
| S-006 | Or | Or | Or | Or | Si, Sa, Or, Al | Si, Sa | - |
| S-007 | Sa | Sa | Sa | Sa | Sa, Gr | Sa | Sa |
| S-008 | Gr | Gr | Gr | Gr | Si, Sa | Sa | Sa |
| S-009 | - | Or | Or | Or | Si, Or | Si, Sa | Si, Sa |
| S-010 | Or | Or | Or | Or | Sa | Si, Sa | Si, Sa |
| Site | Type | 2013 | 2014 | 2015 | 2016 | 2017 | 2018 | 2019 |
|---|---|---|---|---|---|---|---|---|
| S-001 | None | 0 | 0 | 0 | 0 | 0 | 0 | 0 |
| S-002 | Mixed | - | 0 | 0 | 1 | 0 | 0 | 0 |
| S-003 | None | 3 | 4 | 0 | 3 | 4 | 5 | 2 |
| S-004 | None | 0 | 0 | 0 | 1 | 3 | 2 | 2 |
| S-005 | Grassy | 0 | 0 | 0 | 2 | 4 | 3 | 0 |
| S-006 | Grassy | 6 | 7 | 5 | 8 | 10 | 6 | - |
| S-007 | Grassy | 1 | 6 | 0 | 2 | 2 | 1 | 2 |
| S-008 | Woody | 5 | 7 | 0 | 7 | 5 | 9 | 7 |
| S-009 | Woody | - | 8 | 4 | 10 | 8 | 9 | 5 |
| S-010 | Grassy | 0 | 0 | 0 | 8 | 4 | 0 | 5 |
| Model | AICc | ΔAICc | wi | Cum. Weight |
|---|---|---|---|---|
| Sand+Cobble+Organic+Algae+SV | 1202.29 | 0.00 | 0.29 | 0.29 |
| Sand+Gravel+Cobble+Organic+Algae+SV | 1204.10 | 1.81 | 0.12 | 0.41 |
| Silt+Sand+Cobble+Organic+Algae+SV | 1204.19 | 1.90 | 0.11 | 0.52 |
| Sand+Cobble+Algae+SV | 1204.23 | 1.94 | 0.11 | 0.63 |
| Silt+Sand+Gravel+Gravel+Cobble+Organic+Algae+SV | 1205.90 | 3.61 | 0.05 | 0.68 |
| Silt+Sand+Cobble+Algae+SV | 1206.09 | 3.80 | 0.04 | 0.72 |
| Sand+ Gravel+Cobble+Algae+SV | 1206.20 | 3.91 | 0.04 | 0.76 |
Publisher’s Note: MDPI stays neutral with regard to jurisdictional claims in published maps and institutional affiliations. |
© 2021 by the authors. Licensee MDPI, Basel, Switzerland. This article is an open access article distributed under the terms and conditions of the Creative Commons Attribution (CC BY) license (https://creativecommons.org/licenses/by/4.0/).
Share and Cite
Hilling, C.D.; Fischer, J.L.; Ross, J.; Tucker, T.R.; DeBruyne, R.L.; Mayer, C.M.; Roseman, E.F. Nearshore Fish Species Richness and Species–Habitat Associations in the St. Clair–Detroit River System. Water 2021, 13, 1616. https://doi.org/10.3390/w13121616
Hilling CD, Fischer JL, Ross J, Tucker TR, DeBruyne RL, Mayer CM, Roseman EF. Nearshore Fish Species Richness and Species–Habitat Associations in the St. Clair–Detroit River System. Water. 2021; 13(12):1616. https://doi.org/10.3390/w13121616
Chicago/Turabian StyleHilling, Corbin D., Jason L. Fischer, Jason Ross, Taaja R. Tucker, Robin L. DeBruyne, Christine M. Mayer, and Edward F. Roseman. 2021. "Nearshore Fish Species Richness and Species–Habitat Associations in the St. Clair–Detroit River System" Water 13, no. 12: 1616. https://doi.org/10.3390/w13121616