
TiO2-Powdered Activated Carbon (TiO2/PAC) for Removal and Photocatalytic Properties of 2-Methylisoborneol (2-MIB) in Water

1
State Key Laboratory of Pollution Control and Resource Reuse, College of Environmental Science and Engineering, Tongji University, Shanghai 200092, China
2
Shanghai Institute of Technology, School of Chemical and Environmental Engineering, Shanghai 201418, China
*
Authors to whom correspondence should be addressed.
Water 2021, 13(12), 1622; https://doi.org/10.3390/w13121622
Submission received: 6 May 2021
/
Revised: 2 June 2021
/
Accepted: 4 June 2021
/
Published: 9 June 2021
(This article belongs to the Special Issue Analytical Separation Techniques Coupled to Mass Spectrometry for Detection of Some Chemicals and Their Metabolites in Water)
Abstract
:2-methylisoborneol (2-MIB) is a common taste and odor compound caused by off-flavor secondary metabolites, which represents one of the greatest challenges for drinking water utilities worldwide. A TiO2-coated activated carbon (TiO2/PAC) has been synthesized using the sol-gel method. A new TiO2/PAC photocatalyst has been successfully employed in photodegradation of 2-MIB under UV light irradiation. In addition, the combined results of XRD, SEM-EDX, FTIR and UV-Vis suggested that the nano-TiO2 had been successfully loaded on the surface of PAC. Experimental results of 2-MIB removal indicated that the adsorption capacities of PAC for 2-MIB were higher than that of TiO2/PAC. However, in the natural organic matter (NOM) bearing water, the removal efficiency of 2-MIB by TiO2/PAC and PAC were 97.8% and 65.4%, respectively, under UV light irradiation. Moreover, it was shown that the presence of NOMs had a distinct effect on the removal of MIB by TiO2/PAC and PAC. In addition, a simplified equivalent background compound (SEBC) model could not only be used to describe the competitive adsorption of MIB and NOM, but also represent the photocatalytic process. In comparison to other related studies, there are a few novel composite photocatalysts that could efficiently and rapidly remove MIB by the combination of adsorption and photocatalysis.
1. Introduction
The taste and odor (T&O) compounds are produced as off-flavor secondary metabolites by three primary taxa: (1) cyanobacteria, (2) actinobacteria and (3) fungi [1], and occur in up to 50% of lake/reservoir waters in China [2]. These T&O compounds have historically been related to algal blooms that occur in the summer or early fall, when water temperatures are at their highest (about 20 ℃). One of the most predominant T&O compounds identified worldwide is 2-methylisoborneol (2-MIB), which has caused global concerns since it has negative impacts on the aesthetics, integrity and safety of drinking and recreational water [3,4].
To date, common water treatment processes perform poorly on 2-MIB removal due to a significant low odor threshold value (<10 ng/L) for drinking water plants [5,6]. Therefore, 2-MIB was commonly removed by advanced treatment processes including activated carbon adsorption and advanced oxidation processes (AOPs). Previous studies have reported that the removal of 2-MIB was mainly due to biodegradation in bench-scale sand filters [7]. In contrast, adsorption was proven to be an effective treatment option, since activated carbon (AC) has various advantageous characteristics, such as microporous structure, high adsorption capacity, as well as special surface reactivity [8,9]. In addition, several studies have shown the 2-MIB can be effectively removed using powdered activated carbon (PAC) and granular activated carbon (GAC) [10,11,12,13,14,15]. However, the presence of natural organic matter (NOM > 3 mg/L) leads to a reduction in the adsorption capacity of PAC due to biofilm formation on the adsorbent [16]. More recently, research on the influences of NOM on the environmental behavior of adsorbent have been carried out but with limited studies [17].
AOPs are commonly more effective at 2-MIB removal, and a variety of AOPs have been studied using O3, O3/H2O2, UV-C, UV-C/H2O2, UV-C/O3, the photo-Fenton process (UV-A, UV-C, solar) and ultra-sonication [18]. In terms of effectiveness, titanium dioxide (TiO2) under UV light (UV-A) has been a promising method for the removal of 2-MIB from water with highly oxidative •OH radical intermediates [19]. Recently, the combined applications of the UV-A and TiO2 (UV-A/TiO2) for the removal of 2-MIB gained much attention, which is considered an innovative alternative to typical AOPs, since it has both adsorption and degradation capabilities [20]. In addition, previous studies showed that a combination of powdered TiO2 and PAC has a synergistic effect for the photocatalytic degradation of organic pollutants such as methyl orange, cytarabine, 4-chlorophenol, as well as microcystin-LR [21,22,23]. However, few studies have been carried out to study the combined effects of the UV-A/TiO2 and PAC to degrade off-flavor compounds including 2-MIB.
The objectives of this study were to (i) prepare a nano-composite (TiO2/PAC) to degrade 2-MIB under UV light irradiation; (ii) investigate the adsorption characteristics of 2-MIB based on the adsorption and photo-catalytic degradation kinetics, as well as equilibrium adsorption isotherms; (iii) evaluate the impacts of NOM on the adsorption; (iv) establish a simplified model used for well understanding the relationship between removal efficiency of 2-MIB and the dosages of photocatalysts. The pivotal data obtained from this study would significantly contribute to addressing 2-MIB pollution in water.
2. Materials and Methods
2.1. Chemicals
Watsons pure distilled water was used to prepare all the solutions unless otherwise noted. Absolute ethanol (C2H6O, 99.7%), acetic acid glacial (C2H4O2, 99.5%) and powder active carbon (PAC) were purchased from Shanghai Zhanyun Chemical Co. Ltd. Hydrochloric acid (HCl, 36–38%) was obtained from Hangzhou Gaojing Fine Chemical Industry Co. Ltd. Methanol (CH4O, 99.5%) and hexane (C6H14, 99%) were purchased from Shanghai Titan Scientific and Adamas-beta Co. Ltd. Humic acid (HA, 90%), Tannic acid (TA, 99%) and aluminum chlorohydrate (99% +) were obtained from Adamas-beta Co. Ltd. Finally, the standards of the target 2-MIB (C11H20O, MW = 168.28g/mol, purity: 99.5%) and the internal standard chlorooctane (C8H17Cl, MW= 148.67g/mol, purity: 99.5%) were supplied by Dr. Ehrenstorfer GmbH, Germany and O2Si, USA. Tetrabutyltitanate (Ti(OBu)4, 98%) was used as the titanium precursor for the preparation of photo-catalysts.
2.2. Sample Collection and Preparation
An actual water sample was collected from a river, which has undergone coagulation, sedimentation and filtration processes. The water sample was used to simulate the elimination of 2-MIB in realistic aqueous conditions, and its quality parameters are shown in Table 1. A stock solution of 2-MIB with 1000 ng/L concentration was prepared and working concentrations of 2-MIB solutions were prepared by dilution.
2.3. Synthesis of TiO2/PAC
The PAC was functioned with 10% HCl pretreatment for 30 min to remove the ash, then ultrasound for 2 h and soaked for 48 h. The PAC was filtered immediately, washed using deionized water, and then dried at 80 ℃ oven for 12 h. PAC was sieved out using 300–400 mesh sieves, and stored in a desiccator for use. TiO2/PAC were synthesized by a sol-gel method [24]. In brief, at room temperature, 10 mL of Ti(OBu)4 was dissolved in 40 mL of absolute ethanol, and 6.6 mL of glacial acetic acid was added slowly to the slurry. The pH of the solution was adjusted to 2–3 with concentrated HCl. Subsequently, the suspension was stirred for 30 min and ultrasound for 10 min at room temperature to obtain solution A. Then, 20 mL of absolute ethanol was mixed with 9.4 mL of deionized water, which was stirred for 30 min to obtain solution B. Thereafter, solution B was added dropwise into solution A under 60 min vigorous stirring and 10 min ultrasonic at room temperature, until a homogeneous transparent visible light-sensitive TiO2 colloidal sol C was formed. After that, PAC was dispersed into sol C to form TiO2/PAC with constant stirring for 1 h and ultrasonicated for 1 h. Finally, the resultant TiO2/PAC was aged for 24 h and dried at 80 °C for 12 h. TiO2/PAC was heated under N2 flow at a rate of 5 °C/min and maintained at constant temperature at 700 °C for 2 h to obtain the final composites TiO2/PAC.
2.4. 2-MIB Quantification
As clearly described by the method of [25], 2-MIB was determined by gas chromatography mass spectrometry (GC-MS, GC-MS-QP2010 Plus, SHIMADZU, Japan). The internal standard used was 0.01 M 1,2-dichlorobenzene (DCB) and NaCl salt was also used. The GC column used was a J&W 122–5563 (30 m × 0.25 mm × 0.25 μM). High-purity helium was used as the carrier gas at at a constant rate of 1 mL/min under splitless mode. The oven temperature was initially held at at 60 °C for 0.5 min, then increased to 180 °C at a rate of 15 °C/min for 1 min, followed by an increase to 280 °C at a rate of 40 °C/min for 5 min. 2-MIB was operated in the selected ion monitoring (SIM) mode. The mass spectral quantitative ion for 2-MIB was at an m/z of 95, and the qualitative ions were at m/z values of 95, 108 and 168. The electron energy used was 70 eV, and the ion source temperature and the quadrupole temperature were maintained at 200 °C and 250 °C, respectively.
2.5. Experimental Studies for 2-MIB Removal
2.5.1. Batch Adsorption Experiments
Adsorption experiments were performed using 1 L brown flask in the dark. A specified amount of PAC or TiO2/PAC was added to a 1000 mL 2-MIB solution. The batch tests consisted of the contact time (0–180 min), adsorbent amount (2–15 g) and 2-MIB concentration in solution (5–800 ng/L). One flask was used for each experiment and placed on an orbital shaker at 350 rpm for 24 h at room temperature. All the suspensions were centrifuged at 4000 rpm for 10 min, and then filtered with a 0.45 μm membrane before analysis. The 2-MIB in filtrates was determined by GC-MS, as described in detail in Section 2.3. Repeatability test was performed three times and the mean values being presented. The adsorption capacity (ng/mg) and the removal efficiency (RE %) for 2-MIB were calculated using (1) and (2), respectively:
where C0 and Ct (ng/L) are the initial and equilibrium concentrations, respectively. RE (%) is the removal efficiency at time, t, m (g) is the adsorbent mass and V (L) is the adsorbate volume.
2.5.2. Photodegradation Experiments
The 250 W xenon lamp with a peak wavelength of a 365 nm was employed as UV light source in the light reaction instrument (BL-GHX-V, China). Experiment temperature was controlled at 20 ± 1 °C. After adsorption equilibrium, a series of 100 mL PAC and TiO2/PAC suspensions were quickly shifted to the quartz reactors and sealed with parafilm. Subsequently, the samples were magnetically stirred and continuously irradiated under illumination. The subsequent steps were the same as described above. The resulting suspension were centrifuged, filtered, and measured for 2-MIB at regular time intervals by GC-MS.
2.6. Characterization of the Adsorbent
X-ray diffraction analyses (XRD; Ultima IV 2036E102, Rigaku Corporation, Japan) with Cu Kα radiation (λ = 1.540598 Å) were conducted to observe the crystalline nature of the adsorbent. Fourier-transform infrared spectroscopy (FT-IR) (VERTEX70 instrument, Germany) was conducted to identify the dominant functional groups at the surfaces of the target adsorbents. Microstructure changes before and after TiO2/PAC synthesis were investigated using scanning electron microscopy (SEM, ZEISS, Ltd, Germany) equipped with energy-dispersive X-ray spectroscopy (EDX).
2.7. Modeling for Competing NOM Analysis
NOM is ubiquitous in the water environment with concentration ranging from few to hundreds of mg/L organic carbon [26]. Previous studies have shown that NOM severely influences the adsorption capacity of micro-pollutants [27,28]. In heterogeneous photocatalytic systems, NOM is considered as one of the most important factors influencing the adsorption and photodegradation behavior of organic pollutants. Based on the ideal adsorbed solution theory (IAST), the equivalent background compound (EBC) model is proven to be an effective method to describe the competitive removal of NOM and trace pollutants [5,29]. EBC model is characterized by an initial concentration C0, EBC and Freundlich isotherm parameters (KF,EBC, 1/nEBC). Incorporating the Freundlich isotherm into the IAST, the solute adsorption isotherm was calculated as follows:
With the help of IAST application, the EBC model can be fitted as a bi-solute system, which is used as a simplified description of the NOM effects. Thus, Equation (3) can be converted to bi-solute adsorption equation:
However, kE, nE and CE,0 are more difficulty to solve. There are three assumptions: (1) qE was much greater than qT, (2) the Freundlich exponents 1/nT and 1/nE are similar, (3) liquid equilibrium concentration of EBC can be ignored when PAC dosage was enough [30].
However, the application of the EBC model is time-consuming, since the model is required for the experimental measurement of the tracer isotherm in presence and absence of NOM. Therefore, Knappe et al. [31] deduced an equation that direct determined the proportionality between adsorption capacity and initial concentration of tracer at a given dosage of adsorbents following the experimental data. According to the same assumptions, Qi et al. [32] and Knappe et al. [31] have derived a simplified equation from EBC (SEBC) model under the condition that the adsorbed amount of the EBC is much higher than that of the tracer and the values of Freundlich exponents are similar. The following equation can be deduced from the (3), (4) based on IAST (Worch, 2010):
This model provides the opportunity to describe mathematically the removal curve of tracer. As can be seen from Equation (5), B value has no relations with CT,O/CT. Thus, when the initial concentration CT,0 changed, it does not influence on CT,O/CT values that is only related to adsorbent dosages and solution volumes. When B and nT can be determined from a linear regression curve, it can be deduced to (C0-CT)/C0 = f (mA/V). This means that the concentrations of tracer were lower when compared to NOM, the CT/C0 value of the tracer was independent of the initial tracer concentration and only determined by the given adsorbent dosages. If the values of B and nT were determined, the CT/C0 value of the tracer from NOM bearing water could be calculated at any adsorbent mass, in contrast to the EBC model above. This model is in good agreement with the previous studies, and the advantages and limitations of SEBC model were given in previous literature [5,32,33].
Although the model was used to describe the adsorption process of organic pollutants rather than the photodegradation reaction, photodegradation only significant promotes the removal the organic pollutants from water without inhibiting their adsorption process. From this perspective, although the fitting parameters of the model were changed, the mathematical mechanism was still applicable for describing adsorption process, which needs to be further confirmed by this study.
3. Results and Discussion
3.1. Characterization of Adsorbent
3.1.1. SEM Images
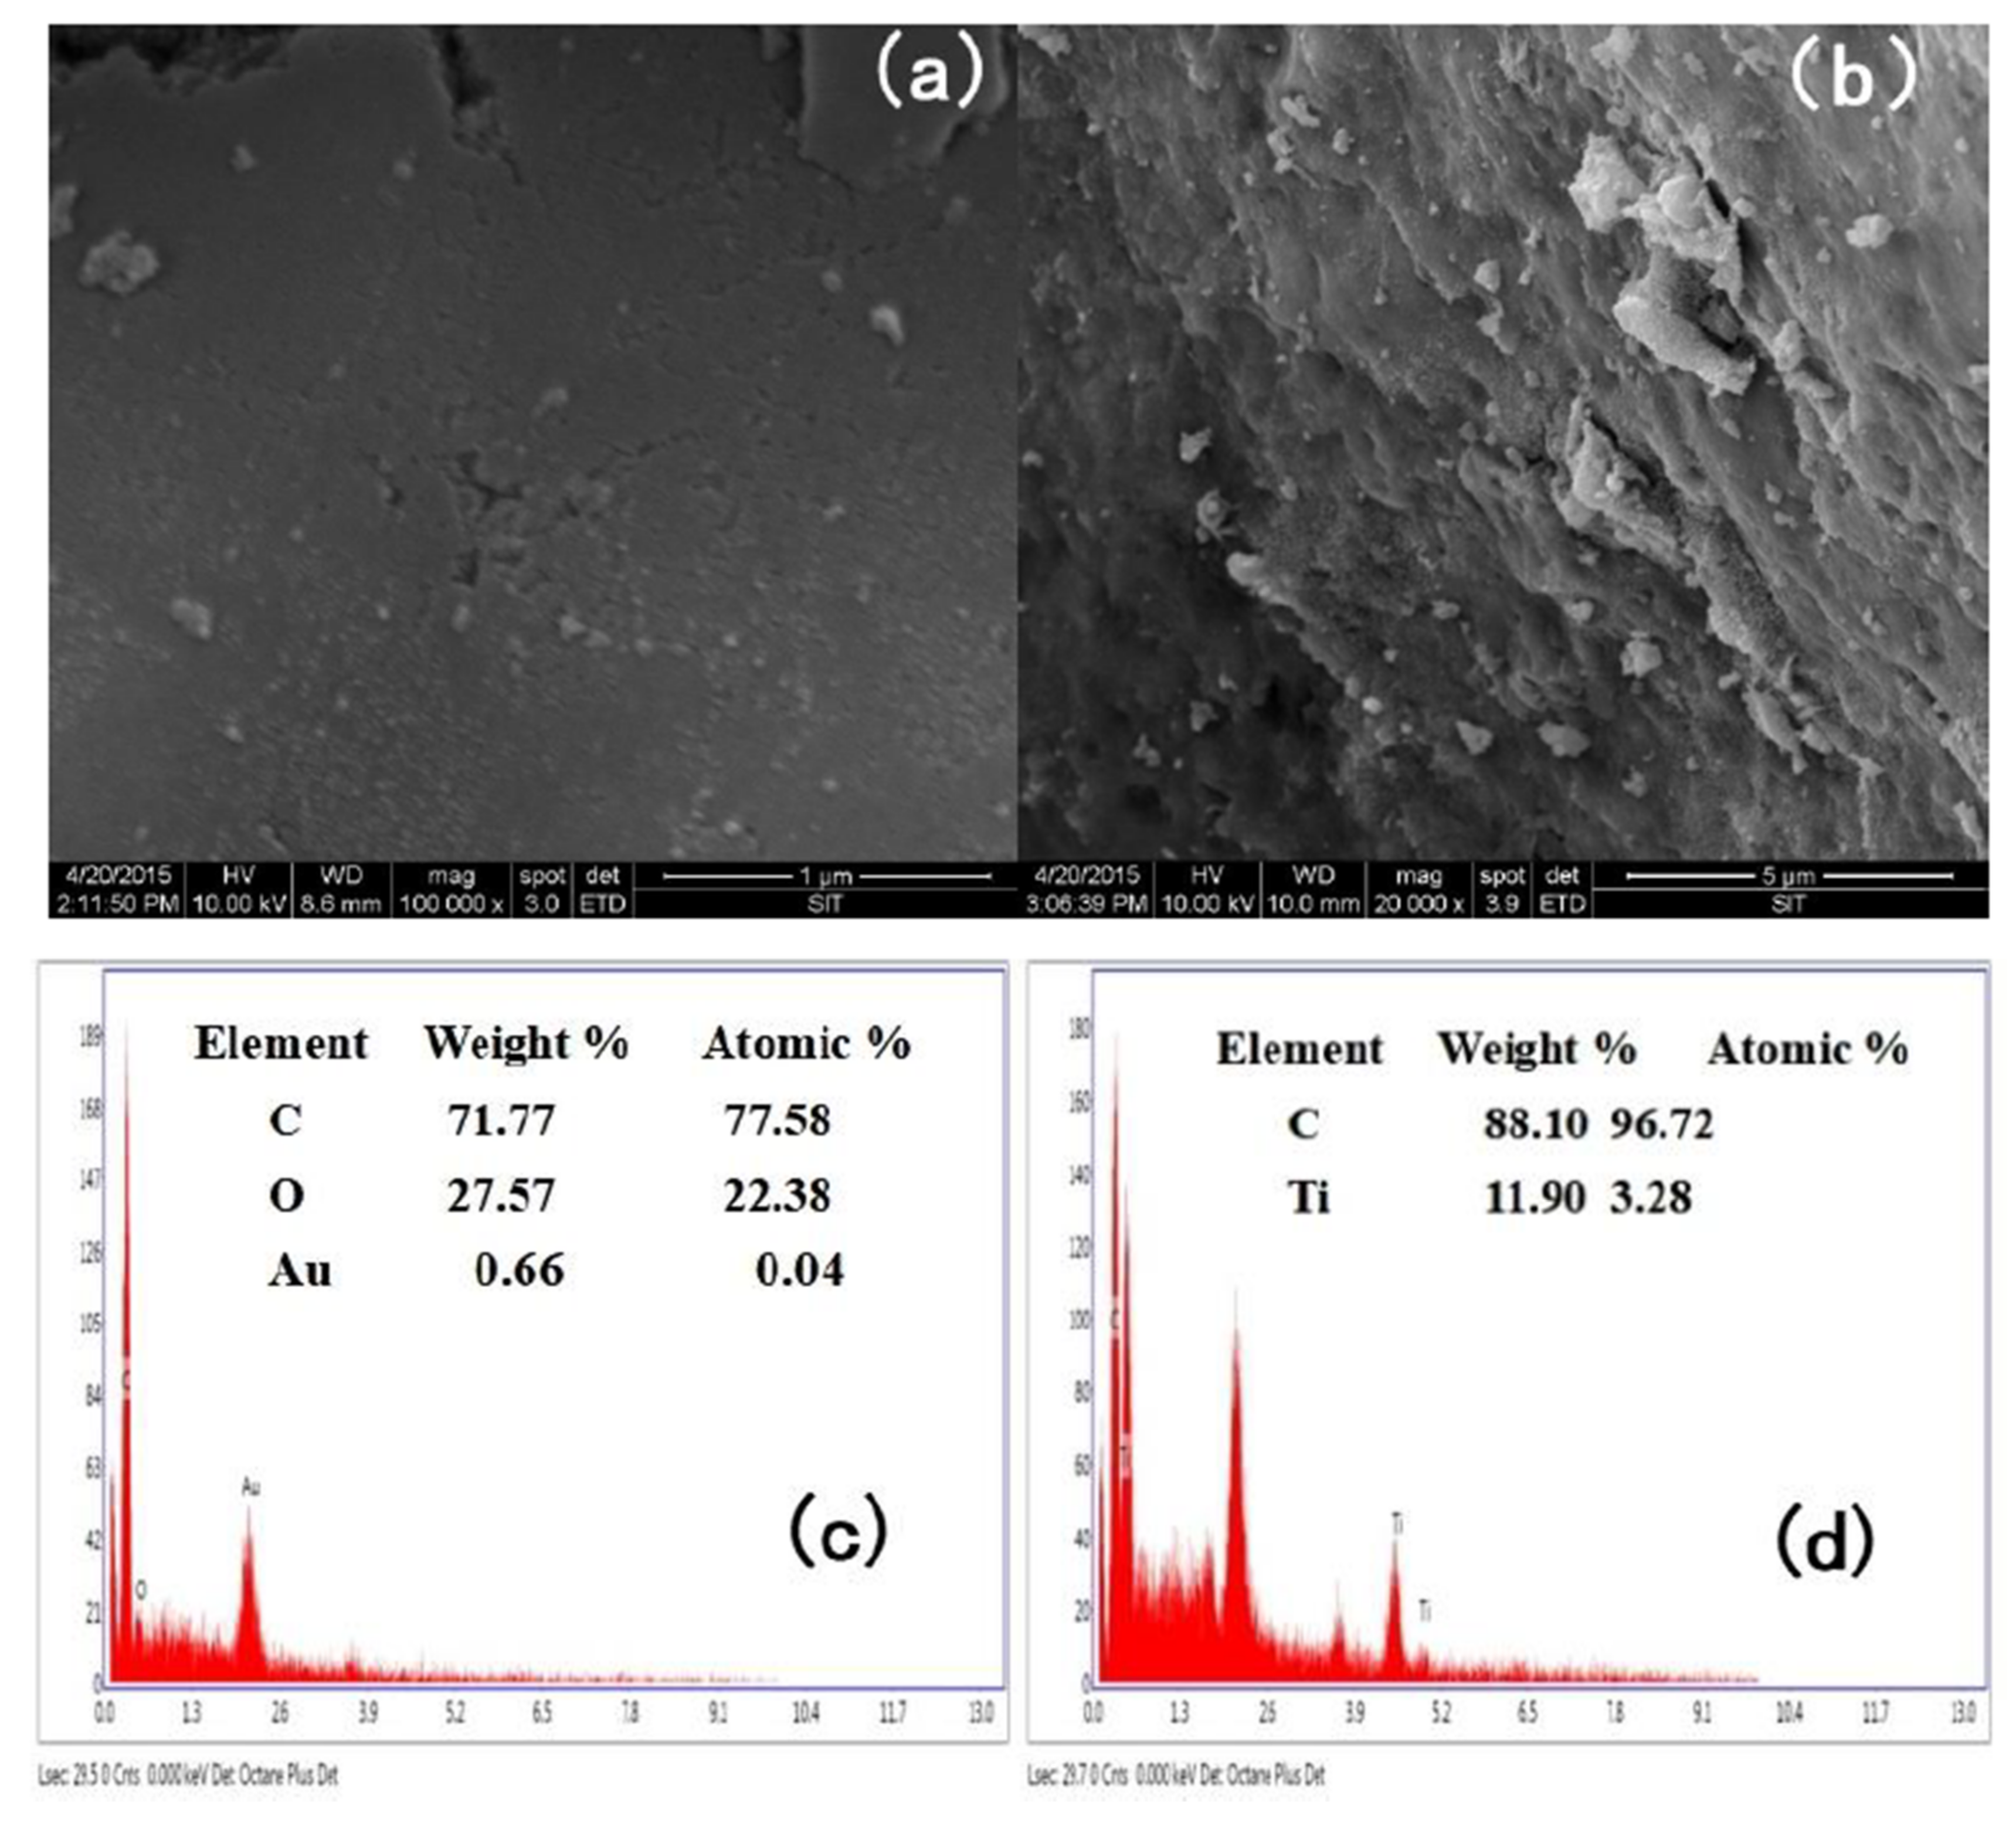
SEM images along with their EDX analyses of PAC and TiO2/PAC are shown in Figure 1. It was clearly seen that PAC had irregular porous structure with a high distribution density (Figure 1a). The element mapping on EDX indicated that the percentage of C, O and Au were 77.77%, 27.57% and 0.66%, respectively (Figure 1c). It should be noted that the Au mainly resulted from the Au-plated film used for the conductivity enhancement of PAC. TiO2 particles was dispersed in the surface of TiO2/PAC. Moreover, a rough porous structure was observable on TiO2/PAC confirmed the formation of TiO2 on PAC surface (Figure 1b). In addition, 11.99 wt % of Ti in the EDX spectrum was very close to the content of TiO2 (10% wt) in TiO2/PAC, further indicating that nano-TiO2 was successfully scattered on the surface of PAC (Figure 1d).
3.1.2. FTIR Analysis
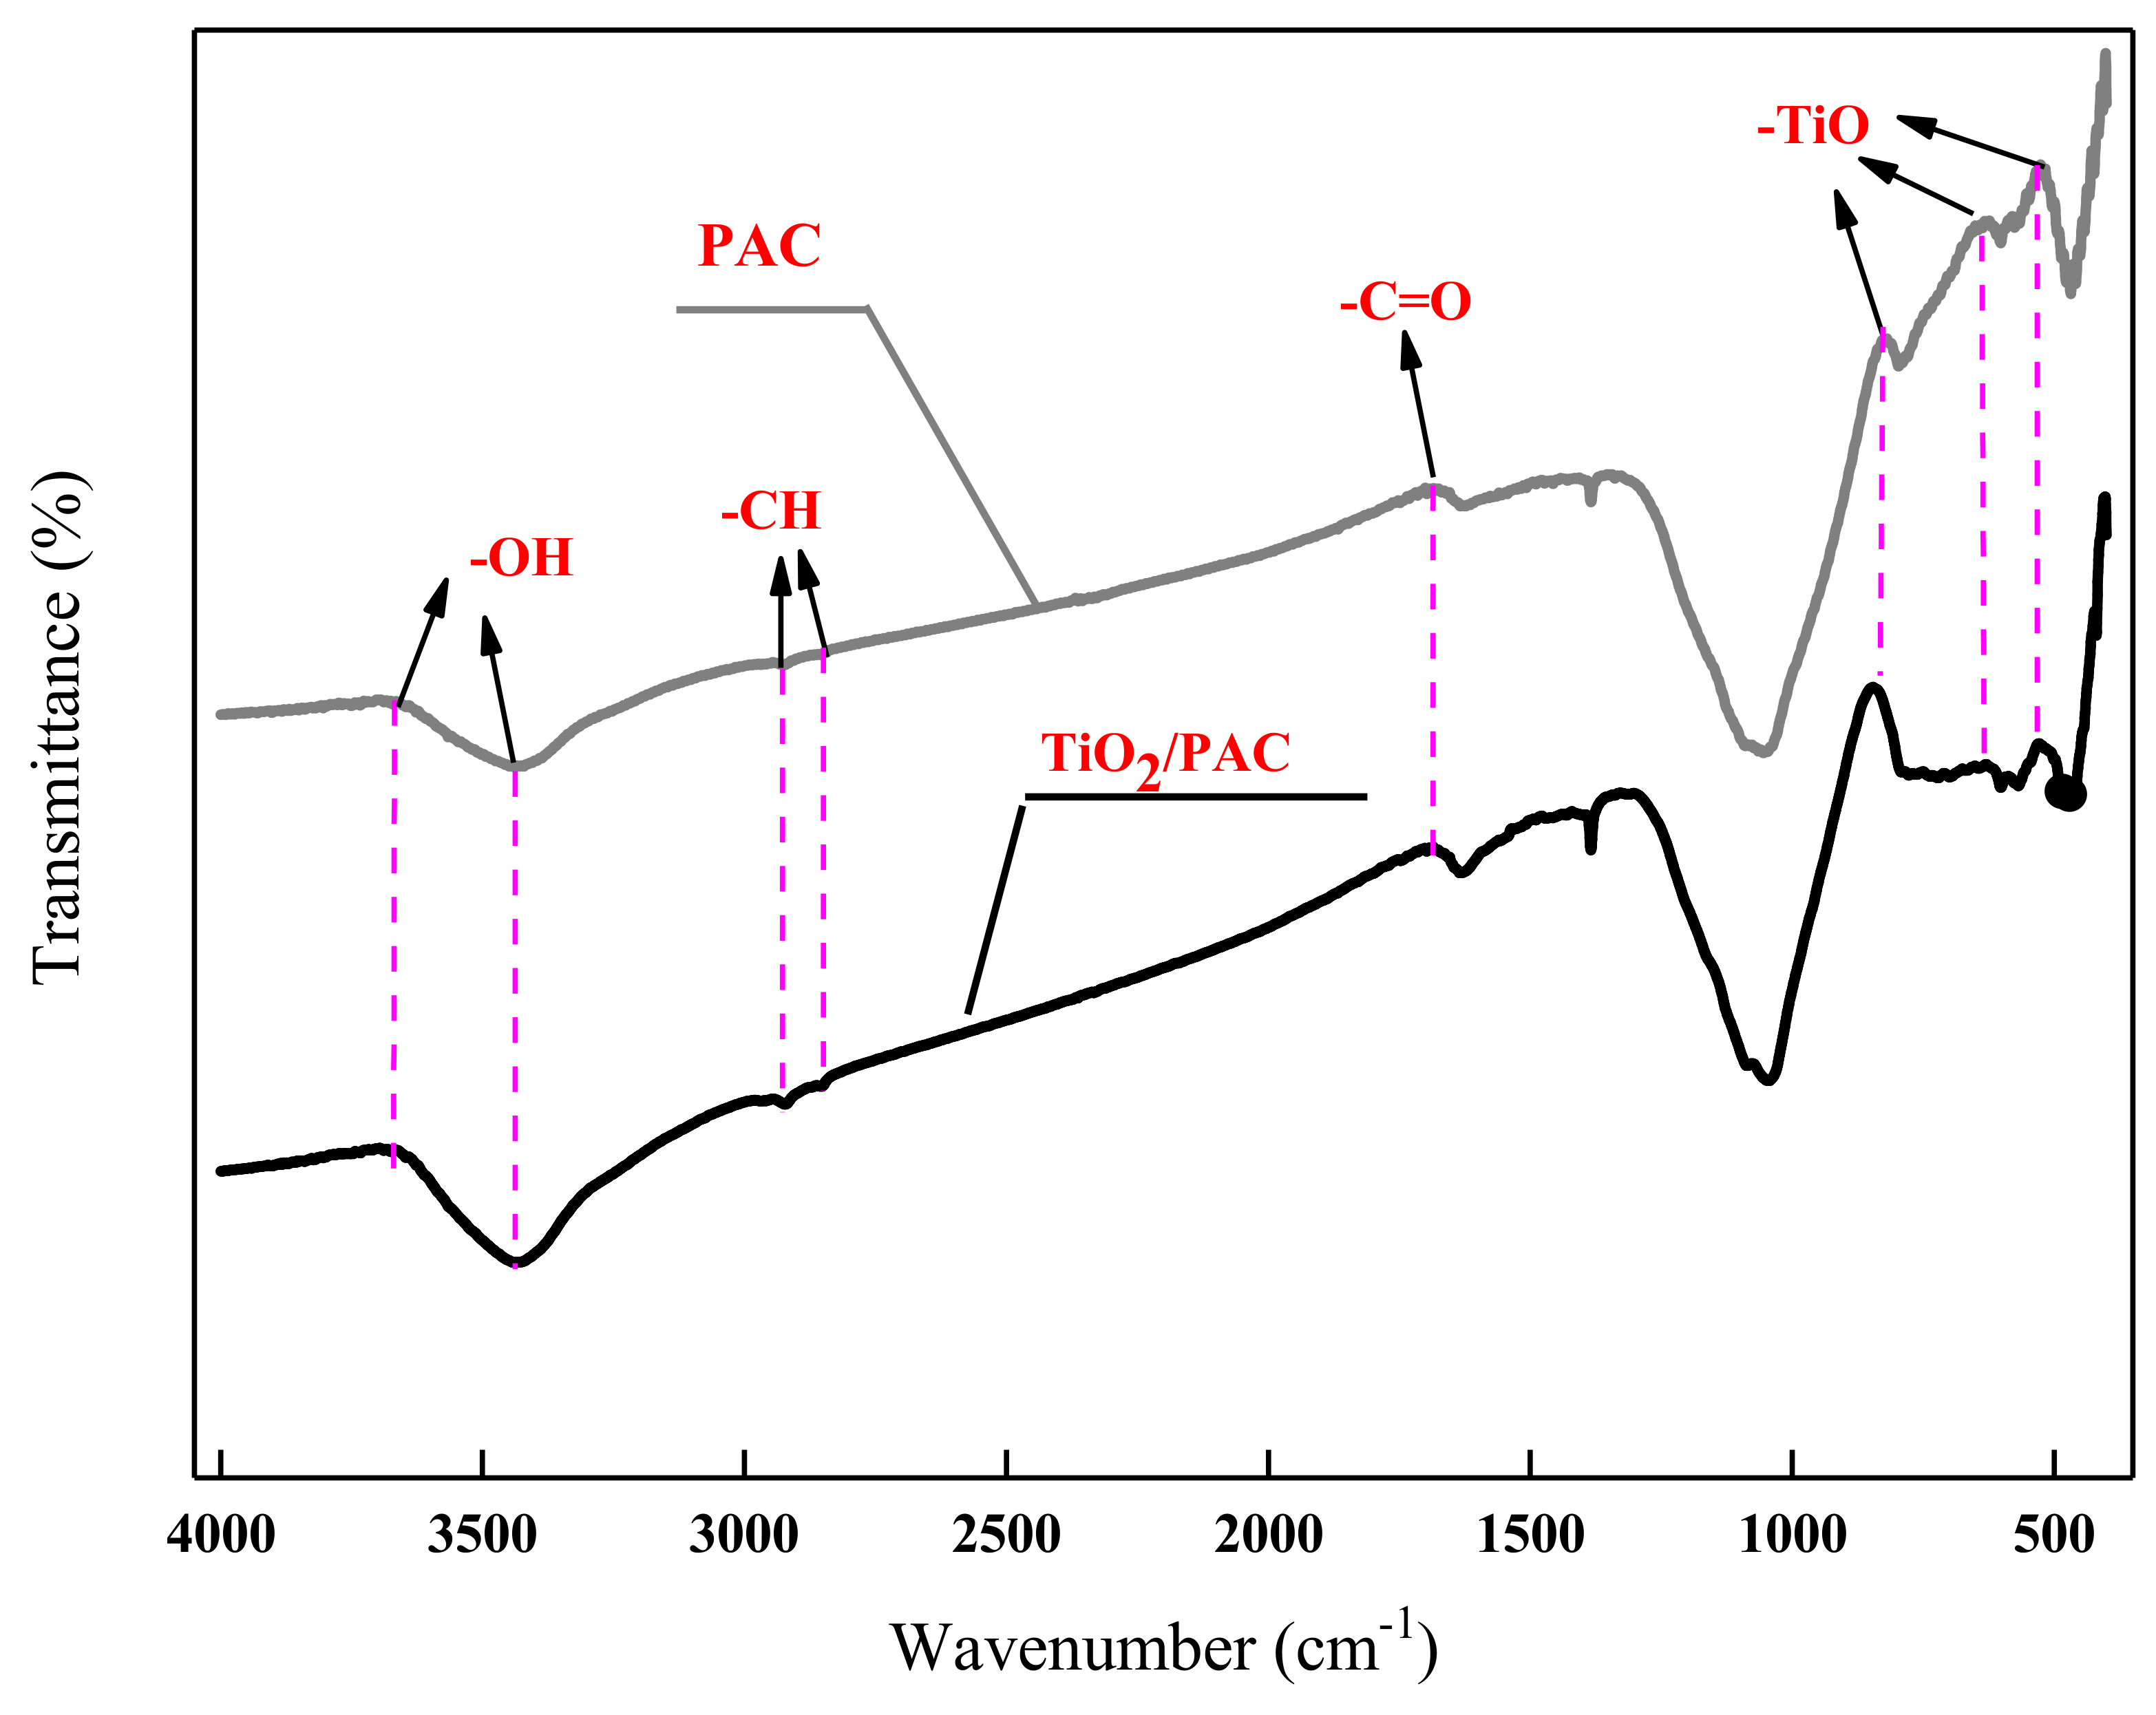
FTIR spectra of PAC and TiO2/PAC is shown in Figure 2. One absorption peak and five absorption bands were observed in PAC. The presence of two characteristic bands were ascribed to the stretch and bend vibrations mode of –OH and –C=O, which was observed between 3600 and 3100 cm−1 and at around 1600 cm−1, respectively. A slight band was a little weaker than TiO2/PAC, which was observed at around 2900 and 2850 cm−1, and corresponds to the aliphatic –CH stretching. In addition, the fourth absorption peak around 1420 cm−1 and the fifth band around 1050 cm−1 belonged to single bond vibrations. Compared with the single peak of PAC, the intensity of a characteristic absorption peak observed between 800 to 550 cm−1 decreased and slight shifting of the peaks was also observed. The peak was attributed to the skeletal vibration of –TiO bond. This phenomenon indicated that nano-TiO2 particles were successfully combined to the PAC surface. These results were additionally confirmed by SEM-EDX and XRD results.
3.1.3. XRD Analysis
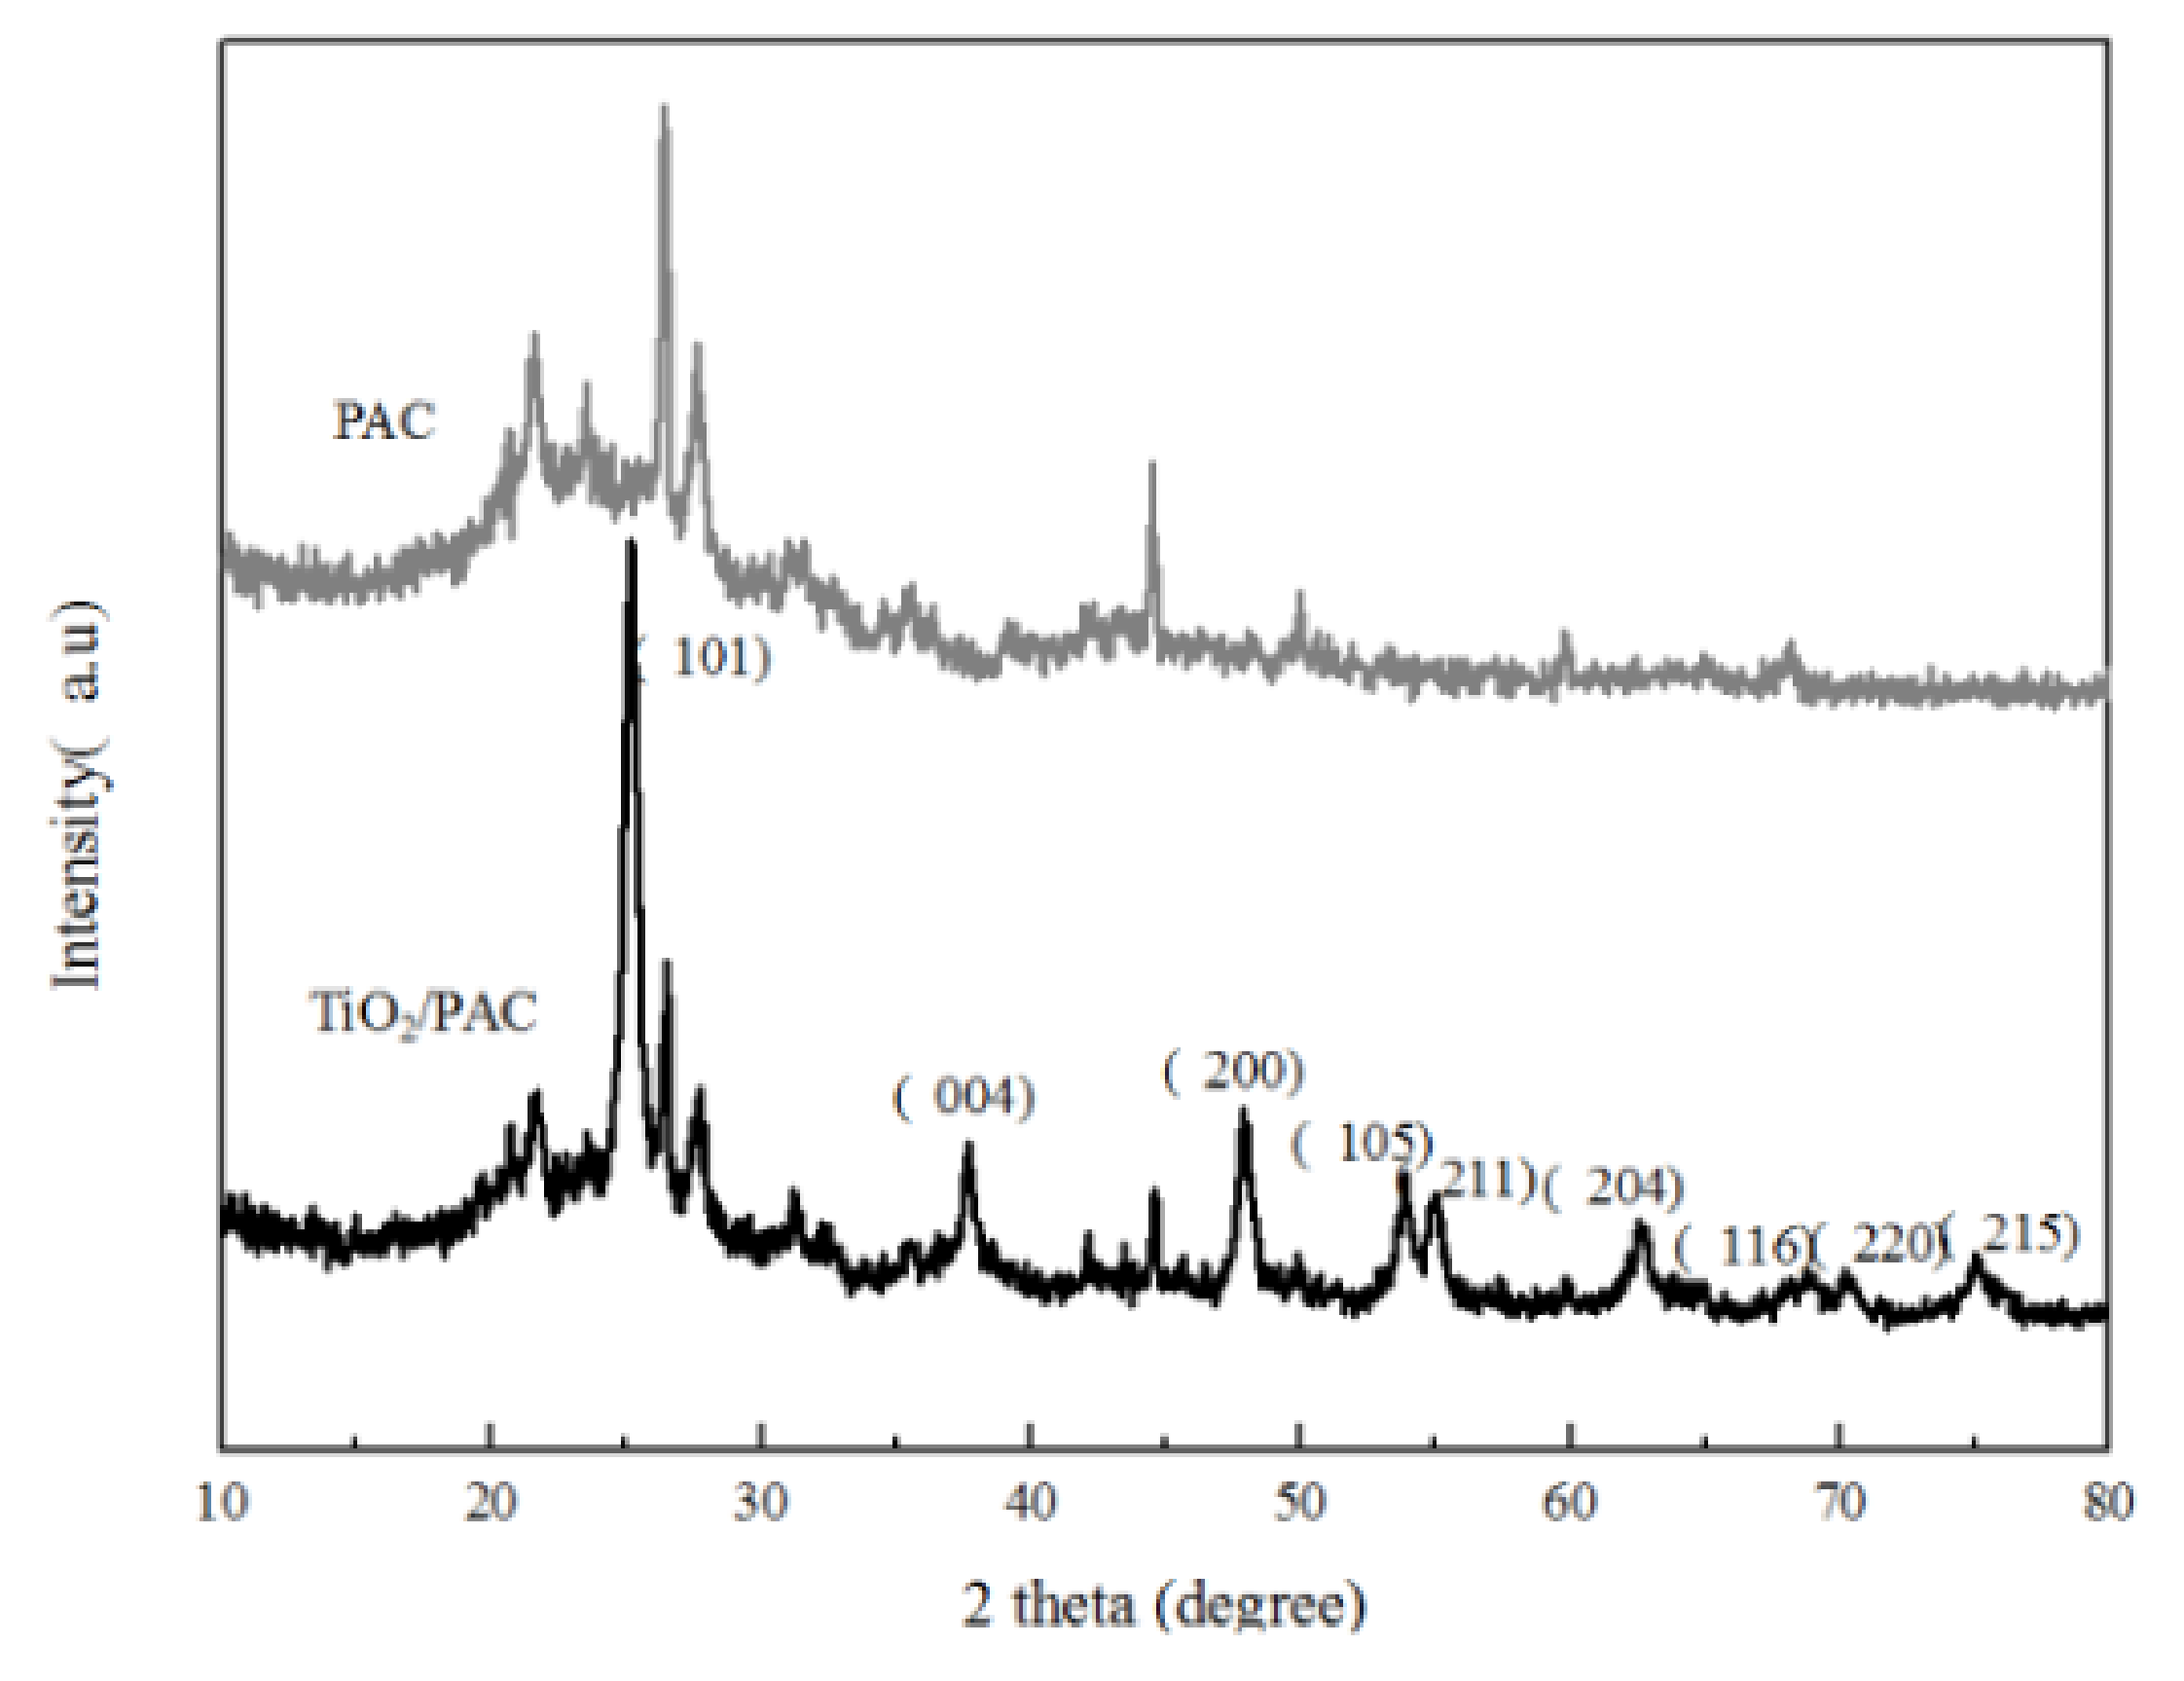
XRD patterns of PAC and TiO2/PAC are shown in Figure 3. The most intense peaks observed at 2θ = 25.16°, 37.72°, 47.92°, 53.88°, 54.96°, 62.52°, 68.79°, 70.21° and 75.04° corresponded to the (101), (004), (200), (105), (211), (204), (116), (220) and (215) crystallographic phases of TiO2 in TiO2/PAC. It was also clear that the presence of TiO2 in the prepared material significantly enhanced the crystallinity of the PAC. Moreover, one diffraction peaks appearing at 37.72° and 54.96° were due to the formation of rutile TiO2 on the PAC surface, while two other intense peaks of anatase TiO2 appear at 25.16° and 47.72° [34,35]. It should be noted that some miscellaneous peaks were observed in the tetragonal structure of (101) and (200) due to the high concentrations of Si in the PAC ash. In addition, the miscellaneous peaks of PAC were much weaker than TiO2/PAC, due to the presence of TiO2 could mask the diffraction peaks of SiO2.
3.2. Adsorption Experiments
3.2.1. Adsorption Isotherm
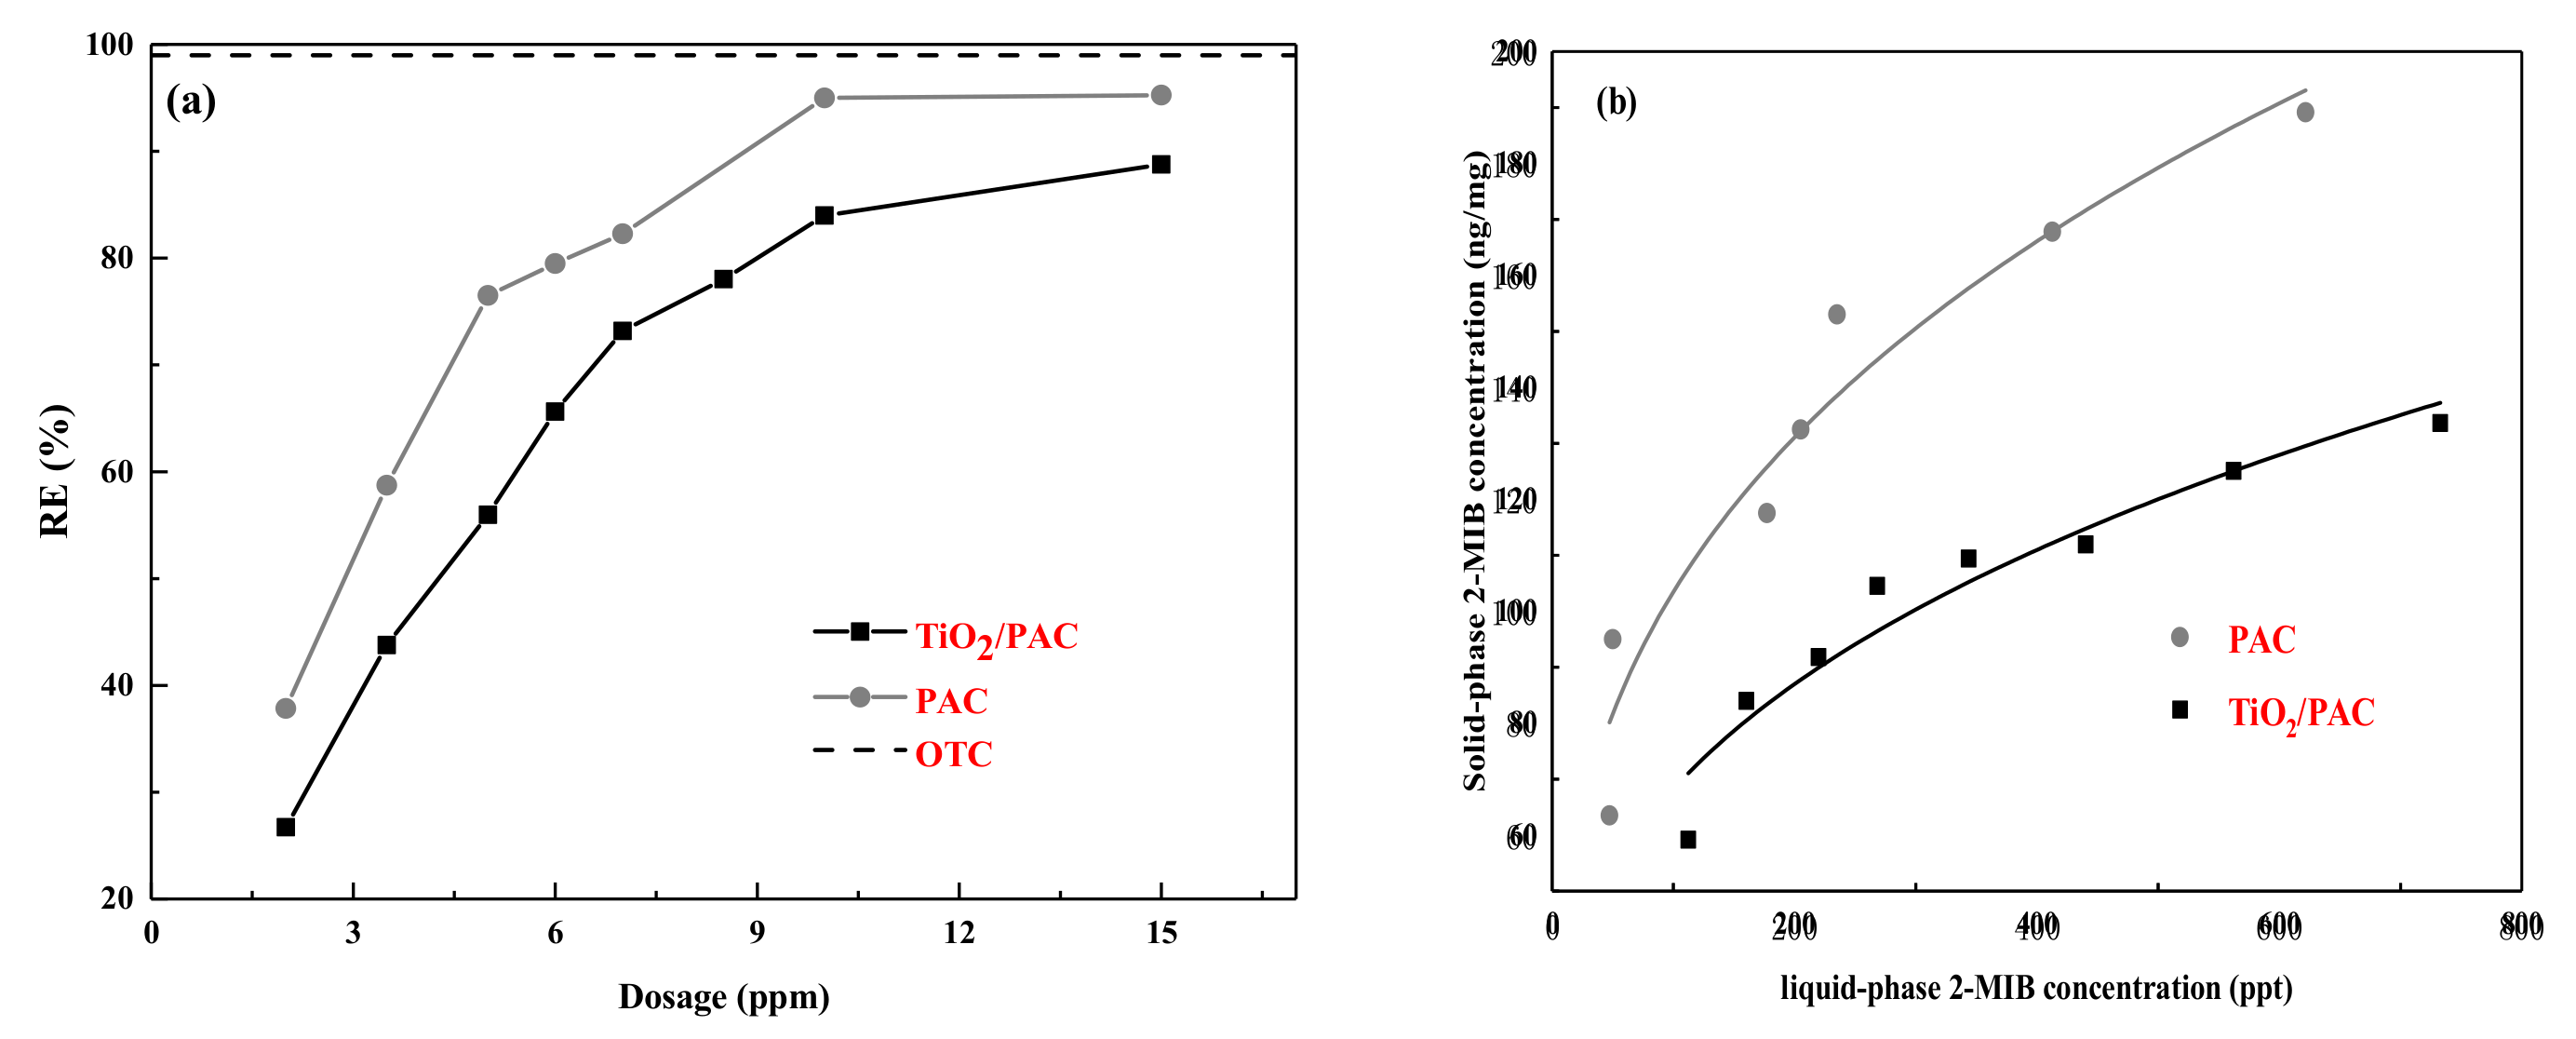
The adsorption isotherm is important indicator to describe the apportioned adsorbates in solid and liquid phases at equilibrium. The dashed line in Figure 4a means the odor threshold concentration (OTC) of 2-MIB in drinking water. As shown in Figure 4a, the adsorption capacity of PAC or TiO2/PAC increased with the increase of their dosages. It was also observed that in contrast to PAC, TiO2/PAC had a lower removal efficiency for 2-MIB. This result revealed that the loading rates of the TiO2 nanosheet into PAC did not play an important role in improving the adsorption capacity of the TiO2/PAC for the 2-MIB. The result was ascribed to the fact that TiO2 had been diffused into the pores of the PAC, especially mesoporous and macroporous, which led to the partial blockage of its pores. Meanwhile, the competition for adsorption sites on the TiO2/PAC surface resulted in a reduction in the specific surface area, which caused a decrease of the adsorption capacity.
Freundlich isotherm models [36]. provided better fitted results for our isotherm data, which can be used to better understand the adsorption process of 2-MIB. The obtained isotherm parameters and fitting curves were presented in Table 2 and Figure 4b. Thus, the above results suggested that the active binding sites on the surface of adsorbents were non-uniformly distributed and the adsorption process was multi-layer adsorption [37].
3.2.2. Photodegradation Performance
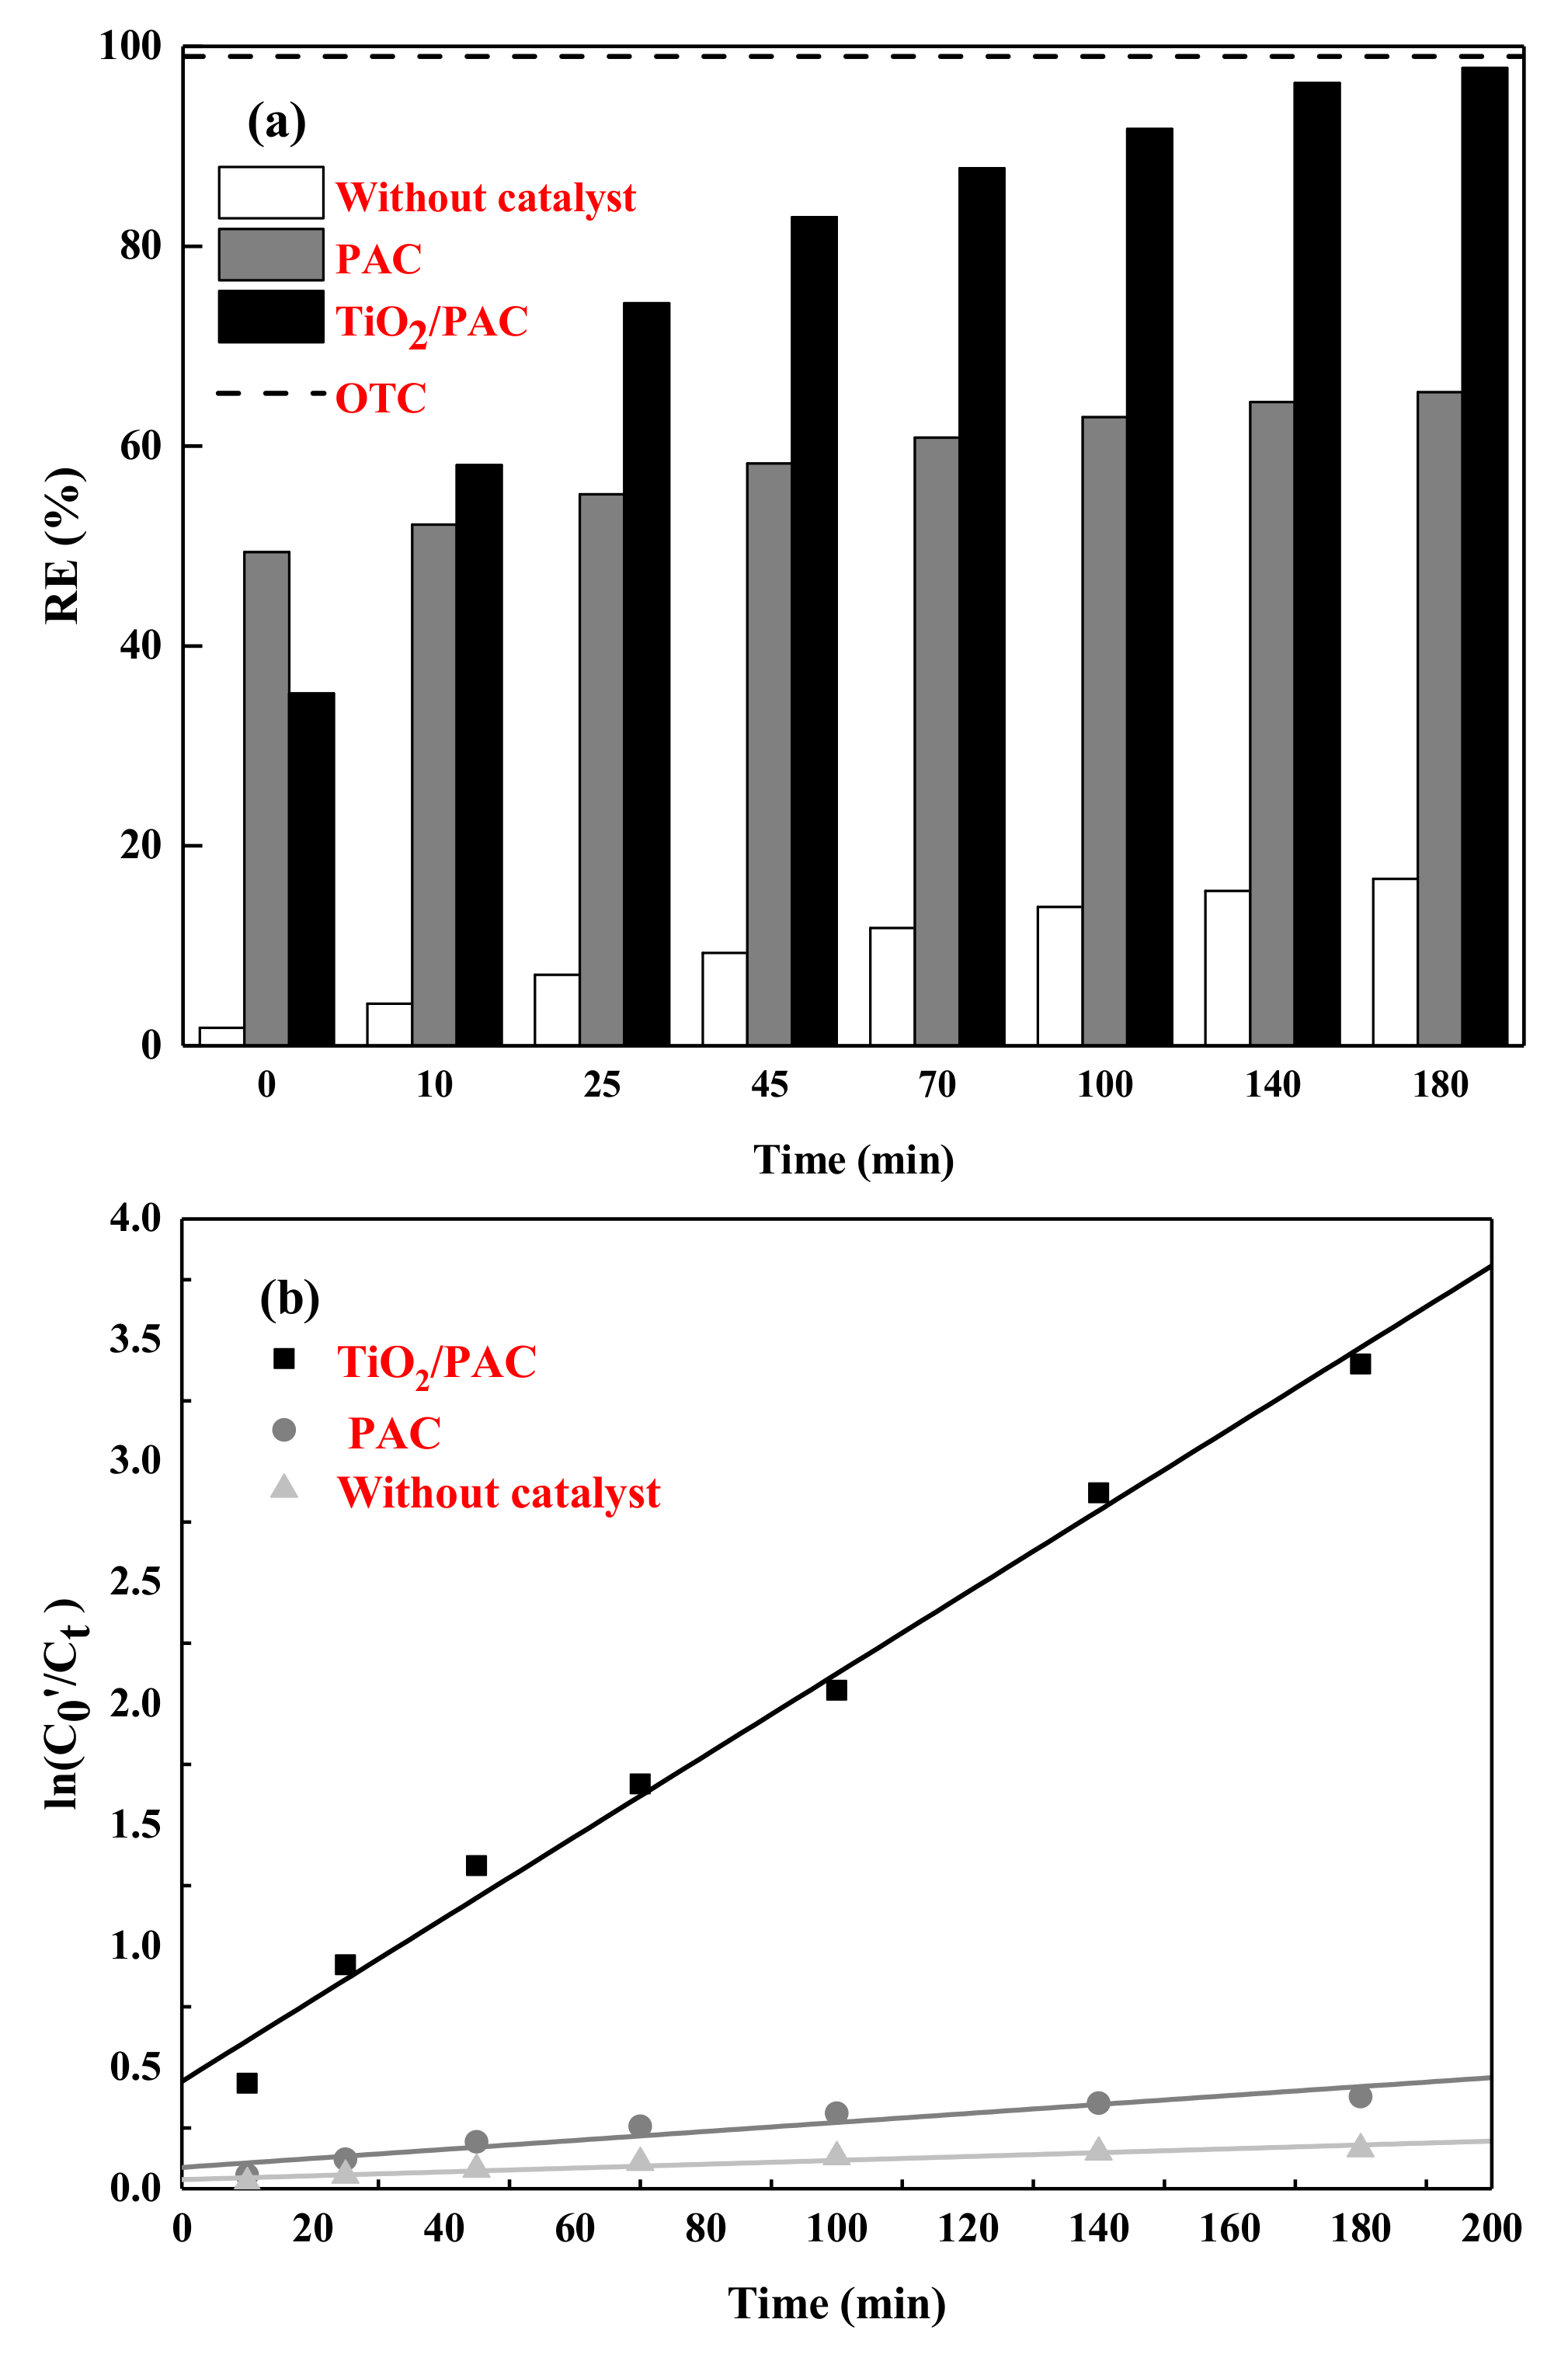
The photodegradation of 2-MIB by PAC and TiO2/PAC under UV irradiation were investigated, and the results were shown in Figure 5a. As shown in Figure 5a, PAC could remove around 49.4% 2-MIB from aqueous solution in the dark, while TiO2/PAC could adsorb about 35.3% 2-MIB from water. In addition, the degradation rate of 2-MIB was slow under UV light without catalysts. Both PAC and TiO2/PAC could remove 2-MIB rapidly under UV light. The degradation efficiency of PAC and TiO2/PAC for 2-MIB increased with time, until the achievement of equilibrium after about 3 h. In addition, it was clear that 97.8% degradation efficiency was obtained for TiO2/PAC within 180 min, while the degradation efficiency of 2-MIB was only 65.4% for PAC. These results indicate that 10% TiO2 was loaded on PAC surface could more effectively mineralize 2-MIB than PAC alone via the photocatalytic oxidation reaction [38].
Adsorption kinetics provides valuable information about the adsorption mechanisms and reaction rate. The kinetic curve and constant (k) values for 2-MIB degradation are shown in Table 3 and Figure 5b. The degradation rates of both catalysts for 2-MIB were evaluate by the first-order kinetics, and the k values of PAC and TiO2/PAC were 1.85 × 10⁻³ and 1.68 × 10⁻², respectively. These results indicated that their adsorption processes were in agreement with the physical adsorption [39]. It has been found that the photodegradation rate of 2-MIB by PAC was much lower than that of TiO2/PAC. One possible reason might be due to the fact that the surface of TiO2/PAC the pit structures were rougher and more formed in comparison with PAC, which contributed to adsorption [39,40]. Another reason for this result was that chain scission and oxidation by UV radiation resulted in the increase of dissociated functional groups on TiO2/PAC, which were more available for greater 2-MIB adsorption.
3.3. Influence of NOM on Photodegradation Performance
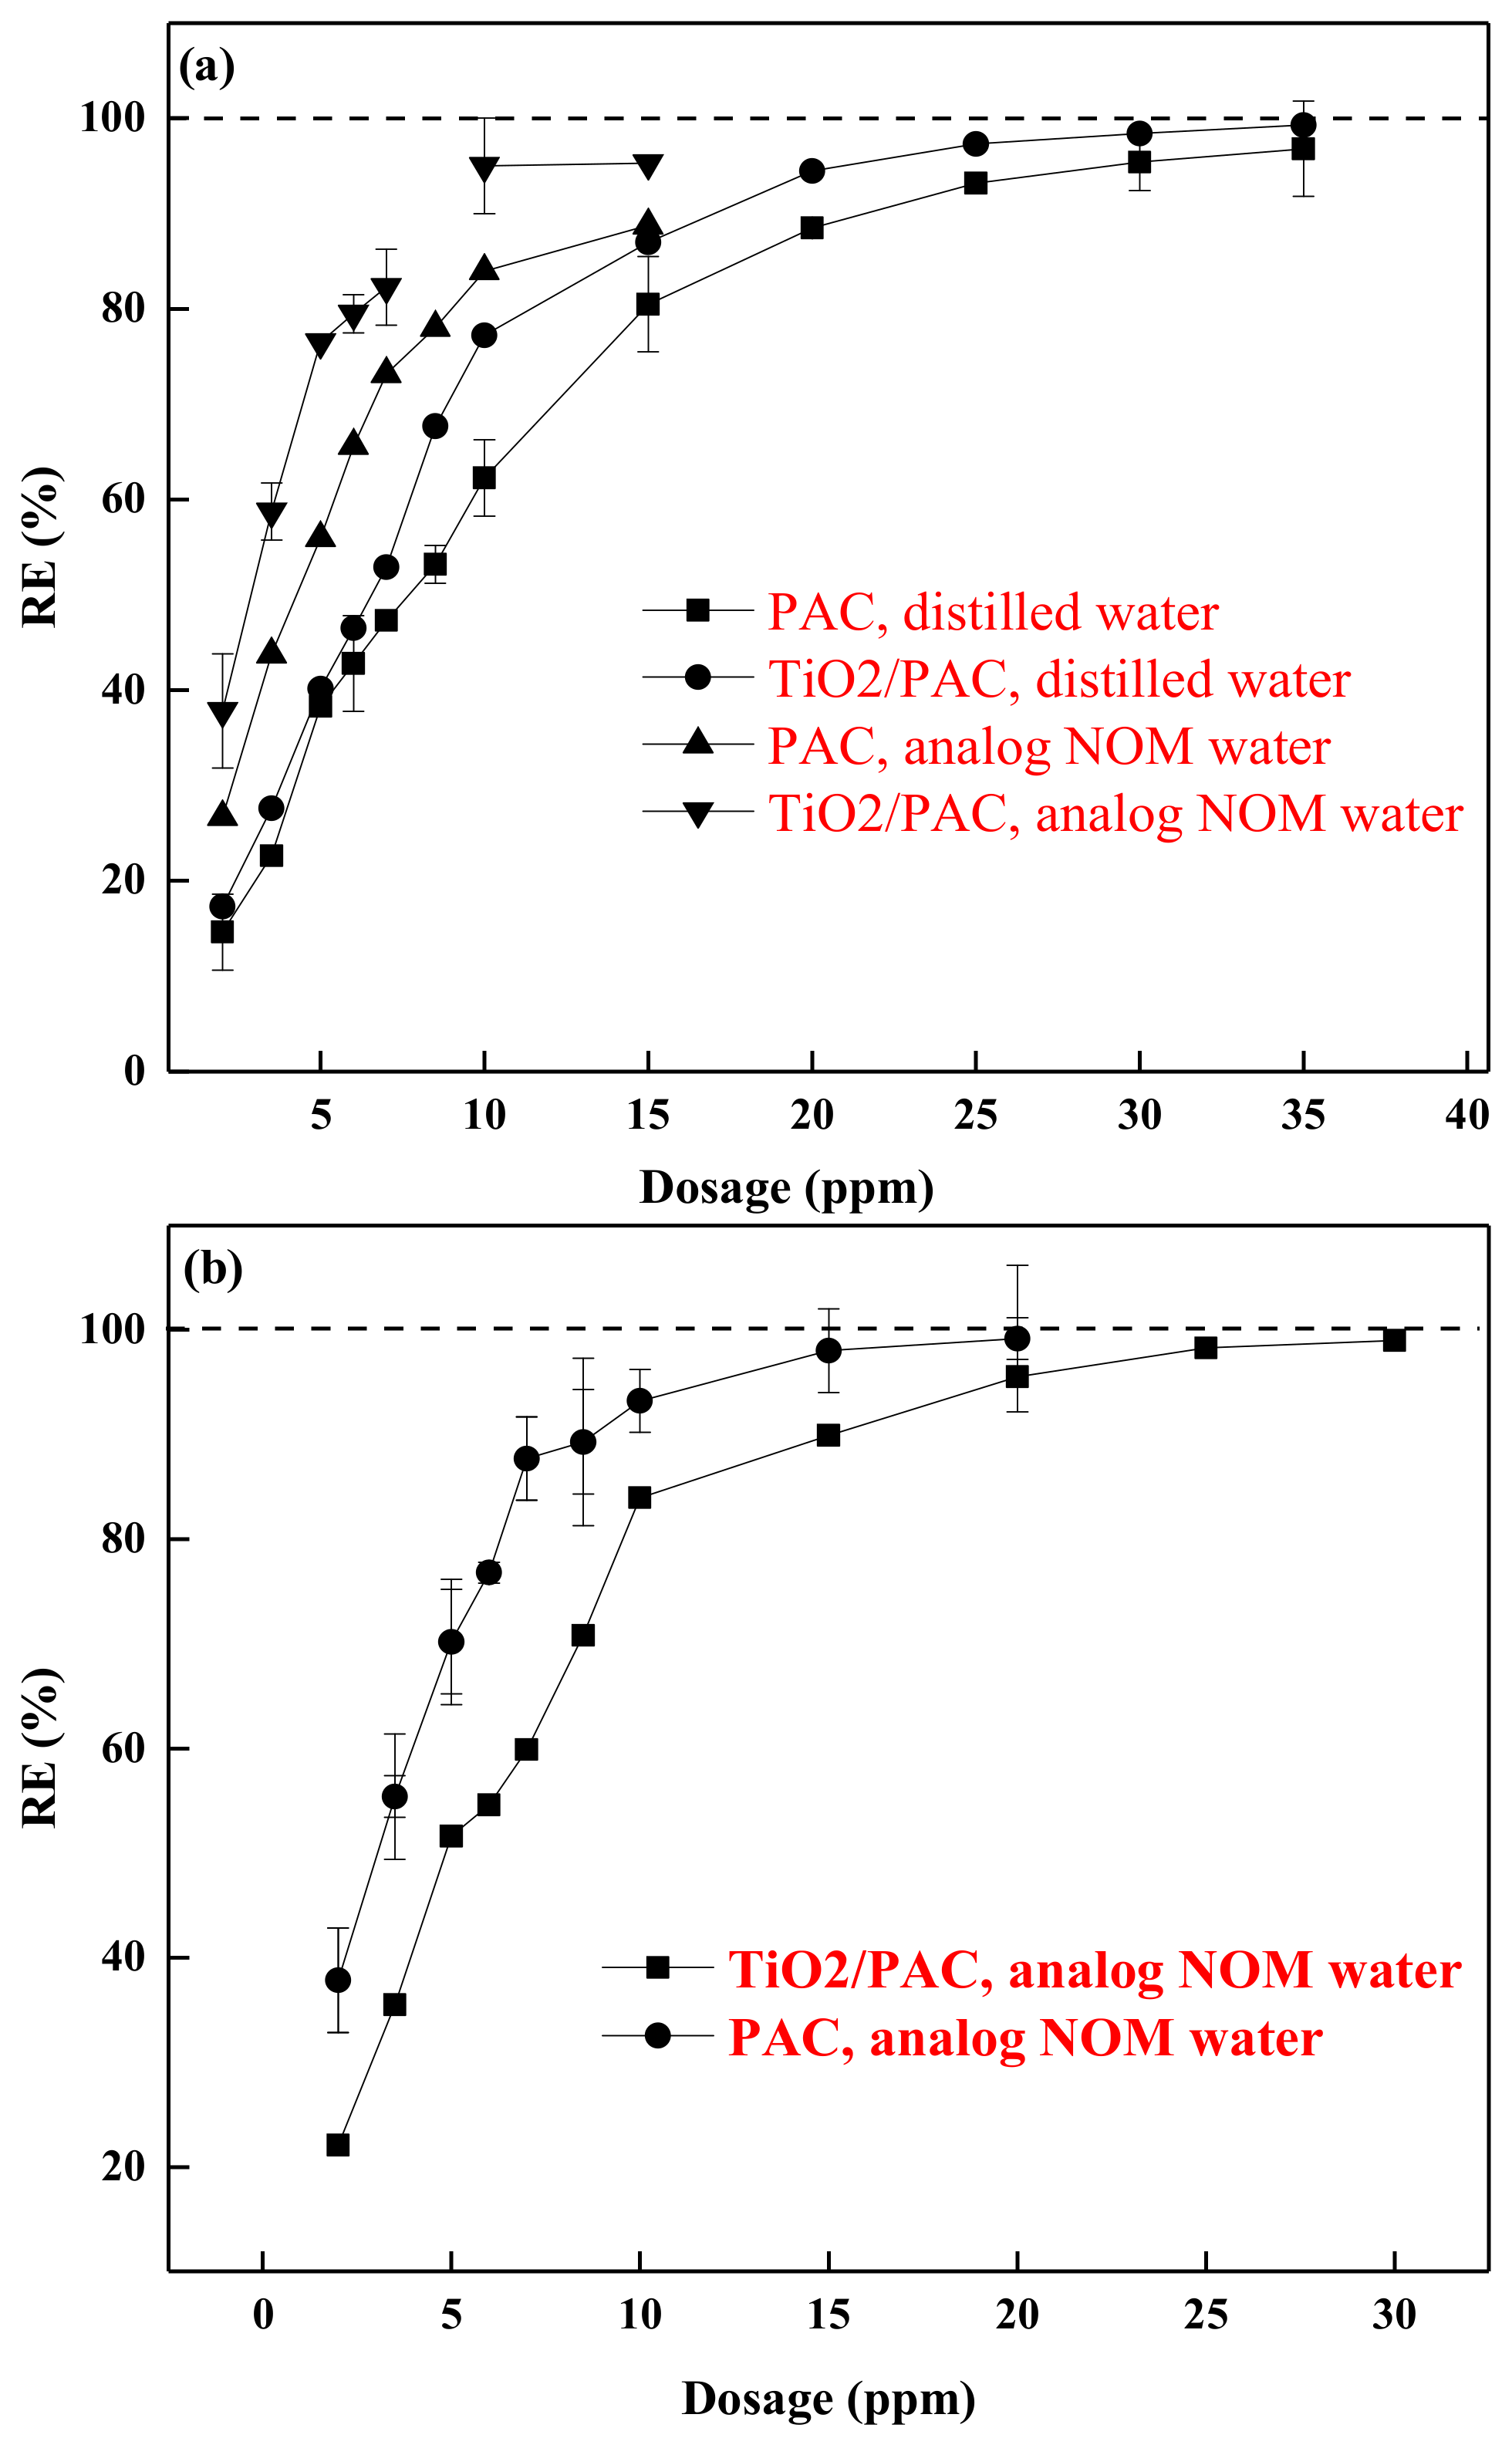
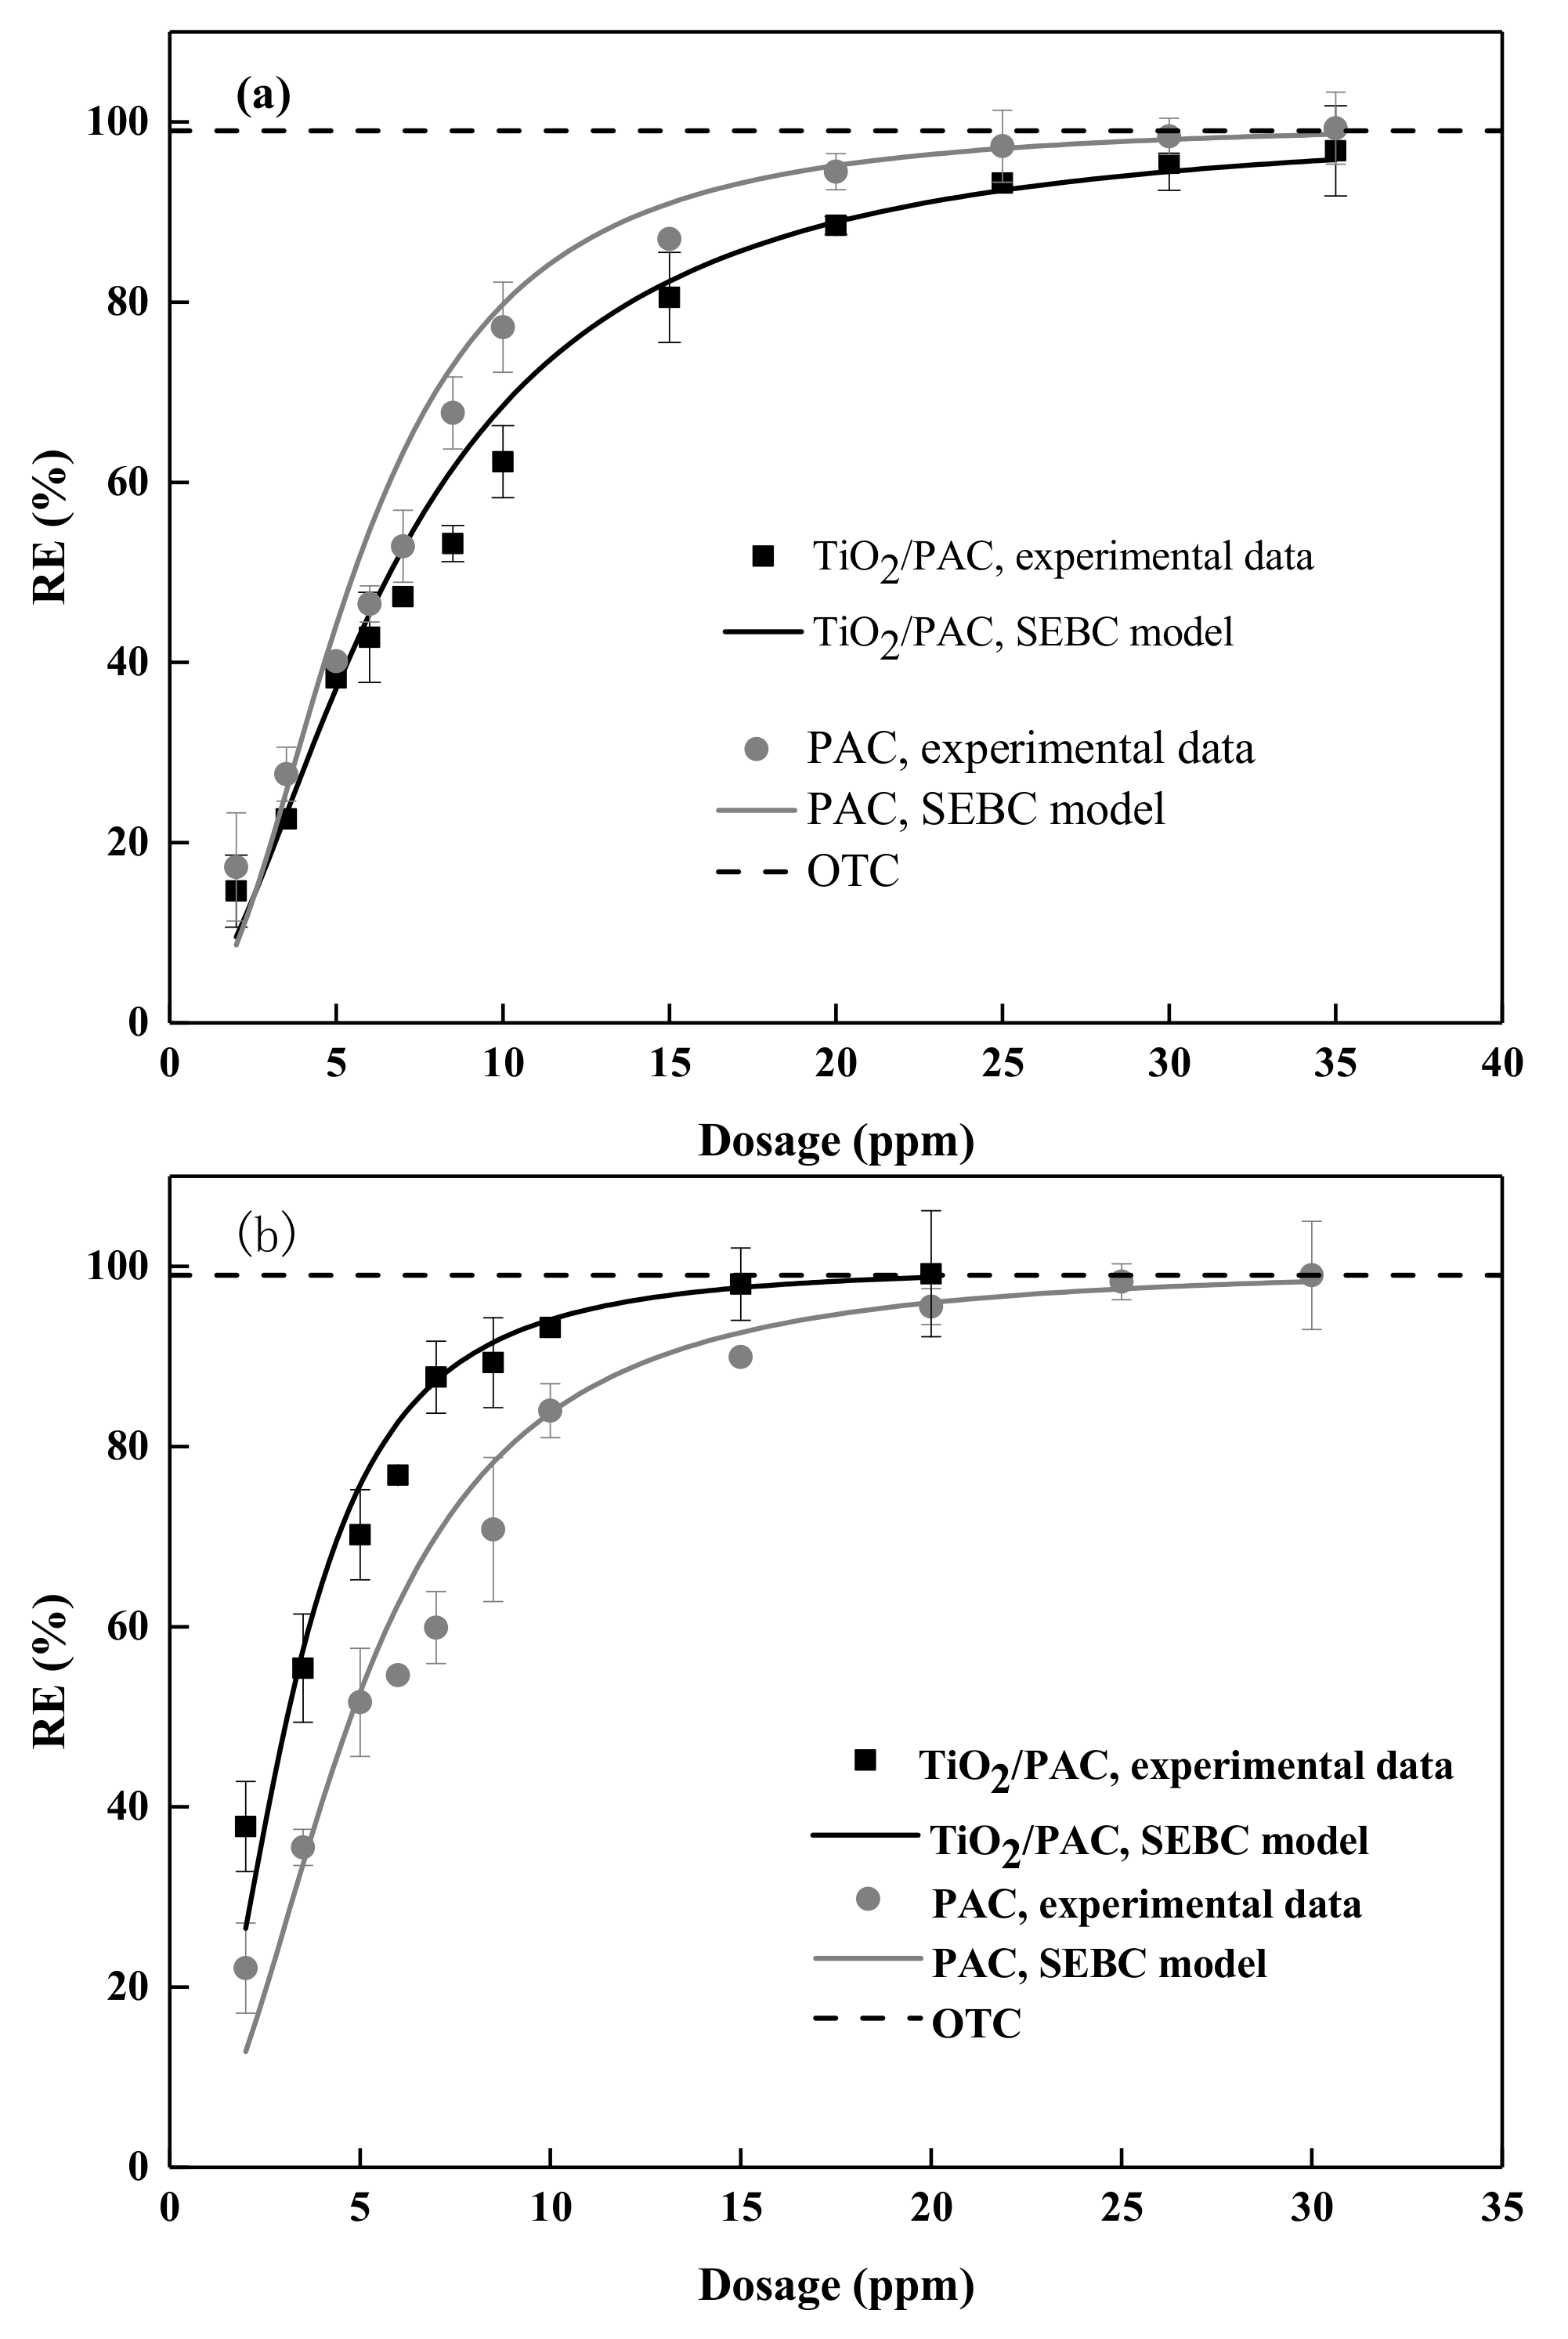
Humic acid (HA) and tannic acid (TA) were the main components of NOM, due to they being universally present in various natural waters [7,41]. In this study, HA and TA were considered as NOM and used to simulate NOM-containing water for evaluating its effects on the 2-MIB removal. Figure 6 shows the elimination of 2-MIB from distilled water and NOM water in dependence on the catalyst’s dosages before and after photodegradation. As shown in Figure 6a, it was found that the two catalysts have a closer removal in NOM water. However, the presence of HA and TA resulted in a significant decrease in the adsorption capacity of PAC and TiO2/PAC of for 2-MIB. In addition, to achieve OTC value, the required dosages for both catalysts in the water with low NOM concentrations increased about one time than in the distilled water. This phenomenon suggested that there was a competitive relationship between NOM and 2-MIB for active site on both catalysts. Meanwhile, it was worth noting that the competitive adsorption was the strongest, when the micro-organic molecules were close to the model pollutants. However, after the light degradation, the removal efficiency of TiO2/PAC for 2-MIB increased significantly (Figure 6b).
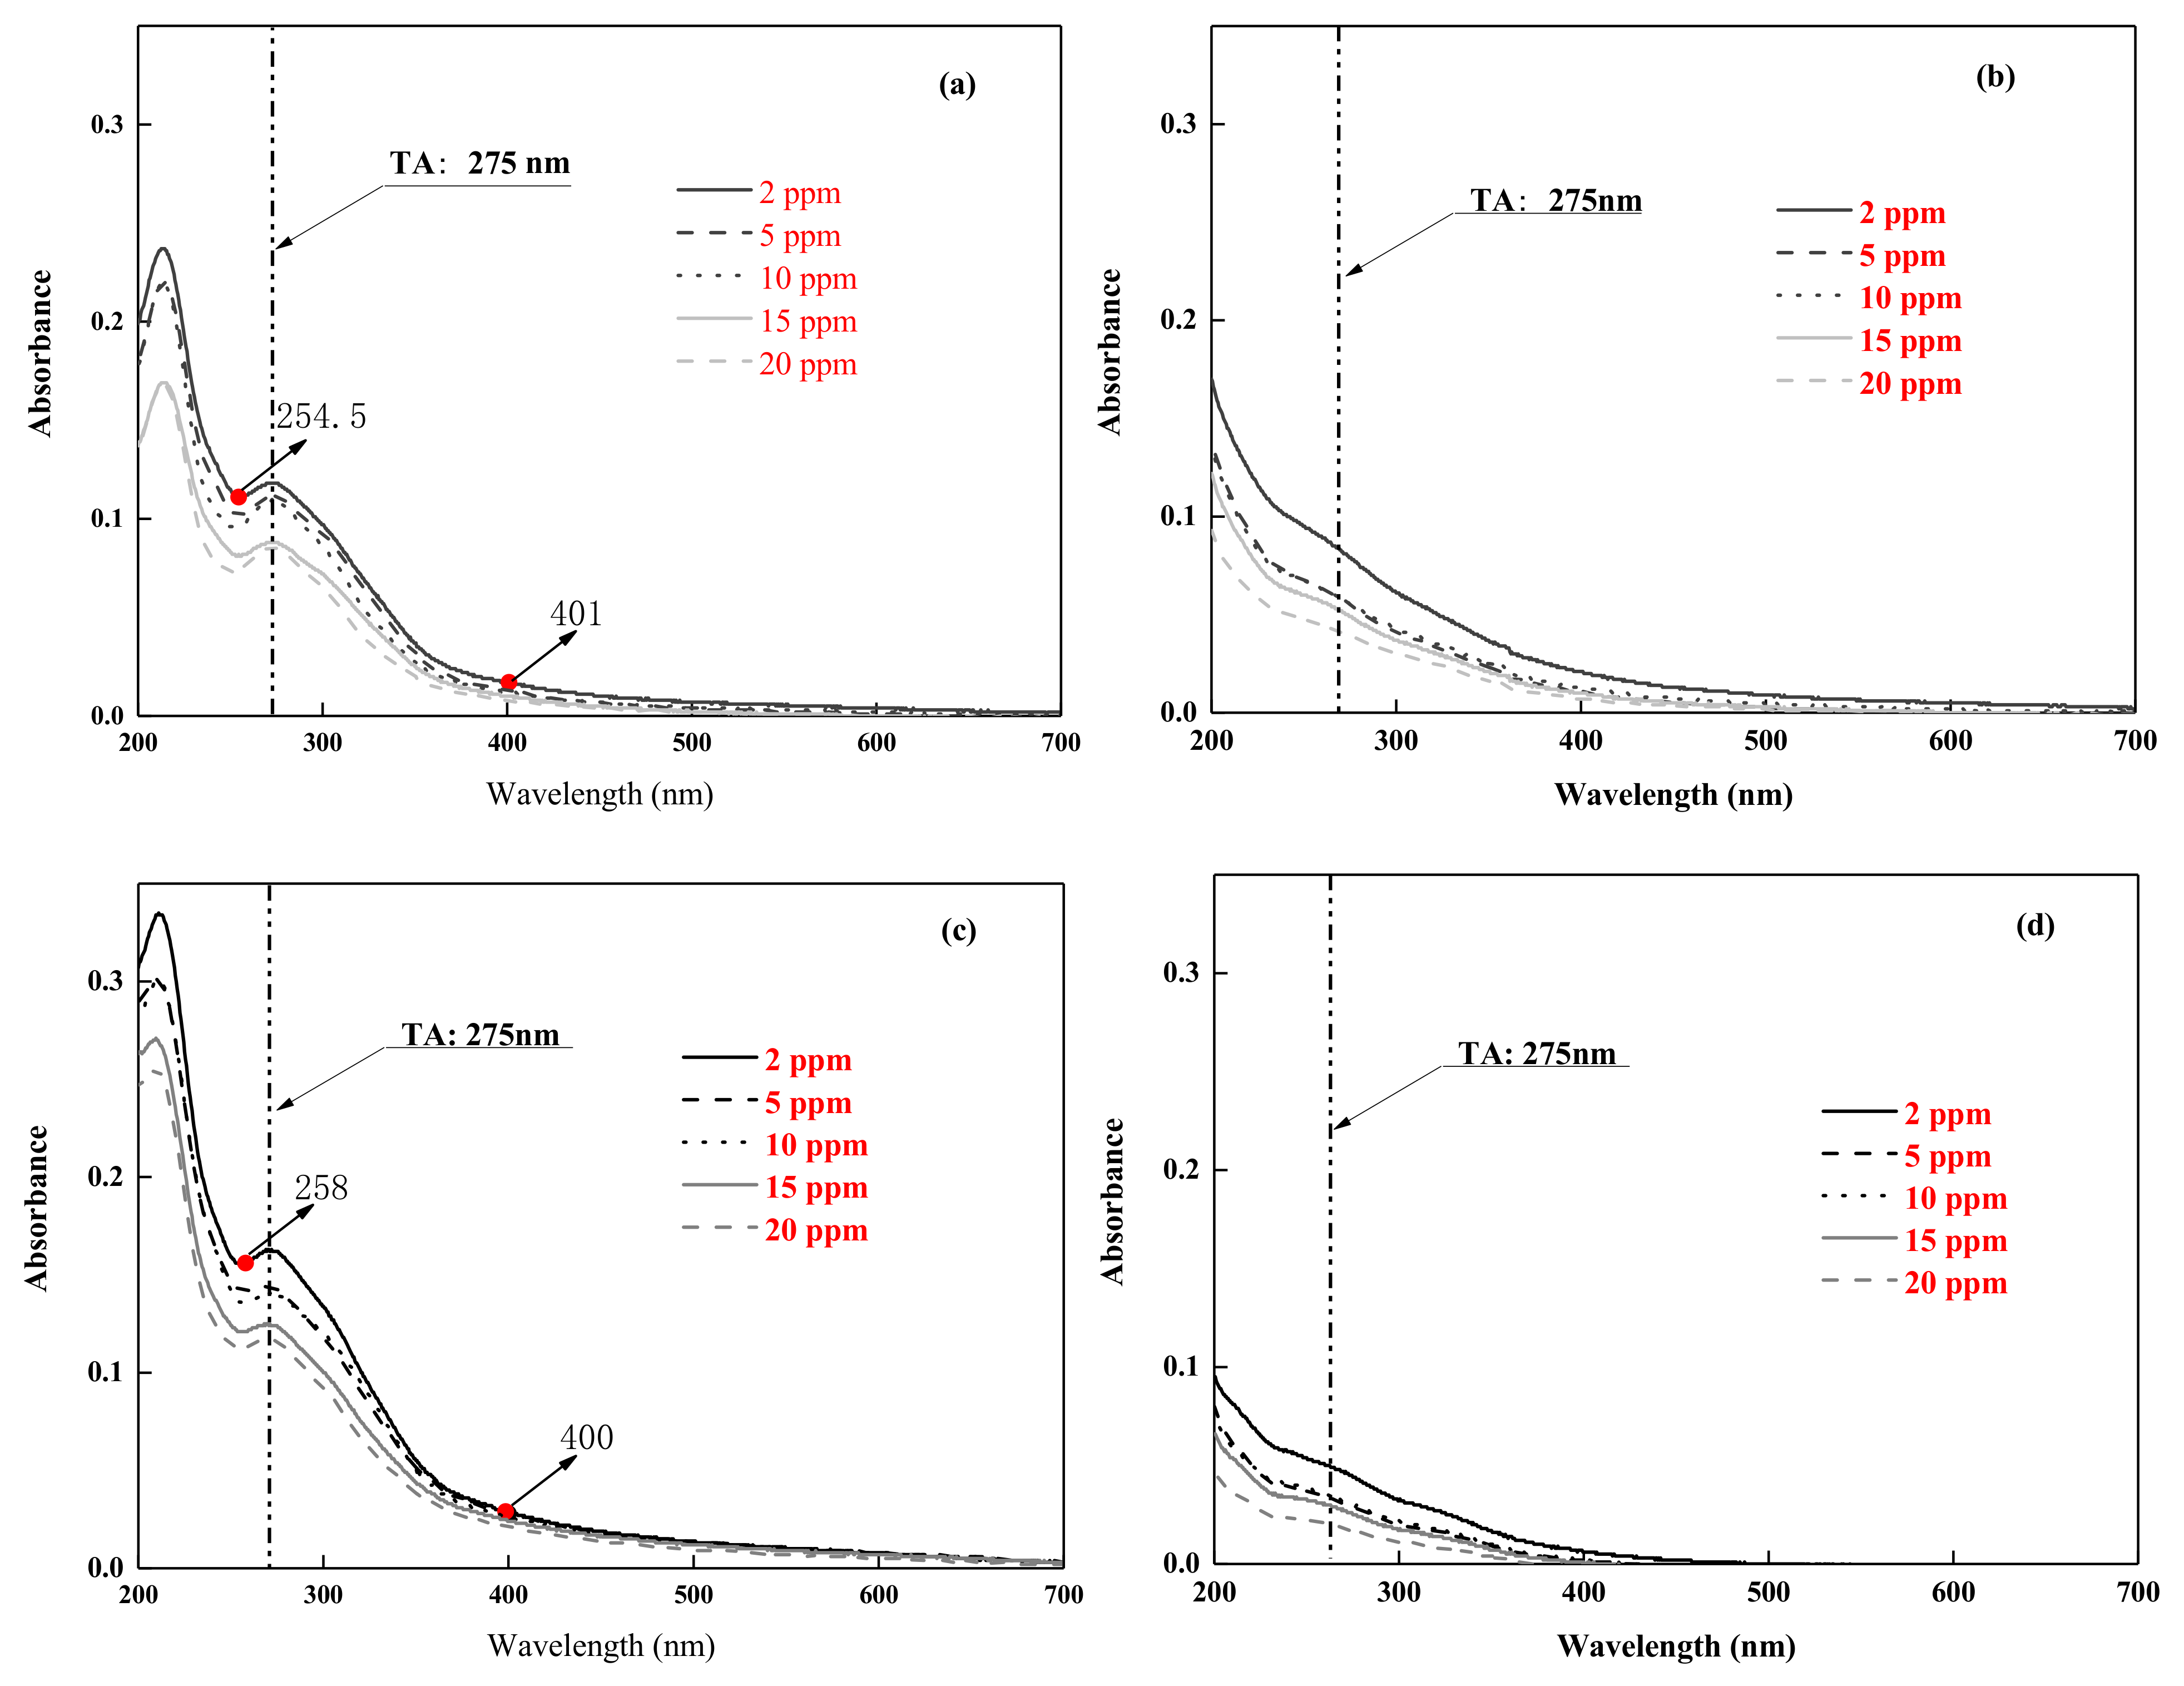
The UV-vis absorption spectrum of PAC and TiO2/PAC particle composites are presented in Figure 7. As shown in Figure 7, incorporation of TiO2 on the surface of PAC supplied the composite UV absorption. The wide absorption peak in the range of about 250–400 nm covered visible light occurred in addition to UV absorption. In addition, a nonlinear redshift was observed with the increasing catalyst dosages. The weakened intensity of the bands at 275 nm for HA and TA implied the 2-MIB removal by adsorption and photodegradation. Meanwhile, it was noted that with the dosages of NOM increased, the peak intensity displayed a decreasing trend, indicating that the intensive competitive adsorption between 2-MIB and NOM in the NOM bearing water. This finding was in good agreement with the above fact that photodegrade activity of TiO2/PAC was higher than that of PAC. Interestingly, UV spectrum characteristic was often not obvious because the absorption peaks of each functional group in HA and TA spectrum was relatively close and overlapped each other before and after the photodegrade.
3.4. Competitive Adsorption
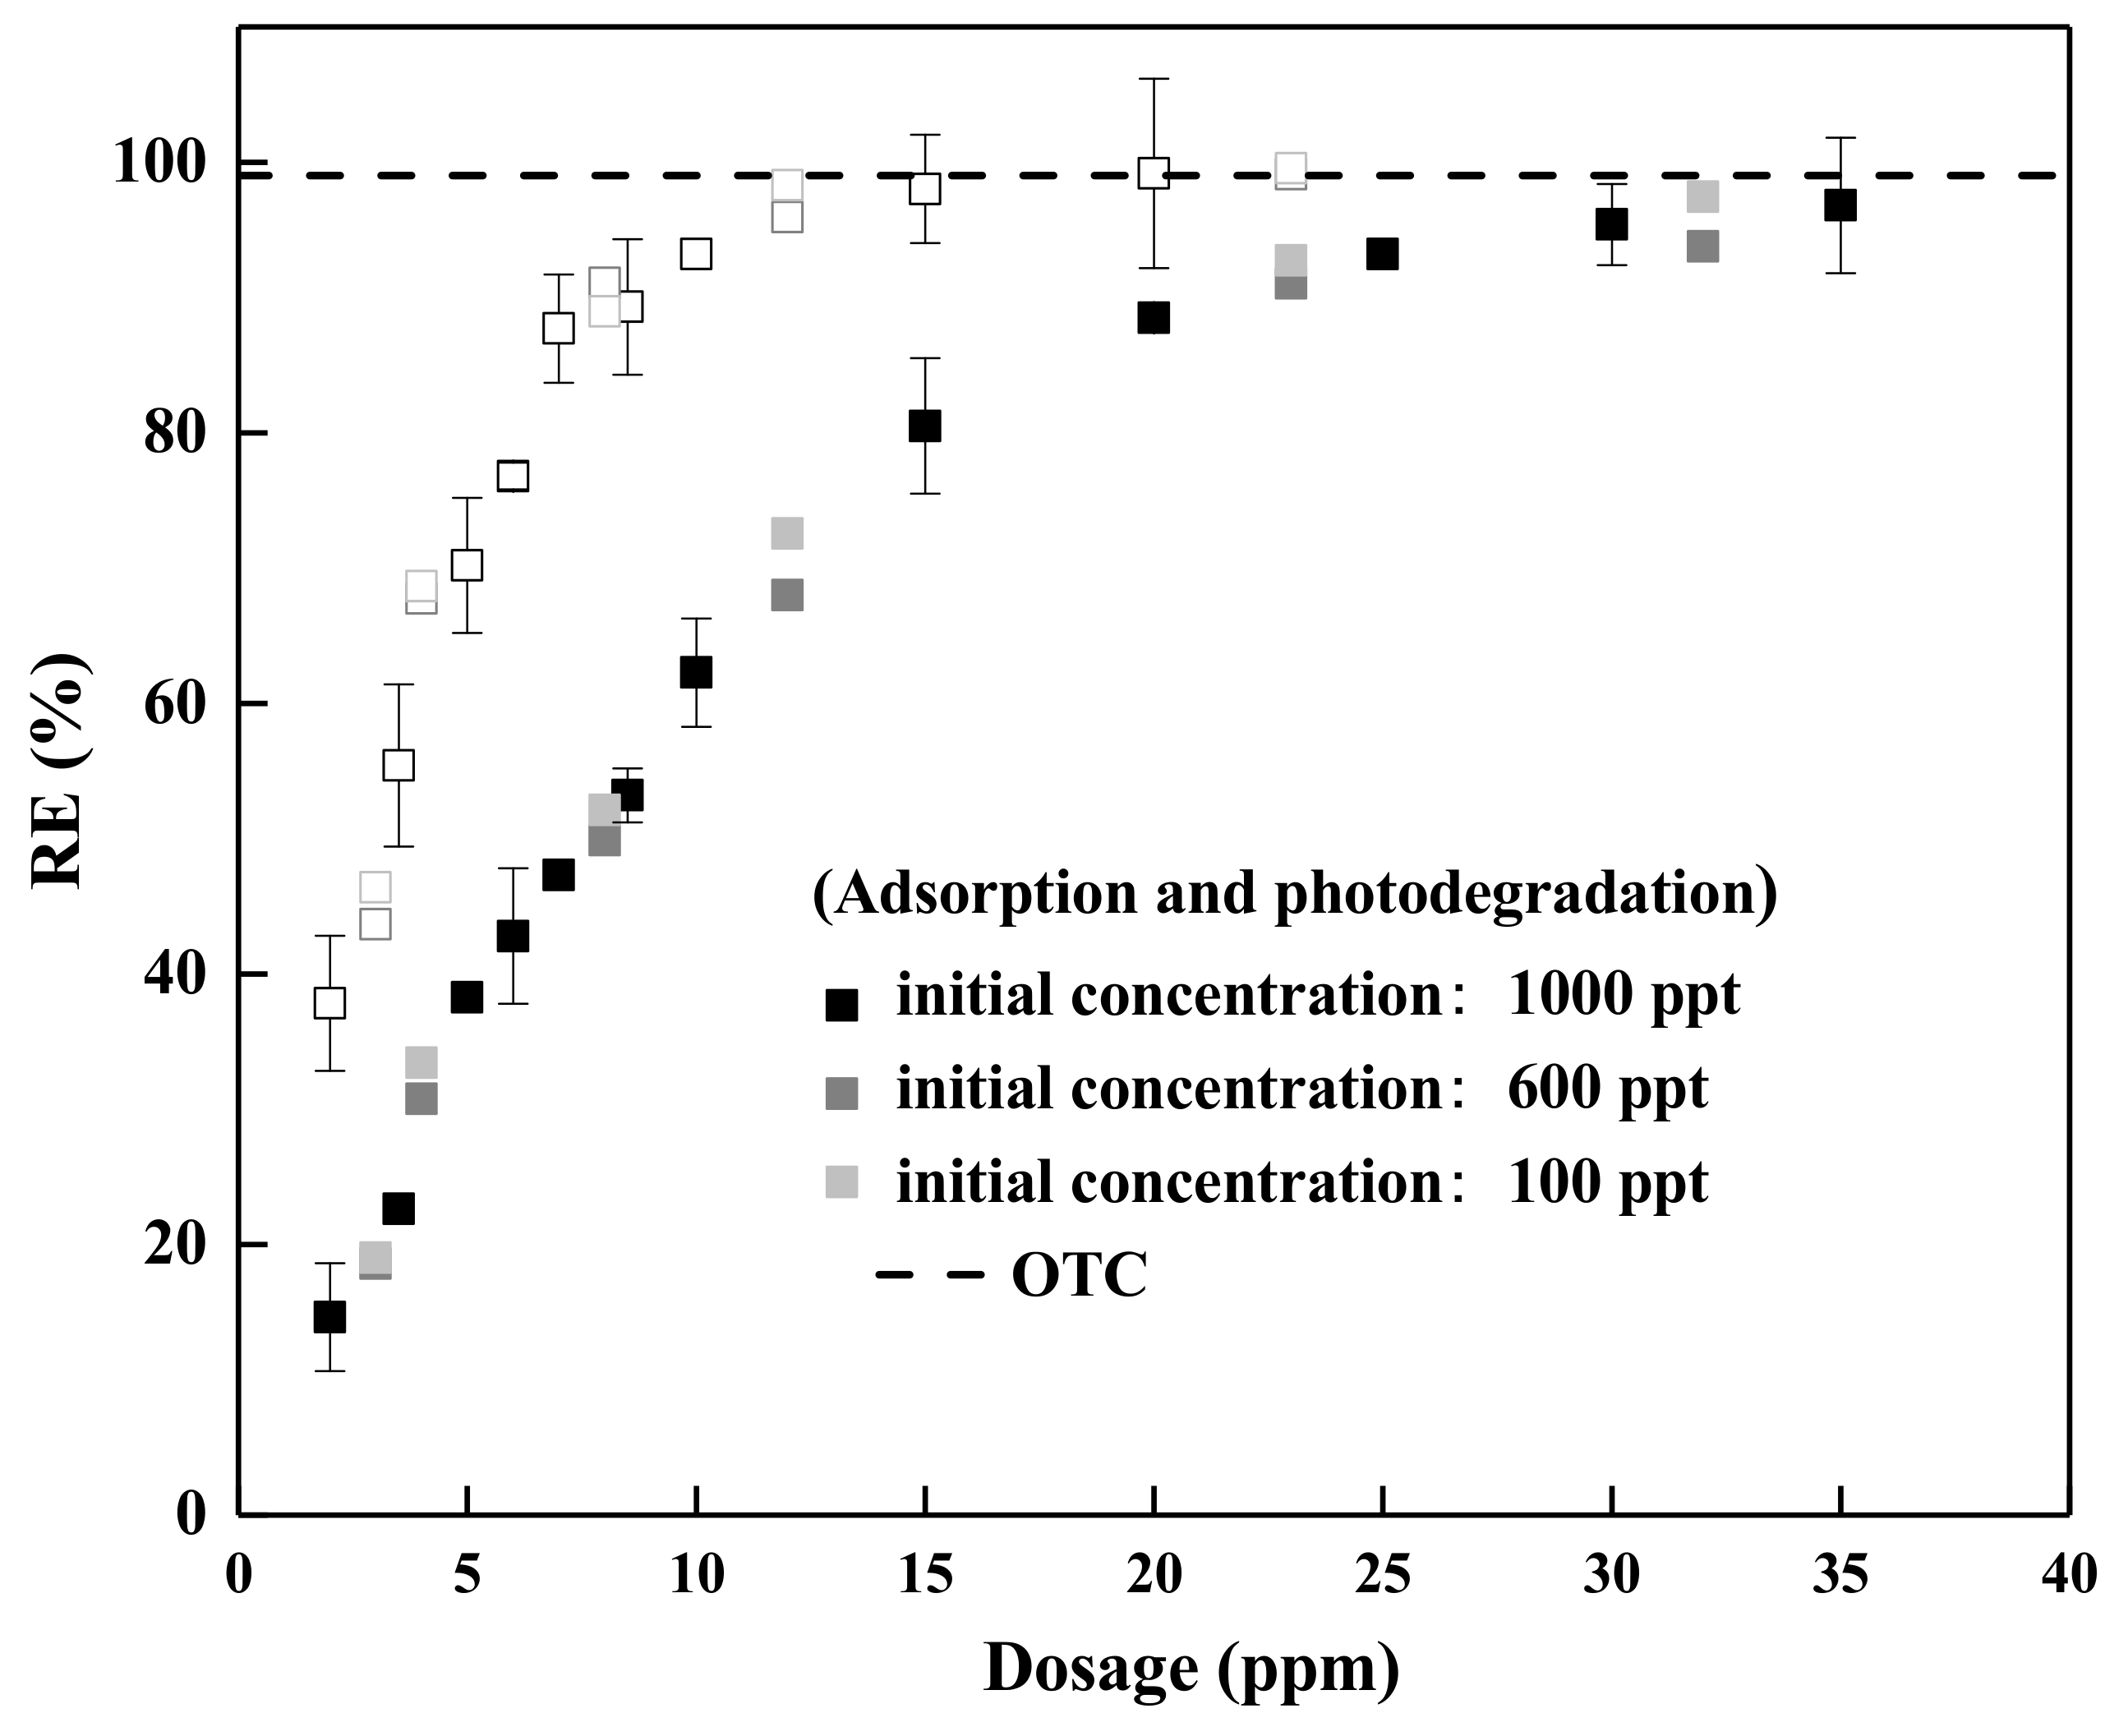
Figure 8 shows the removal efficiency of 2-MIB from NOM bearing water as a function of the adsorbent dosages for different initial concentrations in the adsorption and light degradation. It could be seen from Figure 8 that the curves exhibited similar trends for all initial concentrations in adsorption or light degradation stages. Our experimental data were fitted using Equation (5), and the obtained parameters are shown in Table 4. These parameters in Table 4 could be used to predict the removal curves (R = f (mA/V)) for the tracer at low initial concentrations and catalyst dosages. The fitting curves of the SEBC model and experimental data for the adsorption and photodegradation of 2-MIB on PAC and TiO2/PAC was shown in Figure 9. The fitting results of adsorption data of 2-MIB by PAC and TiO2/PAC indicated good adsorption and photodegradation performance in the NOM bearing water. It was also found in Figure 9b that the removal efficiency of TiO2/PAC was lower than PAC in NOM water. This result supported the hypothesis that SEBC model based on the IAST could be also applied to well describe the explanation process. It might be recognized as a significant breakthrough which could promote the development in photocatalysis field.
3.5. Adsorption Performance in Realistic Water Matrices
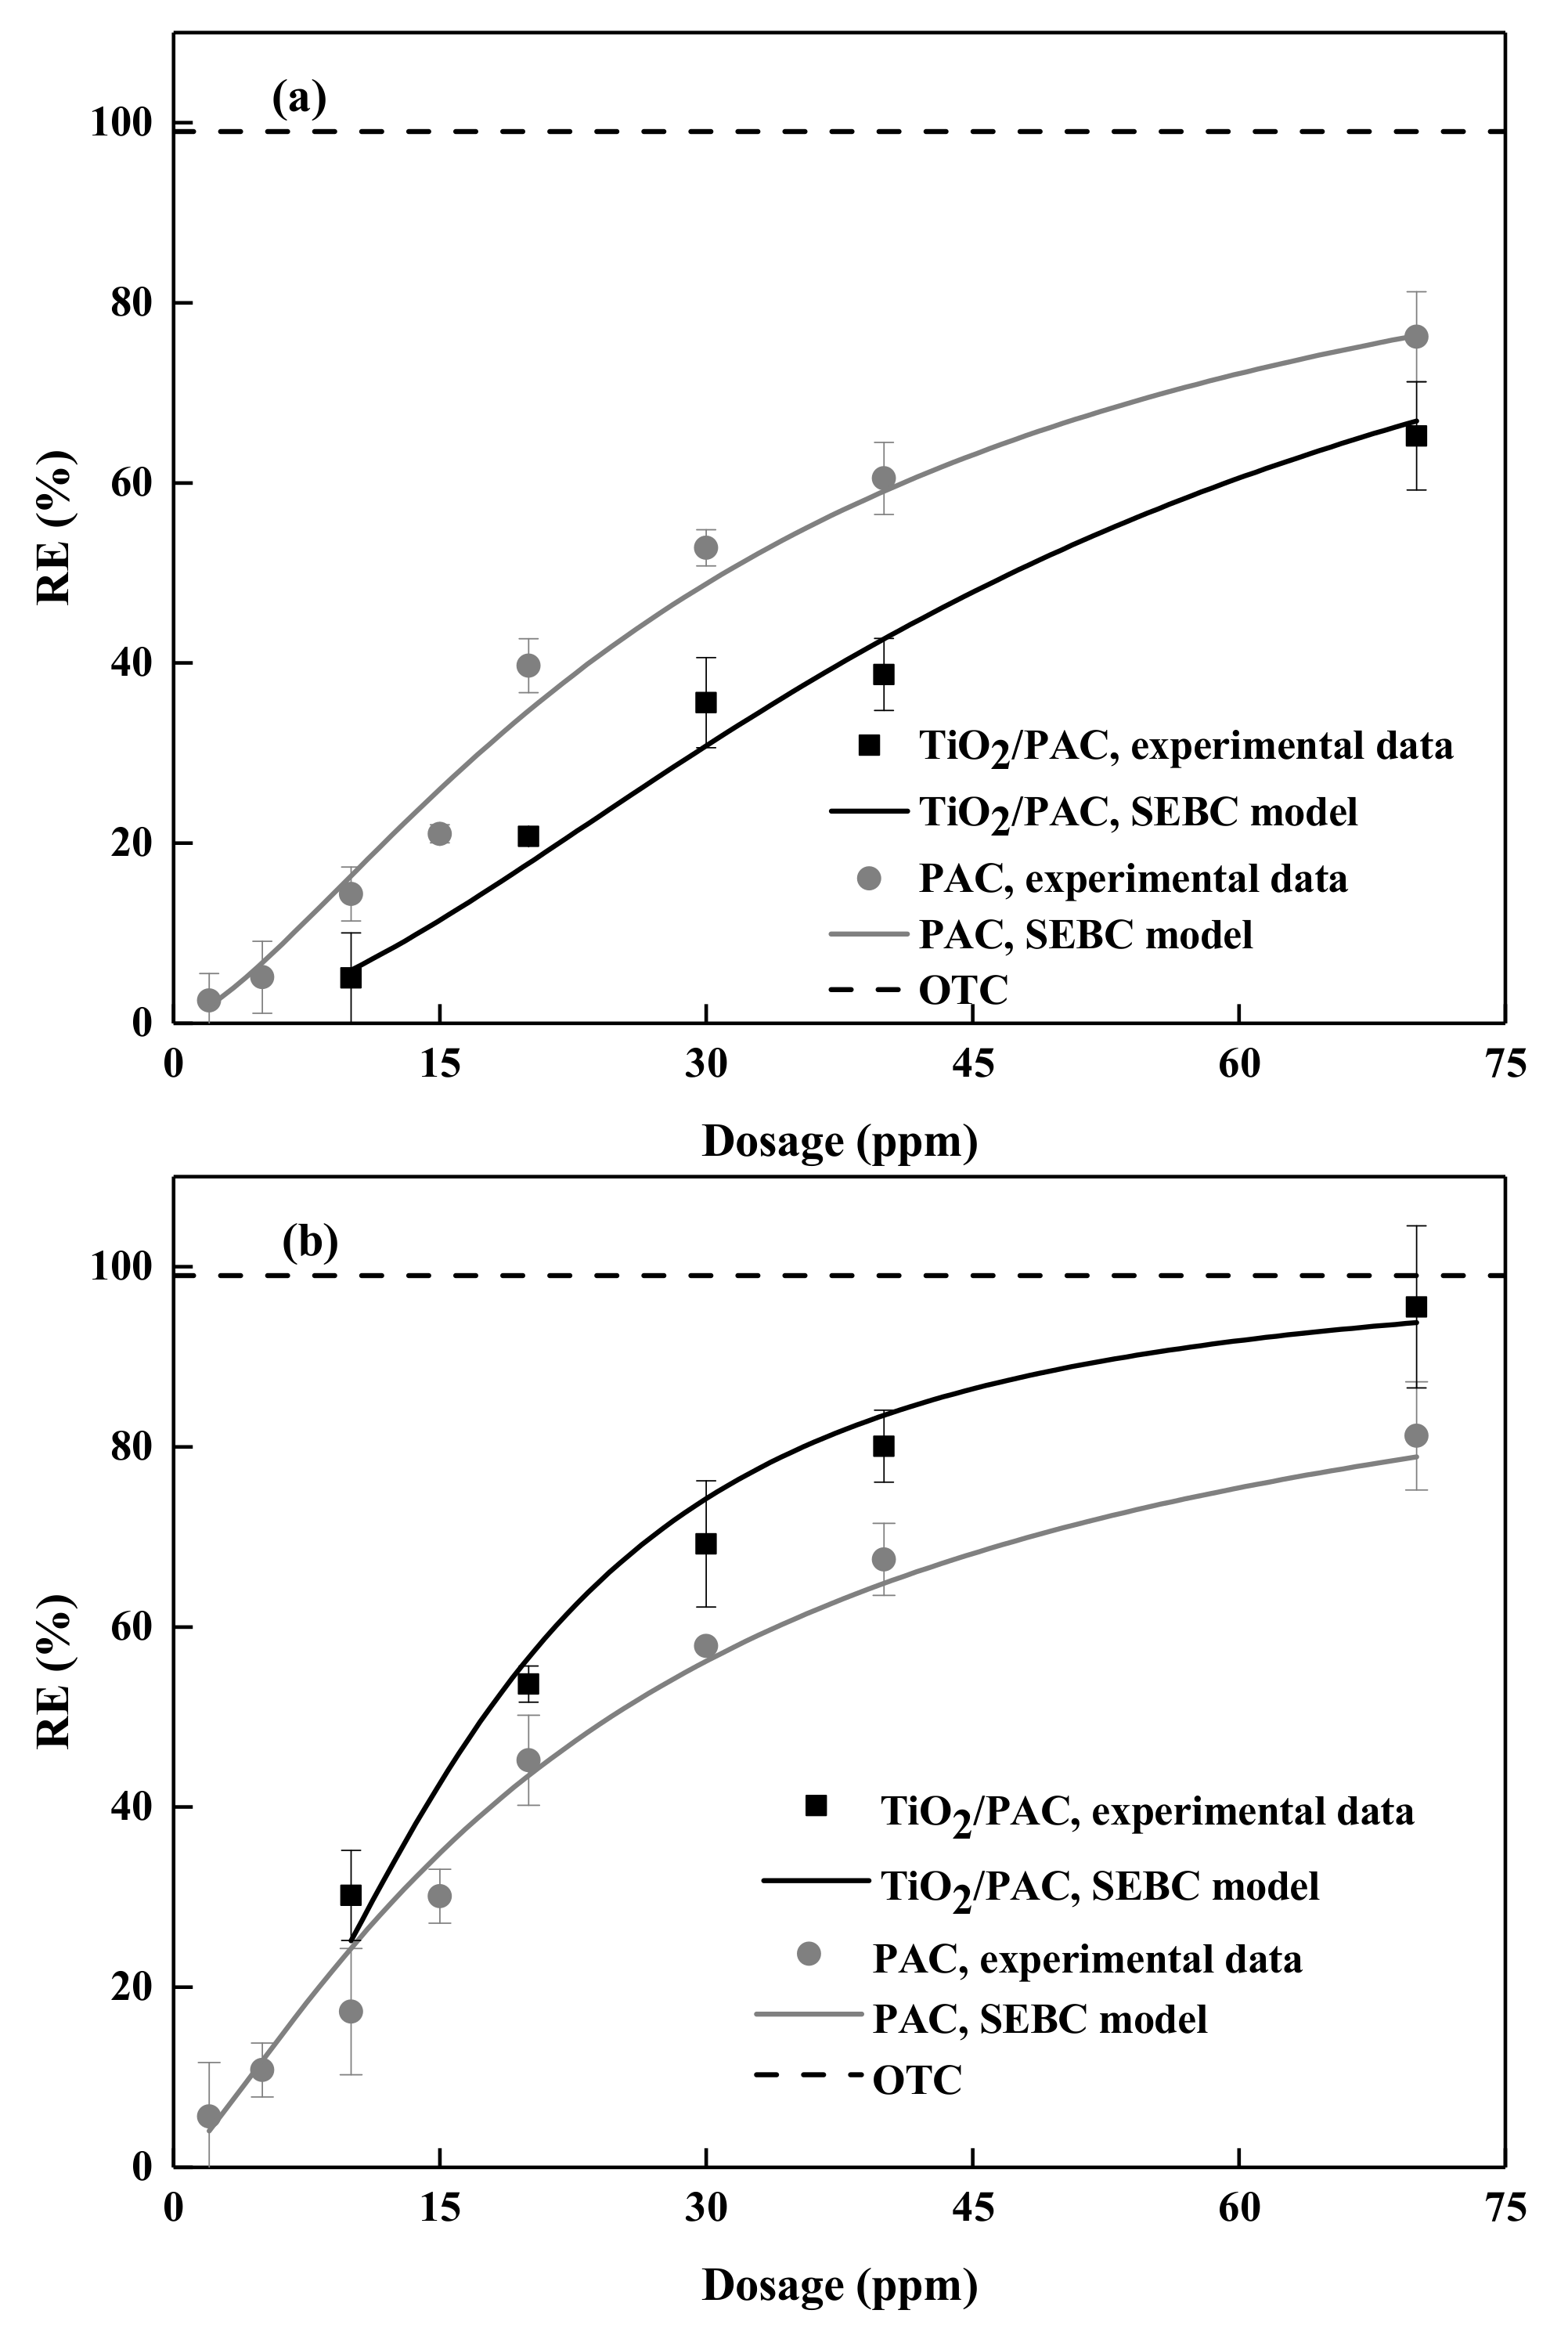
Figure 10 indicated that the experimental values measured in the realistic water were far lower than those in the distilled water and NOM bearing water. This observation was mainly because the NOM is an extremely complex mixture of various organic compounds, which was responsible for their reduced adsorption capacity. In addition, the realistic water from the river only undergoes a simple coagulation, sedimentation and filtration process, where there remains high concentration of NOM. More importantly, the size of organic matter might be close to the size of organic pollutants and adsorption sites on the surface of the catalysts. Meanwhile, there was intense competitiveness of NOM compounds against 2-MIB. Therefore, this requires more investment to increase the adsorbent dosages to achieve the purpose of pollutant removal. Satisfactorily, despite the removal efficiency of 2-MIB by both catalysts were low, the values of parameters correspondingly become higher. The parameter values obtained from the SEBC model based on the experimental data were n = 0.6942 and lnB = 4.9468 at adsorption and n = 0.7937 and lnB = 4.0359 at photocatalytic for PAC, respectively. In case of TiO2/PAC, the corresponding values were n = 0.5607 and lnB = 6.8749 at adsorption, and n = 0.5114and lnB = 5.5918 at photocatalytic, respectively. In addition, the fitting results from the SEBC model indicated that the background concentration effects of 2-MIB were negligible (Figure 10). The small difference between experimental data and fitting curve by the SEBC model was likely due to the difference of the parameter values in the real waters. Furthermore, the effects of other unknown organic compound might cause the difference. However, these differences were considered to be acceptable and did not limit the practical application of SEBC model.
4. Conclusions
In this work, a novel photocatalysts has been prepared by the sol-gel method. Furthermore, its preparation process was simple, and the original materials were inexpensive. Our work was devoted to conduct a comparison study on adsorption and photocatalytic behaviors between PAC and TiO2/PAC for 2-MIB in water. The adsorption experiments indicated that the compared to PAC, TiO2/PAC exhibited the better photocatalytic performance for 2-MIB in the distilled water. The Freundlich isotherm model is more suitable for describing the adsorption isotherms of 2-MIB by PAC and TiO2/PAC, and the adsorption processes were found to follow the the pseudo-first order kinetics model. UV-visible spectra suggested that the direct competition for the active sites was identified as the dominant mechanism of the NOM effects. This competition phenomenon might be even more obvious in the actual water environment, because NOM is composed of various organic compounds. In addition, the small difference was observed between experimental data and fitting curve by the SEBC model due to the difference of the parameter values in the real waters. The study has great significance to the development of novel composite photocatalysts with efficient adsorption and photocatalytic properties for organic pollutants including 2-MIB.
Author Contributions
Conceptualization, X.-P.G.; Methodology, X.-P.G.; Formal Analysis, X.-P.G. and P.Z.; Investigation, X.-P.G.; Funding acquisition, Y.-M.L. and D.-S.B.; Data Curation, X.-P.G. and P.Z.; Writing—Original Draft Preparation, X.-P.G. and P.Z.; Writing—Review and Editing, Y.-M.L. and D.-S.B.; Supervision, Y.-M.L. and D.-S.B.; Project Administration, Y.-M.L. and D.-S.B. All authors have read and agreed to the published version of the manuscript.
Funding
The research was funded by the Key Research Projects of the Science and Technology Commission of Shanghai Municipality (18DZ1203807).
Institutional Review Board Statement
Not applicable.
Informed Consent Statement
Not applicable.
Data Availability Statement
All data generated or analyzed during this study are included in this published article.
Acknowledgments
We wish to express thanks to the anonymous reviewers for their constructive comments and the editors for their remarks.
Conflicts of Interest
The authors declare no conflict of interest.
Nomenclature
| qi | the loading of the adsorbate surface of a single substance; (ng/mg) |
| qj | the total surface loading of the adsorbent; (ng/mg) |
| Ci | the concentration of a single adsorbate in the system; (ng/L) |
| ki, n | a Freundlich isotherm equation constant and exponent ((ng/mg)/(ng/L)1/n) of component i |
| mA | adsorbent dosage; (mg/L) |
| CT,0 | initial concentration of tracer; (ng/L) |
| CE,0 | initial concentration of EBC; (ng/L) |
| qT | solid equilibrium concentration of the tracer; (ng/mg) |
| qE | solid equilibrium concentration of EBC; (ng/mg) |
| V | the volume of the solution |
| m | amount of the PAC or TiO2/PAC used (mg) |
| PAR0 and PARt | initial peak area ratio and post- adsorption peak area ratio at time t of the solution |
| C0, Ct, C0 | the initial concentration (ng/L), post-adsorption concentration after selected time interval (ng/L), equilibrium concentration of 2-MIB after adsorption in the dark (ng/L) |
| Ce | equilibrium concentration (ng/L); |
| qe | equilibrium adsorption amount (ng/mg) |
| K, kapp | Freundlich constant (ng/mg)/(ng/L)1/n, apparent first-order reaction (min-1) constant. |
| n | the related parameters between the adsorbent molecules and the adsorbent surface strength |
| R2 | the correlation coefficient |
| R | the removal efficiency |
References
- Zaitlin, B.; Watson, S.B. Actinomycetes in relation to taste and odour in drinking water: Myths, tenets and truths. Water. Res. 2006, 40, 1741–1753. [Google Scholar] [CrossRef]
- Wang, C.M.; Yu, J.W.; Guo, Q.Y.; Sun, D.L.; Su, M.; An, W.; Zhang, Y.; Yang, M. Occurrence of swampy/septic odor and possible odorants in source and finished drinking water of major cities across China. Environ. Pollut. 2019, 249, 305–310. [Google Scholar] [CrossRef]
- Matsui, Y.; Yoshida, T.; Nakao, S.; Knappe, D.R.U.; Matsushita, T. Characteristics of competitive adsorption between 2-methylisoborneol and natural organic matter on superfine and conventionally sized powdered activated carbons. Water. Res. 2012, 46, 4741–4749. [Google Scholar] [CrossRef] [PubMed] [Green Version]
- Devi, A.; Chiu, Y.T.; Hsueh, H.T.; Lin, T.F. Quantitative PCR based detection system for cyanobacterial geosmin/2-methylisoborneol (2-MIB) events in drinking water sources: Current status and challenges. Water. Res. 2021, 188, 116478. [Google Scholar] [CrossRef]
- Zoschke, K.; Engel, C.; Börnick, H.; Worch, E. Adsorption of geosmin and 2-methylisoborneol onto powdered activated carbon at non-equilibrium conditions: Influence of NOM and process modeling. Water Res. 2011, 45, 4544–4550. [Google Scholar] [CrossRef] [PubMed]
- Xie, P.; Ma, J.; Liu, W.; Zou, J.; Yue, S.; Li, X.; Wiesner, M.R.; Fang, J. Removal of 2-MIB and geosmin using UV/persulfate: Contributions of hydroxyl and sulfate radicals. Water Res. 2015, 69, 223–233. [Google Scholar] [CrossRef]
- Ho, L.; Hoefel, D.; Bock, F.; Saint, C.P.; Newcombe, G. Biodegradation rates of 2-methylisoborneol (MIB) and geosmin through sand filters and in bioreactors. Chemosphere 2007, 66, 2210–2218. [Google Scholar] [CrossRef]
- Tennant, M.F.; Mazyck, D.W. The role of surface acidity and pore size distribution in the adsorption of 2-methylisoborneol via powdered activated carbon. Carbon 2007, 45, 858–864. [Google Scholar] [CrossRef]
- Sidney Seckler, F.F.; Margarida, M.; Rosemeire, A.L. Interference of iron as a coagulant on MIB removal by powdered activated carbon adsorption for low turbidity waters. J. Environ. Sci. 2013, 25, 1575–1582. [Google Scholar] [CrossRef]
- Rangel-Mendez, J.R.; Cannon, F.S. Improved activated carbon by thermal treatment in methane and steam: Physicochemical influences on MIB sorption capacity. Carbon 2005, 43, 467–479. [Google Scholar] [CrossRef]
- Meunier, L.; Canonica, S.; von Gunten, U. Implications of sequential use of UV and ozone for drinking water quality. Water Res. 2006, 40, 1864–1876. [Google Scholar] [CrossRef]
- Yu, J.; Yang, M.; Lin, T.F.; Guo, Z.; Zhang, Y.; Gu, J.; Zhang, S. Effects of surface characteristics of activated carbon on the adsorption of 2-methylisobornel (MIB) and geosmin from natural water. Sep. Purif. Technol. 2007, 56, 363–370. [Google Scholar] [CrossRef]
- Drikas, M.; Dixon, M.; Morran, J. Removal of MIB and geosmin using granular activated carbon with and without MIEX pre-treatment. Water Res. 2009, 43, 5151–5159. [Google Scholar] [CrossRef]
- Summers, R.S.; Kim, S.M.; Shimabuku, K.; Chae, S.H.; Corwin, C.J. Granular activated carbon adsorption of MIB in the presence of dissolved organic matter. Water Res. 2013, 47, 3507–3513. [Google Scholar] [CrossRef]
- Kim, C.; Lee, S.I.; Hwang, S.; Cho, M.; Kim, H.S.; Noh, S.H. Removal of geosmin and 2-methylisoboneol (2-MIB) by membrane system combined with powdered activated carbon (PAC) for drinking water treatment. J. Water Process Eng. 2014, 4, 91–98. [Google Scholar] [CrossRef]
- Azaria, S.; Nir, S.; van Rijn, J. Combined adsorption and degradation of the off-flavor compound 2-methylisoborneol in sludge derived from a recirculating aquaculture system. Chemosphere 2017, 169, 69–77. [Google Scholar] [CrossRef]
- Wu, J.Y.; Jiang, R.F.; Liu, Q.L.; Ouyang, G.F. Impact of different modes of adsorption of natural organic matter on the environmental fate of nanoplastics. Chemosphere 2021, 263, 127967. [Google Scholar] [CrossRef]
- Park, J.A.; Nam, H.L.; Choi, J.W.; Ha, J.; Lee, S.H. Oxidation of geosmin and 2-methylisoborneol by the photo-Fenton process: Kinetics, degradation intermediates, and the removal of microcystin-LR and trihalomethane from Nak-Dong River water, South Korea. Chem. Eng. J. 2017, 313, 345–354. [Google Scholar] [CrossRef]
- Lindholm-Lehto, P.C.; Vielma, J. Controlling of geosmin and 2-methylisoborneol induced off-flavours in recirculating aquaculture system farmed fish—A review. Aquac. Res. 2019, 50, 9–28. [Google Scholar] [CrossRef] [Green Version]
- Cordero, T.; Duchamp, C.; Chovelon, J.M.; Ferronato, C.; Matos, J. Influence of L-type activated carbons on photocatalytic activity of TiO2 in 4-chlorophenol photodegradation. J. Photoch. Photobio. A 2007, 191, 122–131. [Google Scholar] [CrossRef]
- Wang, X.; Liu, Y.; Hu, Z.; Chen, Y.; Liu, W.; Zhao, G. Degradation of methyl orange by composite photocatalysts nano-TiO2 immobilized on activated carbons of different porosities. J. Hazard. Mater. 2009, 169, 1061–1067. [Google Scholar] [CrossRef]
- In, S.I.; Vesborg, P.C.K.; Abrams, B.L.; Hou, Y.D.; Chorkendorff, I. A comparative study of two techniques for determining photocatalytic activity of nitrogen doped TiO2 nanotubes under visible light irradiation: Photocatalytic reduction of dye and photocatalytic oxidation of organic molecules. J. Photochem. Photobiol. A Chem. 2011, 222, 258–262. [Google Scholar] [CrossRef]
- Ocampo-Pérez, R.; Sánchez-Polo, M.; Rivera-Utrilla, J.; Leyva-Ramos, R. Enhancement of the catalytic activity of TiO2 by using activated carbon in the photocatalytic degradation of cytarabine. Appl. Catal. B. Environ. 2011, 104, 177–184. [Google Scholar] [CrossRef]
- Souza, I.P.A.; Crespo, L.H.S.; Spessato, L.; Melo, S.A.R.; Martins, A.F.; Cazetta, A.L.; Almeida, V.C. Optimization of thermal conditions of sol-gel method for synthesis of TiO2 using RSM and its influence on photodegradation of tartrazine yellow dye. J. Environ. Chem. Eng. 2021, 9, 104753. [Google Scholar] [CrossRef]
- He, X.; Liu, Q.; Li, Q.; Tang, K.; Gao, N.; Ma, X. 2-methylisoborneol removal by activated carbon fiber, chlorine dioxide and their combined process. J. Cent. South Univ. (Sci. Technol.) 2014, 45, 973–978. [Google Scholar]
- Nakayama, A.; Sakamoto, A.; Matsushita, T.; Matsui, Y.; Shirasaki, N. Effects of pre, post, and simultaneous loading of natural organic matter on 2-methylisoborneol adsorption on superfine powdered activated carbon: Reversibility and external pore-blocking. Water Res. 2020, 182, 115992. [Google Scholar] [CrossRef] [PubMed]
- Truong, H.B.; Ike, I.A.; Ok, Y.S.; Hur, J. Polyethyleneimine modification of activated fly ash and biochar for enhanced removal of natural organic matter from water via adsorption. Chemosphere 2020, 243, 125454. [Google Scholar] [CrossRef] [PubMed]
- Wang, Q.; Zietzschmann, F.; Yu, J.W.; Hofman, R.; An, W.; Yang, M.; Rietveld, L.C. Projecting competition between 2-methylisoborneol and natural organic matter in adsorption onto activated carbon from ozonated source waters. Water Res. 2020, 173, 115574. [Google Scholar] [CrossRef]
- Newcombe, G.; Morrison, J.; Hepplewhite, C. Simultaneous adsorption of MIB and NOM onto activated carbon. I. Characterisation of the system and NOM adsorption. Carbon 2002, 40, 2135–2146. [Google Scholar] [CrossRef]
- Matsui, Y.; Nakao, S.; Taniguchi, T.; Matsushita, T. Geosmin and 2-methylisoborneol removal using superfine powdered activated carbon: Shell adsorption and branched-pore kinetic model analysis and optimal particle size. Water Res. 2013, 47, 2873–2880. [Google Scholar] [CrossRef] [PubMed]
- Knappe, D.R.U.; Matsui, Y.; Snoeyink, V.L. Predicting the capacity of powdered activated carbon for trace organic compounds in natural waters. Environ. Sci. Technol. 1998, 32, 1694–1698. [Google Scholar] [CrossRef]
- Qi, S.; Schideman, L.; Mariñas, B.J.; Snoeyink, V.L.; Campos, C. Simplification of the IAST for activated carbon adsorption of trace organic compounds from natural water. Water Res. 2007, 41, 440–448. [Google Scholar] [CrossRef]
- Worch, E. Competitive adsorption of micropollutants and NOM onto activated carbon: Comparison of different model approaches. J. Water Supply Res. Technol. 2010, 59, 285–297. [Google Scholar] [CrossRef]
- Mishra, A.; Mehta, A.; Kainth, S.; Basu, S. Effect of g-C3N4 loading on TiO2/Bentonite nanocomposites for efficient heterogeneous photocatalytic degradation of industrial dye under visible light. J. Alloy Compd. 2018, 764, 406–415. [Google Scholar] [CrossRef]
- Chandrabose, G.; Dey, A.; Gaur, S.S.; Pitchaimuthu, S.; Jagadeesan, H.; Braithwaite, N.S.J.; Selvaraj, V.; Kumar, V.; Krishnamurthy, S. Removal and degradation of mixed dye pollutants by integrated adsorption-photocatalysis technique using 2-D MoS2/TiO2 nanocomposite. Chemosphere 2021, 279, 130467. [Google Scholar] [CrossRef] [PubMed]
- Freundlich, H.M.F. Over the adsorption in solution. J. Phys. Chem. B. 1906, 57, 384–471. [Google Scholar]
- Bi, L.B.; Chen, Z.L.; Li, L.H.; Kang, J.; Zhao, S.X.; Wang, B.Y.; Yan, P.W.; Li, Y.B.; Zhang, X.X.; Shen, J.M. Selective adsorption and enhanced photodegradation of diclofenac in water by molecularly imprinted TiO2. J. Hazard. Mater. 2021, 407, 124759. [Google Scholar] [CrossRef]
- Mahmood, A.; Shi, G.S.; Wang, Z.; Rao, Z.P.; Xiao, W.; Xie, X.F.; Sun, J. Carbon quantum dots-TiO2 nanocomposite as an efficient photocatalyst for the photodegradation of aromatic ring-containing mixed VOCs: An experimental and DFT studies of adsorption and electronic structure of the interface. J. Hazard. Mater. 2021, 401, 123402. [Google Scholar] [CrossRef] [PubMed]
- Omri, A.; Lambert, S.D.; Geens, J.; Bennour, F.; Benzina, M. Synthesis, surface characterization and photocatalytic activity of TiO2 supported on almond shell activated carbon. J. Mater. Sci. Technol. 2014, 30, 894–902. [Google Scholar] [CrossRef]
- Ragupathy, S.; Raghu, K.; Prabu, P. Synthesis and characterization of TiO2 loaded cashew nut shell activated carbon and photocatalytic activity on BG and MB dyes under sunlight radiation. Spectrochim. Acta A 2015, 138, 314–320. [Google Scholar] [CrossRef]
- Ho, L.; Newcombe, G. Effect of NOM, turbidity and floc size on the PAC adsorption of MIB during alum coagulation. Water Res. 2005, 39, 3668–3674. [Google Scholar] [CrossRef] [PubMed]
Figure 1.
SEM images and EDX Analyses of PAC (a,c) and TiO2/PAC (b,d).

Figure 2.
FT-IR spectra of PAC and TiO2/PAC.

Figure 3.
XRD patterns of PAC and TiO2/PAC.

Figure 4.
Removal efficiency as a function of PAC and TiO2/PAC dosages for 2-MIB (a) and adsorption isotherms of 2-MIB on PAC and TiO2/PAC (b). Experimental condition: C0 = 1000 ng/L; V = 1000 mL; temperature =20 ± 1 °C.
Figure 4.
Removal efficiency as a function of PAC and TiO2/PAC dosages for 2-MIB (a) and adsorption isotherms of 2-MIB on PAC and TiO2/PAC (b). Experimental condition: C0 = 1000 ng/L; V = 1000 mL; temperature =20 ± 1 °C.

Figure 5.
Removal efficiency (a) and kinetics (b) of the photocatalytic degradation of 2-MIB on PAC and TiO2/PAC in distilled water. Experimental condition: C0 (2-MIB) = 1000 ng/L; m (catalyst) = 3 mg; V = 1000 mL; temperature = 20 ± 1 ℃.
Figure 5.
Removal efficiency (a) and kinetics (b) of the photocatalytic degradation of 2-MIB on PAC and TiO2/PAC in distilled water. Experimental condition: C0 (2-MIB) = 1000 ng/L; m (catalyst) = 3 mg; V = 1000 mL; temperature = 20 ± 1 ℃.

Figure 6.
Removal efficiency of adsorption (a) and photocatalytic degradation (b) of 2-MIB. Experimental condition: C0 (2-MIB) = 1000 ng/L; V = 1000 mL; temperature = 20 ± 1 °C, the dosage of PAC and TiO2/PAC = 15 g.
Figure 6.
Removal efficiency of adsorption (a) and photocatalytic degradation (b) of 2-MIB. Experimental condition: C0 (2-MIB) = 1000 ng/L; V = 1000 mL; temperature = 20 ± 1 °C, the dosage of PAC and TiO2/PAC = 15 g.

Figure 7.
UV-Vis absorption spectra of HA–TA solution in the presence of PAC at adsorption stage (a) and at photocatalytic degradation stage (b), in the presence of TiO2/PAC at adsorption stage (c) and at photocatalytic degradation stage (d). Experimental condition: C0 (2-MIB) = 1000 ng/L; V = 1000 mL; temperature = 20 ± 1 °C.

Figure 8.
Adsorption and photocatalytic degradation of 2-MIB in NOM bearing water on TiO2/PAC at different initial concentrations. Experimental condition: V = 1000 mL; temperature = 20 ± 1 °C.
Figure 8.
Adsorption and photocatalytic degradation of 2-MIB in NOM bearing water on TiO2/PAC at different initial concentrations. Experimental condition: V = 1000 mL; temperature = 20 ± 1 °C.

Figure 9.
Adsorption (a) and photocatalytic degradation (b) of 2-MIB in analog NOM water on the PAC and TiO2/PAC, experimental data and modelling by the SEBC model. Experimental condition: C0 (2-MIB) = 1000 ng/L; V = 1000 mL; temperature = 20 ± 1 °C.
Figure 9.
Adsorption (a) and photocatalytic degradation (b) of 2-MIB in analog NOM water on the PAC and TiO2/PAC, experimental data and modelling by the SEBC model. Experimental condition: C0 (2-MIB) = 1000 ng/L; V = 1000 mL; temperature = 20 ± 1 °C.

Figure 10.
Adsorption (a) and photocatalytic degradation (b) of 2-MIB in realistic water on the PAC and TiO2/PAC, experimental data and modelling by the SEBC model. Experimental condition: C0 (2-MIB) = 1000 ng/L; V = 1000 mL; temperature = 20 ± 1 ℃.
Figure 10.
Adsorption (a) and photocatalytic degradation (b) of 2-MIB in realistic water on the PAC and TiO2/PAC, experimental data and modelling by the SEBC model. Experimental condition: C0 (2-MIB) = 1000 ng/L; V = 1000 mL; temperature = 20 ± 1 ℃.


Table 1.
Characteristics of real water.
| Chromaticity | DO | Conductivity | NH3-N | COD | pH |
|---|---|---|---|---|---|
| 20 (PCU) | 2.9 (mg/L) | 1375 (μs/cm) | 6.75 (mg/L) | 137.72 (mg/L) | 7.56 |
Table 2.
Calculated parameters of Freundlich adsorption isotherms for 2-MIB removal.
| Adsorbents | K((ng/mg)/(ng/L)1/n) | 1/n | R2 |
|---|---|---|---|
| PAC | 21.4713 | 0.3414 | 0.9202 |
| TiO2/PAC | 13.5444 | 0.3510 | 0.9231 |
Table 3.
Apparent first order rate constants (kapp) and correlation coefficient (R2) for the different adsorbents.
Table 3.
Apparent first order rate constants (kapp) and correlation coefficient (R2) for the different adsorbents.
| Photocatalyst | kapp ( min−1) | Correlation Coefficient, R2 |
|---|---|---|
| PAC | 1.850 × 10⁻³ | 0.892 |
| TiO2/PAC | 16.820 × 10⁻³ | 0.987 |
| Without catalyst | 0.794 × 10⁻³ | 0.913 |
Table 4.
n and lnB value for SEBC model.
| Parameters | PAC | TiO2/PAC | ||
|---|---|---|---|---|
| Adsorption | Photocatalytic | Adsorption | Photocatalytic | |
| n | 0.4317 | 0.4528 | 0.5320 | 0.4251 |
| lnB | 3.9636 | 3.4460 | 3.5520 | 2.6498 |
Publisher’s Note: MDPI stays neutral with regard to jurisdictional claims in published maps and institutional affiliations. |
© 2021 by the authors. Licensee MDPI, Basel, Switzerland. This article is an open access article distributed under the terms and conditions of the Creative Commons Attribution (CC BY) license (https://creativecommons.org/licenses/by/4.0/).
Share and Cite
MDPI and ACS Style
Guo, X.-P.; Zang, P.; Li, Y.-M.; Bi, D.-S. TiO2-Powdered Activated Carbon (TiO2/PAC) for Removal and Photocatalytic Properties of 2-Methylisoborneol (2-MIB) in Water. Water 2021, 13, 1622. https://doi.org/10.3390/w13121622
AMA Style
Guo X-P, Zang P, Li Y-M, Bi D-S. TiO2-Powdered Activated Carbon (TiO2/PAC) for Removal and Photocatalytic Properties of 2-Methylisoborneol (2-MIB) in Water. Water. 2021; 13(12):1622. https://doi.org/10.3390/w13121622
Chicago/Turabian StyleGuo, Xiao-Pin, Peng Zang, Yong-Mei Li, and Dong-Su Bi. 2021. "TiO2-Powdered Activated Carbon (TiO2/PAC) for Removal and Photocatalytic Properties of 2-Methylisoborneol (2-MIB) in Water" Water 13, no. 12: 1622. https://doi.org/10.3390/w13121622
Note that from the first issue of 2016, this journal uses article numbers instead of page numbers. See further details here.