
Fluoride Polluted Groundwaters in Calabria Region (Southern Italy): Natural Source and Remediation
by
 , , , and
Ilaria Fuoco
1 ,
,
Carmine Apollaro
1,* ,
,
Alessandra Criscuoli
2,
Rosanna De Rosa
1, 
Svetlozar Velizarov
3 and
and
Alberto Figoli
2,* 1
Department of Biology, Ecology and Earth Sciences (DiBEST), University of Calabria, P. Bucci street, cubo 15b–87036 Arcavacata di Rende, CS, Italy
2
Institute on Membrane Technology (ITM-CNR), P. Bucci street, cubo 17/C–87036 Arcavacata di Rende, CS, Italy
3
Associated Laboratory for Green Chemistry—Clean Technologies and Processes (LAQV), REQUIMTE, Chemistry Department, FCT, Universidade Nova de Lisboa, 2829-516 Caparica, Portugal
*
Authors to whom correspondence should be addressed.
Water 2021, 13(12), 1626; https://doi.org/10.3390/w13121626
Submission received: 4 May 2021
/
Revised: 5 June 2021
/
Accepted: 6 June 2021
/
Published: 9 June 2021
(This article belongs to the Special Issue Emerging Integrated Processes for Sustainable Water-Energy-Materials-Food Nexus)
Abstract
:Excessive ingestion of fluoride through the consumption of F−-rich drinking water could cause adverse effects to human health. For this reason, the WHO has fixed 1.5 mg/L as the maximum F- concentration for drinking water. In this work, a detailed geochemical characterization was performed to define the source of natural pollution of two groundwaters (samples Pc and Bg) coming from deep crystalline aquifers located in the Calabria region (southern Italy) and to define and optimize the most appropriate water treatment strategy. The samples were classified as a F− enriched NaHCO3 type of water. In particular, the F− concentrations observed were 30 mg/L and 8.9 mg/L for the Pc and Bg samples, respectively. Based on the acquired geochemical characterization knowledge, the groundwaters were treated by two thin-film composite NF membranes, namely SPR 10113 and SPR 10114 which have so far not been used for water defluoridation. It was found that the SPR 10114 membrane was able to guarantee water permeates with F− contents lower than the threshold value of 1.5 mg/L for both treated waters, whereas the fluoride content remained above the threshold value when the Pc sample was treated using the SPR 10113 membrane. The obtained permeates were characterized by a low ionic load and were not suitable for long-term consumption as drinking water. However, all of the produced waters did not need any further re-mineralizing processes for agricultural irrigation or other purposes.
1. Introduction
Fluorine (F) is an essential element for human health, which is mainly present in drinking waters in its ionic form, the fluoride anion (F−). The ingestion of small quantities of fluoride helps in the formation and protection of teeth and bones. However, an excess of fluoride consumption could cause dental or skeletal fluorosis [1]. For this reason, the World Health Organization (WHO) has fixed 1.5 mg/L as the maximum allowed F− concentration in drinking waters [2]. Several countries of the world (such as Ethiopia, Egypt, Ghana, India, Iran, Iraq, Israel, Japan, Jordan, Kenya, Libya, Mexico, Morocco, New Zealand, Spain, Sri Lanka, Tanzania, Thailand, Turkey, the USA, and others) record high F− levels in some of their groundwater sources, and part of the population living in these countries is affected by fluorosis [3,4].
The main F-mineral is fluorite (CaF2), which generally occurs in localized secondary hydrothermal vein deposits. The occurrence of high-F concentrations in groundwaters depends on numerous factors, including the saturation state with respect to fluorite [5]. Moreover, due to the “common ion effect”, saturation with respect to carbonate minerals (e.g., calcite) indirectly controls fluoride hydrogeochemical behavior [6]. For this reason, NaHCO3 waters saturated with calcite often have low concentrations of dissolved Ca and high concentrations of fluoride.
Fluoride has an ionic radius very similar to that of OHˉ and substitutes readily in hydroxyl positions in late-formed minerals of igneous rocks, for instance apatite (Ca(PO4)(OH,F,Cl), biotite (K(Mg,Fe)3(Al,Si3O10)(OH,F)2, and muscovite (KAl2(AlSi3O10 (OH,F)2). Other F-bearing minerals are chlorite, topaz, and amphibole [1], [7].
The anion exchange between F− and OH− in clay minerals promotes the F-enrichment of groundwaters [8]. F-rich groundwaters are generally found in crystalline aquifers, particularly granites, which contain F-minerals as micas, apatite, and amphiboles in high percentages [1]. High F− concentrations are also registered in geothermal and active volcanic areas.
Considering the increasing need of drinking water and the stringent concentration limits of their dissolved constituents, it is mandatory to develop and apply efficient remediation systems based on geochemical considerations [9], [10]. This knowledge is essential in order to allow for the implementation of optimized water remediation systems in similar geological settings worldwide.
The conventional methods that are generally employed for water defluoridation can be grouped into adsorption, ion exchange, coagulation/precipitation, and membrane-based technologies [11,12,13].
Nowadays, membrane processes can be viewed as a feasible alternative to the less sustainable traditional treatments to reach the quality standards set for drinking waters. Besides significantly improving the produced water quality compared with conventional methods, the membrane technologies can also operate using renewable energy sources like photovoltaic or wind turbines, thus minimizing waste generation and the risk of hazardous emissions to the environment [13,14,15]. Promising results have been reported using nanofiltration/reverse osmosis (NF/RO) technologies for water defluoridation for both model synthetic aqueous solutions and real F−-contaminated groundwaters [16,17,18,19,20,21,22]. Although NF is generally used to remove divalent ions (Ca2+, Mg2+, SO42−), it is also employed to remove F− ions because of their relatively small ionic radii and consequently larger hydrated shells. The larger hydrated radius of fluoride makes its permeation across NF membranes more difficult with respect to other monovalent ions such as chloride [23].
The aim of this work was to lower the fluoride concentration below the WHO established limit in two F-rich groundwaters coming from the crystalline aquifers of the Calabria Region (southern Italy) by investigating and comparing the performance of two NF membranes that have not already been tested for this application in past literature. The water remediation study was coupled with a geochemical characterization with the purpose of selecting suitable NF membranes and operative parameters, as well as to identify the possible source of natural pollution.
2. Materials and Methods
2.1. Site of Origin of F-Rich Samples
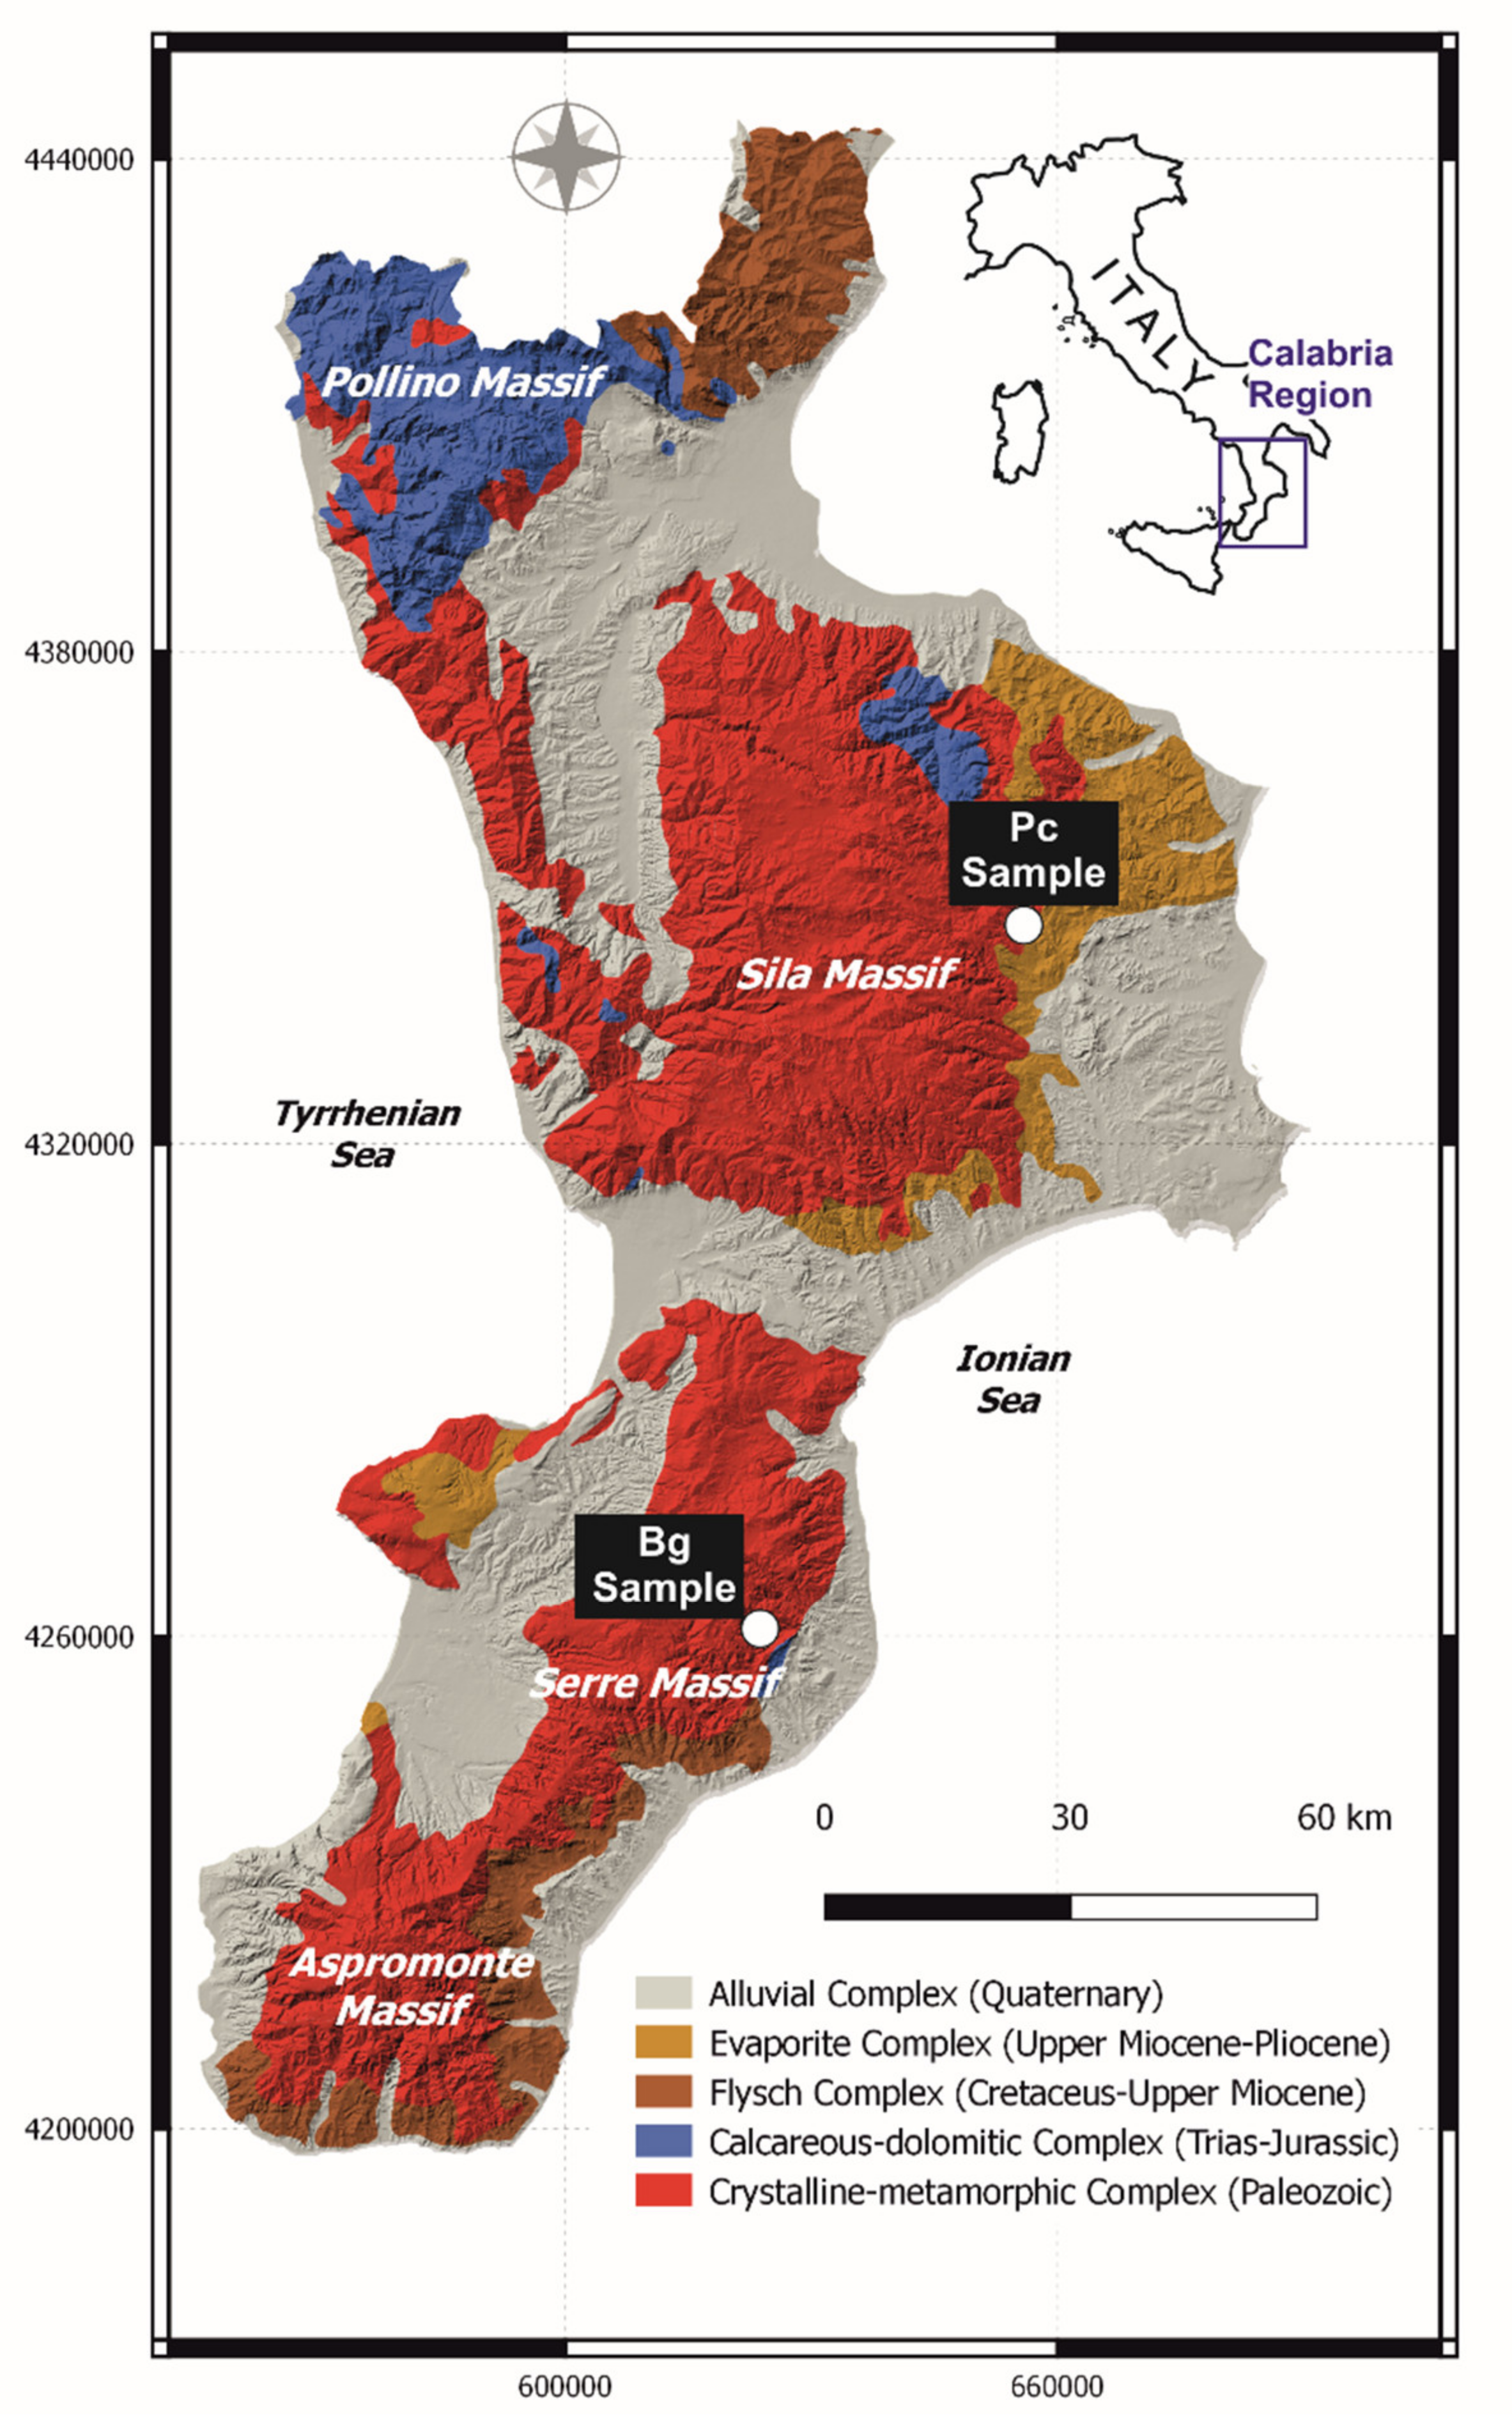
The studied samples were collected in the Calabria Region in southern Italy. The sampling areas fall in the Sila and Serre Massifs. The Sila Massif represents the major morphostructural high of the Ionian margin of north-east Calabria and is mainly composed of gneisses, schists, phyllites, and amphibolites, which were affected by various alpine metamorphic events and were intruded by the late Hercynian Sila Batholith [24]. A Meso-Cenozoic sedimentary cover is also present at the top. One of the collected F-rich groundwaters, labeled Pc, was collected from a well located in the Crotone province (Southeast of the Sila Massif). The deep aquifer is located in the granitic rocks of the Sila Unit, whereas the second one, labeled Bg, is located in Reggio Calabria province (in the southern part of the Serre Massif) (Figure 1).
The Serre Massif is built of late Hercynian granodiorites, granitoids rocks, and high-grade metamorphic rocks [25]. A Cenozoic sedimentary cover is also locally present at the top [26] (Figure 1). K-feldspar, plagioclase, quartz, biotite, and muscovite in variable percentages, constitute the primary mineral assemblage of these granitoid rocks, also containing minor amounts of chlorite, epidote, and apatite [27,28,29].
From the hydrogeological point of view, the two areas of the Sila and Serre Massifs, excluding their sedimentary covers, can be grouped into the crystalline-metamorphic hydrogeological complex defined in [30] (Figure 1). This comprises of a porous shallow aquifer corresponding to the weathered zone of the crystalline rocks, which is in a hydraulic connection with the underlying intermediate aquifer and is hosted in the fissured rock basement. They are both delimited below, by less fissured or non-altered rocks (see [30] for further details).
Other main hydrogeological complexes in the Calabria region are the calcareous-dolomitic complex, the flysch complex, the evaporite complex, and the alluvial complex (see [30] for further details).
Figure 1.
Hydrogeological sketch map of the Calabria region (adapted from [30]) with the locations of Pc and Bg water samples.
Figure 1.
Hydrogeological sketch map of the Calabria region (adapted from [30]) with the locations of Pc and Bg water samples.

2.2. Water Sampling and Analyses
As mentioned above, the Pc sample was taken from a 180 m deep well, whereas the Bg sample was discharged from a spring located at 360m a.s.l. The sampling was conducted in February 2020. The collected water samples were analyzed for major components. The methodologies of sampling are described in detail in [31,32,33,34,35,36,37], therefore, only a brief description is reported here. In the field, water temperature, pH, electrical conductivity (EC), and redox potential (Eh) were measured by using previously calibrated portable instruments. Total alkalinity was measured by means of the acidimetric titration method, using a micro-dosimeter, 0.05 N HCl as a titrating agent, and methyl orange as an indicator. The samples were collected in separate new polyethylene bottles. After filtration through a 0.45 μm pore-size filter, a part of the sample for the determination of cations, and SiO2 was acidified with the addition of 1% HNO3, whereas the remaining one was stored without further treatments for the anions determination. For each sample, the concentrations of major ions (Na+, K+, Mg2+, Ca2+, F−, Cl−, SO42−, and NO3−) were determined by high performance liquid chromatography (HPLC-DX1100, Thermo Scientific™ Dionex™, USA). The dissolved SiO2 was measured by means of VIS spectrophotometry, using the molybdosilicate method. Data quality was evaluated by performing charge balance estimations and accepting a deviation within ± 10% for major ions present. The chemical analyses were performed in the laboratories of the Department of Biology, Ecology and Earth Sciences at the University of Calabria. After the preliminary analysis, about 40 L of each sample were collected for the subsequent membrane treatment tests.
2.3. Experimental Set-Up for NF/RO Tests
NF experiments were performed by using a laboratory pilot unit (SEPA CF, General Electric Company) at the Institute on Membrane Technology (ITM-CNR) in Calabria, Italy [9,10]. The system includes a cross–flow flat membrane module, a feed tank, a pressurization pump, and two manometers located at the module inlet and outlet. A thermometer for the feed stream temperature measurement was mounted in the feed tank, which was equipped with a cooling system using tap water, thus keeping the temperature at 19 ± 2 °C. The experiments were performed by recycling the retentate stream back to the feed tank of the plant, while different sampling containers were used to continuously collect the permeate. The fluoride rejection factor (R, %) and the volumetric fluxes (Jv, L/hm2) were estimated using the following equations:
where Cp and Cf are the concentration of fluoride in the permeate and the feed, respectively. ΔV is the volume of the permeate obtained in a time interval (Δt) and A is the membrane area (140 cm2).
Two NF membranes referred to as SPR 10113 and SPR 10114, both purchased from SEPRA (Separation Process Application (MB, Italy)), were used to treat the F-rich groundwaters. These NF membranes are generally used to remove divalent ions, but they were investigated for their efficiency to remove F− ions from the Pc and Bg samples because F− ions are strongly solvated by water, thus the expectation that this would hinder their transfer across the NF membranes with respect to the transfer of other monovalent ions.
The main properties of the membranes (provided by the manufacturer) are listed in Table 1. The membranes are made of the same material (Polyamide-TFC), and their MWCO is in the range of 100–250 Da and 150–300 Da for the SPR 10113 membrane and the SPR 10114 membrane, respectively. The SPR 10113 membrane shows a higher MgSO4 and NaCl rejection than the SPR 10114 membrane, as reported in their specifications (Table 1). During the experiments, the permeate fluxes as well as the fluoride rejections were evaluated at three operating pressures (5 bar, 10 bar, and 15 bar).
3. Results and Discussion
3.1. Water Characterization Before Membrane Treatment Tests
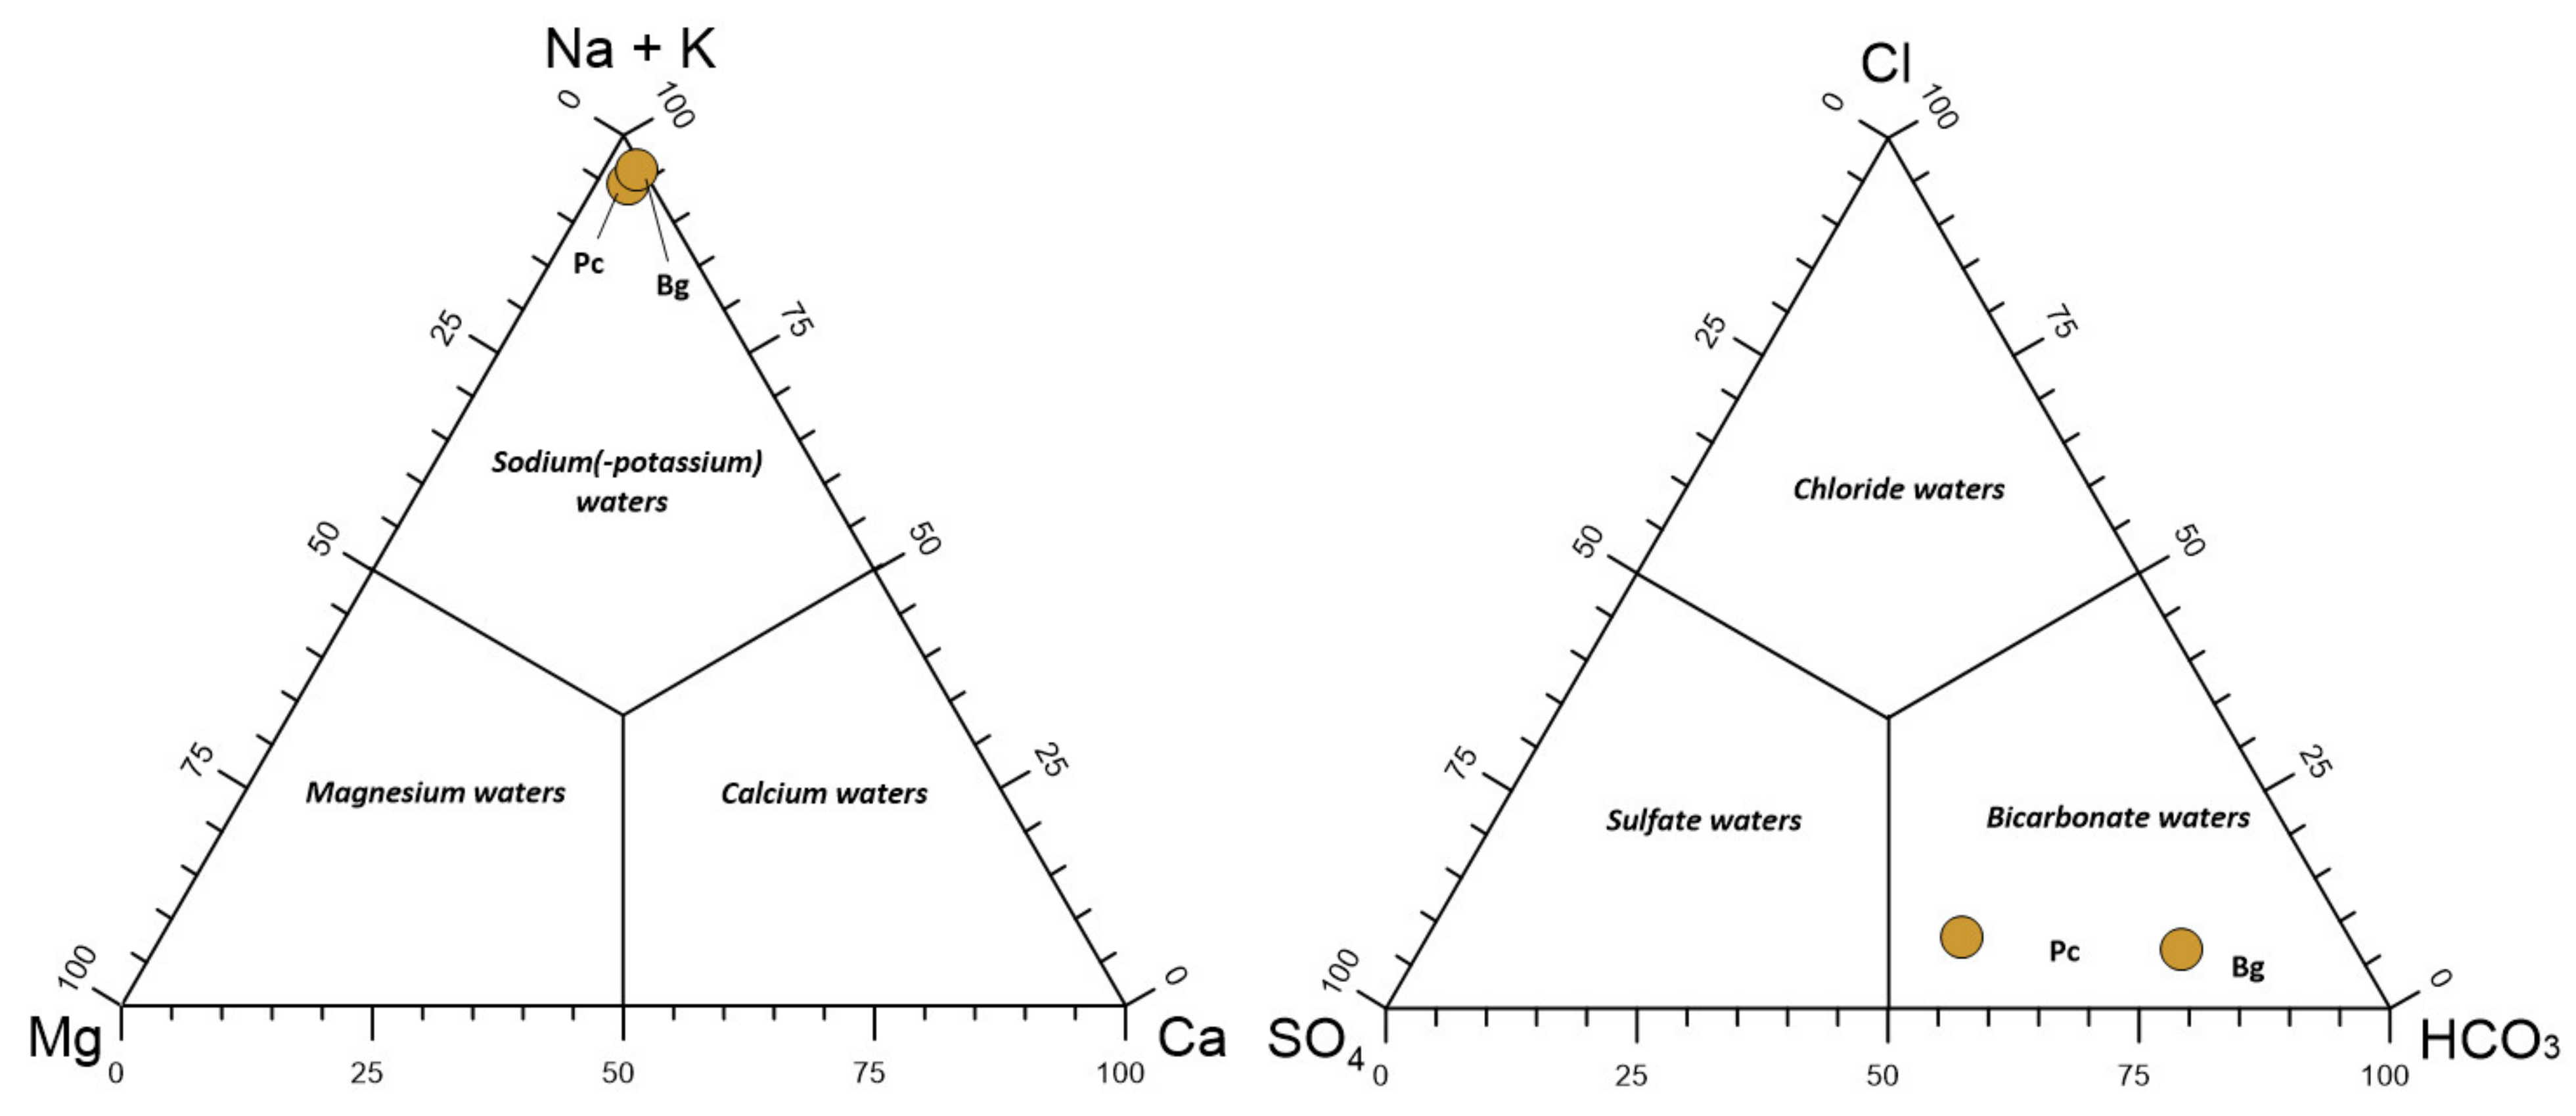
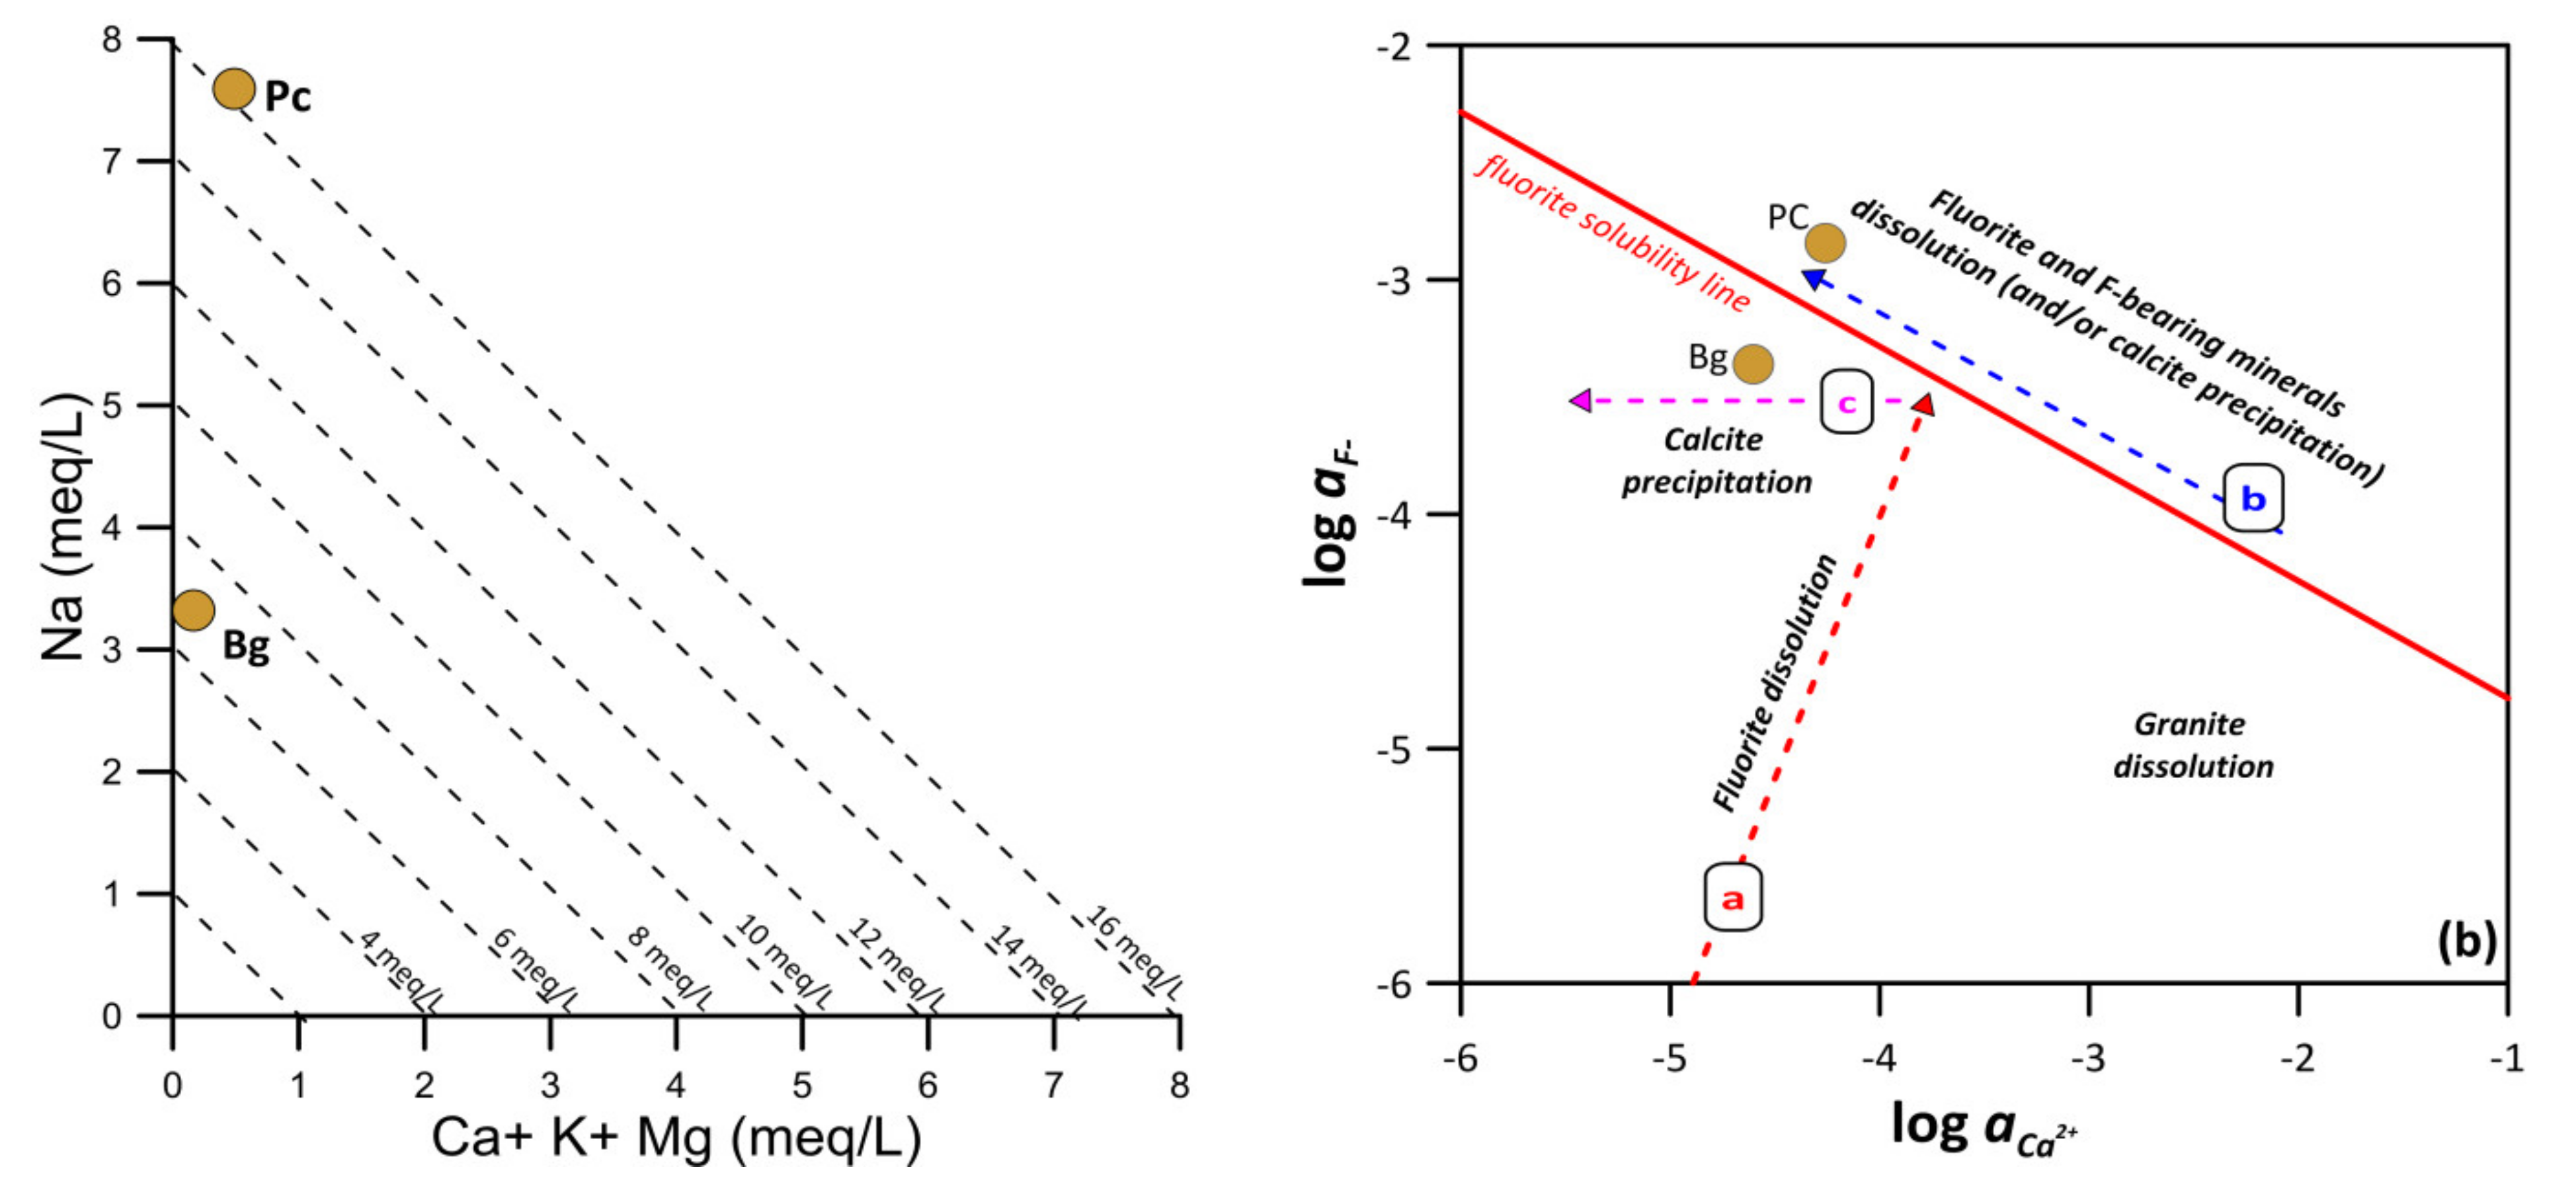
The water from the two aquifers were characterized by high pH values (9.6 and 10.1 for the Pc and Bg samples, respectively), and both had negative redox potential (Eh) (Table 2). On the basis of the obtained triangular plots presented in Figure 2, the two water samples can be classified as the Na-HCO3 water type. The concentrations of F− in both water samples were much higher than the maximal allowed drinking water limit (1.5 mg/L) established by WHO. In particular, the concentrations were 30 mg/L and 8.9 mg/L for the Pc and Bg samples, respectively. Speciation calculations showed that the fluorine was present mainly in its ionic form, fluoride (F−). Moreover, it should be noted that the Pc sample was more mineralized than the Bg one, as it can be seen by the chemical—physical parameters reported in Table 2. In this respect, a total ionic salinity plot (TIS-plot) was constructed and is presented in Figure 3a. The TIS values were found to be equal to 16.1 meq/L and 7.1 meq/L for Pc and Bg, respectively. The chemical compositions of the studied samples can be attributed to their origin from relatively deep aquifers and comparatively long water–rock interaction times [40].
Complete geochemical characterization is useful for the proper choice of the materials and operating conditions to be applied in the subsequent membrane treatment. The compatibility check among the feed water and selected membranes is the first condition to be satisfied. For instance, the alkaline pH of both of the water samples is compatible with the pH operating range of the selected membranes. The membrane MWCO values also need to be appropriate in order to preserve an adequate ionic load in the permeate solutions after treatment, considering the starting average ionic load of both samples (299 mg/L and 587 mg/L, for Bg and Pc respectively). The selected membranes were used to treat, at parity of the operating parameters, the waters with different F-concentrations in order to evaluate the achievable permeate chemical compositions.
3.2. Source of Fluoride
As described in the introduction, the main F-bearing mineral is fluorite (CaF2), which occurs in igneous rocks as a late-crystallizing, mainly hydrothermal product [41]. Fluoride is also hosted in other minerals, frequently occurring in crystalline rocks, such as apatite, biotite, muscovite, chlorite, and amphibole, in which fluoride substitutes the hydroxyl ion.
The fluorite mineralizations occurring in the Calabria region have so far been the subject of few studies, and limited information about their distribution is available [42]. However, some sources testify that the presence of hydrothermal fluorite is probably associated with the intrusion of magmatic rocks in several areas of the region, including the area of Cerenzia (Crotone province), where the Pc sample was collected [43]. In the past, a mining survey was carried out in this area. Nevertheless, the limited extension of fluorite veins (sometimes associated with barite and sulphide minerals) led to the termination the exploration [44].
To describe the geochemical processes that occur in the studied deep aquifers, the activity diagram of Ca2+ vs. F− [3] is reported in Figure 3b. Moreover, the saturation indices plot of calcite and fluorite were calculated by the code PhreeqC Interactive, version 3.1.1 [38,39]. In the diagram, the fluorite solubility line and three possible evolution trends (lines a, b, and c) are reported. During fluorite dissolution, the activities of F− and Ca2+ change according to the relationship described by line (a). The field on the right side of line (a) represents the dissolution of other F- and Ca-bearing minerals which can constitute granitic rock. The Pc sample is equilibrated with fluorite and is saturated with calcite. It appears shifted to the left along the saturation line of fluorite, following the path described by line (b) (Figure 3b). F and Ca are probably mainly controlled by calcite precipitation and the concurrent dissolution of fluorite (and subordinately, other F-bearing minerals) until the attainment of saturation with fluorite. The Bg sample falls under the fluorite solubility line, following the trend described by line (c). Indeed, it is unsaturated with respect to fluorite, and it appears to be saturated with respect to calcite. The calcite precipitation could be the main cause of the shift left of sample in the plot, although the cation exchange process between Ca and Na ions could also occur in the studied environment [3,7,45,46]. Although a properly geochemical modeling and/or experimental dissolution studies are needed to define each environmental condition of the rock-to-water release of fluoride [47,48], the diagram pointed out that in a deep environment, several processes causing the F-enrichment of groundwaters could occur.
3.3. Permeate Flux and Fluorine Rejection
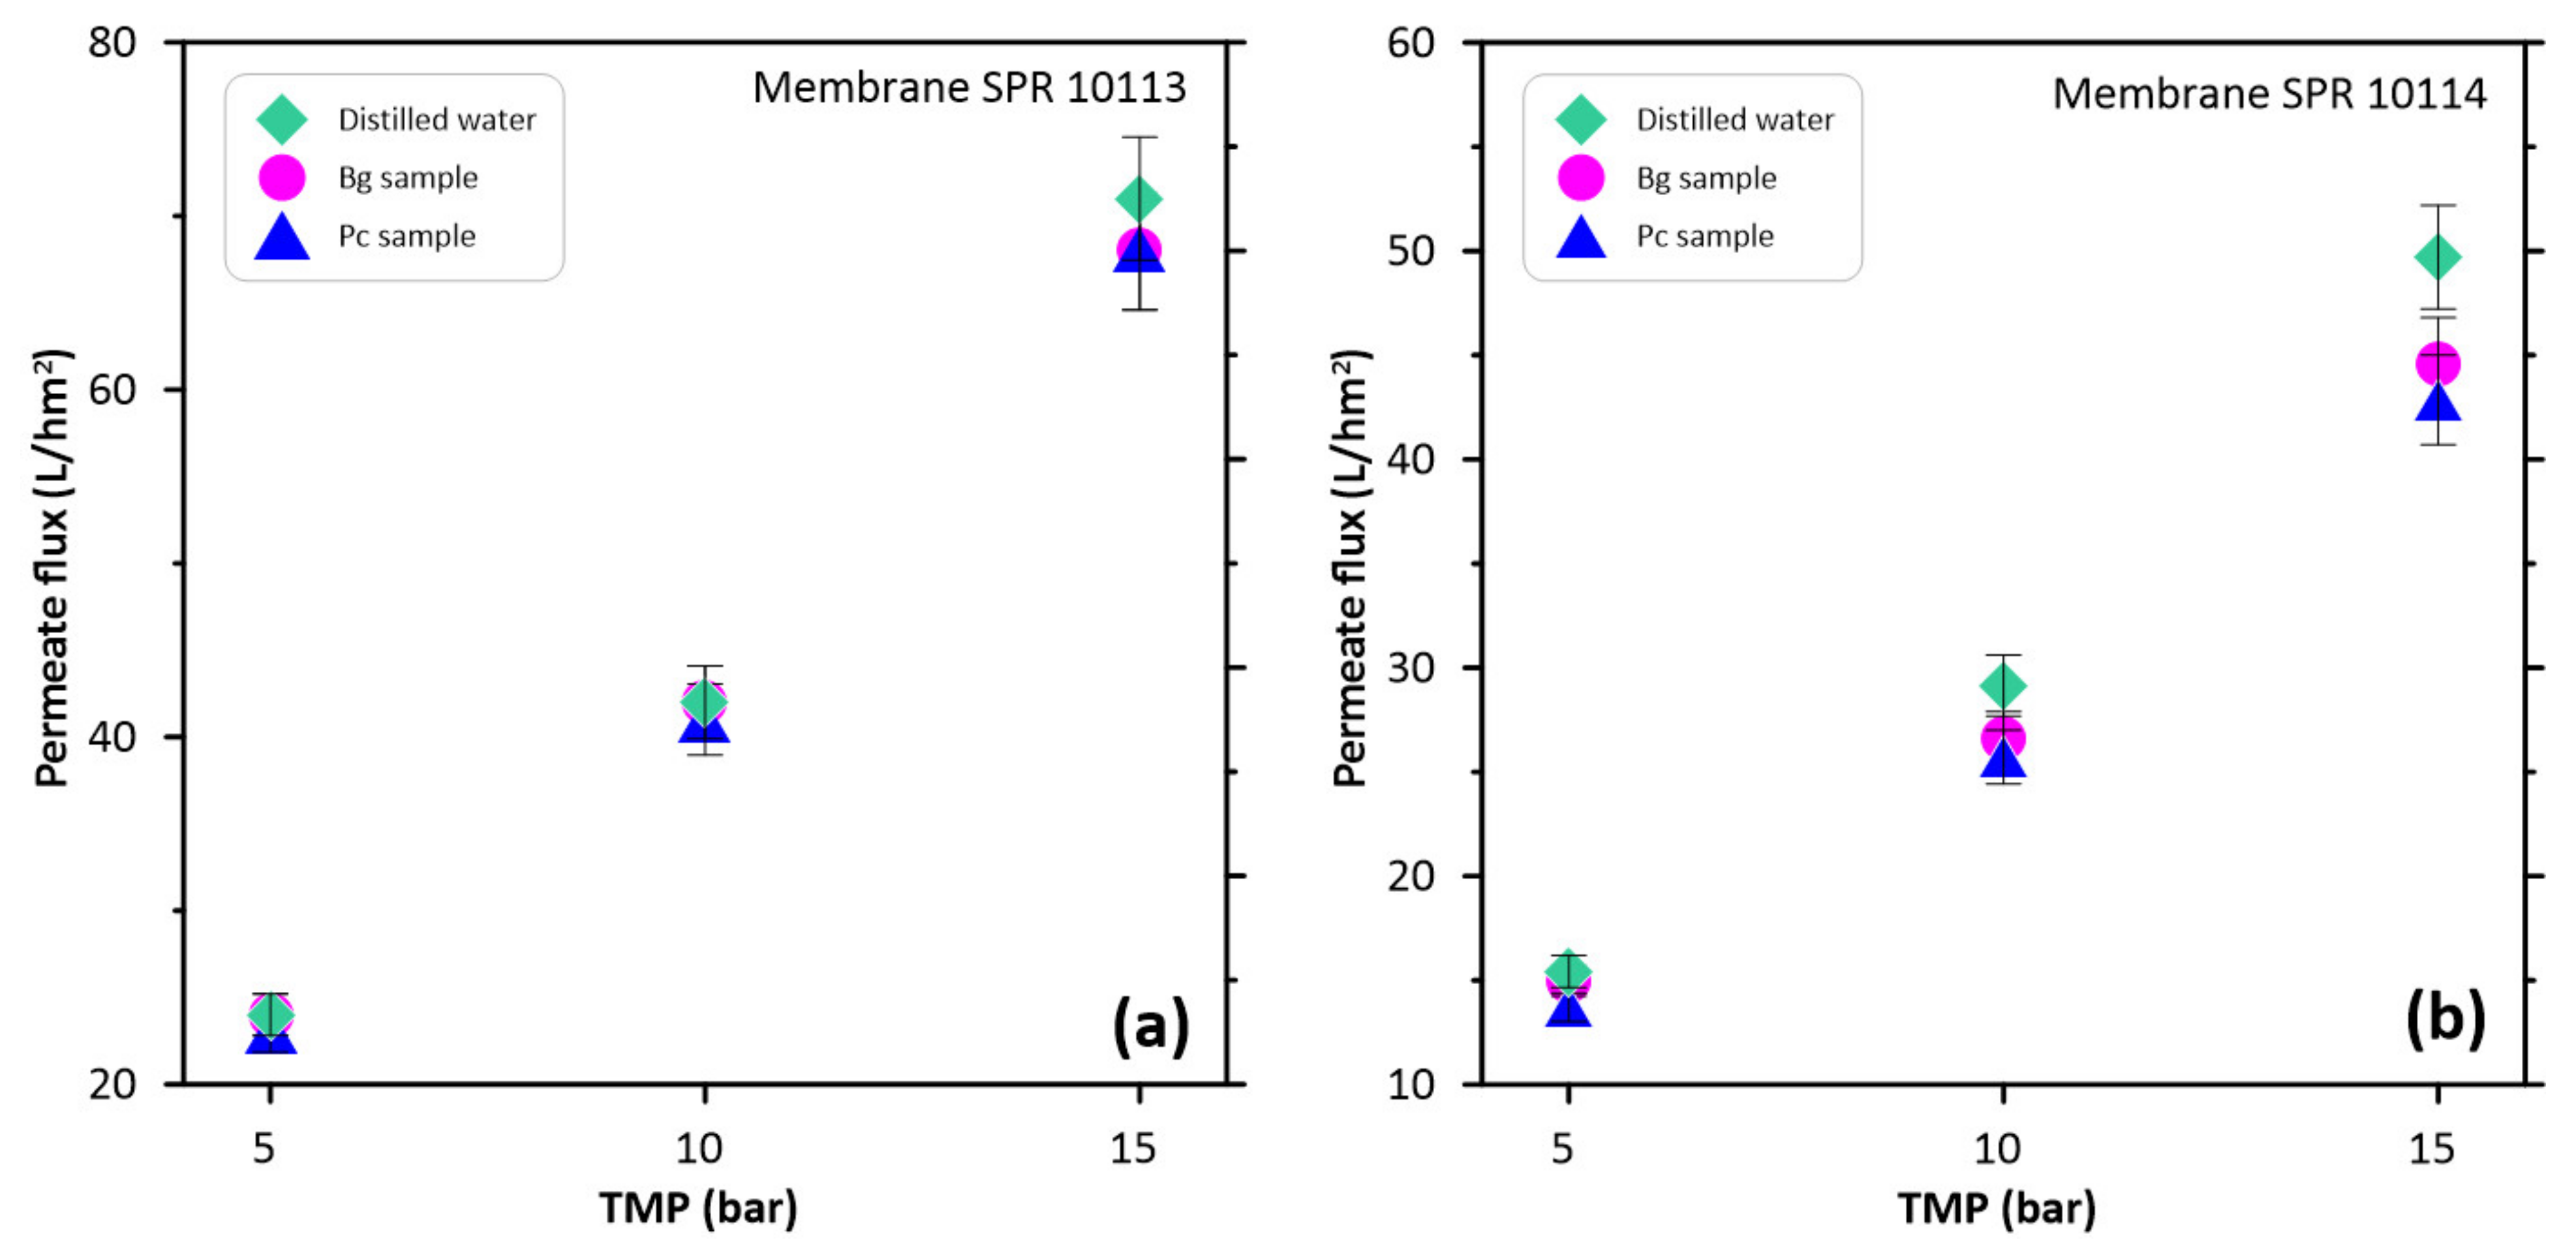
Figure 4a,b illustrate the trends of the permeate fluxes as functions of the trans-membrane pressures (TMPs) for the investigated membranes and the two groundwaters (samples Pc and Bg). The figures also report the results obtained with distilled water. Generally, the permeate fluxes increased with the increase of the applied pressure in each performed test. The highest distilled water fluxes were recorded for the SPR 10113 membrane, with values ranging between 24 and 71 L/hm2 at 5 and 15 bar, respectively. Instead, flux values in the range of 15–50 L/hm2 were measured using the SPR 10114 membrane. After the tests performed using distilled water, the permeate fluxes were also determined by testing the Bg and Pc samples. The obtained values were slightly lower than the previous ones, most likely due to the presence of other species in the Bg and Pc samples, which could lead to the concentration polarization phenomena. However, the SPR 10113 membrane always exhibited higher permeate flux values (from 23 to 68 L/hm2, considering both the Bg and Pc samples) compared to those of the SPR 10114 membrane (from 14 to 45 L/hm2, considering both the Bg and Pc samples). This result seems to be in contrast with the MWCO range of the SPR 10113 membrane, which is lower, although quite close to the MWCO range of the SPR 10 114 membrane (see Table 1).
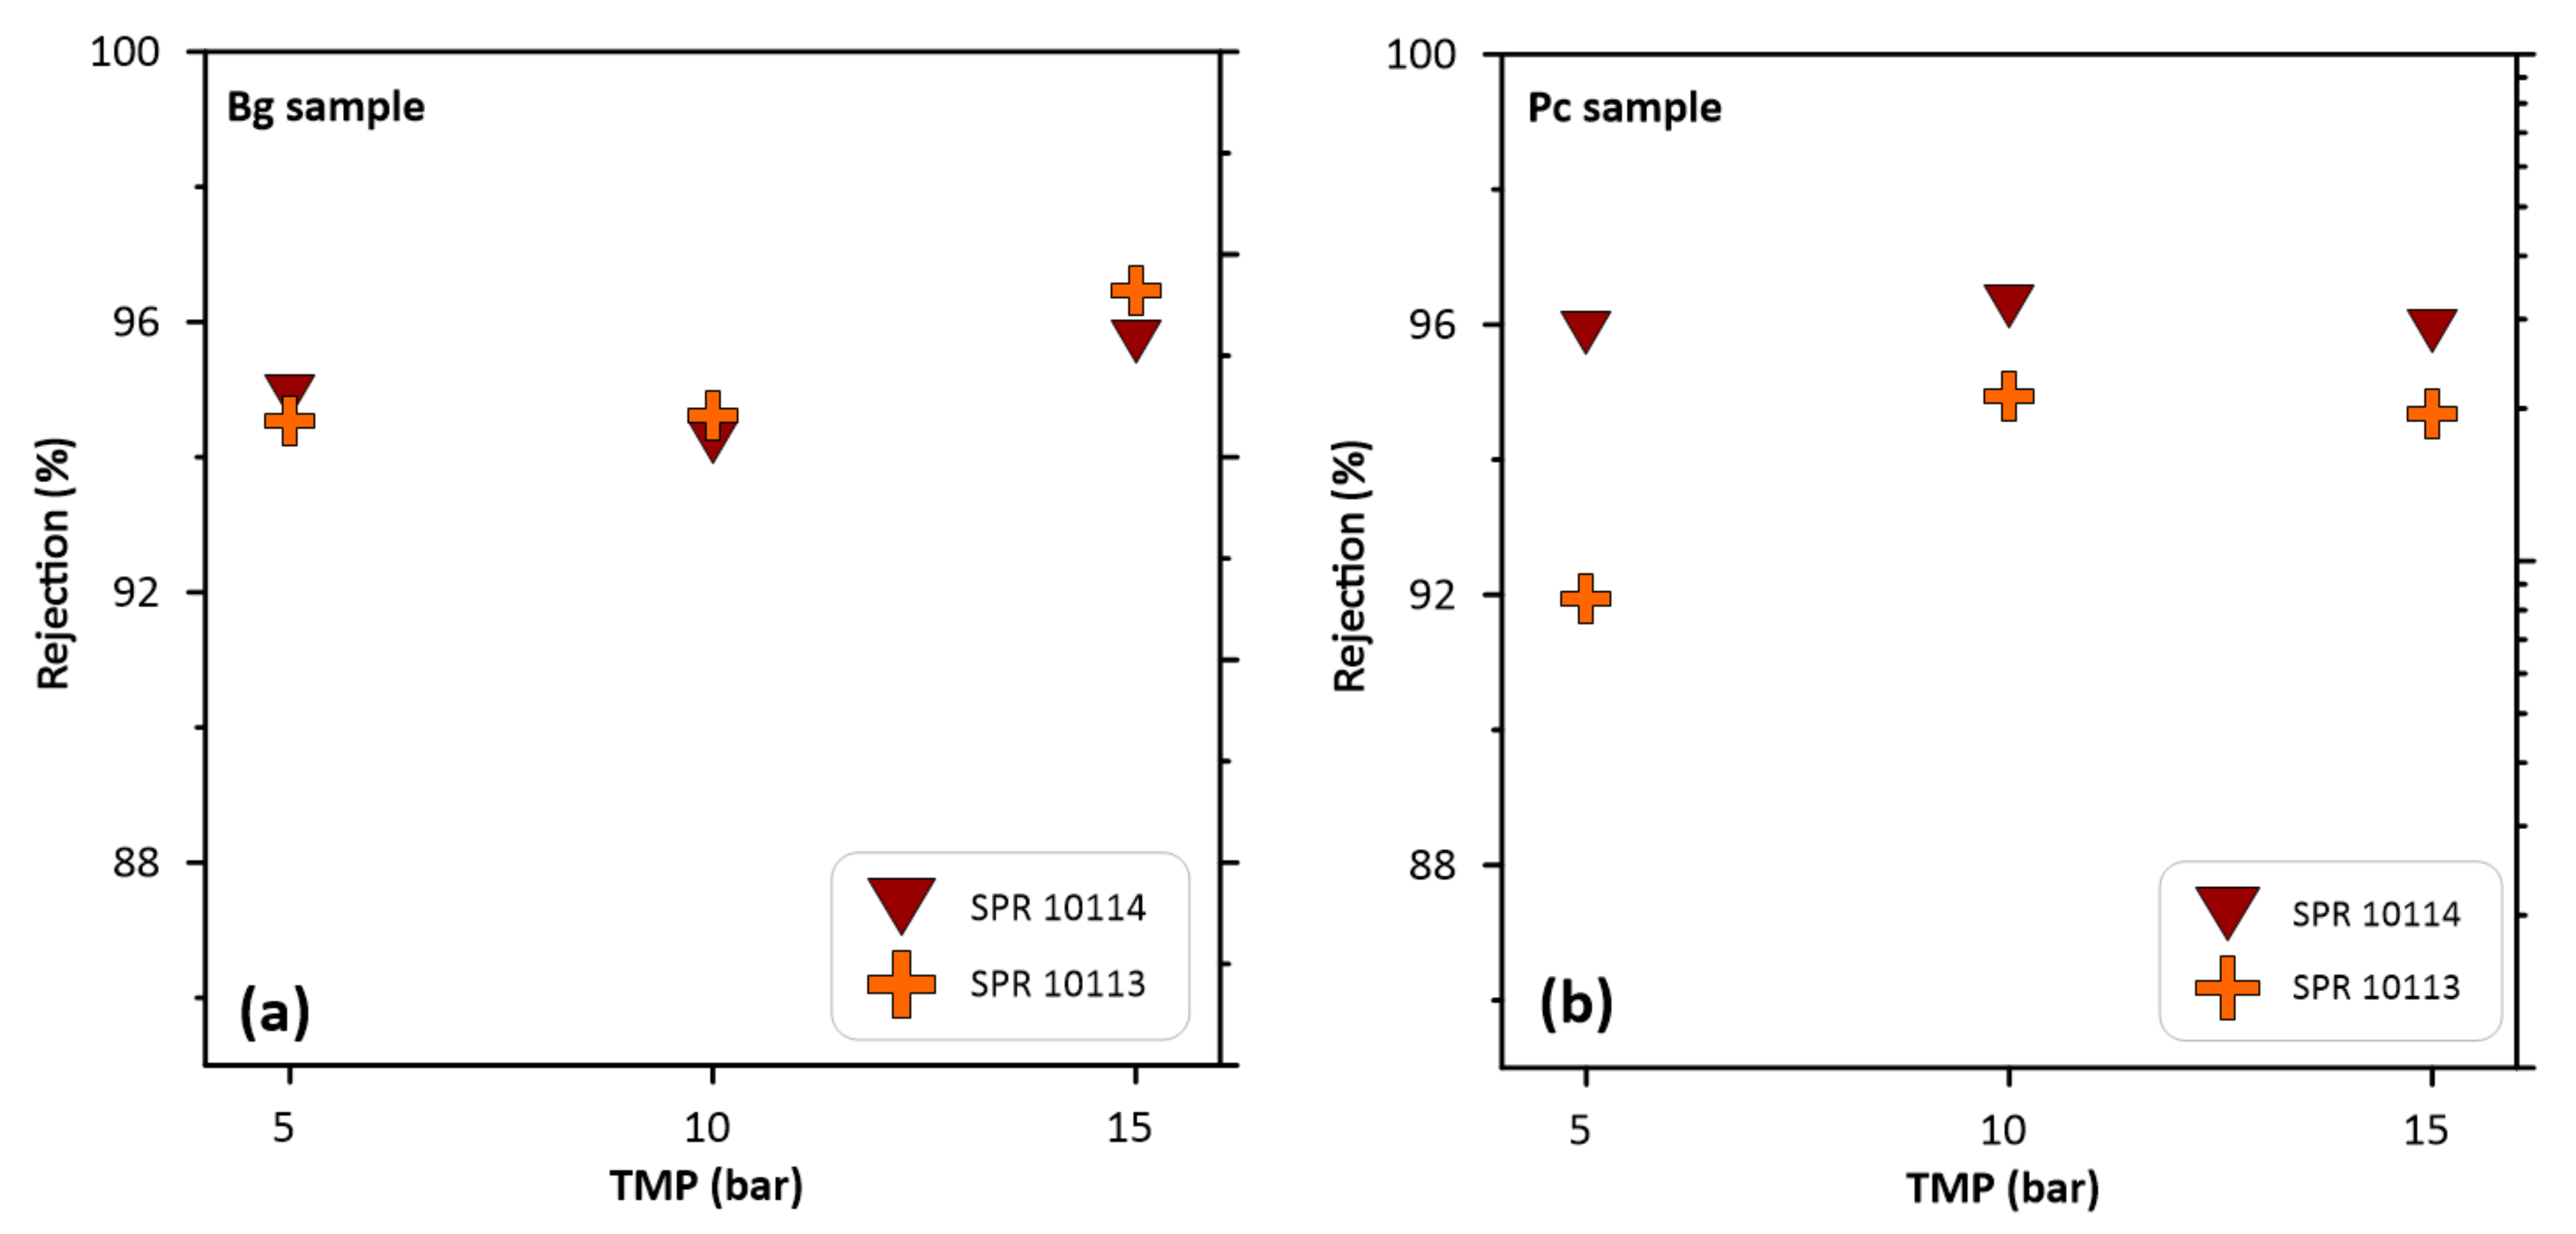
The same remark can be made by analyzing the rejection values of the two membranes. The fluoride rejection and the fluoride concentration in the permeate as a function of TMP for both the SPR 10113 and SPR 10114 membranes and the two groundwaters are reported in Figure 5 and Figure 6, respectively. The SPR 10113 membrane exhibited rejection values ranging from 94% to 96% and from 92% to 95% for the Bg and Pc samples, respectively. However, the SPR 10114 membrane showed rejection values ranging from 95% to 96% for the Bg sample, whereas a constant rejection equal to 96% at different applied TMPs was observed for the Pc sample (Figure 5a,b). Again, membranes behaved differently than expected from MWCO range values, with the SPR 10114 being the one showing the highest rejections. A possible explanation for this result could be that the SPR 10113 membrane tested in the NF set-up had a higher MWCO than the SPR 10114 membrane.
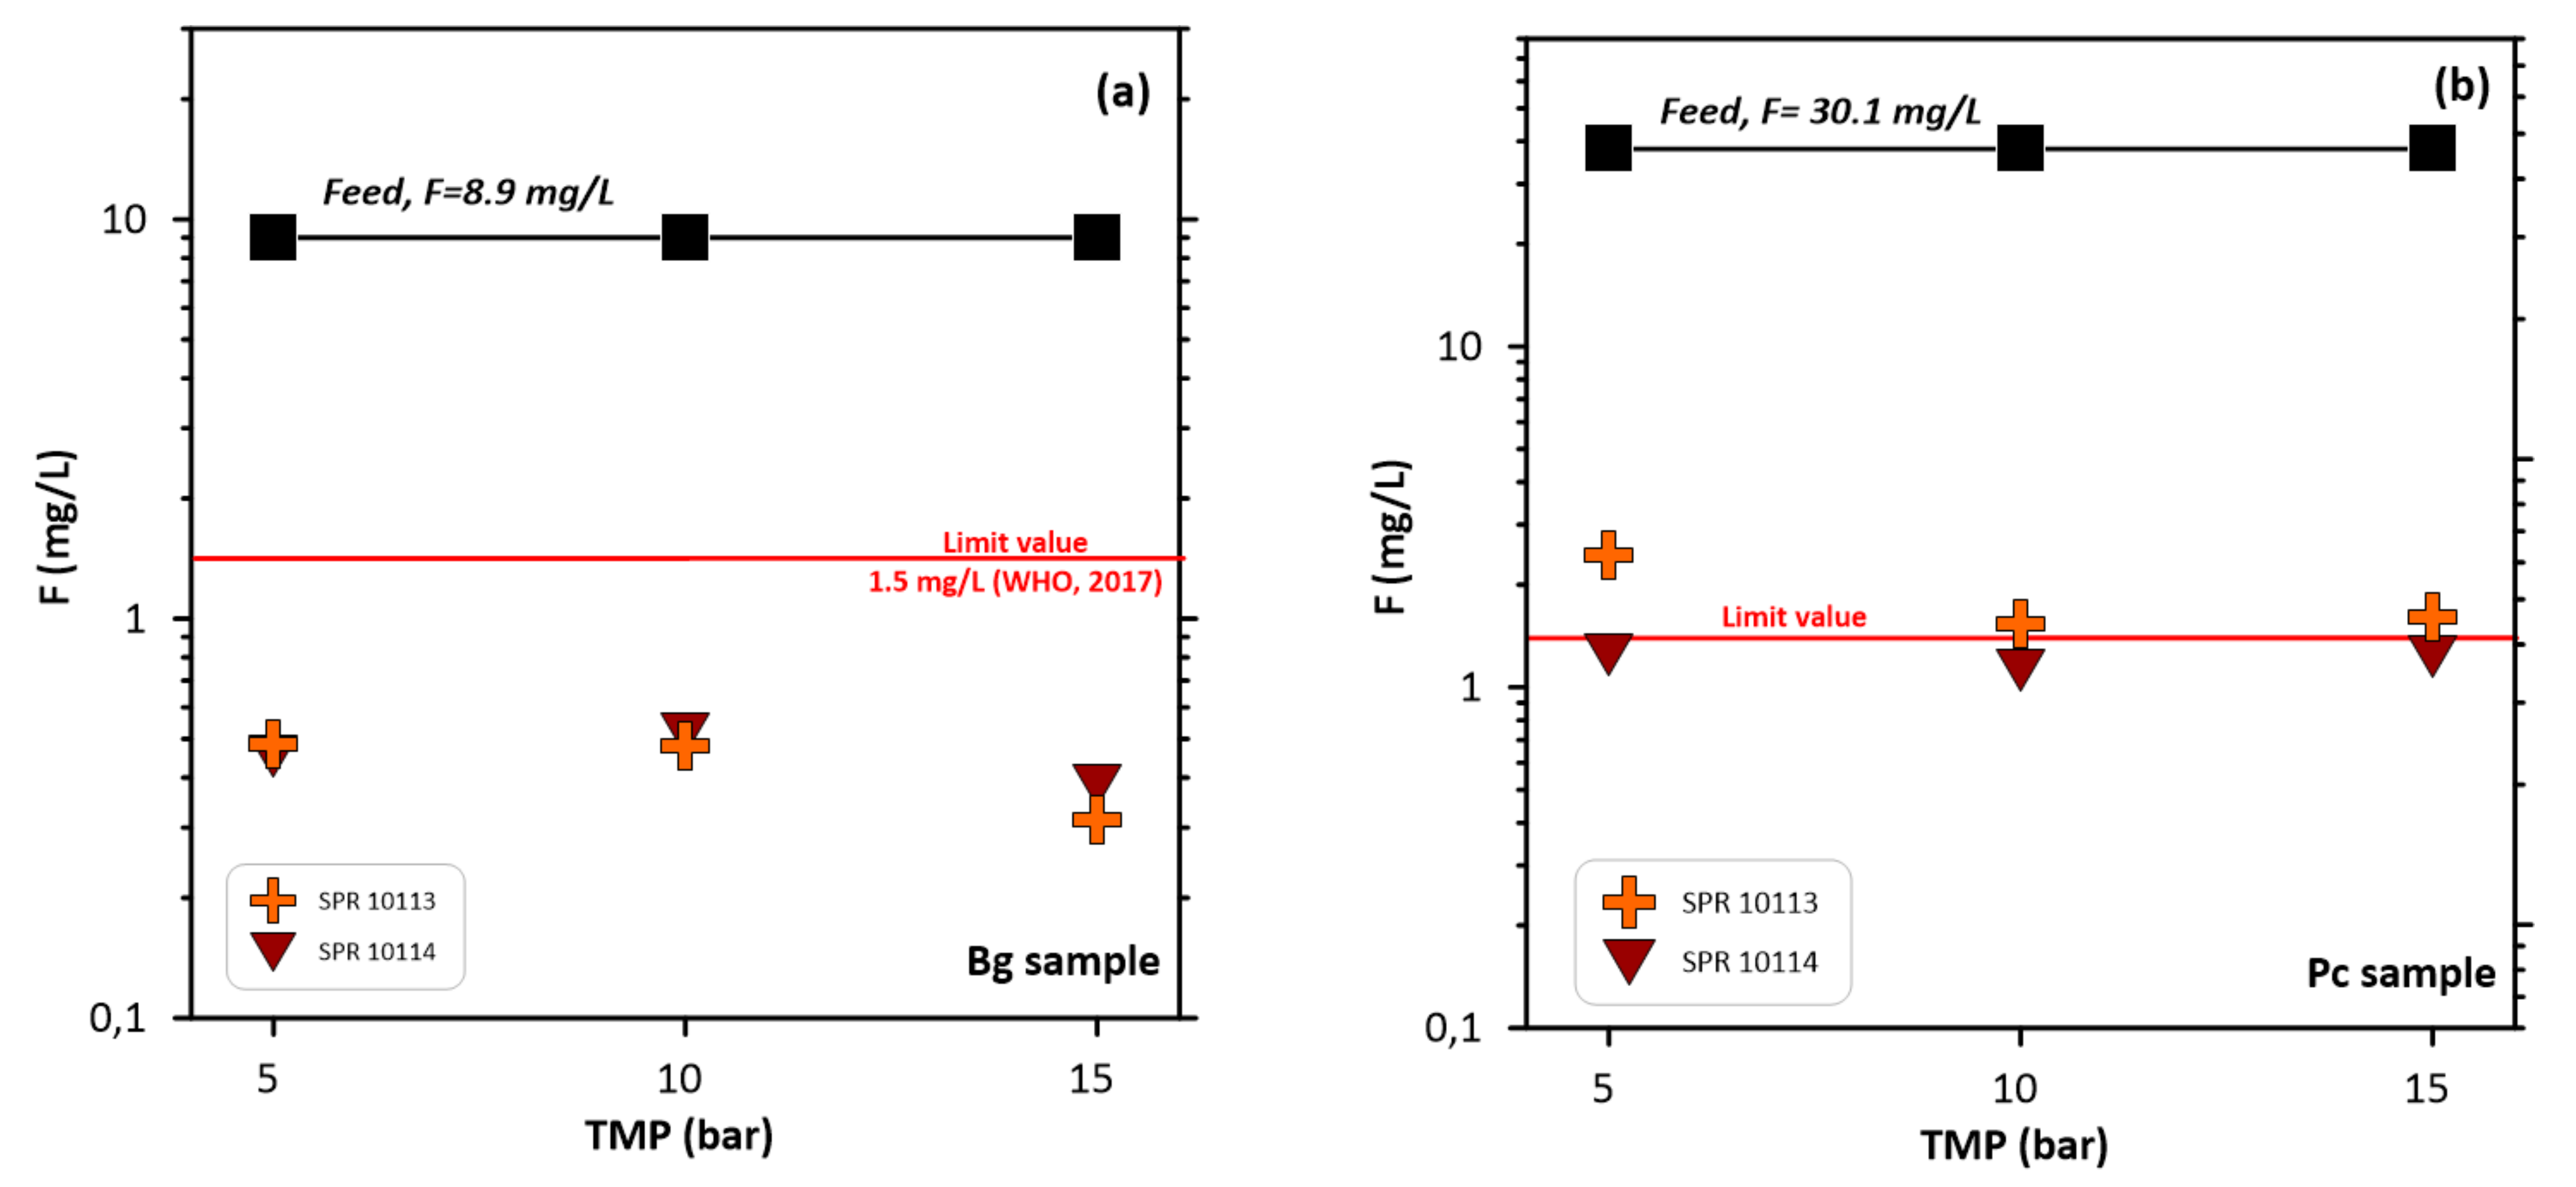
To validate this assumption, other NF tests on a different SPR 10113 membrane coming from the same batch were carried out with distilled water. In this case as well, water fluxes higher than those of the SPR 10114 membrane were measured. Concerning the rejection efficiency, the fluoride rejections were similar in the case of the Bg sample. In the permeate, the F concentration was quite constant with TMP and was lower than the concentration limit of 1.5 mg/L established by WHO (Figure 6a). However, when the Pc sample was treated, the fluoride rejections of the SPR 10114 membrane were higher than those obtained by using the SPR 10113 membrane (Figure 6b). The higher ion concentration of the Pc sample likely promoted a concentration polarization close to the membrane surface. This phenomenon, together with the lower fluxes of the SPR 10114 membrane, favored the fluoride rejection. In this case, the feed composition also played a crucial role during the separation process. Indeed, as noted in Table 2, the Pc sample is the most mineralized water.
It also has to be pointed out that the higher fluxes of the SPR 10113 membrane could be the cause of a “drag effect”, leading to a lower fluoride rejection during the Pc treatment by using this membrane. Nevertheless, the fluoride content in the permeate was close to the limit value when the Pc water was treated, although the fluoride amount was three times greater than that of the Bg water (Table 2, Figure 6). Even if the features provided by the manufacturer showed a NaCl rejection equal to 55% and 40% for SPR 10113 and SPR 10114, respectively, the rejection of the fluoride measured during the experiments was higher because it was strongly hydrated in water [12].
3.4. Comparison with Literature Data
Several authors have investigated NF/RO membrane performance to remove fluoride from natural waters by means of laboratory plants and in situ installations. They have focused their attention on the multiple aspects that can affect the removal of fluoride, such as operating conditions, the presence of organic matter, pH values, and the ionic strength of treated waters, etc. [18,49,50,51,52,53].
In the following, relevant results obtained by using NF membranes for the treatment of natural waters are summarized. Nasr et al. [19] tested the NF5 and NF9 commercial membranes (both composed of a thin-film polyamide composite) to remove fluoride from Tunisian groundwater by means of a NF pilot plant. The tested water, named Louza 2, had a fluoride concentration equal to 3.39 mg/L. After the treatments using NF5 and NF9 membranes, the F concentration in the permeate was 1.45 mg/L (R = 57%) and 0.38 mg/L (R = 88%), respectively. Despite the satisfactory results obtained using the NF9 membrane, the TDS value in the permeate was very low, and the water was not appropriate for human consumption.
Bouhadjar et al. [16] developed a photovoltaic solar energy powered NF filtration plant for the sustainable treatment of fluoride-affected groundwater with high salinity in northern Tanzania. The groundwater treated by Bouhadjar et al. was characterized by a high pH (8.5) and fluoride concentrations >50 mg/L, significantly greater than the WHO guideline value. In this study, a NF module equipped with a NF90 4040 membrane (from Dow Water & Process Solutions) was used. The resulting water quality was within the WHO recommended maximum fluoride level throughout the entire testing period. Moreover, the produced concentrate was reused for washing and toilet flushing purposes.
The efficiency of three membranes, named NF-1, NF-2, and NF-20 (all composed of polyamides), was tested to remove fluoride from groundwater sampled in a village in the Birbhum district (eastern India) [20]. The laboratory experiments showed that at 9.8 bars of applied pressure, the NF-1 had the highest fluoride rejection capability (R = 95%), followed by NF-20 (R = 86%), and NF-2 (R = 78%) membrane types. The best results, considering both permeate flux and F rejection, were obtained at 13.7 bar, using NF-1 and NF-20 membrane types [20].
Satisfactory results have also been reported in [17]. The authors treated brackish water with a fluoride concentration of 49.1 mg/L (an average value considering the two sampling periods) of a borehole located within the town of Boma Ng’ombe in the Hai district (Kilimanjaro region) using an autonomous solar-powered NF/RO system. Among the used membranes, the NF90 membrane type (polyamide) led the most favorable overall results, whereas the NF270 (polyamide) membrane did not achieve the required fluoride guideline values. These membranes were previously tested for treating the F-rich groundwater (17.9 mg/L) of the Oldonyosambu ward in northern Tanzania [54] using a solar energy-based membrane system. In this case as well, the NF90 membrane was able to lower the fluoride concentration below the WHO limit.
The NF90 and NF270 membranes (manufacturer, Filtec Down) together with the TR60 type (manufacturer, Toray) were also used to treat fluoride contaminated groundwater (2.3 mg/L) collected in central Morocco [21]. The performances of the NF270 and TR60 membranes were similar (R = 82% and R = 74%, respectively) whereas the NF90 membrane reached a fluoride rejection equal to 98%. It should be noted that the most investigated NF membranes to fluoride removal are the NF90 and NF270 types.
The comparison of the results obtained in this work with those available in the literature for the defluoridation of natural waters by means of NF membranes is reported in Table 3. It can be noted that the comparison is not immediate due to different features of the considered membranes, starting feed concentration (e.g., fluorides concentration and total dissolved solids), and operating conditions (e.g., applied TMPs).
All of the considered membranes reported in the comparative table are made up of the same material (polyamide), although in different configurations (e.g., flat sheets and spiral wound). The table includes results of laboratory experiments and/or of real in situ applications. The considered waters have a fluoride concentration within the concentration range of 2.3–55 mg/L. Moreover, the electrical conductivity (EC) reported in the table for each sample (except for the Louza sample) provides general information about the degree of water mineralization. For instance, the sample coming from the St. Dorcas borehole shows the highest EC value of 3935 µS/cm (the most mineralized water), whereas the Bg sample tested in this work shows the lowest EC value of 364 µS/cm (the least mineralized water). The NF90 membrane shows the best performance, lowering the F concentrations below the WHO limit while starting from a high concentration of fluoride in high mineralized waters, and working at operative pressures not exceeding 6 bar [16,17]. The other tests were performed at higher operating pressure, up to 10 bar. The SPR 10114 membrane presents a high performance for fluoride removal at an intermediate operating pressure (10 bar) for both the Bg and Pc samples. Although satisfactory results were obtained regarding the fluoride rejection, the permeate fluxes were lower than those obtained with the SPR 10113 membrane. It can be asserted that, in general, the data obtained in this work are in agreement with the data from the literature. Considering all the variables, NF90, NF9, NF-1, and SPR 10114 membranes provide the best performances.
3.5. Total Dissolved Solid (TDS) Rejection
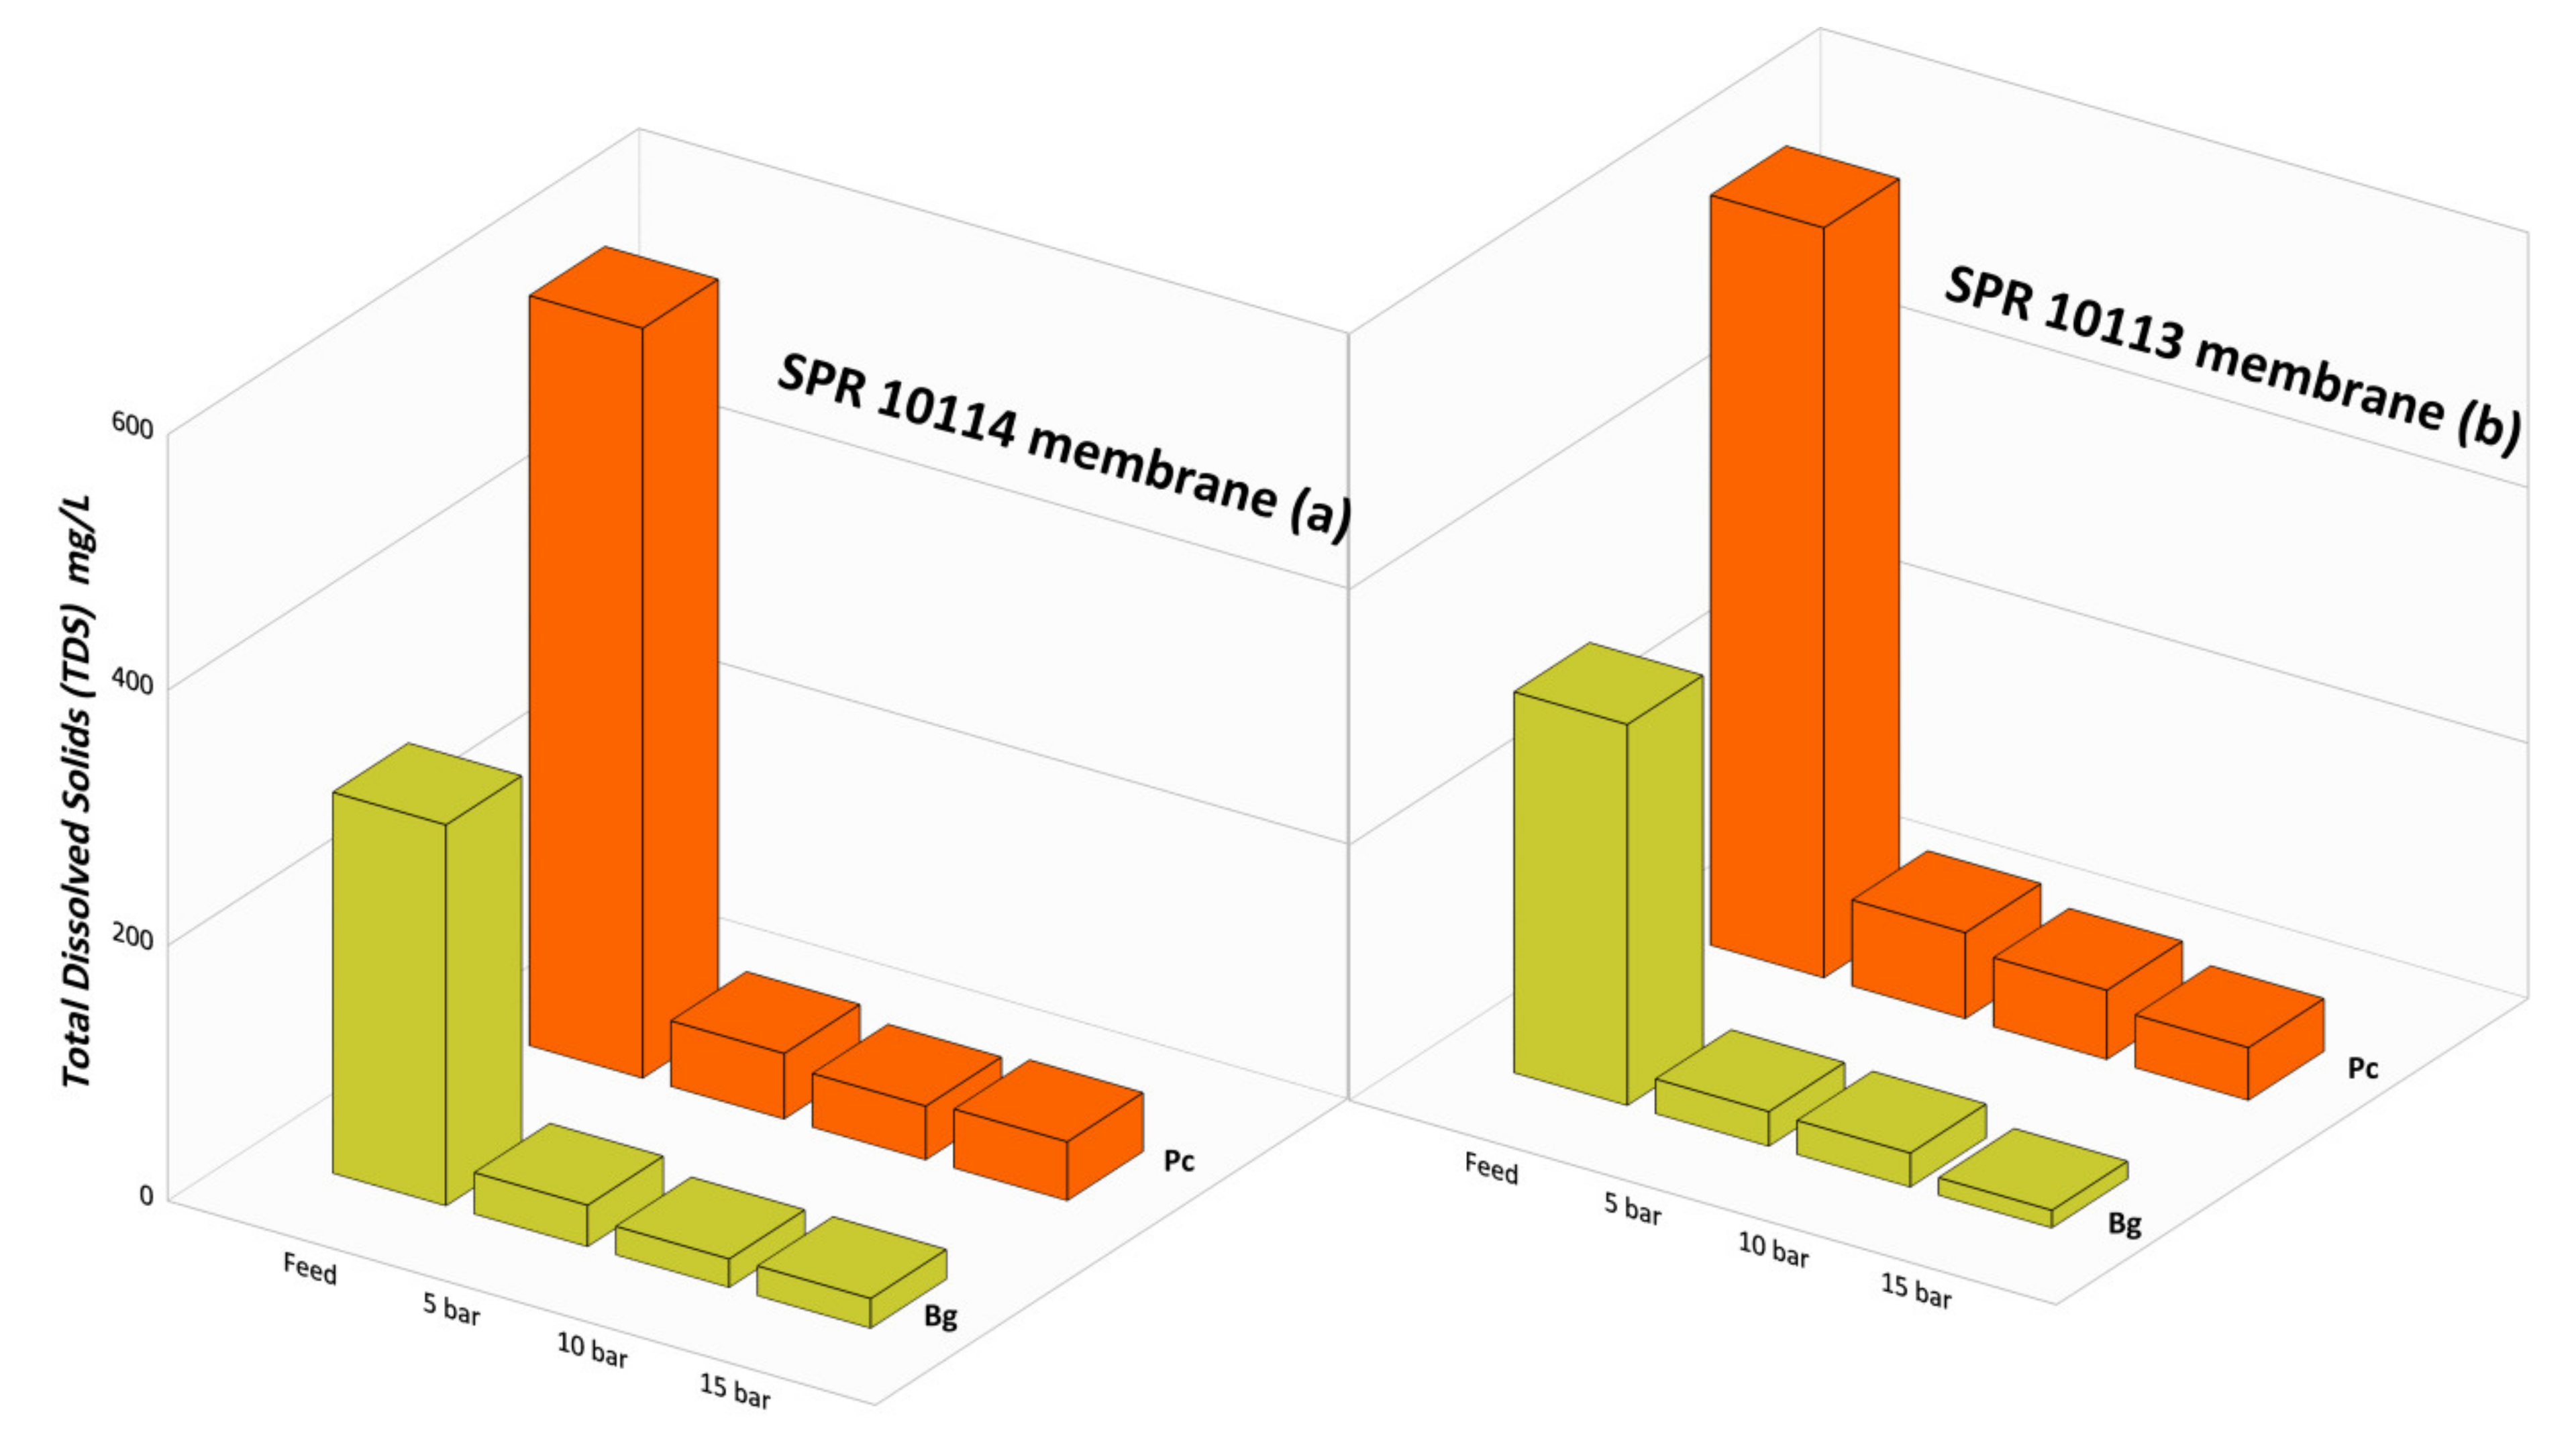
During the NF treatments, the main cations and anions (Na+, K+, Mg2+, Ca2+, F−, Cl−, and SO42−) are rejected differently. Generally, divalent ions are rejected more than monovalent ions. It should be noted that in the considered waters, the monovalent ions prevail with respect to the divalent ones (see Table 2). Indeed, the concentrations of Ca and Mg are very low in both samples, whereas SO4 is the most abundant bivalent ion. The main monovalent ions, in addition to fluoride, are Na+ and HCO3−. The rejections of SO4 reached 99% by using both the SPR 10113 and SPR 10114 membranes. The data obtained by using the SPR 10114 membrane showed rejections ranging from 91% to 95% and from 88% to 92% for the Na and HCO3 ions, respectively. For the same ions, the rejection percentage was similar when the 10113 membrane was used. Indeed, the obtained data showed rejections ranging from 88% to 96% and from 88% to 95% for the Na and HCO3 ions, respectively. Figure 7 shows the total dissolved solid (TDS) content in the permeates (mg/L) produced by the SPR 10113 and SPR 10114 membranes at different TMPs, considering the two tested samples, Bg and Pc.
For both membranes, the rejections increased with TMP. The TDS values in the permeates obtained with the SPR 10113 membrane were higher than the SPR 10114 membrane. The results prove that after all the performed tests, a low ionic load was maintained in the solution. At intermediate TMP (10 bar), the TDS content in the permeates was equal to 22 mg/L and 42 mg/L, for the Bg and Pc samples, respectively.
This means that the produced water is strongly demineralized and, therefore, a re-mineralization process is needed to be suitable for drinking purposes [55]. Indeed, a long-term consumption of demineralized water could cause potential adverse health effects [56,57]. Nevertheless, the produced water can be used without any further need for re-mineralizing for agricultural or other purposes.
4. Concluding Remarks
Two water samples, named Pc and Bg, coming from deep crystalline aquifers in the Calabria region, were studied and the performed detailed geochemical characterization provided essential information about the water chemistry and the possible causes of their fluoride pollution. The samples can be classified as belonging to the F-enriched Na-HCO3 water type. Although a dedicated geochemical modeling is needed to define the causes of F− enrichment in groundwaters, the present study showed that the concomitant occurrence of fluorite dissolution in different amounts, distinct time periods of interaction, leaching of fluoride from other silicate minerals, and saturation with respect to carbonate minerals are the causes of the different F concentration levels found for the studied groundwaters.
Based on the acquired information, two commercial NF-membrane types (namely, SPR 10114 and SPR 10113) were used to treat the fluoride contaminated groundwaters. The initial fluoride concentrations were 30 mg/L and 8.9 mg/L for the Pc and Bg samples, respectively. Although NF membranes are generally used to remove divalent ions, the experiments showed that NF is a valid option to remove fluoride from contaminated groundwaters because the F− ions are strongly hydrated in water and, thus, their transfer across the NF membranes is more difficult with respect to the other monovalent ions present. The SPR 10114 membrane was able to produce permeates with F contents lower than 1.5 mg/L for both treated waters. However, when the Pc sample was treated using the SPR 10113 membrane, the fluoride content remained above the threshold value established by the WHO. Both membranes provide permeates characterized by a low ionic load, which are not suitable for drinking water for long-term consumption. Nevertheless, the produced waters can be used without any further re-mineralizing for agricultural or other purposes.
The results obtained provide useful data about the performance of NF membranes not used so far to treat F-rich groundwaters, and the outcomes are important for further in-depth scientific studies and future real in situ applications in similar geologic settings.
Author Contributions
I.F.: investigation, methodology, data processing and validation, writing—original draft preparation, writing—review and editing. C.A.: investigation, conceptualization, supervision, data curation, writing—original draft preparation, writing—review and editing. A.C.: conceptualization, methodology, supervision, writing—original draft preparation, writing—review and editing R.D.R.: conceptualization, supervision. A.F.: conceptualization, methodology, supervision, writing—original draft preparation, writing—review and editing. S.V.: supervision, writing—original draft preparation. All authors have read and agreed to the published version of the manuscript.
Funding
This research received no external funding.
Institutional Review Board Statement
Not applicable.
Informed Consent Statement
Not applicable.
Data Availability Statement
The manuscript is a data self-contained article, whose results were obtained from the laboratory analysis, and the entire data is presented within the article. However, if any additional information is required, these are available from the corresponding authors upon request to the following e-mails: [email protected]; [email protected].
Acknowledgments
The authors are grateful to the editor for the editorial handling of the manuscript, as well as to the anonymous reviewers for their constructive comments.
Conflicts of Interest
The authors declare no conflict of interest.
References
- Edmunds, W.M.; Smedley, P.L. Fluoride in natural waters. In Essentials of Medical Geology; Springer: Dordrecht, The Netherlands, 2013; pp. 311–336. [Google Scholar]
- World Health Organization. Guidelines for Drinking-Water Quality: Fourth Edition Incorporating First Addendum, 4th ed + 1st add. 2017. Available online: https://apps.who.int/iris/handle/10665/254637 (accessed on 4 May 2021).
- Chae, G.T.; Yun, S.T.; Mayer, B.; Kim, K.H.; Kim, S.Y.; Kwon, J.S.; Kim, K.; Koh, Y.K. Fluorine geochemistry in bedrock groundwater of South Korea. Sci. Total Environ. 2007, 385, 272–283. [Google Scholar] [CrossRef] [PubMed]
- Fawell, J.; Bailey, K.; Chilton, J.; Dahi, E.; Magara, Y. Fluoride in Drinking-Water; IWA Publishing: London, UK, 2006. [Google Scholar]
- Nordstrom, D.K.; Jenne, E.A. Fluorite solubility equilibria in selected geothermal waters. Geochim. Cosmochim. Acta 1997, 41, 175–188. [Google Scholar] [CrossRef]
- Appelo, C.A.J.; Postma, D. Geochemistry, Groundwater and Pollution; CRC Press: Boca Raton, FL, USA, 2005. [Google Scholar]
- Tossou, Y.Y.J.; Orban, P.; Gesels, J.; Otten, J.; Yessoufou, S.; Boukari, M.; Brouyère, S. Hydrogeochemical mechanisms governing the mineralization and elevated fluoride F-contents in Precambrian crystalline aquifer groundwater in central Benin, Western Africa. Environ. Earth Sci. 2017, 76, 1–14. [Google Scholar] [CrossRef]
- Apambire, W.B.; Boyle, D.R.; Michel, F.A. Geochemistry, genesis, and health implications of fluoriferous groundwaters in the upper regions of Ghana. Environ. Geol. 1997, 33, 13–24. [Google Scholar] [CrossRef]
- Fuoco, I.; Figoli, A.; Criscuoli, A.; Brozzo, G.; De Rosa, R.; Gabriele, B.; Apollaro, C. Geochemical modeling of chromium release in natural waters and treatment by RO/NF membrane processes. Chemosphere 2020, 254, 126696. [Google Scholar] [CrossRef] [PubMed]
- Figoli, A.; Fuoco, I.; Apollaro, C.; Chabane, M.; Mancuso, R.; Gabriele, B.; De Rosa, R.; Vespasiano, G.; Barca, D.; Criscuoli, A. Arsenic-contaminated groundwaters remediation by nanofiltration. Sep. Purif. Technol. 2020, 238, 116461. [Google Scholar] [CrossRef]
- Velizarov, S.; Crespo, J.G.; Reis, M.A. Removal of inorganic anions from drinking water supplies by membrane bio/processes. Rev. Environ. Sci. Bio/Technol. 2004, 3, 361–380. [Google Scholar] [CrossRef]
- Kut, K.M.K.; Sarswat, A.; Srivastava, A.; Pittman, C.U., Jr.; Mohan, D. A review of fluoride in african groundwater and local remediation methods. Groundw. Sustain. Dev. 2016, 2, 190–212. [Google Scholar] [CrossRef]
- Velizarov, S.; Oehmen, A.; Reis, M.A.; Crespo, J.G. Electro-membrane Processes for the Removal of Trace Toxic Ions from Water. In Membrane Technologies for Water Treatment: Removal of Toxic Trace Elements with Emphasis on Arsenic, Fluoride and Uranium; CRC Press: Boca Raton, FL, USA, 2016; pp. 73–87. [Google Scholar]
- Figoli, A.; Criscuoli, A. (Eds.) Sustainable Membrane Technology for Water and Wastewater Treatment; Springer: Berlin/Heidelberg, Germany, 2017. [Google Scholar]
- Bey, S.; Criscuoli, A.; Simone, S.; Figoli, A.; Benamor, M.; Drioli, E. Hydrophilic PEEK-WC hollow fibre membrane contactors for chromium (VI) removal. Desalination 2011, 283, 16–24. [Google Scholar] [CrossRef]
- Bouhadjar, S.I.; Kopp, H.; Britsch, P.; Deowan, S.A.; Hoinkis, J.; Bundschuh, J. Solar powered nanofiltration for drinking water production from fluoride-containing groundwater–A pilot study towards developing a sustainable and low-cost treatment plant. J. Environ. Manag. 2019, 231, 1263–1269. [Google Scholar] [CrossRef] [PubMed]
- Shen, J.; Richards, B.S.; Schäfer, A.I. Renewable energy powered membrane technology: Case study of St. Dorcas borehole in Tanzania demonstrating fluoride removal via nanofiltration/reverse osmosis. Sep. Purif. Technol. 2016, 170, 445–452. [Google Scholar] [CrossRef]
- Shen, J.; Schäfer, A.I. Factors affecting fluoride and natural organic matter (NOM) removal from natural waters in Tanzania by nanofiltration/reverse osmosis. Sci. Total Environ. 2015, 527, 520–529. [Google Scholar] [CrossRef]
- Nasr, A.B.; Charcosset, C.; Amar, R.B.; Walha, K. Defluoridation of water by nanofiltration. J. Fluor. Chem. 2013, 150, 92–97. [Google Scholar] [CrossRef]
- Chakrabortty, S.; Roy, M.; Pal, P. Removal of fluoride from contaminated groundwater by cross flow nanofiltration: Transport modeling and economic evaluation. Desalination 2013, 313, 115–124. [Google Scholar] [CrossRef]
- Tahaikt, M.; Haddou, A.A.; El Habbani, R.; Amor, Z.; Elhannouni, F.; Taky, M.; Kharif, M.; Boughriba, A.; Hafsi, M.; Elmidaoui, A. Comparison of the performances of three commercial membranes in fluoride removal by nanofiltration. Continuous operations. Desalination 2008, 225, 209–219. [Google Scholar] [CrossRef]
- Dolar, D.; Košutić, K.; Vučić, B. RO/NF treatment of wastewater from fertilizer factory—Removal of fluoride and phosphate. Desalination 2011, 265, 237–241. [Google Scholar] [CrossRef]
- Paugam, L.; Diawara, C.K.; Schlumpf, J.P.; Jaouen, P.; Quéméneur, F. Transfer of monovalent anions and nitrates especially through nanofiltration membranes in brackish water conditions. Sep. Purif. Technol. 2004, 40, 237–242. [Google Scholar] [CrossRef]
- Van Dijk, J.P.; Bello, M.; Brancaleoni, G.P.; Cantarella, G.; Costa, V.; Frixa, A.; Golfetto, F.; Merlini, S.; Riva, M.; Torricelli, S.; et al. A regional structural model for the northern sector of the Calabrian Arc (southern Italy). Tectonophysics 2000, 324, 267–320. [Google Scholar] [CrossRef]
- Ietto, F.; Perri, F.; Cella, F. Geotechnical and landslide aspects in weathered granitoid rock masses (Serre Massif, southern Calabria, Italy). Catena 2016, 145, 301–315. [Google Scholar] [CrossRef]
- Angì, G.; Cirrincione, R.; Fazio, E.; Fiannacca, P.; Ortolano, G.; Pezzino, A. Metamorphic evolution of preserved Hercynian crustal section in the Serre Massif (Calabria–Peloritani Orogen, southern Italy). Lithos 2010, 115, 237–262. [Google Scholar] [CrossRef]
- Apollaro, C.; Accornero, M.; Marini, L.; Barca, D.; De Rosa, R. The impact of dolomite and plagioclase weathering on the chemistry of shallow groundwaters circulating in a granodiorite-dominated catchment of the Sila Massif (Calabria, Southern Italy). Appl. Geochem. 2009, 24, 957–979. [Google Scholar] [CrossRef]
- Perri, F.; Scarciglia, F.; Apollaro, C.; Marini, L. Characterization of granitoid profiles in the Sila Massif (Calabria, southern Italy) and reconstruction of weathering processes by mineralogy, chemistry, and reaction path modeling. J. Soils Sediments 2015, 15, 1351–1372. [Google Scholar] [CrossRef]
- Bertolani, M.; Foggia, F. La formazione Kinzigitica della Sila Greca. Boll. Soc. Geol. It. 1975, 94, 329–345. [Google Scholar]
- Allocca, V.; Celico, F.; Celico, P.; De Vita, P.; Fabbrocino, S.; Mattia, S.; Monacelli, G.; Musilli, I.; Piscopo, V.; Scalise, A.R.; et al. Note Illustrative della Carta Idrogeologica dell’Italia Meridionale; Istituto Poligrafico e Zecca dello Stato: Rome, Italy, 2007; p. 211. ISBN 88-448-0223-6. [Google Scholar]
- Apollaro, C.; Tripodi, V.; Vespasiano, G.; De Rosa, R.; Dotsika, E.; Fuoco, I.; Critelli, S.; Muto, F. Chemical, isotopic and geotectonic relations of the warm and cold waters of the Galatro and Antonimina thermal areas, southern Calabria, Italy. Mar. Pet. Geol. 2019, 109, 469–483. [Google Scholar] [CrossRef]
- Apollaro, C.; Buccianti, A.; Vespasiano, G.; Vardè, M.; Fuoco, I.; Barca, D.; Bloise, A.; Miriello, D.; Cofone, F.; Servidio, A.; et al. Comparative geochemical study between the tap waters and the bottled mineral waters in Calabria (Southern Italy) by compositional data analysis (CoDA) developments. Appl. Geochem. 2019, 107, 19–33. [Google Scholar] [CrossRef]
- Apollaro, C.; Fuoco, I.; Bloise, L.; Calabrese, E.; Marini, L.; Vespasiano, G.; Muto, F. Geochemical Modeling of Water-Rock Interaction Processes in the Pollino National Park. Geofluids 2021, 2021. [Google Scholar] [CrossRef]
- Apollaro, C.; Perri, F.; Le Pera, E.; Fuoco, I.; Critelli, T. Chemical and minero-petrographical changes on granulite rocks affected by weathering processes. Front. Earth Sci. 2019, 13, 247–261. [Google Scholar] [CrossRef]
- Apollaro, C.; Caracausi, A.; Paternoster, M.; Randazzo, P.; Aiuppa, A.; De Rosa, R.; Fuoco, I.; Mongelli, G.; Muto, F.; Vanni, E.; et al. Fluid geochemistry in a low-enthalpy geothermal field along a sector of southern Apennines chain (Italy). J. Geochem. Explor. 2020, 219, 106618. [Google Scholar] [CrossRef]
- Apollaro, C.; Fuoco, I.; Brozzo, G.; De Rosa, R. Release and fate of Cr (VI) in the ophiolitic aquifers of Italy: The role of Fe (III) as a potential oxidant of Cr (III) supported by reaction path modelling. Sci. Total Environ. 2019, 660, 1459–1471. [Google Scholar] [CrossRef] [PubMed]
- Apollaro, C.; Vespasiano, G.; Muto, F.; De Rosa, R.; Barca, D.; Marini, L. Use of mean residence time of water, flowrate, and equilibrium temperature indicated by water geothermometers to rank geothermal resources. Application to the thermal water circuits of Northern Calabria. J. Volcanol. Geotherm. Res. 2016, 328, 147–158. [Google Scholar] [CrossRef]
- Parkhurst, D.L.; Appelo, C.A.J. Description of Input and Examples for PHREEQC Version 3—A Computer Program for Speciation, Batch-Reaction, One-Dimensional Transport, and Inverse Geochemical Calculations: U.S. Geological Survey Techniques and Methods; USGS: Reston, VA, USA, 2013; Book 6; Chapter A43; p. 497. [Google Scholar]
- Charlton, S.R.; Parkhurst, D.L. PhreeqcI-A Graphical User Interface to the Geochemical Model PHREEQC; Fact Sheet FS-031-02; U.S. Geological Survey: Reston, VA, USA, 2002; 2p. [CrossRef]
- Kumar, M.; Goswami, R.; Patel, A.K.; Srivastava, M.; Das, N. Scenario, perspectives and mechanism of arsenic and fluoride co-occurrence in the groundwater: A review. Chemosphere 2020, 249, 126126. [Google Scholar] [CrossRef] [PubMed]
- Deer, W.A.; Howie, R.A.; Zussman, J. An Introduction to the Rock- Forming Minerals, 3rd ed.; The Mineralogical Society: London, UK, 2013; 498p. [Google Scholar]
- Bonardi, G.; De Vivo, B.; Giunta, G.; Lima, A.; Perrone, V.; Zuppetta, A. Mineralizzazioni dell’Arco Calabro Peloritano. Ipotesi Genetiche e Quadro Evolutivo. Boll. Soc. Geol. It. 1982, 141–155. [Google Scholar]
- Zucchetti, S. I Giacimenti di Fluorite dell’area Peninsulare Italiana. Atti della Giornata di Studio su «LE FLUORITI ITALIANE» Torino. 1972. Available online: https://www.researchgate.net/profile/Stefano-Zucchetti/publication/303854674 (accessed on 4 May 2021).
- Castaldo, G. Memoria Illustrativa della Carta Mineraria D’italia. SCALA 1: 1000000. Carta Geologica d’Italia; Servizio Geologico D’ Italia: Roma, Italy, 1975; Volume XIV. [Google Scholar]
- Chae, G.T.; Yun, S.T.; Kim, K.; Mayer, B. Hydrogeochemistry of sodium-bicarbonate type bedrock groundwater in the Pocheon spa area, South Korea: Water–rock interaction and hydrologic mixing. J. Hydrol. 2006, 321, 326–343. [Google Scholar] [CrossRef]
- Chae, G.T.; Yun, S.T.; Kwon, M.J.; Kim, Y.S.; Mayer, B. Batch dissolution of granite and biotite in water: Implication for fluorine geochemistry in groundwater. Geochem. J. 2006, 40, 95–102. [Google Scholar] [CrossRef] [Green Version]
- Critelli, T.; Marini, L.; Schott, J.; Mavromatis, V.; Apollaro, C.; Rinder, T.; De Rosa, R.; Oelkers, E.H. Dissolution rates of actinolite and chlorite from a whole-rock experimental study of metabasalt dissolution from 2≤ pH≤ 12 at 25 C. Chem. Geol. 2014, 390, 100–108. [Google Scholar] [CrossRef]
- Gogoi, R.R.; Khanikar, L.; Gogoi, J.; Neog, N.; Deka, D.J.; Sarma, K.P. Geochemical sources, hydrogeochemical behaviour of fluoride release and its health risk assessment in some fluorosis endemic areas of the Brahmaputra valley of Assam, India. Appl. Geochem. 2021, 127, 104911. [Google Scholar] [CrossRef]
- Shen, J.; Jeihanipour, A.; Richards, B.S.; Schäfer, A.I. Renewable energy powered membrane technology: Experimental investigation of system performance with variable module size and fluctuating energy. Sep. Purif. Technol. 2019, 221, 64–73. [Google Scholar] [CrossRef]
- Owusu-Agyeman, I.; Reinwald, M.; Jeihanipour, A.; Schäfer, A.I. Removal of fluoride and natural organic matter from natural tropical brackish waters by nanofiltration/reverse osmosis with varying water chemistry. Chemosphere 2019, 217, 47–58. [Google Scholar] [CrossRef]
- Owusu-Agyeman, I.; Shen, J.; Schäfer, A.I. Renewable energy powered membrane technology: Impact of pH and ionic strength on fluoride and natural organic matter removal. Sci. Total Environ. 2018, 621, 138–147. [Google Scholar] [CrossRef] [PubMed]
- Jeihanipour, A.; Shen, J.; Abbt-Braun, G.; Huber, S.A.; Mkongo, G.; Schäfer, A.I. Seasonal variation of organic matter characteristics and fluoride concentration in the Maji ya Chai River (Tanzania): Impact on treatability by nanofiltration/reverse osmosis. Sci. Total Environ. 2018, 637, 1209–1220. [Google Scholar] [CrossRef] [PubMed]
- Pontié, M.; Dach, H.; Leparc, J.; Hafsi, M.; Lhassani, A. Novel approach combining physico-chemical characterizations and mass transfer modelling of nanofiltration and low pressure reverse osmosis membranes for brackish water desalination intensification. Desalination 2008, 221, 174–191. [Google Scholar] [CrossRef]
- Shen, J.; Mkongo, G.; Abbt-Braun, G.; Ceppi, S.L.; Richards, B.S.; Schäfer, A.I. Renewable energy powered membrane technology: Fluoride removal in a rural community in northern Tanzania. Sep. Purif. Technol. 2015, 149, 349–361. [Google Scholar] [CrossRef]
- Van der Aa, M. Classification of mineral water types and comparison with drinking water standards. Environ. Geol. 2003, 44, 554–563. [Google Scholar] [CrossRef] [Green Version]
- Verma, K.C.; Kushwaha, A.S. Demineralization of drinking water: Is it prudent? Med. J. Armed Forces Ind. 2014, 70, 377–379. [Google Scholar] [CrossRef] [PubMed] [Green Version]
- Kozisek, F. Health risks from drinking demineralised water. Nutr. Drink. Water 2005, 1, 148–163. [Google Scholar]
Figure 2.
Triangular diagrams of the main cationic and anionic constituents prepared from concentrations in equivalent units.
Figure 2.
Triangular diagrams of the main cationic and anionic constituents prepared from concentrations in equivalent units.

Figure 3.
(a) Correlation diagram of Na vs. Ca + K + Mg for the studied samples, also reporting selected iso-salinity lines and (b) plot of activity of Ca vs. activity of F in which three geochemical pathways are reported, as well as the fluorite solubility line [3].
Figure 3.
(a) Correlation diagram of Na vs. Ca + K + Mg for the studied samples, also reporting selected iso-salinity lines and (b) plot of activity of Ca vs. activity of F in which three geochemical pathways are reported, as well as the fluorite solubility line [3].

Figure 4.
Volumetric permeate flux as a function of the applied trans-membrane pressure for (a) the SPR 10113 membrane and (b) the SPR 101014 membrane.
Figure 4.
Volumetric permeate flux as a function of the applied trans-membrane pressure for (a) the SPR 10113 membrane and (b) the SPR 101014 membrane.

Figure 5.
Effects of TMPs on fluoride rejection in the (a) Bg and (b) Pc permeates produced by using the SPR 10113 and SPR 10114 membranes.
Figure 5.
Effects of TMPs on fluoride rejection in the (a) Bg and (b) Pc permeates produced by using the SPR 10113 and SPR 10114 membranes.

Figure 6.
The effect of TMP on the fluoride concentration in the permeates obtained by using the membranes SPR 10113 and SPR 10114 for (a) the Bg and (b) the Pc samples, respectively.
Figure 6.
The effect of TMP on the fluoride concentration in the permeates obtained by using the membranes SPR 10113 and SPR 10114 for (a) the Bg and (b) the Pc samples, respectively.

Figure 7.
TDS content in the feed and permeates for the (a) SPR 10114 and (b) SPR 10113 membranes.


Table 1.
Main NF membranes characteristics used for the treatment of F-contaminated waters.
| SPR 10113 | SRP 10114 | |
|---|---|---|
| Type | NF | NF |
| Materials | Polyamide-TFC | Polyamide-TFC |
| Manufacturer | SEPRA | SEPRA |
| Configuration | flat plate | flat plate |
| MWCO | 100–250 Da | 150–300 Da |
| MgSO4 rejection | 99.50% | 99% |
| NaCl rejection | 55% | 40% |
| pH operating range | 3–10 | 3–10 |
Table 2.
Physical–chemical parameters of the studied groundwaters.
| Sample | pH | T | EC | Eh | SiO2 | Ca | Mg | K | Na | Cl | SO4 | HCO3 | NH4 | F |
|---|---|---|---|---|---|---|---|---|---|---|---|---|---|---|
| Sorensen’s Scale | °C | µS/cm | mV | mg/L | mg/L | mg/L | mg/L | mg/L | mg/L | mg/L | mg/L | mg/L | mg/L | |
| Pc | 9.6 | 20.1 | 1059.0 | −119.9 | 11.25 | 5.30 | 2.20 | 1.65 | 174.55 | 23.35 | 75.61 | 259.34 | 3.80 | 30.12 |
| Bg | 10.1 | 21.4 | 363.5 | −214.6 | 23.30 | 2.39 | 0.26 | 0.99 | 76.31 | 8.66 | 9.08 | 168.58 | - | 8.90 |
Table 3.
Comparative table on the treatment of F-contaminated groundwaters using NF membrane processes.
Table 3.
Comparative table on the treatment of F-contaminated groundwaters using NF membrane processes.
| Membrane Type | Water Sample | F- Concentration Before Treatment | Applied TMP | Flux | F Rejection | F Concentration After Treatment | Cond | Ref. |
|---|---|---|---|---|---|---|---|---|
| mg/L | bar | L/m2h | % | mg/L | µS/cm | |||
| NF5 | Louza 2 | 3.39 | 8 | 91 a | 57.2 | 1.45 | - | [19] |
| NF9 | Louza 2 | 3.39 | 8 | 57.2 a | 88.8 | 0.38 | - | [19] |
| NF 90 4040 | BGW | 55 b | 6 | 29 *b | 98 b | 0.64 b | 2990 b | [16] |
| NF-1 | GW Birbhum | 20 | 9.8 | 106 | 95 | 1 * | 671 | [20] |
| NF-2 | GW Birbhum | 20 | 9.8 | 124 | 78 | 4.4 * | 671 | [20] |
| NF-20 | GW Birbhum | 20 | 9.8 | 116 | 86 | 2.8 * | 671 | [20] |
| NF-90 | St. Dorcas borehole | 49.1 b | 4.8 | 20.8 | 98.2 | 0.9 | 3935 b | [17] |
| NF-270 | St. Dorcas borehole | 49.1 b | 4.8 | 29.8 | 71.9 | 14.2 | 3935 b | [17] |
| NF270 | feed water | 2.32 | 10 | - | 82 * | 0.4 | 1492 | [21] |
| TR60 | feed water | 2.32 | 10 | - | 74 * | 0.6 | 1492 | [21] |
| NF90 | feed water | 2.32 | 10 | - | 98 * | 0.05 | 1492 | [21] |
| SPR 10113 | Bg | 8.9 | 10 | 42 | 94.6 | 0.5 | 364 | This work |
| SPR 10114 | Bg | 8.9 | 10 | 27 | 94.2 | 0.5 | 364 | This work |
| SPR 10113 | Pc | 30.1 | 10 | 41 | 94.9 | 1.5 | 1059 | This work |
| SPR 10114 | Pc | 30.1 | 10 | 26 | 96 | 1.1 | 1059 | This work |
* Calculated value on the basis of the available data in the reference work. a Referred to a model solution. b Average value.
Publisher’s Note: MDPI stays neutral with regard to jurisdictional claims in published maps and institutional affiliations. |
© 2021 by the authors. Licensee MDPI, Basel, Switzerland. This article is an open access article distributed under the terms and conditions of the Creative Commons Attribution (CC BY) license (https://creativecommons.org/licenses/by/4.0/).
Share and Cite
MDPI and ACS Style
Fuoco, I.; Apollaro, C.; Criscuoli, A.; De Rosa, R.; Velizarov, S.; Figoli, A. Fluoride Polluted Groundwaters in Calabria Region (Southern Italy): Natural Source and Remediation. Water 2021, 13, 1626. https://doi.org/10.3390/w13121626
AMA Style
Fuoco I, Apollaro C, Criscuoli A, De Rosa R, Velizarov S, Figoli A. Fluoride Polluted Groundwaters in Calabria Region (Southern Italy): Natural Source and Remediation. Water. 2021; 13(12):1626. https://doi.org/10.3390/w13121626
Chicago/Turabian StyleFuoco, Ilaria, Carmine Apollaro, Alessandra Criscuoli, Rosanna De Rosa, Svetlozar Velizarov, and Alberto Figoli. 2021. "Fluoride Polluted Groundwaters in Calabria Region (Southern Italy): Natural Source and Remediation" Water 13, no. 12: 1626. https://doi.org/10.3390/w13121626
Note that from the first issue of 2016, this journal uses article numbers instead of page numbers. See further details here.