
Land-Use/-Cover Changes and Their Effect on Soil Erosion and River Suspended Sediment Load in Different Landscape Zones of European Russia during 1970–2017


1
Institute of Geology and Petroleum Technologies, Kazan Federal University, Kremlyovskaya Str. 18, 420008 Kazan, Russia
2
Federal and Regional Centre for Aerospace and Ground Monitoring of Objects and Natural Resources, Belgorod State National Research University, Pobedy Str. 85, 308015 Belgorod, Russia
Water 2021, 13(12), 1631; https://doi.org/10.3390/w13121631
Submission received: 31 March 2021
/
Revised: 4 June 2021
/
Accepted: 8 June 2021
/
Published: 10 June 2021
(This article belongs to the Special Issue Fluvial Processes and Denudation)
Abstract
:Contemporary trends in cultivated land and their influence on soil/gully erosion and river suspended sediment load were analyzed by various landscape zones within the most populated and agriculturally developed part of European Russia, covering 2,222,390 km2. Based on official statistics from the Russian Federation and the former Soviet Union, this study showed that after the collapse of the Soviet Union in 1991, there was a steady downward trend in cultivated land throughout the study region. From 1970–1987 to 2005–2017, the region lost about 39% of its croplands. Moreover, the most significant relative reduction in cultivated land was noted in the forest zone (south taiga, mixed and broadleaf forests) and the dry steppes and the semi-desert of the Caspian Lowland—about 53% and 65%, respectively. These territories are with climatically risky agriculture and less fertile soils. There was also a widespread reduction in agricultural machinery on croplands and livestock on pastures of the region. A decrease in soil/gully erosion rates over the past decades was also revealed based on state hydrological monitoring data on river suspended sediment load as one of the indicators of the temporal variability of erosion intensity in river basins and the published results of some field research in various parts of the studied landscape zones. The most significant reduction in the intensity of erosion and the load of river suspended sediment was found in European Russia’s forest-steppe zone. This was presumably due to a favorable combination of the above changes in land cover/use and climate change.
1. Introduction
The East European, or Russian, Plain is one of the most extensive plains of the Earth’s landmass and the largest natural geographic region of Europe. The latitudinal zonation of natural landscapes and their human transformation are well manifested in this region. For centuries, fertile soils (mainly chernozems and grey forest soils) in the plain have been intensively cultivated. The expansion of cultivated land was accompanied by significant deforestation in the southern subzone of the forest landscape zone and forest-steppe zone. From the end of the seventeenth century to 1914, the territory of modern European Russia lost almost a third of its natural forests [1]. There were noticeable changes in the depth of soil freezing, soil filtration properties, and in the ratio between surface and underground water runoff from hillslopes during the snowmelt period, mainly March and April, and the warm season, mostly May to October, as a consequence of cultivation and deforestation [1]. All these changes resulted in partial siltation and warm-season drying of the regional network of creeks and small rivers, lakes, and ponds, in changes in river water flow regimes, in accelerating water erosion and aeolian processes within interfluves [1,2,3,4,5]. In the forest and forest-steppe landscape zones, the maximum soil losses occurred after the agrarian reform in the Russian Empire in 1861 [6]. According to [7], the densest network of gullies was formed in the forest-steppe zone owing to agricultural activities. A decrease in the natural fertility of soils and a sharp increase in the volume of erosion products, especially suspended sediment, in rivers have also occurred over the last centuries [3,4,5,7,8,9,10,11,12]. The combination of all these negative processes resulted in a noticeable deterioration of European Russia’s natural environment both in the Russian Empire and later, in the Union of Soviet Socialist Republics, the USSR or Soviet Union [1,3,4].
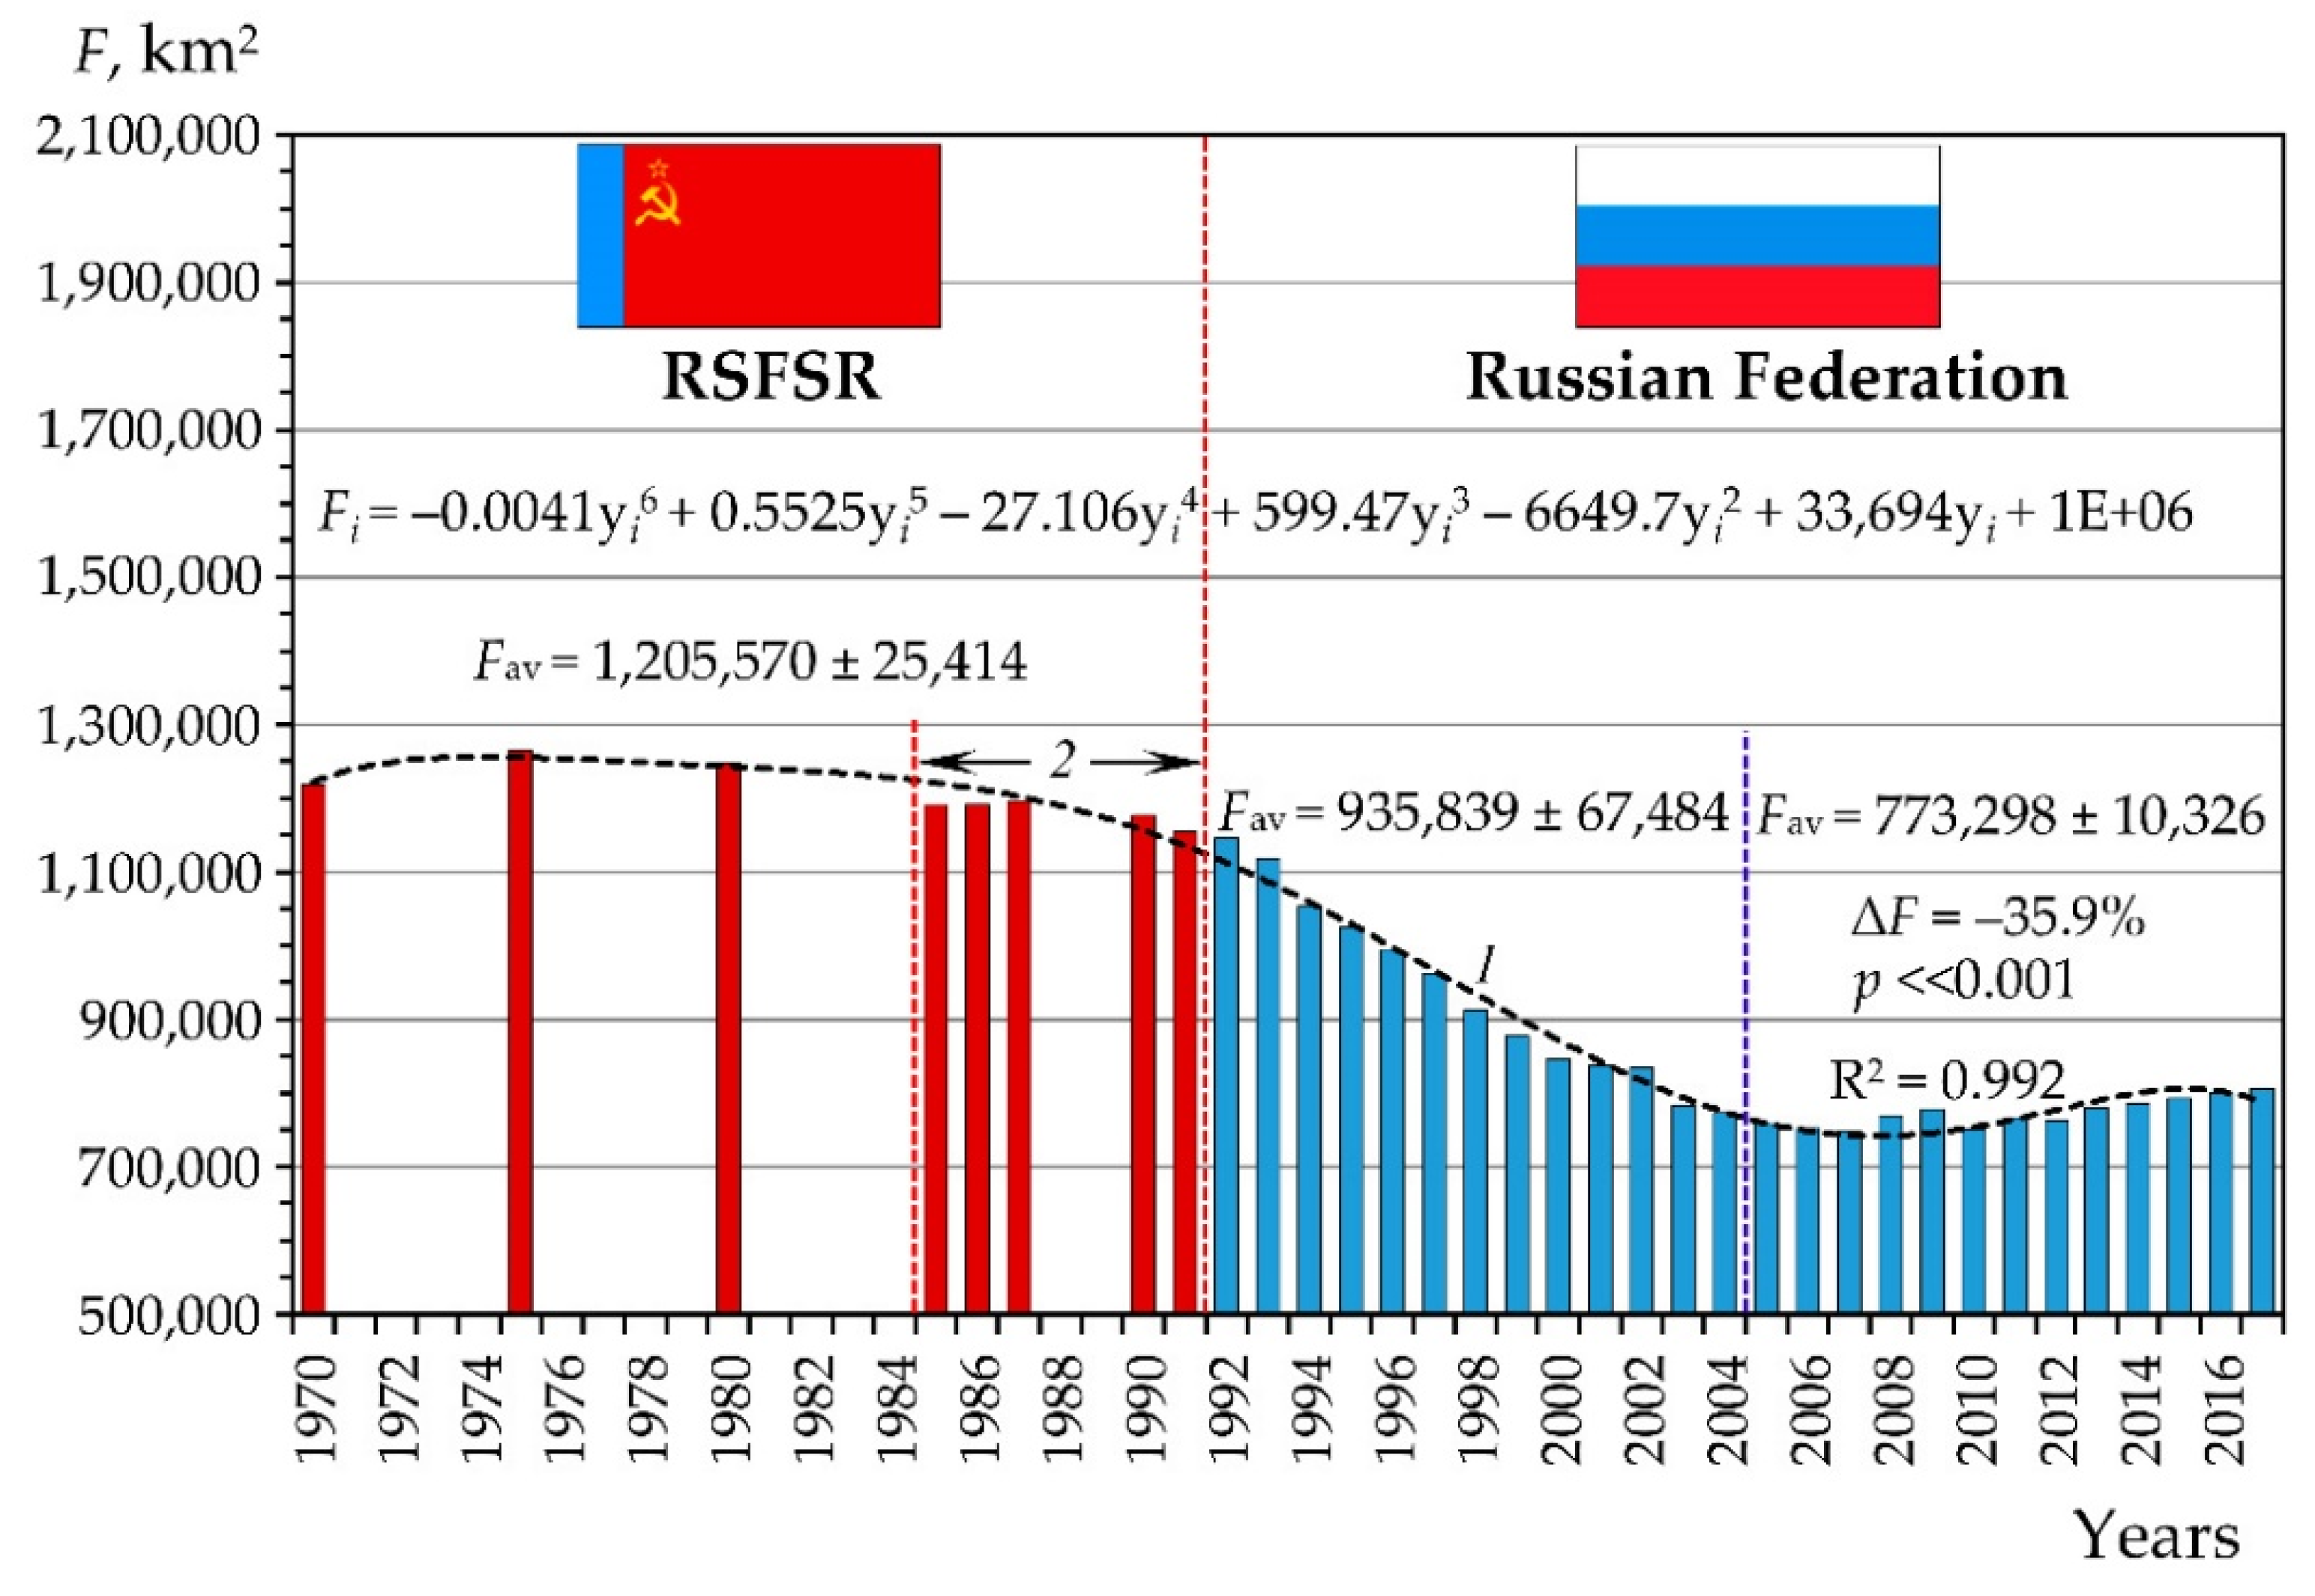
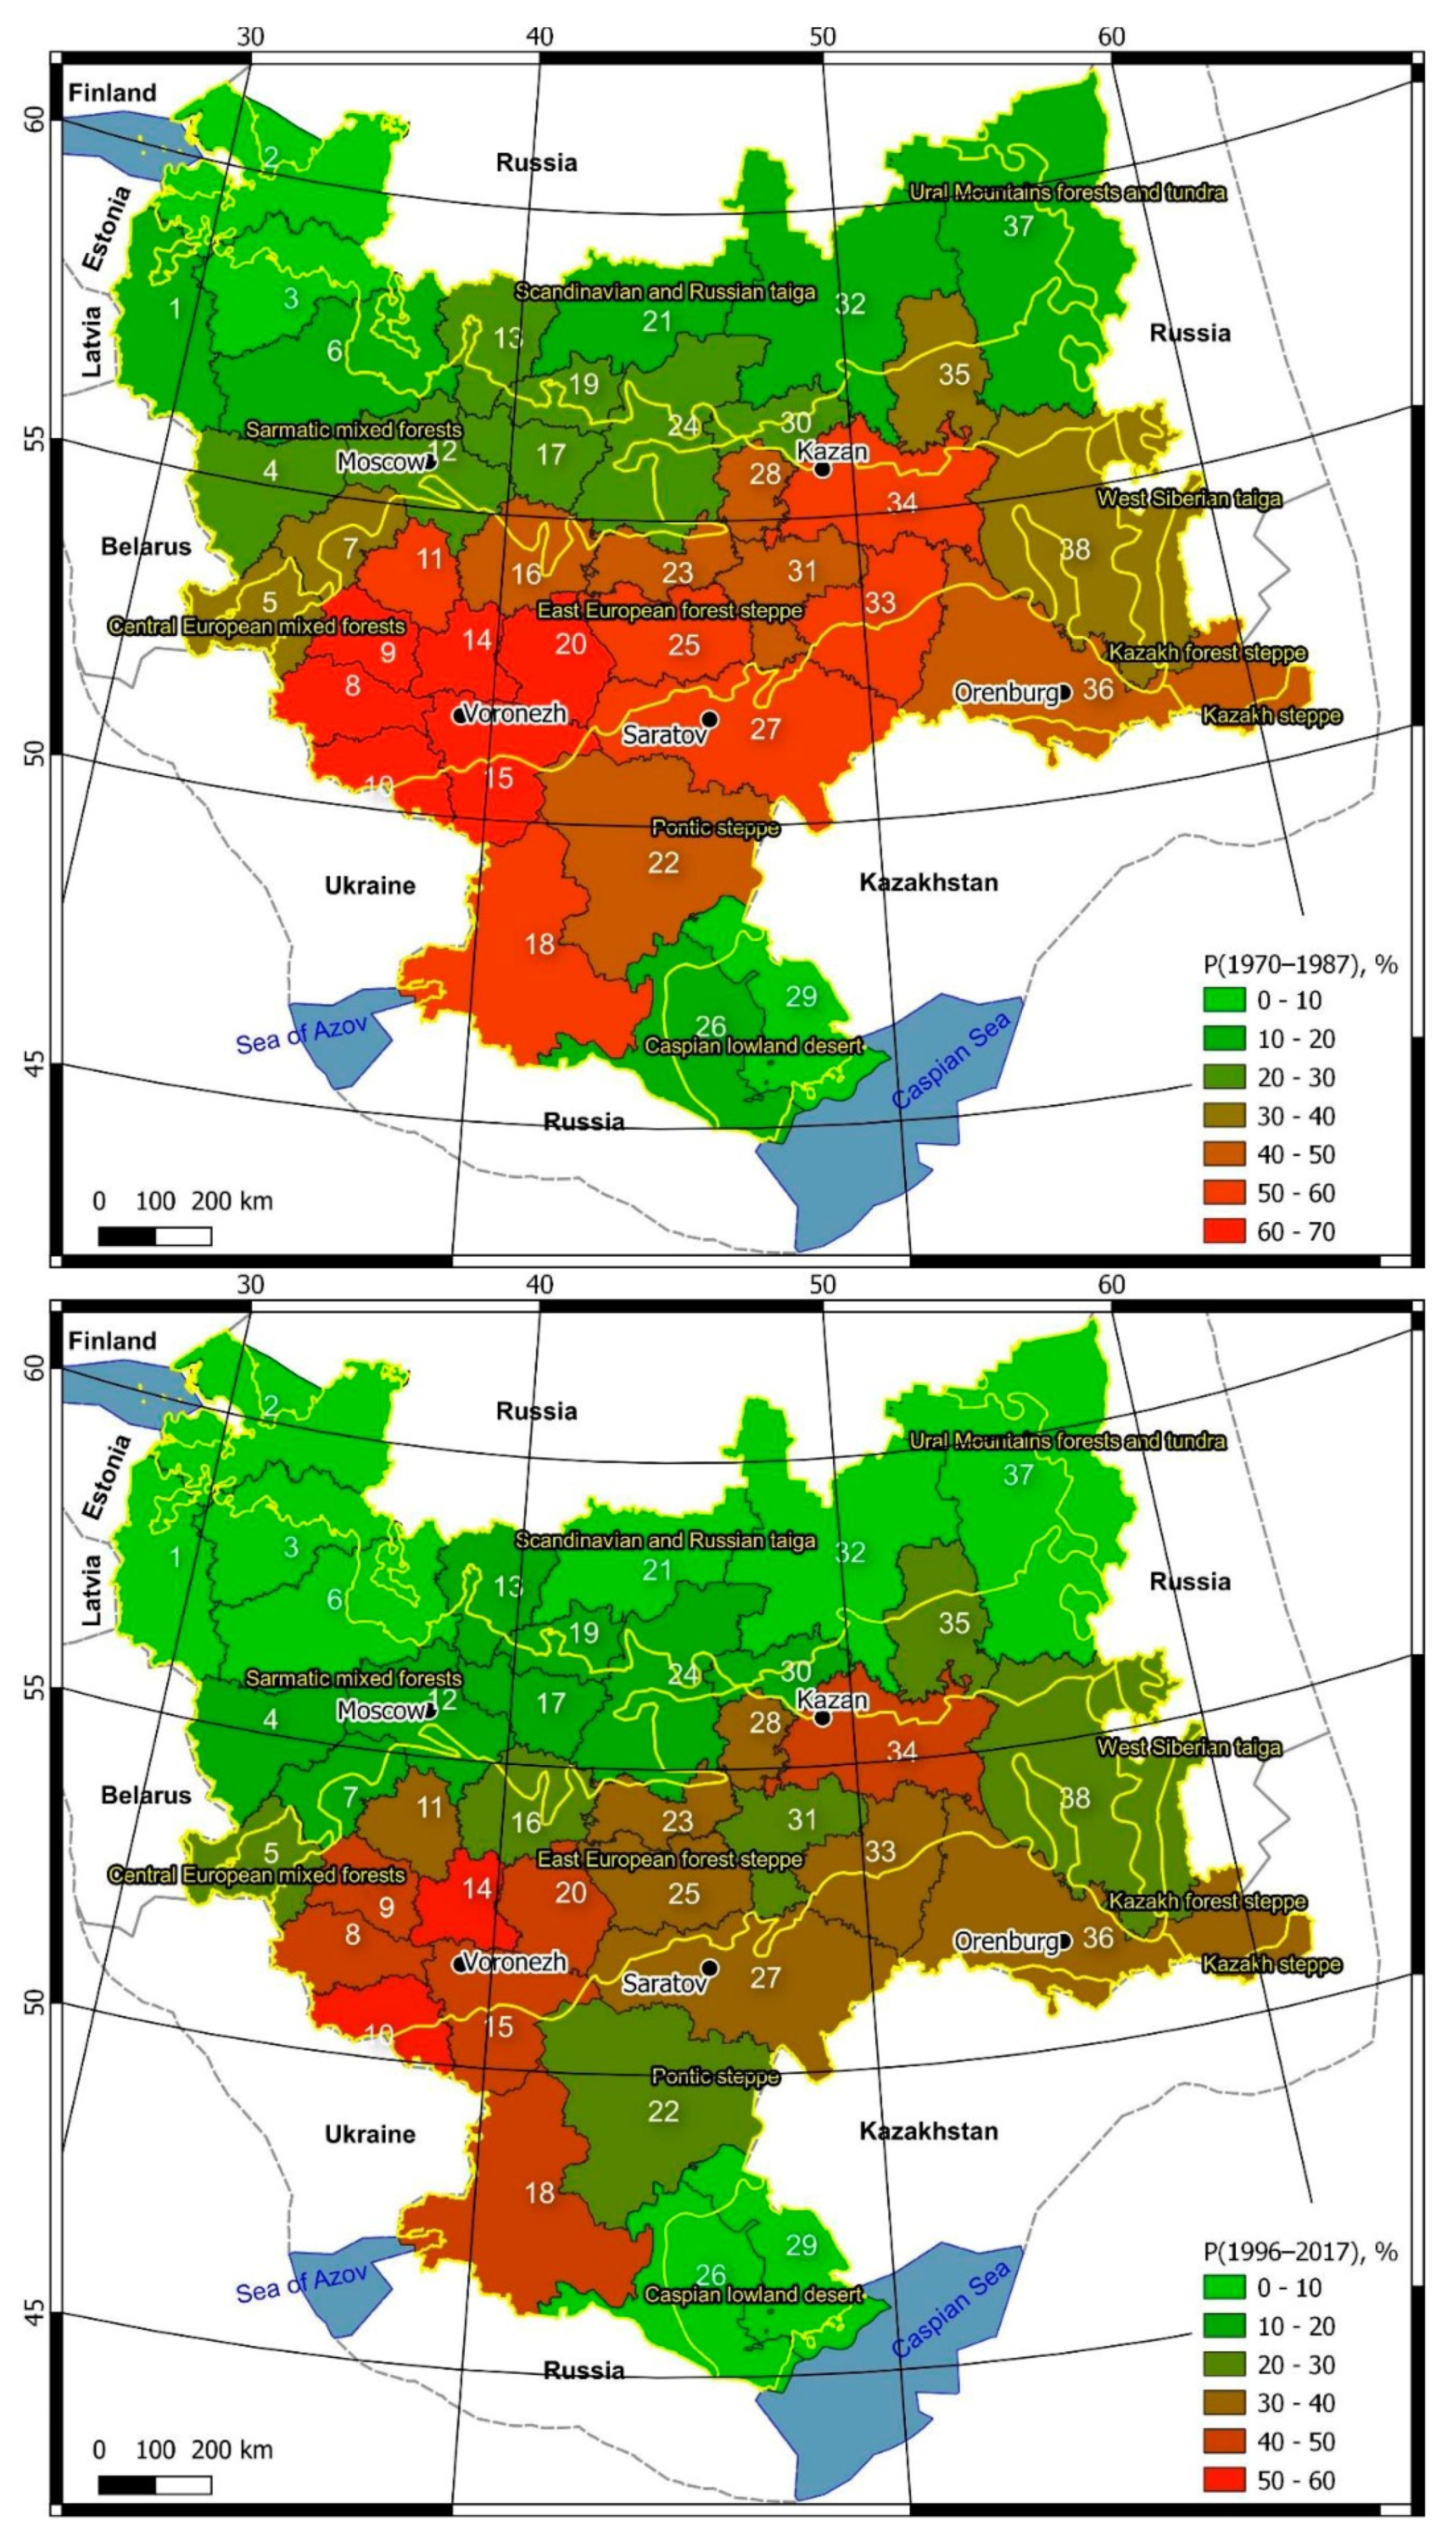
After the collapse of the USSR in 1991, significant degradation of agriculture took place on the plain within the modern Russian Federation. It manifested itself mainly in the abandonment of cultivated land (Figure 1), reducing the fleet of agricultural machinery, and unprecedented animal husbandry changes. Regional features and reasons for the noted changes in the post-Soviet space have been analyzed in numerous studies [13,14,15,16,17,18,19,20,21,22,23,24,25]. It is also noted that the practice of cultivated land abandonment in Europe as a whole, which began in the 1950s, was mainly owing to technological, socio-economic, political, demographic, and climate changes [26,27,28,29,30,31,32,33].
Despite the apparent progress in these studies, there is still insufficient research on the environmental impacts of land-use/-cover changes in European Russia in recent decades. In particular, this concerns the assessment of modern trends in the intensity of soil (i.e., sheet and rill) and gully erosion. Centuries and even decades ago, as mentioned earlier, erosion was a severe problem in the region. It determined the ecological state of the soil and surface water bodies and was also one of the factors affecting food/environmental safety in European Russia. It is also important to note that water erosion is not only one of the most substantial reasons for soil degradation. It is also one of the main drivers of transferring pollutants, absorbed by soil mineral/organic grains, into permanent watercourses and water bodies [34,35,36,37]. The complexity of this assessment is determined not only by the relative lack of knowledge of these trends in most of the region but also by the fact that they also occurred against the background of noticeable changes in climate [38,39,40,41,42,43,44,45,46] and hydrological processes [47,48,49,50]. These changes have affected European Russia since the late 1970s. An additional difficulty in understanding current trends in erosion rates in the region is the lack of soil/gully erosion surveys over the past decades, which were previously taken place regularly during the late Soviet Union [1,4].
An assessment made by a research team from Lomonosov Moscow State University (Russia) [12] was perhaps the only reliable attempt to determine the trends in soil erosion rates within arable lands in this vast region since the end of the late USSR. This assessment was based on the use of erosion models and a landscape-zonal approach. According to the results of this modeling, there was the following reduction in total soil losses between 1980 and 2012–2014 in the landscape zones of European Russia: the southern taiga subzone by 75.2%; the forest-steppe zone by 41.9%; and the steppe and semi-desert zones by 14.1%. However, it is still unclear to what extent these modeled results correspond to the observed changes in erosion intensity in European Russia, as determined from monitoring or field studies.
Below, we will assess the aforementioned model calculation findings and identify the role of human activity as one of the leading factors of modern dynamics of erosion within the most populated and agriculturally developed part of European Russia. Data of the state hydrological monitoring for river-suspended sediment load as one of the indicators of the temporal variability of soil/gully erosion intensity in river basins were used to achieve this purpose. The landscape-zonal approach of the study is because landscape zones, as integral expressions of a complex combination of various environmental components, predetermine both the main features of human activities, mainly agricultural, and a specific set and intensity of exogenous processes, including water erosion.
2. Materials and Methods
2.1. Study Region
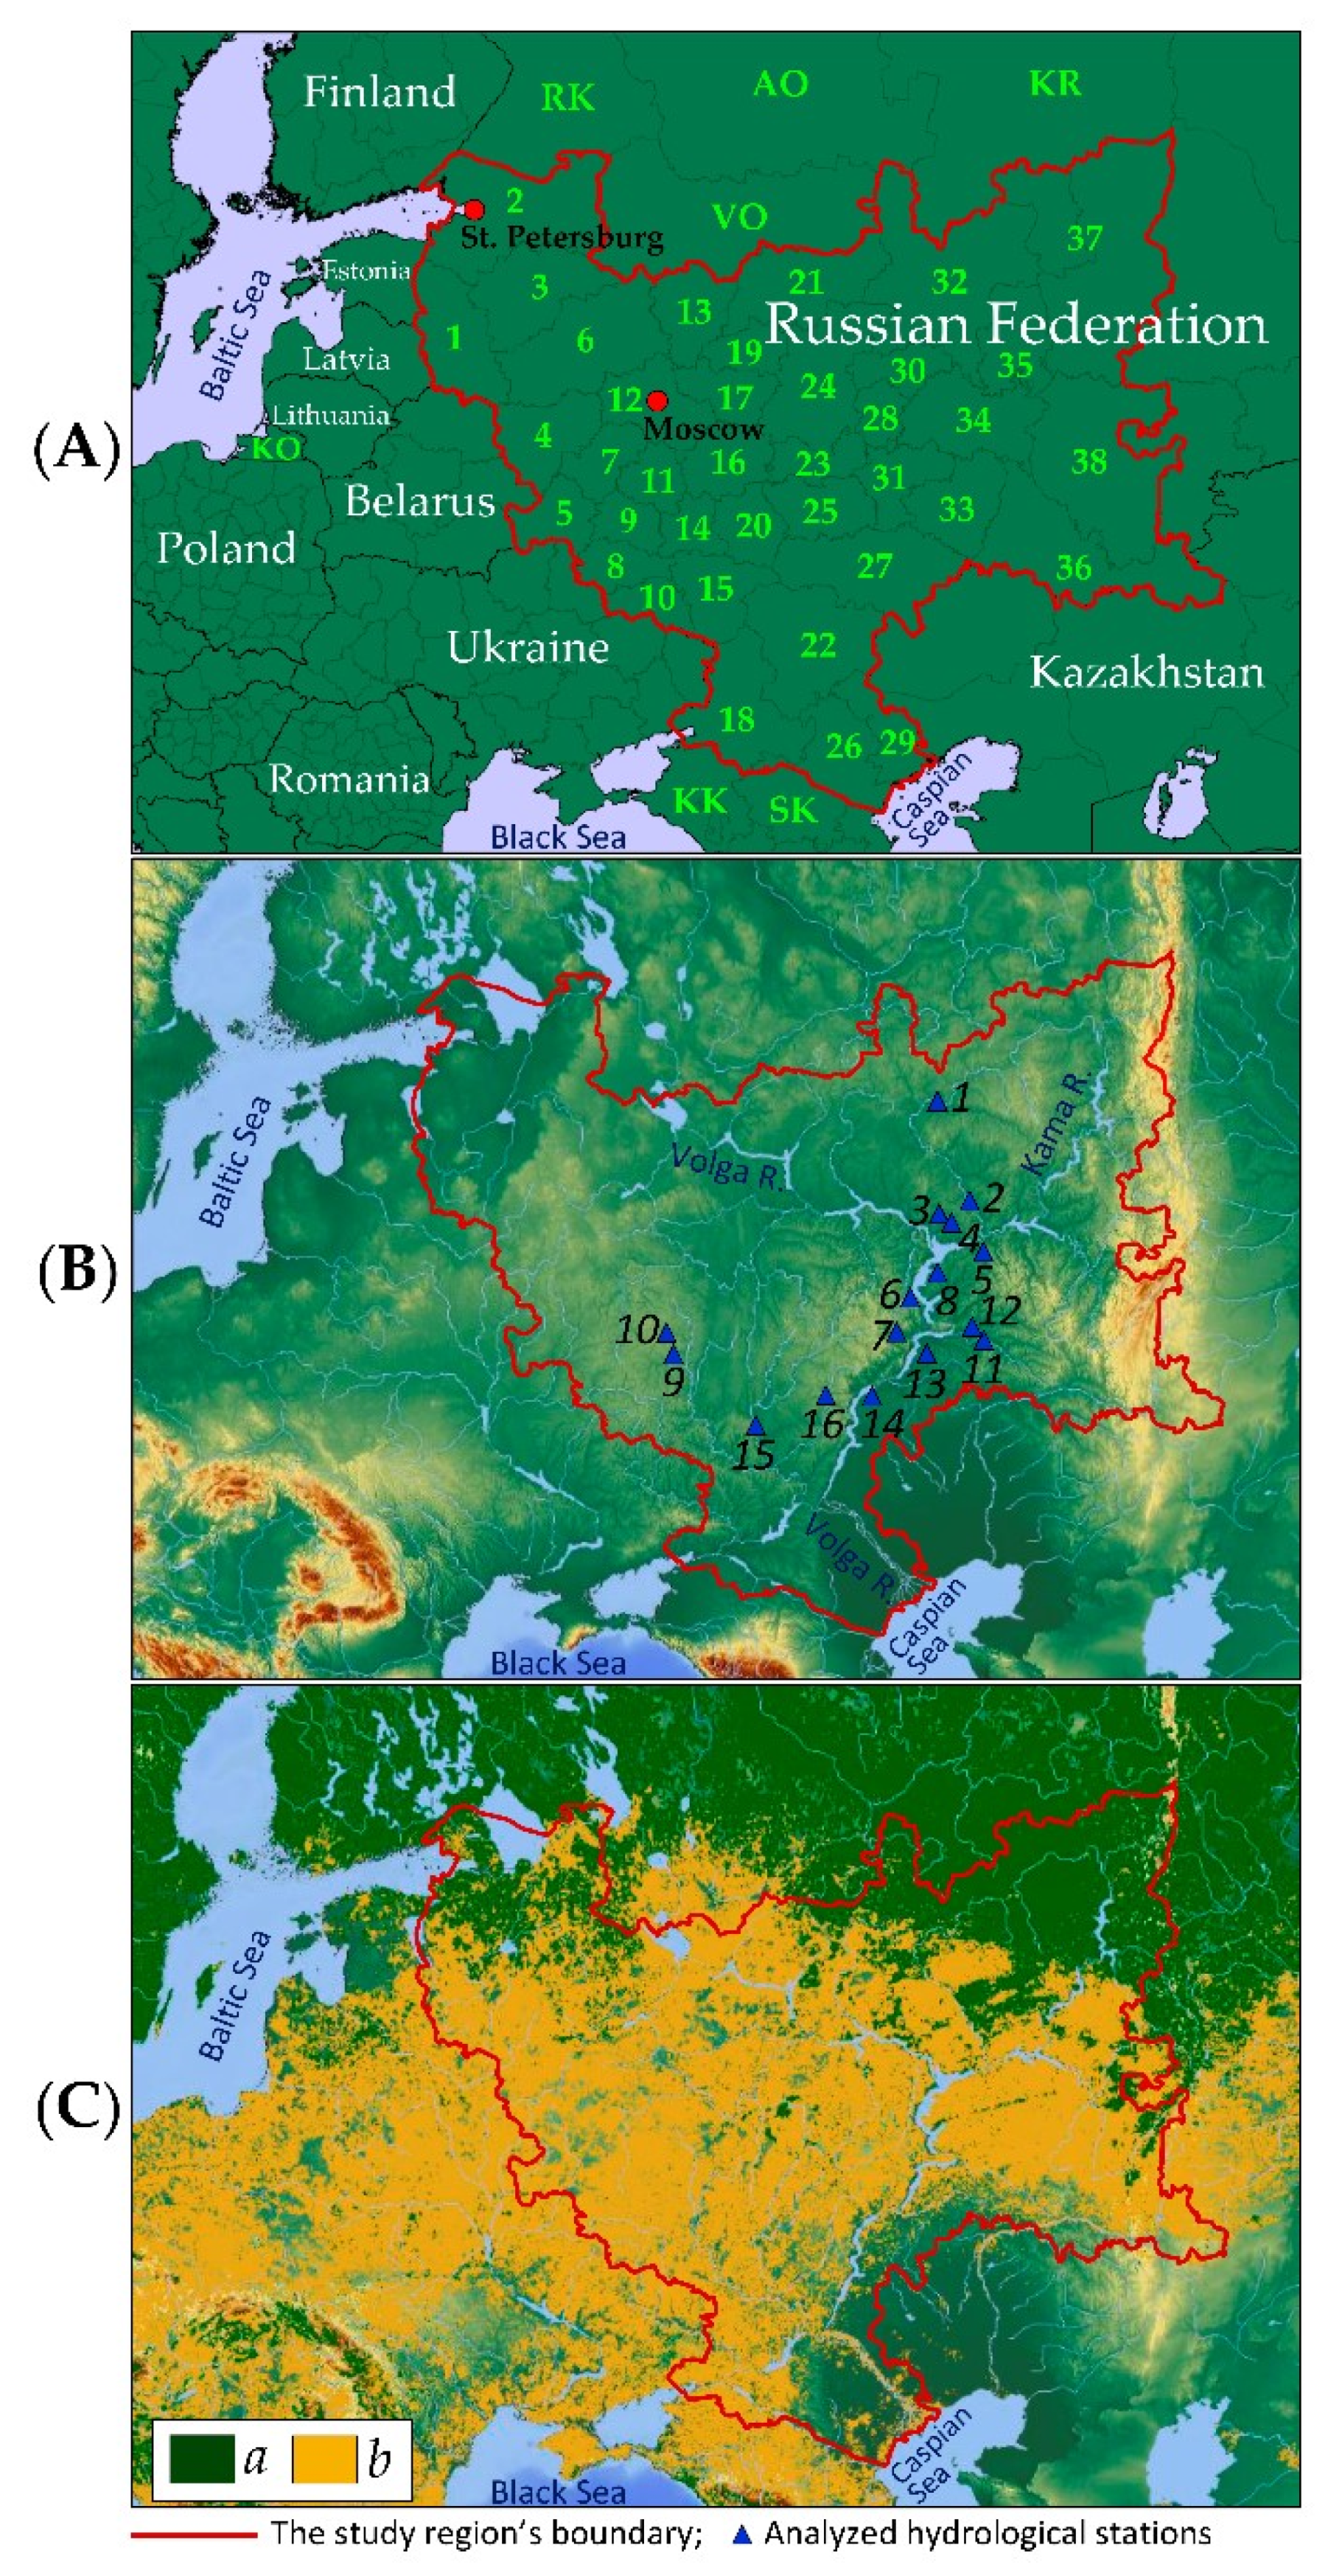
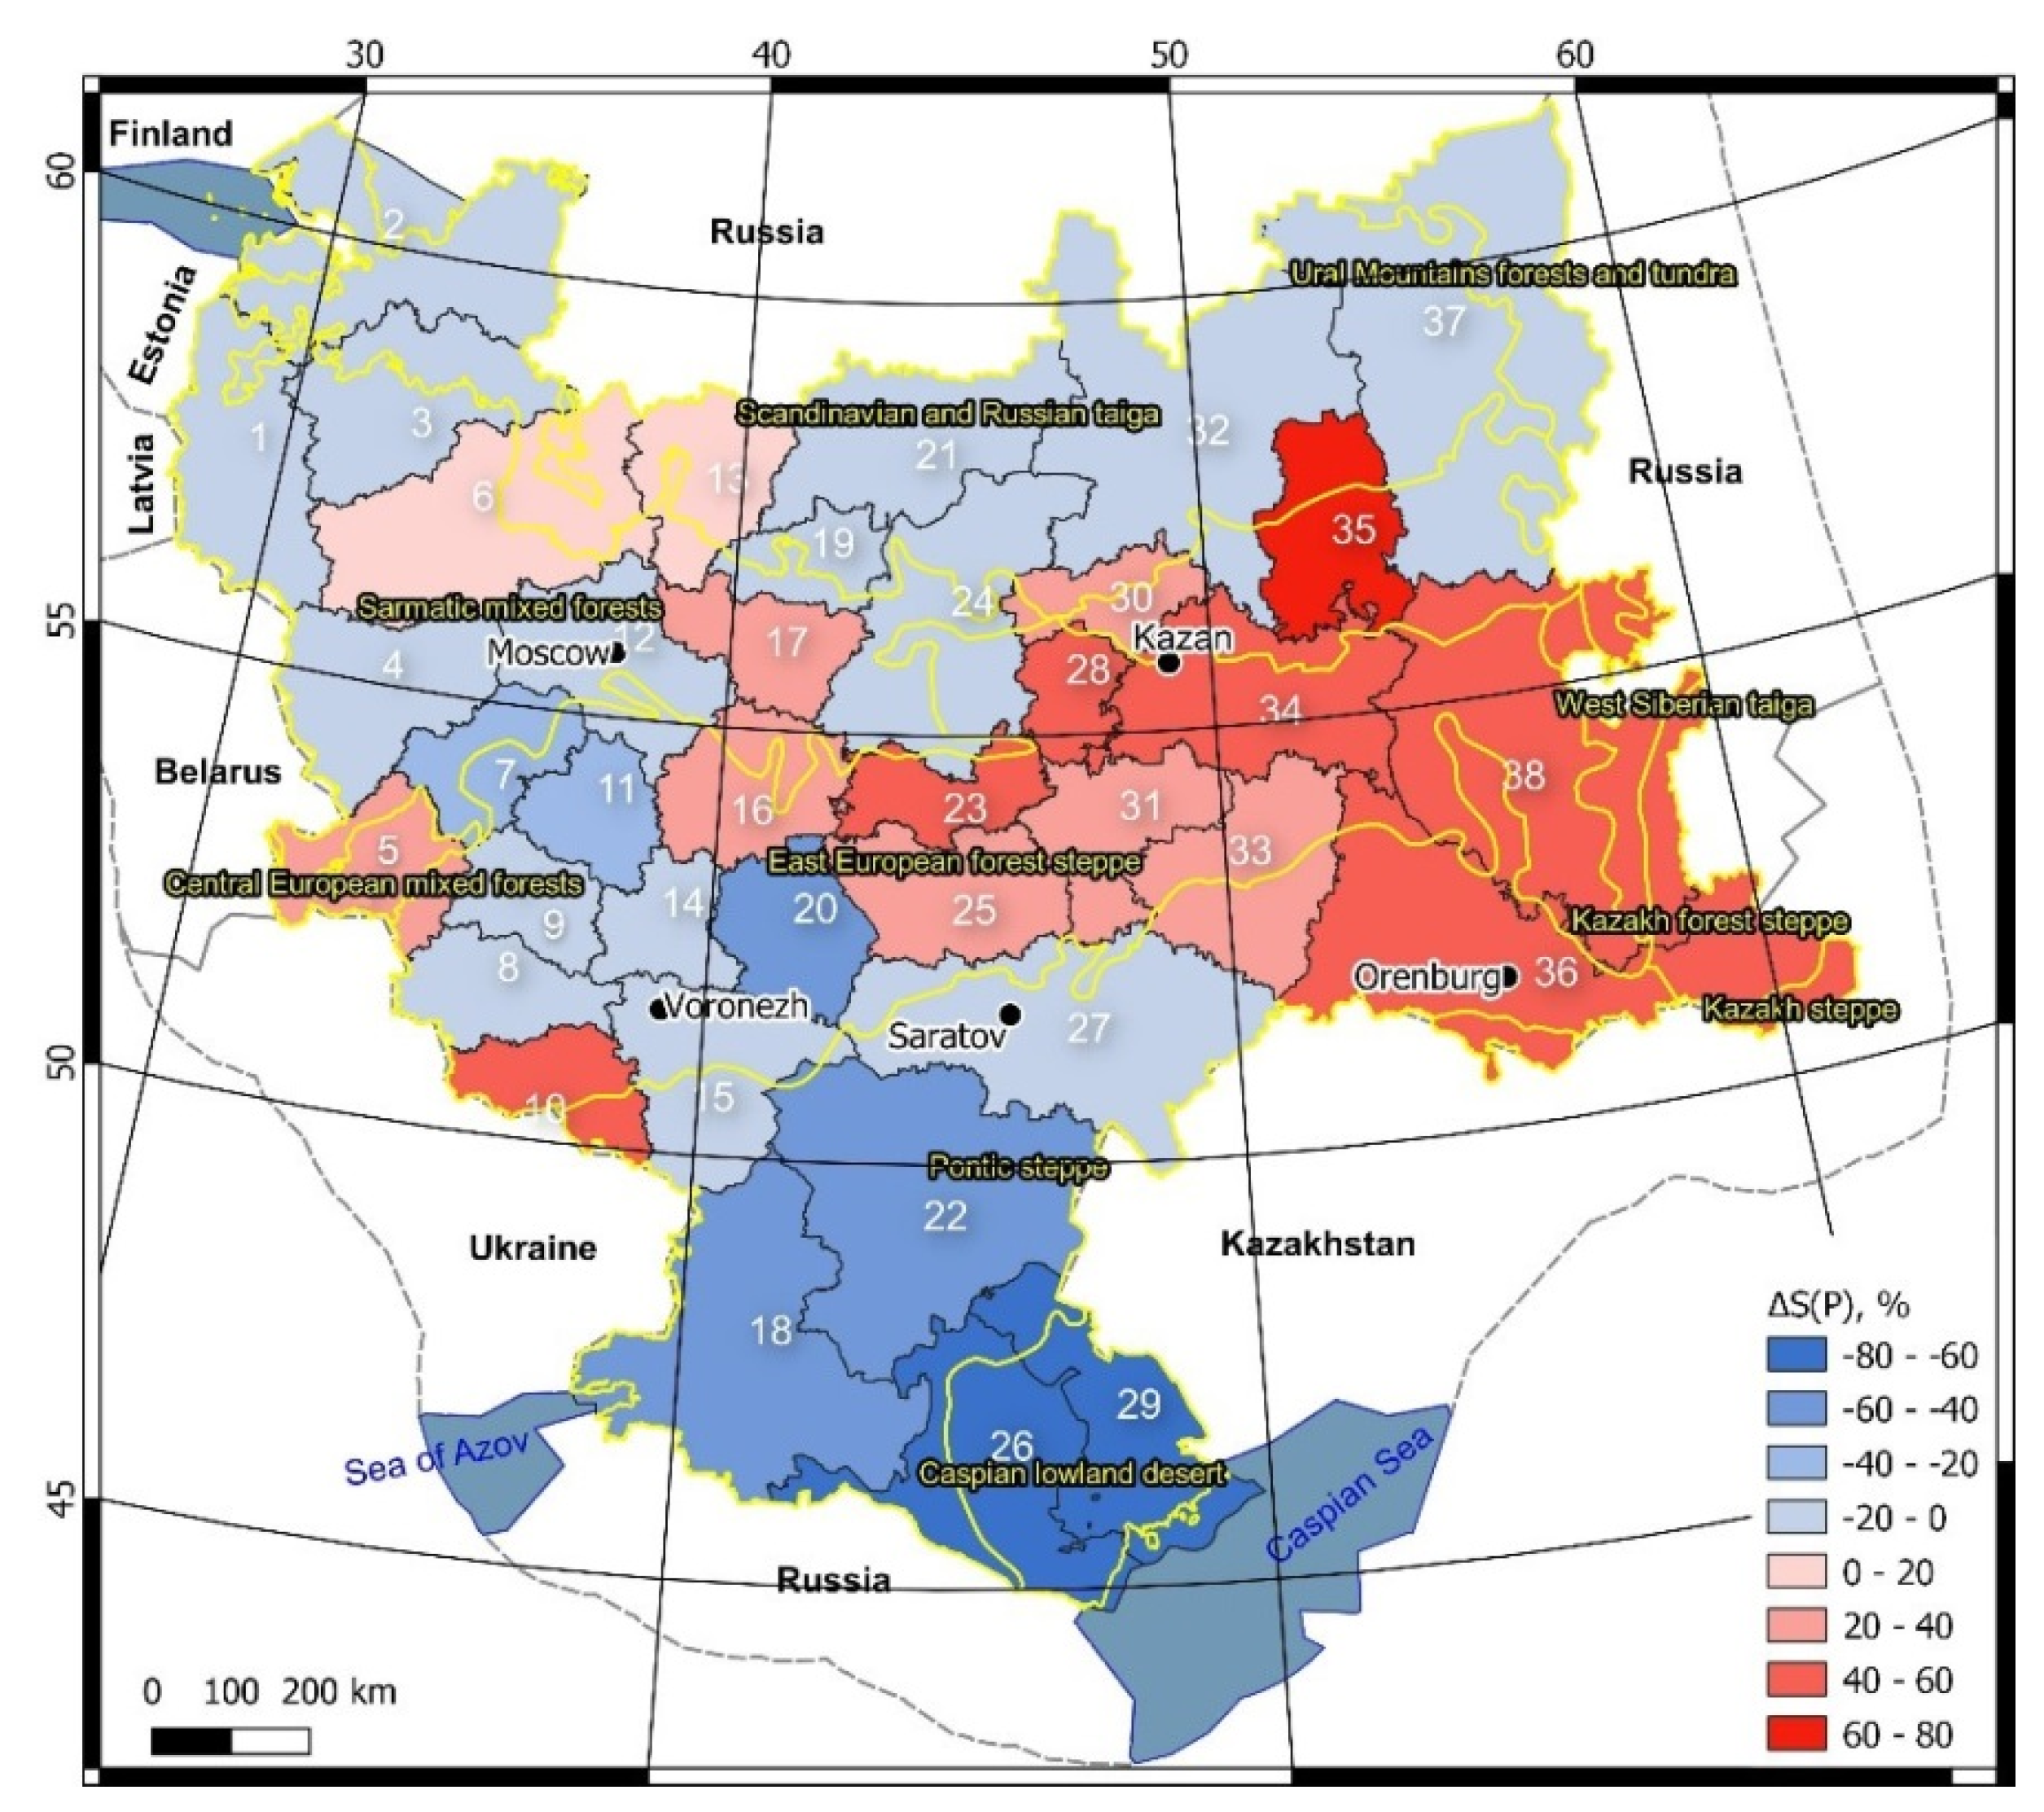
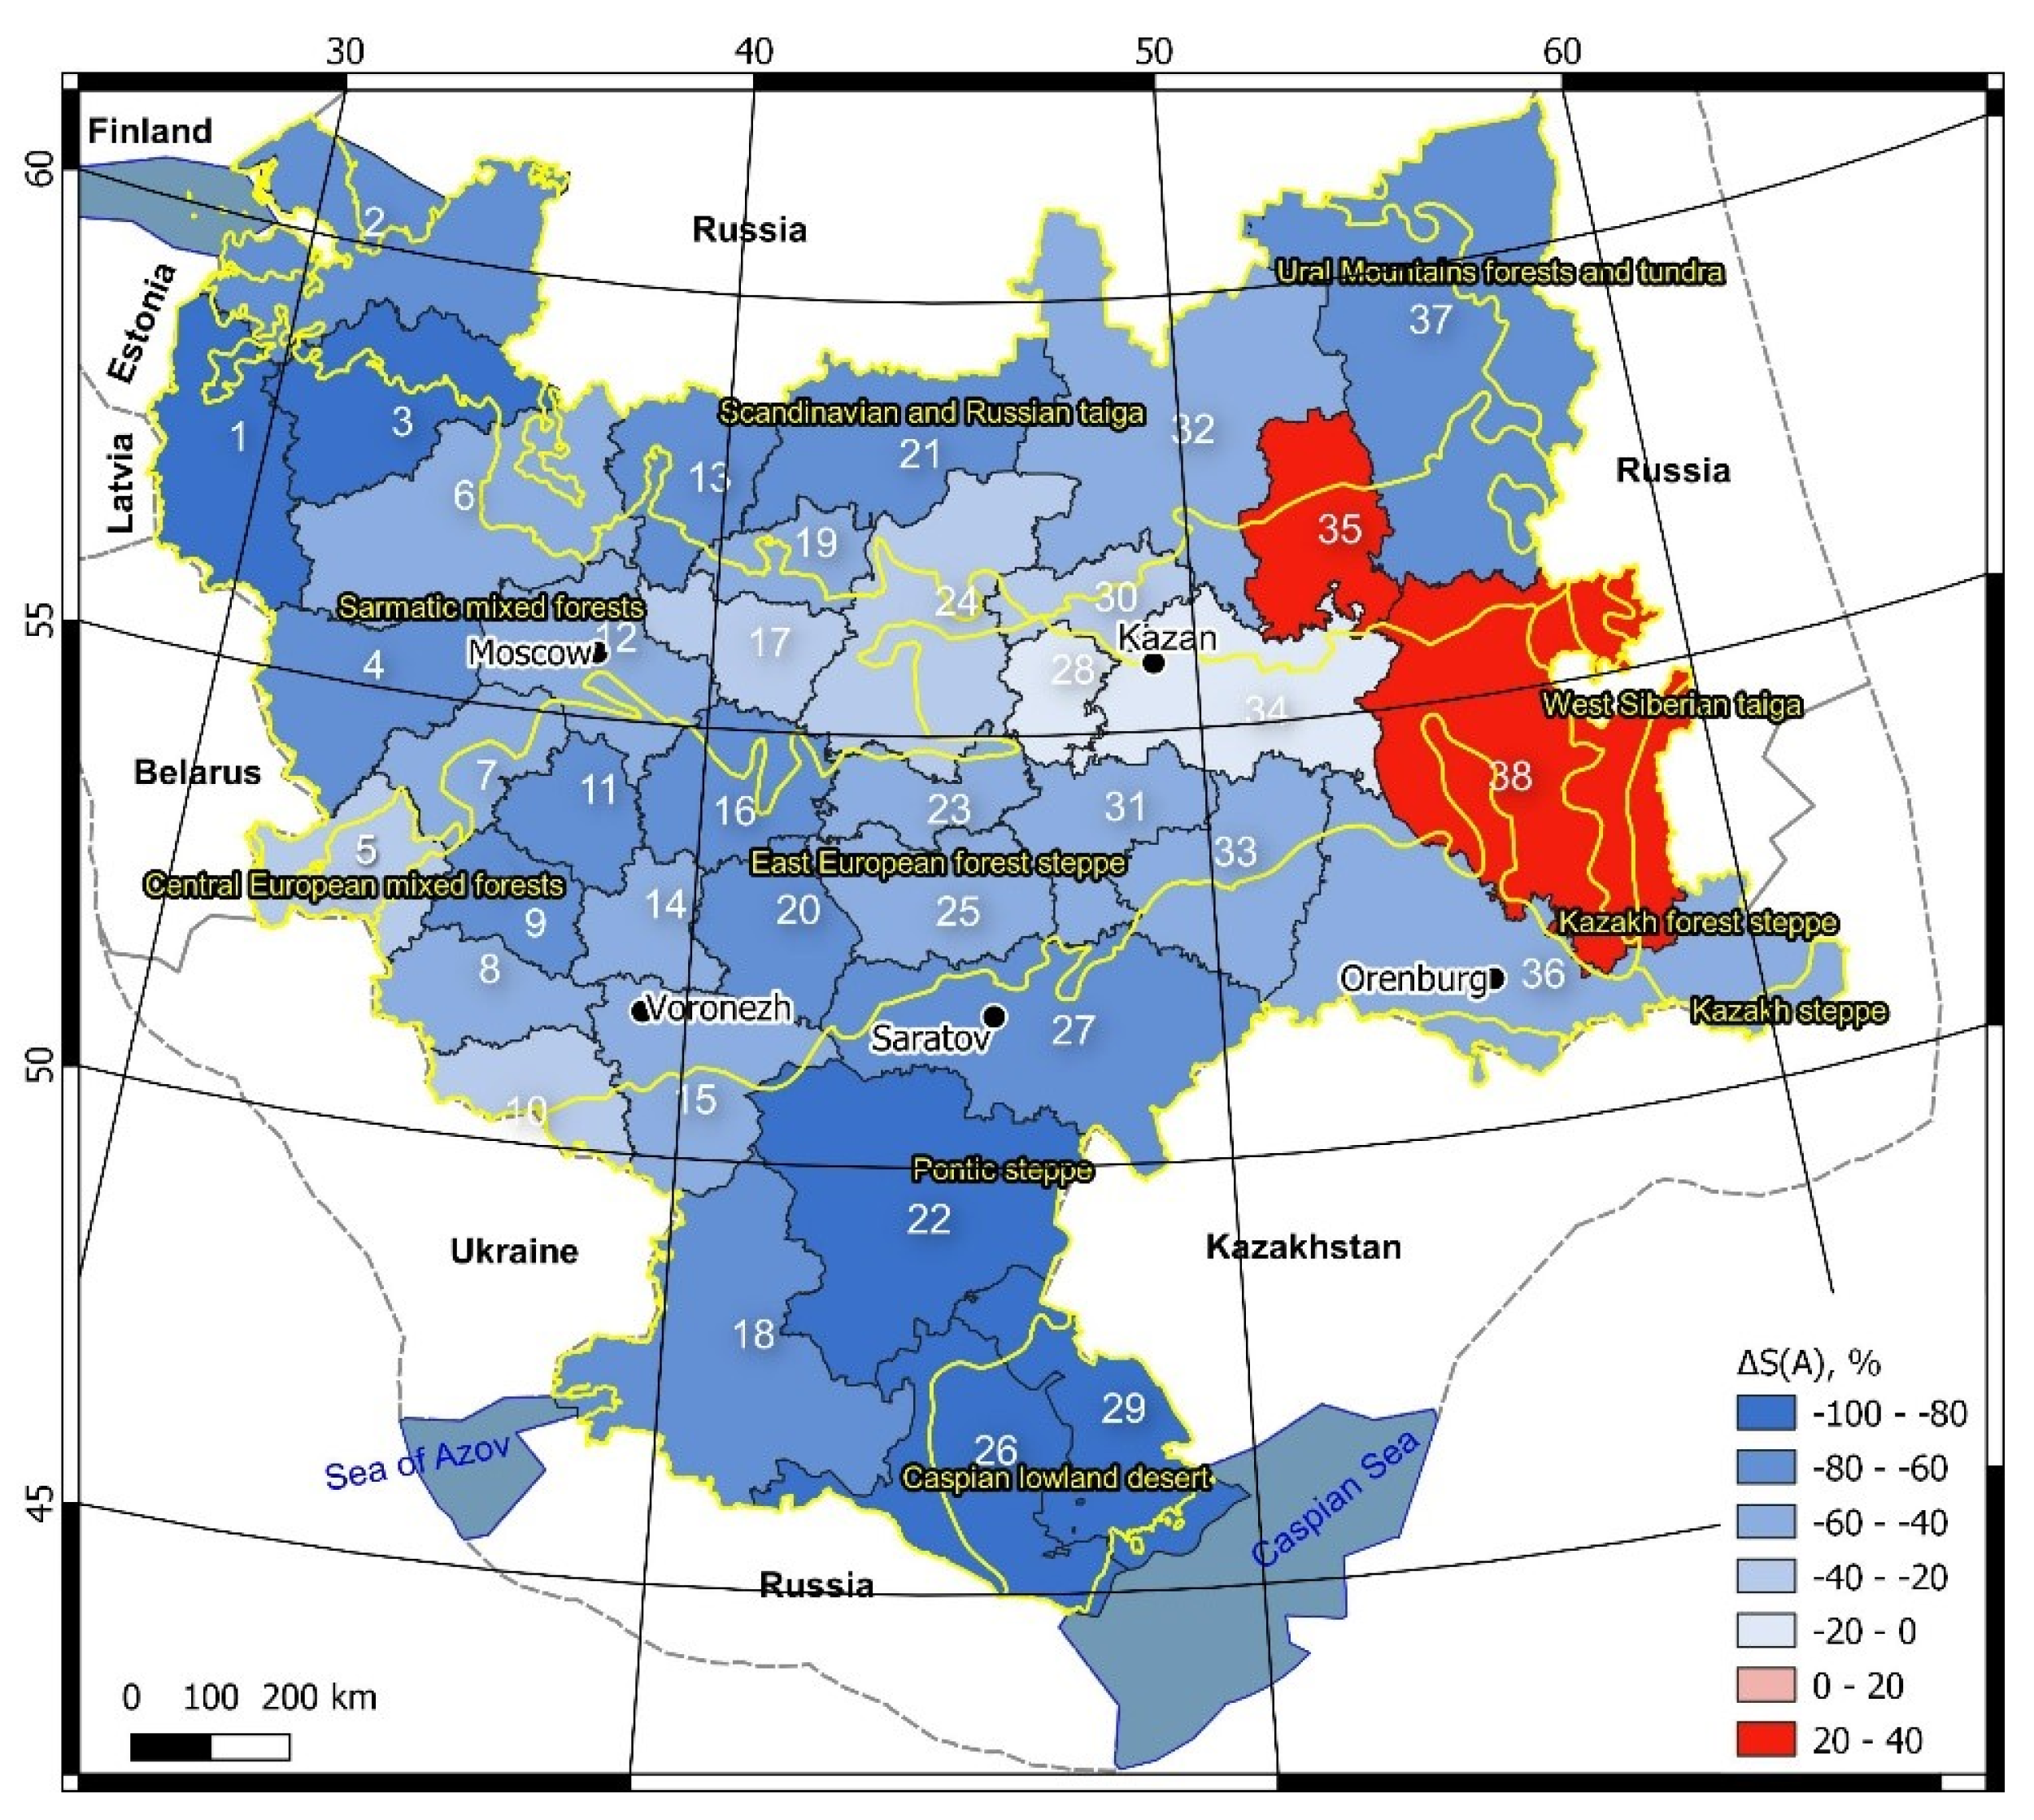
The study region, occupying 2,222,390 km2 or 13% of Russia’s total area, is the most populated (85,237 million people or 59% of Russia’s total population) and agriculturally developed territory of European Russia. The region is located mainly within the temperate forest, forest-steppe, steppe, and semi-desert landscape zones of the East European Plain. It is also partly situated on the western mega-slope of the Ural Mountains. The region includes 38 administrative regions of the Russian Federation from 18,343 km2 of the Chuvash Republic to 160,600 km2 of the Perm Krai (Figure 2A). In 2005–2017, the total area of cultivated land was about 21% of the study region’s total area. About 61–62% of Russia’s cultivated land is concentrated in the region (Figure 2C).
The study did not cover sparsely populated and agriculturally poorly developed administrative regions of the northern sector of European Russia–the Arkhangelsk Oblast, Komi Republic, Republic of Karelia, Murmansk Oblast, and Vologda Oblast (together 1,473,636 km2), as well as the Kaliningrad Oblast (15,125 km2), the semi-exclave of the Russian Federation on the Baltic Sea coast (see Figure 2A).
2.2. Materials and Their Sources
2.2.1. Land-Cover/-Use Data
We collected data on the distribution of cultivated land areas for the late USSR period (available only for 1970, 1975, 1980, 1985, 1986, and 1987) and the post-USSR’s period (for each year from 1996 to 2017; no reliable data on the areas during 1988–1995 were available) in the study region for 38 administrative regions of European Russia and for various crops. All the data collected were initially presented with a spatial resolution of 1 km2. The sources of the data were statistical collections of the USSR [51], electronic statistical resources of the Russian Federation–https://fedstat.ru (accessed on 15 September 2020), and also the Federal State Statistics Service http://www.gks.ru (accessed on 12 September 2020). Population change data were also used from the Russian Federation’s above statistical websites.
To reveal the role of agriculture changes, information on the number of tractors and grain combine harvesters in 2006 and 2016 (the data on other years were not available) was collected for each of the 38 administrative regions from https://fedstat.ru (accessed on 15 September 2020). The published materials of independent Russian experts were also used.
2.2.2. Hydrological Data
Data on the suspended sediment load of 15 rivers (Figure 2B) in various parts of the temperate forest, forest-steppe, and steppe landscape zones were collected and processed to assess contemporary erosion intensity trends in the study region. The analyzed river basins’ total area is 247,080 km2 (about 11% of the area of the study region), ranging from 309 to 124,000 km2 (see Table 1). The suspended sediment load (or yield) data are presented as long-term monitoring series with mean annual (kg s−1) or total annual (Mg km−2 y−1) values, respectively. According to [52], the average error in assessing the mean annual load at gauging stations in the former USSR and later was estimated at 8–10%.
Due to the poor availability of suspended sediment load data, especially over recent decades, the analyzed hydrological stations on rivers are unevenly and rarely located within the study region. Moreover, the available sediment load observation series have significant gaps, especially from the 1980s to the 2000s. Despite these difficulties, the data obtained made it possible to trace the leading contemporary trends in suspended sediment load in the studied region’s rivers.
The dominant part of the load consists of soil/gully erosion products delivered from interfluve slopes to the network of rivers, as found, for example, in Eastern Europe [3,7,9,10]. Despite some methodological flaws, stream suspended sediment load is used to assess the temporal variability of the intensity of mechanical denudation (mainly water erosion) in fluvial systems of various spatiotemporal scales [53,54,55,56,57,58,59,60,61,62,63,64,65,66]. According to variables presented below in the corresponding tables and figures, data on long-term river water flow were additionally collected and analyzed to interpret the temporal dynamics in the load and the intensity of erosion. Data on river suspended sediment load and water flow were available from the State Water Registers of the USSR; Russian State Water Register http://voda.mnr.gov.ru (accessed on 15 October 2020); the automated information system of state monitoring for water bodies of the Federal Agency for Water Resources of the Ministry of Natural Resources and Environment of the Russian Federation http://gmvo.skniivh.ru (accessed on 20 October 2020), and other reliable sources.
2.3. Data Analysis
Russia’s administrative regions were selected as territorial units to study long-term land-cover changes based on the following considerations. First, the most complete and accessible general information on land-cover dynamics was available only for administrative regions for 1970–1987 (the late Soviet Union period) and 1996–2017. Secondly, administrative regions as the main territorial units of the Russian Federation are most suitable for studying from the point of view of generalizing information on such a large territory as European Russia. The average size of one such territorial unit is about 2.6% of the study region’s total area.
All studied administrative regions were divided into four groups depending on their position in the landscape zones of the East European Plain—the regions of the temperate forest (southern taiga, mixed and broadleaf forests), forest-steppe, steppe, and semi-desert zones. It is obvious that the boundaries of these regions do not coincide with the edges of the selected zones. Therefore, we determined their landscape position according to the principle of the majority (>75%) of the region belonging to the corresponding zone. In a few “controversial” administrative regions, their landscape affiliation was determined, taking into account the peculiarities of the soil cover of the adjacent zones. The boundaries of the landscape zones are given according to [67].
Long-term trends in land-cover changes were analyzed by comparing the average values of cultivated land for two main periods: 1970–1987 and 1996–2017. These periods varied greatly in terms of the total cultivated land area and farming’s political and economic conditions. During the last period, two sub-periods, 1996–2004 and 2005–2017, were also identified to trace land-cover changes in the modern Russian Federation. A Free and Open Source Geographic Information System (QGIS 3.0) was used to create a series of cropland change maps.
Long-term trends in river suspended sediment load changes were analyzed by comparing the average values of the load over the studied periods.
To determine the role of land-cover changes in long-term changes of erosion intensity and river sediment load, the integral crop management factor (C-factor) [68]), or ΣC, was calculated for the warm season, May to October, for two analyzed periods in each landscape zone. The ΣC-index is a weighted average that considers both the area occupied by one or another crop in the corresponding period and its individual C-factor. The ΣC-index was calculated only for the following crops: cereals, perennial and annual crops, potato, sugar beet, and sunflower (Equation (1)). The total area under these crops is 80%+ of the total sown area of the study region. Data on the remaining planted area were not available. Although potatoes, sugar beets, and sunflowers are annual crops per se, in the Soviet and Russian practice of processing agricultural statistical information, they belong to an independent category—non-food, or industrial, crops cultivated to obtain technology’s raw materials.
C1, C2 … Cn–individual C-factors for different analyzed crops (0.016 for natural meadow vegetation, 0.02 for perennials, 0.43 for sunflowers, 0.48 for cereals, 0.48 for annuals, 0.52 for potato, and 0.64 for sugar beet), averaged over the warm period, i.e., it is the average of the monthly averages from May to October [1]. From November to early April, the cold period is a season with almost no liquid precipitation (only snow precipitation) and reliable soil protection by snow cover in most of the studied administrative regions. In this regard, the ΣC-index was not calculated for the months indicated. F1, F2 … Fn–average areas occupied by these crops in the corresponding period. The ΣC-index varies from 0 to 1. The lower the index, the better the plowed soils in the analyzed administrative regions or landscape zones are protected against rainfall-induced soil erosion. In May, the beginning of the sowing season, and October, the end of the sowing season, the soil in the study region is poorly protected by cultivated vegetation against erosion, i.e., C is close to 1. Due to this, the ΣC-values averaged over the warm season are somewhat overestimated compared to the summer months.
ΣC = (C1 × F1 + C2 × F2 + … + Cn × Fn)/(F1 + F2 + … + Fn)
The agricultural machinery load (τ) on cultivated land within the landscape zones for 2006 and 2016 was calculated as follows (Equation (2)):
n–the total number (units) of tractors or grain combine harvesters for the corresponding year; F—cultivated land area (ha) for the corresponding year: for tractors—the total area of cultivated land; for grain combine harvesters—only sown areas for grain crops.
τ = n/F
To identify statistically significant differences in all averaged values of the studied land-cover and hydrological variables between the monitoring periods, Student’s t-test was used. All the averaged values were calculated with a 95% confidence interval.
3. Results
3.1. Changes in Land Cover and Agriculture
3.1.1. Land-Cover Changes
In the 1970s to 1980s, Russia’s total cultivated land area was the largest in its entire history [4]. Over the past 30–40 years, a significant and mainly steady reduction in acreage has affected all the analyzed administrative regions of European Russia: from 1970–1987 (751,928 km2) to 1996–2017 (492,408 km2), the study region lost more than 1/3 of its cultivated land. The result of this reduction was a proportional increase in the area of abandoned land. Such uncultivated arable land quickly overgrows, first with weeds and then with zonal vegetation. In this case, it differs little or does not differ from meadows in terms of soil protection properties.
The reduction in cropland began gradually in the 1980s, during the political and economic reform in the USSR in 1985–1991, and accelerated after the collapse of the USSR in 1991 (see Figure 1). This reduction was statistically significant (p < 0.05) in all studied administrative regions (Figure 3). The relative decrease in cultivated land was especially notable in the forest zone and the Caspian Lowland’s semi-desert zone. At the same time, the absolute reduction in the area, in addition to the forest zone, was significant both in the forest-steppe and the steppe (Table 2). In the forest zone, the relatively small reduction in cultivated land in the Leningrad Oblast (“only” by 28%), located in the extreme northwest of the study region (see Figure 3), was mainly due to proximities to Saint Petersburg, the second-largest city of Russia with over five million people. The smallest relative reduction in the area occurred in the forest-steppe and steppe zones (Table 2), especially in their eastern (the Middle Volga region and the Cis-Ural Region) and western sectors (see Figure 3). However, it should be noted that even in the late USSR period, a period of the relative growth of agriculture in the country, cultivated land occupied relatively small areas (see Appendix A, Figure A1) compared to Central and Western Europe. Over the past three decades, these trends have continued, although not with such a sharp gradient. In the overwhelming majority of European Russia’s administrative regions, there was a statistically significant relative reduction in cultivated land between 1996–2004 and 2005–2017 (Table 2). In a few regions where there was a slight increase in the sown area, it was statistically insignificant.
Russia is traditionally considered one of the world leaders in wheat, rye, oats, and barley. The aforementioned reduction in cultivated land was primarily due to a steady decrease in grain crops since these crops are the main sowing component in the region. In 1970–1987, their total share was 53.2% (in 1970–1980–54.9%, in 1985–1987–51.6%) of the total area of cultivated land. In 1996–2017, this share reduced to 43.8%: 1996–2004–44.9%, 2005–2017–43.0%. In the study region, the area of cultivated land occupied by cereals declined with p < 0.05 for all studied administrative regions between 1970–1987 and 1996–2017 by 41.4%, from 441,461 to 258,712 km2: 1970–1980–437,043 km2, 1985–1987–387,600 km2, 1996–2004–276,432 km2, and 2005–2017–246,445 km2. The relative reduction in acreage was again greatest in the southern subzone of the East European Plain’s forest zone (Figure 4). The smallest relative reduction (<20–25%) occurred in the administrative regions of southwest European Russia with the most fertile soils (mainly Haplic Chernozems Pachic), especially in the Belgorod, Kursk, and Rostov Oblasts, <17–19% (see Figure 4). The largest losses of sown areas for grain crops occurred in the far northwest, in the economically depressed administrative regions of European Russia–the Novgorod Oblast (by 88%) and Pskov Oblast (by 83%).
Perennial grasses and forbs (Medicago sativa L., Trifolium L., Onobrychis viciifolia, Agropýron, and others) are the second most important sowing component: 16.9% in 1970–1987, 30.3% in 1996–2017. In general, their area even increased by an average of 3.2% (a statistically insignificant change) from 1970–1987 to 1996–2017, from 89,535 to 92,368 km2. In the forest zone and the steppe, a downward trend in perennials prevailed, whereas an upward trend in this area was observed in the center and east of the forest-steppe and steppe zones (Figure 5).
Annual grasses (Sorghum sudanense L., Setaria italica, and others) are the third most important sowing component: in 1970–1987 these accounted for 9.2%, and in 1996–2017 for 6.1%. Except for two regions from the eastern part of European Russia, the Udmurt Republic and the Republic of Bashkortostan, there was a reduction in their area in all studied regions, especially in the western sector of the forest zone, as well as in the steppe (Figure 6). In the study region, the area under annual grasses noticeably decreased between 1970–1987 and 1996–2017 from 65,428 to 29,352 km2, i.e., by 55%.
Potatoes are also one of the most important sowing components: in 1970–1987 they accounted for 5.1%, in 1996–2017 for 4.5%. In the vast majority of the study region, the area under these crops decreased by 45%, from 27,469 to 15,131 km2. In the studied zones, the reduction in the area between 1970–1987 and 1996–2017 was as follows: in the southern “belt” of the forest zone by 58%, from 12,487 to 5298 km2 (with the maximum reduction (>70%) in the Smolensk, Tver, and Ivanovo oblasts); in the forest-steppe by 43%, from 11,387 to 6498 km2; and in the steppe by 9.4%, from 3563 to 3229 km2. In those very few areas where agriculture is possible in the semi-desert zone, for example, in the valley and delta of the Volga River in the Astrakhan Oblast, the area under potato increased by 159%, from 41 to 106 km2.
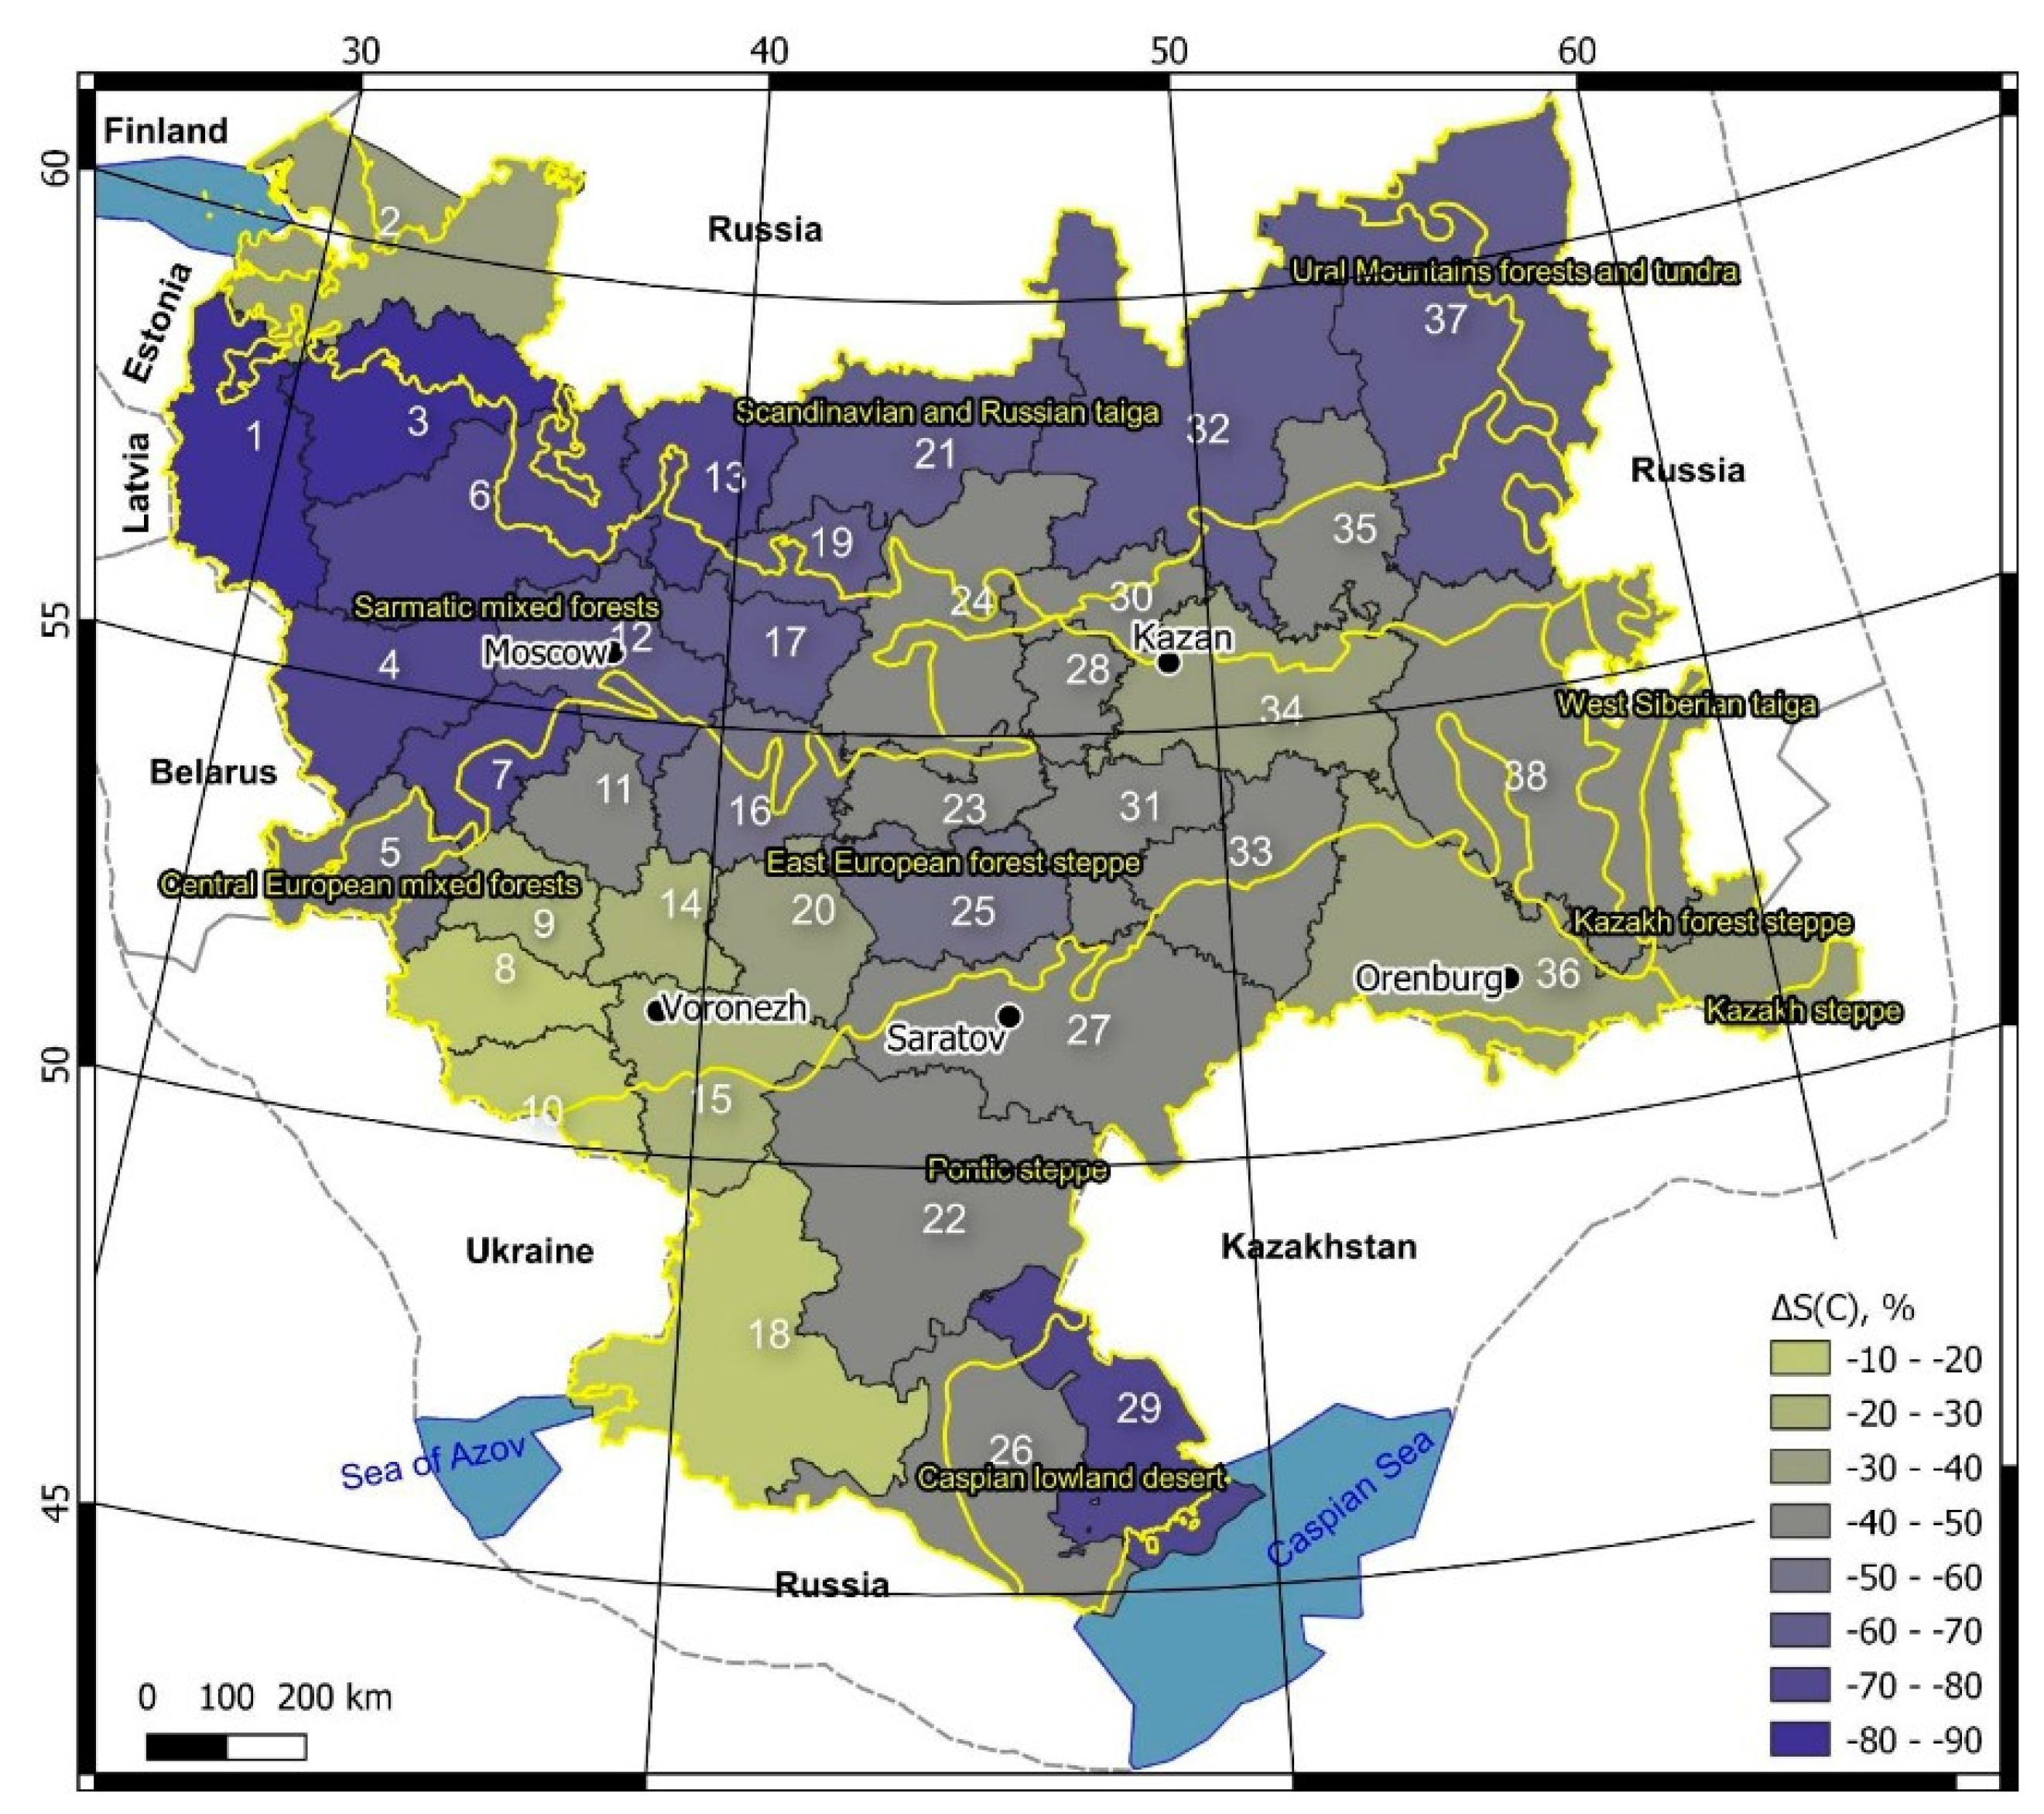
Cereals, perennial and annual grasses and forbs, and potatoes accounted for about 83% in 1970–1987 and 80% in 1996–2017 of the total cultivated area. The whole area under all remaining crops (sugar beet, sunflower, corn, legumes, soybeans, flax, and others) decreased by 24.4%, from 1970–1987 to 1996–2017. For example, the area under sugar beet crops, located mainly in the forest-steppe zone and partially in the steppe, decreased by 39%, from 11,880 to 7259 km2. At the same time, the area under sunflower has increased significantly from 15,792 to 42,480 km2. This increase was found mainly in the steppe and most of the forest-steppe (see Appendix B, Table A1). Considering the changes mentioned above in the main crops over the past half-century, we obtained the following distribution of C-factor changes over the landscape zones of the study region (Table 3).
It should also be noted that in those administrative regions of European Russia, mainly in its northern and agriculturally poorly developed part, which were not included in the study (see the Section 2.1), the trend to reduce sown areas also persisted–planted areas decreased by 50–65%. Moreover, from 1970–1987 to 1996–2017, this trend was found even in those administrative regions that are considered the most agriculturally developed in Russia, together with the studied Rostov Oblast–the Krasnodar Krai (−15.1%) and Stavropol Krai (−23.4%). These regions are located in the Asian part of Russia, in the Cis-Caucasus region, between European Russia and the Caucasus Mountains (see Figure 2A,B).
3.1.2. Agriculture Changes
Due to the difficulty of obtaining reliable statistical information, consideration of this issue was limited only to a general overview of agricultural machinery and animal husbandry changes in the region. Below are quantitative estimates summarizing both the conclusions of some independent Russian experts [69] and our statistical calculations.
The almost complete elimination of domestic tractor production in Russia was one of the results of the political/economic reform of the 1990s. Only 6800 tractors were produced throughout Russia in 2016 compared to 213,600 units in 1990, the penultimate year of the RSFSR/USSR existence [69]. The experts noted a similar situation with the production of harvesters in the country due to the reform.
Table 4 shows some quantitative values of agricultural machinery load in the study region, which were calculated for 2006 and 2016 according to the Russian Federation’s official statistics at www.fedstat.ru (accessed on 15 September 2020). In the forest-steppe, steppe, and semi-desert zones, the load of tractors per unit of sown area decreased by 18–23% from 2006 to 2016, while it almost did not change in the forest zone’s south. The overall decrease in the number of combine harvesters per unit of cultivated area was even more significant (by 35–93%) between these years (see Table 4). This load in agricultural organizations reduced by more than three times from 1990 to 2016 [69].
What happened to animal husbandry during the reform after 1991 was unprecedented in the country’s history. Grazhdankin and Kara-Murza [69] noted that the number of livestock decreased by two-thirds over the years of the reform. In 1958–1990, the number of sheep and goats in the RSFSR was maintained at more than 60 million, sometimes increasing to 67–68 million heads. Since the early 1990s, it began to decline, falling from the maximum values to about 20%: in 1999, there were only 14.8 million sheep left in the Russian Federation. This result was the historical minimum of the twentieth century.
3.2. Contemporary Changes in the Load of River Suspended Sediment and the Intensity of Erosion
3.2.1. Forest Zone
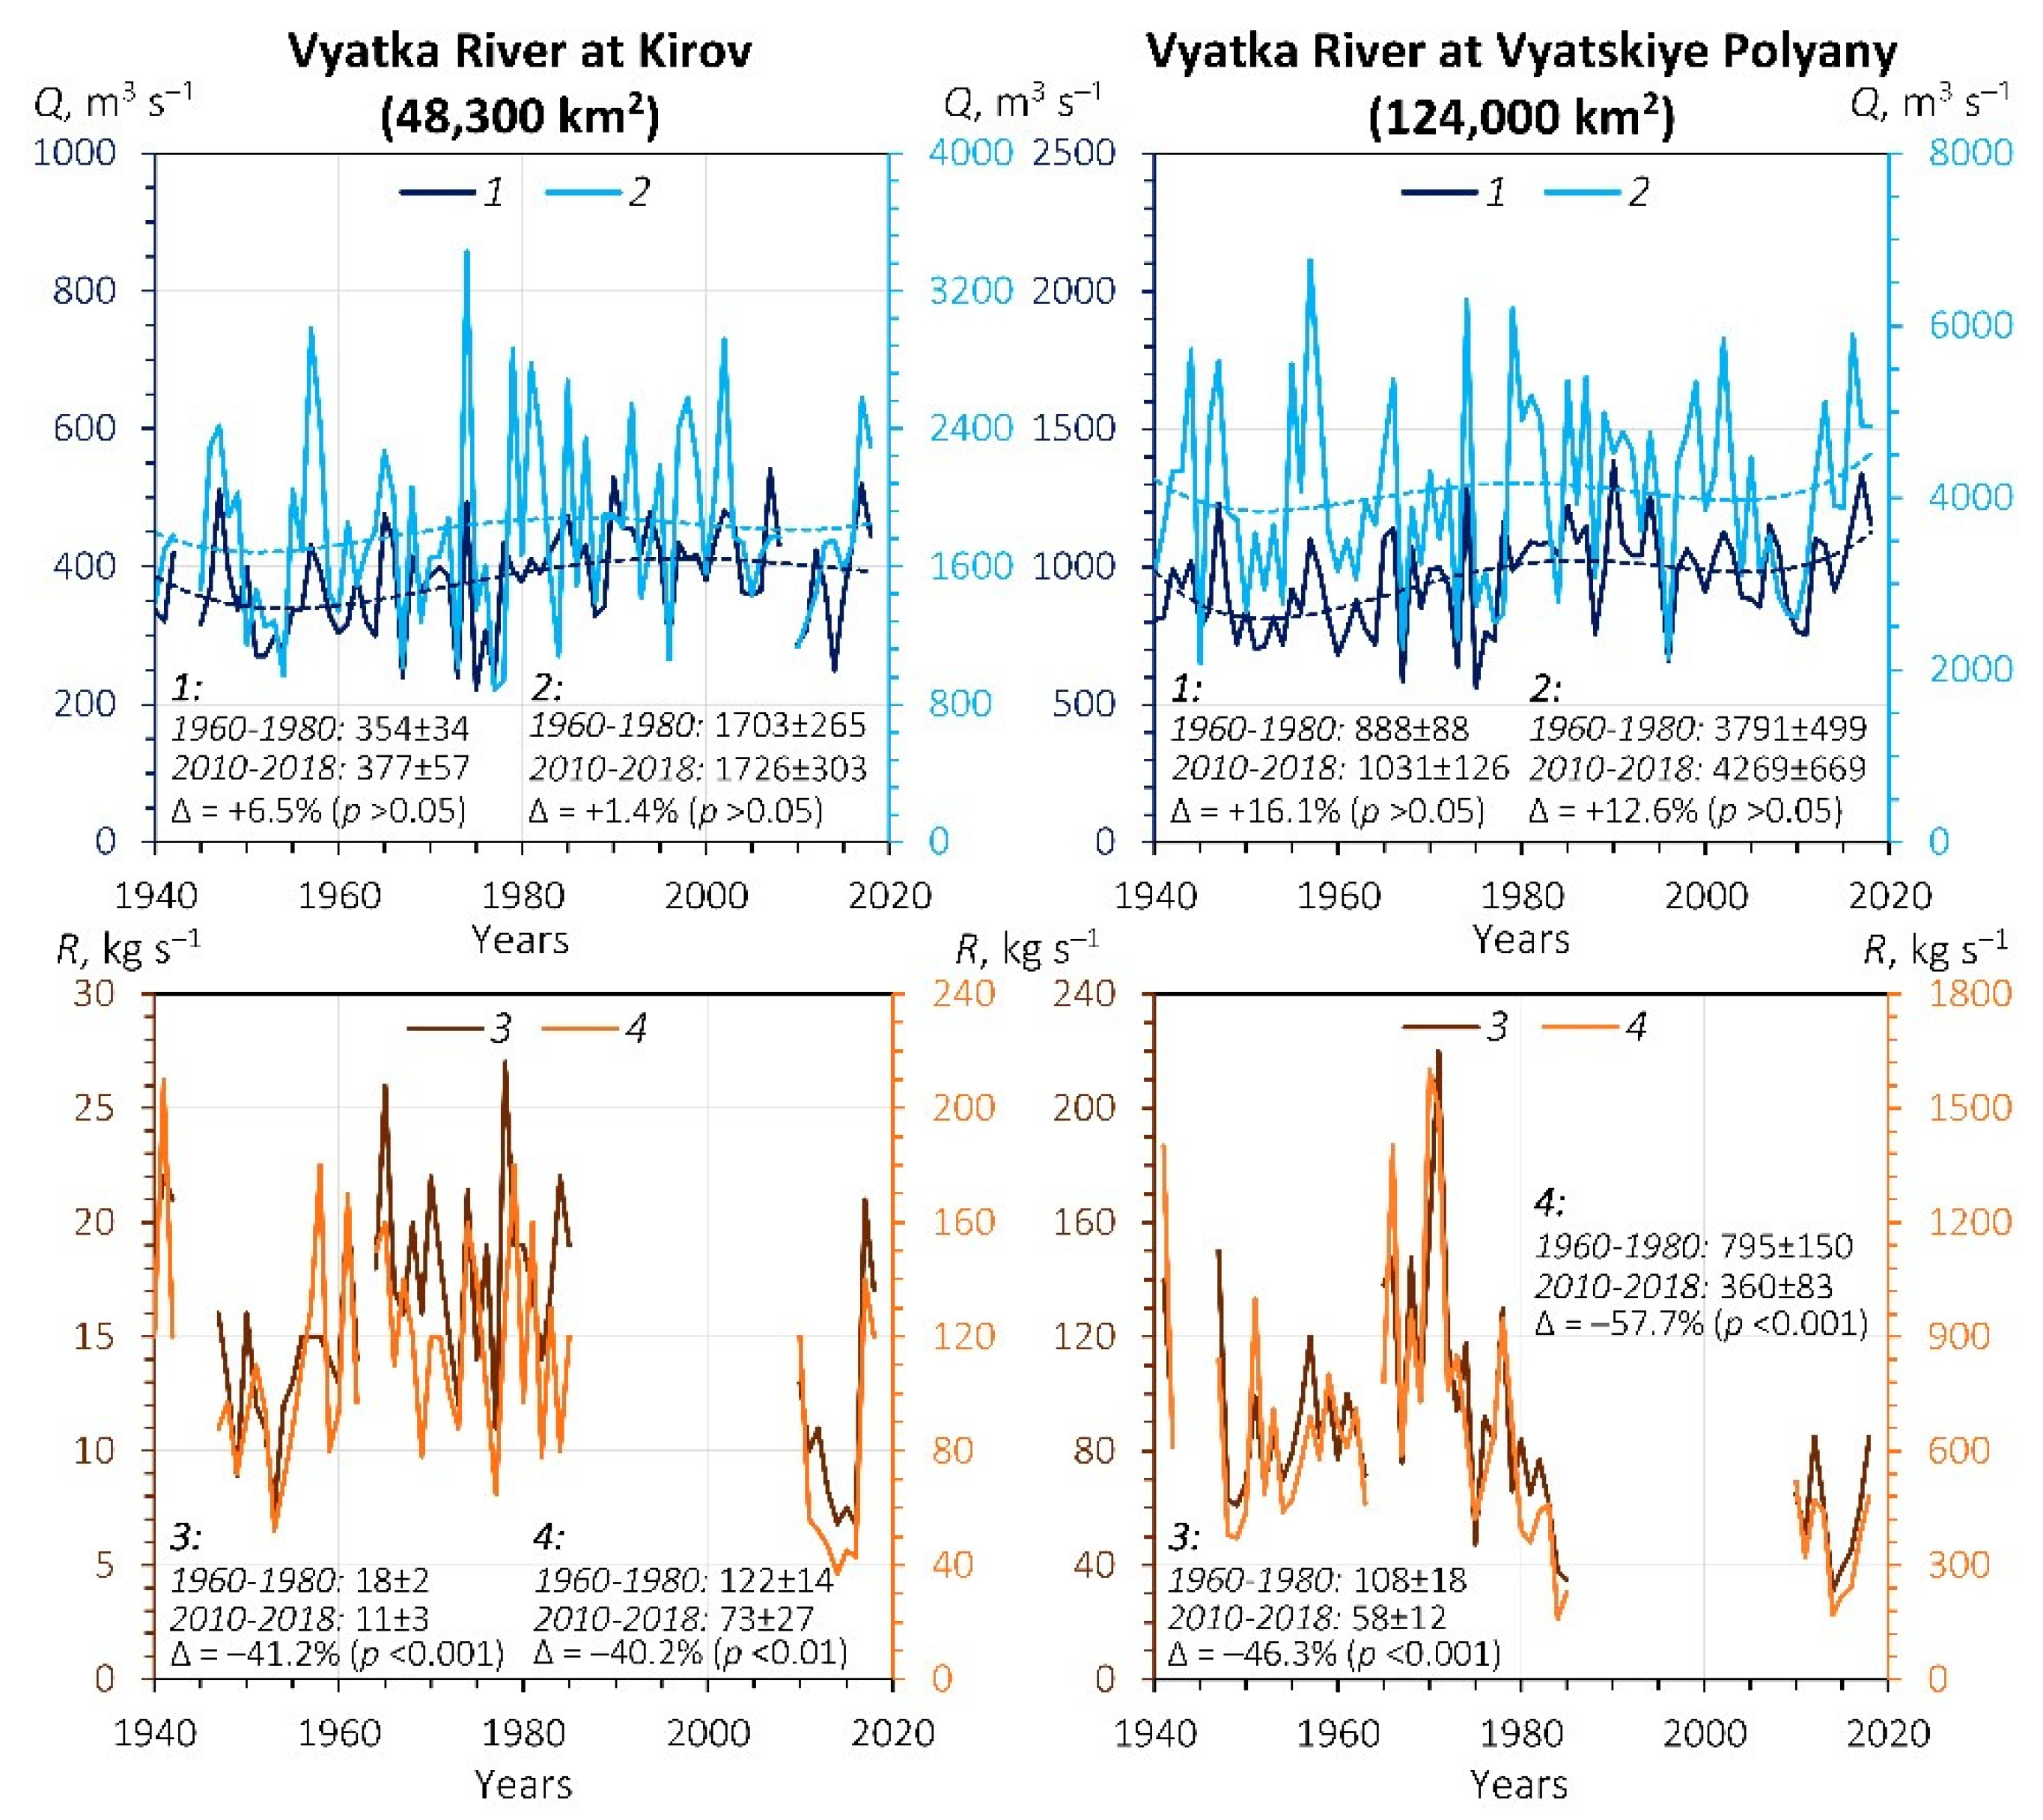
Due to the limited availability of data on the suspended sediment load of Russia’s rivers, we analyze only one river in this landscape zone—the Vyatka River. It drains about 129,000 km2 of the zone’s east, mainly within the Kirov Oblast, Udmurt Republic, Komi Republic, and Perm Krai (see Figure 2A).
In this river basin, there was a steady and statistically significant downward trend in the long-term series of the mean annual and spring (snowmelt-induced) suspended sediment load of the river after the 1960s and 1970s (Figure 7). Moreover, this tendency was better expressed in the south-west sub-basin of the river, between Vyatskiye Polyany and Kirov. In this sub-basin, cultivated land now occupies twice the area (about 25%) than in the north-east sub-basin, upriver of Kirov (about 13%).
We found confirmation of this in the change in the intensity of erosion and accumulation of its products in the adjacent basin of the Izh River, located south of the Vyatka River basin, within the Udmurt Republic (see Figure 2A). Within one (0.68 km2) of the small dry-valley catchments located in the south part of the republic, there was a noticeable reduction, by at least 60%, in the rates of washed-out soil material accumulation at the dry valley bottom over the past 60 years [70,71]. This trend was consistent with a decline in average rates of gully headcut retreat within the republic’s cultivated land over the past 40 years from 1.3 m y−1 in 1978–1997 to 0.3 m y−1 in 1998–2014 [72,73]. The slowdown in gullies’ growth over the last decades also took place in the neighboring Perm Krai [74] and the south half of the Nizhny Novgorod Oblast [75], at the junction of the forest and forest-steppe zones. Thus, in the forest zone, at least within its east part, the soil/gully erosion rates decreased at least by 54–61%, or an average of 58%, from the 1960s and 1970s to the 2000s and 2010s, according to the data on suspended sediment load of the Vyatka River (124,000 km2).
3.2.2. Forest-Steppe Zone
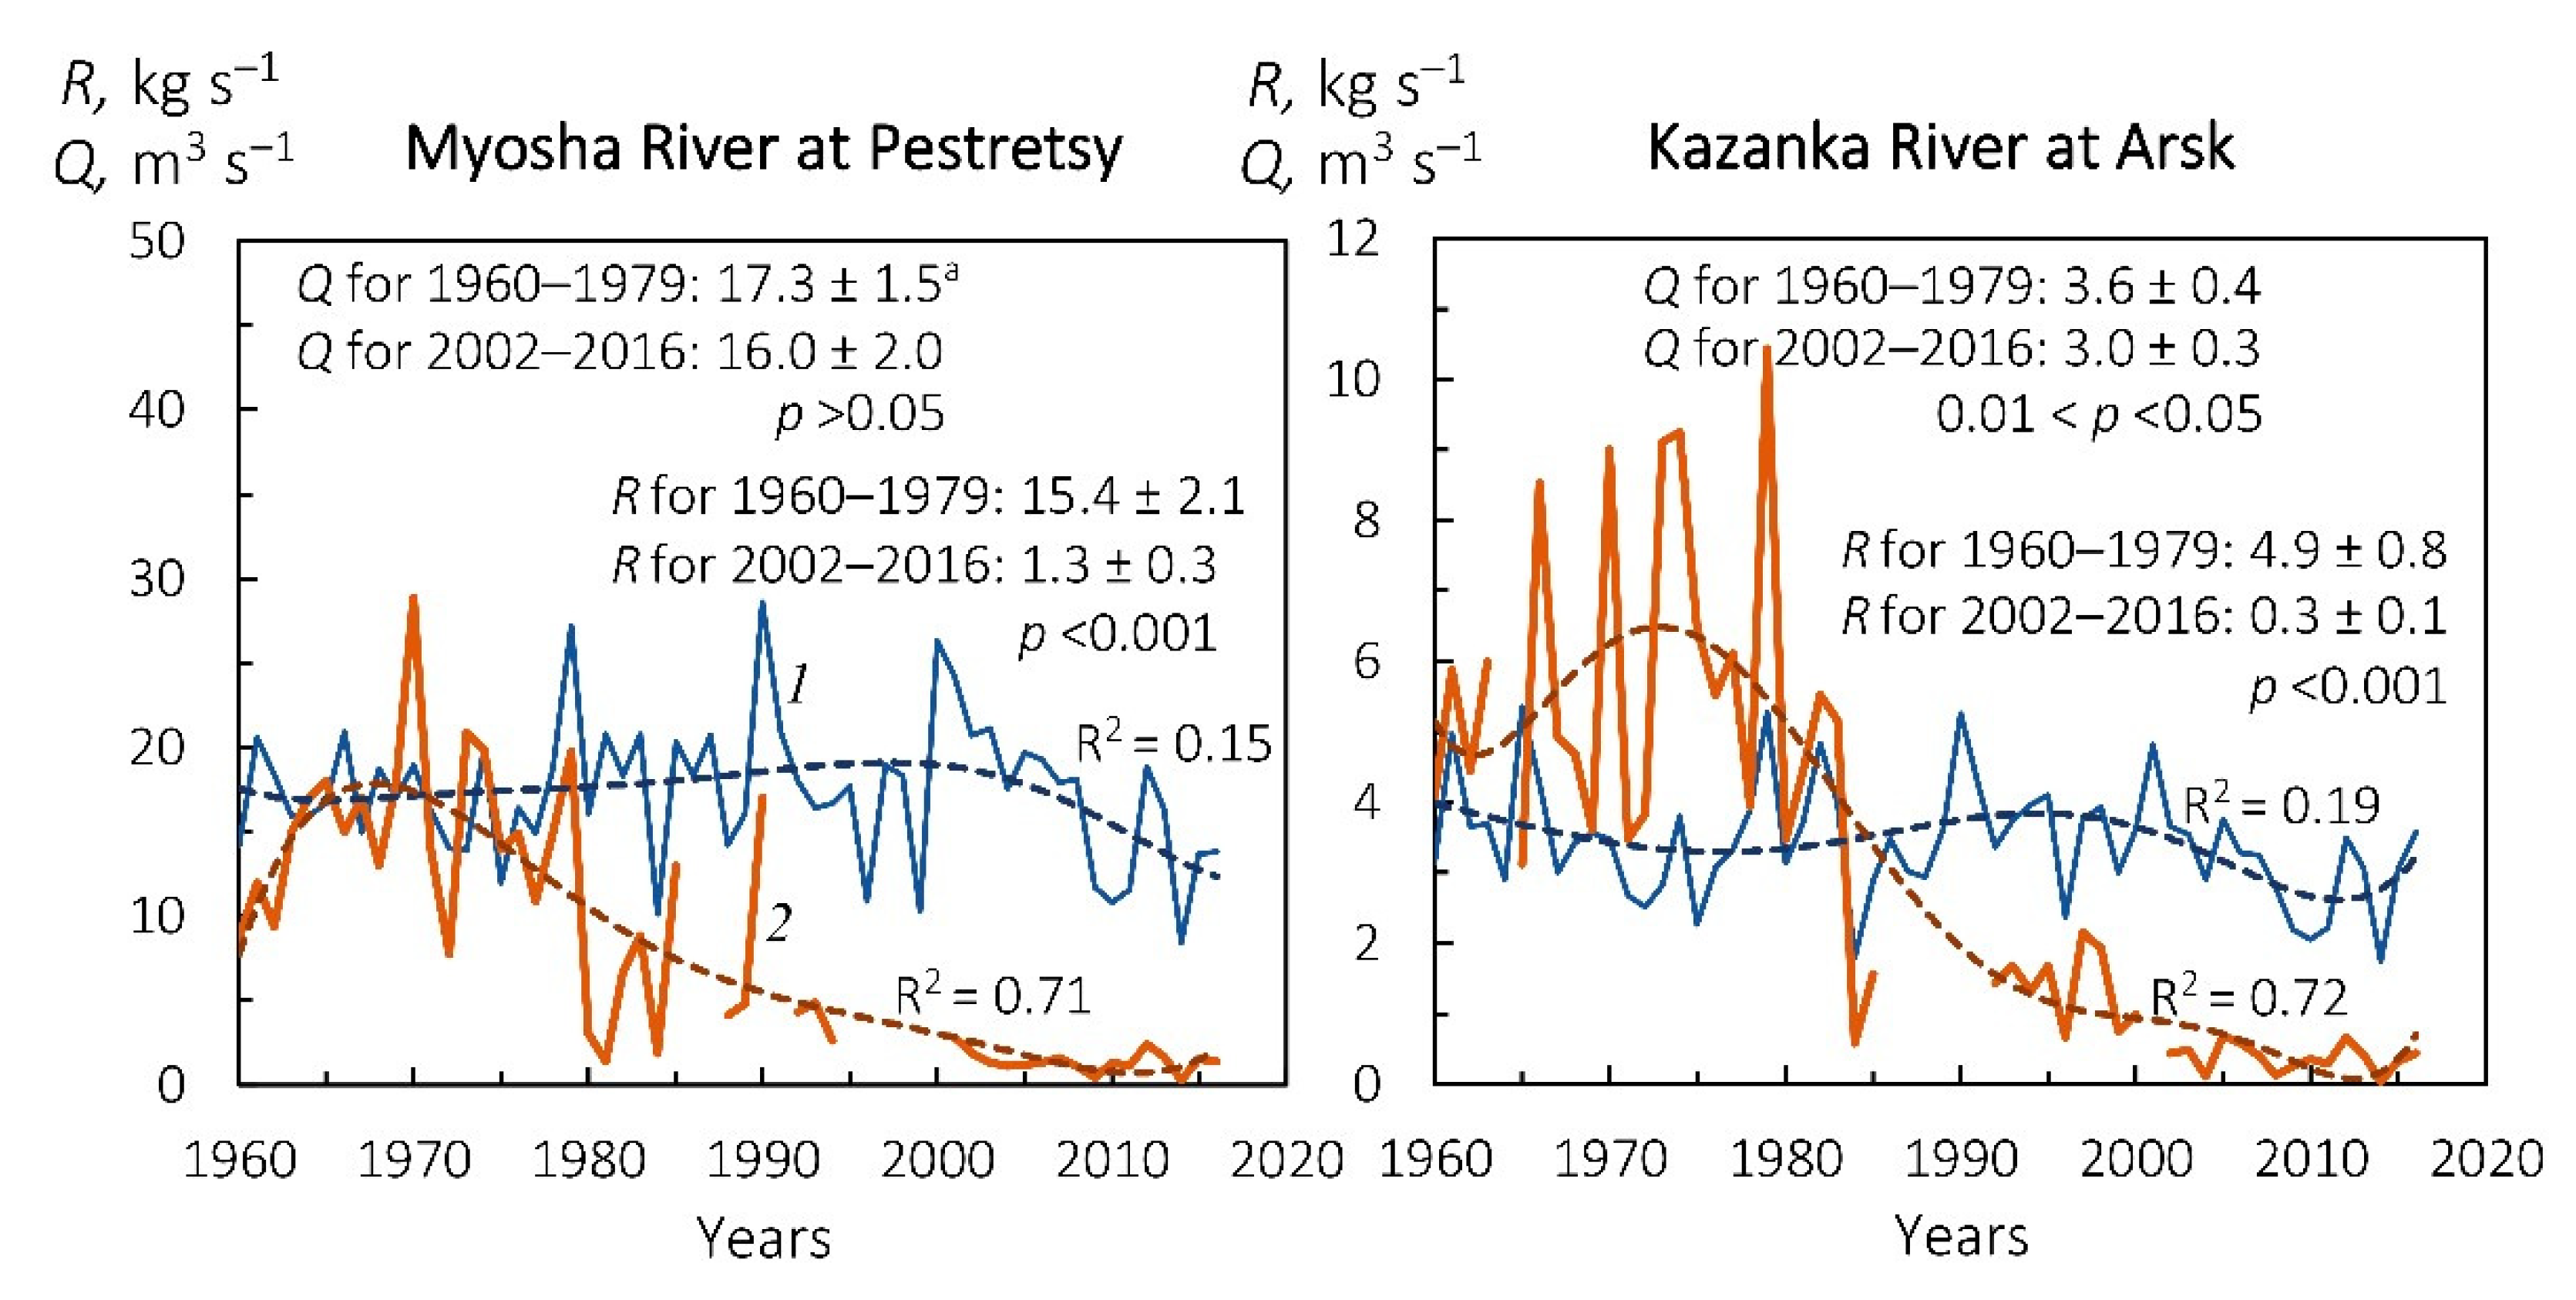
Kazanka River at Arsk (the upper reaches) and Myosha River at Pestretsy: the average annual load of suspended sediment of the rivers reduced with a high statistical significance between 1960–1979 and 2002–2016: by 93.9% in the Kazanka River and 76.9% in the Myosha River (Figure 8). The studies [70,76] in one of the small dry-valley catchments of the Myosha River basin also confirmed these trends. Therefore, if during 1963–1986 the average rates of dry-valley bottom sedimentation of washed-out soil material, using radiocesium as a chronomarker for sediment dating, were 0.92–1.81 cm per annum, then during 1987–2015 they were only 0.17–0.50 cm per annum, i.e., they reduced by at least 72–81%. It is noteworthy that in this part of the Republic of Tatarstan, where the basins of these rivers are located, almost 60% of the studied gullies almost completely stopped linear growth from 1960–1970 to 2009–2016 [77].
Kichuy River at Utyashkino: the following temporal changes in the average annual load of suspended sediment were found in this river: from 1963–1979–4.28 ± 1.05 kg s−1, 1980–1998–1.83 ± 1.19 kg s−1, and 2003–2012–0.92 ± 0.14 kg s−1, i.e., the load reduced with p < 0.001 by 78.5% between 1963–1979 and 2003–2012.
Tushonka River at Sergeyevka and Syzranka River at Repyovka: in the Tushonka River, the annual yield of suspended sediment decreased with p < 0.001 by 96.5% between 1967–1980 and 2008–2016. In the neighboring and larger basin of the Syzranka River, a reduction with p < 0.001 in the yield was 93.6%: 1963–1975–110 Mg km−2 y−1, 2008–2016–7 Mg km−2 y−1. As in the Myosha River and Kazanka River cases, the yield in these rivers also began to decline most noticeably from the first half of the 1980s.
Krasnaya River at Krasnaya Reka: the following temporal changes in the average annual load of suspended sediment were found in this river: during 1967–1979 (without 1969)–0.89 ± 0.47 kg s−1, 1980–2001 (without 1987 and 1998)–0.39 ± 0.17 kg s−1, and 2002–2016 (without 2002, 2006, 2010, and 2014)–0.006 ± 0.002 kg s−1, i.e., the load reduced with p < 0.001 by 99.3% between 1967–1979 and 2002–2016. Such a high rate of load decrease was most likely associated with a favorable combination of a relatively arid climate with the geomorphic/geological structure on this territory–the predominance of loose alluvial deposits of the Volga paleo-valley. This circumstance affects the runoff of melt/rainfall water against the background of significant agricultural degradation in the Ulyanovsk Oblast during the last few decades.
In the western sector of the forest-steppe zone, we also found significant decreases in the rates of river suspended sediment load/yield and washed-out soil accumulation.
Sosna River at Yelets: this river had the following temporal dynamics of the average annual load of suspended sediment: during 1950–1975 of 49.9 kg s−1, 2008–2015 of 2.8 kg s−1. The load reduced with p < 0.001 by 94.4% between the periods.
Krasivaya Mecha River at Yefremov: between 1965–1975 and 2008–2015, annual suspended sediment yield reduced in the river’s basin from 29.0 to 3.7 Mg km−2 y−1, i.e., by 87.2%. This reduction was also statistically significant (p < 0.001).
These distinct decreases in river suspended sediment load/yield are supported by results from the research of [78] in this sector of the forest-steppe zone of European Russia, within the Orel Oblast, Tula Oblast, Kursk Oblast, and Penza Oblast. Having studied the temporal and spatial variability of modern sedimentation rates on floodplains of six rivers in the sector using the radioactive isotope of cesium-137 as a chronomarker, these authors determined that most of these rivers were characterized by a decrease (at least by 66–80%) in the rates in 1986–2008 compared to the previous period (1964–1986). Thus, in the forest-steppe zone, at least within European Russia, according to the data on suspended sediment load of eight analyzed rivers with the total area of their basins of 29,750 km2, the soil/gully erosion rates decreased by 77–99%, or an average of 90%, from the 1960s and 1970s to the 2000s and 2010s.
3.2.3. Steppe Zone
Samara River at Yelshanka (the upper reaches of the river): a decrease in the river’s suspended sediment yield was almost threefold between 1968–1984 to 2008–2012–from 15.7 to 5.3 Mg km−2 y−1, or by 66.2%. This trend is well supported by the commensurate rates of washed-out soil material accumulation at the bottom of one of the typical dry valleys located in the basin of the Buzuluk River, one of the left-bank tributaries of the Samara River [79].
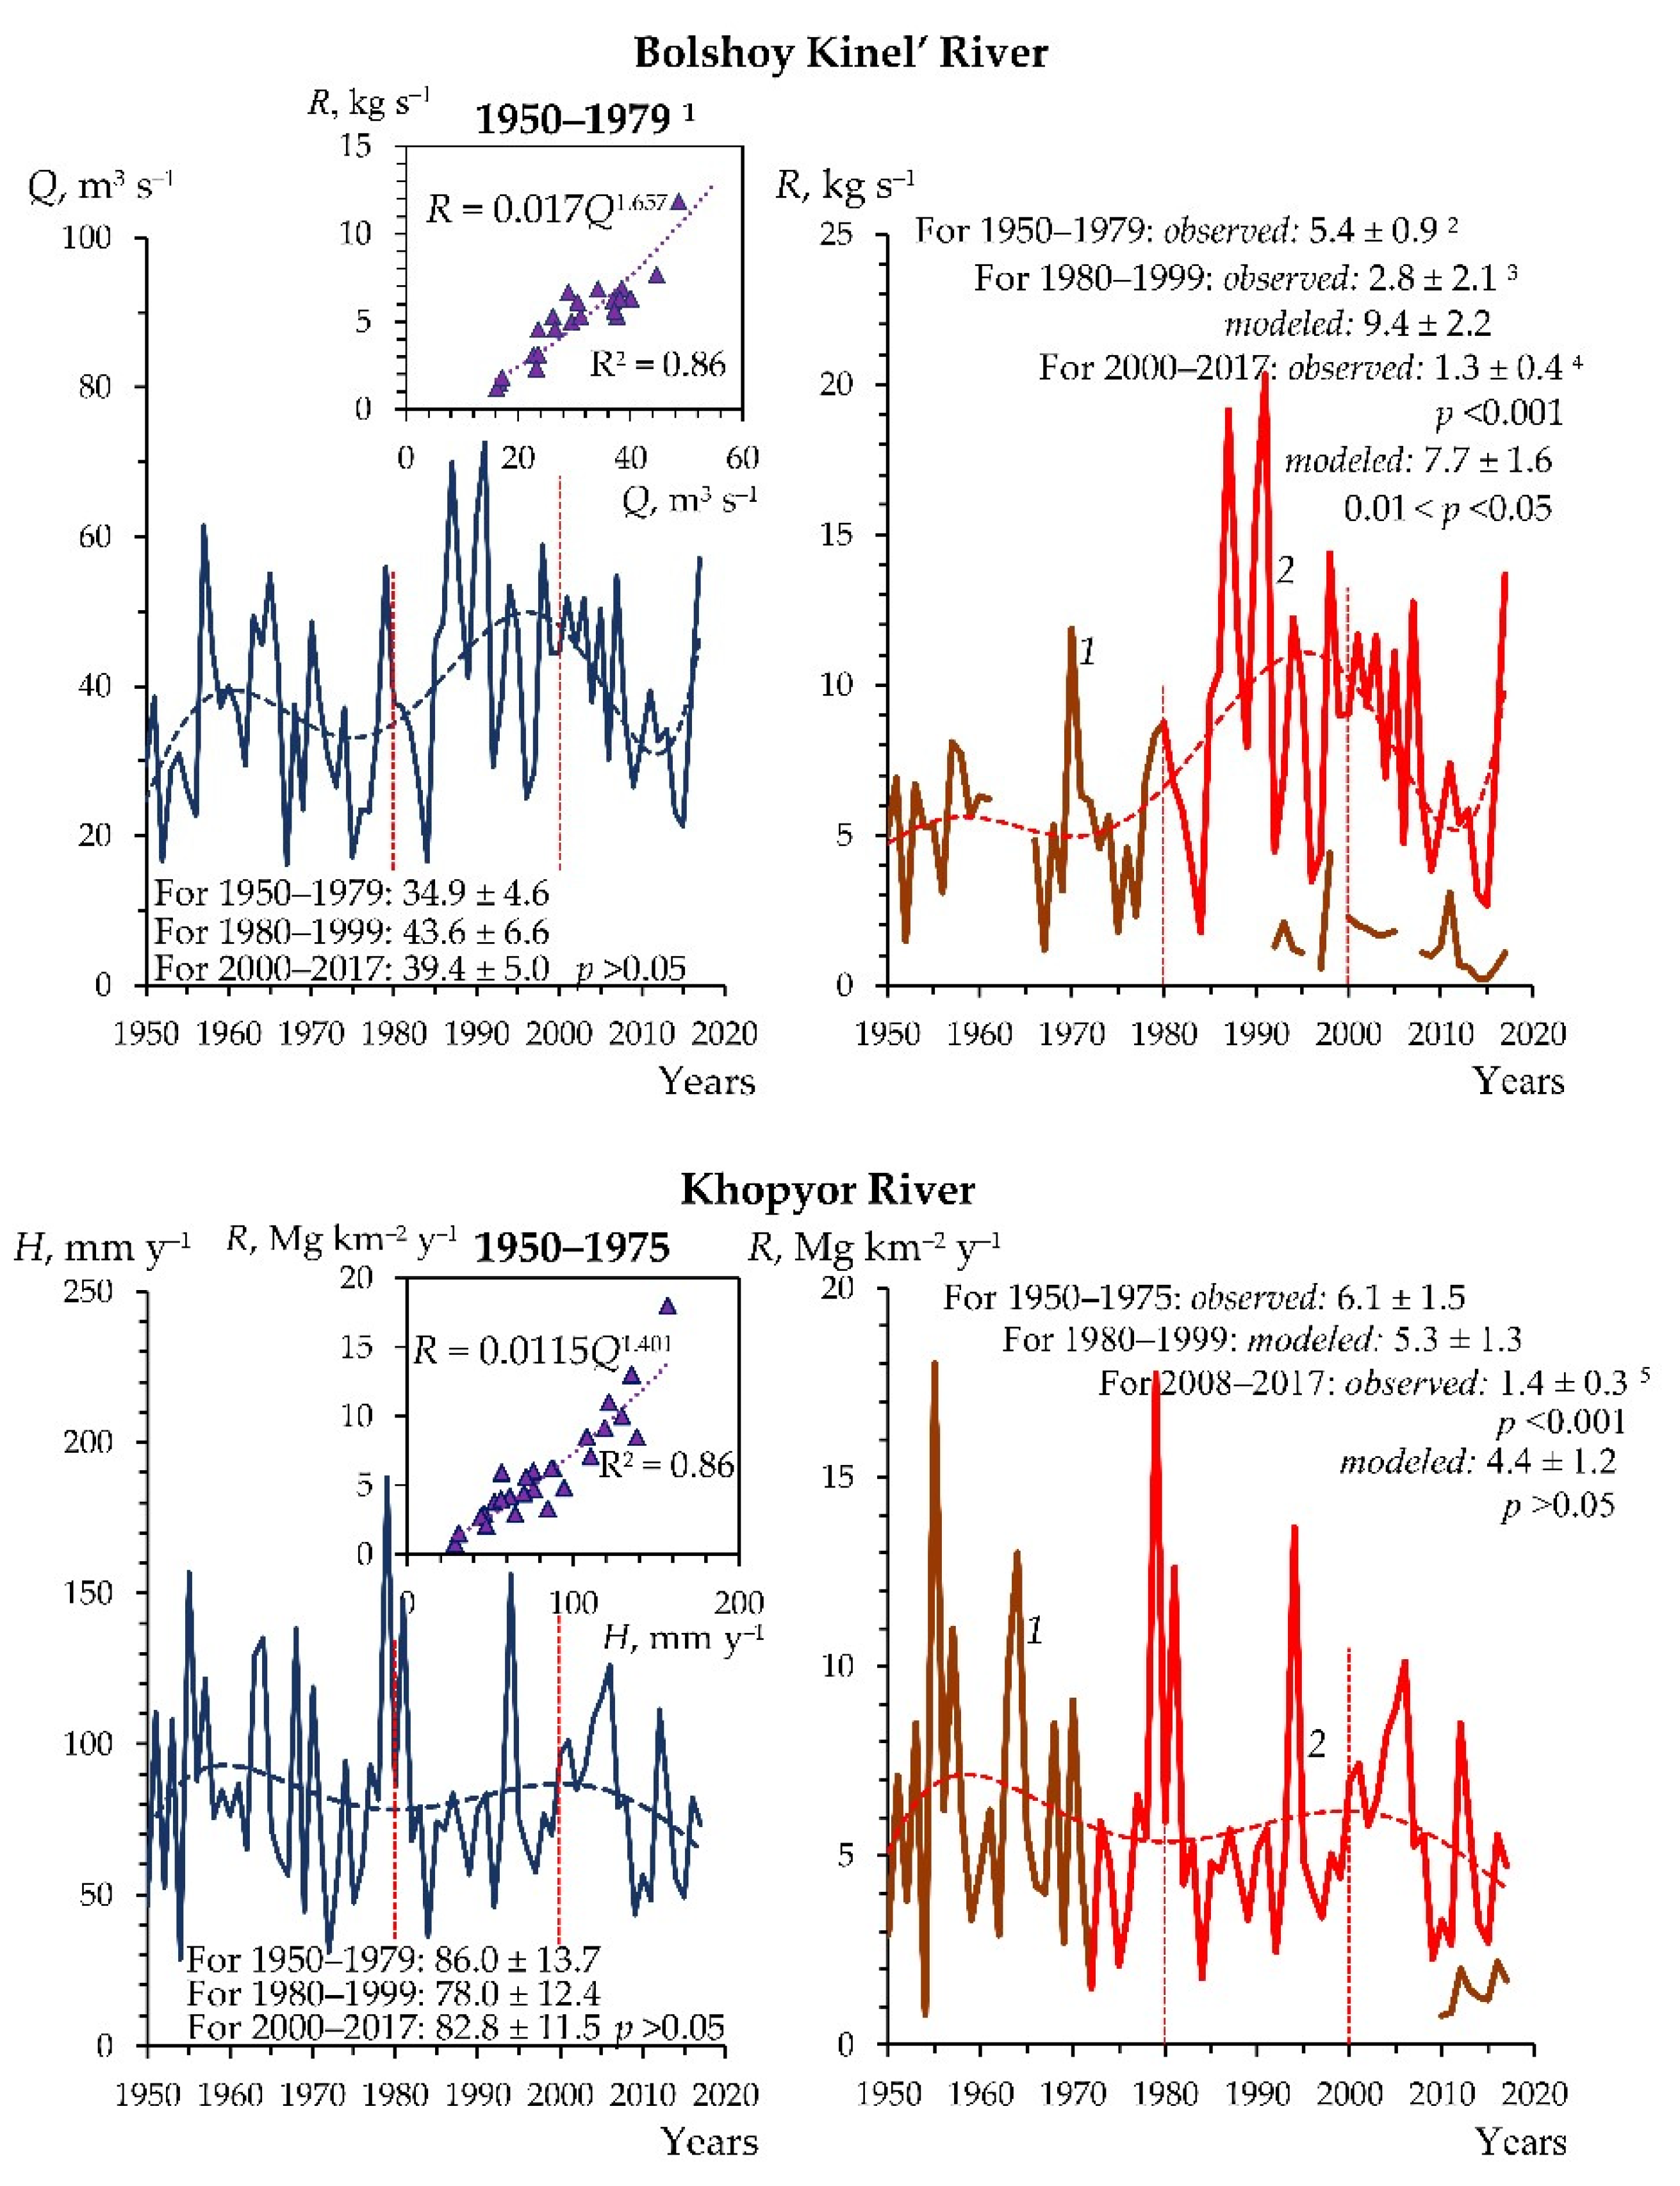
Bolshoy Kinel’ River at Timashevo (the upper and middle reaches of the river): from 1950–1979 to 2000–2017, the suspended sediment load of the river decreased (a statistically significant decrease) by more than four times, or >76% (Figure 9). It is noteworthy that the load was almost six times lower over the last period than what was modeled based on calculations, using the close relationship between the water flow and sediment load of the river for 1950–1979. In this case, it was assumed that there were no climate and land-use/-cover changes in the last two decades (see Figure 9).
Chagra River at Novotulka (the upper and middle reaches of the river): between 1965–1980 and 2008–2015, the river’s suspended sediment yield reduced from 11.5 to 0.9 Mg km−2 y−1, i.e., by 92.2%. This reduction was statistically significant (p < 0.001).
Bolshoy Karaman River at Sovetskoye (the upper and middle reaches of the river): between 1967–1979 and 2008–2015, the river’s suspended sediment yield reduced from 13.6 to 1.7 Mg km−2 y−1, i.e., by 88.5%. This reduction was also statistically significant (p < 0.001).
Khopyor River at Besplemyanovsky and Medveditsa River at Lysyye Gory (the upper and middle reaches of the rivers): according to [64], the rivers’ annual suspended sediment yield decreased by 72–77% between the 1950s and 1970s and 2008–2015/2017 (see Figure 9). These findings are also well consistent with the temporal dynamics of washed-out soil material accumulation rates within the bottom of one of the dry valleys located in the basin’s upper reaches of the Medveditsa River [64].
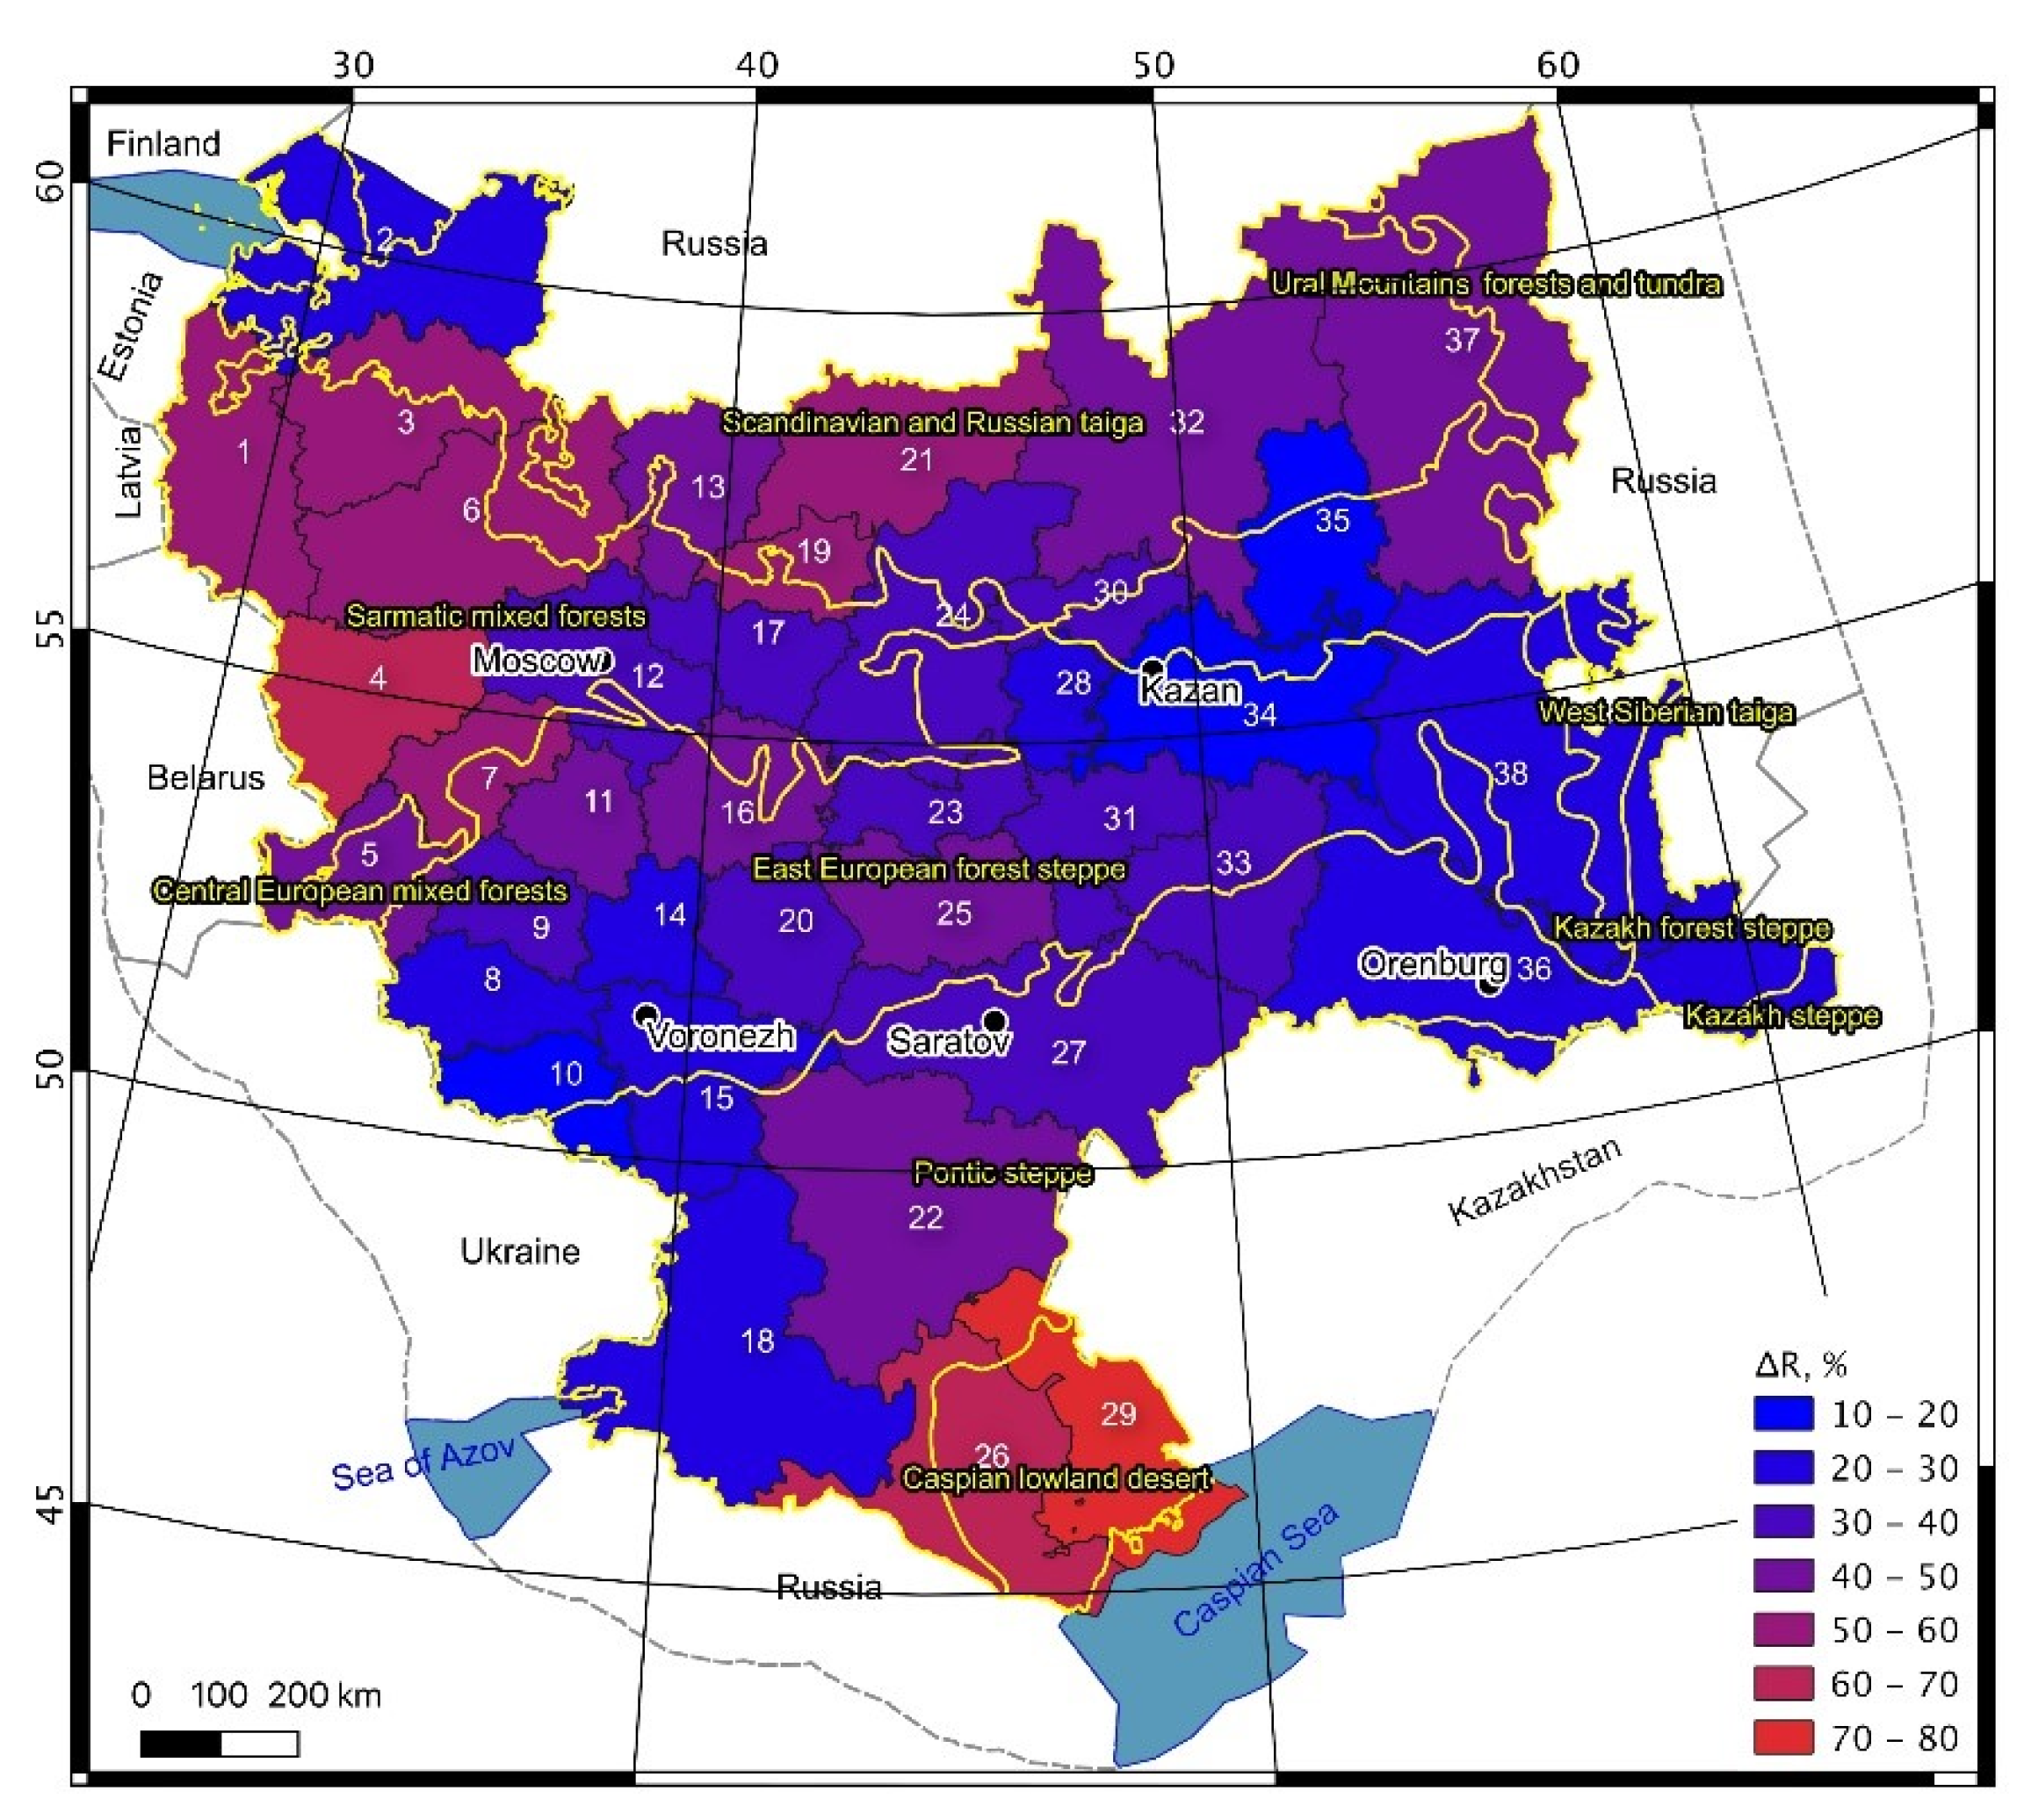
Thus, in the steppe zone, at least within European Russia, the erosion rates decreased by 66–92%, or an average of 77.2%, from the 1960s and 1970s to the 2000s and 2010s, according to the data on the suspended sediment load of six rivers with the total area of their basins of 93,330 km2. Unfortunately, at the moment, we do not have reliable data on the dynamics of river sediment load in the southern (dry) subzone of the steppe zone, as well as in the semi-desert zone. However, we assume similar trends within these areas, at least for the dry steppe subzone.
From the above, we can make a preliminary conclusion that the highest rates of suspended sediment load reduction of European Russia’s rivers were noted over the past decades in the forest-steppe landscape zone, the lowest–in the forest zone.
4. Discussion
4.1. The Main Reasons for the Changes in Land Cover and Agriculture
The total area of cultivated land in European Russia has decreased due to a combination of political, economic, and social reasons [19,20,21,22,23,24,25]. Their detailed analysis is beyond the scope of our study, although the main regularities are as follows.
The landscape zonation of these reasons manifested itself, for example, in the temporal dynamics (reduction) of the population, in particular the rural population, especially over the past 20 years [19,20]. It was most noticeable in the administrative regions of the forest zone, where the most significant reduction in acreage took place. In addition, in this zone, the change in cultivated land area was more dependent on population decline than in more southern regions (Figure 10). Between 1970–1987 and 1996–2017, for every 1% decrease in the population, cultivated land area reduced by an average of 0.71%, while from 1996–2004 to 2005–2017–by 2.85%. In the second case, we did not use the Moscow Oblast and Leningrad Oblast in the analysis because these two administrative regions of the Russian Federation experienced stable population growth after the collapse of the USSR in 1991. It was mainly due to economic migration from other areas of the country.
As shown above, the relative decline in cultivated land since the late USSR was greatest both in the forest zone and the Caspian Lowland’s semi-desert. This decline happened primarily because these territories are regions with agriculture climatically at risk: in the north, mainly due to frequent relatively low temperatures and high soil moisture during a relatively short growing season; in the south, in the Lower Volga River region, primarily owing to periodic droughts. In these relatively unfavorable environmental conditions, agriculture requires additional financial investments and technologies that post-communist Russia could not afford, especially in the 1990s and early 2000s.
It is also important to note that the zonation of the reduction in cultivated areas was due not only to the relatively unfavorable climatic conditions. It was also owing to the wide distribution of comparatively lesser fertile soils–mainly sod-podzolic soils in the south “belt” of the forest zone, and kastanozems in the semi-desert zone, the presence of relict glacial boulders in the forest zone’s soils [80]. Relatively high density of the network of rivers and dry valleys in the north is also not conducive to plowing the soil [81]. Moreover, in the modern agricultural landscapes of the region, the most favorable conditions for soil/gully erosion are in the southern “belt” of the forest zone and the northern part of the forest-steppe [7]. Thus, all these environmental factors also limit efficient farming, affecting its temporal dynamics.
4.2. Decrease in Surface Runoff as a Reason for Reducing the Load of Suspended Sediment and the Intensity of Erosion
Monitoring studies carried out in several administrative regions of the forest-steppe and steppe zones of European Russia showed significant surface runoff degradation over the last decades. According to field measurements data from some runoff plots [82,83,84,85,86], there was a noticeable downward trend in the depth of snowmelt runoff on plowed fields (1–1.3 mm per annum) of the forest-steppe zone after the 1950s and 1960s. This decline has accelerated (to 1.3 mm per annum) since the late 1980s [12]. The studies [85] at some water runoff plots of the Novosil Zonal Agroforestry Experimental Station (ZAGLOS) located in the Orel Oblast (see Figure 2A), SW European Russia, showed that snowmelt-induced runoff on fall-plowed fields in 1995–2005 (5–6 mm) was 6–7 times lower compared to 1958–1975 (35–38 mm). The later observations at experimental drainage sites of the Scientific Research Institute of Agriculture of the South-East (the Saratov Oblast, see Figure 2A) found that the runoff from cultivated land and compacted autumn plow in 1973–1982 was 10 and 34.5 mm, respectively, and then reduced to 1.3 and 9.1 mm, respectively, in 2004–2014 [87]. According to the data of another field monitoring studies carried out at some experimental stations located in the western and central parts of the forest-steppe and steppe zones of European Russia [88], there was also a significant reduction in the surface runoff coefficient during spring snowmelt—from 0.3–0.5 in the 1960s–1970s to 0.01–0.05 in the 2000–2010s, i.e., by more than 90%. Similar works carried out in the southern “belt” of the forest zone with a predominance of sod-podzolic soils showed that the melt surface runoff on the soil plowed in autumn for subsequent spring sowing decreased from 62 mm in 1982–1988 to 18 mm in 1989–1996, i.e., by 71% [83].
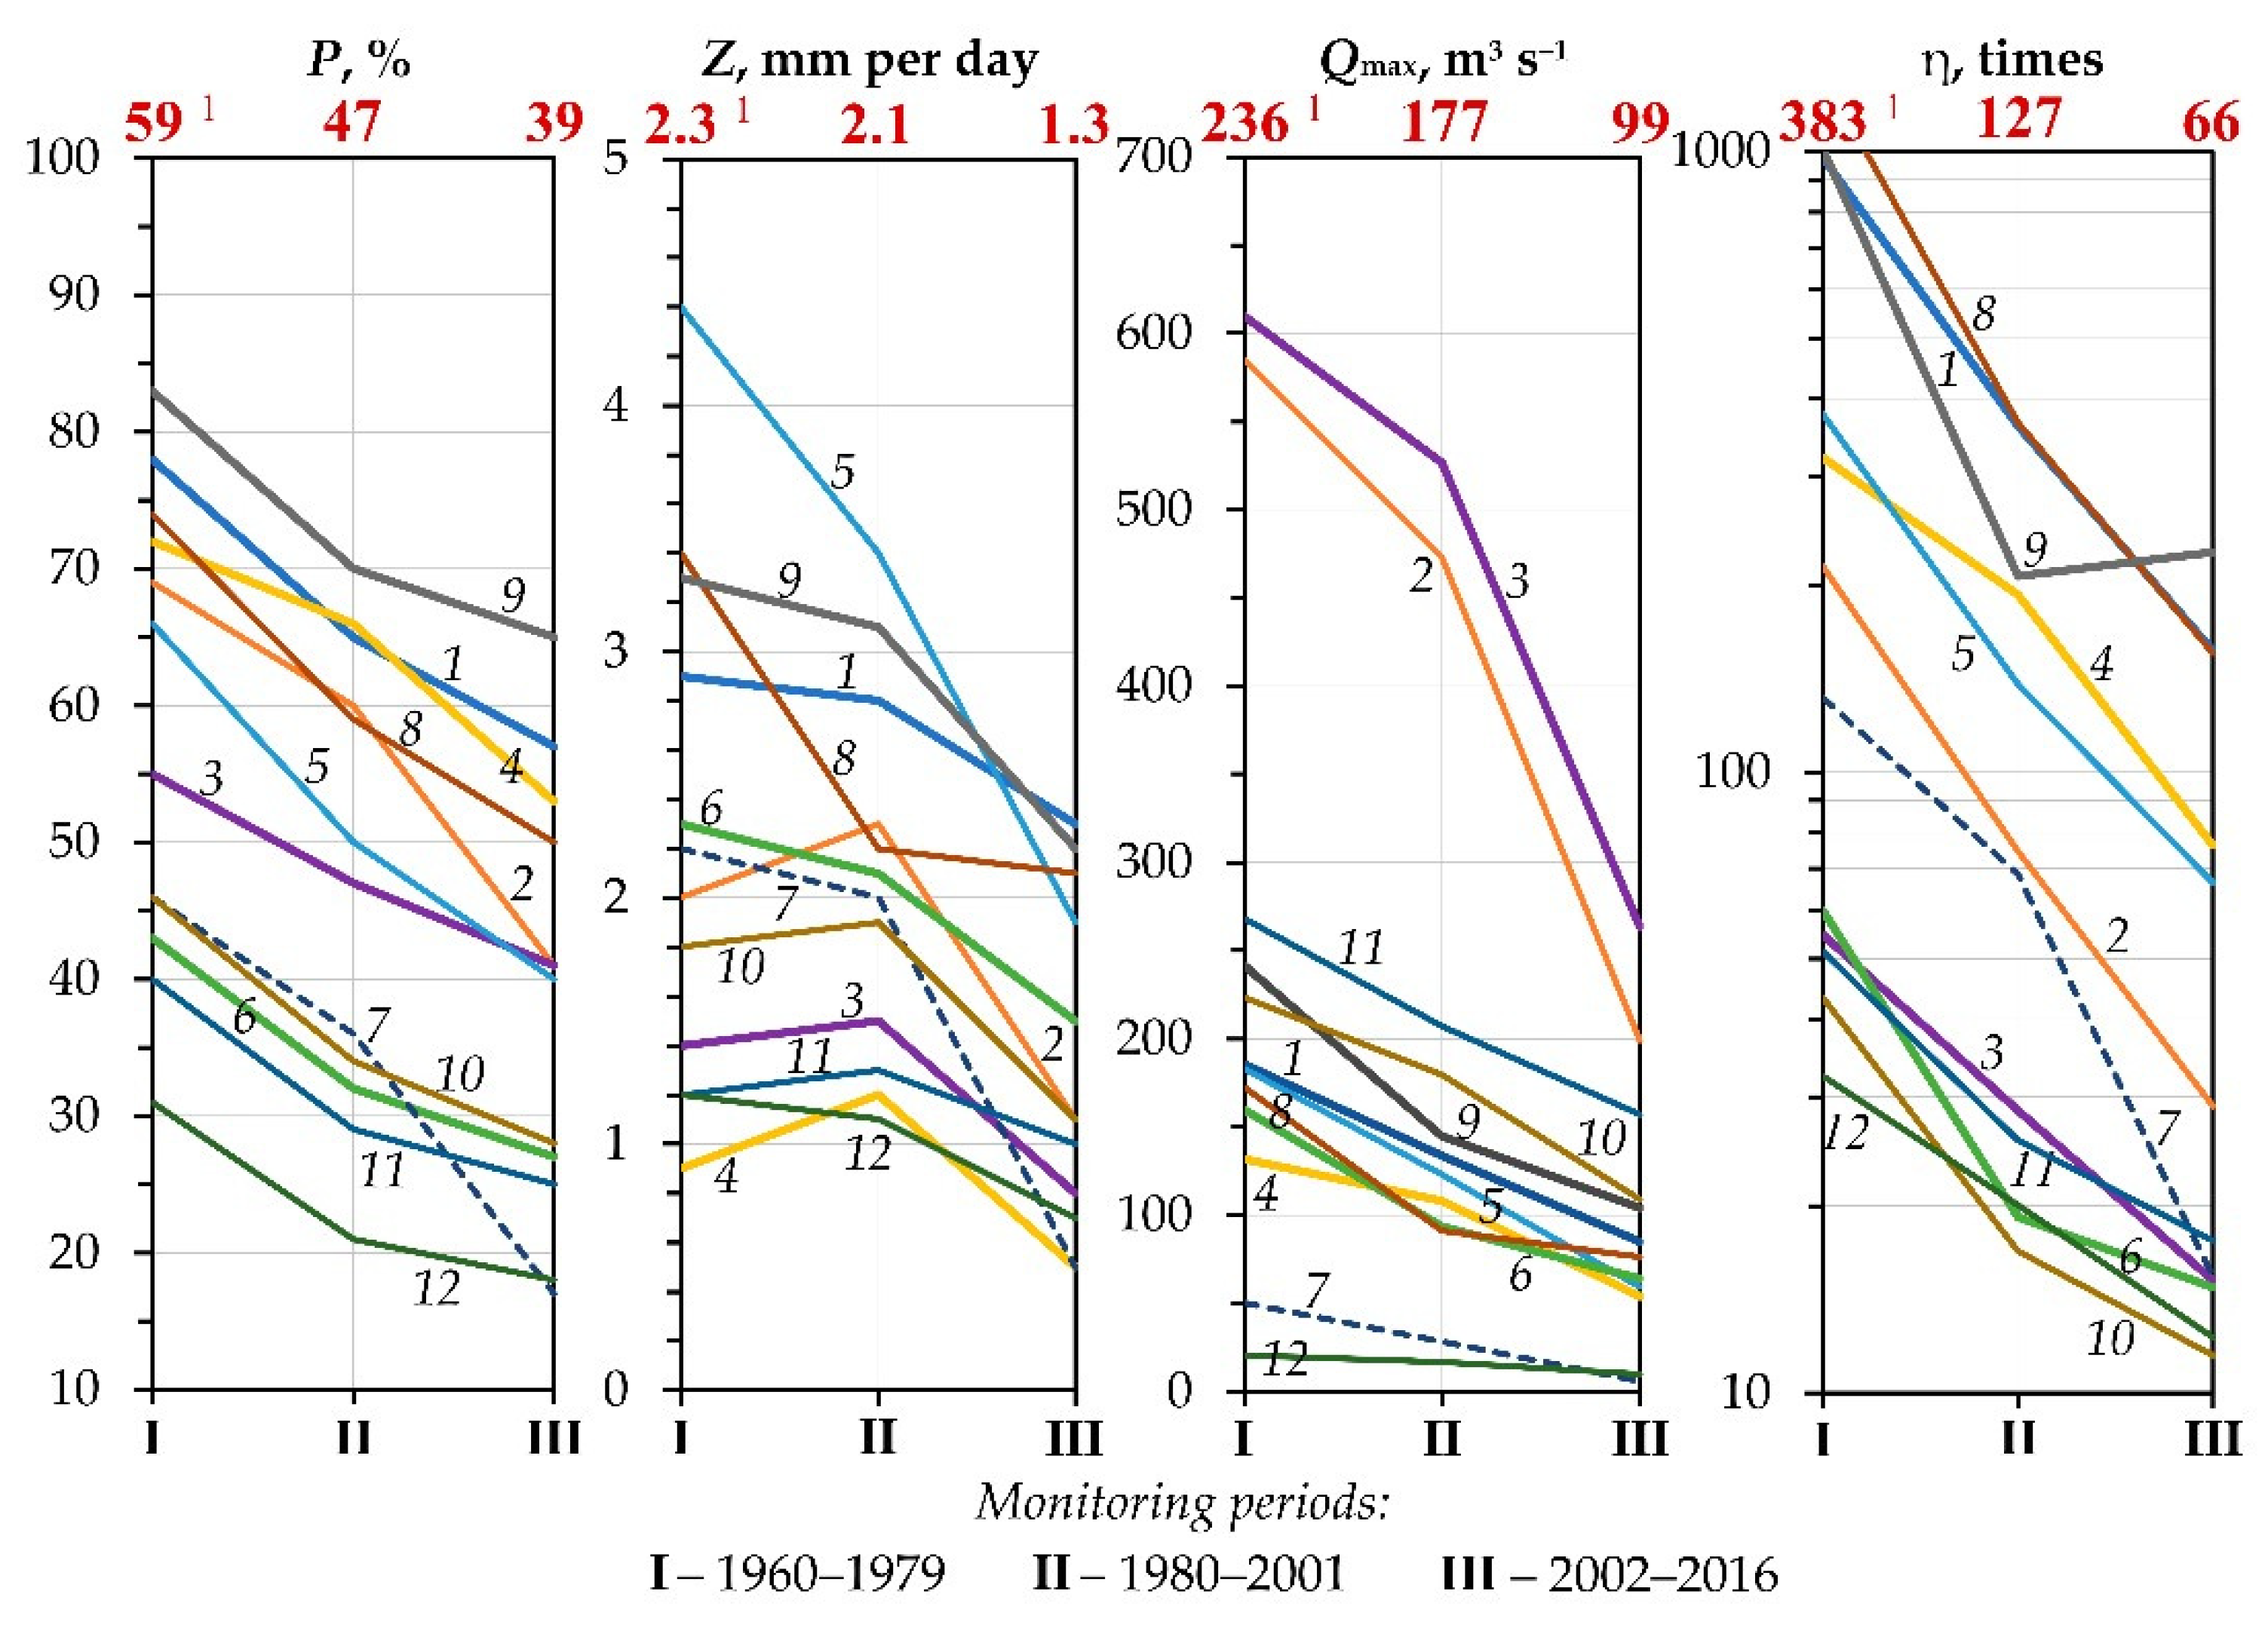
The changes in the surface runoff noted above are confirmed by the long-term dynamics of the water flow of the study region’s rivers. Analysis of recent changes in river water flow within the European subcontinent and adjacent territories of Asia and Africa demonstrated [48,49,50] that within the southern mega-slope of the East European Plain and most of the south of the forest zone, a noticeable “degradation” in snowmelt-induced flood flow was observed over the last decade. This degradation was primarily manifested in a decrease in both volumes and the intensity of the flow, in changes in its calendar terms, and a significant reduction in maximum river water discharge. The greatest degradation of the flow was found in the Don River basin and some river basins of the Middle Volga region [49]. Figure 11 gives an example of such degradation in the rivers of the Middle Volga region. Similar trends in water flow were also observed in the Baltic countries (Estonia, Latvia, and Lithuania) [89], as well as in Eastern Scandinavia [90], Poland, Belarus, and northern Ukraine [91]. In other words, these changes covered almost completely the south of the forest zone, as well as the forest-steppe and steppe zones of Eastern Europe. However, in some large river basins of northern European Russia (the Onega River, Severnaya Dvina River, Mezen River, etc.), there was a downward trend in snowmelt-induced flood flow during 1960–2010 [50].
All the changes were accompanied by a significant decrease in the intra-annual irregularity of river flow, which indicates a change in the ratio of surface and underground runoff between the main hydrological seasons in this region of Europe. This is well demonstrated by the example of the Bolshoy Kinel’ River, where along with a decrease in flood runoff, an increase in water discharge was noted in all other months of the year (Table 5). The increase in the baseflow of the river in the warm season was primarily due to the redistribution of surface snowmelt water runoff into an underground runoff because of climate and land-cover/-use changes within its basin. The significant increase in the river’s baseflow in the cold season (December to March) resulted from an increase in the number of thaws over the last decades [49].
Thus, a reduction in the surface melt runoff as the leading driving force of water erosion processes in most of European Russia [1,3,4,12] has become the main reason for the aforementioned decrease in the load of suspended sediment and the intensity of erosion in the river basins of this region in the last decades. This reduction was driven by both changes in climate and human (mainly agricultural) activities.
4.3. The Role of Land-Cover/-Use Changes in Reducing the Load of Suspended Sediment and the Intensity of Erosion
The role of human activities in reducing the rates of erosion over vast areas of the region would manifest itself as follows.
First of all, this is a decrease in cultivated areas as one of the most erosion-hazardous elements of the environment. Numerous studies [1,3,4,7,9] carried out at different scales show that plowing of the soil can intensify its erosion and increase sediment load in rivers by tens, hundreds, and even thousands of times compared to natural, anthropogenically undisturbed landscapes. Accordingly, a decrease in cultivated land significantly reduces these processes’ intensity since abandoned arable lands are covered over time by vegetation, the characteristics of which become close to zonal vegetation. On abandoned lands, thanks to the forming sod and litter under forest vegetation, the most favorable conditions are created to convert snowmelt-induced and rainfall-induced surface runoff into underground runoff (an increase in the underground water supply of rivers and their baseflow). There was also a sharp decrease or complete cessation of soil washout and the formation of linear erosional forms due to the increased anti-erosion resistance of the vegetation cover [1,3,4,5,81]. In addition, under the formed sod and litter, the best conditions are created for moistening the soil before it freezes in winter. All other things being equal, this circumstance, as a rule, leads to less freezing of the soil in winter and, consequently, better filtration of meltwater into the ground in spring during the snow melting period. This further minimizes the likelihood of soil and gully erosion. Thus, the rate of reduction of acreage in a particular region or landscape zone determines a more or less proportional (by rough estimate) decrease in the volume of soil material washed away from the cultivated slopes of river basins.
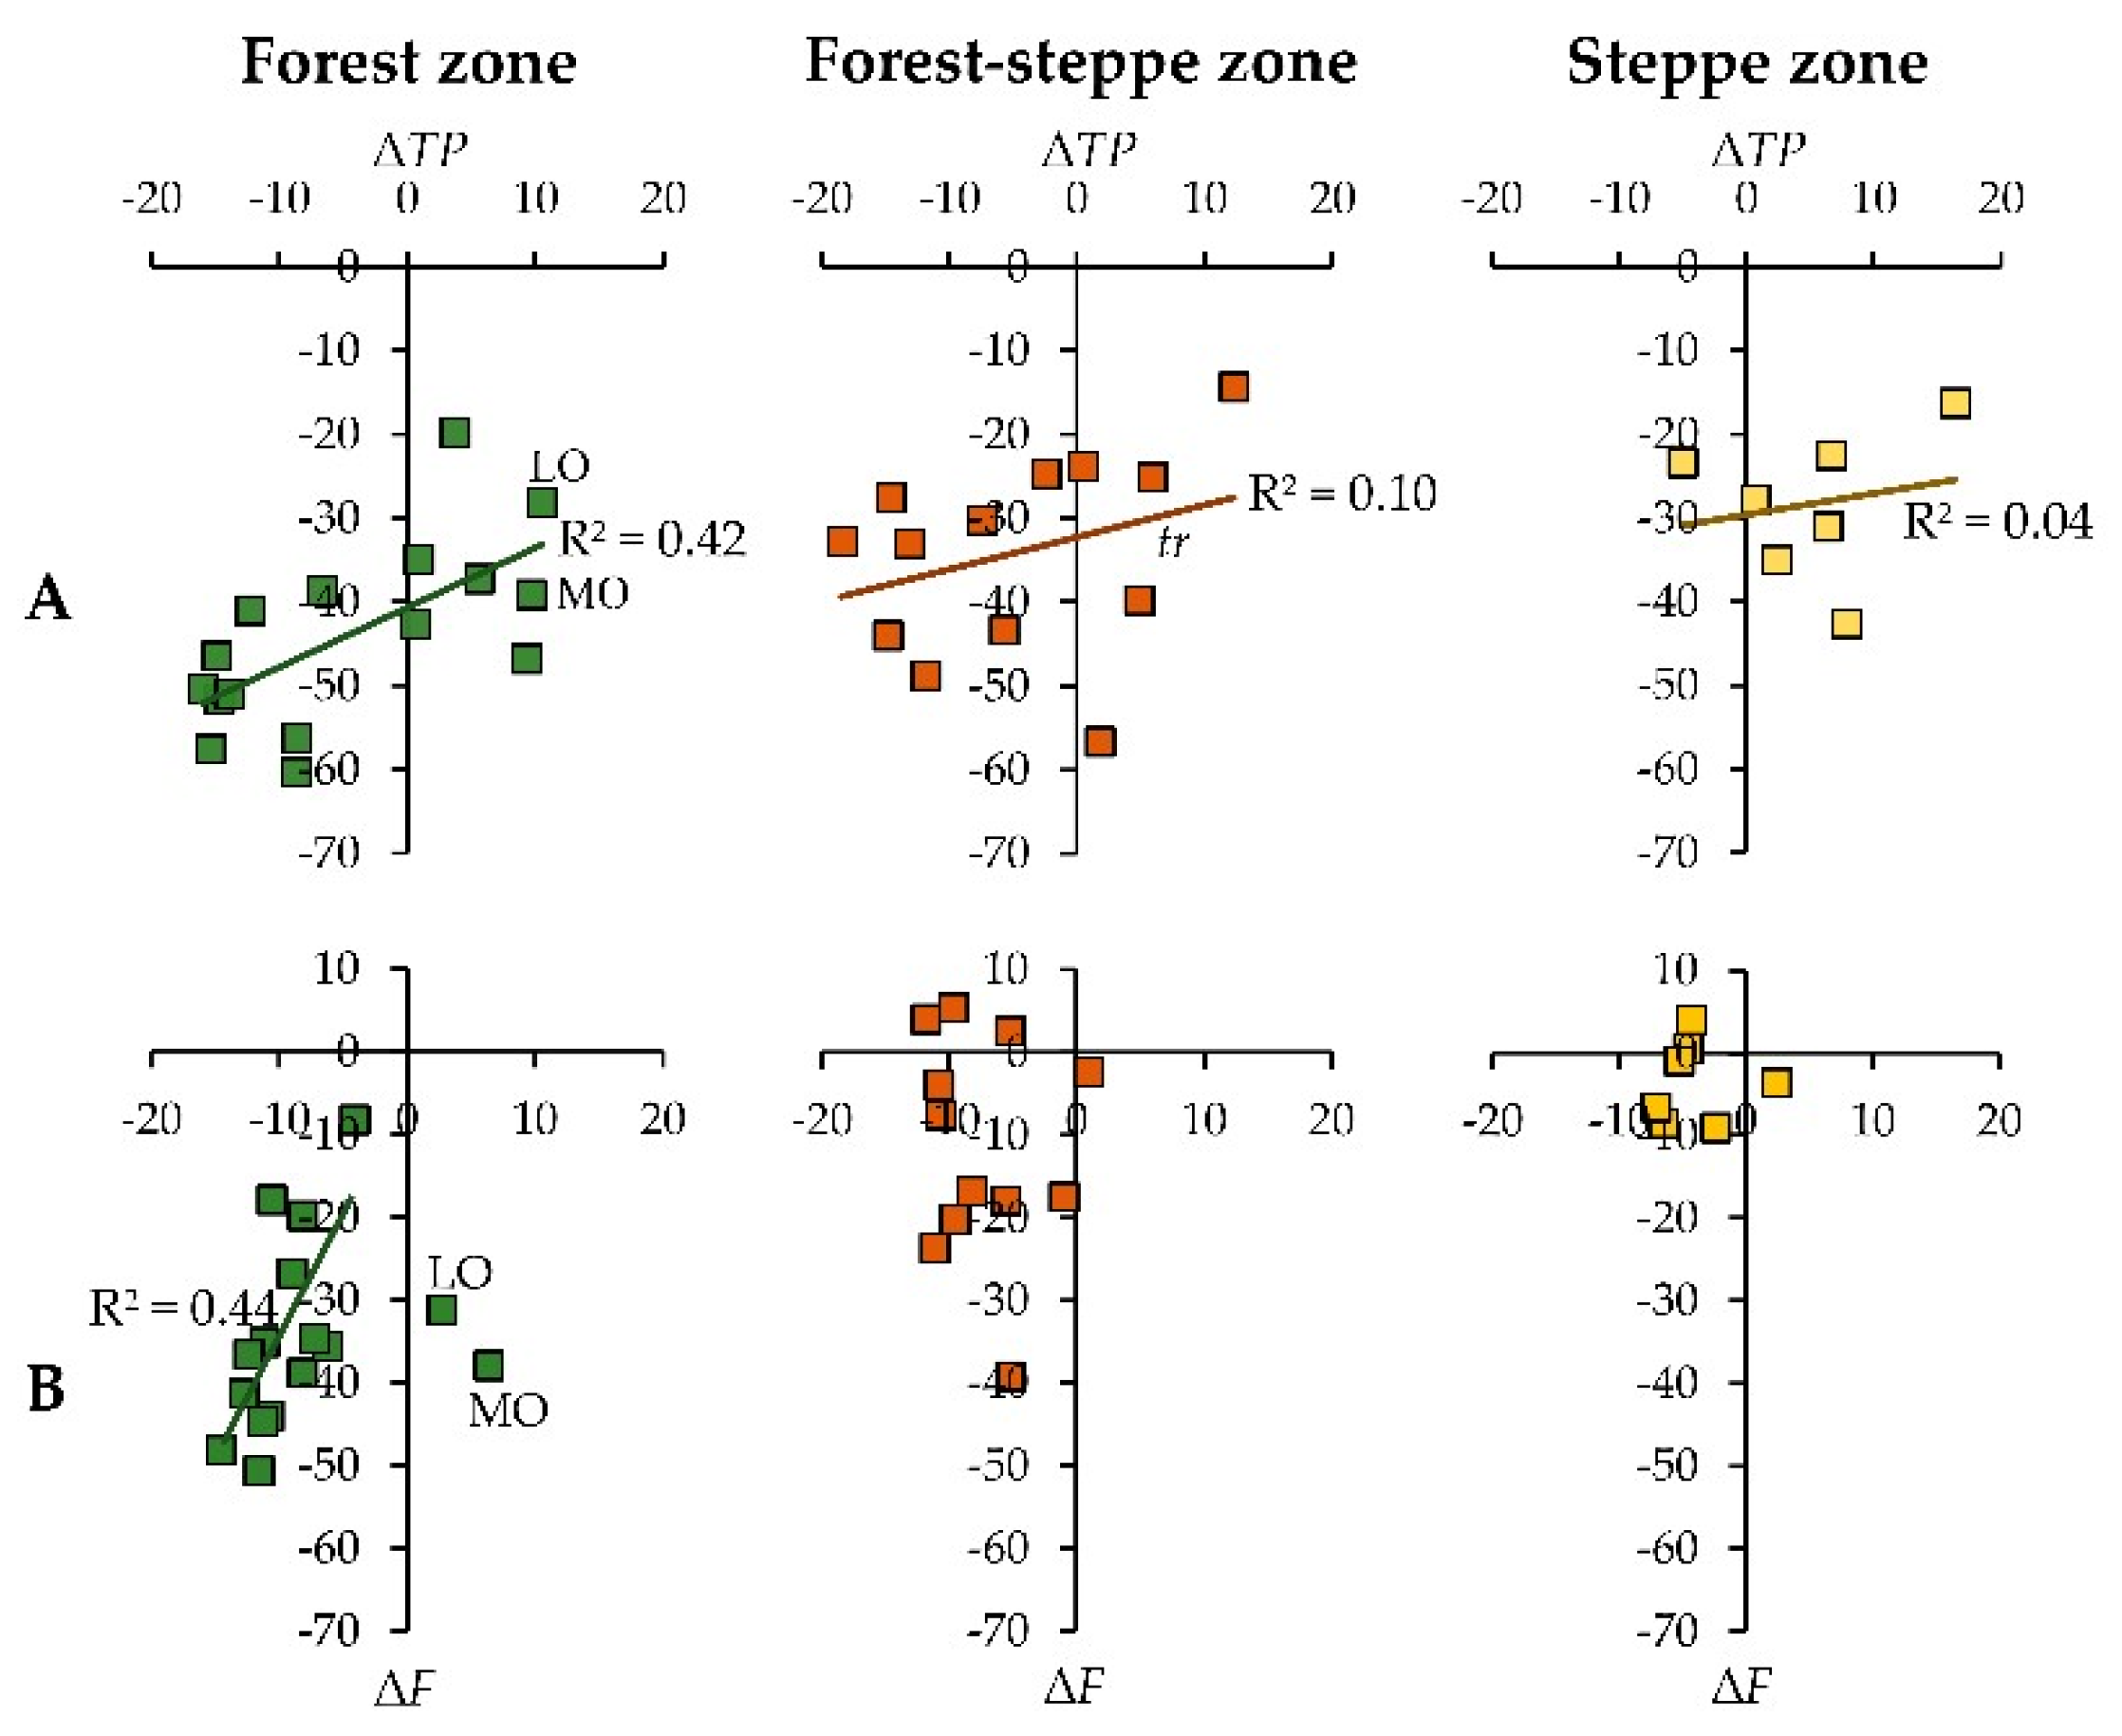
In the forest-steppe and steppe zones, an approximately equal decrease in the volume of washed-out soil material could be expected over the past decades due to a decrease in sown areas, according to Table 2. Indeed, with a 31% and 30% reduction in cultivated areas in these zones, respectively, river sediment load responded with a 90% and 77% reduction. The most significant impact of this factor was expected in the forest zone and the semi-desert. This becomes clearer if we consider the properties of soils of the southern taiga and mixed forests of European Russia—various subtypes of predominantly sod-podzolic soils, mainly Umbric Albeluvisols Abruptic (hereinafter, according to World Reference Base for Soil Resources, 2006), as well in the subzone of broadleaf forests–mainly light grey forest soils–Greyic Phaeozems Albic. A relatively higher vulnerability to water erosion characterizes these soils—from 2.9 to 4.2 Mg ha−1 y−1, compared to the predominant soils of the forest-steppe (dark grey forest soils (Greyic Phaeozems Albic)) and steppe zones (various subtypes of chernozem (Chernozems))—from 1.16 for ordinary chernozem to 2.0 Mg ha−1 y−1 for southern chernozem on sandy loams [92]. Consequently, with an equal reduction in sown areas, the potential loss of washed-out soil material from a conventional unit of cultivated land, all other things being equal, is higher in the forest zone than in the forest-steppe and steppe zones. Despite this circumstance and a much higher percentage of cultivated land reduction in the forest zone in the last few decades (see Table 2), the load of suspended sediment in the studied river basins of this zone reacted with a smaller reduction (about 58%) than in more southern landscape zones. In this regard, we can assume more active participation of climate change in the reduction of soil erosion and river sediment load in the latter zones.
On the remaining cultivated land (without the area of abandoned land), changes in the intensity of erosion processes depend on climate change and changes in crop rotation. For example, during snow melting, perennial grass crops are reliable protection against these processes. According to earlier studies by I.A. Kuznik in 1961 [3], in the forest-steppe of the Trans-Volga region, the total washout of soil material under perennial grasses was 50 times less than on cropland. The total area of these crops in the region under study has changed little over the past decades. However, on the one hand, their reduction is noted in the forest and steppe zones, which most likely resulted in a weakening of the anti-erosion role of these grasses during the period of snow melting. On the other hand, in the forest-steppe zone (especially in its central and eastern sectors, see Figure 5), there was an increase in these crops, which most likely also influenced the decrease in river sediment load, as happened, for example, in the Middle Volga region. By contrast, the expansion of sunflower crops in all administrative regions of the forest-steppe and steppe zones could increase rainfall-induced erosion since these crops protect the soil against erosion relatively poorly. The calculated integral coefficient of crop management for each landscape zone in the warm (rainy) season gives a general idea of how the erosion-protective function of the vegetation cover has changed within the arable land of the study region (Table 3). Of the three landscape zones (except for the semi-desert) where arable land occupies a relatively large area, cultivated vegetation began to protect the soil against erosion in recent decades to the greatest extent in the forest zone.
The reduction in the agricultural machinery fleet on Russia’s cultivated fields noted above, especially in the forest-steppe and steppe zones (see Table 4), also contributed to a decrease in soil erosion rates and then river sediment load through a reduction of the compaction of the topsoil. This reduction favored a better conversion (filtration) of rainfall-induced runoff into sub-soil/underground runoff. This could also have happened owing to the reduction in the number of livestock on pastures. This reduction could most noticeable, most likely, in the south of the forest zone due to the most significant decrease in the population, primarily rural, over recent decades [19,20,25].
Erosion-control and sediment-control measures, i.e., artificial forest plantations, engineering and hydrotechnical constructions (reservoirs, ponds, etc.), were carried out in the former USSR from the late 1970s and the 1980s. They also contributed to the reduction in erosion intensity and river sediment load noted above. These measures were especially numerous in the most erosion-hazardous regions of the East European Plain, especially within the forest-steppe and steppe zones [1,3,4]. The effectiveness of these measures also manifested itself in the following decades, after the collapse of the USSR in 1991.
There are many examples of the influence of land-use/-cover changes, particularly abandonment of cropland, on the hydrological regime of rivers and the intensity of erosion in their basins, including Europe [56,57,93,94,95,96,97,98,99,100,101,102,103,104,105]. Their comparative analysis with European Russia is of separate scientific interest.
4.4. The Combined Changes in Land-Cover/-Use and Climate as a Driving Force for Erosion and River Suspended Sediment Load Reduction
As noted above, the impact of human activities in the region occurred against the background of climate change. This change primarily concerns an increase in the cold season temperature and the temperature of the soil. The consequence of this was a decrease in the depth of its freezing. These processes in Russia have become especially noticeable since the late 1970s [44]. The depth of freezing of the soil, along with soil moisture, is a determining factor in the loss of snowmelt runoff [106]. According to [86], the snowmelt runoff ceases to form at a freezing depth of less than 30–50 cm. For most administrative regions of the south half of the East European Plain, especially in its central and western sectors, the present soil freezing depths are close to this interval’s lower boundary. However, the same cannot be said for most of the forest zone. For example, in the southeast of the forest zone, according to data of a weather station in the city of Izhevsk (the Udmurt Republic, see Figure 2A, near the southern border of the forest zone), there was a downward trend in the depth of winter freezing of the soil: 1978–1985–128.8 ± 14.4 cm and 1986–2014–74.5 ± 10.5 cm [71]. Nevertheless, despite this trend, from 1986 to 2014, about 80% of all springs had a soil freezing depth of more than 51 cm (at the end of March)–a threshold value above which the filtration of meltwater into the soil was still extremely difficult. This circumstance could completely prevent the filtration of meltwater under these conditions. Only during three years, in 1999, 2004, and 2011, soil freezing was less than 30 cm. Most likely, this significantly reduced the coefficient of surface runoff during these years [71]. It can be assumed that in the more northern and, therefore, colder parts of the forest zone, over the past half century, soil freezing has not changed enough to reduce surface runoff and, therefore, the intensity of soil/gully erosion.
We believe that changes in the depth of soil freezing, which caused the redistribution of a significant part of the melt runoff into the groundwater runoff, can be considered the leading factor in the change in the intra-annual irregularity of river water discharge in most of Eastern Europe. This issue has been analyzed in detail by hydrologists [48,49,50]. Based on these works, we can draw an important conclusion. As said above, in some agriculturally very poorly transformed river basins of the north of the East European Plain (the basins of the Onega River, Severnaya Dvina River, Mezen River, etc.), long-term trends in water discharge were revealed, opposite to those observed in most of the plain. Moreover, these tendencies cannot be explained by the above redistribution of the spring meltwater runoff into the groundwater runoff. Consequently, in these vast basins of the north of European Russia, any significant changes in the depth of winter freezing of the soil that could cause this redistribution either did not appear or appeared in a weak form over the recent decades.
Given the continuity and known gradualness of climate change in space, it can be assumed that the most significant degradation of seasonal soil freezing could occur mainly in the southern half of the plain, in the forest-steppe and steppe zones. It could also happen in the western and, therefore, relatively warmer sector of the southern “belt” of the forest zone, gradually ending in the north of European Russia. In other words, the role of climate change in the previously noted decrease in erosion intensity in river basins of the study region was greatest in the forest-steppe, steppe, and possibly semi-desert, in contrast to the southern part of the forest zone. It is noteworthy that the climatic factor’s leading role in reducing the intensity of erosion and the load of river sediment was also noted in the steppes of the North Caucasus region located south of the study region [105].
As a result, the highest rates of decrease in soil/gully erosion intensity were observed in the forest-steppe zone, according to the above data on river suspended sediment load, resulting from the most favorable (optimal) combination of changes in climate, land cover, and agricultural activities. The optimality of this combination, most likely, reduced to the north and south of the forest-steppe zone, giving a leading role to either human activities or climate change, respectively. It should be recalled that several decades ago, from the 1950s to the 1980s, it was the forest-steppe zone that was most susceptible to soil and gully erosion due to a favorable combination of geological, geomorphic, landscape, and climatic conditions in this part of the East European Plain [7,9,81]. All this was especially true for the forest-steppe Middle Volga region, where the highest zonal rates of reduction in the intensity of soil and gully erosion were observed over the last decades [65].
As for rainfall-induced erosion, apparently its role in changing the contemporary erosion processes was/is secondary in the region. It was proved that the frequency and intensity of heavy rains in Russia have risen over the past half-century, increasing by 1–2% every 10 years [107,108]. However, a possible increase in rainfall-induced erosion rates is compensated by decreased cropland areas and an overall increase in soil protection by cultivated vegetation during the warm season (see Table 3). It is likely that in some administrative regions of European Russia, there may be exceptions to this rule. All this requires further, more detailed research.
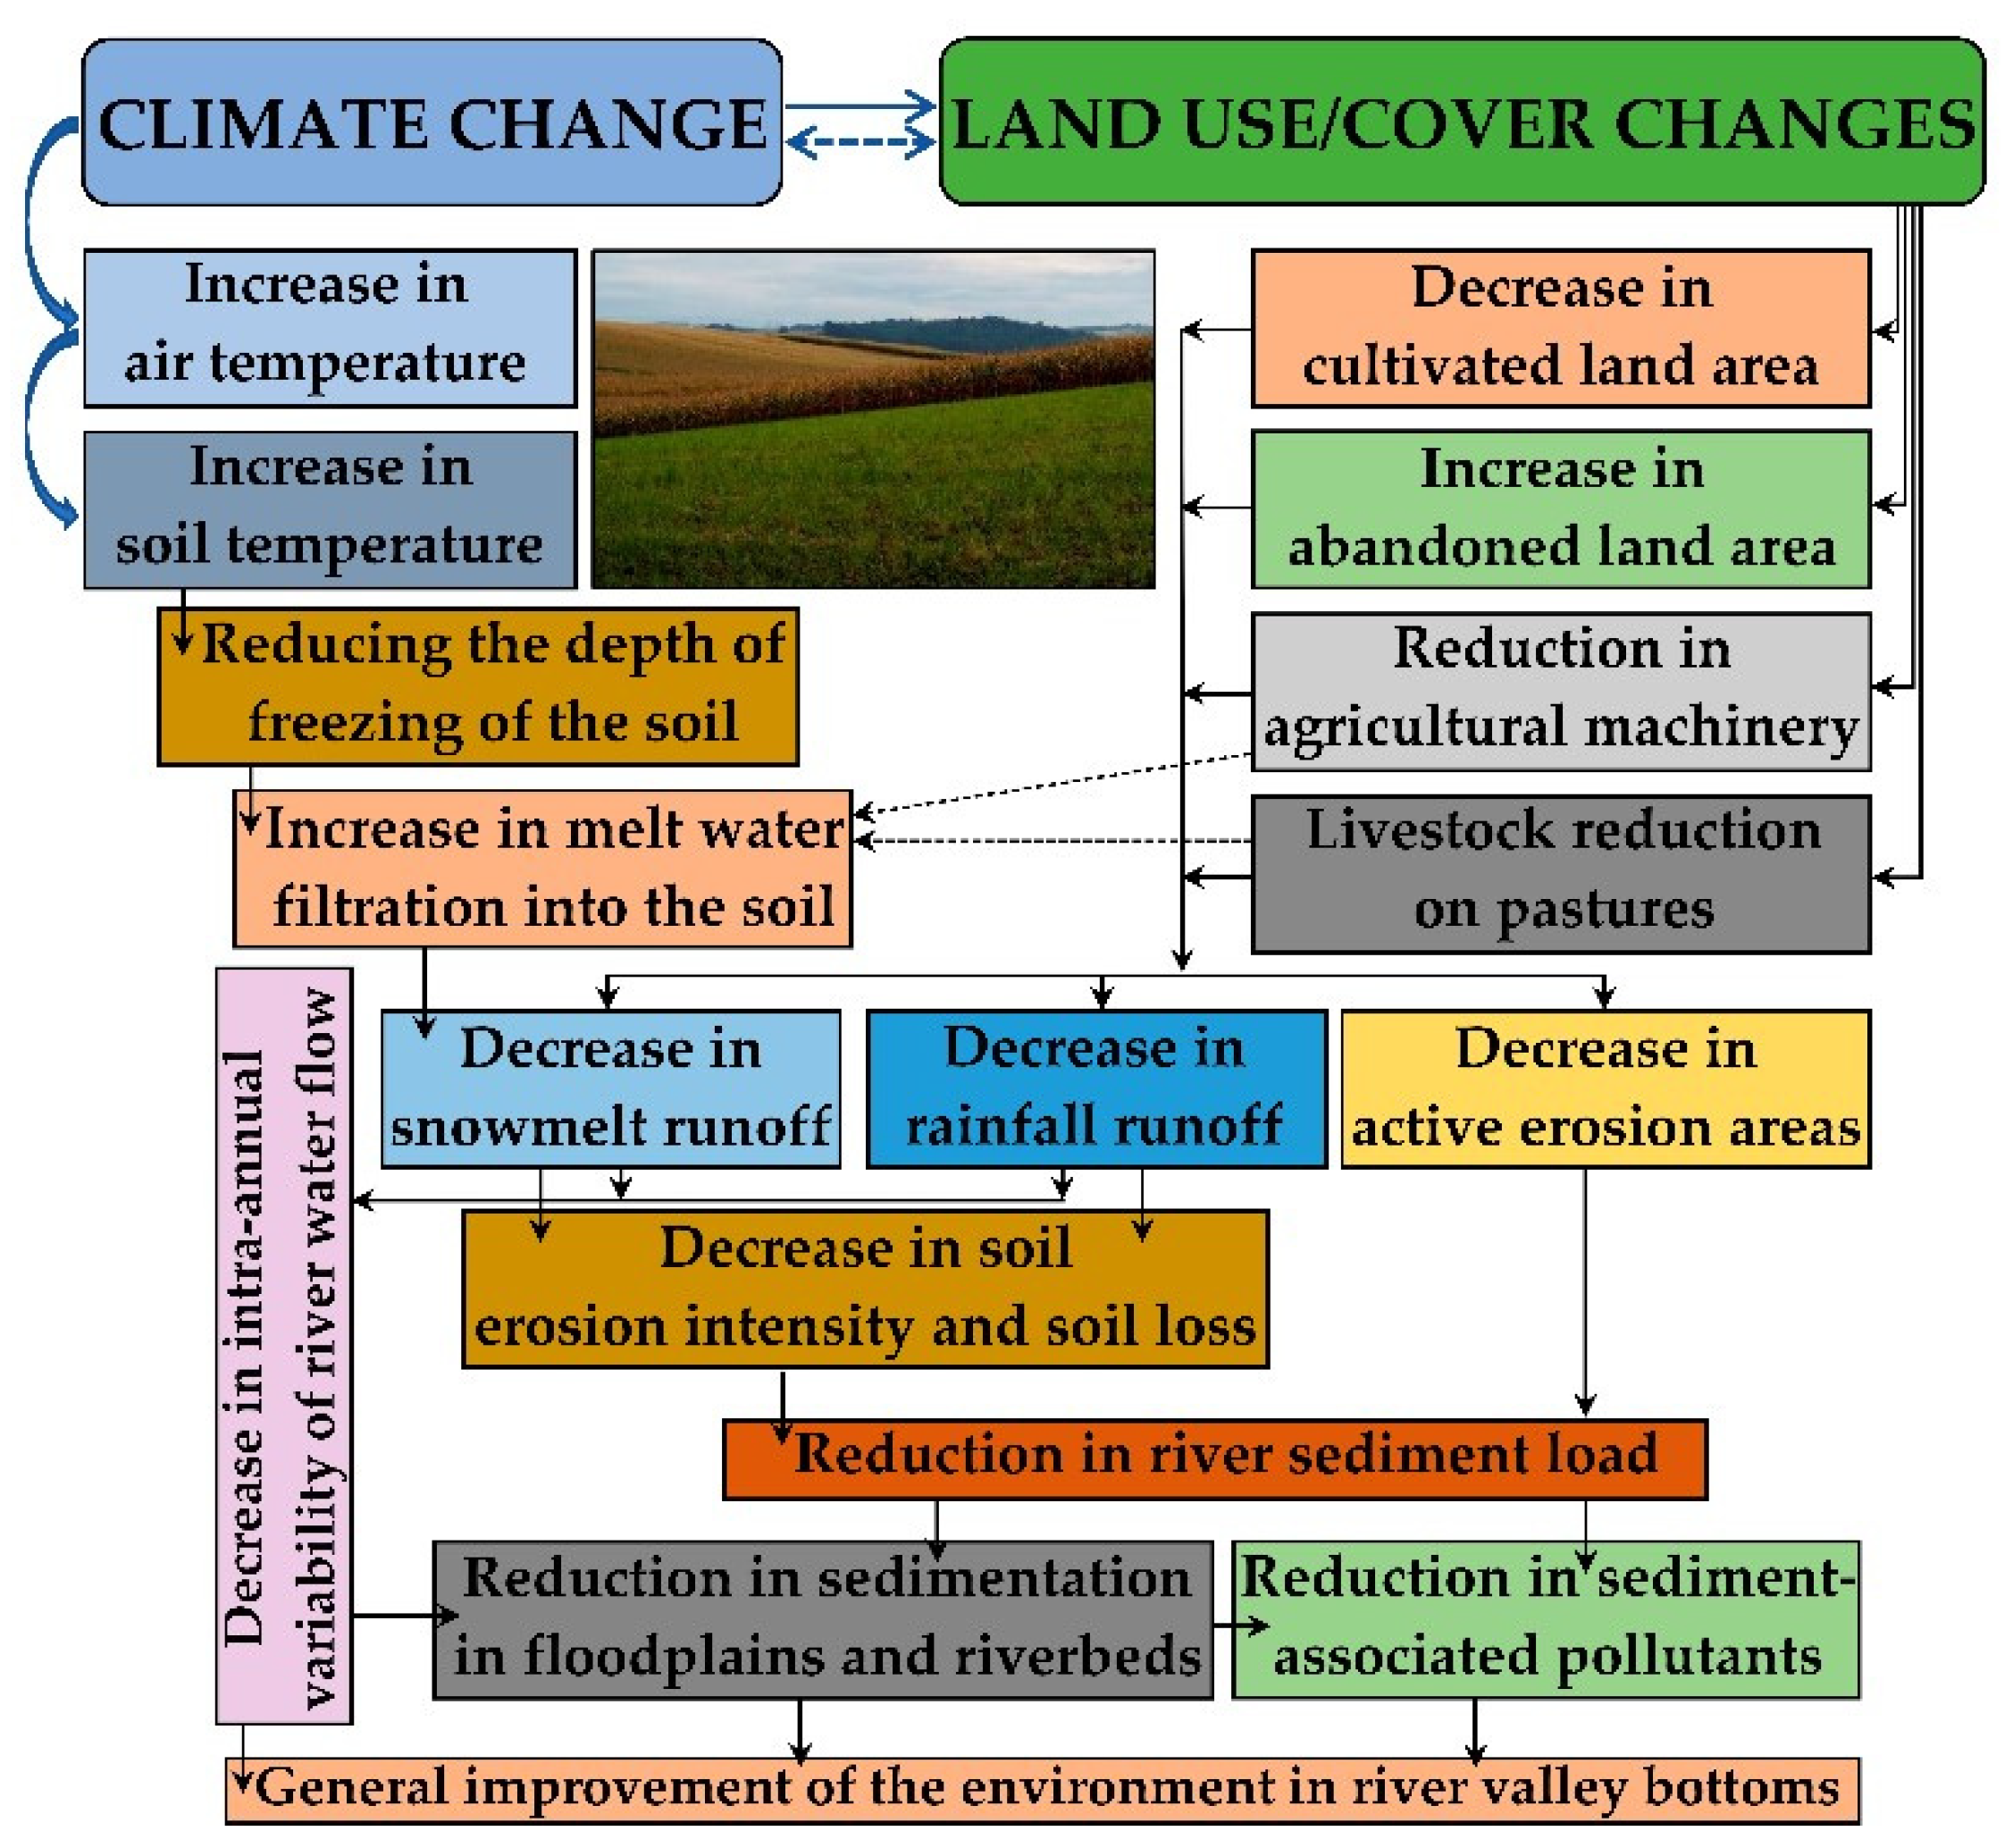
To better understand all that has been said above, a generalized scheme of the interaction of climate and land-use/-cover changes and its hydrological, erosion, and environmental consequences is depicted in Figure 12. In general terms, this scheme can be considered representative of the entire study region. The tendencies of a decrease in the load of river suspended sediment in the south half of European Russia fit well with the global trends revealed for the Earth’s large rivers [109].
4.5. Limitations of the Study
- (a)
- The insufficient number and uneven distribution of the studied rivers, especially within the forest zone, limit a reliable spatial analysis of contemporary trends in suspended sediment load and erosion intensity. In this context, the study’s findings are preliminary.
- (b)
- The different duration and discontinuity of the suspended sediment load monitoring series complicate their reliable uniform statistical analysis.
- (c)
- The study did not consider the potential impact of reservoirs and ponds, especially numerous in the forest-steppe and steppe zones, on the long-term dynamics of river suspended sediment load. However, it should be clarified that the overwhelming share of these artificial water bodies was created in the region during the late USSR (the 1970s and 1980s) and even earlier. Thus, we can assume that they had a comparatively similar effect on both the modern sediment load and the sediment load during the late USSR. This issue requires a separate study.
5. Conclusions
Over the past few decades, there has been a significant decrease in soil/gully erosion intensity and river suspended sediment load in European Russia’s studied region. This decrease occurred against the background of widespread agricultural degradation (reduction in cultivated land, agricultural machinery, and livestock) due to political and economic transformations in post-Soviet Russia.
Changes in cultivated land, erosion intensity, and river suspended sediment load had well-defined zonal features. If the relative reduction in cultivated land was most significant in the forest zone and the semi-desert, then the decrease in the intensity of erosion and the load of river sediment was most noticeable in the forest-steppe zone and then in the steppe zone.
The greatest reduction in erosion intensity and river sediment load in the forest-steppe zone resulted from a favorable (optimal) combination of climate, land-cover, and agricultural activities changes. The optimality of this combination, most likely, reduced to the north and south of the forest-steppe zone, giving a leading role to either human activities or climate change, respectively.
Funding
This paper has been supported by the Kazan Federal University Strategic Academic Leadership Program and was carried out within the framework of the intra-university grant of the Belgorod State University to support the creation and development of scientific departments–centers of excellence.
Institutional Review Board Statement
Not applicable.
Informed Consent Statement
Not applicable.
Data Availability Statement
Data used in the study are available from the published statistical collections of the USSR (Agri-culture of the USSR: Statistical Bulletin (Main indicators of crop production development); “Fi-nansy i Statistika” Publisher: Moscow, USSR, 1988; http://istmat.info/node/26167 (accessed on 10 September 2020)), electronic statistical resources of the Russian Federation–https://fedstat.ru (accessed on 15 September 2020), the Federal State Statistics Service http://www.gks.ru (accessed on 12 September 2020), the State Water Registers of the USSR; Russian State Water Register http://voda.mnr.gov.ru (accessed on 15 October 2020); the automated information system of state monitoring for water bodies of the Federal Agency for Water Resources of the Ministry of Natural Resources and Environment of the Russian Federation http://gmvo.skniivh.ru (accessed on 20 October 2020).
Acknowledgments
The author thanks A.M. Gafurov, Kazan Federal University (Russia), for technical assistance in creating a series of maps used in this work, and some data collection, and A.S. Tsyplenkov, Lomonosov Moscow State University (Russia), for providing some hydrological data. The author also thanks the anonymous reviewers who comprehensively contributed to the manuscript providing valuable reviews.
Conflicts of Interest
The author declares no conflict of interest. The funders had no role in the design of the study; in the collection, analyses, or interpretation of data; in the writing of the manuscript; or in the decision to publish the results.
Appendix A

Appendix B

Table A1.
Changes in the area (F) under sunflower in the landscape zones of European Russia during 1970–2017 (based on data from [51] and https://fedstat.ru (accessed on 15 September 2020)).
Table A1.
Changes in the area (F) under sunflower in the landscape zones of European Russia during 1970–2017 (based on data from [51] and https://fedstat.ru (accessed on 15 September 2020)).
| Landscape Zone and Administrative Region, According to Figure 2 and Figure 3 | F (×103 ha) | |||
|---|---|---|---|---|
| 1970–1987 | 1996–2004 | 2005–2017 | ||
| Forest zone | ||||
| 5 | Bryansk Oblast | 0.0 | 0.1 | 2.0 |
| 24 | Nizhny Novgorod Oblast | 0.0 | 0.1 | 13.9 |
| In total | 0.0 | 0.2 | 15.9 | |
| Forest-steppe zone | ||||
| 7 | Kaluga Oblast | 0.0 | 0.04 | 0.25 |
| 8 | Kursk Oblast | 0.0 | 21.7 | 82.7 |
| 9 | Orel Oblast | 0.0 | 8.9 | 26.5 |
| 11 | Tula Oblast | 0.0 | 4.9 | 7.0 |
| 14 | Lipetsk Oblast | 17.8 | 31.3 | 100.6 |
| 16 | Ryazan Oblast | 0.0 | 2.5 | 17.0 |
| 20 | Tambov Oblast | 100.0 | 192.0 | 318.3 |
| 23 | Republic of Mordovia | 0.0 | 3.1 | 2.8 |
| 25 | Penza Oblast | 31.9 | 62.0 | 140.0 |
| 28 | Chuvash Republic | 0.0 | 0.1 | 3.2 |
| 31 | Ulyanovsk Oblast | 51.4 | 60.5 | 132.5 |
| 34 | Republic of Tatarstan | 0.0 | 5.5 | 46.6 |
| 38 | Republic of Bashkortostan | 57.2 | 97.9 | 171.0 |
| In total | 258.3 | 490.4 | 1048.5 | |
| Steppe zone | ||||
| 10 | Belgorod Oblast | 62.6 | 109.0 | 143.8 |
| 15 | Voronezh Oblast | 224.0 | 341.9 | 458.5 |
| 18 | Rostov Oblast | 417.0 | 878.7 | 899.3 |
| 22 | Volgograd Oblast | 183.0 | 484.2 | 663.1 |
| 27 | Saratov Oblast | 286.5 | 451.1 | 960.1 |
| 33 | Samara Oblast | 138.3 | 232.2 | 441.1 |
| 36 | Orenburg Oblast | 0.0 | 272.6 | 565.6 |
| In total | 1311.4 | 2769.7 | 4131.5 | |
| Semi-desert zone | ||||
| 26 | Republic of Kalmykia | 9.8 | 23.6 | 15.8 |
| 29 | Astrakhan Oblast | 0.0 | 0.2 | 0.02 |
| In total | 9.8 | 23.8 | 15.8 | |
| Total study region | 1579.5 | 3284.1 | 5211.7 | |
References
- Chalov, R.S.; Golosov, V.N.; Sidorchuk, A.Y.; Litvin, L.F.; Alexeevsky, N.I.; Chernov, A.V.; Kovalev, S.N.; Krasnov, S.F.; Larionov, G.A.; Berkovich, K.M.; et al. Catchment Erosion-Fluvial Systems; Chalov, R.S., Golosov, V.N., Sidorchuk, A.Y., Eds.; INFRA-M Publisher: Moscow, Russia, 2017. (In Russian) [Google Scholar]
- Ivanova, N.N.; Golosov, V.N.; Panin, A.V. Agricultural cultivation of land and small river degradation in European Russia. Geomorfologiya 1996, 4, 53–60. (In Russian) [Google Scholar]
- Mozzherin, V.I.; Kurbanova, S.G. Human Activities and Erosion and Riverbed Systems of the Middle Volga Region; ART DESIGN Publisher: Kazan, Russia, 2004. (In Russian) [Google Scholar]
- Golosov, V.N. Erosion and Deposition Processes in River Basins of Cultivated Plains; GEOS Publisher: Moscow, Russia, 2006. (In Russian) [Google Scholar]
- Dedkov, A.P.; Gusarov, A.V.; Mozzherin, V.V. Two erosion systems in the river basins of the Earth’s plains and their mutual transformation (part I). Geomorfologiya 2008, 4, 3–16. (In Russian) [Google Scholar] [CrossRef]
- Sidorchuk, A.Y.; Golosov, V.N. Erosion and sedimentation on the Russian Plain, II: The history of erosion and sedimentation during the period of intensive agriculture. Hydrol. Process. 2003, 17, 3347–3358. [Google Scholar] [CrossRef]
- Dedkov, A.P.; Mozzherin, V.I. Erosion of the plains of Eastern Europe. Geomorfologiya 1996, 2, 3–9. (In Russian) [Google Scholar]
- Dedkov, A.P. Exogenous Relief Formation in the Kazan-Ulyanovsk Pre-Volga Region; Kazan University Publisher: Kazan, Russia, 1970. (In Russian) [Google Scholar]
- Dedkov, A.P.; Mozzherin, V.I. Erosion and Sediment Yield on the Earth; Kazan University Publisher: Kazan, Russia, 1984. (In Russian) [Google Scholar]
- Gusarov, A.V. The main regularities of the ratio between riverbed and basin components of erosion and suspended sediment flux in the Northern Eurasia’s river basins. Geomorfologiya 2015, 4, 3–20. (In Russian) [Google Scholar] [CrossRef]
- Golosov, V.; Gusarov, A.; Litvin, L.; Yermolaev, O.; Chizhikova, N.; Safina, G.; Kiryukhina, Z. Evaluation of soil erosion rates in the southern half of the Russian Plain: Methodology and initial results. Proc. IAHS 2017, 375, 23–27. [Google Scholar] [CrossRef]
- Litvin, L.F.; Kiryukhina, Z.P.; Krasnov, S.F.; Dobrovol’skaya, N.G. Dynamics of agricultural soil erosion in European Russia. Eurasian Soil Sci. 2017, 50, 1343–1352. [Google Scholar] [CrossRef]
- Ioffe, G.; Nefedova, T. Marginal farmland in European Russia. Eurasian Geogr. Econ. 2004, 45, 31–45. [Google Scholar] [CrossRef]
- Lerman, Z.; Shagaida, N. Land policies and agricultural land markets in Russia. Land Use Policy 2007, 24, 14–23. [Google Scholar] [CrossRef]
- Bergen, K.M.; Zhao, T.; Kharuk, V.; Blam, Y.; Brown, D.G.; Peterson, L.K.; Miller, N. Changing regimes: Forested land cover dynamics in Central Siberia 1974 to 2001. Photogr. Eng. Remote Sens. 2008, 74, 787–798. [Google Scholar] [CrossRef]
- Baumann, M.; Kuemmerle, T.; Elbakidze, M.; Ozdogan, M.; Radeloff, V.C.; Keuler, N.S.; Prishchepov, A.V.; Kruhlov, I.; Hostert, P. Patterns and drivers of post-socialist farmland abandonment in Western Ukraine. Land Use Policy 2011, 28, 552–562. [Google Scholar] [CrossRef]
- Hostert, P.; Kuemmerle, T.; Prishchepov, A.V.; Sieber, A.; Lambin, E.F.; Radeloff, V.C. Rapid land use change after socio-economic disturbances: The collapse of the Soviet Union versus Chernobyl. Environ. Res. Lett. 2011, 6, 045201. [Google Scholar] [CrossRef]
- Mukhin, G.D. Ecological-economic assessment of land use structure within the European territory of Russia during two recent decades. Vestn. Mosk. Univ. Ser. 5 Geogr. 2012, 5, 19–28. (In Russian) [Google Scholar]
- Nefedova, T.G. Major trends for changes in the socioeconomic space of rural Russia. Reg. Res. Russ. 2012, 2, 41–54. [Google Scholar] [CrossRef] [Green Version]
- Nekrich, A.S.; Lyuri, D.I. Factors of local-scale dynamics of croplands during the crisis period: A case study of Kursk Oblast. Izv. Ross. Akad. Nauk. Seriya Geogr. 2016, 1, 123–130. (In Russian) [Google Scholar] [CrossRef] [Green Version]
- Prishchepov, A.V.; Radeloff, V.C.; Baumann, M.; Kuemmerle, T.; Müller, D. Effects of institutional changes on land use: Agricultural land abandonment during the transition from state-command to market-driven economies in post-Soviet Eastern Europe. Environ. Res. Lett. 2012, 7, 024021. [Google Scholar] [CrossRef]
- Prishchepov, A.V.; Müller, D.; Dubinin, M.; Baumann, M.; Radeloff, V.C. Determinants of agricultural land abandonment in post-Soviet European Russia. Land Use Policy 2013, 30, 873–884. [Google Scholar] [CrossRef] [Green Version]
- Prishchepov, A.V.; Müller, D.; Baumann, M.; Kuemmerle, T.; Alcantara, C.; Radeloff, V.C. Underlying drivers and spatial determinants of post-Soviet agricultural land abandonment in temperate Eastern Europe. In Land-Cover and Land-Use Changes in Eastern Europe after the Collapse of the Soviet Union in 1991; Springer International Publishing: Cham, Switzerland, 2016; pp. 91–117. [Google Scholar] [CrossRef]
- Lyuri, D.I.; Nekrich, A.S.; Karelin, D.V. Cropland dynamics in Russia in 1990–2015 and soil emission of carbon dioxide. Vest. Mosk. Univ. Ser. 5 Geogr. 2018, 3, 70–76. (In Russian) [Google Scholar]
- Nekrich, A.S.; Lyuri, D.I. Changes of the dynamic of agrarian lands of Russia in 1990–2014. Izv. Ross. Akad. Nauk. Seriya Geogr. 2019, 3, 64–77. (In Russian) [Google Scholar] [CrossRef] [Green Version]
- Csaki, C.; Lerman, Z. Land and farm structure in transition: The case of Poland. Eurasian Geogr. Econ. 2002, 43, 305–322. [Google Scholar] [CrossRef]
- Kuemmerle, T.; Hostert, P.; Radeloff, V.C.; van der Linden, S.; Perzanowski, K.; Kruhlov, I. Cross-border comparison of post-socialist farmland abandonment in the Carpathians. Ecosystems 2008, 11, 614–628. [Google Scholar] [CrossRef]
- Kuemmerle, T.; Kozak, J.; Radeloff, V.C.; Hostert, P. Differences in forest disturbance among land ownership types in Poland during and after socialism. J. Land Use Sci. 2009, 4, 73–83. [Google Scholar] [CrossRef]
- Müller, D.; Kuemmerle, T.; Rusu, M.; Griffiths, P. Lost in transition: Determinants of post-socialist cropland abandonment in Romania. J. Land Use Sci. 2009, 4, 109–129. [Google Scholar] [CrossRef]
- Persson, A.S.; Olsson, O.; Rundlöf, M.; Smith, H.G. Land use intensity and landscape complexity—Analysis of landscape characteristics in an agricultural region in Southern Sweden. Agric. Ecosyst. Environ. 2010, 136, 169–176. [Google Scholar] [CrossRef]
- Bakker, M.M.; Sonneveld, M.P.W.; Brookhuis, B.; Kuhlman, T. Trends in soil–land-use relationships in the Netherlands between 1900 and 1990. Agric. Ecosyst. Environ. 2013, 181, 134–143. [Google Scholar] [CrossRef]
- Estel, S.; Kuemmerle, T.; Alcántara, C.; Leversa, C.; Prishchepov, A.; Hostert, P. Mapping farmland abandonment and recultivation across Europe using MODIS NDVI time series. Remote Sens. Environ. 2015, 163, 312–325. [Google Scholar] [CrossRef]
- Pazur, R.; Lieskovsky, J.; Feranec, J.; Ot’ahel, J. Spatial determinants of abandonment of large-scale arable lands and managed grasslands in Slovakia during the periods of post-socialist transition and European Union accession. Appl. Geogr. 2014, 54, 118–128. [Google Scholar] [CrossRef]
- Morgan, R.P.C. Soil Erosion and Conservation, 3rd ed.; Blackwell Publisher: Oxford, UK, 2005. [Google Scholar]
- Golosov, V.N.; Gennadiev, A.N.; Olson, K.R.; Markelov, M.V.; Zhidkin, A.P.; Chendev, Y.G.; Kovach, R.G. Spatial and temporal features of soil erosion in the forest-steppe zone of the East-European Plain. Eurasian Soil Sci. 2011, 44, 794–801. [Google Scholar] [CrossRef]
- Lal, R. Soil erosion and the global carbon budget. Environ. Int. 2003, 29, 437–450. [Google Scholar] [CrossRef]
- Olson, K.R.; Al-Kaisi, M.A.; Lal, R.; Cihacek, L.J. Impact of soil erosion on soil organic carbon stocks. J. Soil Water Conserv. 2016, 71, 61–67. [Google Scholar] [CrossRef] [Green Version]
- Maracchi, G.; Sirotenko, O.; Bindi, M. Impacts of present and future climate variability on agriculture and forestry in the temperate regions: Europe. Clim. Chang. 2005, 70, 117–135. [Google Scholar] [CrossRef]
- Shmakin, A.B.; Popova, V.V. Dynamics of climate extremes in Northern Eurasia in the late 20th century. Izv. Atmos. Ocean. Phys. 2006, 42, 138–147. (In Russian) [Google Scholar] [CrossRef]
- Popova, V.V.; Polyakova, I.A. Change of stable snow cover destruction dates in Northern Eurasia, 1936–2008: Impact of global warming and the role of large-scale atmospheric circulation. Ice Snow 2013, 53, 29–39. (In Russian) [Google Scholar] [CrossRef] [Green Version]
- Shvidenko, A.Z.; Schepaschenko, D.G. Climate change and wildfires in Russia. Contemp. Probl. Ecol. 2013, 6, 683–692. [Google Scholar] [CrossRef]
- Madsen, H.; Lawrence, D.; Lang, M.; Martinkova, M.; Kjeldsen, T.R. Review of trend analysis and climate change projections of extreme precipitation and floods in Europe. J. Hydrol. 2014, 519, 3634–3650. [Google Scholar] [CrossRef] [Green Version]
- The Fifth Assessment Report (AR5) of the United Nations Intergovernmental Panel on Climate Change. 2 November 2014. Available online: https://www.ipcc.ch/report/ar5/syr/ (accessed on 19 February 2021).
- Park, H.; Sherstiukov, A.B.; Fedorov, A.N.; Polyakov, I.V.; Walsh, J.E. An observation-based assessment of the influences of air temperature and snow depth on soil temperature in Russia. Environ. Res. Lett. 2014, 9, 64026. [Google Scholar] [CrossRef]
- Ashabokov, B.A.; Tashilova, A.A.; Kesheva, L.A.; Taubekova, Z.A. Trends in precipitation parameters in the climate zones of southern Russia (1961–2011). Russ. Meteorol. Hydrol. 2017, 42, 150–158. [Google Scholar] [CrossRef]
- Perevedentsev, Y.P.; Shantalinskii, K.M.; Guryanov, V.V.; Nikolaev, A.A.; Aukhadeev, T.R. Empirical Statistical Model of Climatic Changes in the Volga Region. IOP Conf. Ser. Earth Environ. Sci. 2018, 211, 012016. [Google Scholar] [CrossRef]
- Dolgov, S.V. Climate changes of the annual rivers’ run-off and its components in the European part of Russia. Izv. Akad. Nauk Seriya Geogr. 2011, 6, 78–86. (In Russian) [Google Scholar]
- Blöschl, G.; Hall, J.; Parajka, J.; Perdigão, R.A.P.; Merz, B.; Arheimer, B.; Aronica, G.T.; Bilibashi, A.; Bonacci, O.; Borga, M.; et al. Changing climate shifts timing of European floods. Science 2017, 357, 588–590. [Google Scholar] [CrossRef] [Green Version]
- Frolova, N.L.; Agafonova, S.A.; Kireeva, M.B.; Povalishnikova, E.S.; Pakhomova, O.M. Recent changes of annual flow distribution of the Volga basin rivers. Geogr. Environ. Sustain. 2017, 10, 28–39. [Google Scholar] [CrossRef]
- Blöschl, G.; Hall, J.; Viglione, A.; Perdigão, R.A.P.; Parajka, J.; Merz, B.; Lun, D.; Arheimer, B.; Aronica, G.T.; Bilibashi, A.; et al. Changing climate both increases and decreases European river floods. Nature 2019, 573, 108–111. [Google Scholar] [CrossRef]
- Agriculture of the USSR: Statistical Bulletin (Main Indicators of Crop Production Development); Streltsov, G.I.; Makarova, O.K.; Zhdanov, M.P. (Eds.) “Finansy i Statistika” Publisher: Moscow, USSR, 1988; Available online: http://istmat.info/node/26167 (accessed on 10 September 2020). (In Russian)
- Karaushev, A.V. Water erosion and sediment. In Sediment Yield, Its Study and Geographical Distribution; Karaushev, A.V., Ed.; Gidrometeoizdat Publisher: Leningrad, Russia, 1977. (In Russian) [Google Scholar]
- Bobrovitskaya, N.N. Long-term variations in mean erosion and sediment yield from the rivers of the former Soviet Union. IAHS-AISH Publ. 1996, 236, 407–413. [Google Scholar]
- Dedkov, A.P.; Mozzherin, V.I.; Safina, G.R. On the recent trend in erosion within the steppe and forest-steppe of the East European Plain. Geomorfologiya 1997, 3, 39–43. (In Russian) [Google Scholar]
- Walling, D.E.; Owens, P.N.; Foster, I.D.L.; Lees, J.A. Changes in the fine sediment dynamics of the Ouse and Tweed basins in the UK over the last 100-150 years. Hydrol. Process. 2003, 17, 3245–3269. [Google Scholar] [CrossRef]
- Bakker, M.M.; Govers, G.; van Doorn, A.; Quetier, F.; Chouvardas, D.; Rounsevell, M. The response of soil erosion and sediment export to land-use change in four areas of Europe: The importance of landscape pattern. Geomorphology 2008, 98, 213–226. [Google Scholar] [CrossRef]
- Keesstra, S.D.; van Dam, O.; Verstraeten, G.; van Huissteden, J. Changing sediment dynamics due to natural reforestation in the Dragonja catchment, SW Slovenia. Catena 2009, 78, 60–71. [Google Scholar] [CrossRef]
- Fuchs, M.; Will, M.; Kunert, E.; Kreutzer, S.; Fischer, M.; Reverman, R. The temporal and spatial quantification of Holocene sediment dynamics in a meso-scale catchment in northern Bavaria, Germany. Holocene 2011, 21, 1093–1104. [Google Scholar] [CrossRef]
- De Girolamo, A.M.; Pappagallo, G.; Porto, A.L. Temporal variability of suspended sediment transport and rating curves in a Mediterranean river basin: The Celone (SE Italy). Catena 2015, 128, 135–143. [Google Scholar] [CrossRef]
- Gao, J.H.; Xu, X.; Jia, J.; Kettner, A.J.; Xing, F.; Wang, Y.P.; Yang, Y.; Qi, S.; Liao, F.; Li, J.; et al. A numerical investigation of freshwater and sediment discharge variations of Poyang Lake catchment, China over the last 1000 years. Holocene 2015, 25, 1470–1482. [Google Scholar] [CrossRef]
- Shi, H.Y.; Wang, G.Q. Impacts of climate change and hydraulic structures on runoff and sediment discharge in the middle Yellow River. Hydrol. Process. 2015, 29, 3236–3246. [Google Scholar] [CrossRef] [Green Version]
- Sun, L.; Yan, M.; Cai, Q.; Fang, H. Suspended sediment dynamics at different time scales in the Loushui River, south-central China. Catena 2016, 136, 152–161. [Google Scholar] [CrossRef]
- Vercruysse, K.; Grabowski, R.C.; Rickson, R.J. Suspended sediment transport dynamics in rivers: Multi-scale drivers of temporal variation. Earth Sci. Rev. 2017, 166, 38–52. [Google Scholar] [CrossRef] [Green Version]
- Gusarov, A.V. The impact of contemporary changes in climate and land use/cover on tendencies in water flow, suspended sediment yield and erosion intensity in the northeastern part of the Don River basin, SW European Russia. Environ. Res. 2019, 175, 468–488. [Google Scholar] [CrossRef]
- Gusarov, A.V. The response of water flow, suspended sediment yield and erosion intensity to contemporary long-term changes in climate and land use/cover in river basins of the Middle Volga Region, European Russia. Sci. Total Environ. 2020, 719, 134770. [Google Scholar] [CrossRef]
- Zhang, H.; Meng, C.; Wang, Y.; Wang, Y.; Li, M. Comprehensive evaluation of the effects of climate change and land use and land cover change variables on runoff and sediment discharge. Sci. Total Environ. 2020, 702, 134401. [Google Scholar] [CrossRef]
- Olson, D.M.; Dinerstein, E.; Wikramanayake, E.D.; Burgess, N.D.; Powell, G.V.; Underwood, E.C.; D’amico, J.A.; Itoua, I.; Strand, H.E.; Morrison, J.C.; et al. Terrestrial Ecoregions of the World: A New Map of Life on Earth: A new global map of terrestrial ecoregions provides an innovative tool for conserving biodiversity. BioScience 2001, 51, 933–938. [Google Scholar] [CrossRef]
- Wischmeier, W.H.; Smith, D.D. Predicting Rainfall Erosion Losses; Agriculture Handbook 537; U.S. Department of Agriculture Publisher: Washington, DC, USA, 1978.
- Grazhdankin, A.I.; Kara-Murza, S.G. White Book of Russia. Construction, Reconstruction and Reforms: 1950–2013; Nauchniy Ekspert Publisher: Moscow, Russia, 2015. (In Russian) [Google Scholar]
- Gusarov, A.V.; Golosov, V.N.; Sharifullin, A.G. Contribution of climate and land cover changes to reduction in soil erosion rates within small cultivated catchments in the eastern part of the Russian Plain during the last 60 years. Environ. Res. 2018, 167, 21–33. [Google Scholar] [CrossRef]
- Gusarov, A.V.; Rysin, I.I.; Sharifullin, A.G.; Golosov, V.N. Assessment of contemporary erosion/sedimentation rates trend within a small cultivated catchment using the radiocaesium-137 as a chronomarker (a case study from the Udmurt Republic, European Russia). Geomorfologiya 2019, 1, 37–56. (In Russian) [Google Scholar] [CrossRef]
- Rysin, I.I.; Golosov, V.N.; Grigoryev, I.I.; Zaitseva, M.Y. Influence of climate change on the rates of gully growth in the Vyatka-Kama watershed. Geomorfologiya 2017, 1, 90–103. (In Russian) [Google Scholar] [CrossRef]
- Rysin, I.I.; Grigoryev, I.I.; Zaitceva, M.Y.; Golosov, V.N.; Sharifullin, A.G. Long-term monitoring of gully erosion in Udmurt Republic, Russia. Proc. IAHS 2017, 375, 1–4. [Google Scholar] [CrossRef] [Green Version]
- Gareev, A.M.; Nazarov, N.N.; Rysin, I.I. The main trends in the development of gully erosion within the Kama Cis-Ural Region. In Erosion and Riverbed Processes; Lomonosov Moscow State University Publisher: Moscow, Russia, 2015. (In Russian) [Google Scholar]
- Piyashova, S.N. Gully erosion in the Fore-Volga Region of Nizhny Novgorod District. Geomorfologiya 2003, 4, 92–97. (In Russian) [Google Scholar]
- Sharifullin, A.G.; Gusarov, A.V.; Golosov, V.N. Assessment of contemporary erosion/sedimentation trend within a small cultivated catchment in the Republic of Tatarstan (European Russia). Geomorfologiya 2018, 3, 93–108. (In Russian) [Google Scholar]
- Medvedeva, R.A. Trends of the gully erosion development in the territory of the Republic of Tatarstan. IOP Conf. Ser. Earth Environ. Sci. 2018, 107, 012016. [Google Scholar] [CrossRef]
- Markelov, M.V.; Golosov, V.N.; Belyaev, V.R. Changes in the sedimentation rates on the floodplains of small rivers in the Central Russian Plain. Vestn. Mosk. Univ. Ser. 5 Geogr. 2012, 5, 70–76. (In Russian) [Google Scholar]
- Gusarov, A.V.; Golosov, V.N.; Sharifullin, A.G.; Gafurov, A.M. Contemporary trend in erosion of arable southern chernozems (Haplic Chernozems Pachic) in the west of Orenburg Oblast (Russia). Eurasian Soil Sci. 2018, 51, 561–575. [Google Scholar] [CrossRef]
- Petrov, O.V.; Morozov, A.F. (Eds.) Map of Quaternary Formations in the Russian Federation, Scale 1:2,500,000; Rosnedra, VSEGEI, VNII Okeanologia Publisher: Moscow, Russia, 2010. (In Russian) [Google Scholar]
- Dedkov, A.P.; Mozzherin, V.I.; Stupishin, A.V.; Trofimov, A.M. Climatic Geomorphology of Denudation Plains; Kazan University Publisher: Kazan, Russia, 1977. (In Russian) [Google Scholar]
- Surmach, G.P. Relief and Forest-Steppe Development, Modern Erosion, and Erosion Control Measures; All-Russia Scientific Research Institute of Agroforest Reclamation Publisher: Volgograd, Russia, 1992. (In Russian) [Google Scholar]
- Litvin, L.F.; Golosov, V.N.; Dobrovol’skaya, N.G.; Ivanova, N.N.; Kiryukhina, Z.P.; Krasnov, S.F. Stationary studies of erosion after snow melting in the central nonchernozemic region. In Soil Erosion and Riverbed Processes; Moscow State Univ. Publisher: Moscow, Russia, 1998; Volume 11, pp. 57–76. (In Russian) [Google Scholar]
- Kuznetsov, M.S.; Demidov, V.V. Soil Erosion in the Forest-Steppe Zone of Central Russia: Modelling, Control, and Ecological Consequences; Polteks Publisher: Moscow, Russia, 2002. (In Russian) [Google Scholar]
- Petelko, A.I.; Golosov, V.N.; Belyaev, V.R. Experience of design of system of counter-erosion measures. In Proceedings of the 10th International Symposium on River Sedimentation, Moscow, Russia, 1–4 August 2007; Moscow State University Publisher: Moscow, Russia, 2007; Volume 1, pp. 311–316. [Google Scholar]
- Barabanov, A.T.; Balychev, R.D.; Smirnov, R.E.; Kochkar, M.M. Regulation of melt-water runoff by influencing snow deposition and the nature of soil freezing. Proc. Nizhnevolzhskiy Agrouniversity Complex Sci. High. Vocat. Educ. 2012, 1, 10–13. (In Russian) [Google Scholar]
- Medvedev, I.F.; Levitskaya, N.G.; Makarov, V.Z.; Nazarov, V.A. The results of monitoring of erosion processes on chernozems of the Volga Region. Agrar. Sci. J. 2016, 8, 29–34. (In Russian) [Google Scholar]
- Barabanov, A.T.; Dolgov, S.V.; Koronkevich, N.I. Effect of present-day climate changes and agricultural activities on spring overland runoff in forest-steppe and steppe regions of the Russian Plain. Water Resour. 2018, 45, 447–454. [Google Scholar] [CrossRef]
- Sarauskiene, D.; Kriauciuniene, J.; Reihan, A.; Klavins, M. Flood pattern changes in the rivers of the Baltic countries. J. Environ. Eng. Landsc. Manag. 2015, 23, 28–38. [Google Scholar] [CrossRef] [Green Version]
- Arheimer, B.; Lindström, G. Climate impact on floods: Changes in high flows in Sweden in the past and the future (1911–2100). Hydrol. Earth Syst. Sci. 2015, 19, 771–784. [Google Scholar] [CrossRef] [Green Version]
- Kaczmarek, Z. The impact of climate variability on flood risk in Poland. Risk Anal. 2003, 23, 559–566. [Google Scholar] [CrossRef] [PubMed]
- Kiryukhina, Z.P.; Patsukevich, Z.V. Erodibility of plowed soils in Russia upon rainstorms. Eurasian Soil Sci. 2001, 34, 1018–1023. [Google Scholar]
- Gusarov, A.V.; Sharifullin, A.G. Contemporary erosion and suspended sediment yield within river basins in the steppe of the southeastern part of the Russian Plain: A case study of the Samara River basin. Izv. Ross. Akad. Nauk Seriya Geogr. 2019, 1, 37–51. (In Russian) [Google Scholar] [CrossRef] [Green Version]
- Kosmas, C.; Gerontidis, S.; Marathianou, M. The effects of land use change on soils and vegetation over various lithological formations on Lesvos (Greece). Catena 2000, 40, 51–68. [Google Scholar] [CrossRef]
- Lach, J.; Wyżga, B. Channel incision and flow increase of the upper Wisłoka River, southern Poland, subsequent to the reafforestation of its catchment. Earth Surf. Process. Landf. 2002, 27, 445–462. [Google Scholar] [CrossRef]
- López-Moreno, J.I.; Beguería, S.; García-Ruiz, J.M. Trends in high flows in the central Spanish Pyrenees: Response to climatic factors or to land-use change? Hydrol. Sci. J. 2006, 51, 1039–1050. [Google Scholar] [CrossRef] [Green Version]
- Cebecauer, T.; Hofierka, J. The consequences of land-cover changes on soil erosion distribution in Slovakia. Geomorphology 2008, 98, 187–198. [Google Scholar] [CrossRef]
- Wyżga, B. A review on channel incision in the Polish Carpathian rivers during the 20th century. In Gravel-Bed Rivers VI: From Process Understanding to River Restoration; Habersack, H., Piégay, H., Rinaldi, M., Eds.; Dev. Earth Surf. Proc. 11; Elsevier: Amsterdam, The Netherlands, 2008; pp. 525–555. [Google Scholar]
- Zorn, M.; Komac, B. Response of soil erosion to land use changes within particular reference to the last 200 years (Julian Alps, western Slovenia). Rev. Geomorfol. 2009, 11, 39–47. [Google Scholar]
- García-Ruiz, J.M. The effects of land uses on soil erosion in Spain: A review. Catena 2010, 81, 1–11. [Google Scholar] [CrossRef]
- García-Ruiz, J.M.; Lana-Renault, N.; Beguería, S.; Lasanta, T.; Regüés, D.; Nadal-Romero, E.; Serrano-Muela, P.; López-Moreno, J.I.; Alvera, B.; Martí-Bono, C.; et al. From plot to regional scales: Interactions of slope and catchment hydrological and geomorphic processes in the Spanish Pyrenees. Geomorphology 2010, 120, 248–257. [Google Scholar] [CrossRef] [Green Version]
- Spalević, V.; Nyssen, J.; Curovic, M.; Lenaerts, T.; Kerckhof, A.; Annys, K.; van den Branden, J.; Frankl, A. The impact of land use on soil erosion in the river basin Boljanska Rijeka in Montenegro. In IV International Symposium “Agrosym 2013”; Book of Proceedings; University of East Sarajevo: Sarajevo, Republic of Srpska, Bosnia, 2013; pp. 54–63. [Google Scholar] [CrossRef]
- Latocha, A.; Szymanowski, M.; Jeziorska, J.; Stec, M.; Roszczewska, M. Effects of land abandonment and climate change on soil erosion—An example from depopulated agricultural lands in the Sudetes Mts., SW Poland. Catena 2016, 145, 128–141. [Google Scholar] [CrossRef]
- Manojlović, S.; Sibinović, M.; Srejić, T.; Hadud, A.; Sabri, I. Agriculture land use change and demographic change in response to decline suspended sediment in Južna Morava River basin (Serbia). Sustainability 2021, 13, 3130. [Google Scholar] [CrossRef]
- Gusarov, A.V.; Sharifullin, A.G.; Komissarov, M.A. Contemporary long-term trends in water discharge, suspended sediment load, and erosion intensity in river basins of the North Caucasus region, SW Russia. Hydrology 2021, 8, 28. [Google Scholar] [CrossRef]
- Kalyuzhny, I.L.; Pavlova, K.K. Formation of Snowmelt Runoff Losses; Gidrometeoizdat Publisher: Saint Petersburg, Russia, 1981. (In Russian) [Google Scholar]
- Kanatieva, N.P.; Krasnov, S.F.; Litvin, L.F. Modern changes in the climatic factors of erosion in the north of the Cis-Volga Region. In Soil Erosion and Riverbed Processes; Chalov, R.S., Ed.; Geographical Faculty of MGU Publisher: Moscow, Russia, 2010; Volume 17, pp. 14–27. (In Russian) [Google Scholar]
- Chernokulsky, A.; Kozlov, F.; Zolina, O.; Bulygina, O.; Mokhov, I.I.; Semenov, V.A. Observed changes in convective and stratiform precipitation in Northern Eurasia over the last five decades. Environ. Res. Lett. 2019, 14, 45001. [Google Scholar] [CrossRef]
- Li, L.; Ni, J.; Chang, F.; Yue, Y.; Frolova, N.; Magritsky, D.; Borthwick, A.G.L.; Ciais, P.; Wang, Y.; Zheng, C.; et al. Global trends in water and sediment fluxes of the world’s large rivers. Sci. Bull. 2020, 65, 62–69. [Google Scholar] [CrossRef] [Green Version]
Figure 1.
Change in the total area of cultivated land (F) in the Russian Federation in 1970–2017. RSFSR—the Russian Soviet Federative Socialist Republic as the principal part of the former USSR until December 1991; Fav—the average area of cultivated land; ∆F—relative change in Fav between 1970–1991 and 2005–2017 with p (Student’s t-test); R2—the coefficient of determination of a sixth-degree polynomial trend (1); 2—the years of the political and economic reform in the USSR, “Perestroika”. In the sixth-degree polynomial equation: Fi is the modeled F-value for the year yi. Note. According to the five-year program for the development of the socialist planned economy of the former USSR, the total area of cultivated land during every five years (…1971–1975, 1976–1980, 1981–1985, and 1986–1990) remained slightly changed.

Figure 2.
The location of the study region on political (A), physical (B), and land-cover (C) maps. The map (A): Administrative regions of European Russia: 1–Pskov Oblast, 2–Leningrad Oblast, 3–Novgorod Oblast, 4–Smolensk Oblast, 5–Bryansk Oblast, 6–Tver Oblast, 7–Kaluga Oblast, 8–Kursk Oblast, 9–Orel Oblast, 10–Belgorod Oblast, 11–Tula Oblast, 12–Moscow Oblast, 13–Yaroslavl Oblast, 14–Lipetsk Oblast, 15–Voronezh Oblast, 16–Ryazan Oblast, 17–Vladimir Oblast, 18–Rostov Oblast, 19–Ivanovo Oblast, 20–Tambov Oblast, 21–Kostroma Oblast, 22–Volgograd Oblast, 23–Republic of Mordovia, 24–Nizhny Novgorod Oblast, 25–Penza Oblast, 26–Republic of Kalmykia, 27–Saratov Oblast, 28–Chuvash Republic, 29–Astrakhan Oblast, 30–Mari El Republic, 31–Ulyanovsk Oblast, 32–Kirov Oblast, 33–Samara Oblast, 34–Republic of Tatarstan, 35–Udmurt Republic, 36–Orenburg Oblast, 37–Perm Krai, 38–Republic of Bashkortostan. Note 1. Without the Vologda Oblast (VO), Arkhangelsk Oblast (AO), Komi Republic (KR), Republic of Karelia (RK), Murmansk Oblast, and the semi-exclave of the Kaliningrad Oblast (KO); KK–Krasnodar Krai, SK–Stavropol Krai. Note 2. The cities of Moscow and Saint Petersburg as administrative regions of the Russian Federation were not included in the study. Note 3. The Orenburg Oblast includes both its European part and Asian part. The map (B): Hydrological stations on the analyzed rivers are listed in Table 1. The map (C): a–forestland, b–arable land.

Figure 3.
Relative reduction (∆R) in cultivated land area within the analyzed administrative regions of European Russia between 1970–1987 and 1996–2017, according to [64]. Note. The boundaries of the landscape zones are given, according to [67]. For other symbols, see Figure 2.

Figure 4.
Relative reduction in cultivated land area under cereals (∆S(C)) within the analyzed administrative regions of European Russia between 1970–1987 and 1996–2017. For other symbols, see Figure 2 and Figure 3.

Figure 5.
Relative changes in cultivated land area under perennial crops (∆S(P)) within the analyzed administrative regions of European Russia between 1970–1987 and 1996–2017. For other symbols, see Figure 2 and Figure 3.

Figure 6.
Relative changes in cultivated land area under annual crops (∆S(A)) within the analyzed administrative regions of European Russia between 1970–1987 and 1996–2017. For other symbols, see Figure 2 and Figure 3.

Figure 7.
Changes in water discharge (Q) and suspended sediment load (R) of the Vyatka River (the forest zone’s south, see Figure 2B and Table 1) during 1940–2018. 1–mean annual Q; 2–maximum (per annum) mean monthly Q; 3–mean annual R; 4–maximum (per annum) mean monthly R; the dashed line–a fourth-degree polynomial trend; ∆–relative changes with p (Student’s t-test).

Figure 8.
Changes in mean annual water discharge (Q, 1) and suspended sediment load (R, 2) of the Myosha River and Kazanka River (see Figure 2B and Table 1) in 1960–2016, modified from [65]; the dashed line–a sixth-degree polynomial trend. a Hereinafter, a 95% confidence interval.

Figure 9.
Changes in water flow (Q–mean annual water discharge; H–annual depth of surface water runoff) and suspended sediment load/yield (R; 1—observed, 2—modeled according to the power equation of the relationship between two variables) in the Bolshoy Kinel’ River at Timashevo and the Khopyor River at Besplemyanovsky (see Figure 2B and Table 1) during 1950–2017. The dashed line is a fifth-degree polynomial trend; p–the probability of statistically significant differences in average values between 1950–1975/1979 and 2000/2008–2017 (Student’s t-test). 1 Without 1957, 1966, and 1979; 2 Without 1963–1965; 3 For 1980, 1992–1995, 1997, and 1998; 4 Without 2006 and 2007; 5 Without 2009.

Figure 10.
The ratio between relative changes in the total population (∆TP, %) and the total area of cultivated land (∆F, %) by the analyzed administrative regions in the landscape zones of European Russia: (A) between 1970–1987 and 1996–2017, (B) between 1996–2004 and 2005–2017; R2—the coefficient of determination of a linear trend (tr). LO—the Leningrad Oblast, MO—the Moscow Oblast (see Figure 2A).

Figure 11.
Changes in intra-annual distribution characteristics of water flow recorded in some studied rivers of the Middle Volga region (the Chuvash Republic, Republic of Tatarstan, Ulyanovsk Oblast, Samara Oblast, and Orenburg Oblast, see Figure 2A), calculated based on data from [65]. P—the portion of spring (snowmelt-induced) flood surface water runoff in the total annual surface water runoff; Z—the average intensity of spring (snowmelt-induced) flood surface water runoff; Qmax—maximum (per annum) discharge timed to the spring (snowmelt-induced) flood period; η—the average dimensionless ratio between Qmax and minimum (per annum) water discharge timed to the river-ice-free baseflow period (Qmin): η = Qmax/Qmin. The rivers: 1–Aktai at Karavayevo (55°05′43″ N 49°50′21″ E), 2–Bolshoy Cheremshan at Novocheremshansk (54°22′19″ N 50°09′06″ E), 3–Bolshoy Kinel′ at Timashevo, 4–Chagra at Novotulka, 5–Kazanka at Arsk, 6–Kichuy at Utyashkino, 7–Krasnaya at Krasnaya Reka, 8–Kubnya at Chuteyevo (55°17′19″ N 47°46′18″ E), 9–Maliy Cheremshan at Abalduyevka (54°57′09″ N 50°15′57″ E), 10–Sheshma at Sloboda Petropavlovskaya (55°03′35″ N 51°21′43″ E), 11–Syzranka at Repyovka, 12–Tushonka at Sergeyevka. Note. Rivers 1, 2, 8–10 are additionally studied rivers concerning the temporal dynamics of water flow, which were not included in the study′s analysis. 1 Average values of the analyzed characteristics for the monitoring periods.

Figure 12.
Generalized scheme for explaining the combined effects of climate and land-cover/-use changes on the temporal dynamics of hydrological and erosion/sedimentation processes in river basins of the most populated and agriculturally developed part of European Russia during the last few decades.

Table 1.
The analyzed rivers (see Figure 2B); F–river basin area (km2).
Table 1.
The analyzed rivers (see Figure 2B); F–river basin area (km2).
| № | River | Hydrological Station, Coordinates | F | Additional Information |
|---|---|---|---|---|
| Forest zone (southern taiga, mixed and broadleaf forests) | ||||
| 1 | Vyatka | Kirov, 58°36′ N 49°39′ E | 48,300 | A right-bank tributary of the Kama River |
| 2 | Vyatka | Vyatskiye Polyany, 56°13′06″ N 51°04′06″ E | 124,000 | |
| Forest-steppe zone | ||||
| 3 | Kazanka | Arsk, 56°04′48″ N 49°52′12″ E | 650 | A left-bank tributary of the Volga River |
| 4 | Myosha | Pestretsy, 55°45′00″ N 49°40′12″ E | 3230 | A right-bank tributary of the Kama River |
| 5 | Kichuy | Utyashkino, 55°12′46″ N 51°19′39″ E | 1330 | The basin of the lower Kama River |
| 6 | Tushonka | Sergeyevka, 54°03′34″ N 48°30′55″ E | 309 | A right-bank tributary of the Volga River |
| 7 | Syzranka | Repyovka, 53°08′59″ N 48°05′10″ E | 4380 | A right-bank tributary of the Volga River |
| 8 | Krasnaya | Krasnaya Reka, 54°33′59″ N 49°07′41″ E | 311 | A left-bank tributary of the Volga River |
| 9 | Sosna | Yelets, 52°37′ N 38°28′ E | 16,300 | The northwest of the Don River basin |
| 10 | Krasivaya Mecha | Yefremov, 53°09′ N 38°07′ E | 3240 | The northwest of the Don River basin |
| Steppe zone | ||||
| 11 | Samara | Yelshanka, 52°52′21″ N 52°02′19″ E | 22,800 | A left-bank tributary of the Volga River |
| 12 | Bolshoy Kinel’ | Timashevo, 53°19′33.6′′ N 51°10′45.4″ E | 12,000 | A right-bank tributary of the Samara River |
| 13 | Chagra | Novotulka, 52°39′53.64″ N 48°45′14.86″ E | 2550 | A left-bank tributary of the Volga River |
| 14 | Bolshoy Karaman | Sovetskoye, 51°27′ N46°44′ E | 3470 | A left-bank tributary of the Volga River |
| 15 | Khopyor | Besplemyanovsky, 50°44′33″ N 41°51′58″ E | 44,900 | A left-bank tributary of the Don River |
| 16 | Medveditsa | Lysyye Gory, 51°31′45″ N 44°48′20″ | 7610 | A left-bank tributary of the Don River |
Table 2.
Changes in the total area (km2) of cultivated land within the analyzed landscape zones of European Russia (see Figure 2 and Figure 3) during 1970–2017.
| Landscape Zone | Monitoring Period | ∆, % | |
|---|---|---|---|
| 1970–1987 (1996–2004) | 1996–2017 (2005–2017) | ||
| Forest zone (16) 1 | 183,455 | 102,679 | −44.0 |
| (127,080) | (85,790) | −32.5 | |
| Forest-steppe zone (13) | 256,660 | 175,409 | −31.7 |
| (187,630) | (166,900) | −11.0 | |
| Steppe zone (7) | 300,162 | 210,326 | −29.9 |
| (213,400) | (206,200) | −3.4 | |
| Semi-desert zone (2) | 11,651 | 3994 | −65.7 |
| (4690) | (3510) | −25.3 | |
| Total study region (38) | 751,928 | 492,408 | −34.5 |
| (532,800) | (462,400) | −13.2 | |
∆–relative reduction between the periods. 1 The number of analyzed administrative regions.
Table 3.
Changes in the crop management factor (C-factor) during the warm season (May to October) in the analyzed landscape zones of European Russia between 1970–1987 and 2005–2017.
Table 3.
Changes in the crop management factor (C-factor) during the warm season (May to October) in the analyzed landscape zones of European Russia between 1970–1987 and 2005–2017.
| Landscape Zone | ΣC 1 | ∆, % | |
|---|---|---|---|
| 1970–1987 2 | 2005–2017 3 | ||
| Forest zone (16) 4 | 0.35 | 0.13 | −62.9 |
| Forest-steppe zone (13) | 0.43 | 0.28 | −34.9 |
| Steppe zone (7) | 0.39 | 0.33 | −15.4 |
| Semi-desert zone (2) | 0.44 | 0.23 | −47.7 |
∆–relative reduction between the periods. 1 The integral C-factor was calculated only for cereals, perennial and annual crops, potato, sugar beet, and sunflower. These crops occupied more than 85% of cultivated land during the periods. 2 Within cultivated land area during this period. 3 Within the area of cultivated and abandoned lands during this period. 4 The number of analyzed administrative regions.
Table 4.
Changes in the number of tractors and grain combine harvesters in the analyzed landscape zones of European Russia (see Figure 3) between 2006 and 2016.
Table 4.
Changes in the number of tractors and grain combine harvesters in the analyzed landscape zones of European Russia (see Figure 3) between 2006 and 2016.
| Landscape Zone | Variable | Year | ∆, % | |
|---|---|---|---|---|
| 2006 | 2016 | |||
| Forest zone (16) 1 | Tractors, ×103 un. | 206 | 179 | −13 |
| τ, ha per un. | 45 | 46 | +2 | |
| Combines, ×103 un. | 20.4 | 9.6 | −53 | |
| χ, ha per un. | 139 | 269 | +94 | |
| Forest-steppe zone (13) | Tractors, ×103 un. | 211 | 202 | −4 |
| τ, ha per un. | 74.4 | 87.6 | +18 | |
| Combines, ×103 un. | 40.0 | 27.2 | −32 | |
| χ, ha per un. | 212 | 367 | +73 | |
| Steppe zone (7) | Tractors, ×103 un. | 193 | 168 | −13 |
| τ, ha per un. | 105 | 129 | +23 | |
| Combines, ×103 un. | 48.9 | 37.3 | −24 | |
| χ, ha per un. | 255 | 343 | +35 | |
| Semi-desert zone (2) | Tractors, ×103 un. | 8.7 | 7.5 | −14 |
| τ, ha per un. | 41.2 | 43.9 | +7 | |
| Combines, ×103 un. | 1.4 | 0.7 | −50 | |
| χ, ha per un. | 166 | 293 | +76 | |
| Total study region (38) | Tractors, ×103 un. | 618 | 556 | −10 |
| τ, ha per un. | 73.8 | 86.1 | +17 | |
| Combines, ×103 un. | 111 | 75 | −32 | |
| χ, ha per un. | 217 | 342 | +58 | |
τ (χ)—the number of hectares of cultivated land per one tractor (grain combine harvesters); ∆—relative change between 2006 and 2016; 1 The number of analyzed administrative regions.
Table 5.
Changes in water discharge of the Bolshoy Kinel’ River at Timashevo, the eastern part of the Samara Oblast and the western part of the Orenburg Oblast of European Russia (see Figure 2A,B), during 1942–2017.
Table 5.
Changes in water discharge of the Bolshoy Kinel’ River at Timashevo, the eastern part of the Samara Oblast and the western part of the Orenburg Oblast of European Russia (see Figure 2A,B), during 1942–2017.
| Variable | Monitoring Period | ∆, % | p | ||
|---|---|---|---|---|---|
| Qm, m3 s−1 | Month | 1942–1983 | 1984–2017 (1996–2017) | ||
| January | 10.3 ± 0.9 | 22.0 ± 2.6 | +113.6 | <0.001 | |
| February | 9.7 ± 0.7 | 20.4 ± 2.2 | +110.3 | <0.001 | |
| March | 17.7 ± 6.1 | 30.0 ± 7.9 | +69.5 | 0.01 < p < 0.05 | |
| April | 226.9 ± 31.6 | 176.8 ± 31.5 (149.9 ± 28.4) | −22.1 (−33.9) | 0.01 < p < 0.05 (< 0.001) | |
| May | 70.9 ± 18.7 | 71.8 ± 18.2 | +1.3 | >>0.05 | |
| June | 22.3 ± 2.6 | 35.2 ± 4.2 | +57.8 | <0.001 | |
| July | 16.3 ± 2.0 | 29.6 ± 3.5 | +81.6 | <0.001 | |
| August | 14.2 ± 1.6 | 25.2 ± 2.7 | +77.5 | <0.001 | |
| September | 13.0 ± 1.1 | 23.8 ± 2.4 | +83.1 | <0.001 | |
| October | 13.6 ± 1.1 | 24.4 ± 2.6 | +79.4 | <0.001 | |
| November | 13.3 ± 1.1 | 26.2 ± 3.7 | +97.0 | <0.001 | |
| December | 11.7 ± 0.9 | 24.8 ± 2.9 | +112.0 | <0.001 | |
| Qmax, m3 s−1 | 675.9 ± 144.2 | 406.8 ± 98.9 | −39.8 | 0.001 < p < 0.01 | |
| Qmin(1), m3 s−1 | 7.9 ± 0.6 | 16.9 ± 2.1 | +117.4 | <0.001 | |
| Qmin(2), m3 s−1 | 10.2 ± 1.1 | 19.0 ± 1.9 | +80.5 | <0.001 | |
| Qmax/Qmin(2), times | 66.3 | 21.4 | −67.7 | <0.001 | |
Qm–mean monthly water discharge; Qmax–maximum (per annum) water discharge timed to the spring (snowmelt-induced) flood period; Qmin–minimum water discharge for the winter months—December to February (1), and the river-ice-free period, mainly the late April to November (2); ∆–relative changes in the variables between the periods with p (Student’s t-test). Note. 1983/1984–the years of the most significant changes in Qm of the river during all calendar months, excluding April. In April, when the spring (snowmelt-induced) flood occurs, these changes became more noticeable only after the mid-1990s.
Publisher’s Note: MDPI stays neutral with regard to jurisdictional claims in published maps and institutional affiliations. |
© 2021 by the author. Licensee MDPI, Basel, Switzerland. This article is an open access article distributed under the terms and conditions of the Creative Commons Attribution (CC BY) license (https://creativecommons.org/licenses/by/4.0/).
Share and Cite
MDPI and ACS Style
Gusarov, A.V. Land-Use/-Cover Changes and Their Effect on Soil Erosion and River Suspended Sediment Load in Different Landscape Zones of European Russia during 1970–2017. Water 2021, 13, 1631. https://doi.org/10.3390/w13121631
AMA Style
Gusarov AV. Land-Use/-Cover Changes and Their Effect on Soil Erosion and River Suspended Sediment Load in Different Landscape Zones of European Russia during 1970–2017. Water. 2021; 13(12):1631. https://doi.org/10.3390/w13121631
Chicago/Turabian StyleGusarov, Artyom V. 2021. "Land-Use/-Cover Changes and Their Effect on Soil Erosion and River Suspended Sediment Load in Different Landscape Zones of European Russia during 1970–2017" Water 13, no. 12: 1631. https://doi.org/10.3390/w13121631
Note that from the first issue of 2016, this journal uses article numbers instead of page numbers. See further details here.