
Socio-Hydrological Approach to Explore Groundwater–Human Wellbeing Nexus: Case Study from Sundarbans, India


1
School of Environmental Science and Engineering, Indian Institute of Technology Kharagpur, Kharagpur 721302, India
2
Natural Resources and Ecosystem Services, Institute for Global Environmental Strategies, Hayama, Kanagawa 240-0115, Japan
3
Department of Geology and Geophysics, Indian Institute of Technology Kharagpur, Kharagpur 721302, India
4
Applied Policy Advisory to Hydrogeosciences Group, Indian Institute of Technology Kharagpur, Kharagpur 721302, India
*
Author to whom correspondence should be addressed.
Water 2021, 13(12), 1635; https://doi.org/10.3390/w13121635
Submission received: 7 May 2021
/
Revised: 3 June 2021
/
Accepted: 8 June 2021
/
Published: 10 June 2021
(This article belongs to the Special Issue Water Quality Assessments for Urban Water Environment)
Abstract
:Coastal regions are the residence of an enormously growing population. In spite of rich biodiversity, coastal ecosystems are extremely vulnerable due to hydroclimatic factors with probable impact on socio-economy. Since the last few decades, researchers and policymakers were attracted towards the existing water demand–resource relationship to predict its future trends and prioritize better water resource management options. Water Evaluation And Planning (WEAP) serves the wholesome purpose of modeling diverse aspects of decision analysis using water algorithm equations for proper planning of water resource management. In this study, future groundwater demand (domestic, agricultural, and livestock sector) in the fragile Sundarbans ecosystem was estimated considering different human population growth rates (high, low, and current) for 2011–2050. The results showed that the sustainability of coastal aquifer-dependent rural livelihood is expected to face great danger in the near future. The total groundwater demand is expected to rise by approximately 17% at the current growth rate in the study area to fulfill the domestic and agricultural requirement, while this value goes up to around 35% for a higher growth rate and around 4% for a lower growth rate. The impact of increasing groundwater demand was analyzed further to identify any socio-economic shifts in this region.
1. Introduction
The history of humankind can be scripted with regard to the human and water interactions and interrelationship [1]. Water is an indispensable natural resource. However, sustainable management of water resources requires a proper understanding of interactions between human and hydrological parameters [2]. Almost 70% of global water (both surface and groundwater) is utilized in the agricultural sector, making it the largest consumer of water resources worldwide [3]. According to the water bulletin published by Circle of Blue [4], nearly 80% of Indian livelihoods directly or indirectly rely on groundwater. Furthermore, rapid population expansion entails intensification of the food manufacturing sector, demanding a constant water supply. Rockstrom et al. (2001) defined a country as water-stressed where per capita per year (pcpy) water availability is less than 1700 m3 [5]. As stated in the Ministry of Jal Shakti report [6], the annual water availability per capita was 1545 m3 in 2011, which may further reduce to 1486 m3 in 2021, signifying India as a water-stressed country. According to the study conducted by Vorosmarty et al. [7], nearly 2.4 billion people, which is 1/3rd of the world population, are residing in water-stressed countries, whereas this value might increase to 2/3rd by the end of 2025. Moreover, the impact of climate change is intensifying over South Asian countries with adverse effects on the agricultural sector, especially in coastal regions. Water resources, agriculture, human health status, and the overall ecosystem are in ever-increasing stress due to inconsistent rainfall, rapid temperature increases, and the rise in sea level along with frequent intense extreme climatic events such as cyclonic storms in coastal regions of India [8]. Global climate change and increased demand for economic expansion with population growth at full tilt have led to the disproportionate exploitation of water resources causing declining water availability per capita specifically in developing countries such as India [9].
In the recent past, deserving emphasis was given to the term “vulnerability” by the scientific community. Vulnerability is described as the sensitivity of the system to any stressor variable, which is also dependent on the state, rate, and duration of exposure to the variable as well as capability to adapt to the stressful situation [10]. The lower part of the Gangetic delta comprising Sundarbans, the largest mangrove forest in the world, is a well-recognized hotspot of climate change [11]. The entire Sundarbans region is extremely fragile due to the low-lying coastal plain, and in addition to that, excessive reliance on rain-fed agro-economy affects the remunerative security of farmers as a result of inconsistent rainfall driven by climatic change, which has further worsened rural livelihood [12,13]. The sustainability of livelihood in Sundarbans and associated coastal zones is facing great insecurity due to over-dependence on the agricultural sector [14]. Additionally, increasing soil salinity due to proximity to the Bay of Bengal and frequent cyclonic storms (such as Aila and super cyclone Amphan in the recent past) along with the increasing prevalence of harmful pests and disease because of elevated temperature and humid conditions further deteriorates agricultural output [15]. Saline river water and brackish subsurface groundwater have led the residents of the Sundarbans region to depend on fresh groundwater abstracted from the confined aquifer at 160 to 300 m below ground level. The drinking water requirement of nearly 4.5 million people residing in this region is fulfilled by deep groundwater [16], whereas merely 32% of total households receive water from the piped groundwater facility [17], intensifying the hardship of local people to obtain one of the most important natural resources—water.
Socio-hydrology or hydro-sociology is a broad domain that combines both socio-economic aspects and environmental features of hydrology, concentrating on basic scientific principles of interrelationship, feedback mechanisms consisting of two separate loops of socio-economy and community sensitivity loops, and evolving human behavior. The sensitivity loop, a decisive component, depends solely on the community behavior and water management decisions which are driven by a community’s social and environmental values and local action translating into direct or indirect impacts on any marginal change in water variables. Naturally, the sensitivity loop determines how behavioral response will impact on future available water quality as well as quantity [2]. Various tools are available to assess water resource management along with coupling with socio-economic parameters. Some of the widely used models are mentioned below. The Spatial Agro Hydro Salinity Model or SAHYSMOD (developed by International Institute for Land Reclamation and Improvement, Wageningen, Netherlands) is used to incorporate hydrological and physical consequences along with social and economic factors to understand the issues and approach to the sustainable development of any basin [18]. The ModSim, also named as Modular Simulator (developed by Colorado State University, Colorado, USA), is widely used as a decision support system (DSS) for both short and long-term planning in any river basin to develop advanced policy-making for better water allocation strategy [19]. Among many, Water Evaluation And Planning (WEAP) (developed by Stockholm Environment Institute’s U.S. Center, Massachusetts) modeling has emerged as one of the best platforms in many catchments to understand and implicate water management strategies under varying climatic and socio-economic scenarios [20,21]. A major advantage of using WEAP lies in the simulation of the water situation in recent times, quantitative evaluation of water, and based on that, proper management scenarios for water demand and supply problems. There are some previously set objects along with procedures provided by WEAP to solve any management-related problem of any stream, reservoir, watershed, or canal by applying a scenario-based approach [22]. Previously, the WEAP model has been successfully used to supervise the transboundary water resource-related issues associated with political conflicts in the Jordon River basin [23]. Ospina et al. (2011) [24] analyzed the adaptive strategies against increasing climate change to understand an effective supply–demand scenario in the Sinu-Caribe River basin, located in Columbia. In India, one major case study (Polavaram project) was conducted by Bharati et al. (2008) [25] to estimate the water availability–demand conflict from Godavari River to Krishna River. Nevertheless, there are no such studies on the hydrological impact on the socio-economy in the highly vulnerable Sundarbans region, where major risk factors are increasing groundwater salinity and depleting groundwater storage [26].
This study aimed to identify the basic drivers of the “sensitivity loop”, the most important feedback loop in socio-hydrology [2], to understand the human behavior and management policies under a hydrological context in the Sundarbans region. This is one of the first studies to estimate the groundwater demand and its impact on socio-economic parameters with the application of the WEAP model in the Sundarbans region. Under this model, each scenario describes compatible plots of how a system might evolve in the future (within a particular period) under the specific socio-economic condition. Scenario analysis acts as an effective tool for developing proper policy amidst uncertainties [27,28].
More precisely, the research objectives are:
- Analyzing the current socio-economic status (shift in occupation) over the decade under a hydrological context for the study area;
- Predicting the sector-wise (household, agricultural and livestock) groundwater demand for different growth scenarios in 2050;
- Identifying the way forward to achieve sustainable water resource management and human wellbeing.
The integrated hydro-socioeconomic approach is applied to provide scientific evidence to guide policy-makers in formulating better water management practices. Throughout the entire manuscript, the water should be regarded as groundwater and the agricultural crop is specified as paddy or rice.
2. Study Area
2.1. Description of the Study Area
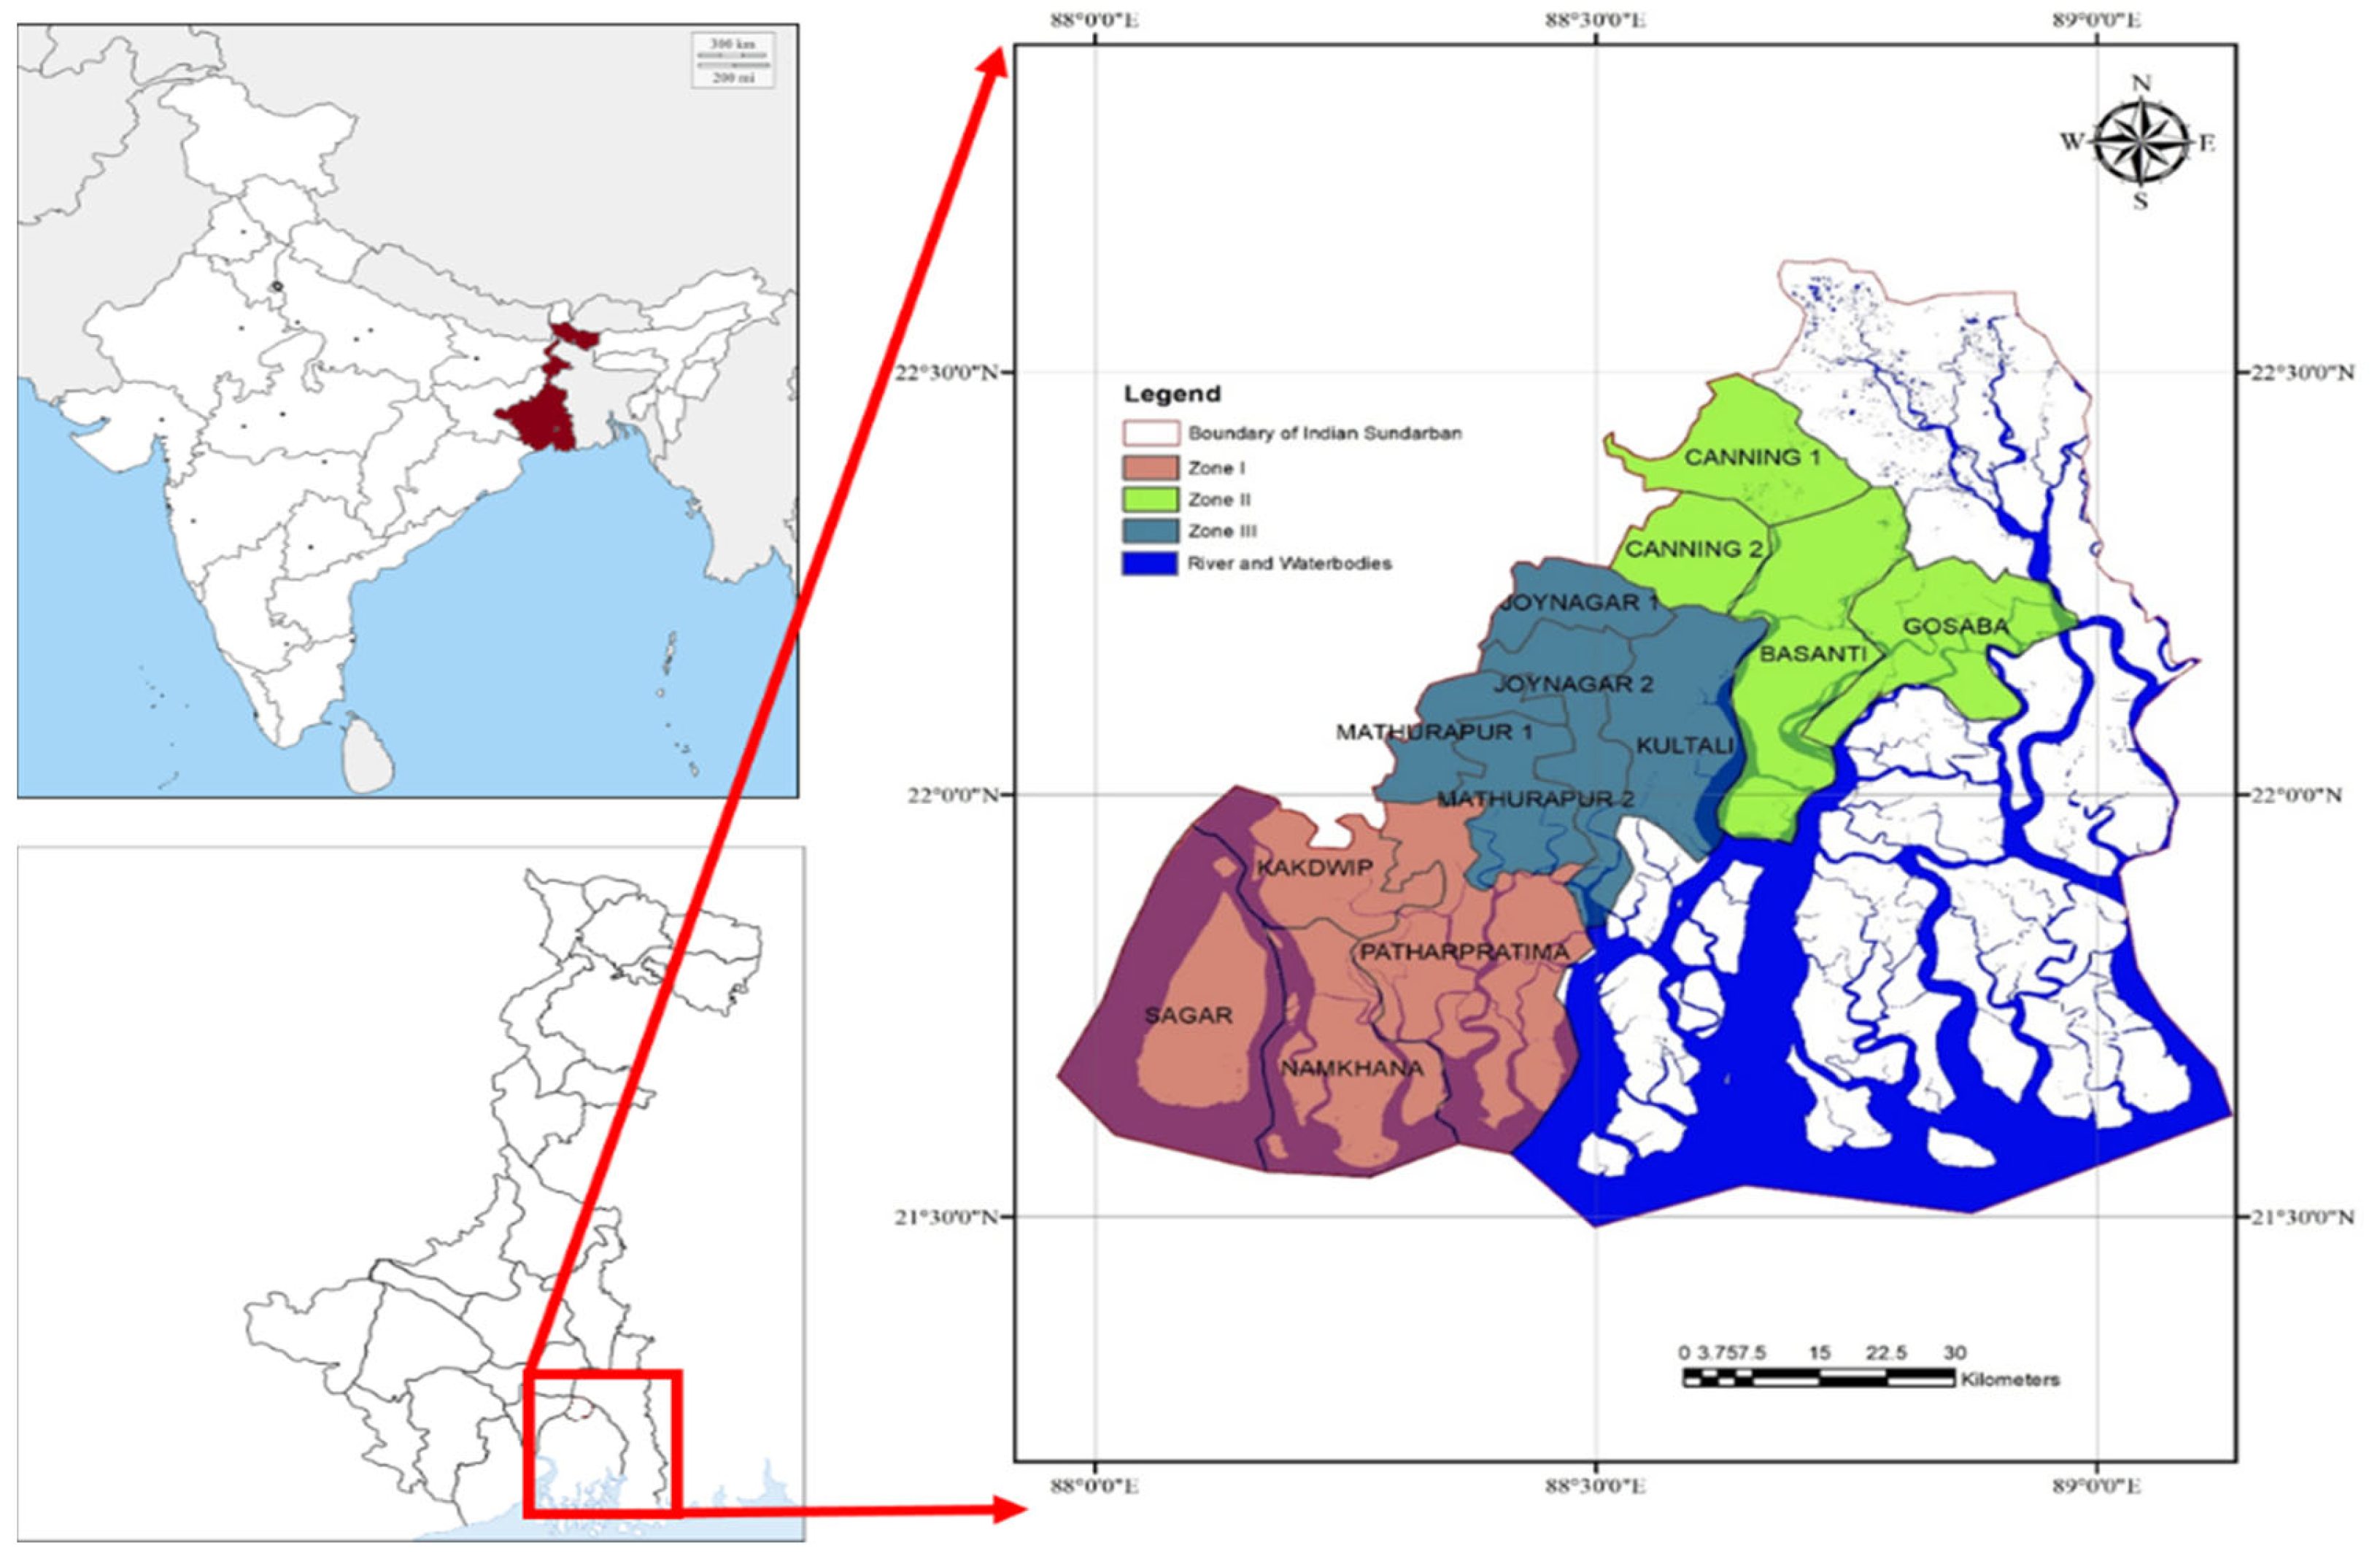
Combined depositional activities of the world’s largest river network, namely the Ganges–Brahmaputra–Meghna (GBM), shaped the Sundarbans delta, covering an area of nearly one million hectares, shared among India (38%) and Bangladesh (62%) [29]. Geographically, the Indian Sundarbans region lies within 21°30′ to 22°40′ N latitude and 88°05′ to 89°55′ E longitude and is bounded by the Dampier and Hodges line from the northern side, the Hoogli River (a distributary of the river Ganges and a part of the Bhagirathi–Hoogli river channel) from the west, and Bangladesh from the east, while the Bay of Bengal demarcates the southern boundary. The Sundarbans deltaic complex is characterized by extensive sand flats, beaches, coastal dunes, and estuaries, while creeks, mudflats, and mangrove swamps are other important morphotypes [30,31]. The warm-humid climate is prevalent throughout the hydrological year with an average annual precipitation of around 1600 mm in the study area [26]. Lithologically, the study area is categorized into three zones: (i) upper shallow aquifer with a depth range up to 60 mbgl; (ii) the main aquifer (up to a depth of 140–150 mbgl), which is characterized by semi-confined to locally unconfined comprising medium to coarse grained sand with alternate layers of gravel and varying in thickness up to 75 m in the southern part; and (iii) the aquifer beyond 150 m is regarded as a deeper aquifer which is separated from the main aquifer by a clay layer which consists of medium to coarse sands with inter-beds of clay and silt [32,33,34]. The Indian Sundarbans Biosphere Reserve comprises around 9630 sq. km., among which 5367 sq. km. of forest area is cleared for habitation extending over 19 community development or C.D. blocks (13 blocks from South 24 Parganas and 6 from North 24 Parganas) [31,35]. The present study was conducted specifically in thirteen blocks of South 24 Parganas, which are further divided into three zones, i.e., Zone I (Patharpratima, Kakdwip, Namkhana, and Sagar), Zone II (Canning I, Canning II, Basanti, Gosaba), and Zone III (Jaynagar I, Jaynagar II, Mathurapur I, Mathurapur II, Kultali) (Figure 1). The southern region (Zone I in this study) is famous for its tourist attraction, which is mainly divided into three types, viz., religious tourism, beach tourism, and wildlife tourism. Sagar Island is well known as a Hindu pilgrimage site, attracting millions annually. Beach tourism is mostly prevalent in the southern beaches of the Namkhana community development block. Although they are elusive, tigers are the major attraction of wildlife tourism [36]. According to Mitra et al. (2009) [37], water quality in the Sundarbans region has been deteriorating over the last few decades due to the multifarious impact of climate change and anthropogenic activities. Furthermore, saline intrusion is evident from ionic ratios and salinity content of groundwater [26].
2.2. Livelihood of Indian Sundarbans Region
Agriculture is the primary occupation of the inhabitants of Indian Sundarbans. Sánchez-Triana et al. (2014) [38] reported that among the total working population, 23.6% belongs to cultivators while 36.1% are agricultural laborers, summating around 60% of the total working population solely dependent on the agricultural sector. However, the indirect dependence on agriculture may well reach over 90%, which also supports the backbone of an agrarian economy. A large proportion of the inhabited area, measuring about 2648 sq. km, is dedicated to agriculture [39]. Due to inefficient irrigation amenities in non-monsoonal months, the mono-crop rainfed paddy (Aman rice) is cultivated during the rainy seasons (July–September). Farming sites are dominated in marginal areas. The second-largest occupation is fisheries and aquaculture [38]. Extensive traditional fishing is reported in Frazergunj, Sagar, Bakkhali, and Kalisthan [40]. Apart from these, rural livelihood is largely dependent on mangrove forest-derived products such as honey and timber. Eco-tourism is also promoted in Indian Sundarbans, which serves both remunerative and conservative purposes [41].
3. Required Dataset
Block-level census data (human) were obtained from the Office of the Registrar General and Census Commissioner, India, Ministry of Home Affairs, Government of India, Census Digital Library [42]. The livestock population was retrieved from the statistical handbook of South 24 Parganas under the Department of Planning and Statistics, Govt. of West Bengal [43]. The daily per capita groundwater (both from the deep aquifer for drinking purposes and shallow aquifers for household works) requirement was set at 40 L (14.5 cubic meters annually per capita) for humans, while it was kept at 10 L (5 cubic meters annually per capita) for livestock [44]. The groundwater level data were retrieved from the Central Groundwater Board Annual Report [45]. The agricultural statistics were extracted from the official website of the Directorate of Economics and Statistics under the supervision of the Department of Agriculture, Cooperation and Farmers Welfare [46]. The inland and marine fisheries data were retrieved from the Handbook of Fisheries Statistics (many editions) [47]. Another socio-economic parameter (literacy rate) was retrieved from census data and the Department of Planning and Statistics (Govt. of West Bengal) [42]. The entire dataset in the reference scenario is provided in Table 1.
4. Methodology and Model Set Up
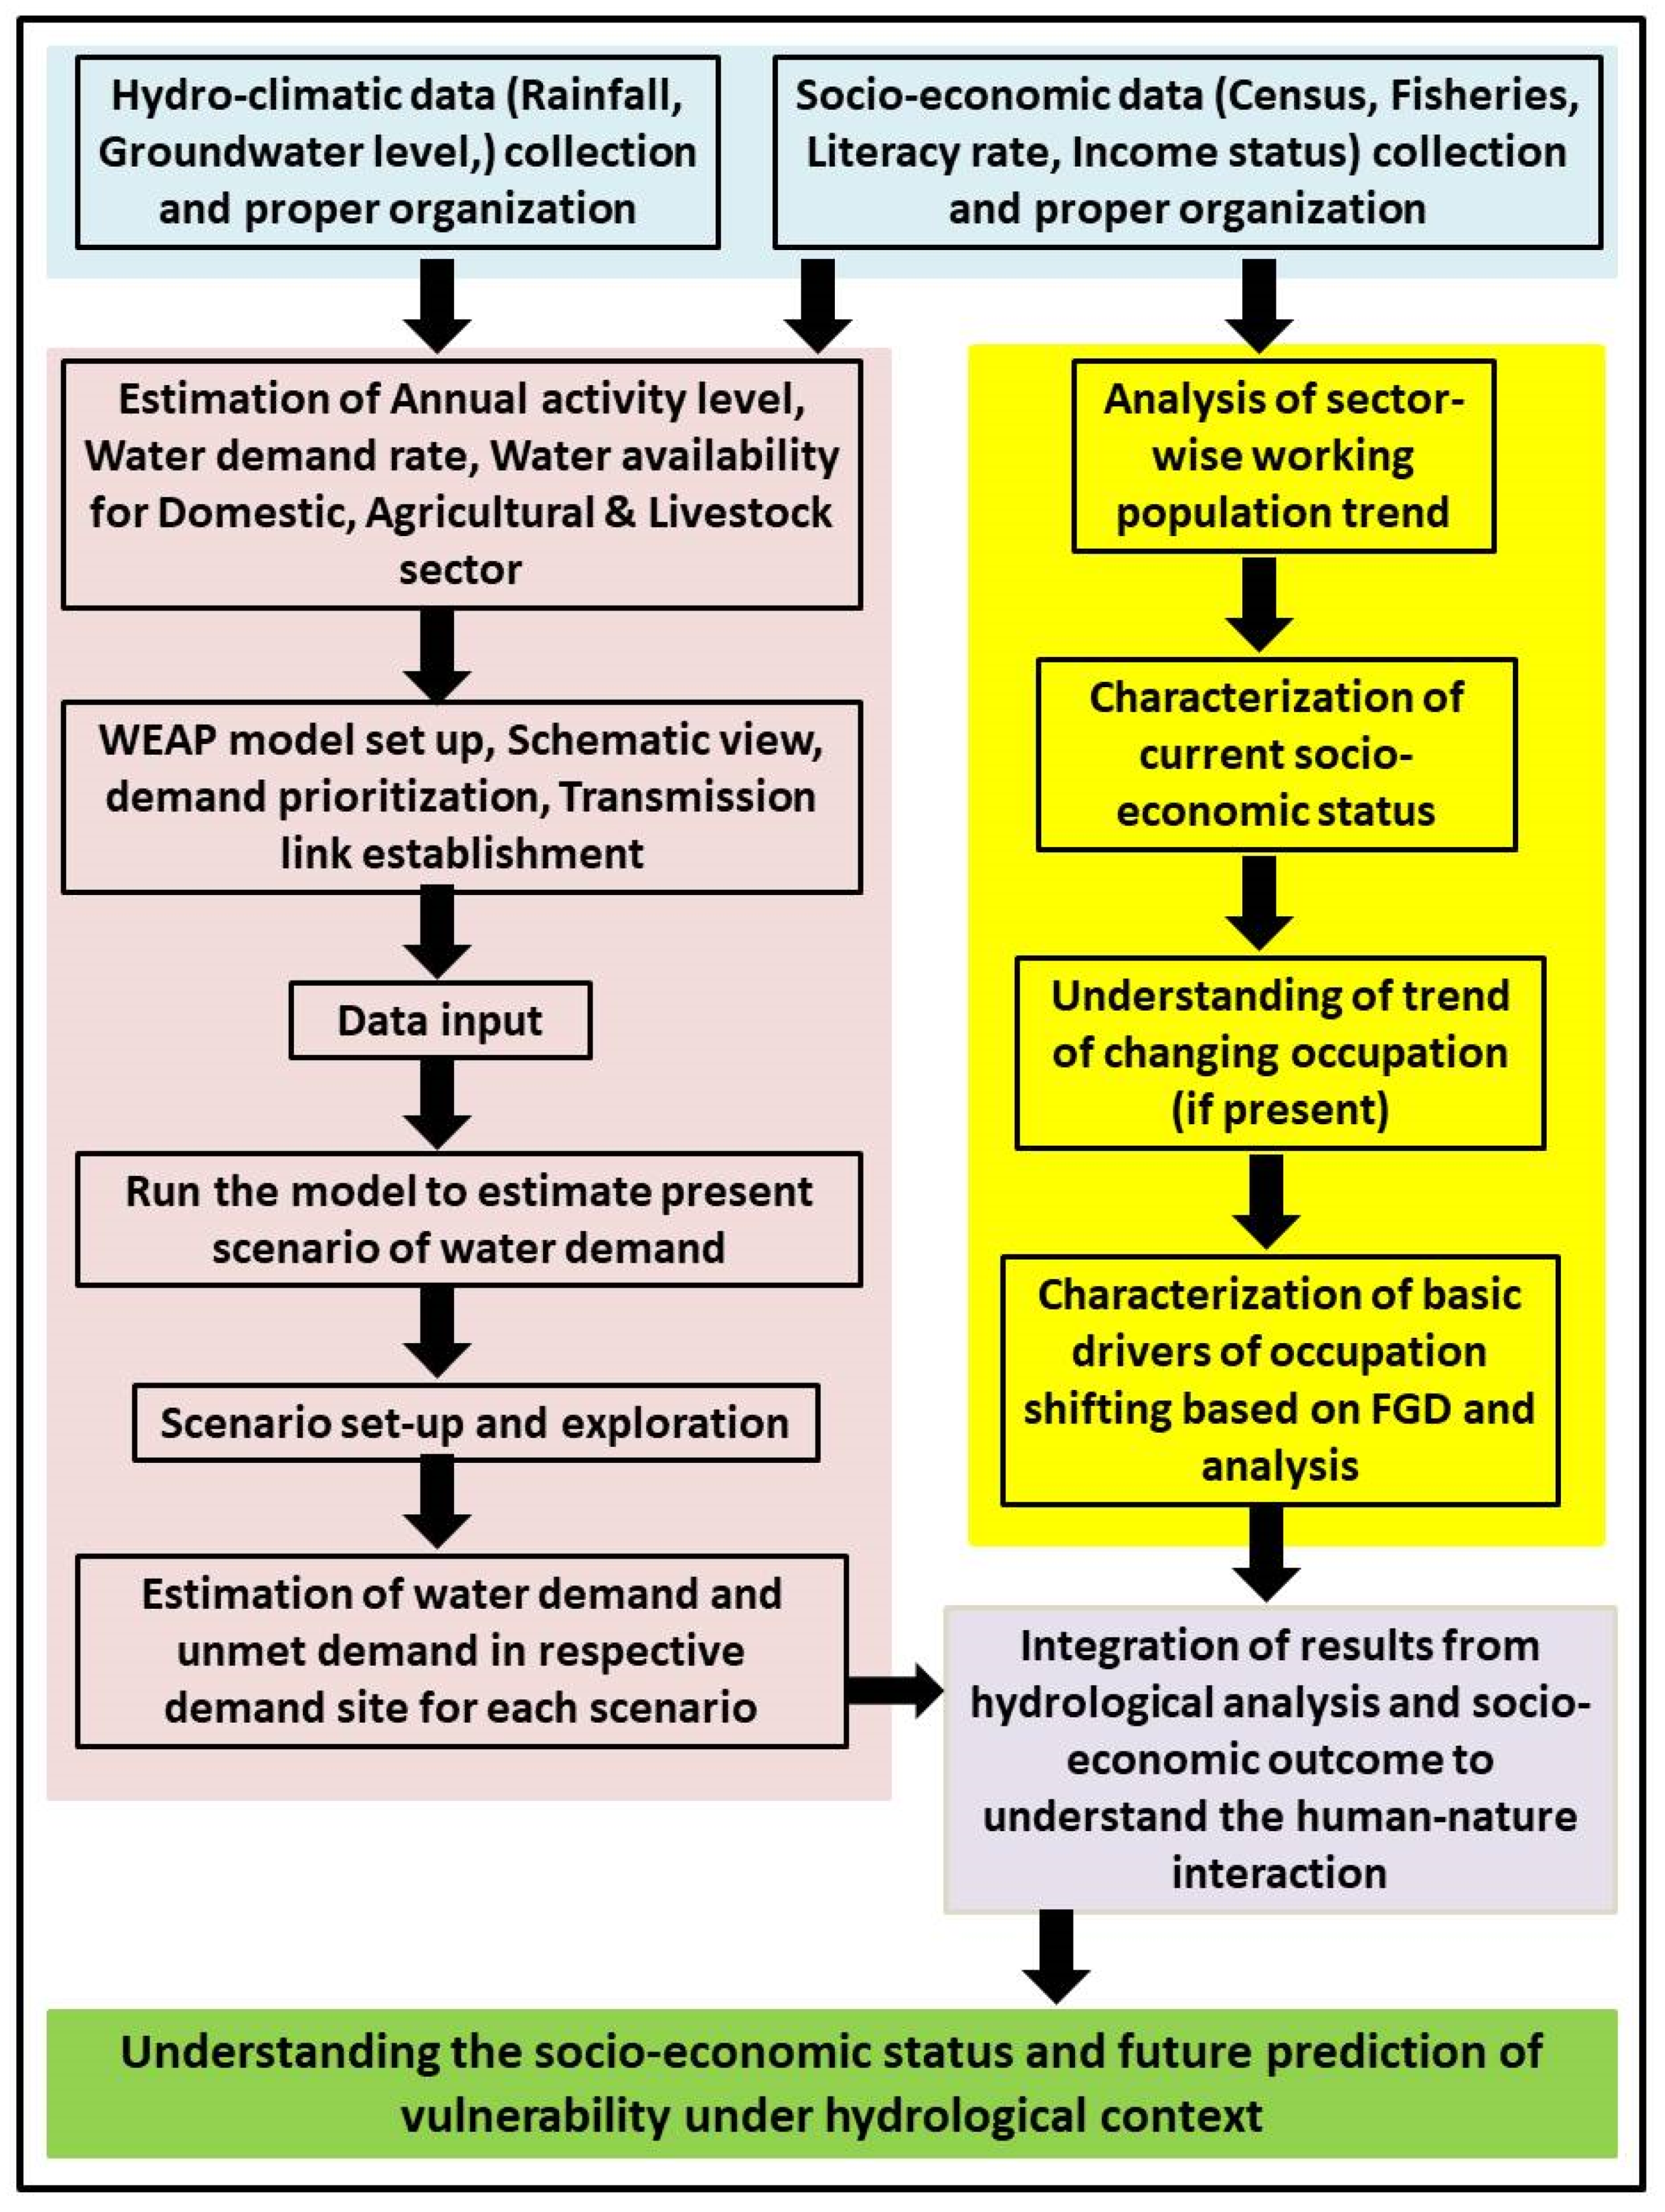
The WEAP model was applied in this study due to its robustness and utility based on data availability as it is useful in performing both aggregated and disaggregated forms of water management analysis in multiple sites [28]. To estimate the groundwater demand and unmet demand which indicates the water shortage, the study area (three zones comprising 13 blocks) was divided into three demand sectors: domestic, agriculture, and livestock. The primary intention was to incorporate the management problems regarding the availability, consumption, and conservation of water resources for comprehensive policy development. The WEAP model was used because it implements a coordinated approach to simulate the present and future scenarios with the consequent optimization of water resources, ultimately aligning them into policy construction [28,48,49]. The water resource system is represented by both hydrological and water quality modules within the WEAP model. Further, these modules can be represented by various elements such as administrative boundaries, river networks, groundwater, reservoir withdrawals, ecosystem requirements, wastewater treatment facilities, etc., depending on our research objectives [28]. The methodology flowchart is provided in Figure 2.
The year 2011 was considered as the base year. The simulation on the socio-economic scenario (e.g., human population growth, water consumption rate) continued until 2050, which was specified as the end year of modeling. Water quantity is calculated for each node and link on a regular (monthly or annually) interval in the selected system. The overall groundwater demand for domestic purposes is a function of human population size and the rate of utilization. Two fundamental parameters, annual activity level and annual water use rate, were defined for the demand sectors. The key assumptions made for these two parameters for the human population, agricultural status, and livestock population are given in Table 2.
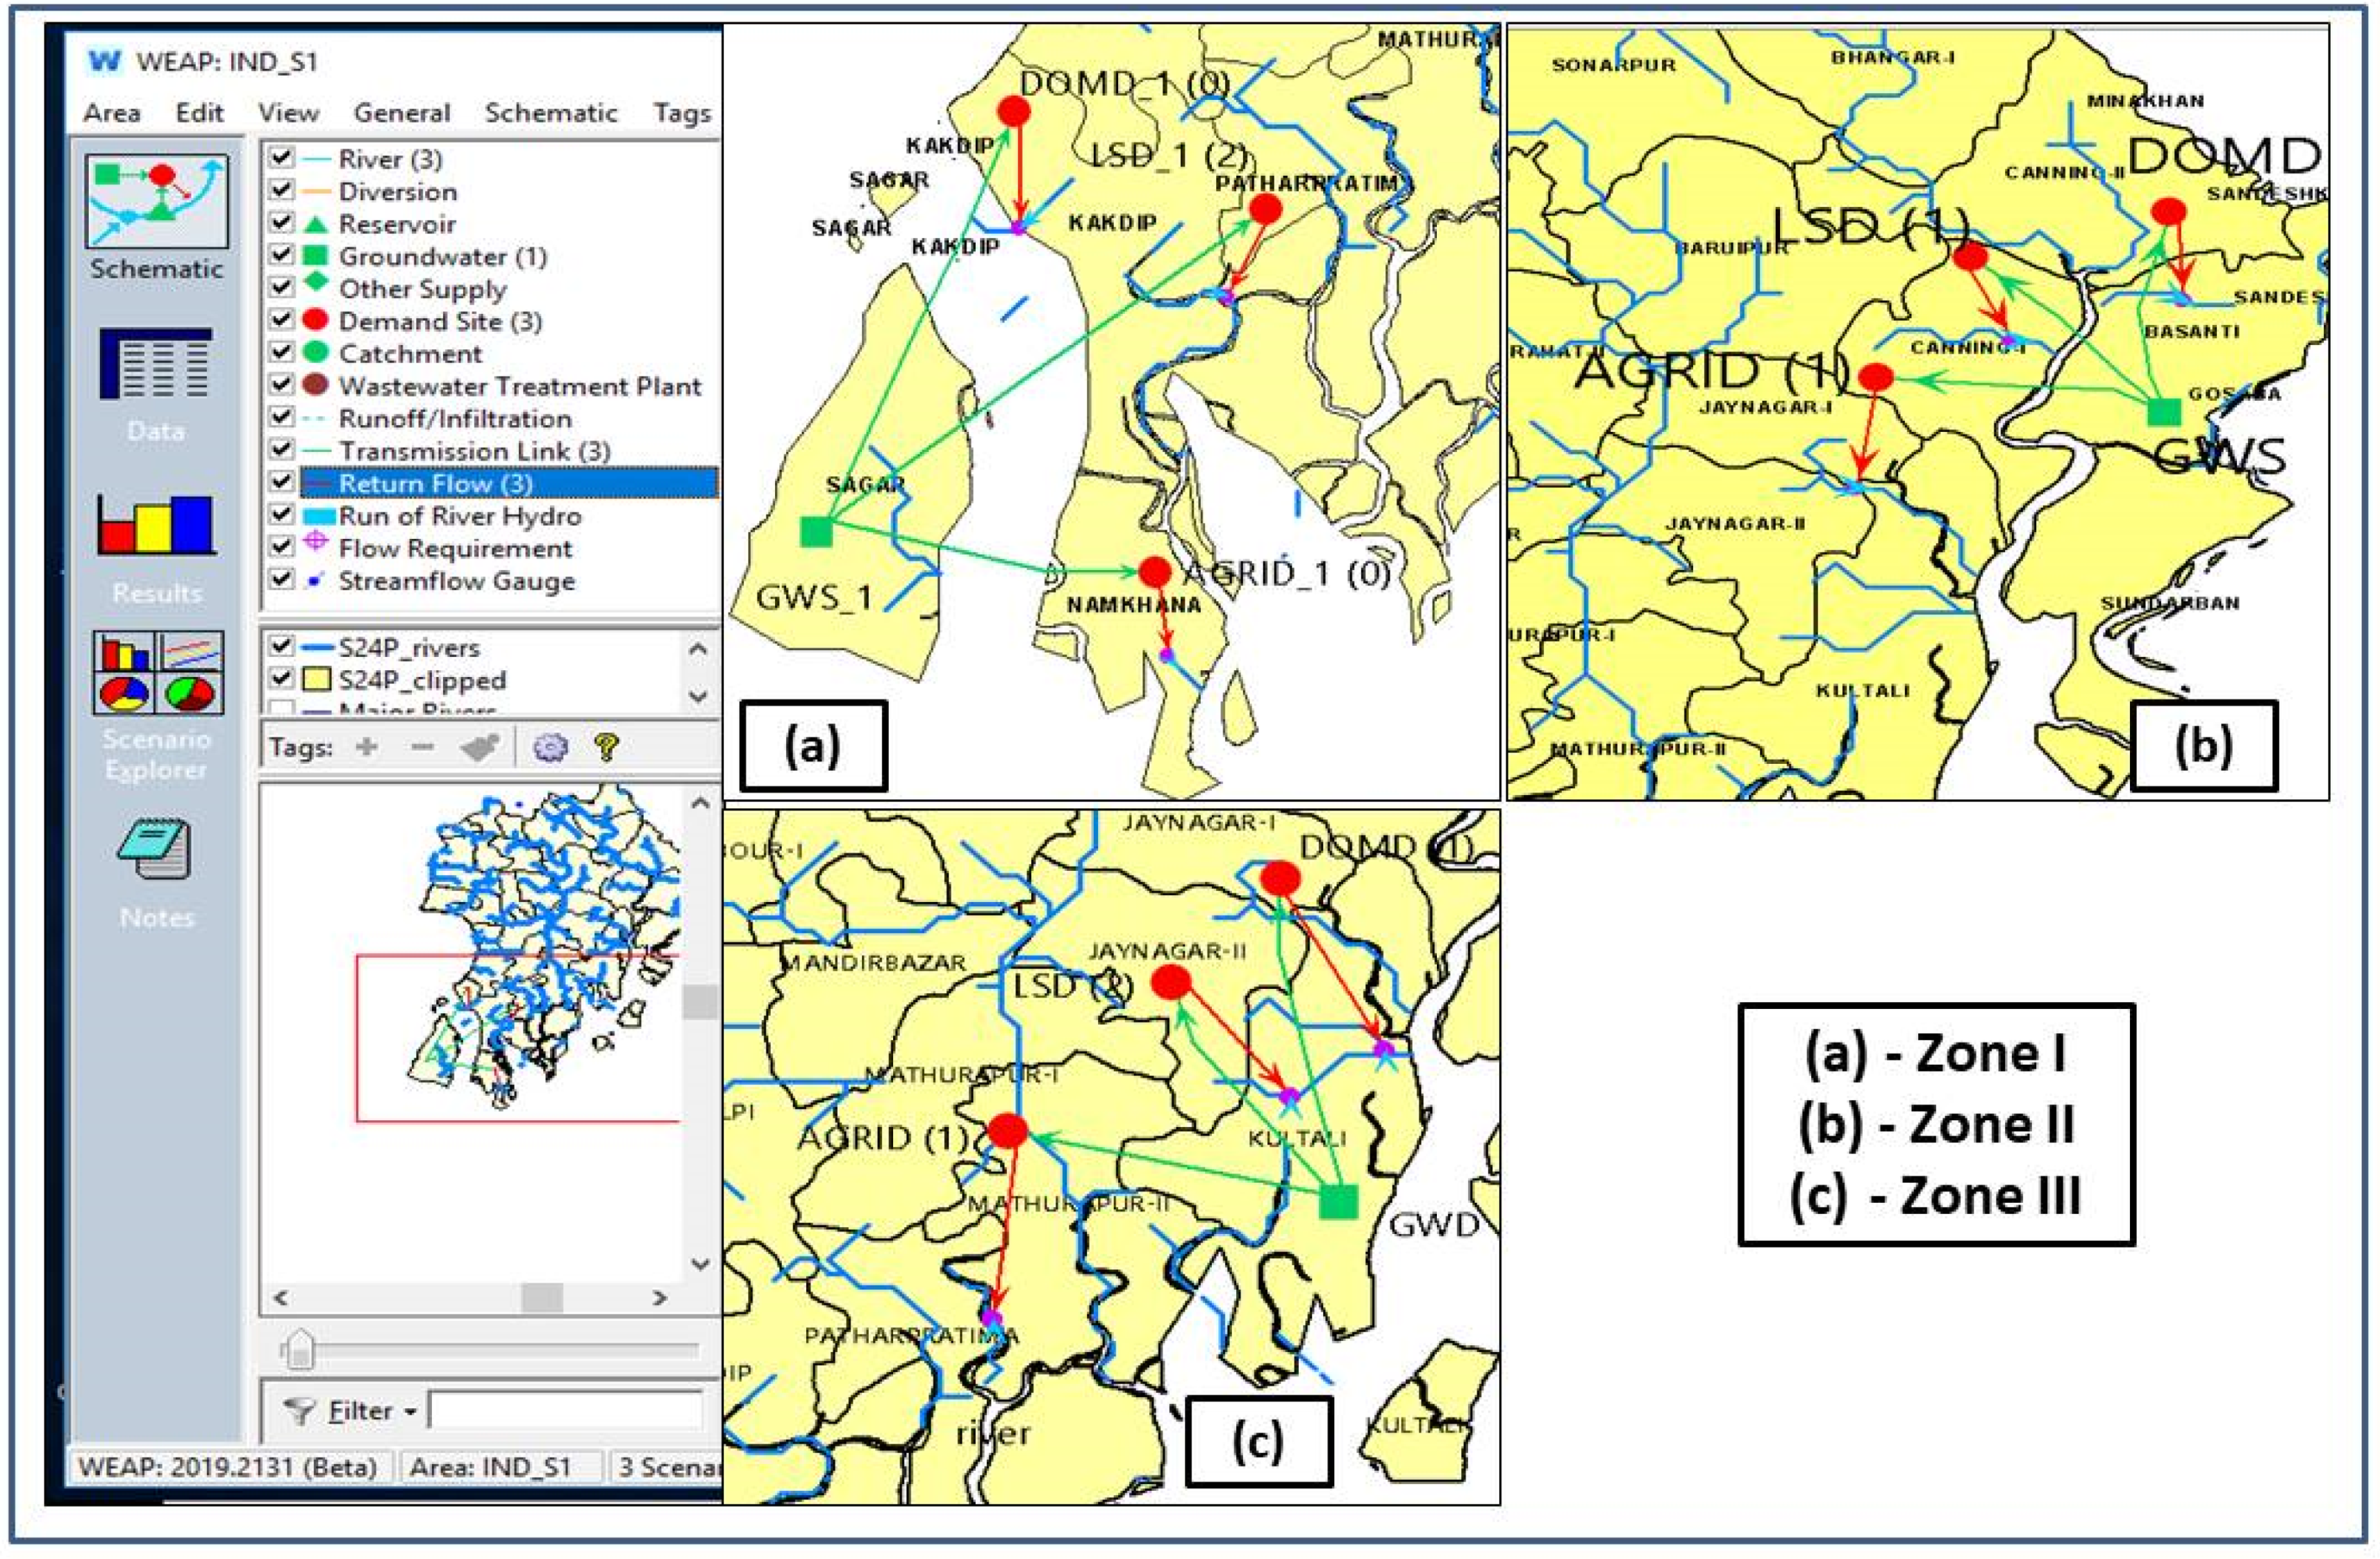
According to the specified demand priorities, WEAP allocates the available water to satisfy the different demand sites [27,28]. In this study, the domestic and agricultural demand sites are given a priority value of one as these are the major groundwater consuming sites, whereas livestock water demand is described with a priority value of two for lesser consumption. The description of the hydrological model setup is provided in Figure 3. The annual activity level for domestic, agriculture, and livestock defines the total human population, land irrigated by groundwater, and livestock population, respectively, in 2011 for three zones. The domestic groundwater utilization in the study area was determined by five Focused Group Discussions (FGD) involving cultivators conducted during February, 2020 in Zone I of the study area [50]. The consumption rate or the amount of groundwater that is not returned to the system is estimated as 25%, 80%, and 25% for the respective annual activity levels [44,51,52]. The human and livestock population were presumed to increase over the years (2011–2050). The annual rural population growth rate was estimated from the previous census data, which was 1.44%, 1.93%, and 1.73%, respectively, for Zone I, II, and III. For the simulations, a minimum growth rate of 1% and maximum rate of 2.5% were determined (according to various growth simulation model outputs reported in macrotrends [53] and several print media [54]). This was further confirmed by the rural population growth rate according to World Bank data [55]. The livestock population increase rate (1%) was retrieved from Vikashpedia [56].
The groundwater use rate for agricultural purposes was assumed to decrease due to certain improvements in technologies and adaptation measures. The rainwater harvesting potential for the Sundarbans region was already estimated by Bhadra et al. (2018) [35]. Along with these data, the seasonal effective agricultural land area was estimated (District statistical abstract, many editions); further groundwater requirement for these areas was calculated [57]. Additionally, the potentially stored rainwater amount was subtracted from the total water demand. It was estimated that technological improvements for agriculture as well as awareness among communities in the Sundarbans region might cause a decrement in groundwater demand by 0.2 cubic meters with an interval of 5 years. The agricultural land area was considered constant throughout the study period as only the impact of varying human growth rates on water demand was studied. The overall activity was multiplied by the rate of water use to calculate the water consumption. The activity level was adopted for socio-economic demand analysis. The annual water use rate defines the mean water consumption rate per unit of activity. The total groundwater demand was calculated by multiplying the activity level and the rate of water consumption. It is worth mentioning that the annual water use rate does not indicate the total amount used, rather this represents the average annual water consumption per unit of activity.
D = A × C
- where: D = Groundwater demand at each node;
- A = Activity level;
- C = Water consumption rate at each node.
The reference scenario is described as the ongoing status of the system without any futuristic strategy and policy management. This is also helpful in distinguishing the demand sites and where more focus is to be given [28,58]. Prior to the simulations, the demand priorities were defined to specify the importance of groundwater requirement in-demand sites and assure that demands are met properly [28,48]. Therefore, the three scenarios selected for this study are:
- (a)
- Higher human growth rate (2.5%), livestock growth rate 1%, and agricultural groundwater demand decrease by 0.2 cubic meters with an interval of 5 years.
- (b)
- Current growth rate of respective zones, livestock growth rate 1%, and agricultural groundwater demand decrease by 0.2 cubic meters with an interval of 5 years.
- (c)
- Lower human growth rate (1%), livestock growth rate 1%, and agricultural groundwater demand decrease by 0.2 cubic meters with an interval of 5 years.
5. Results
5.1. Decadal Trend of Census Data
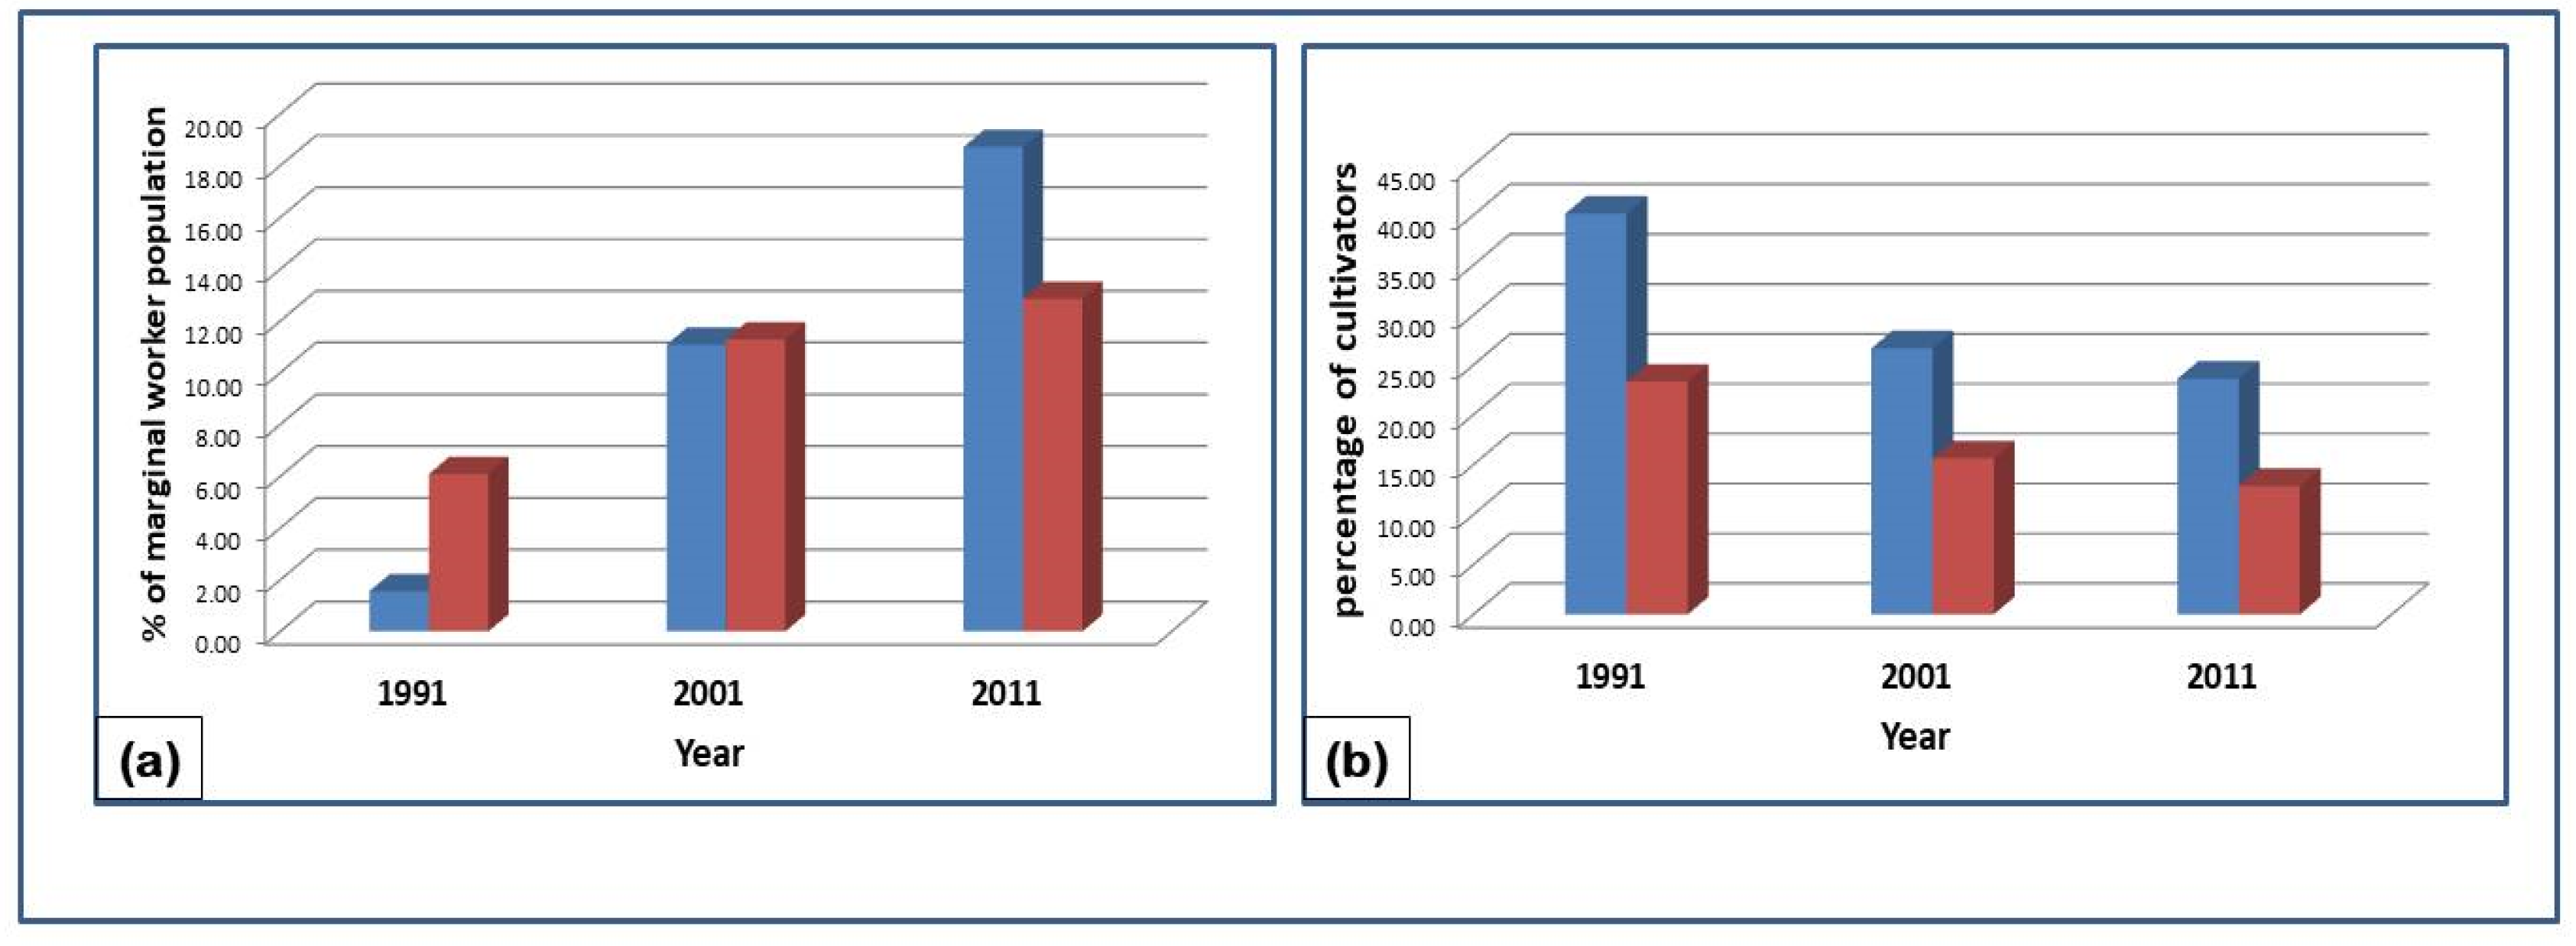
According to the Indian Census, the working population is divided into two major groups, viz, main workers, who work a substantial portion (more than 180 days) of any year, and marginal workers, who work less than 180 days in a year. Furthermore, the main worker population is divided into four classes, namely, agricultural cultivators, agricultural laborers, household industry workers, and other workers (Indian Census, 2011). For simplicity, cultivators and agricultural laborers are considered as one group “Agriculture-dependent population”. Block-wise census data for two decades (1991–2011) show a hike in marginal worker percentage compared to main workers. A steady decline in the total main worker population (26.09% in 1991 and 22.9% in 2011) was observed in the study area. The male main worker population in the study area has decreased from 47.63% to 34.85% during 1991–2011, while the opposite trend was observed for the female main worker population with an increasing trend (2.76% in 1991 and 5.44% in 2011 of total population). The male marginal worker population in the study area has increased from 1.56% to 18.72% during 1991–2011. A similar trend was observed for the female marginal worker population, which has shown an increasing pattern (6.09% in 1991 and 12.85% in 2011) (Figure 4a). These data are also significant as men are drifting away from main to marginal status due to mass outward migration of male workers to urban areas as well as different states or even overseas. Furthermore, the non-agriculture occupation is becoming an important sector to absorb the increasing labor force.
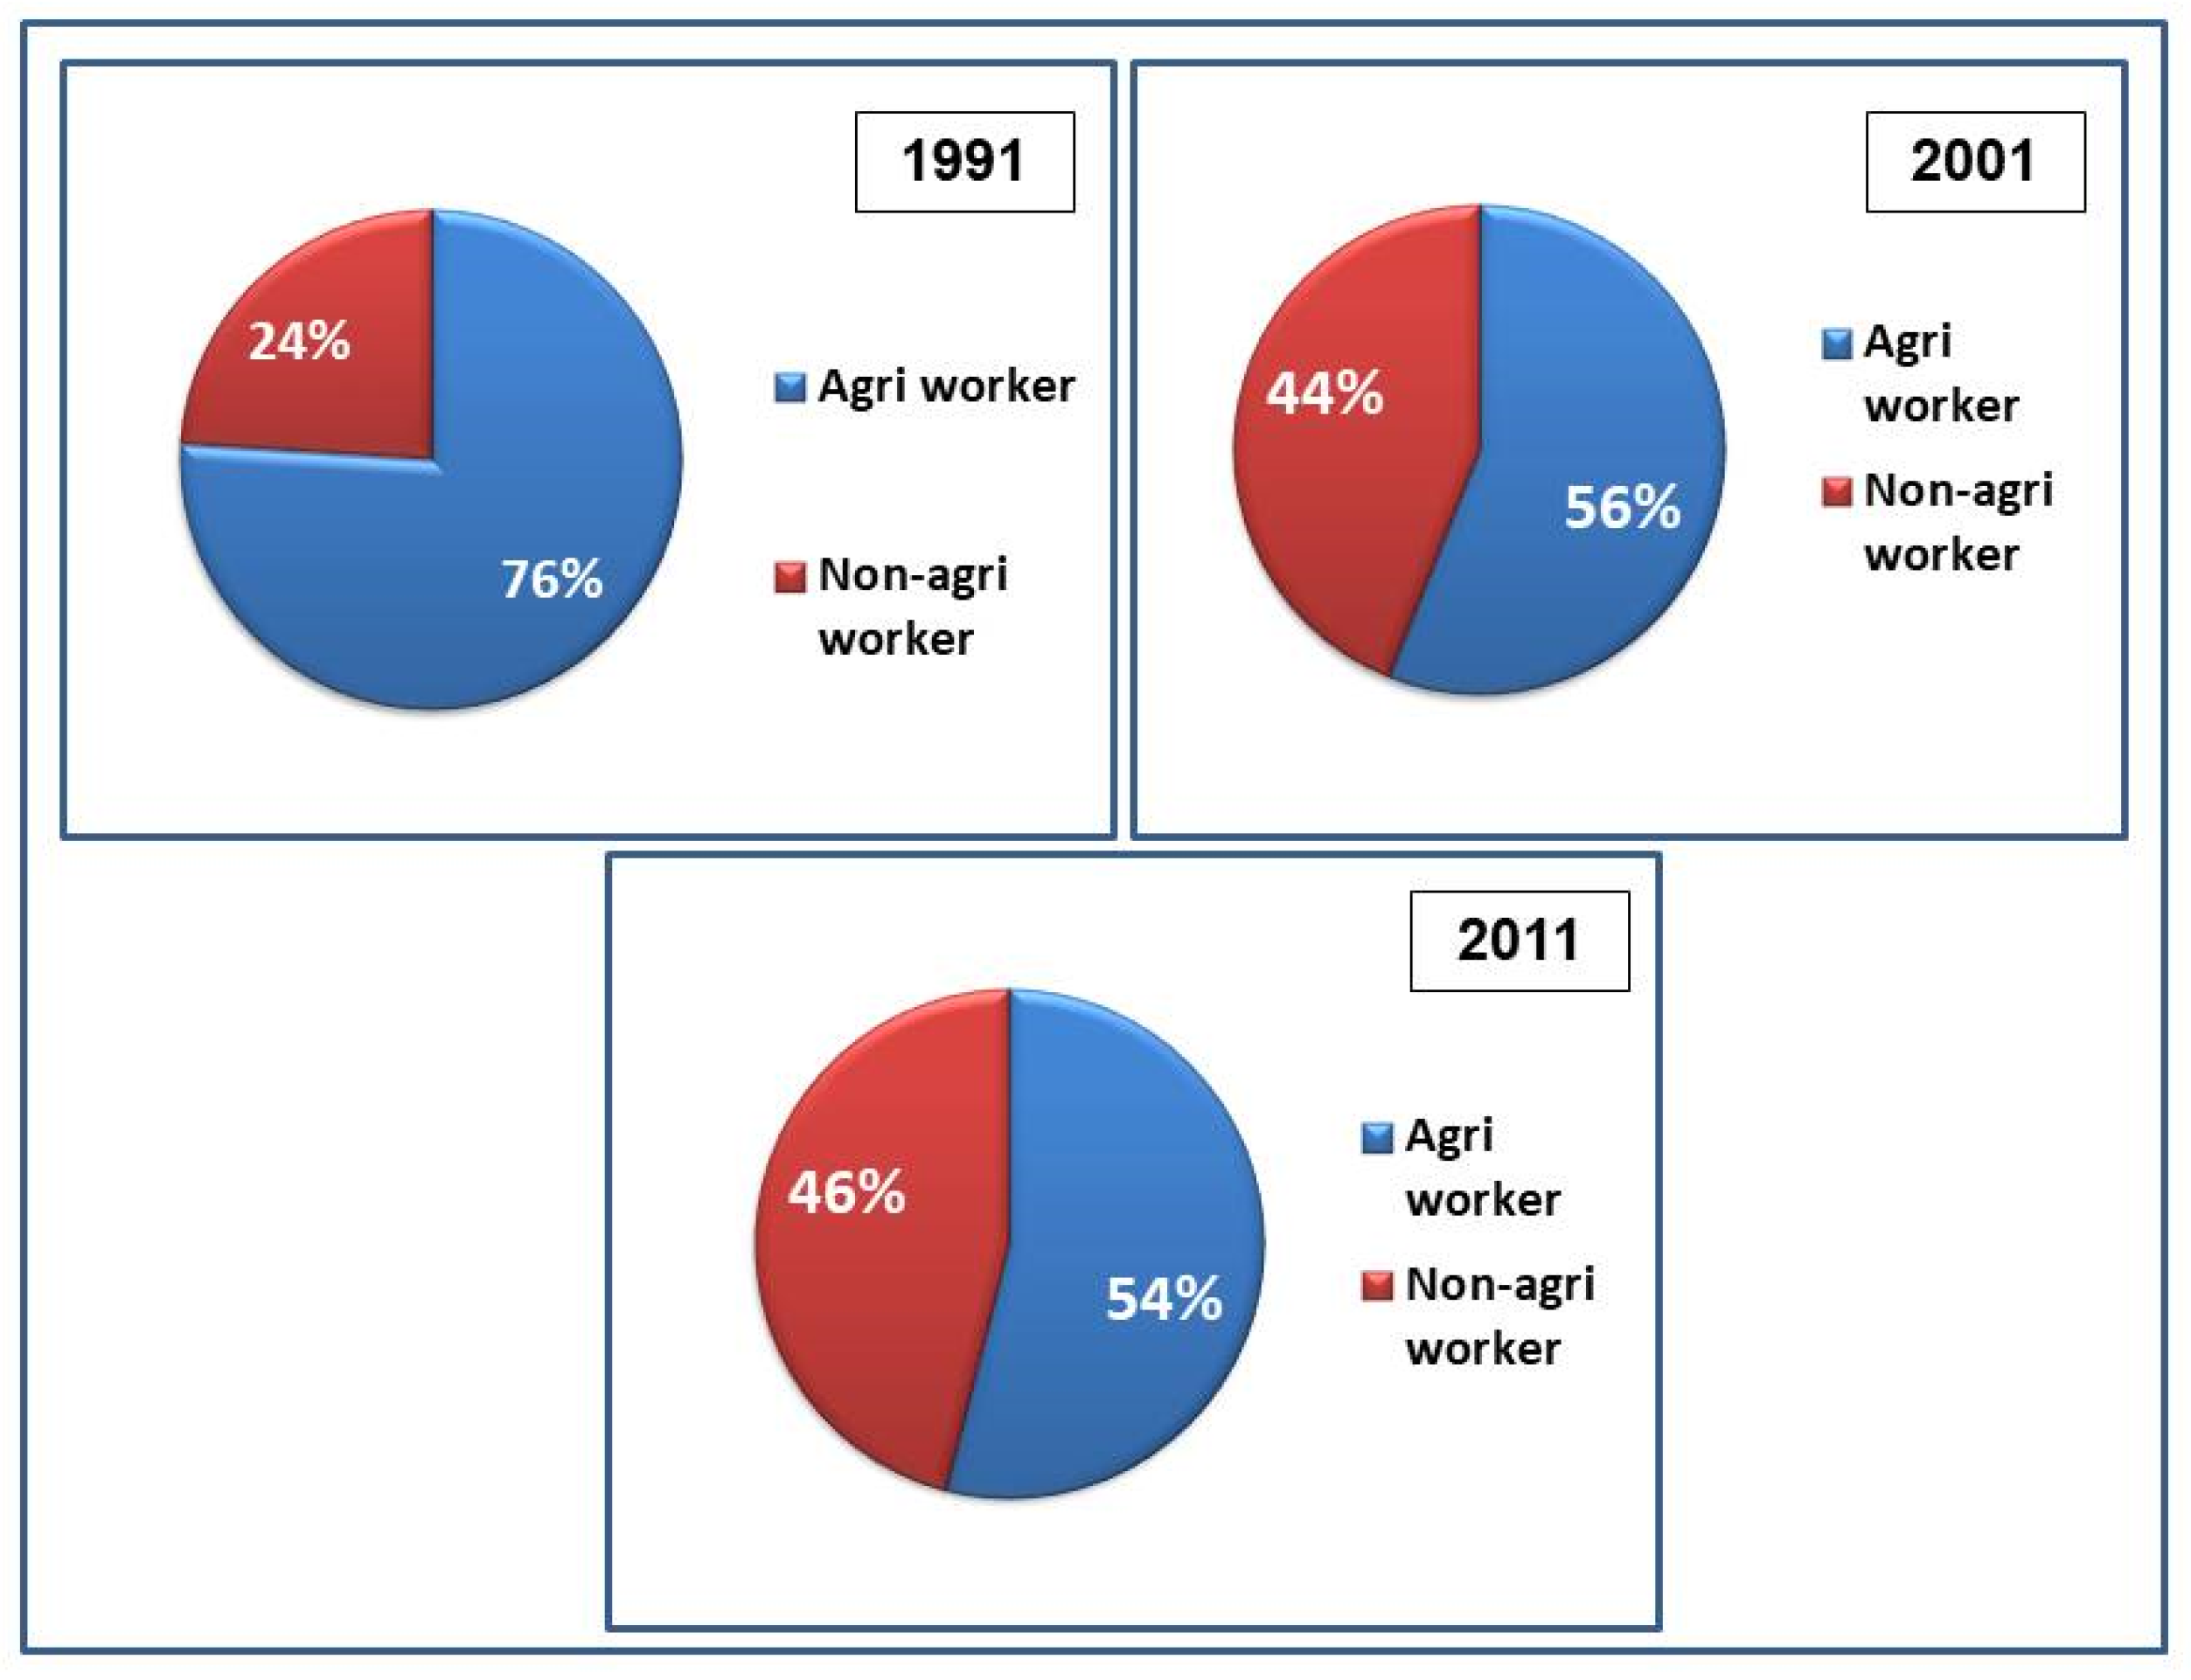
The occupation preference of the total workforce is still inclined towards agriculture in the study area as 54% of workers are strongly dependent on it according to 2011 census reports. Another noteworthy observation is that the percentage of self-cultivators is declining sharply (39.61% in 1991 and 22.22% in 2011) along with a steady decrease in agriculture laborers (35.44% in 1991 and 32.34% in 2011) (Figure 4b). Since 1991, increasing participation (around 24% in 1991 to 46% in 2011) in the non-agricultural sector has been observed. Nevertheless, this high growth rate in non-agriculture has decelerated, and during the recent decade (2001–2011), the shift was recorded to be 2%, while the shift in the past decade (1991–2001) was 20%. As a result, the considerable change in the structure of the workforce towards non-agriculture observed in the 1990s was reduced in the 2000s. This is in contrast to the growth of GDP in India in its non-agriculture sector that had registered its highest ever during 2001–2011. This indicates a glitch in the structural change of the workforce.
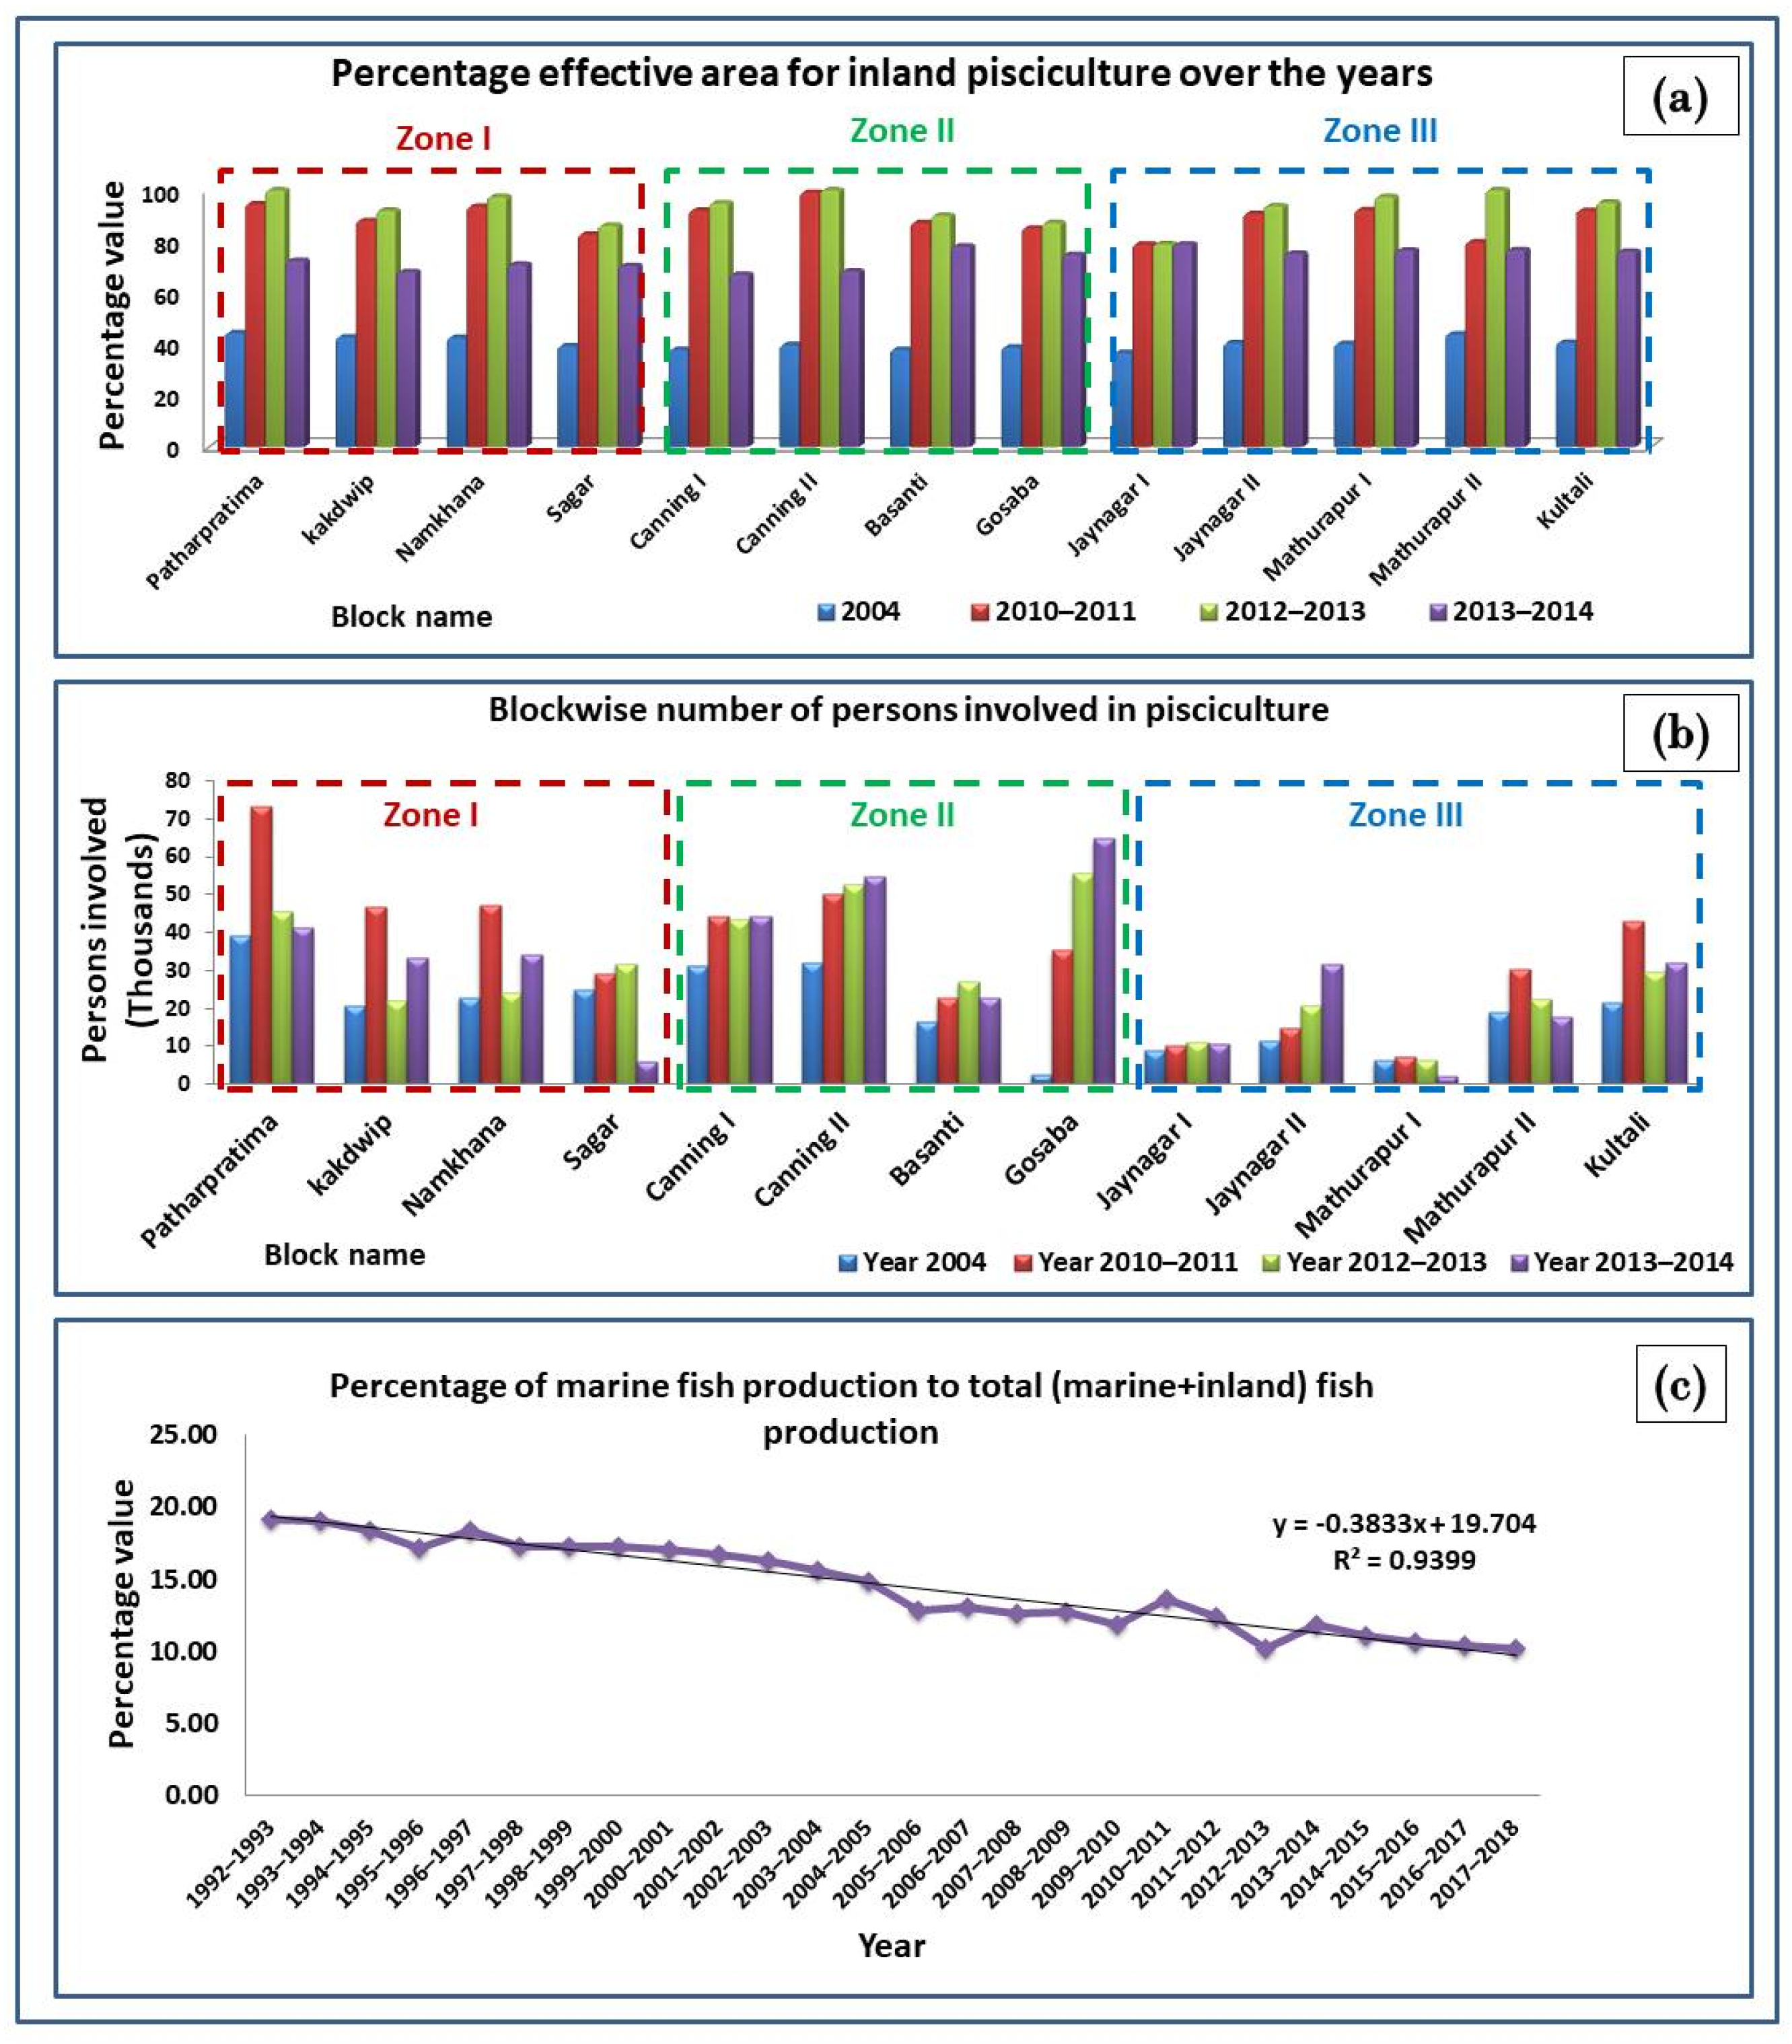
Moreover, the study area is famous for its inland and marine fishery products [40]. Extensive inland fishing is reported in all the blocks of the study area (Figure 5a,b). The fisheries data from 1992 to 2018 have shown that there is an observable decrease in marine fish production [47]. Although various new techniques are available for marine fish capture nowadays, increased cyclones, death rates, and other associated geopolitical complications have forced the marine fishermen to shift into inland fisheries or any other occupation. Subsequently, the total marine fish production has decreased steadily from 20% to 10% over the above-mentioned period (Figure 5c).
5.2. Water Demand Derived from WEAP
5.2.1. Domestic Groundwater Demand
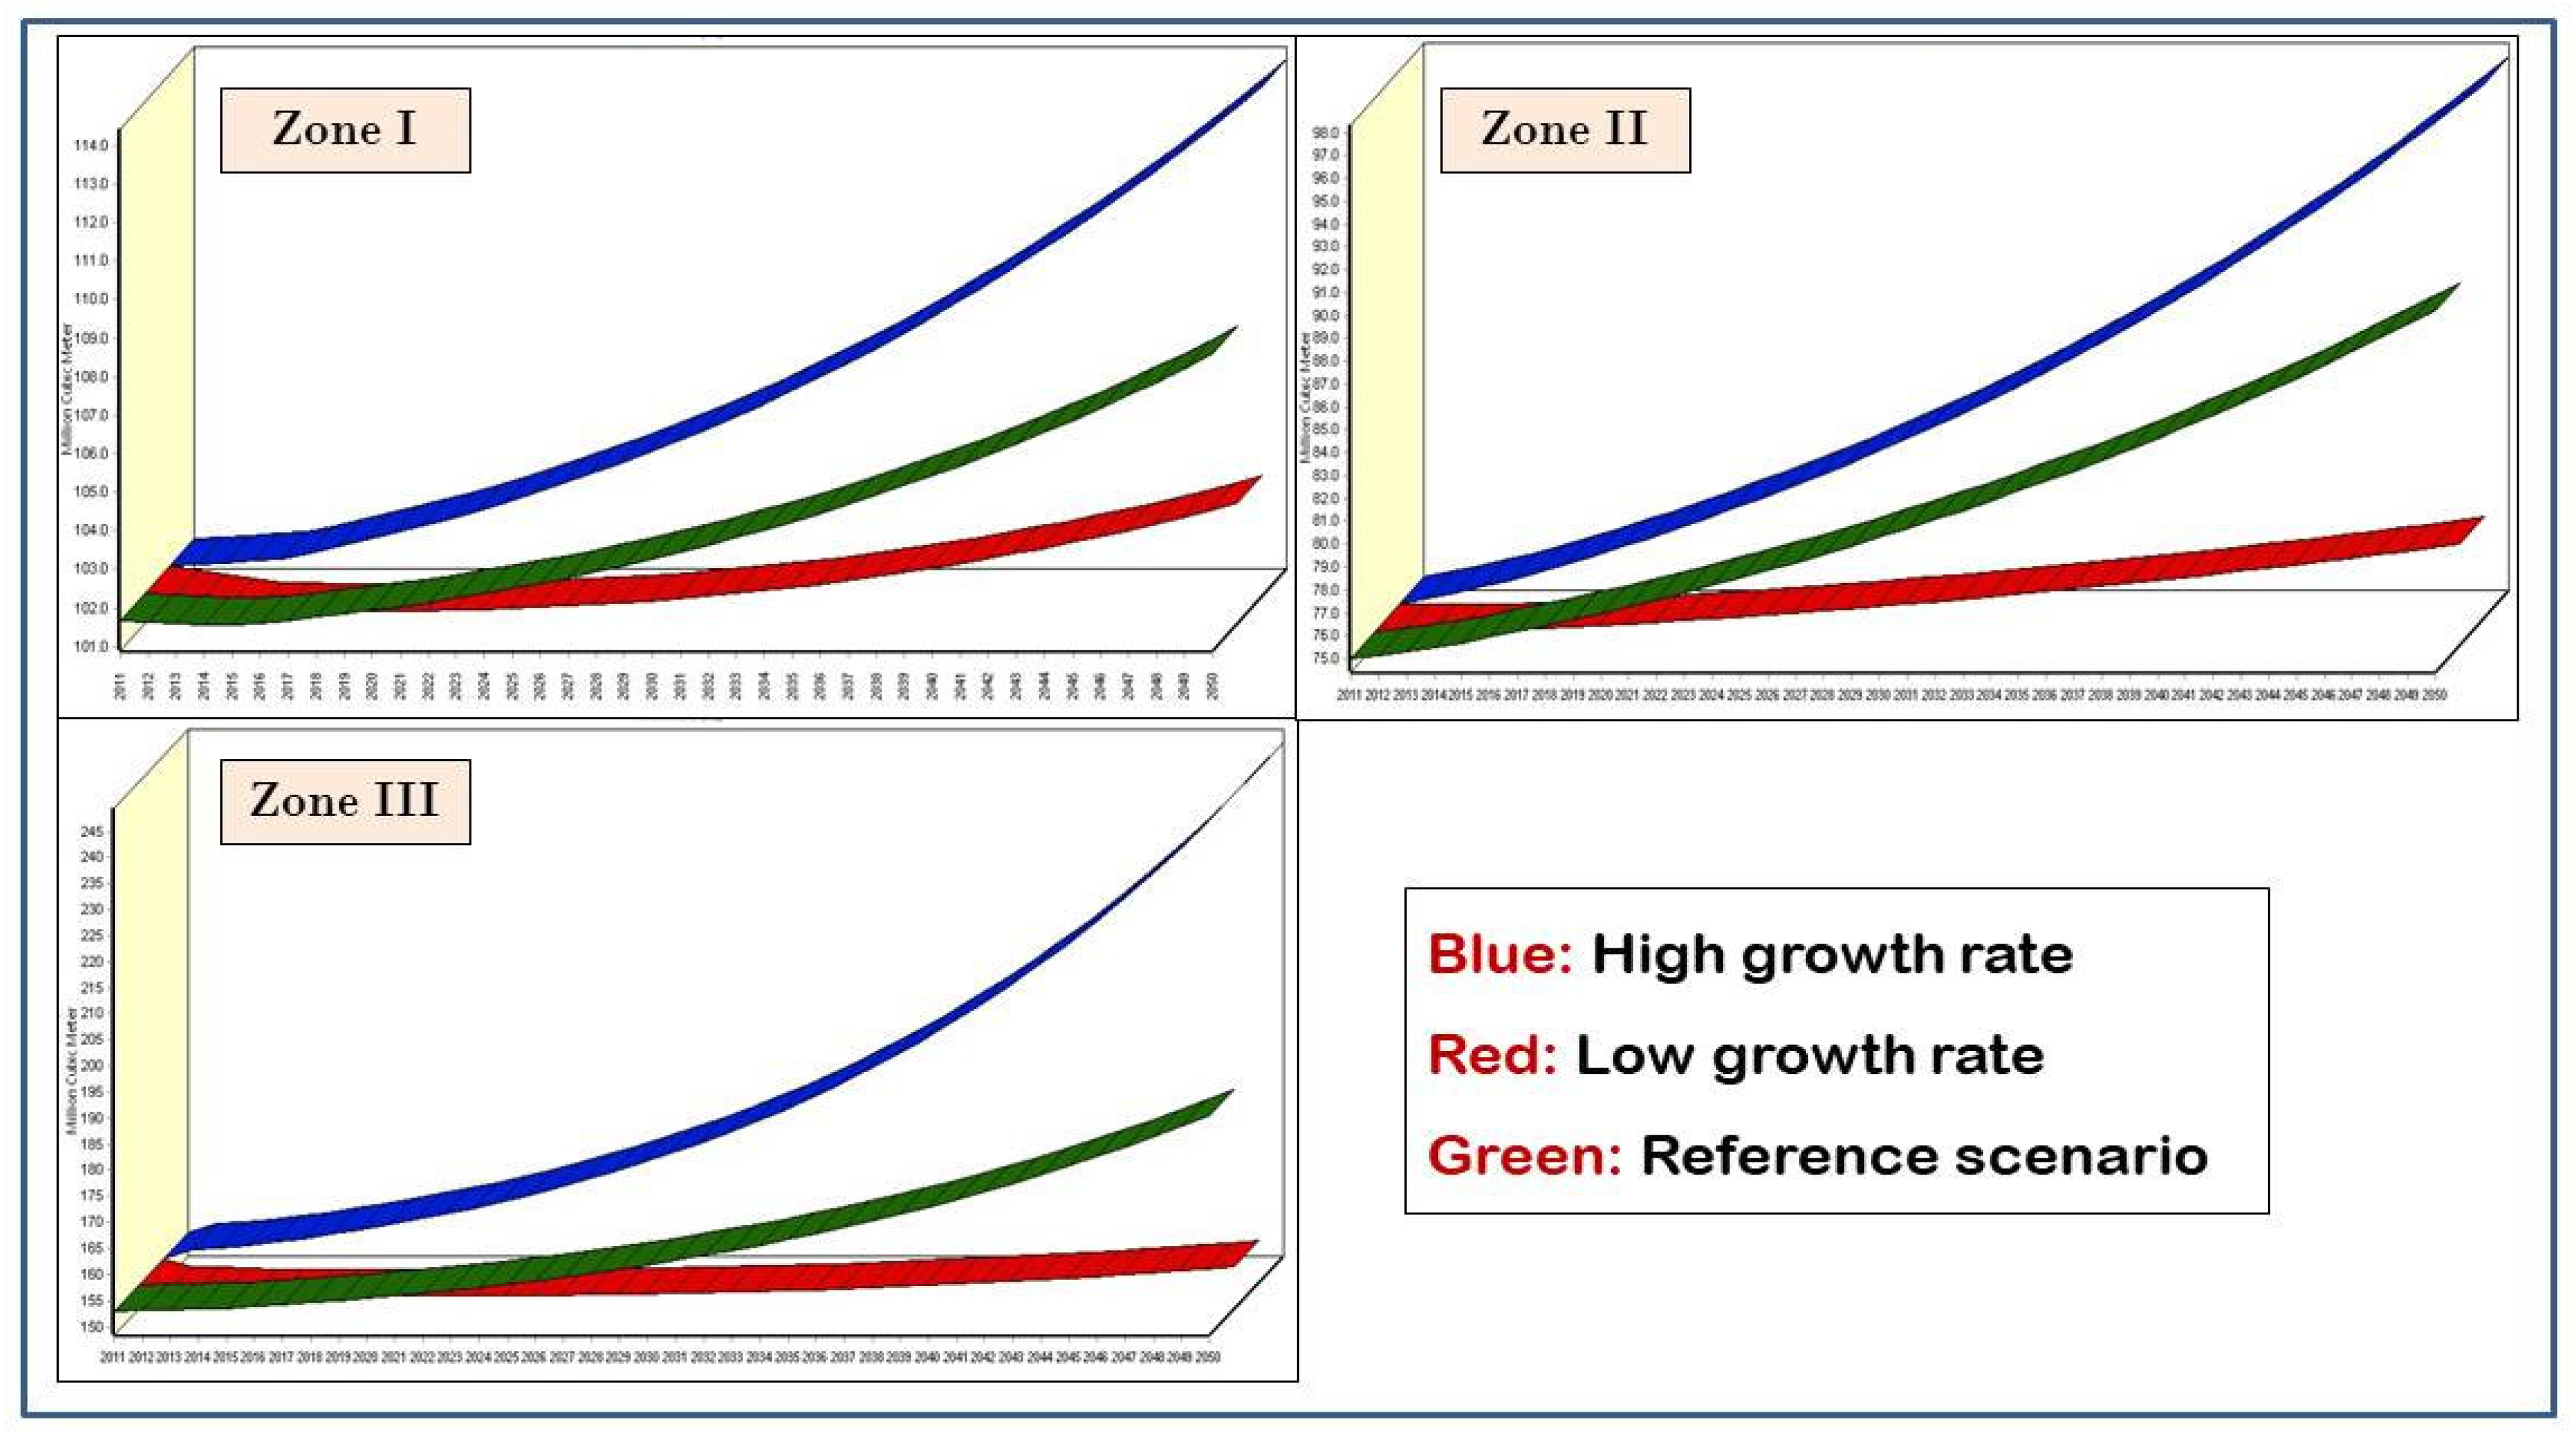
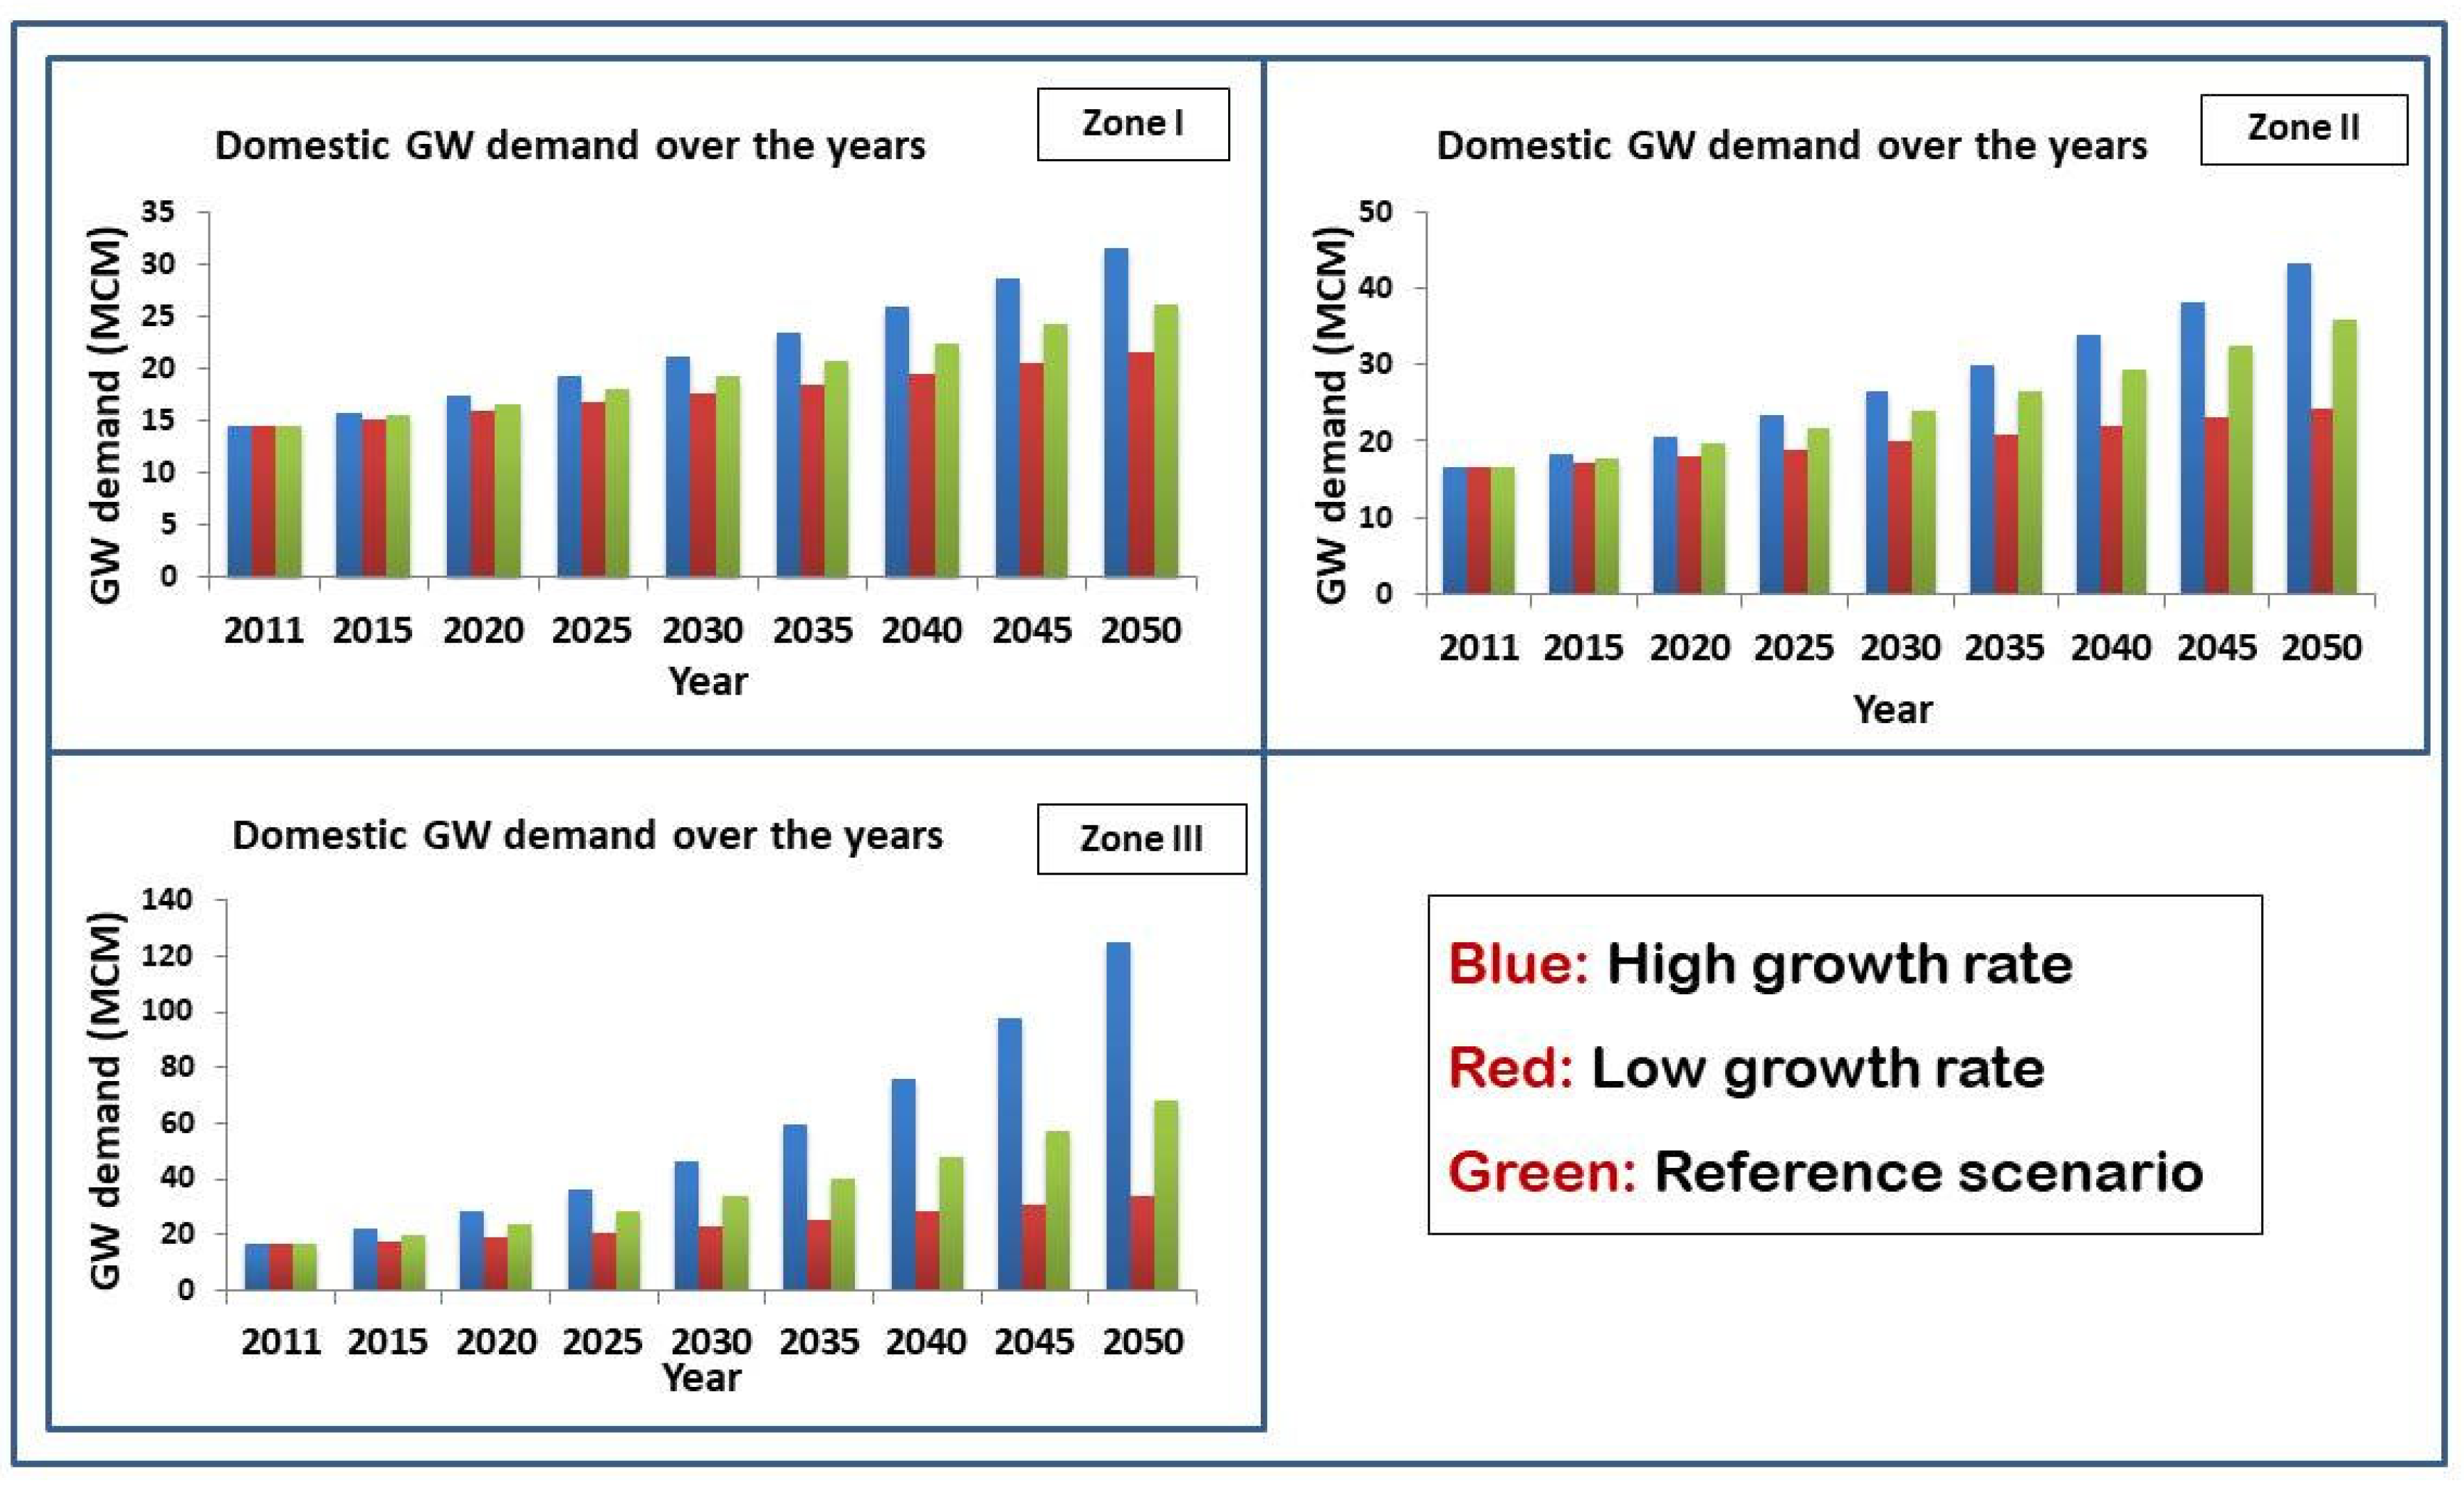
The total groundwater demand under different scenarios is shown in Figure 6. The domestic water demand for humans is expected to increase with population growth as groundwater demand for domestic purposes is a function of human population size and the rate of utilization. The water requirement under three scenarios for three zones is shown in Figure 7. According to the reference scenario, the domestic groundwater demand (annually) at the start of modeling (2011) was estimated as 14.62, 16.54 and 16.82 million cubic meters (mcm) for class I, II and III, respectively. According to the current growth rate in respective areas, the water demand for the domestic purpose for those respective zones is calculated as 26.13, 35.80, and 68.24 cubic meters in 2050. When the scenarios are considered, at a higher population growth rate (2.5%), the groundwater demand in 2050 showed an expected hike up to 31.65, 43.32, and 124.72 cubic meters in respective zones. At a lower growth rate (1%), the water demand decreased to 21.55, 24.38, and 34.08 mcm in respective areas in 2050. The higher domestic groundwater demand in Zone III is due to more population than the other two zones. The sector-wise groundwater demand is provided in Table 3.
5.2.2. Agricultural Groundwater Demand
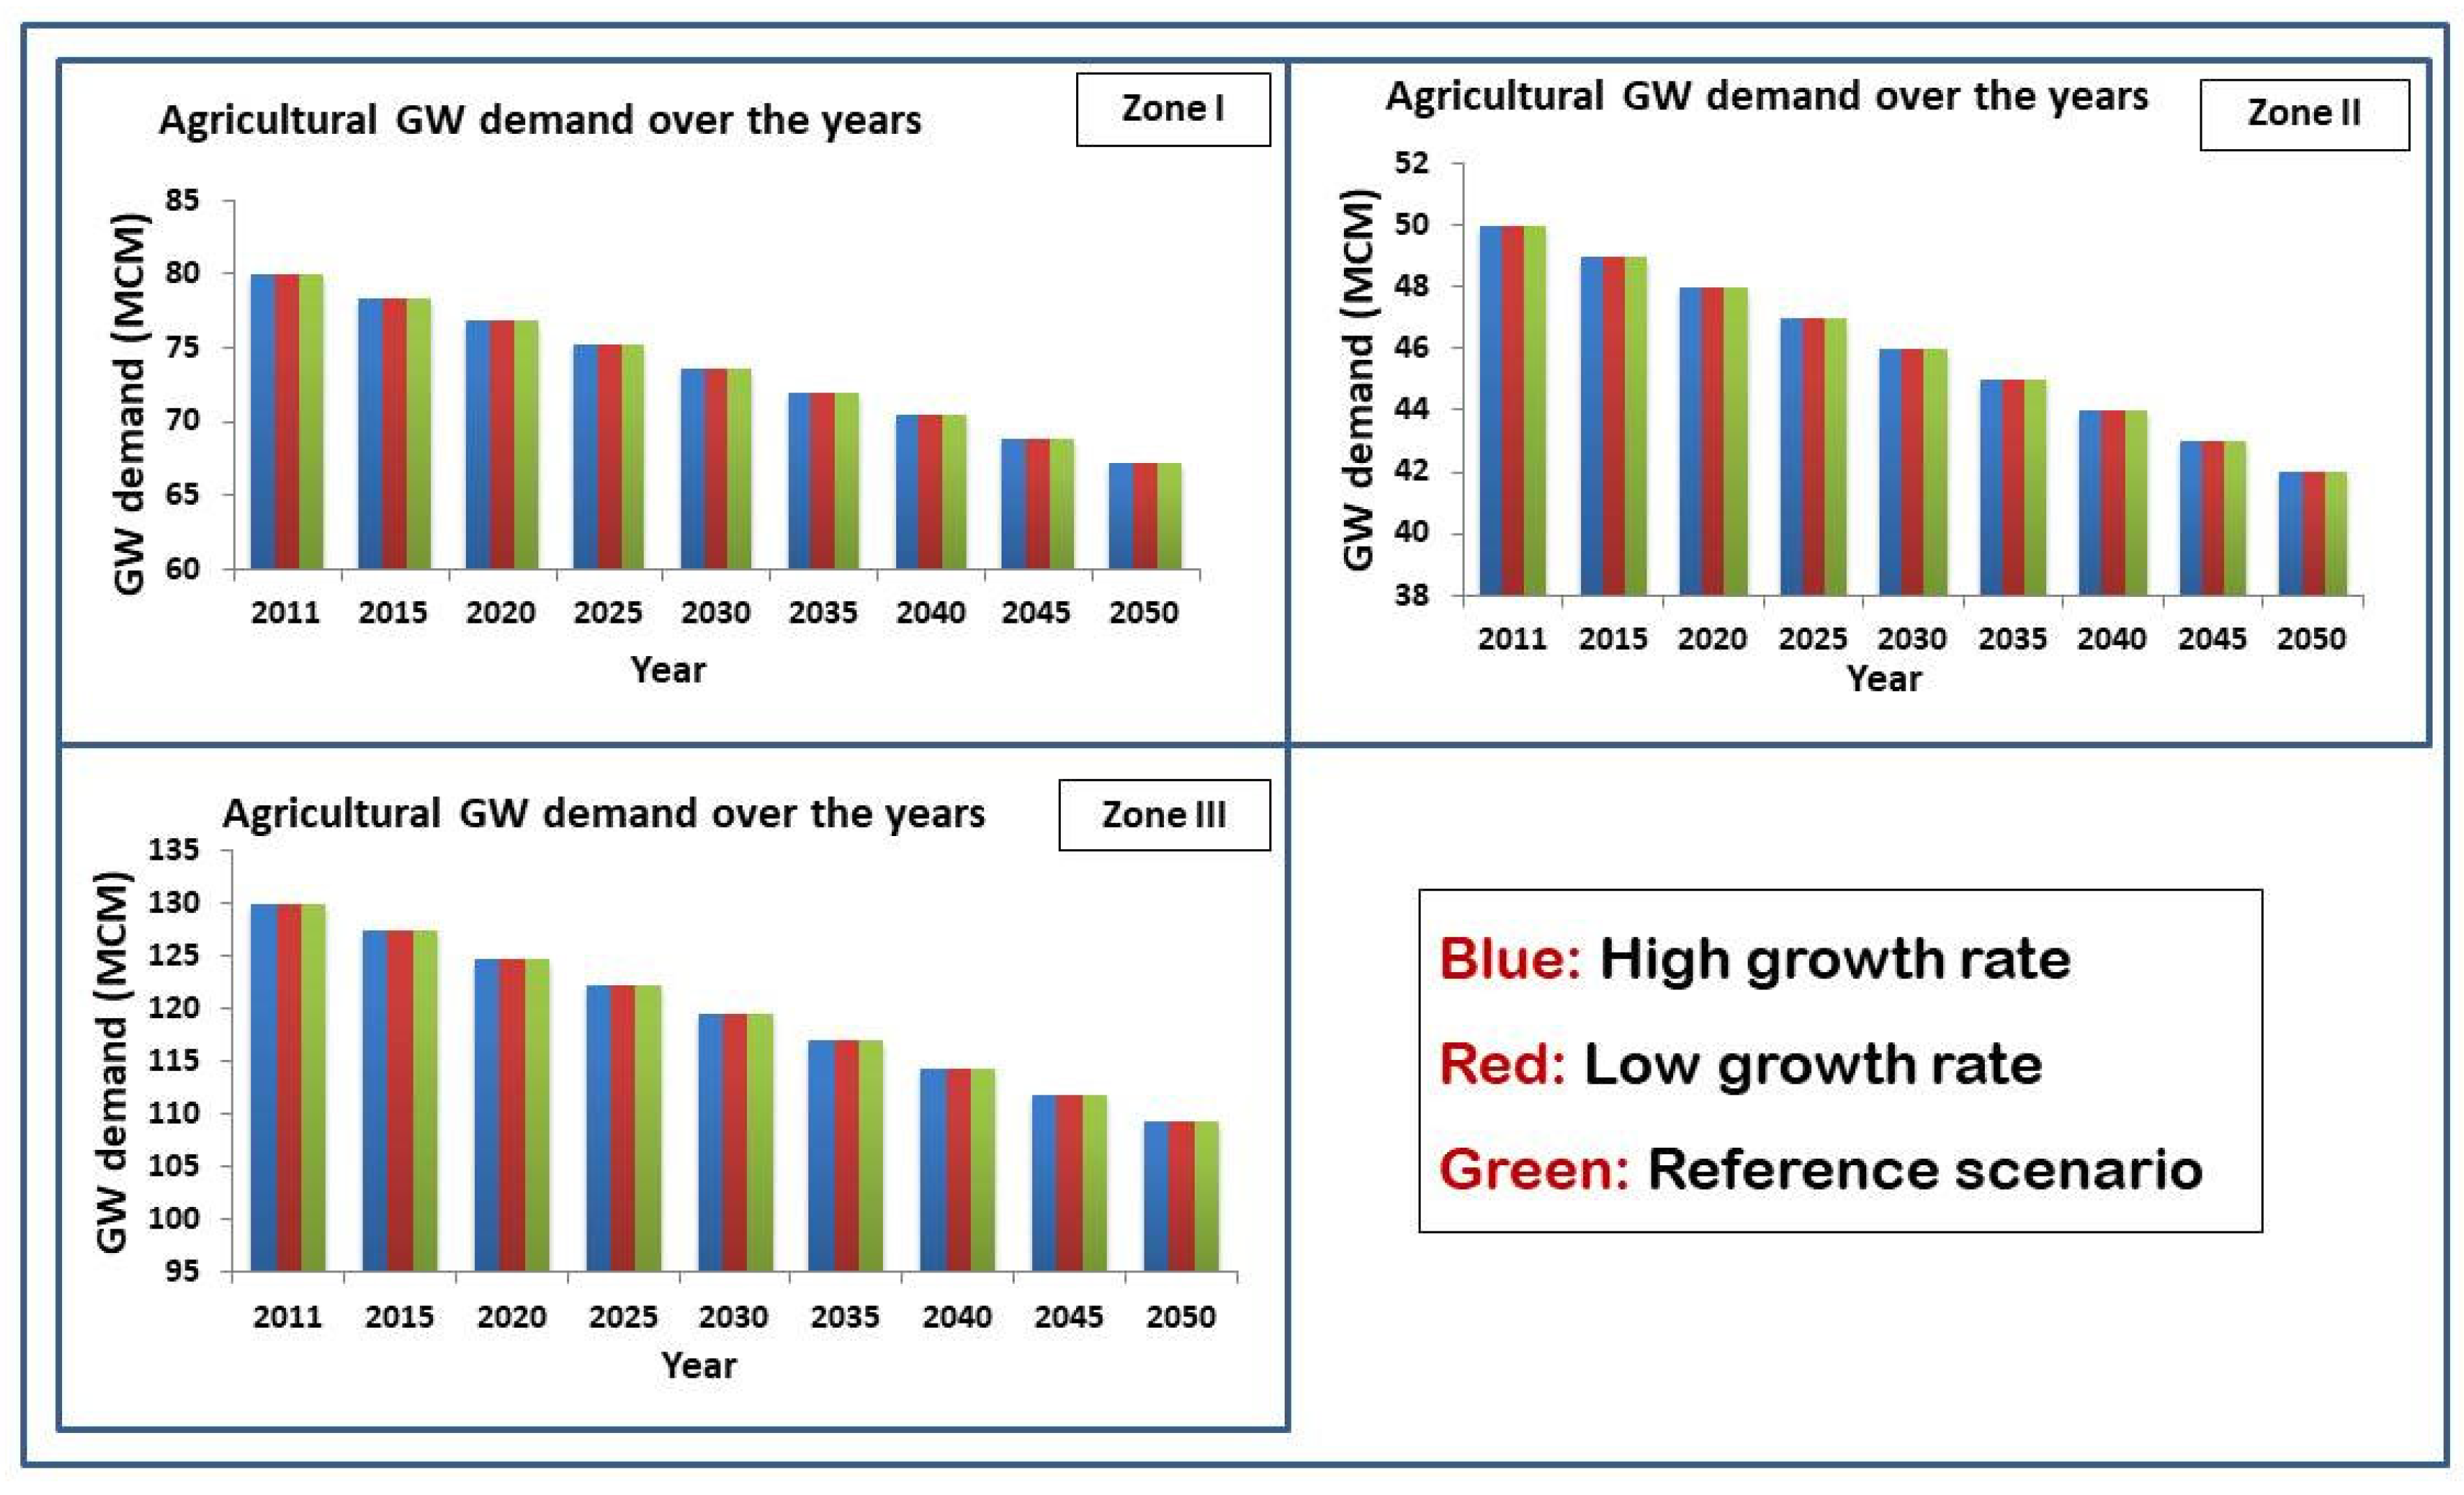
Sundarbans, a prominent agro-economic region, contributes over 60% of the district’s (South 24 Parganas) annual rice production (calculated from district statistical abstract). Due to the non-availability of data for areas irrigated by groundwater only, the total canal irrigated area was subtracted from the total agricultural area for respective zones. The study on future trends in groundwater abstraction for irrigation aims to understand the relationship between evolving agricultural demand and the consequent groundwater withdrawal rate. The groundwater demand for respective zones in the base year (2011) was 80, 50 and 120.6 mcm. It was considered that the water consumption per hectare would decrease yearly due to technological improvements (e.g., rainwater harvesting and artificial groundwater recharge) and irrigational efficiency. Based on this scenario, the rate of groundwater use was estimated to decrease by 0.2 cubic meters every 5 years. With this assumption, the groundwater demand is likely to decline up to 67.2, 42, 109.2 mcm in 2050 for the respective zones (Figure 8).
5.2.3. Livestock Groundwater Demand
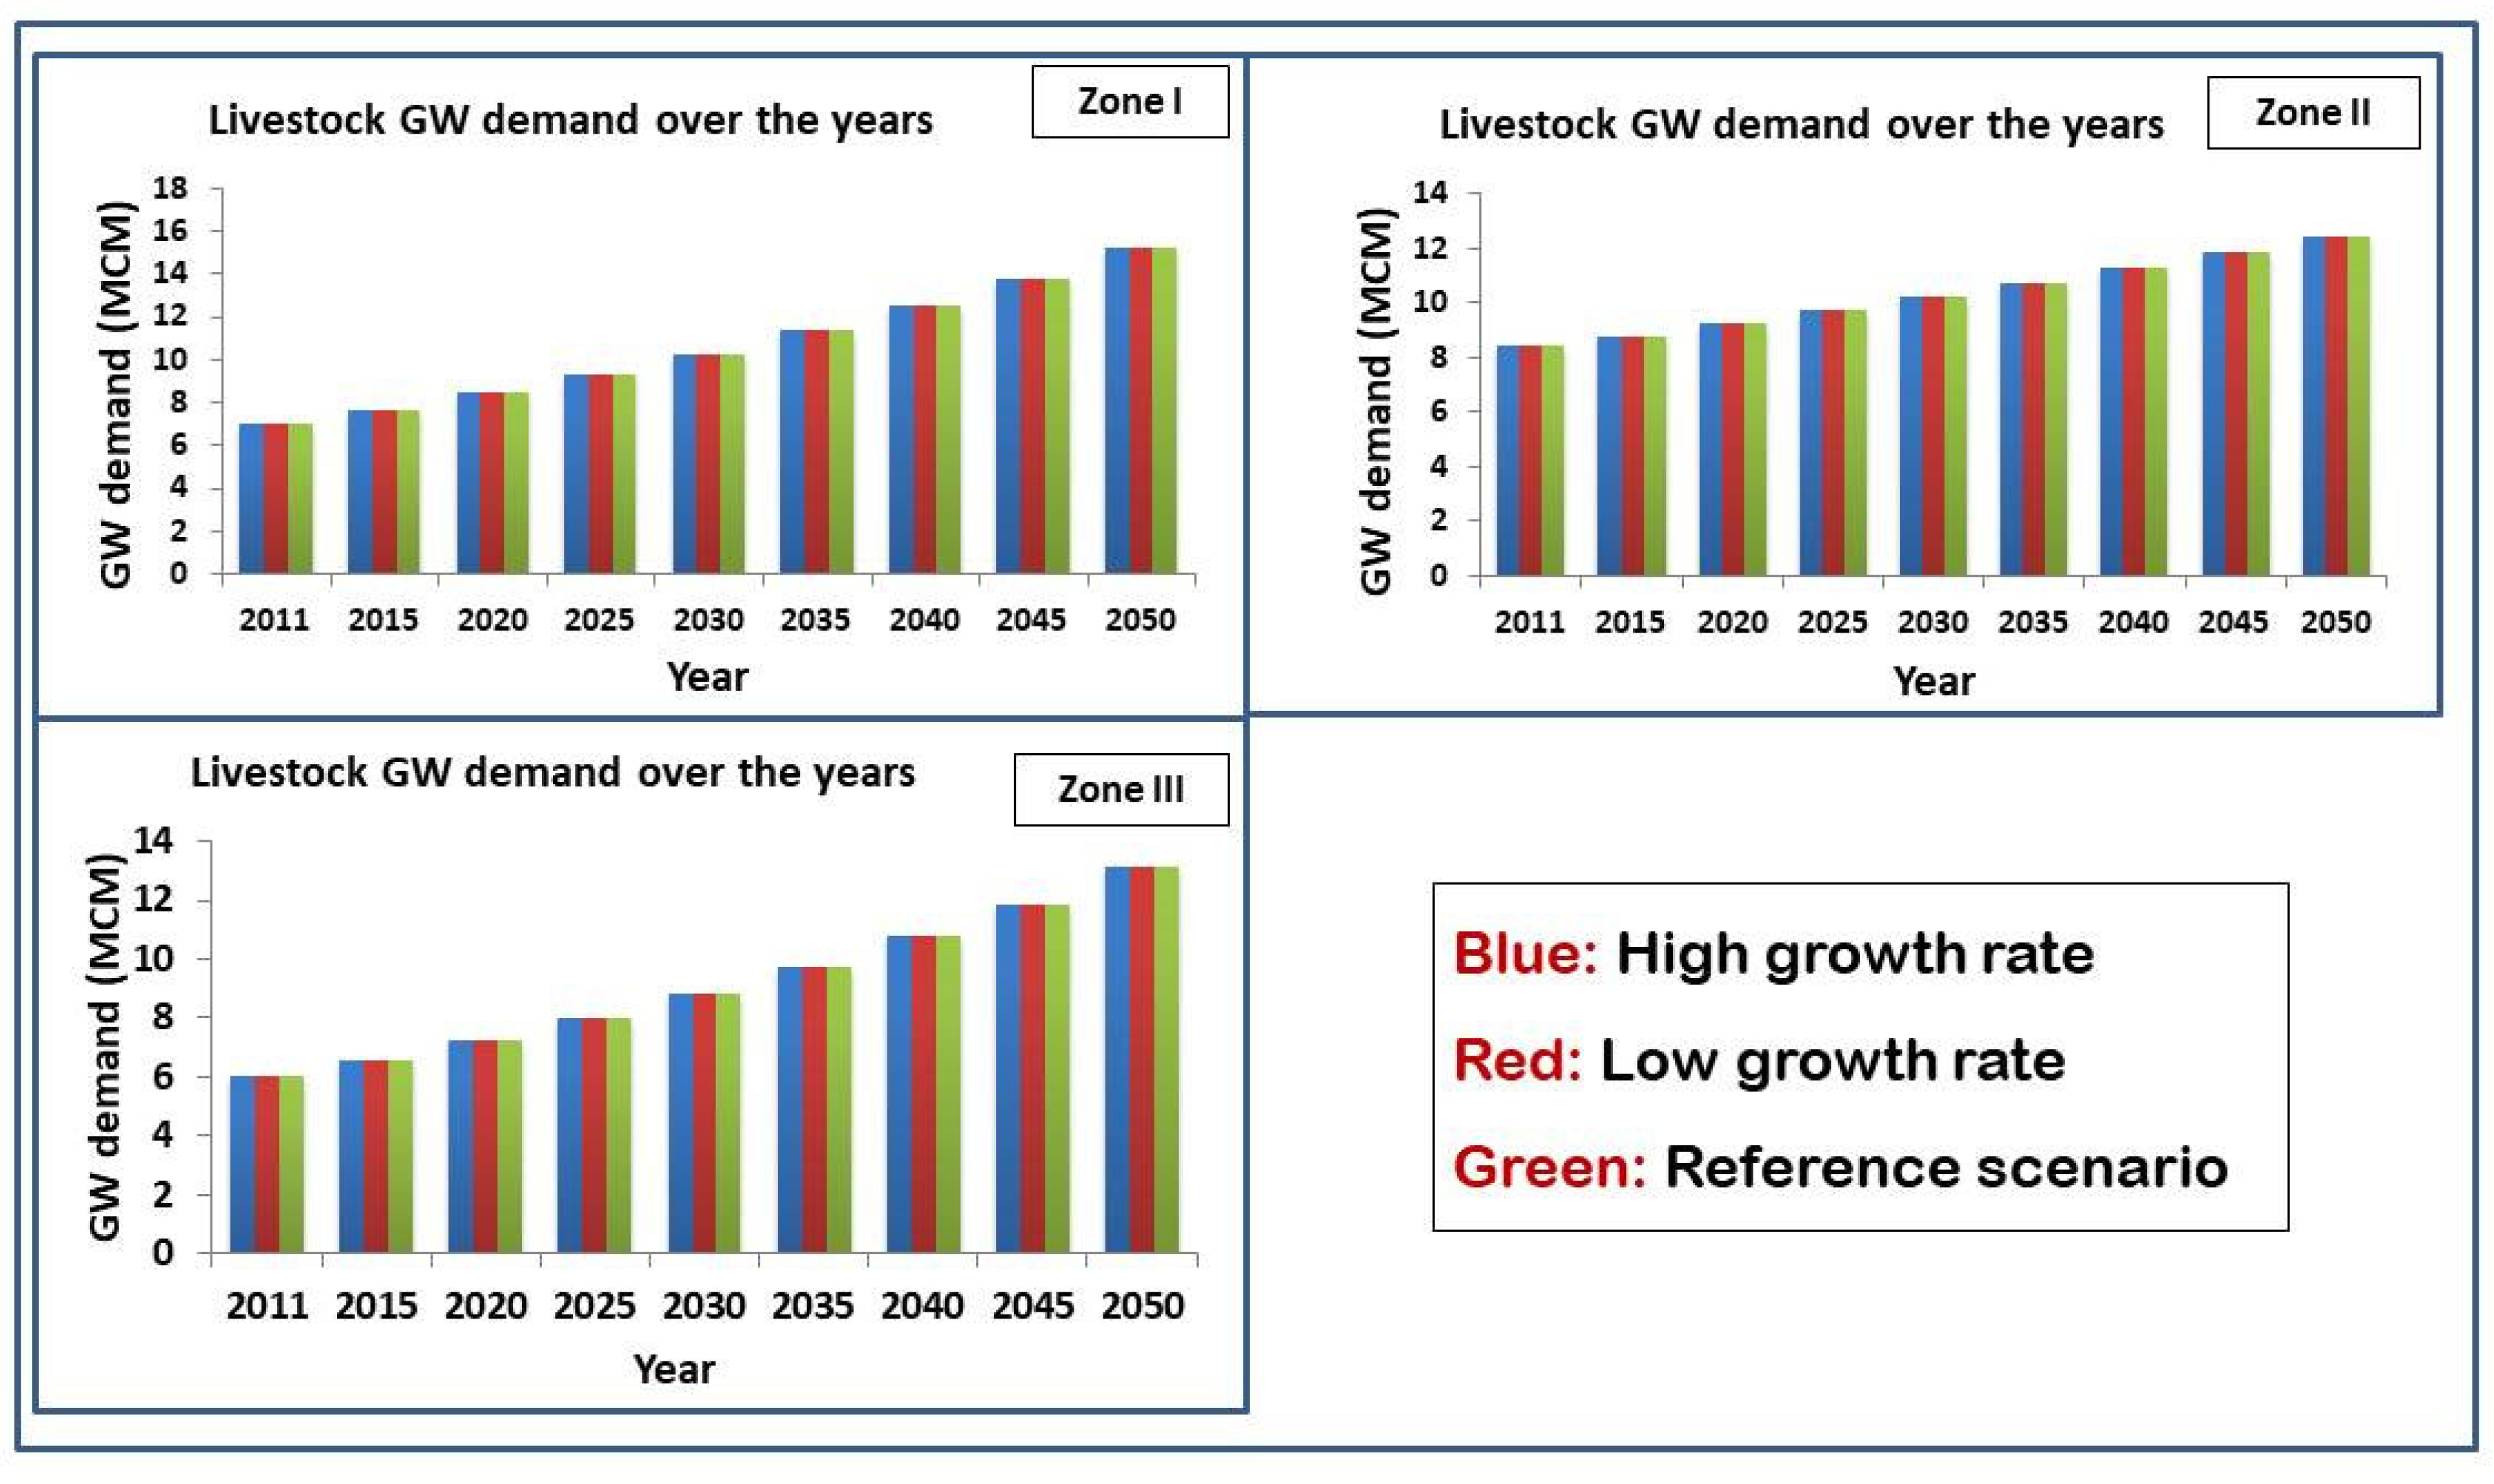
Cattle, buffalo, goat and poultry birds are the major livestock animals in the study area. Cattle and buffalos are reared because of milk and meat while the poultry farms are reared for meat only. Cattles and buffalos are the major water consuming livestock followed by poultry in the study area. The water consumption rate for poultry farms was retrieved from The Poultry Site [59] and Water Consumption in Broiler [60]. The groundwater requirements for dairy animals are only attributed to drinking purposes, whereas pond water is used for washing. The livestock water demand is estimated to double from 7.04 mcm (in 2011) to 15.25 mcm in Zone I in 2050, while a steady increase in demand is observed in Zone II (8.44 mcm in 2011 to 12.44 mcm in 2050). In Zone III, the livestock water demand is also estimated to double from 6.03 mcm in 2011 to 13.1 mcm in 2050 (Figure 9). This anomaly is due to the presence of more cattle and buffalo in Zone I than the other two regions, while the steady increase in water demand in Zone II is due to more poultry farms contributing to lesser water demand.
5.3. Unmet Groundwater Demand Derived from WEAP
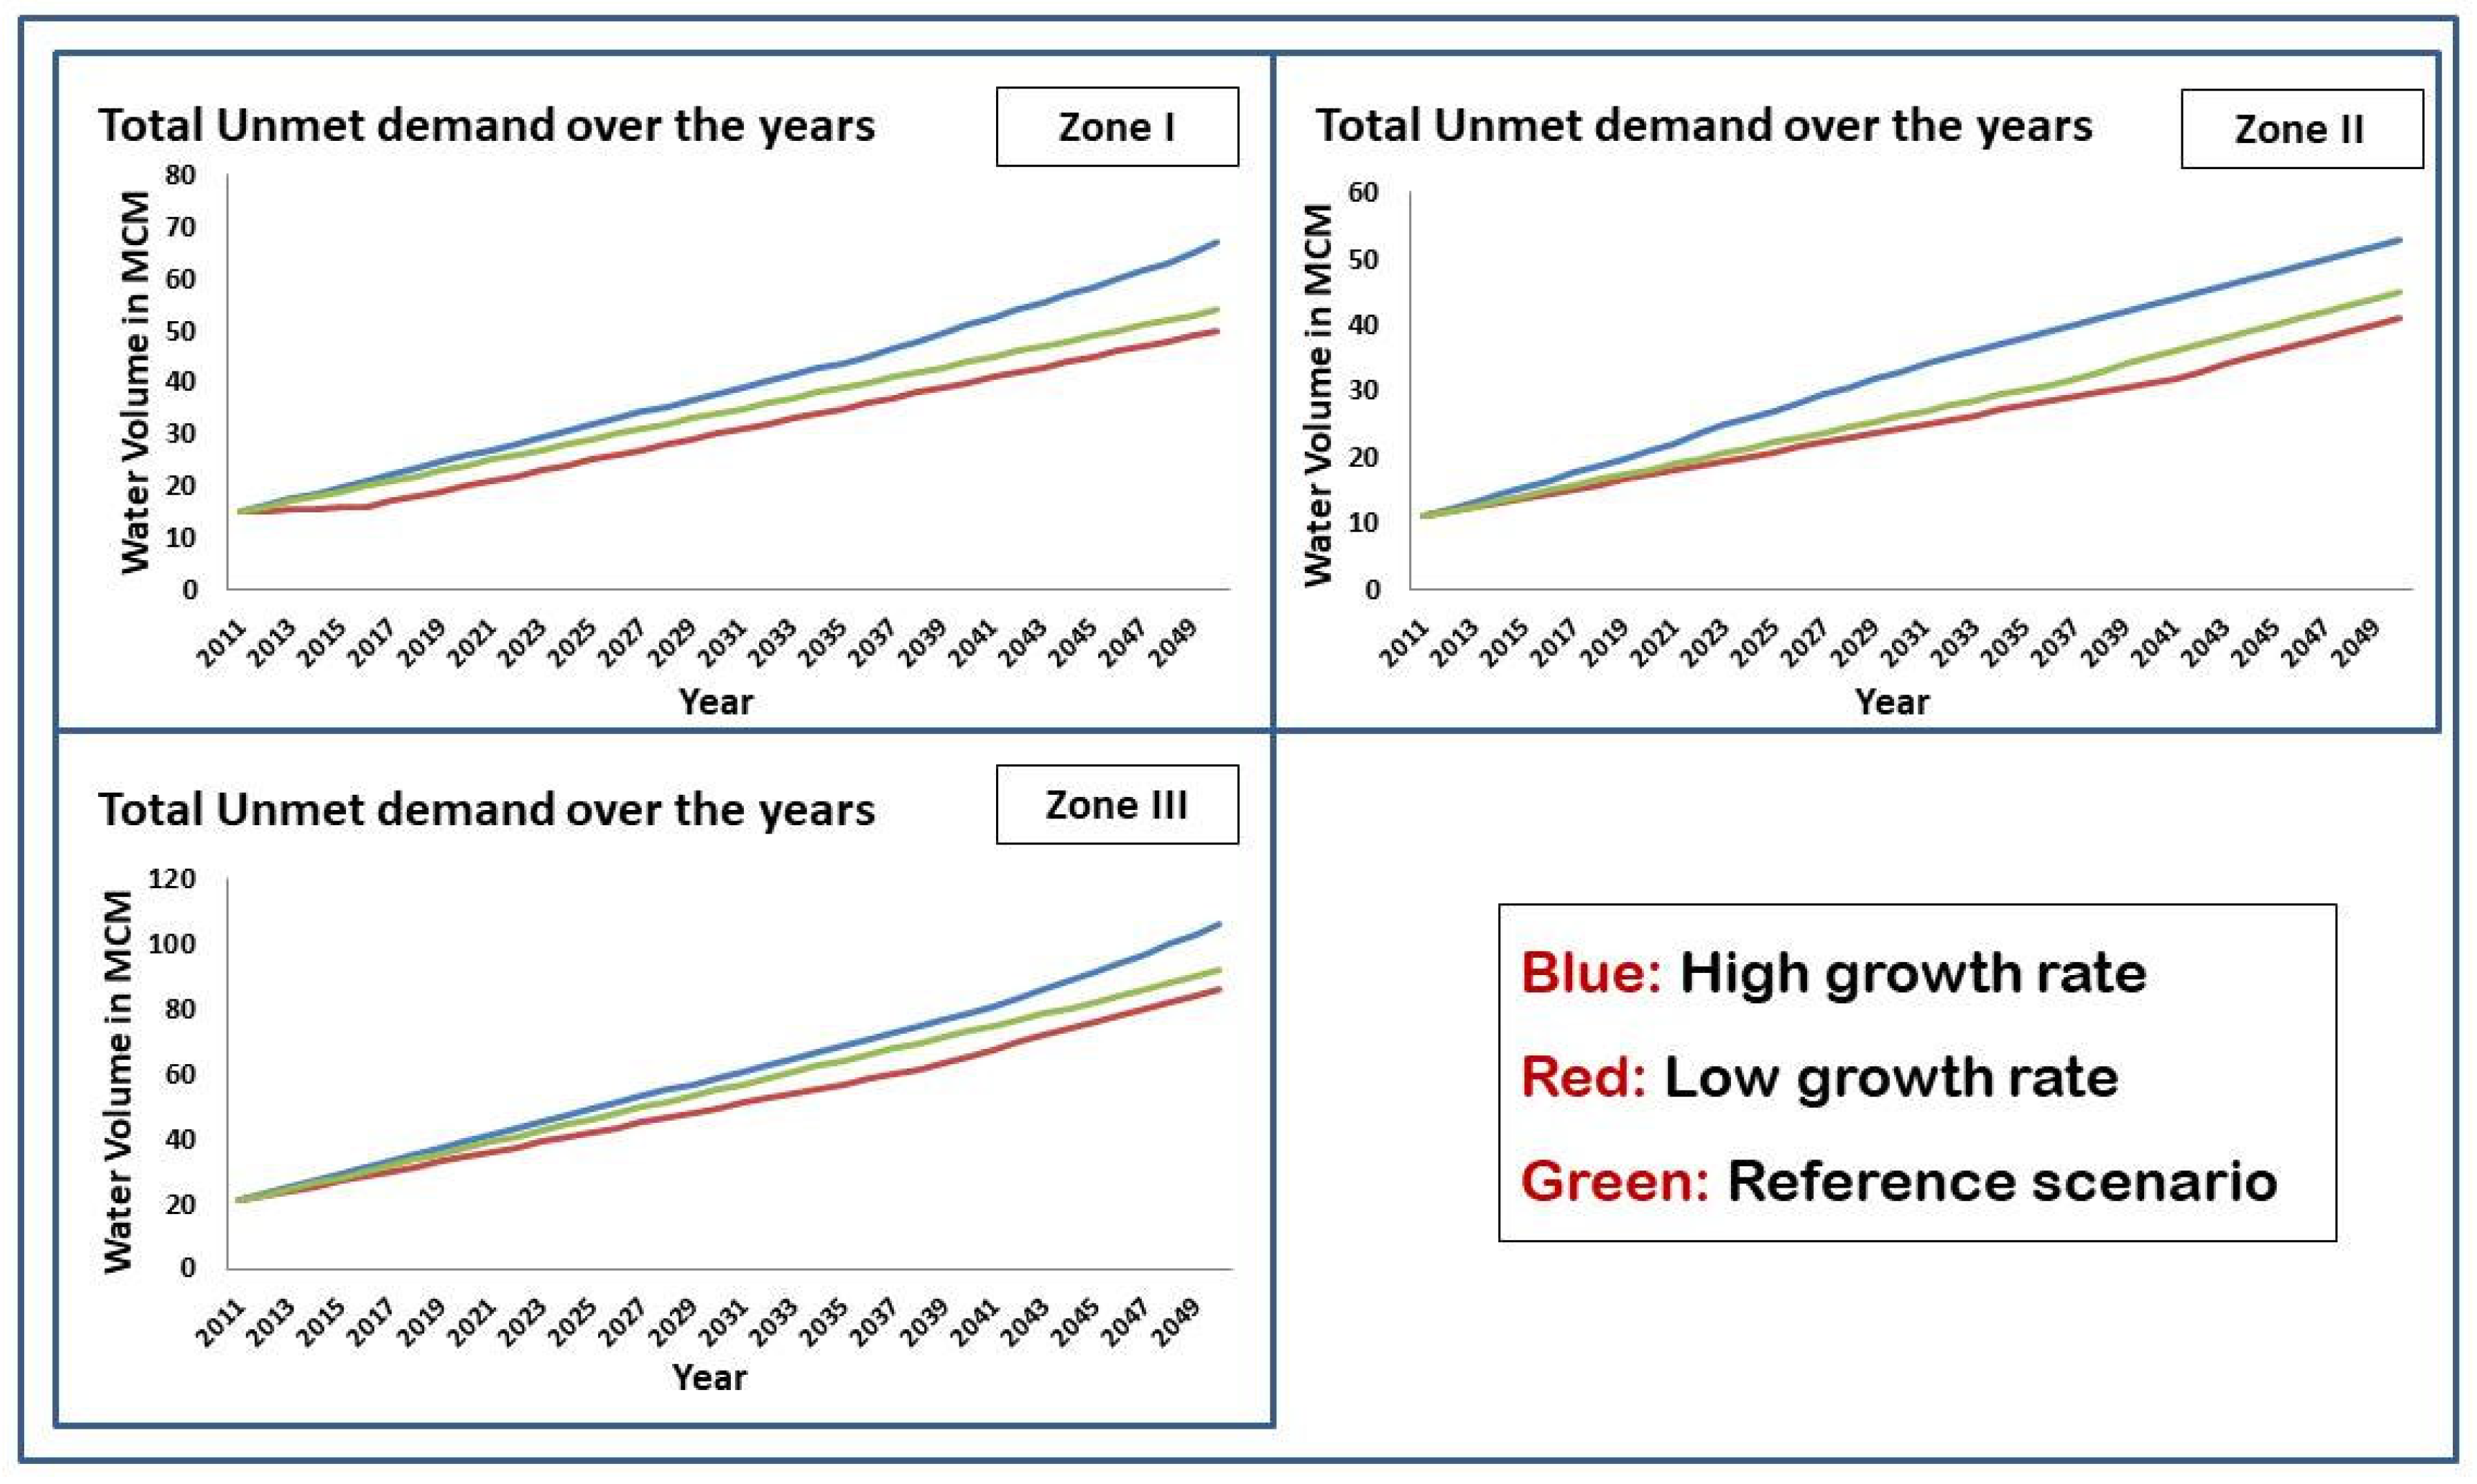
The unmet demand represents the gap between the allocated water and the demand in each node, or simply the shortage of water. It was calculated by subtracting the WEAP allocated water amount from the demand values in each node. The estimated value of groundwater flow in deep aquifers is 18.25 mcm annually in the study area [35]. The groundwater abstracted from shallow tube wells was estimated to be around 24 mcm (calculated from the water abstraction rate and a number of shallow tube wells installed as mentioned in district statistical abstract and CGWB annual reports). The WEAP model was capable of simulation and the results indicated strong seasonal changes in required groundwater utilization over the years. The sectoral division of unmet demand is compiled in Table 4 and represented in Figure 10. Based on unmet demand values, it is clearly indicated that water stress-related issues (described in the next section) are going to rise at any growth rate scenario in Zone III due to higher agricultural and domestic demand.
6. Discussion
6.1. Implications of Increasing Groundwater Demand
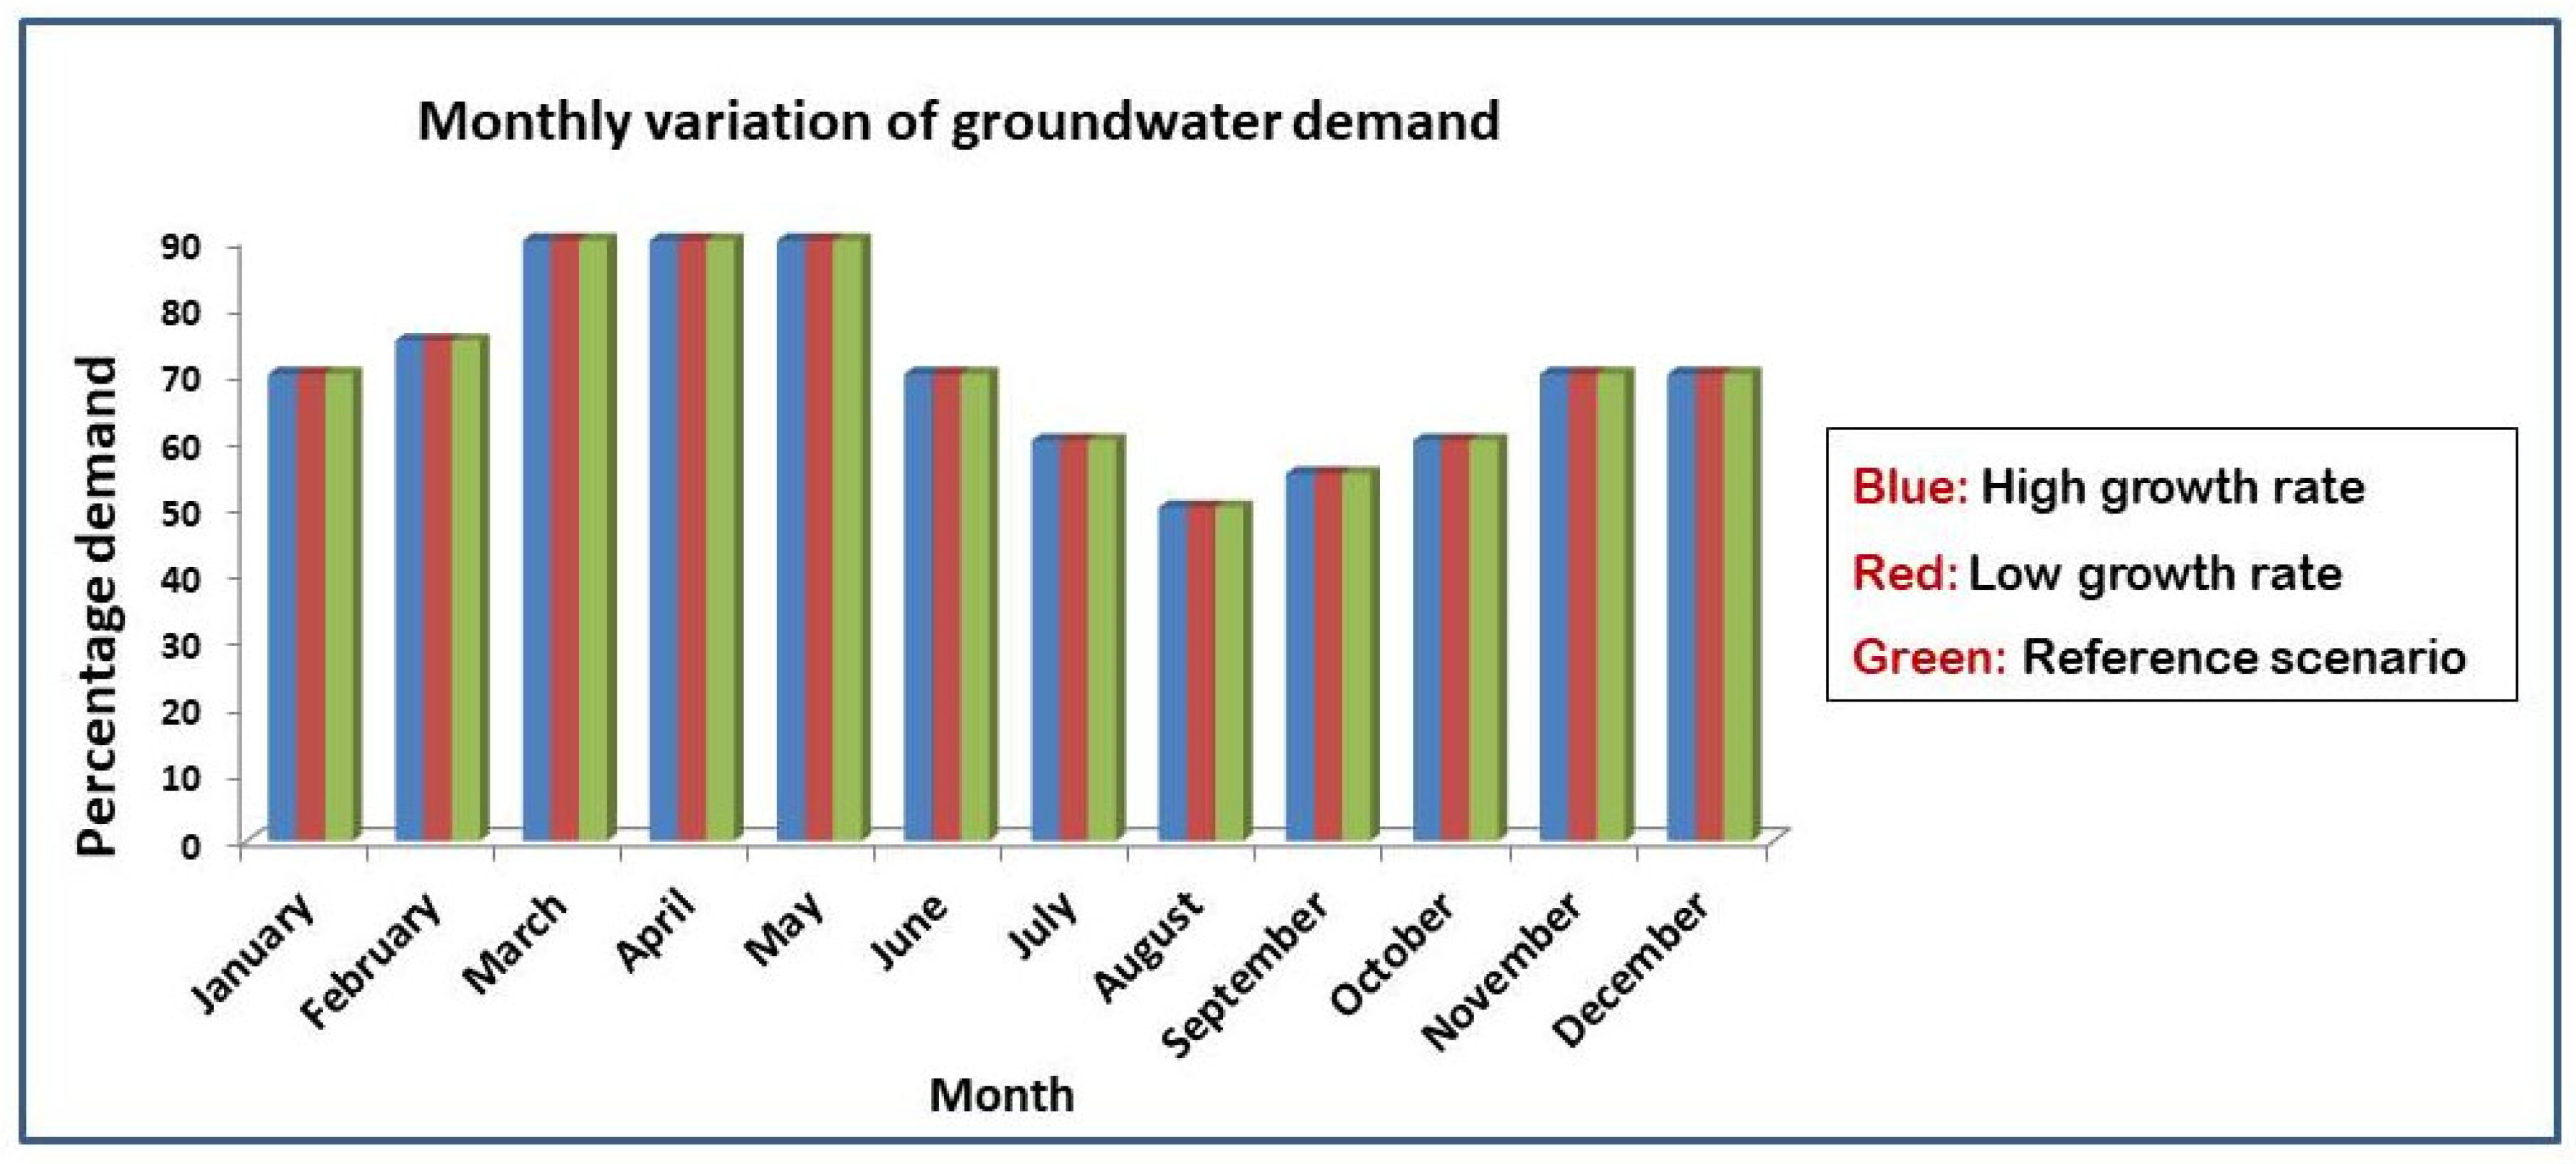
The future sectoral water demand and unmet demand in three separate zones gave an idea about the groundwater storage vulnerability. Based on unmet water demand, the zones can be segregated into three major criteria: more vulnerable (Zone III), medium vulnerable (Zone I), and less vulnerable (Zone II). Zone III is comprised of five community development blocks, with a decadal human population growth rate of 1.71% along with a larger land area irrigated by groundwater, which is translated into higher groundwater demand. The decadal human growth rate (1.44%) is much lesser in Zone I, but being the major tourist attraction, the water demand is expected to rise at a greater rate with a subsequent depletion in groundwater level. The groundwater-dependent agricultural land area is much lesser in Zone II compared to the other two zones. This is significant as, despite a higher decadal population growth rate (1.93%), the overall demand stayed at the lower level. Along with population size, an increasing trend of population density (573 in 1991 to 819 person/km2 in 2011) [42] is observed in the study area, impacting on the groundwater abstraction rate significantly. From the monthly demand, it was confirmed that the groundwater demand rises in the pre-monsoon months (March–June, when rainfall is not sufficient) during the sowing of Aman paddy, and again it rises in November during the sowing of Boro paddy, indicating a strong negative correlation with monthly rainwater availability (Figure 11). In other words, groundwater demand increases when rainfall is lower and demand decreases when rainfall is adequate. During FGD, it was confirmed that in any extreme climatic event (cyclone), hydrological changes can trigger serious repercussions on economic output and associated mental stress among communities. This leads to severe consequences such as restlessness, anxiety, and frequent domestic violence and suicides too [50].
6.2. Relationship between Agricultural Activities and Climate
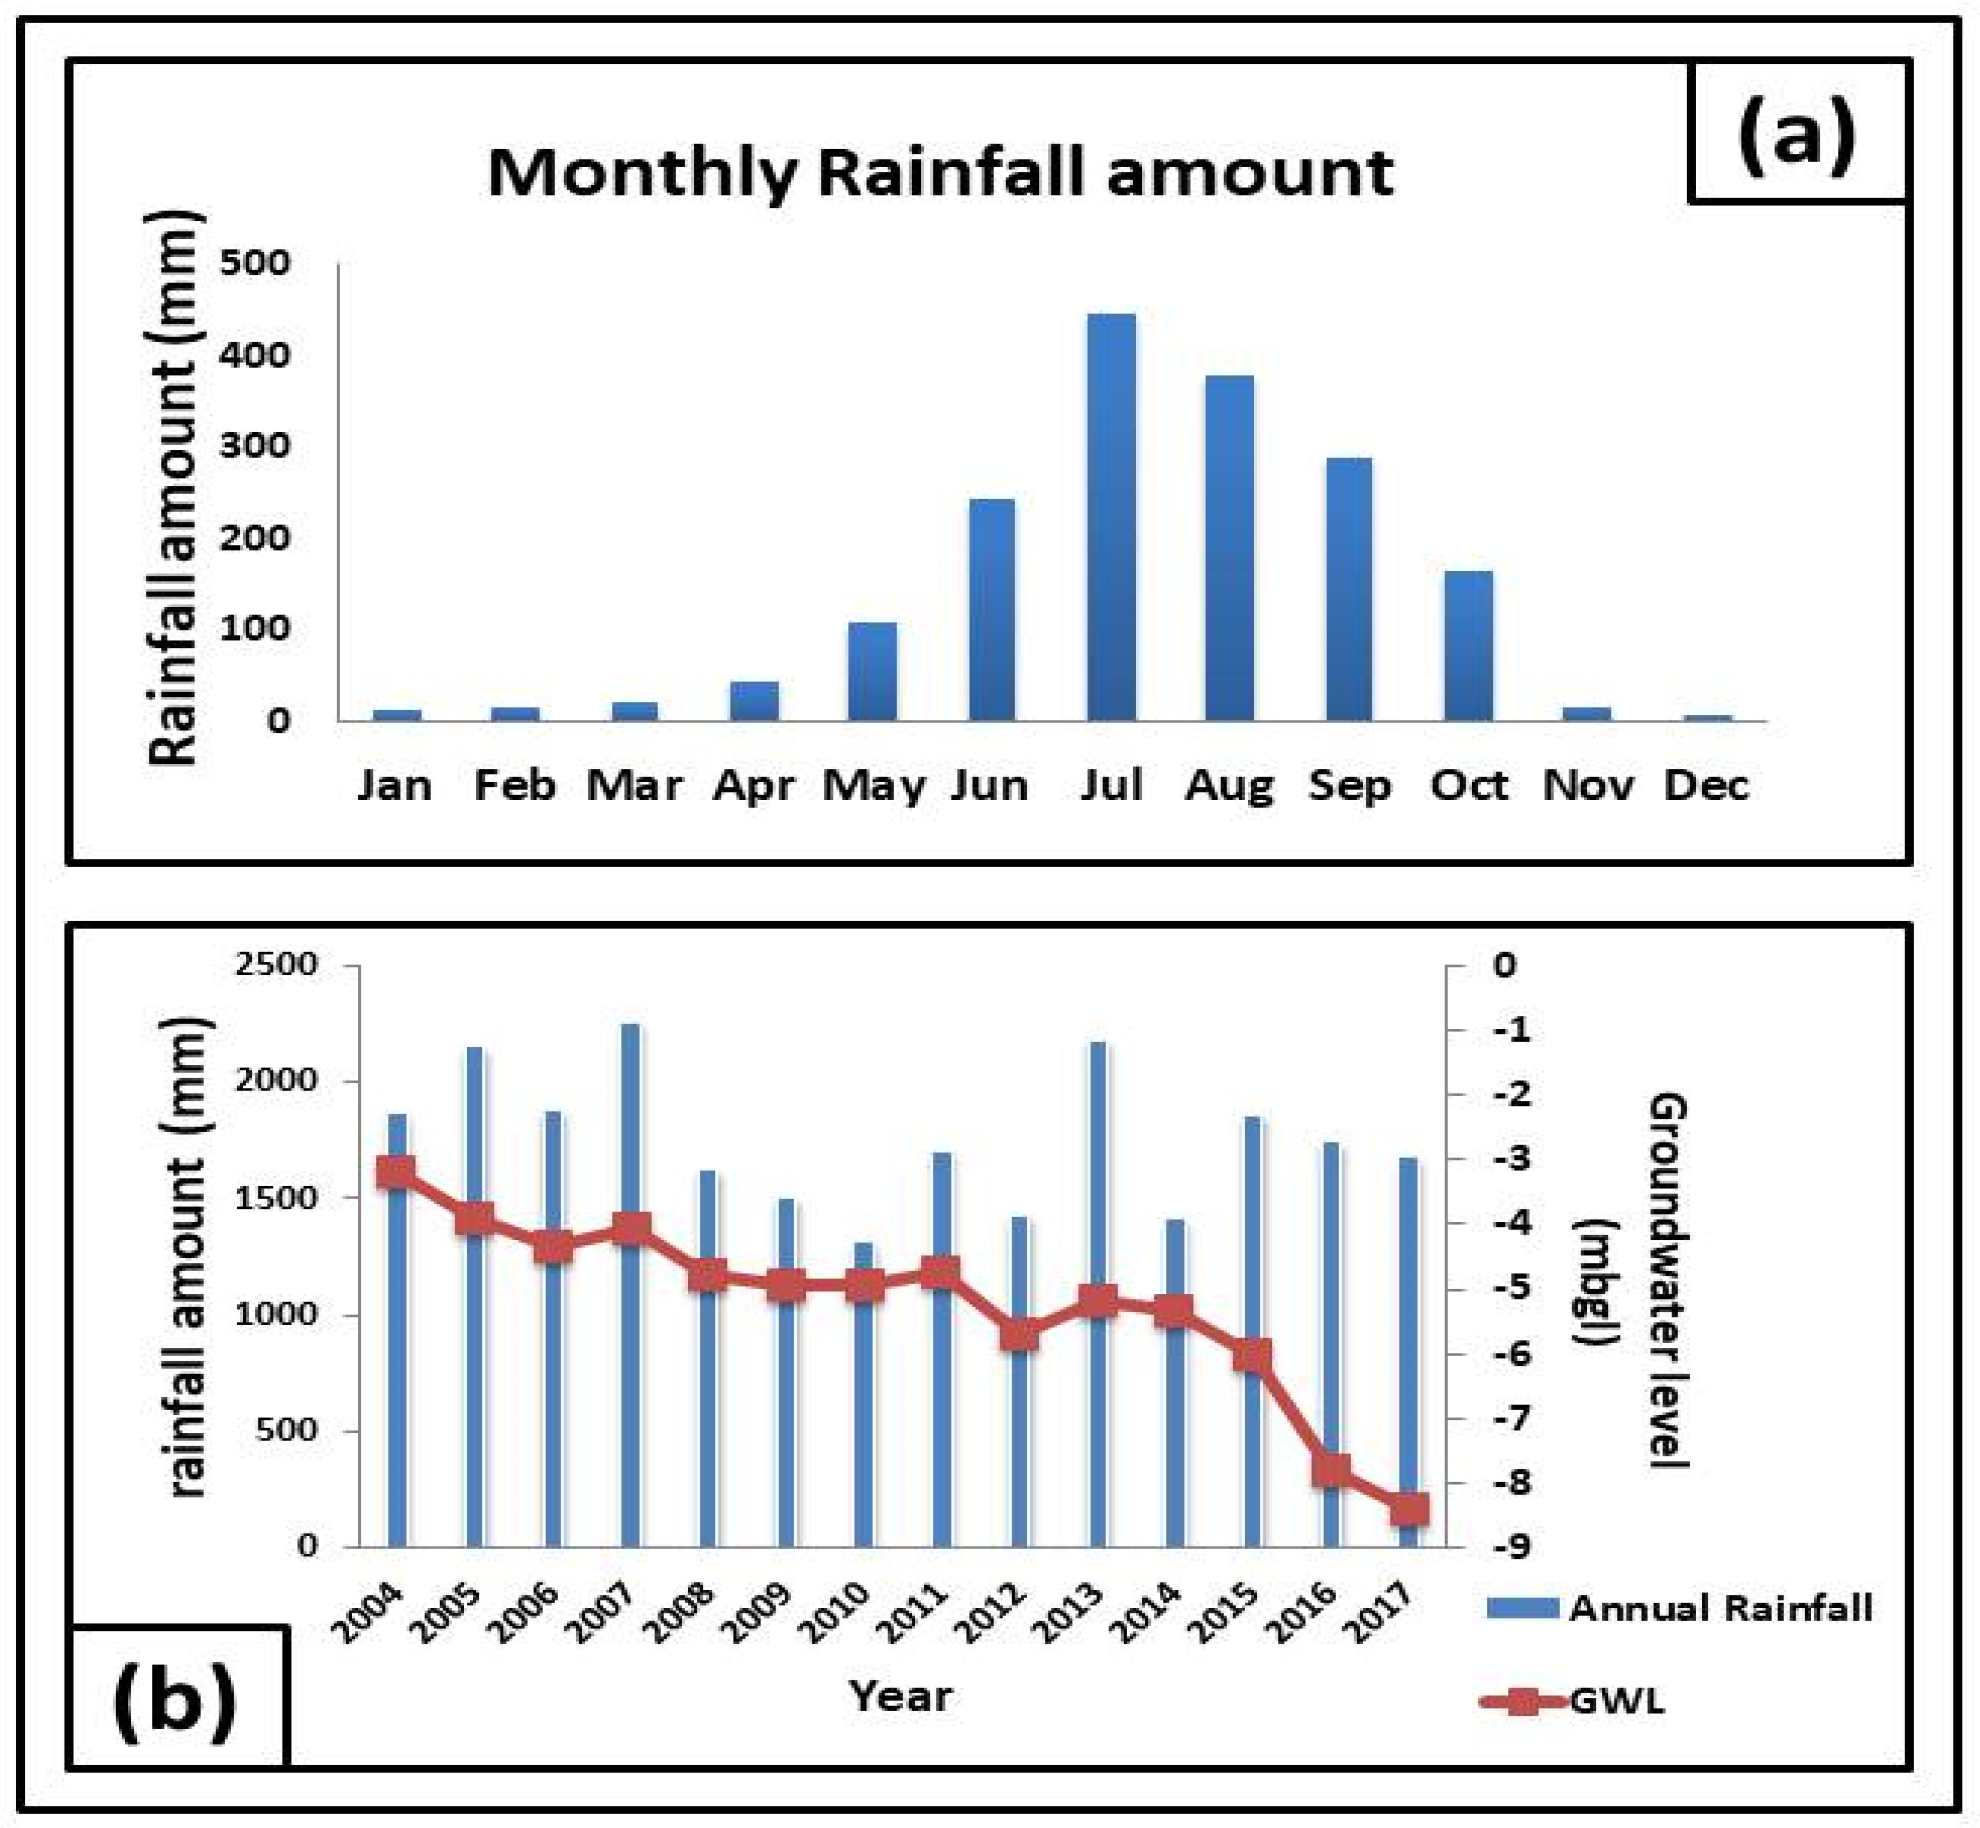
Climatic parameters (rainfall) play a prominent role in agricultural activities in the study area. The monthly variation of rainfall amount in the study area is depicted in Figure 12a. This rainfall pattern is significant as agricultural groundwater demand increases during non-monsoonal months. Any variability in rainfall might cause a significant impact on crop yield. Decreasing rainfall [26] prompts the farmers to extract more groundwater. This was confirmed by FGD in the study area. Furthermore, the reach of groundwater-based irrigation is not available to all farmers, thus, it greatly acts as a limiting factor of economic growth. Increasing population density [42] and decreasing rainfall and groundwater recharge rate [26] might be important reasons behind the declining groundwater level in Figure 12b. This leads to the extraction of water from deeper wells, which increases the electricity cost as well as the total cost of production. According to Mandal et al. (2015) [15], the Sundarbans coastal region has been experiencing a delay in the onset of monsoon and late recession, while sometimes-heavy rainfall was observed during the harvest period of the monsoonal crop. The depletion of the groundwater level causes a higher rate of seawater intrusion, resulting in the qualitative deterioration and quantitative depletion of groundwater resources [26,50]. Additionally, the changes in hydrological parameters have a significant aftermath due to the increased rate of pest attacks with a consequent decrease in crop productivity [61].
6.3. Status of the Agricultural Economy
For the last couple of decades, the contribution of the agricultural sector to GDP has been decreasing significantly in India (from over 50% during the 1950s to 15.4% in the year 2015–2016), while an increasing contribution from the industrial (manufacturing) and service sectors was observed (constant prices considered) [62]. According to the reports of PRS Legislative Research [62], the major influencing factors of agricultural productivity are over-dependence on monsoonal rainfall, landholdings, deteriorating soil nutrients due to improper use of fertilizers, deprivation from formal credit, and the disproportionate use of technology, etc. Compared to other rice-producing states, the lowest growth rate (−1.3%) was observed in West Bengal, as mentioned in the NSSO 2015 report [63]. Almost 95% of farming households who cultivate <4 hectares were incapable of fulfilling their basic consumption need [64]. These statistics are highly significant as nearly 84% of total farmland is cultivated by small and marginal farmers in West Bengal. Additionally, West Bengal belongs to those states where the average monthly income of farmers lies below 5000 rupees [64].
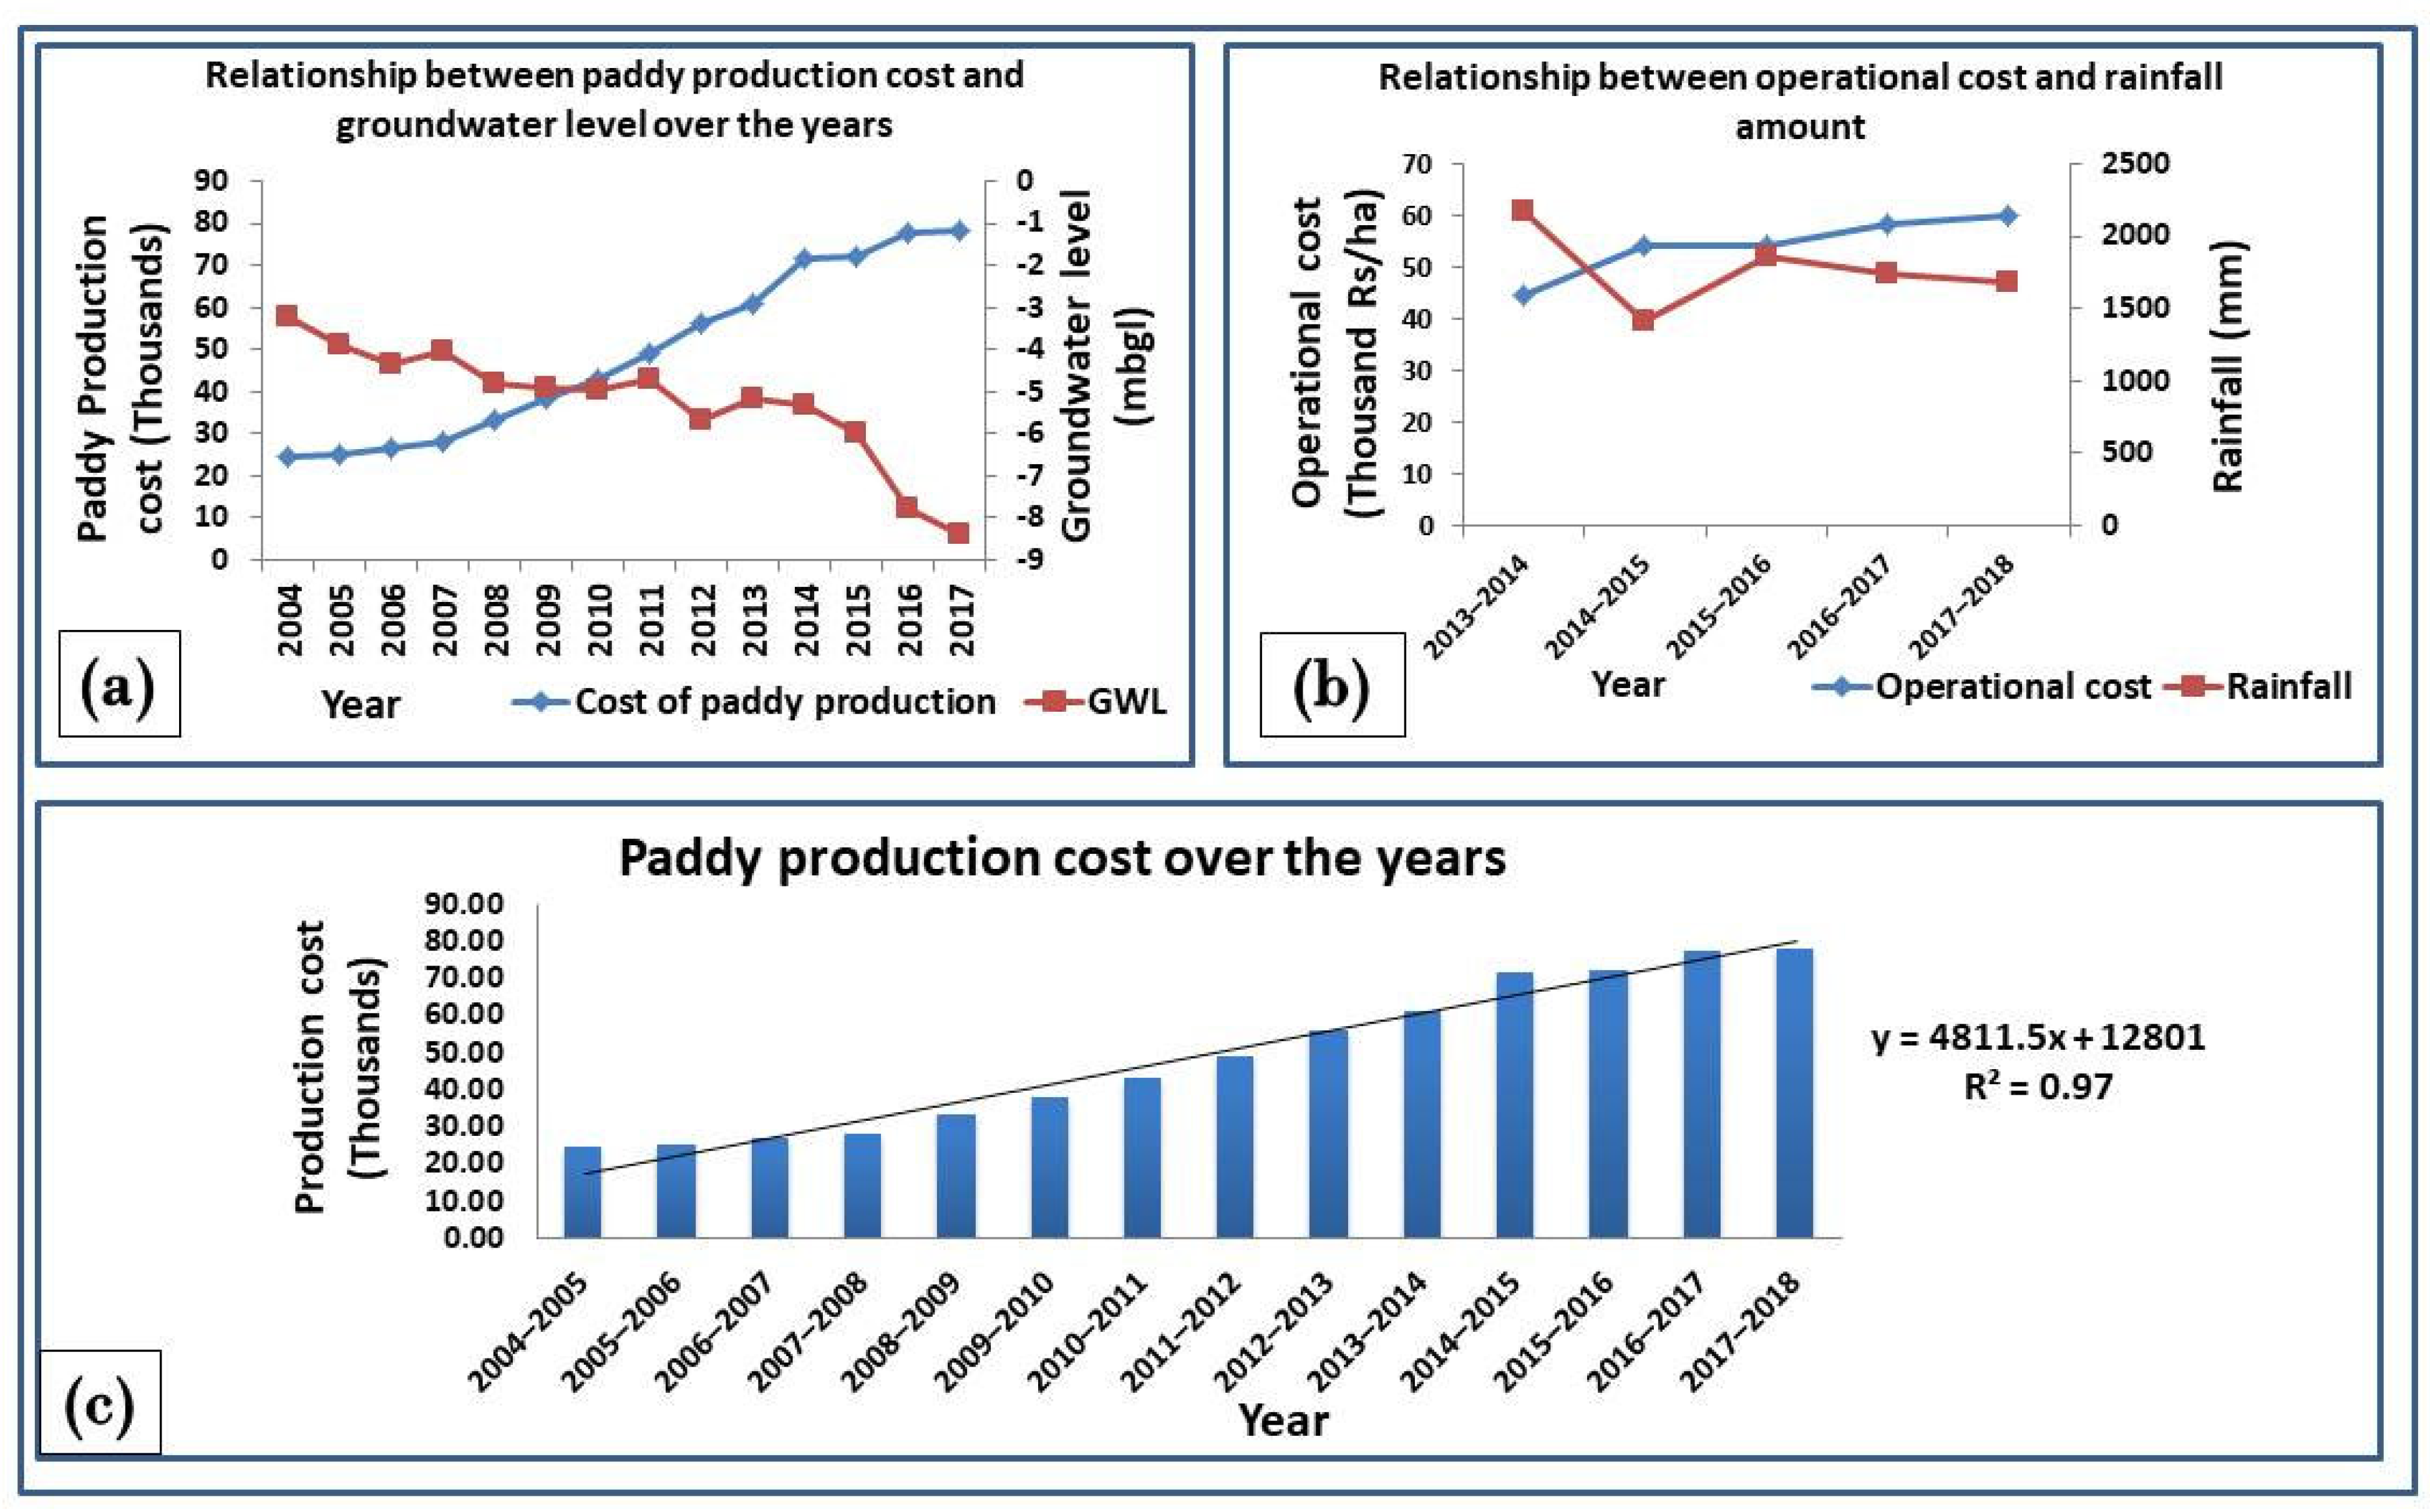
When plotting the groundwater level data (GWL) and the cost of cultivation in the study area, a significant inverse relationship was found. As the GWL started declining, the cost of cultivation started increasing (Figure 13a). This may be due to electricity consumption during agricultural water abstraction. The relationship between groundwater and electricity is straightforward, as electricity is consumed for groundwater abstraction from aquifers. Unlike other states, the farmers of West Bengal do not receive free electricity for agriculture or tariff subsidies [65], and as a result, the cost of production increases along with the depleting groundwater level. This trend is also significant as the cost of cultivation has shown an inverse relationship with the rainfall amount in 2013–2018 time periods (Figure 13b). As such, these data imply that when rainfall is lower, there is a higher groundwater demand in agriculture, which leads to excessive electricity costs and an associated increase in the overall cost of paddy production (Figure 13c).
6.4. Impact of Literacy Rate on Economic Wellbeing
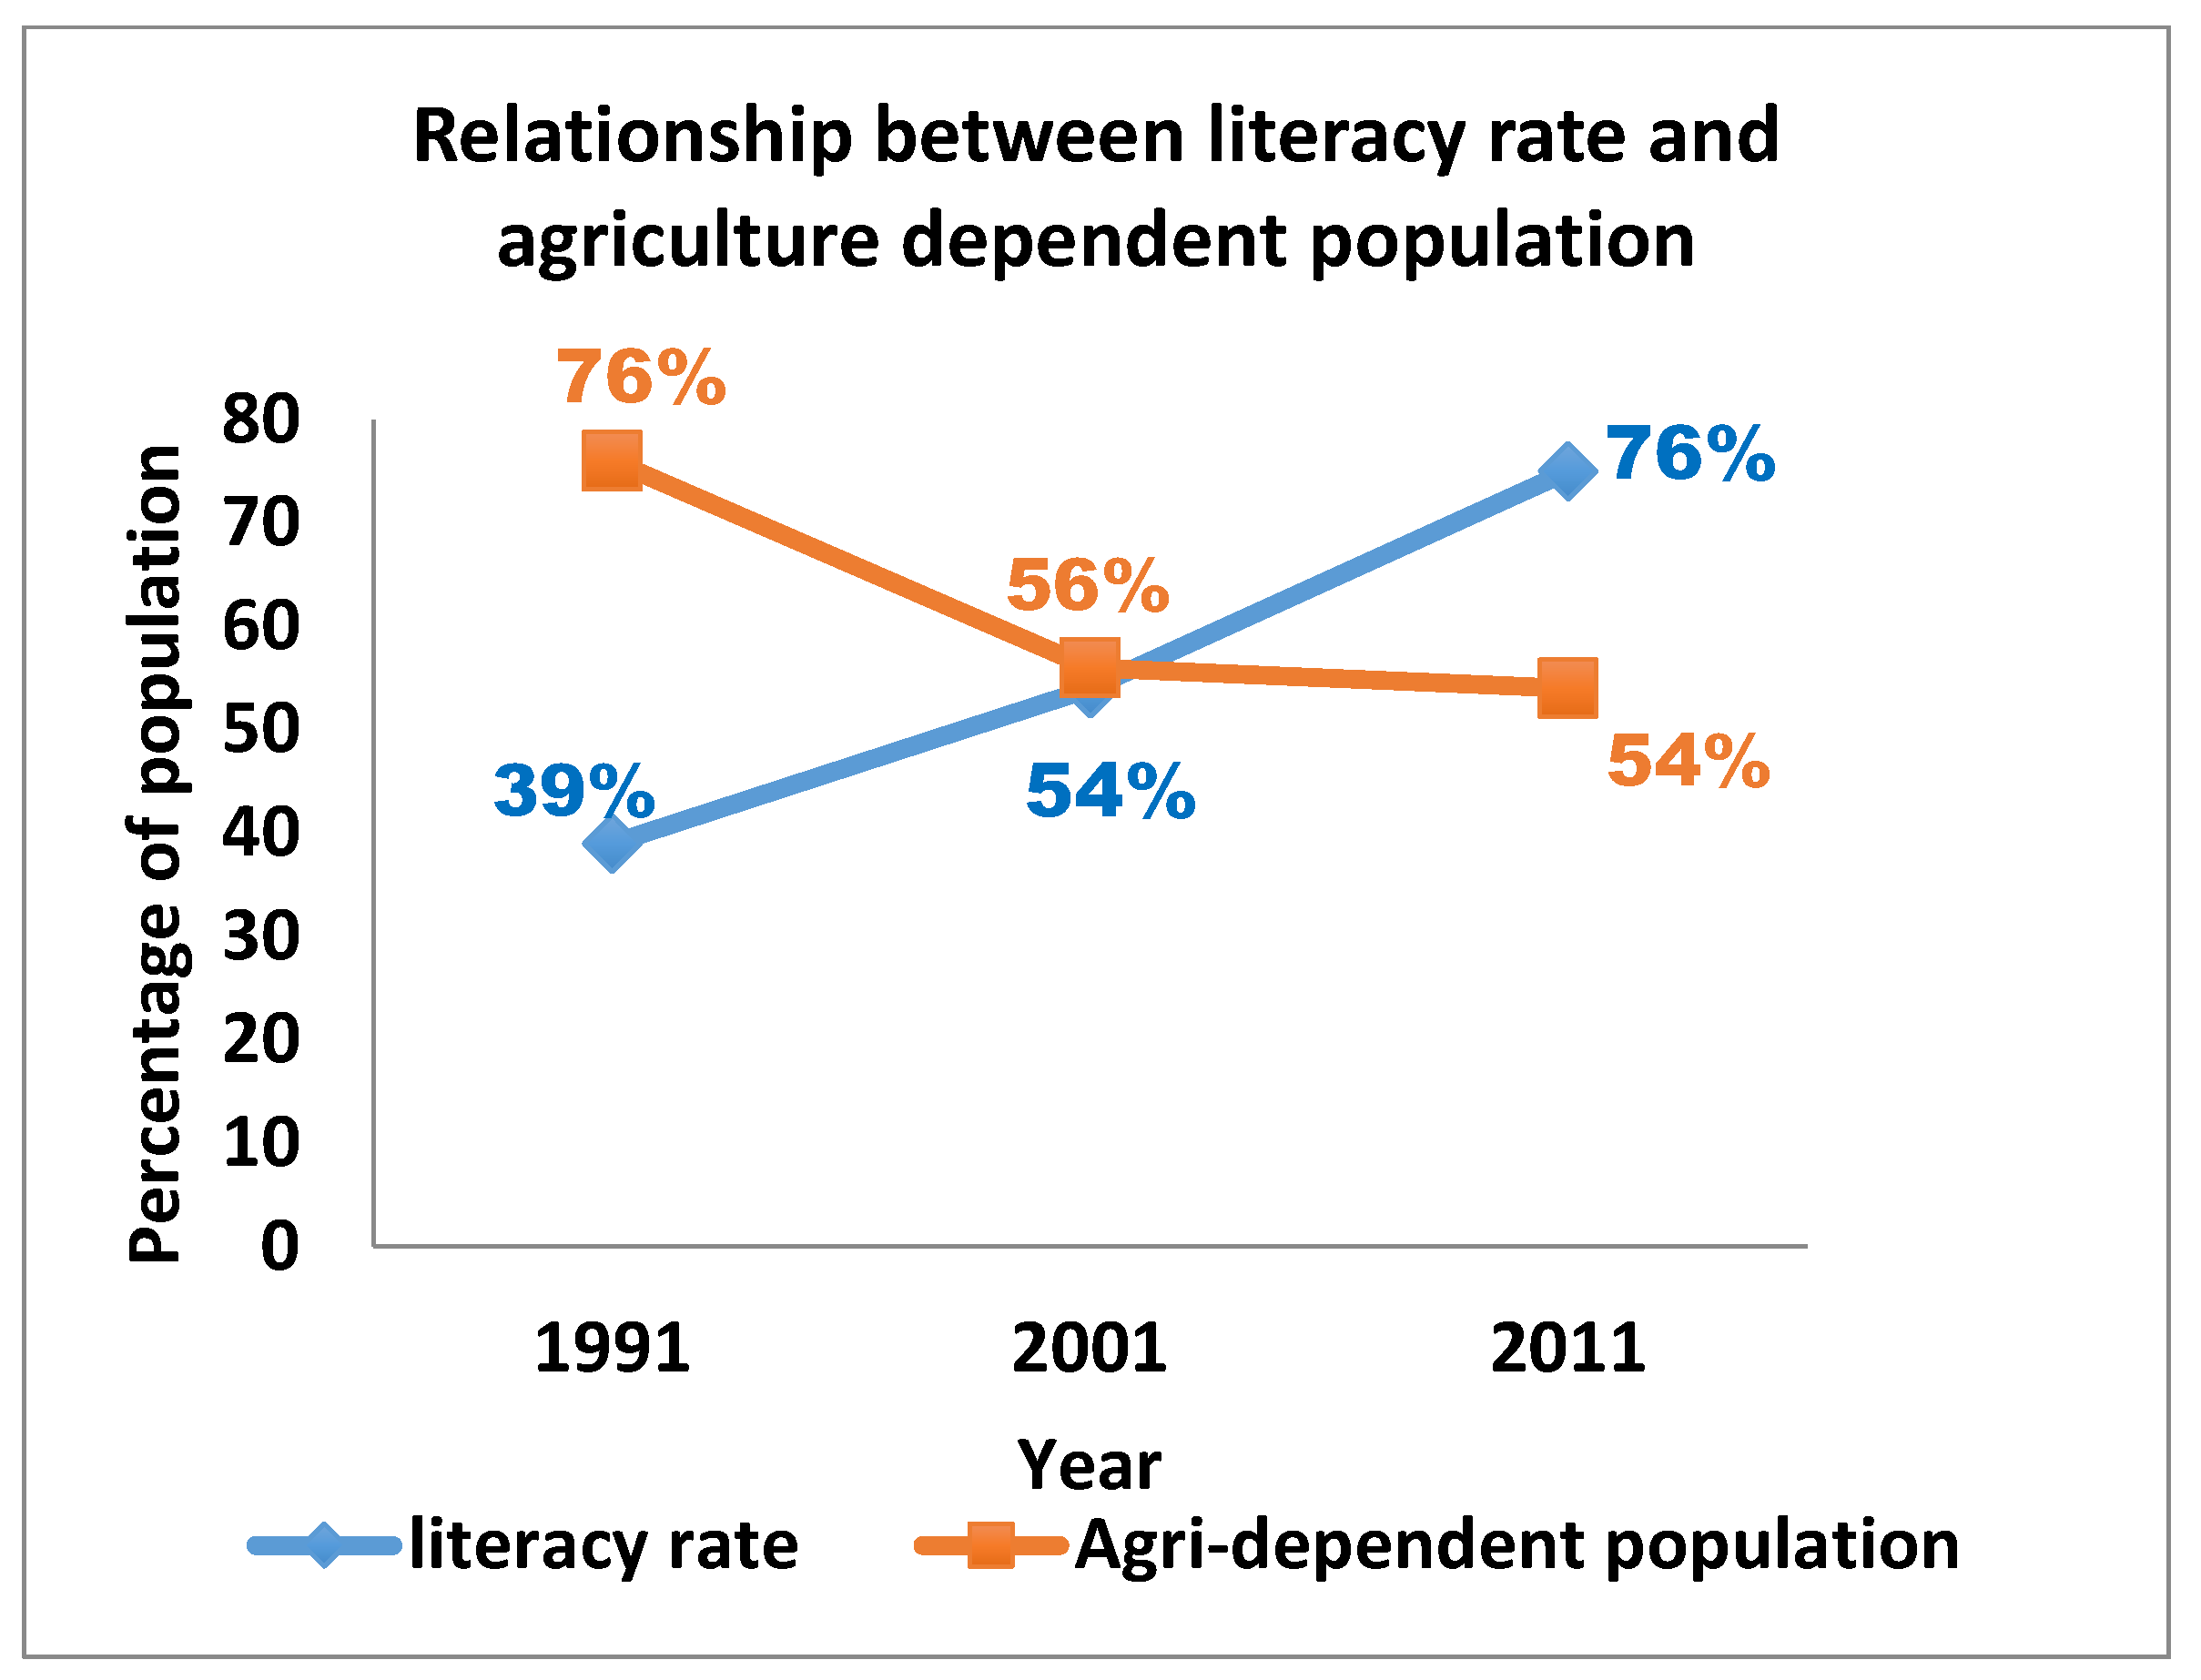
Literacy is one of the key factors of the economic prosperity of any region (country/state/district). Therefore, increasing the literacy rate is suggestive of better employment opportunities [66]. According to the Indian Census, literacy is defined as the capability of reading, writing, and interpreting in any language [42]. It is worth mentioning that, along with the described literacy definition, it is important to have certain technical skills to survive in the modern labor market. This will eventually decrease occupational passivity in the workforce with an improving rate of employability. Therefore, a certain level of educational qualification and technical knowledge helps in the attainment of better salary jobs in India [67]. The literacy rate in the study area showed an upsurging trend; 39%, 54%, and 75% in 1991, 2001, and 2011, respectively. An increasing literacy rate is associated with a shift in occupation from agriculture (lower wage rate) to other industrial sectors (higher wage rate). The daily wage rate for unskilled agricultural laborers is 260 rupees (without food), whereas any unskilled industrial (bakery, automobile manufacturing and repairing, biscuit manufacturing, etc.) worker gets around 338 rupees (without food) daily, as mentioned in a recent report published by Labour Commissionerate, Labour Department, Government of West Bengal [68]. As the economic benefit from agriculture is very low in West Bengal (with respect to other states), the occupation shift will be more prominent in the coming years. The relationship between the decadal literacy rate and trend in occupation shifting is provided in Figure 14.
6.5. Overall Socio-Economic Status under the Hydrological Context
The increasing salinity content of surface water has compelled the people in Sundarbans to depend solely on groundwater as a drinking water source [26]. Apart from surface water salinization, several constraints in agricultural groundwater utilization have led to economic hardship and the associated migration of local people [50]. According to Bhanja et al. (2017) [69], unsustainable abstraction of groundwater and anthropogenic impacts are the consequences of the inaccurate implementation of management policies. Unproductive agricultural lands are transformed into brackish water aquaculture, possibly leading to increased salinization of shallow aquifers [26,70]. Therefore, improper knowledge about the hydrology of this area and a lack of convenient awareness among communities have resulted in the over-abstraction of deep groundwater, ultimately leading to the disruption of groundwater dynamics [26].
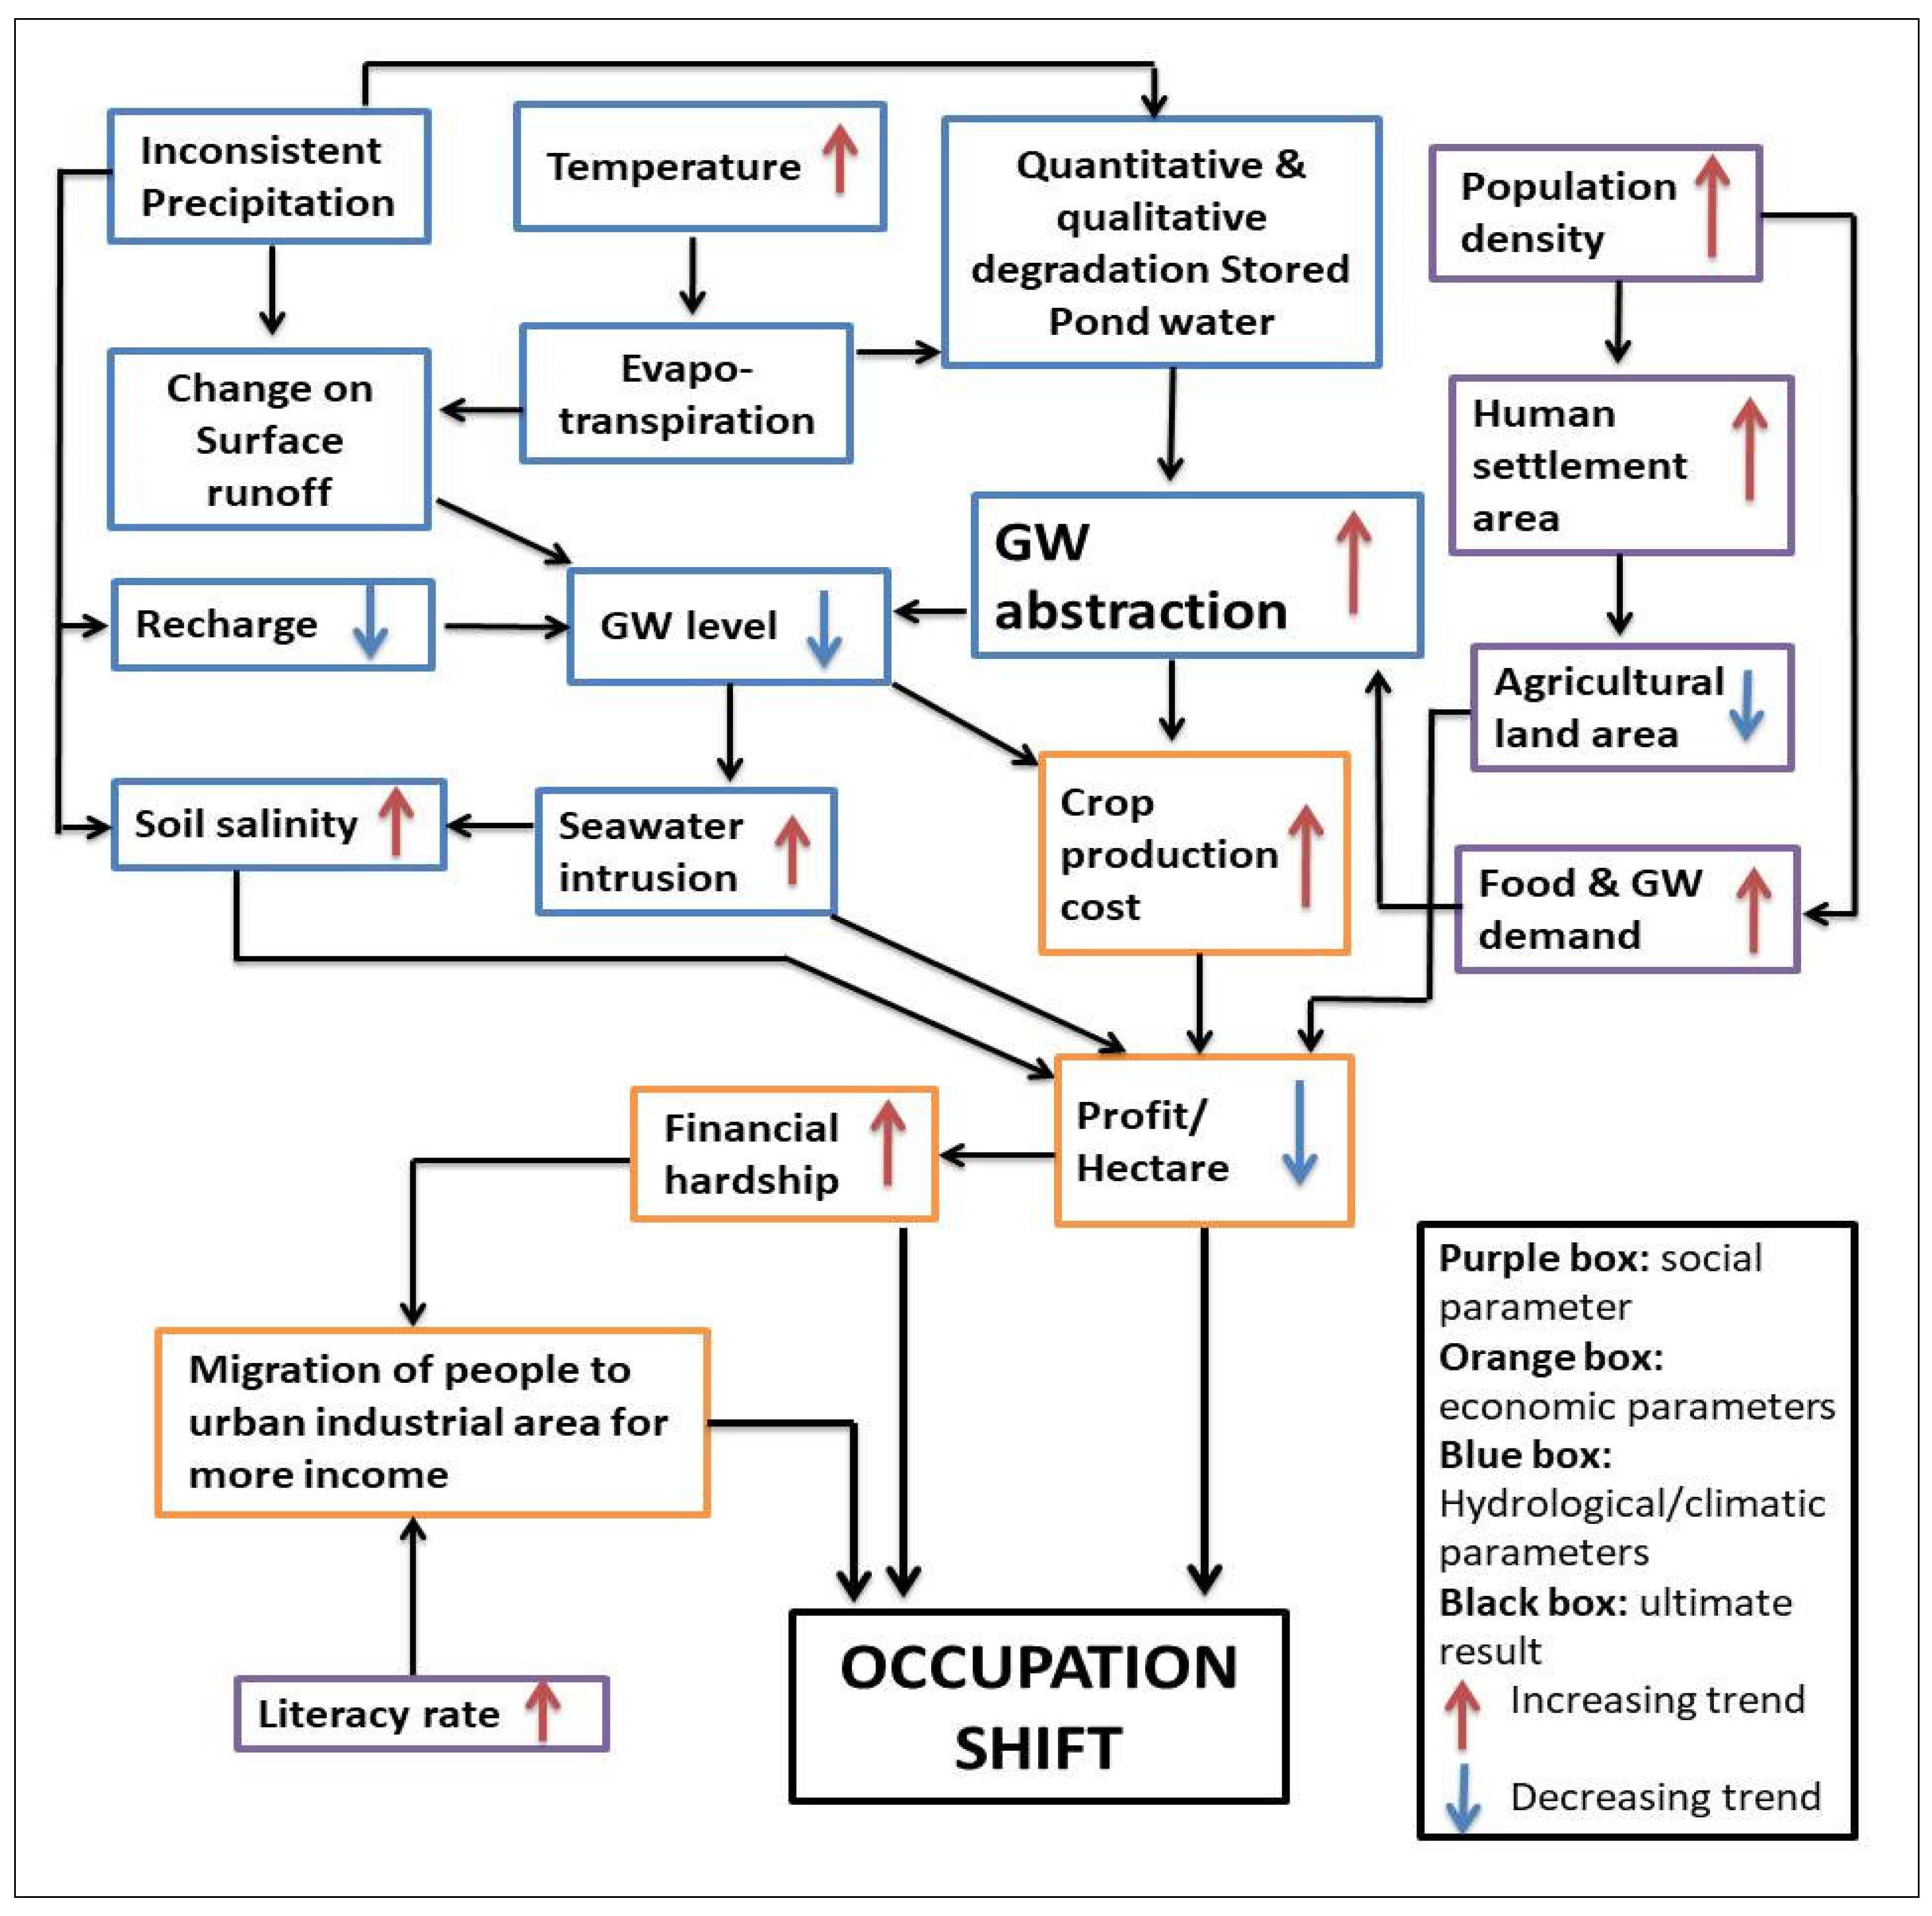
From the above analysis, it was observed that there is conspicuous shifting in professional dependency. Occupational shifting is a broad term that is controlled by multifarious factors starting from the resource availability, ecosystem vulnerability, and socio-economic status of the area [71]. Sundarbans is exposed to various highly impactful climatic events such as cyclones [72,73] with an additional higher rate of coastal aquifer salinization [26,34], leading to the serious vulnerability of the ecosystem. One significant outcome of the analysis is changing occupational trends as the portion of cultivators is declining with an increase in agricultural laborers in the workforce. This suggests that self-cultivators are quitting farming activities and becoming laborers in the agriculture field. Additionally, a trend in occupation shifting was also observed in the fisheries-dependent population, where inland fisheries are blooming at a considerable rate with a slight decrease in marine fish production. The prevalence of inland aquaculture practice was also reported in Dubey et al. [70]. Even though marine fish production can be affected by various other factors (quality of seawater, climatic change, etc.), the rate of overall production is significant as less yield may lead to a shift in occupation. Although more than half of the total working people are dependent on agriculture (Figure 15), a higher rate of conversion is expected in the coming years if the situation does not improve significantly. The principal drivers of hydrological parameters and associated socio-economic status in the study area are described in Figure 16.
6.6. Limitations and Way Forward
Previously, no data were published on the contribution of groundwater and agricultural growth in the Sundarbans region. Due to this, the net area irrigated by groundwater (only) was calculated by subtracting the total canal/pond irrigated area from the total agricultural area. Moreover, the non-availability of data prompted us to use various estimated parameters from printed media and non-governmental association data. The increasing pattern of groundwater is reflected through human population growth rate only, and a further increment due to urbanization is not considered in this study due to the lack of data. Additionally, the complex hydrostratigraphy of the study area was not considered during modeling as the zone-wise groundwater demand and unmet demand were only studied with respect to varying population growth rate. Although database limitations are there, substantial analysis has shown the importance of groundwater and associated climatic factors and social parameters on the overall economic status of the study area. There is always a gap between outcomes from scientific experiments and policy-makers’ decisions. It is noteworthy to mention that innumerable feedback mechanisms exist between humans and the hydrological system. Combining all these factors is beyond the scope of this study. The presented model and findings solely portrayed a snapshot of future trends in water use and human response for defined scenarios only. This study identified separate zones based on water demand and unmet demand to guide policy-makers for the implementation of location-specific policies to accomplish an impactful water management strategy to maintain the socio-economic development of humans. This is one of the first studies to acknowledge the complex human–water interactions in the Sundarbans region and further studies are required to predict the overall social dynamics under the hydrological context.
7. Conclusions
This study addresses crucial hydrological queries regarding human–nature interaction along with socio-economic issues in a highly complex coastal ecosystem. Despite the history of Sundarbans narrating the transformation for mangrove forests into agricultural land, gradually, it is becoming uninhabitable owing to changing hydrological dynamics, including the rapid salinization and contamination of freshwater aquifers. With these irreversible impacts, crop productivity and aquaculture yield are further expected to decrease in the near future. Sundarbans is possibly the classic case where groundwater availability is a great limiting factor to socio-economic growth. The relationship between hydroclimatic factors and socio-economic vulnerability is prominent, and such a relationship is further magnified by low per capita income, uneven allocation of natural resources, an inefficient health care system, improper education, and several associated factors, ultimately leading to an inadequate adaptive response to stressors. As a result, the major occupation sectors (e.g., agriculture, fishery) are affected considerably, posing challenges to populations living there. The impact of rapid changes in hydroclimatic factors on natural resources can endanger the utilization of natural resources. Both qualitative and quantitative securities of natural resources are important for sustainable socio-economic wellbeing. The probable factors for occupation shifting are: firstly, the ever-increasing cost of irrigation with reducing profitability in paddy production. Secondly, being a tourism attraction, there is a rapid bloom in real estate with urbanization that ultimately leads to a decrease in land area for cultivation. Thirdly, climate change (inadequate and inconsistent rainfall, cyclones, storms and increasing surface water temperature) acts as proper slow-burn with ever-lasting impact to promote this shifting. These factors either individually or in combination act as the push factors. Therefore, the early estimation of vulnerability is crucial to mitigate the aftermath of stressors. Further analysis is required to estimate the groundwater exploitation with increasing demand and understand the impact of climate change. Additional studies are also required to design effective adaptation strategies, both for agriculture and other employment sectors.
Author Contributions
Conceptualization: S.H., P.K., A.M.; methodology: S.H., P.K.; formal analysis: S.H., P.K.; field investigation: S.H., P.K., K.D., R.D.; writing—original draft preparation: S.H., P.K.; writing—review and editing: S.H., P.K., K.D., R.D., A.M. All authors have read and agreed to the published version of the manuscript.
Funding
This work is supported by Asia Pacific Network for Global Change Research (APN) under Collaborative Regional Research Programme (CRRP) project with project reference number CRRP2019-01MY-Kumar.
Institutional Review Board Statement
Not applicable.
Informed Consent Statement
Not applicable.
Data Availability Statement
Not applicable.
Acknowledgments
The authors also appreciate the support from the people of Namkhana, Kakdwip and Patharpratima community development blocks during FGD.
Conflicts of Interest
The authors declare no conflict of interest.
References
- Biswas, A.K. History of Hydrology; North-Holland Publishing Company: Amsterdam, The Netherlands, 1970. [Google Scholar]
- Elshafei, Y.; Sivapalan, M.; Tonts, M.; Hipsey, M.R. A prototype framework for models of socio-hydrology: Identification of key feedback loops and parameterisation approach. Hydrol. Earth Syst. Sci. 2014, 18, 2141–2166. [Google Scholar] [CrossRef] [Green Version]
- WWAP. The United Nations World Water Development Report 2017: Wastewater, the Untapped Resource; WWAP (United Nations World Water Assessment Programme); UNESCO: Paris, France, 2017. [Google Scholar]
- Cicle of Blue Website. Available online: https://www.circleofblue.org/2018/world/groundwater-scarcity-pollution-set-india-on-perilous-course (accessed on 28 May 2021).
- Rockström, J.; Gordon, L. Assessment of green water flows to sustain major biomes of the world: Implications for future ecohydrological landscape management. Phys. Chem. Earth Part B Hydrol. Ocean. Atmos. 2001, 26, 843–851. [Google Scholar] [CrossRef]
- Ministry of Jal Shakti. Available online: https://pib.gov.in/PressReleasePage.aspx (accessed on 28 April 2021).
- Vörösmarty, C.J.; McIntyre, P.B.; Gessner, M.O.; Dudgeon, D.; Prusevich, A.; Green, P.; Glidden, S.; Bunn, S.E.; Sullivan, C.A.; Liermann, C.R.; et al. Global threats to human water security and river biodiversity. Nature 2010, 467, 555–561. [Google Scholar] [CrossRef] [PubMed]
- Wheeler, T.; Von Braun, J. Climate change impacts on global food security. Science 2013, 341, 508–513. [Google Scholar] [CrossRef]
- Bakken, T.H.; Modahl, I.S.; Raadal, H.L.; Bustos, A.A.; Arnøy, S. Allocation of water consumption in multipurpose reservoirs. Water Policy 2016, 18, 932–947. [Google Scholar] [CrossRef] [Green Version]
- Bryan, E.; Deressa, T.T.; Gbetibouo, G.A.; Ringler, C. Adaptation to climate change in Ethiopia and South Africa: Options and constraints. Environ. Sci. Policy 2009, 12, 413–426. [Google Scholar] [CrossRef]
- Hazra, S.; Ghosh, T.; DasGupta, R.; Sen, G. Sea level and associated changes in the Sundarbanss. Sci. Cult. 2002, 68, 309–321. [Google Scholar]
- Chowdhury, A.N.; Mondal, R.; Brahma, A.; Biswas, M.K. Culture and stigma: Ethnographic case studies of tiger-widows of Sundarbans Delta, India. World Cult. Psychiatry Res. Rev. 2014, 9, 99–122. [Google Scholar]
- Mandal, S.; Choudhury, B.U.; Satpati, L.N. Monsoon variability, crop water requirement, and crop planning for kharif rice in Sagar Island, India. Int. J. Biometeorol. 2015, 59, 1891–1903. [Google Scholar] [CrossRef]
- Solomon, S. IPCC (2007): Climate change the physical science basis. In AGU Fall Meeting Abstracts; Intergovernmental Panel on Climate Change (IPCC): Geneva, Switzerland, 2007; Volume 2007, p. U43D-01. [Google Scholar]
- Jakariya, M.; Alam, M.S.; Rahman, M.A.; Ahmed, S.; Elahi, M.L.; Khan, A.M.S.; Saad, S.; Tamim, H.M.; Ishtiak, T.; Sayem, S.M.; et al. Assessing climate-induced agricultural vulnerable coastal communities of Bangladesh using machine learning techniques. Sci. Total Environ. 2020, 742, 140255. [Google Scholar] [CrossRef]
- Bhadra, T.; Hazra, S.; Ray, S.S.; Barman, B.C. Assessing the groundwater quality of the coastal aquifers of a vulnerable delta: A case study of the Sundarbans Biosphere Reserve, India. Groundw. Sustain. Dev. 2020, 11, 100438. [Google Scholar] [CrossRef]
- World Bank Publications. Turn Down the Heat: Confronting the New Climate Normal; World Bank Publications: Herndon, VA, USA, 2014. [Google Scholar]
- Inam, A.; Adamowski, J.; Prasher, S.; Halbe, J.; Malard, J.; Albano, R. Coupling of a distributed stakeholder-built system dynamics socio-economic model with SAHYSMOD for sustainable soil salinity management. Part 2: Model coupling and application. J. Hydrol. 2017, 551, 278–299. [Google Scholar] [CrossRef]
- Vaghefi, S.A.; Mousavi, S.J.; Abbaspour, K.C.; Srinivasan, R.; Arnold, J.R. Integration of hydrologic and water allocation models in basin-scale water resources management considering crop pattern and climate change: Karkheh River Basin in Iran. Reg. Environ. Chang. 2015, 15, 475–484. [Google Scholar] [CrossRef]
- Yates, D.; Purkey, D.; Sieber, J.; Huber-Lee, A.; Galbraith, H.; West, J.; Herrod-Julius, S.; Young, C.; Joyce, B.; Rayej, M. Climate driven water resources model of the Sacramento Basin, California. J. Water Resour. Plan. Manag. 2009, 135, 303–313. [Google Scholar] [CrossRef]
- Hum, N.N.M.F.; Talib, S.A. Modeling water supply and demand for effective water management allocation in Selangor. J. Teknol. 2016, 78. [Google Scholar] [CrossRef] [Green Version]
- Al-Amin, S.; Berglund, E.Z.; Mahinthakumar, G.; Larson, K.L. Assessing the effects of water restrictions on socio-hydrologic resilience for shared groundwater systems. J. Hydrol. 2018, 566, 872–885. [Google Scholar] [CrossRef]
- Hoff, H.; Bonzi, C.; Joyce, B.; Tielbörger, K. A water resources planning tool for the Jordan River Basin. Water 2011, 3, 718–736. [Google Scholar] [CrossRef]
- Ospina-Noreña, J.E.; Gay-García, C.; Conde, A.C.; Sanchez-Torres Esqueda, G. Water availability as a limiting factor and optimization of hydropower generation as an adaptation strategy to climate change in the Sinú-Caribe river basin. Atmósfera 2011, 24, 203–220. [Google Scholar]
- Bharati, L.; Anand, B.K.; Smakhtin, V. Analysis of the Inter-Basin Water Transfer Scheme in India: A Case Study of the Godavari-Krishna link; (No. 614-2016-40883); International Water Management Institute: New Delhi, India, 2008. [Google Scholar]
- Das, K.; Mishra, A.K.; Singh, A.; Agrahari, S.; Chakrabarti, R.; Mukherjee, A. Solute exchanges between multi-depth groundwater and surface water of climatically vulnerable Gangetic delta front aquifers of Sundarbanss. J. Environ. Manag. 2021, 284, 112026. [Google Scholar] [CrossRef]
- Vogel, R.M.; Sieber, J.; Archfield, S.A.; Smith, M.P.; Apse, C.D.; Huber-Lee, A. Relations among storage, yield, and instream flow. Water Resour. Res. 2007, 43. [Google Scholar] [CrossRef]
- Yates, D.; Sieber, J.; Purkey, D.; Huber-Lee, A. WEAP21—A demand-, priority-, and preference-driven water planning model: Part 1: Model characteristics. Water Int. 2005, 30, 487–500. [Google Scholar] [CrossRef]
- Sahana, M.; Rehman, S.; Sajjad, H.; Hong, H. Exploring effectiveness of frequency ratio and support vector machine models in storm surge flood susceptibility assessment: A study of Sundarbans Biosphere Reserve, India. Catena 2020, 189, 104450. [Google Scholar] [CrossRef]
- Ghosh, A.; Mukhopadhyay, S. Quantitative study on shoreline changes and Erosion Hazard assessment: Case study in Muriganga–Saptamukhi interfluve, Sundarbans, India. Modeling Earth Syst. Environ. 2016, 2, 75. [Google Scholar] [CrossRef] [Green Version]
- Chaudhuri, A.B.; Choudhury, A. Mangroves of the Sundarbans. Volume 1: India; International Union for Conservation of Nature and Natural Resources (IUCN): Gland, Switzerland, 1994. [Google Scholar]
- Mukherjee, A.; Fryar, A.E.; Howell, P.D. Regional hydrostratigraphy and groundwater flow modeling in the arsenic-affected areas of the western Bengal basin, West Bengal. India. Hydrogeol. J. 2007, 15, 1397. [Google Scholar] [CrossRef]
- Mukherjee, A.; Fryar, A.E.; Thomas, W.A. Geologic, geomorphic and hydrologic framework and evolution of the Bengal basin, India and Bangladesh. J. Asian Earth Sci. 2009, 34, 227–244. [Google Scholar] [CrossRef]
- Das, K.; Mukherjee, A. Depth-dependent groundwater response to coastal hydrodynamics in the tropical, Ganges river mega-delta front (the Sundarbans): Impact of hydraulic connectivity on drinking water vulnerability. J. Hydrol. 2019, 575, 499–512. [Google Scholar] [CrossRef]
- Bhadra, T.; Das, S.; Hazra, S.; Barman, B.C. Assessing the demand, availability and accessibility of potable water in Indian Sundarbans biosphere reserve area. Int. J. Recent Sci. Res. 2018, 9, 25437–25443. [Google Scholar]
- Danda, A.A.; Rahman, M. Transformation of the Sundarbans Eco-region: Lessons from Past Approaches and Suggested Development Options. In The Sundarbanss: A Disaster-Prone Eco-Region; Springer: Cham, Switzerland, 2019; pp. 61–89. [Google Scholar]
- Mitra, A.; Gangopadhyay, A.; Dube, A.; Schmidt, A.C.; Banerjee, K. Observed changes in water mass properties in the Indian Sundarbans (northwestern Bay of Bengal) during 1980–2007. Curr. Sci. 2009, 97, 1445–1452. [Google Scholar]
- Sánchez-Triana, E.; Paul, T.; Ortolano, L.; Ruitenebeek, J. Building Resilience for the Sustainable Development of the Sundarbanss; Strategy Report No. 88061-1N; South Asia Region Sustainable Development Department Environment Water Resources Management Unit, The World Bank: Washington, DC, USA, 2014. [Google Scholar]
- DasGupta, R.; Hashimoto, S.; Okuro, T.; Basu, M. Scenario-based land change modelling in the Indian Sundarbans delta: An exploratory analysis of plausible alternative regional futures. Sustain. Sci. 2019, 14, 221–240. [Google Scholar] [CrossRef]
- Datta, D.; Chattopadhyay, R.N.; Deb, S. Prospective livelihood opportunities from the mangroves of the Sunderbans, India. Res. J. Environ. Sci. 2011, 5, 536. [Google Scholar]
- Sen, H.S.; Ghorai, D. The Sundarbanss: A flight into the wilderness. In The Sundarbanss: A Disaster-Prone Eco-Region; Springer: Cham, Switzerland, 2019; pp. 3–28. [Google Scholar]
- Ministry of Home Affairs, Government of India, Census Digital Library. Available online: https://censusindia.gov.in/DigitalLibrary/MapsCategory.aspx (accessed on 17 May 2020).
- Department of Planning Statistics [Govt. of West Bengal]. Available online: http://www.wbpspm.gov.in/publications/District%20Statistical%20Handbook (accessed on 26 May 2020).
- Phansalkar, S.J. Livestock-water interaction: Status and issues. In Proceedings of the 5th IWMI-Tata Annual Partners Meet, Gujarat, India, 8–10 March 2006. [Google Scholar]
- Central Groundwater Board Annual Report. Available online: http://cgwb.gov.in/reportspublished.html (accessed on 19 May 2020).
- Directorate of Economics and Statistics under the Supervision of Department of Agriculture, Cooperation and Farmers Welfare. Available online: https://eands.dacnet.nic.in/latest_20011.htm (accessed on 7 July 2020).
- Handbook of Fisheries Statistics. Available online: http://dof.gov.in/statistics (accessed on 14 June 2020).
- Kou, L.; Li, X.; Lin, J.; Kang, J. Simulation of urban water resources in Xiamen based on a WEAP model. Water 2018, 10, 732. [Google Scholar] [CrossRef] [Green Version]
- Javadinejad, S.; Ostad-Ali-Askari, K.; Eslamian, S. Application of multi-index ecision analysis to management scenarios considering climate change prediction in the Zayandeh Rud River Basin. Water Conserv. Sci. Eng. 2019, 4, 53–70. [Google Scholar] [CrossRef]
- Kumar, P.; Avtar, R.; Dasgupta, R.; Johnson, B.A.; Mukherjee, A.; Ahsan, M.N.; Nguyen, D.C.; Nguyen, H.Q.; Shaw, R.; Mishra, B.K. Socio-hydrology: A key approach for adaptation to water scarcity and achieving human wellbeing in large riverine islands. Prog. Disaster Sci. 2020, 8, 100134. [Google Scholar] [CrossRef]
- Popkin, B.M.; D’Anci, K.E.; Rosenberg, I.H. Water, hydration, and health. Nutr. Rev. 2010, 68, 439–458. [Google Scholar] [CrossRef]
- Dhawan, V. Water and agriculture in India. In Background Paper for the South Asia Expert Panel during the Global Forum for Food and Agriculture (GFFA). German Asia-Pacific Business Association, German Agri-Business alliance, TERI; 2017; Volume 28, Available online: https://www.oav.de/fileadmin/user_upload/5_Publikationen/5_Studien/170118_Study_Water_Agriculture_India.pdf (accessed on 26 March 2021).
- Macrotends Data. Available online: https://www.macrotrends.net/countries/IND/india/rural-population (accessed on 19 March 2021).
- India’s Population to Cross 152 Crore in Next 16 Years, More People Will Be of Working Age. Available online: https://theprint.in/india/indias-population-to-cross-152-crore-in-next-16-years-more-people-will-be-of-working-age/481018/ (accessed on 19 March 2021).
- World Bank Data. Available online: https://data.worldbank.org/indicator/SP.RUR.TOTL.ZS?locations=IN (accessed on 19 March 2021).
- Vikashpedia. Available online: https://vikaspedia.in/agriculture/agri-directory/reports-and-policy-briefs/20th-livestock-census (accessed on 2 April 2021).
- Masser, M.P.; Jensen, J.W.; Brunson, M.W. Calculating Area and Volume of Ponds and Tanks; Southern Regional Aquaculture Center: Stoneville, MI, USA, 1991. [Google Scholar]
- Toure, A.; Diekkrüger, B.; Mariko, A.; Cissé, A.S. Assessment of groundwater resources in the context of climate change and population growth: Case of the Klela Basin in Southern Mali. Climate 2017, 5, 45. [Google Scholar] [CrossRef]
- The Poultry Site, Broiler Water Consumption. Available online: https://www.thepoultrysite.com/articles/broiler-water-consumption (accessed on 3 April 2021).
- Water Consumption in Broiler. Available online: https://www.fivetanimalhealth.com/management-articles/water-consumption-broilers (accessed on 4 April 2021).
- Leal Filho, W.; Esilaba, A.O.; Rao, K.P.; Sridhar, G. Adapting African Agriculture to Climate Change: Transforming Rural Livelihoods; Springer: Berlin, Germany, 2015. [Google Scholar]
- PRS Legislative Research. Available online: https://prsindia.org/policy/analytical-reports/state-agriculture-india (accessed on 15 April 2021).
- Government of India. Some Characteristics of Agricultural Households in India; January–December 2013; National Sample Survey Office, Ministry of Statistics and Programme Implementation: Puram, India, 2015.
- Bhalla, G.S. Agricultural growth and regional variations. In India in a Globalising World: Some Aspects of Macro Economy, Agriculture and Poverty, Essays in Honour of Prof. C. H. Hanumantha Rao; Centre for Economic and Social Studies, And Academic Foundation: New Delhi, India, 2006; pp. 309–346. [Google Scholar]
- Mukherji, A.; Das, A. The political economy of metering agricultural tube wells in West Bengal, India. Water Int. 2014, 39, 671–685. [Google Scholar] [CrossRef]
- Yeoh, E.; Chu, K.M. Literacy, Education and Economic Development in Contemporary China. 2012. Available online: https://papers.ssrn.com/sol3/papers.cfm?abstract_id=2207559 (accessed on 8 April 2021).
- Bloom, D.E. Population Dynamics in India and Implications for Economic Growth; Working Paper no. 65; Harvard University: Cambridge, MA, USA, 2011; Available online: www.hsph.harvard.edu/pgda/WorkingPapers/2011/PGDA_WP_65.pdf (accessed on 8 April 2021).
- Labour Commissionerate, Labour Department, Government of West Bengal. Available online: https://wblc.gov.in/synopsys/January/2021 (accessed on 19 April 2021).
- Bhanja, S.N.; Mukherjee, A.; Rodell, M.; Wada, Y.; Chattopadhyay, S.; Velicogna, I.; Pangaluru, K.; Famiglietti, J.S. Groundwater rejuvenation in parts of India influenced by water-policy change implementation. Sci. Rep. 2017, 7, 1–7. [Google Scholar] [CrossRef] [Green Version]
- Dubey, S.K.; Chand, B.K.; Trivedi, R.K.; Mandal, B.; Rout, S.K. Evaluation on the prevailing aquaculture practices in the Indian Sundarbans delta: An insight analysis. J. Food Agric. Environ. 2016, 14, 133–141. [Google Scholar]
- Panori, A.; Psycharis, Y.; Ballas, D. Spatial segregation and migration in the city of Athens: Investigating the evolution of urban socio-spatial immigrant structures. Popul. Space Place 2019, 25, e2209. [Google Scholar] [CrossRef]
- Ghosh, A.; Schmidt, S.; Fickert, T.; Nüsser, M. The Indian Sundarbans mangrove forests: History, utilization, conservation strategies and local perception. Diversity 2015, 7, 149–169. [Google Scholar] [CrossRef]
- Dutta, D.; Das, P.K.; Paul, S.; Sharma, J.R.; Dadhwal, V.K. Assessment of ecological disturbance in the mangrove forest of Sundarbanss caused by cyclones using MODIS time-series data (2001–2011). Nat. Hazards 2015, 79, 775–790. [Google Scholar] [CrossRef]
Figure 1.
Location map of the study area, the Indian Sundarbans delta. The brown color signifies Zone I, the blue color designates Zone II and the green color represents Zone III.
Figure 1.
Location map of the study area, the Indian Sundarbans delta. The brown color signifies Zone I, the blue color designates Zone II and the green color represents Zone III.

Figure 2.
Flowchart of methodology (Blue color: Secondary data, Pink color: Hydrological data analysis in WEAP, Yellow color: Socio-economic parameter analysis, Grey color: Incorporation of results, Green color: Conclusion).
Figure 2.
Flowchart of methodology (Blue color: Secondary data, Pink color: Hydrological data analysis in WEAP, Yellow color: Socio-economic parameter analysis, Grey color: Incorporation of results, Green color: Conclusion).

Figure 3.
Hydrological simulation model in the study area (Sundarbans).

Figure 4.
(a) Gender-wise percentage of marginal worker population and (b) the percentage of cultivator population in the study area (blue bar—male, brown bar—female).
Figure 4.
(a) Gender-wise percentage of marginal worker population and (b) the percentage of cultivator population in the study area (blue bar—male, brown bar—female).

Figure 5.
Statistics of fisheries. (a) Represents the effective area for inland fisheries over the years in the study area. (b) Represents the number of persons involved in inland fisheries. (c) Representation of contribution of marine fisheries to total fish production in the study area over the years (1992–2018).

Figure 6.
Total groundwater demand under different scenarios in the study area.

Figure 7.
Domestic groundwater demand under different scenarios.

Figure 8.
Agricultural groundwater demand under different scenarios.

Figure 9.
Livestock groundwater demand under different scenarios.

Figure 10.
Zone-wise unmet demand under different scenarios.

Figure 11.
The monthly variation of groundwater demand in the study area.

Figure 12.
(a) Monthly rainfall amount in the study area, (b) Relationship between annual rainfall amount and changing groundwater level over the years (2004–2017) in the study area.
Figure 12.
(a) Monthly rainfall amount in the study area, (b) Relationship between annual rainfall amount and changing groundwater level over the years (2004–2017) in the study area.

Figure 13.
(a) Relationship between groundwater level (GWL) and cost of paddy production (2004–2017), (b) Relationship between annual rainfall and operational cost of paddy production (2013–2018), (c) Overall cost of paddy production over the years.
Figure 13.
(a) Relationship between groundwater level (GWL) and cost of paddy production (2004–2017), (b) Relationship between annual rainfall and operational cost of paddy production (2013–2018), (c) Overall cost of paddy production over the years.

Figure 14.
Relationship between literacy rate (percentage value) and agriculture-dependent population.
Figure 14.
Relationship between literacy rate (percentage value) and agriculture-dependent population.

Figure 15.
Overall trend of occupation shifting in the study area.

Figure 16.
The drivers of socio-economic trend/status under hydroclimatic context in the study area.
Figure 16.
The drivers of socio-economic trend/status under hydroclimatic context in the study area.


Table 1.
List of parameters considered for this study.
| Parameter | Value | Reference |
|---|---|---|
| Base year for modeling | 2011 | |
| End year for modeling | 2050 | |
| Human Population (cap) | 3,309,526 | Census India, 2011 [42] |
| Agricutural land irrigated by groundwater (Ha) | 26,000 | District statistical abstract [43] |
| Livestock Population (cap) | 4,082,384 | District statistical abstract [43] |
| Human population growth rate | 1.5% | Census India, 2011 [42] |
| Livestock population growth rate | 1% | District statistical abstract [43] |
| Agricultural worker (%) | 76% (1991), 56% (2001), 54% (2011) | Census India, 2011 [42] |
| Non-Agricultural worker (%) | 24% (1991), 44% (2001), 46% (2011) | Census India, 2011 [42] |
| Socioeconomic parameter (Literacy rate) | Described in Section 6.4 | Census India, 2011 [42] |
| Hydroclimatic parameters (rainfall, groundwater level) | Described in Section 6.2, Section 6.3 | Central Groundwater Board Annual Report [45] |
Table 2.
Table for initial parameters to set up model.
| Table for Initial Parameters to Set Up the Model | |||||||||
|---|---|---|---|---|---|---|---|---|---|
| Domestic | Agriculture | Livestock | |||||||
| Zone I | Zone II | Zone III | Zone I | Zone II | Zone III | Zone I | Zone II | Zone III | |
| Annual Activity | 1,008,653 (no.) | 1,140,562 (no) | 1,160,311 (no.) | 8000 (Ha) | 5000 (Ha) | 13,000 (Ha) | 1,301,355 (no.) | 1,622,139 (no.) | 1,158,890 (no.) |
| Annual water use | 14.5 (m3) | 14.5 (m3) | 14.5 (m3) | 10,000 (m3) | 10,000 (m3) | 10,000 (m3) | 5 (m3) | 5 (m3) | 5 (m3) |
| Consumption | 25% | 25% | 25% | 80% | 80% | 80% | 25% | 25% | 25% |
Table 3.
Table of sector-wise groundwater demand (in mcm) in 2050 (HGR—High growth rate, LGR—Low growth rate).
Table 3.
Table of sector-wise groundwater demand (in mcm) in 2050 (HGR—High growth rate, LGR—Low growth rate).
| Zone 1 | Zone 2 | Zone 3 | |||||||
|---|---|---|---|---|---|---|---|---|---|
| Reference | HGR | LGR | Reference | HGR | LGR | Reference | HGR | LGR | |
| Domestic | 26.13 | 31.65 | 21.55 | 35.8 | 43.32 | 24.38 | 68.24 | 124.72 | 34.08 |
| agriculture | 67.2 | 67.2 | 67.2 | 42 | 42 | 42 | 109.2 | 109.2 | 109.2 |
| Livestock | 15.25 | 15.25 | 10.38 | 12.44 | 12.44 | 12.44 | 13.1 | 13.1 | 13.1 |
| Total | 108.58 | 114.1 | 99.13 | 90.24 | 97.76 | 78.82 | 190.54 | 247.02 | 156.38 |
Table 4.
Table of sector-wise groundwater unmet demand (in mcm) in 2050.
| Zone 1 | Zone 2 | Zone 3 | |||||||
|---|---|---|---|---|---|---|---|---|---|
| Reference | HGR | LGR | Reference | HGR | LGR | Reference | HGR | LGR | |
| Domestic | 12.14 | 21.45 | 10.55 | 15.8 | 21.45 | 12.8 | 18.5 | 30.7 | 16.46 |
| agriculture | 34.2 | 37.6 | 32.44 | 24.45 | 26.65 | 21.38 | 69.52 | 73.16 | 66.33 |
| Livestock | 7.65 | 8.45 | 6.84 | 5.25 | 5.82 | 4.97 | 4.65 | 4.65 | 4.65 |
| Total | 53.99 | 67.5 | 49.83 | 45.5 | 53.92 | 39.15 | 92.67 | 108.51 | 87.44 |
Publisher’s Note: MDPI stays neutral with regard to jurisdictional claims in published maps and institutional affiliations. |
© 2021 by the authors. Licensee MDPI, Basel, Switzerland. This article is an open access article distributed under the terms and conditions of the Creative Commons Attribution (CC BY) license (https://creativecommons.org/licenses/by/4.0/).
Share and Cite
MDPI and ACS Style
Halder, S.; Kumar, P.; Das, K.; Dasgupta, R.; Mukherjee, A. Socio-Hydrological Approach to Explore Groundwater–Human Wellbeing Nexus: Case Study from Sundarbans, India. Water 2021, 13, 1635. https://doi.org/10.3390/w13121635
AMA Style
Halder S, Kumar P, Das K, Dasgupta R, Mukherjee A. Socio-Hydrological Approach to Explore Groundwater–Human Wellbeing Nexus: Case Study from Sundarbans, India. Water. 2021; 13(12):1635. https://doi.org/10.3390/w13121635
Chicago/Turabian StyleHalder, Soham, Pankaj Kumar, Kousik Das, Rajarshi Dasgupta, and Abhijit Mukherjee. 2021. "Socio-Hydrological Approach to Explore Groundwater–Human Wellbeing Nexus: Case Study from Sundarbans, India" Water 13, no. 12: 1635. https://doi.org/10.3390/w13121635
Note that from the first issue of 2016, this journal uses article numbers instead of page numbers. See further details here.