Article

Estimating Surface and Groundwater Irrigation Potential under Different Conservation Agricultural Practices and Irrigation Systems in the Ethiopian Highlands

1
Faculty of Civil and Water Resource Engineering, Bahir Dar Institute of Technology, Bahir Dar University, Bahir Dar P.O. Box 26, Ethiopia
2
Faculty of Chemical and Food Engineering, Bahir Dar Institute of Technology, Bahir Dar University, Bair Dar P.O. Box 26, Ethiopia
3
Sustainable Intensification Innovation Lab and Department of Agronomy, Kansas State University, Manhattan, KS 66506, USA
*
Author to whom correspondence should be addressed.
Water 2021, 13(12), 1645; https://doi.org/10.3390/w13121645
Submission received: 20 April 2021 / Revised: 2 June 2021 / Accepted: 9 June 2021 / Published: 11 June 2021

Abstract

:
This study was conducted at the Dangishta watershed in the Ethiopian highlands to evaluate irrigation potential from surface and groundwater sources under different farming and water application systems. Daily streamflow and the groundwater table were monitored from 2015 to 2017. Shallow groundwater recharge was estimated using the water table fluctuation method. Automated baseflow separation techniques were used to determine the amount of runoff and baseflow from the total streamflow records. The potential of groundwater and runoff to sustain dry season irrigation (i.e., low flow) was evaluated considering two tillage systems (i.e., conservation agriculture, CA; and conventional tillage, CT), and water application (i.e., drip and overhead) systems for major irrigated crops (i.e., onion, garlic, cabbage, and pepper) grown in the Dangishta watershed. We found that the annual groundwater recharge varied from 320 to 358 mm during the study period, which was about 17% to 22% of the annual rainfall. The annual surface runoff depth ranged from 192 to 268 mm from 2015 to 2017. The results reveal that the maximum seasonal irrigable land from groundwater recharge was observed under CA with drip irrigation (i.e., 2251 and 2992 ha from groundwater recharge and surface runoff, respectively). By comparison, in the CT practice with overhead irrigation, the lowest seasonal irrigable land was observed (i.e., 1746 and 2121 ha from groundwater and surface runoff, respectively). From the low flow analysis, about 199 and 173 ha of one season’s irrigable land could be irrigated using the CA and CT systems, respectively, both with drip irrigation. Similarly, two-season overhead irrigation potential from low flow under CA and CT was found to be about 87 and 76 ha, respectively. The dry season irrigable land using low flow could be increased from 9% to 16% using the CA system for the various vegetables, whereas drip irrigation could increase the irrigable land potential by 56% compared to overhead irrigation. The combined use of groundwater recharge and runoff could sustain up to 94% of the dry season low flow irrigation through the combination of the CA system and drip irrigation. Decision makers must consider the introduction of feasible and affordable technologies to make use of groundwater and direct runoff, to maximize the potential of dry season production through efficient and appropriate CA and water management practices.

1. Introduction

Agriculture is the main source of livelihoods in Ethiopia [1,2,3,4], where rainfed production is predominantly practiced [5,6]. However, rainfed agriculture is challenged by climate change and, in particular, prolonged dry seasons and insufficient rainfall during crop production periods, leading to food insecurity in the region [7,8,9]. Due to these challenges, irrigation is an alternative strategy to overcome food shortages [10] and improve the living standards of smallholder farmers in Ethiopia [4,11,12]. Ethiopia has abundant water resources suitable for irrigation [13,14,15] but smallholder farmers continue to face challenges of water scarcity leading to low crop productivity [16]. Awlachew and Ayana [17] reviewed master plan studies and river basin surveys, and reported that of 5.7 million hectares (M ha) of potentially irrigable land in Ethiopia, 3.7 M ha could be developed using surface water sources, and 1.6 M ha using groundwater and rainwater management. Irrigation demand using surface water sources could be met by harvesting surface runoff and using the low flow of the river system. In areas where the low flow is minimal but abundant subsurface resources exist, groundwater is an alternative means to sustain dry season irrigation to maximize food production and reduce water scarcity in the region. In addition, the use of water-saving technologies and practices, and wisely selecting cropping patterns based on water demand, would help in the efficient practice of agriculture. Compared to surface water, groundwater is a reliable resource to combat climate change and is the best alternative to sustain irrigation [14,18]. However, the irrigation sector is constrained by a lack of irrigation infrastructure and access to irrigation water [19].
Worqlul et al. [14] estimated around 8% of the potentially irrigable land in Ethiopia can be irrigated using shallow groundwater, based on groundwater depth and borehole yield maps from the British Geological Survey (BGS). This indicates the need to exploit the potential of groundwater recharge to maximize irrigated crop production. Various studies have evaluated groundwater recharge potential in Ethiopian highlands [20,21,22,23,24,25] using different methods (e.g., water balance, water table fluctuations, and empirical models). The water table fluctuation method is a widely used approach to quantify groundwater recharge from time series of groundwater level records taken from unconfined aquifers [26]. The method has limitations in extrapolating results to zones with little observation data. Groundwater recharge was estimated to vary from 284 to 456 mm/y at the same watershed using a SWAT model [6]. By comparison, in the same region, higher annual groundwater recharge rates of 760 mm [27] and 814 mm [20] were reported using the water table fluctuation method due to a high estimation of specific yield, which may have been caused by a non-constant pumping rate, because a pumping recovery test was used to estimate the specific yield. Groundwater levels from shallow wells decrease in dry spells (by 27% on average) resulting in water shortages, and thus harvesting runoff from the rainy season can provide support to sustain irrigation in the dry season. Reasonable direct runoff estimates can be obtained using various techniques: manual separation [28], isotopic tracers [29], and mass balance [30] are commonly used approaches. Arnold et al. [31] suggested automated base flow separation techniques to quantify direct runoff, which is affected by runoff generation mechanisms [32,33,34]. In the highlands of Ethiopia, the saturation excess runoff mechanism (i.e., the rainfall intensity is mostly exceeded by the infiltration rate of the soil) is the dominant process [35].
Small-scale irrigation in combination with efficient soil and water management practices are being implemented in the Ethiopian highlands. In comparison with farmer’s traditional practices (e.g., tillage, no soil cover, monocropping, and overhead irrigation), conservation agriculture practices (e.g., minimal soil disturbance without tillage, year-round permanent organic soil mulch cover, crop rotation, and improved irrigation methods) have been tested and shown to be a means of improving water productivity [13,36,37,38,39,40,41,42]. In addition, when evaluated against farmers’ traditional overhead irrigation methods, drip irrigation systems significantly improved water saving (18% to 28%), yields (9% to 56%), and water productivity (33% to 120%) for a range of vegetables (onion, cabbage, garlic, and pepper) when managed by conservation agriculture rather than conventional tillage practice [37,40]. Conservation agriculture (CA) and drip irrigation systems are efficient in improving water saving, soil fertility, and, consequently, productivity in the Ethiopian highlands. To ensure many smallholder farmers can benefit from irrigation, it is essential to utilize the maximum irrigation water potential for production. However, accurate estimation of irrigation water availability from surface and groundwater sources considering efficient CA and irrigation systems is lacking in the region. Therefore, the objectives of this study were to (1) estimate irrigation water availability considering low flow, direct runoff, and groundwater recharge; (2) evaluate the CA system for improving irrigation water availability compared to farmers’ traditional tillage method; and (3) evaluate drip irrigation for improving irrigation water availability compared to farmers’ overhead irrigation systems. In addition, the combined potential of CA and drip irrigation farming systems was analyzed. The evidence from this study will assist local government and decision makers to expand small-scale irrigation that can benefit smallholder farmers.

2. Study Area

This study was conducted in the Dangishta watershed (size of 5700 ha) of the Ethiopian highlands. Dangishta (Figure 1) is located about 80 km southwest of Bahir Dar city at a latitude ranging from 11.14 to 11.33° N, and longitude ranging from 36.83 to 36.90° E. The altitude of the watershed ranges from 2037 to 2436 m above sea level. The climate is sub-tropical with a range of annual rainfall from 1500 to 2000 mm recorded during the period of the study (2015 to 2017). In the study region, the wet season refers to June to September, whereas the dry season refers to October to May. The average temperatures during the study period ranged from 10 to 25 °C. Agriculture is the dominant land use in the watershed covering ~75% of the land, and clay soil is the predominant soil type. Walker et al. [20] noted that the area is endowed with subsurface water resource potential. Hand-dug wells are constructed by farmers and provide service for domestic use and occasionally for irrigating vegetable home gardens. Dry season irrigated production is practiced twice a year: October to February and March to June, depending on the water level and recharge. Farmers grow vegetables (e.g., onion (Alium cepa), garlic (Allium sativum), cabbage (Brassica oleracea), potato (Solanum tuberosum), tomato (Solanum lycopersicum), and pepper (Capsicum annuum)) in the dry season and cereal crops (e.g., maize (Zea mays), teff (Eragrostis tef), sorghum (Sorghum bicolor), and millet (Pennisetum glaucum)) during the rainy season.

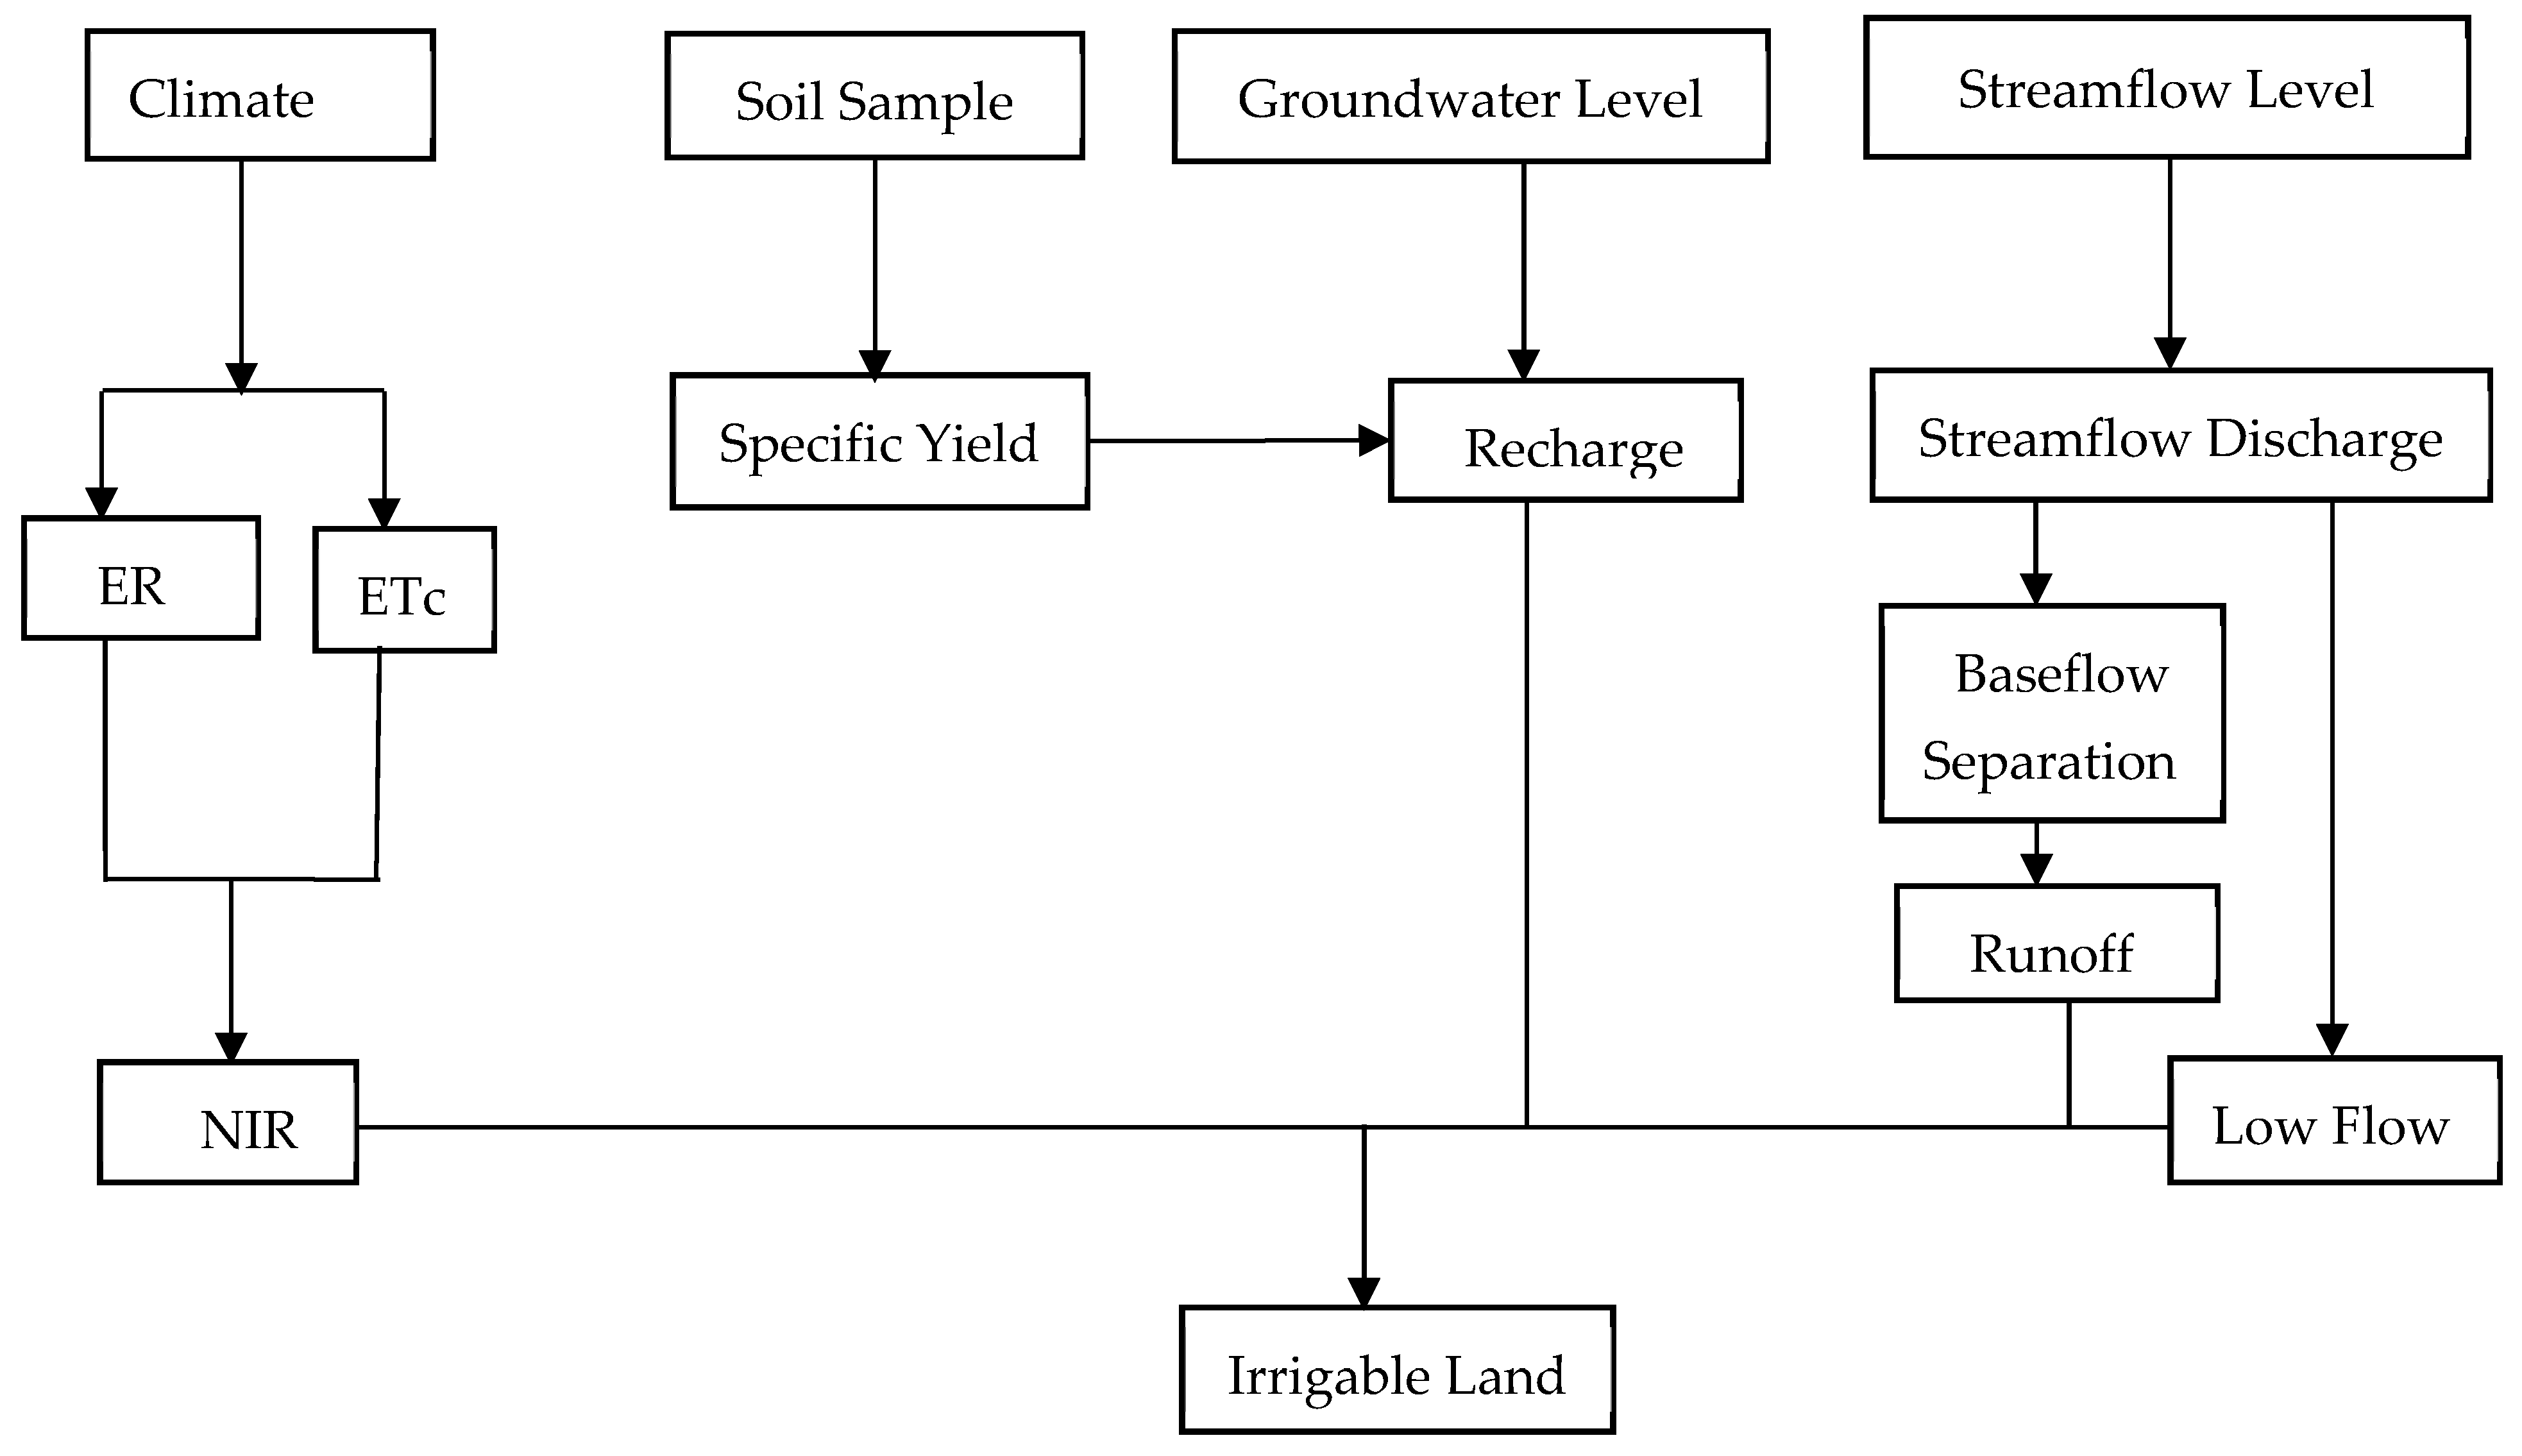
3. Materials and Methods

This study identified the potential irrigable area in the Dangishta watershed from low flow (90 percentile flow), groundwater recharge, and direct runoff. Streamflow stage at the watershed outlet and groundwater level from 23 monitoring wells located within the watershed were recorded on a daily basis. Data were recorded from 2015 to 2017 at various locations in the watershed, as shown in Figure 1. Irrigation potential analysis was conducted considering the CA system (minimum soil disturbance without tillage, year-round organic mulch cover, and crop rotation) and farmers’ conventional tillage (CT) practices (traditional tillage with a hand tool, no organic mulch cover, and crop rotation) with drip water application and overhead irrigation using a watering can (Figure 2).

3.1. Groundwater Recharge Estimation

A total of 23 groundwater wells were monitored (Figure 1) for water level fluctuations during the study period (2015 to 2017). The depth of monitoring wells ranged from 3 to 21 m. The monitoring wells were constructed by the local farmers manually using a local drill material called “Dengora”. To prevent the entry of sediments and unwanted materials into the wells, the local people covered the tops of wells with a cover made from iron. Groundwater level was recorded on a daily basis using a non-sounder deep meter scale each day in the early morning before farmers started to extract water. The local people used the groundwater for household water supply and to some extent for irrigation of vegetables, using a manual rope and bucket water-lifting system. The daily groundwater recharge was estimated using the water level fluctuation (WTF) method [26]. The WTF method uses a specific yield of the aquifer and water level fluctuation to estimate groundwater recharge, as shown in Equation (1). This method assumes groundwater level rises in unconfined aquifers are caused by recharge and uncertainty exists regarding the estimation of specific yield. Pumping-induced phenomena also affect the groundwater recharge estimation and need to be carefully examined.
R = S y × ( Δ h / Δ t )
where R, Sy, h, and t are recharge (mm), specific yield (dimensionless), water table height (m), and time, respectively. Δ h / Δ t . was computed by subtracting the daily water level records. The antecedent recession was not considered in the computation.
In this study, the specific yield was determined by taking depth-integrated soil samples (up to 3 m) using two methods, namely: the pressure plate method and the standing tube method, using a tube with a diameter of 10 cm and a height of 50 cm. The standing tube approach determines the specific yield from the gravimetric moisture content difference between the soil at saturation and the moisture content retained by the soil sample in a standing tube after it was left to drain from saturation for two weeks without evaporation [43,44]. In the pressure plate approach, the moisture content difference between the soil at saturation and the retained moisture content in the soil after 0.33 bar pressure was taken as a specific yield. Finally, an average specific yield was taken to determine groundwater recharge.

3.2. Direct Runoff Estimation

Streamflow level was recorded daily at the outlet of Brantie river (Dangishta watershed) from 2015 to 2017 using a manual staff gauge. In addition, event runoff (streamflow stages for each storm event) was collected to capture the peak discharge at 10 min intervals during each rainfall event. The flow velocity was measured using a floating method and 0.9 of the value was considered an average velocity [45]. The river cross-section was obtained by taking chainage and elevation measurements up to the maximum flood mark. The river cross-sectional area was multiplied by average flow velocity to determine the streamflow discharge. A flow rating curve (stage–discharge relationship) was developed for the river and used to determine streamflow discharge using the daily stage records. The base flow recursive digital filter program [46,47,48,49] was used to separate the direct runoff from the stream flow, as shown in Equation (2).
q t = β q t 1 + [ 1 + β 2 ] × ( Q t Q t 1 ) .  
where qt is the filtered surface runoff at the t time step, Qt is the original streamflow, and β is the filter parameter which is taken as 0.925. Q t 1 is the streamflow at time t−1. Then, base flow bt was calculated as shown in Equation (3). The filter passed over the streamflow data three times (forward, backward, and forward), maintaining the filter parameter at 0.925 as reported by Nathan and McMahon [47]. The filter parameter of 0.925 was determined to give realistic results with the manual separation techniques from the sample size of 186 with a coefficient of determination (R2 = 0.94) and standard error of 0.05. According to Nathan and McMahon [47], the value of the filter parameter that yields the most acceptable baseflow separation was reported to be in the range of 0.9 to 0.95 and, among the range of values, 0.925 would appear the most appropriate and was used to separate the baseflow.
b t = Q t q t
The surface runoff generated in the watershed was computed by subtracting the base flow from the streamflow as shown in Equation (2). The interflow component was included in the surface runoff. The rate of runoff was changed to volume and divided by the net irrigation requirement to determine the potentially irrigable land from runoff potential for the dominant irrigated vegetables (e.g., onion, garlic, cabbage, pepper) cultivated in the Dangishta watershed.

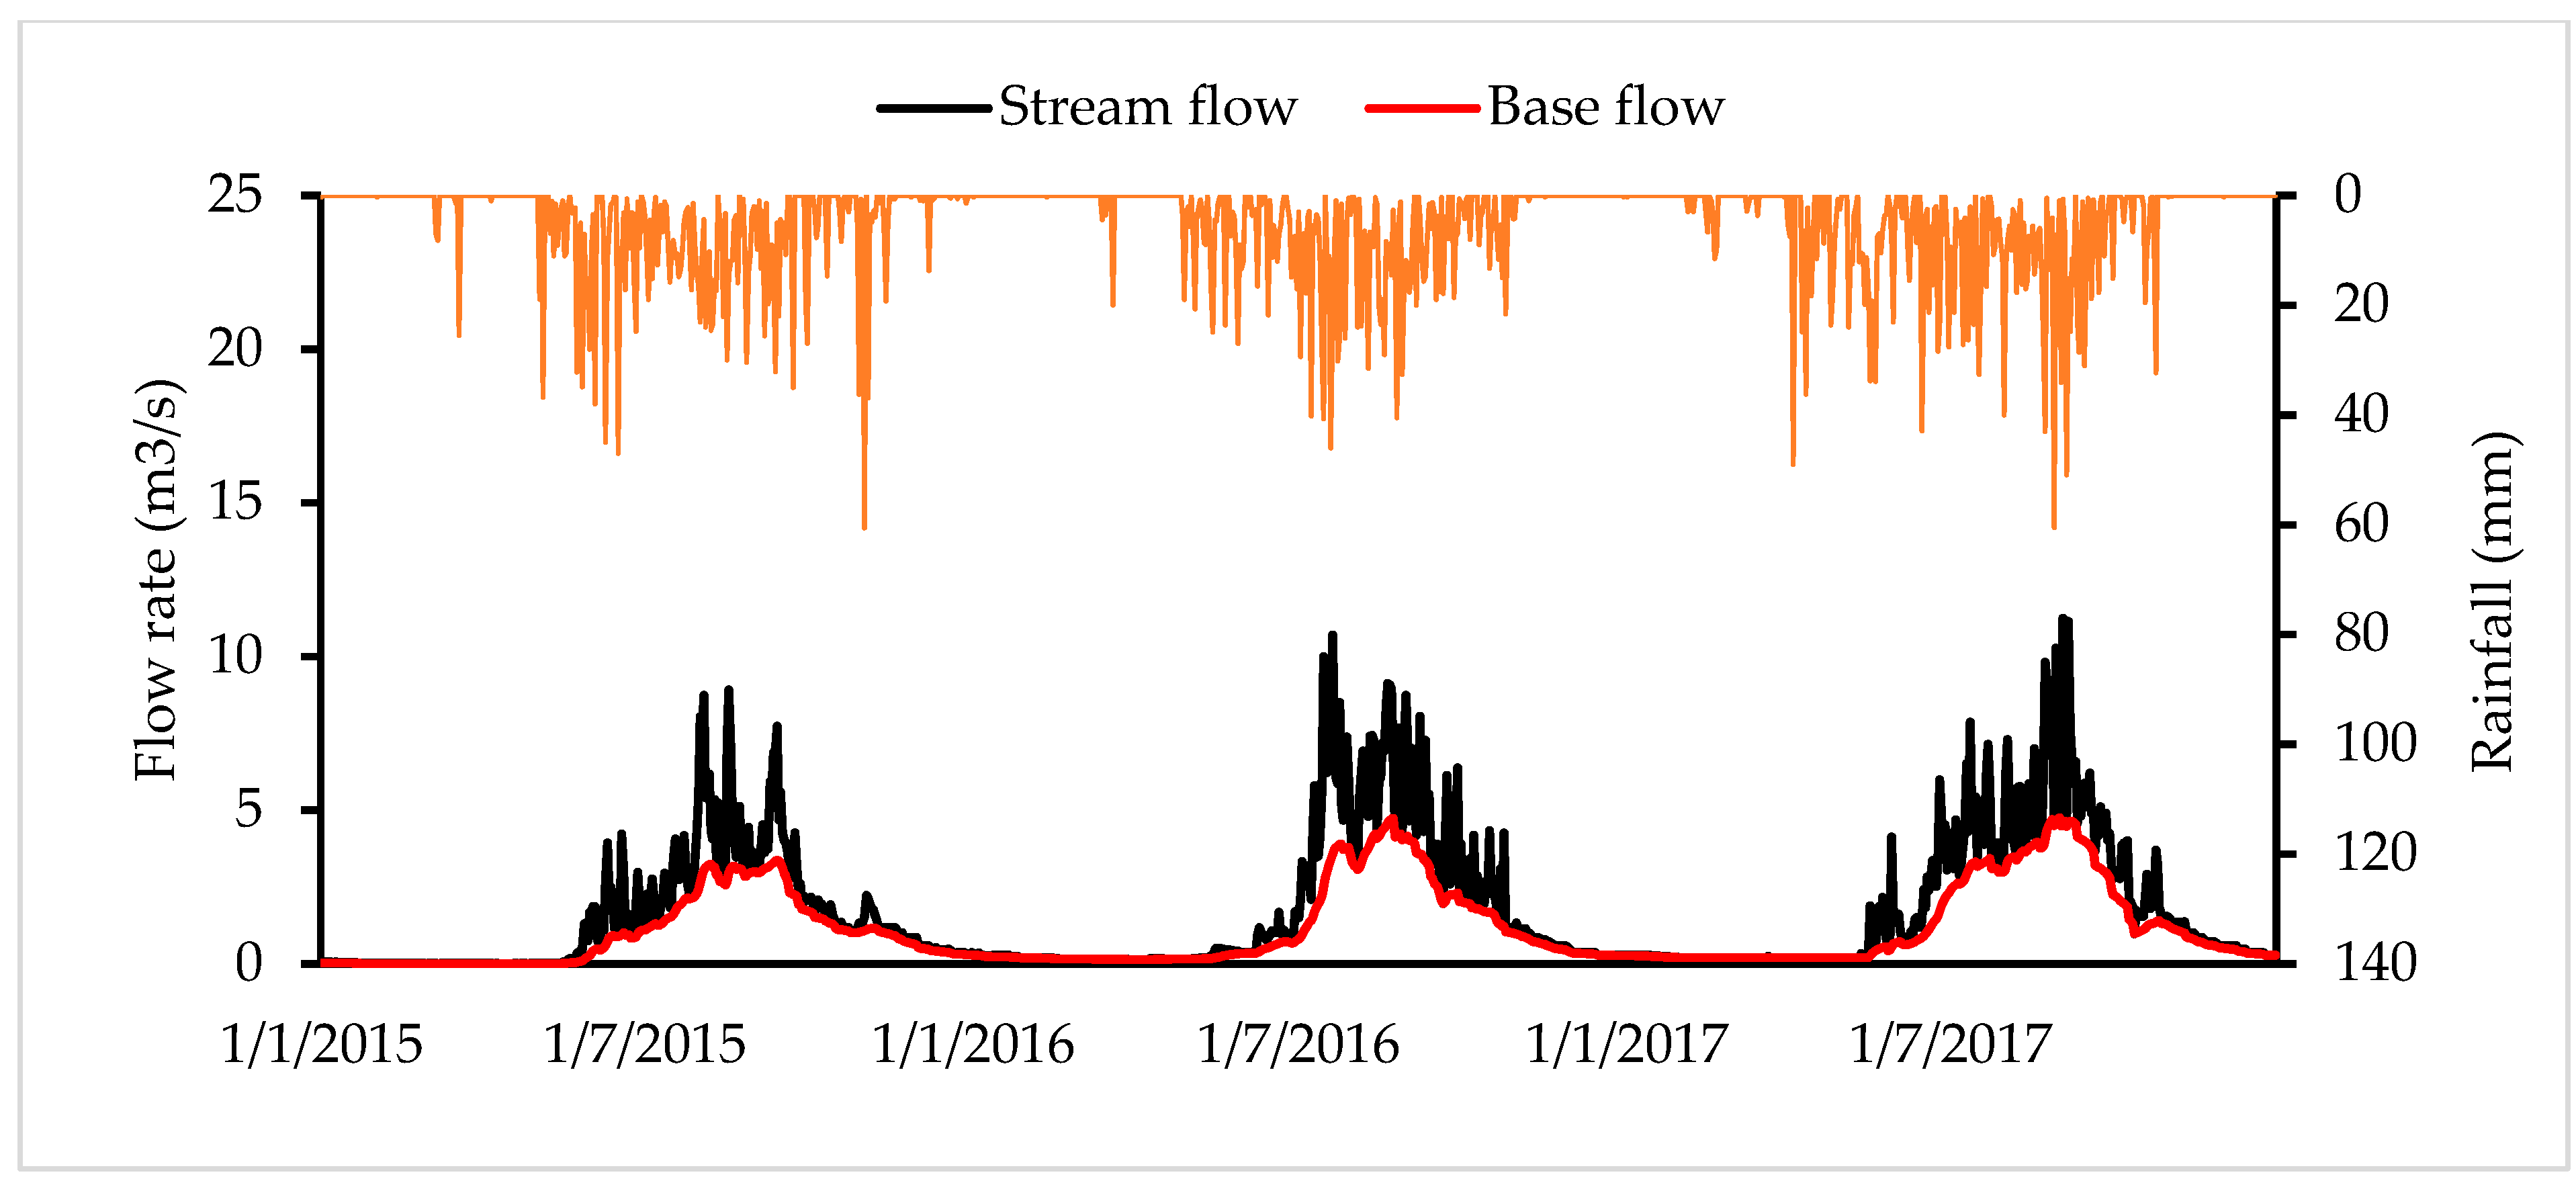
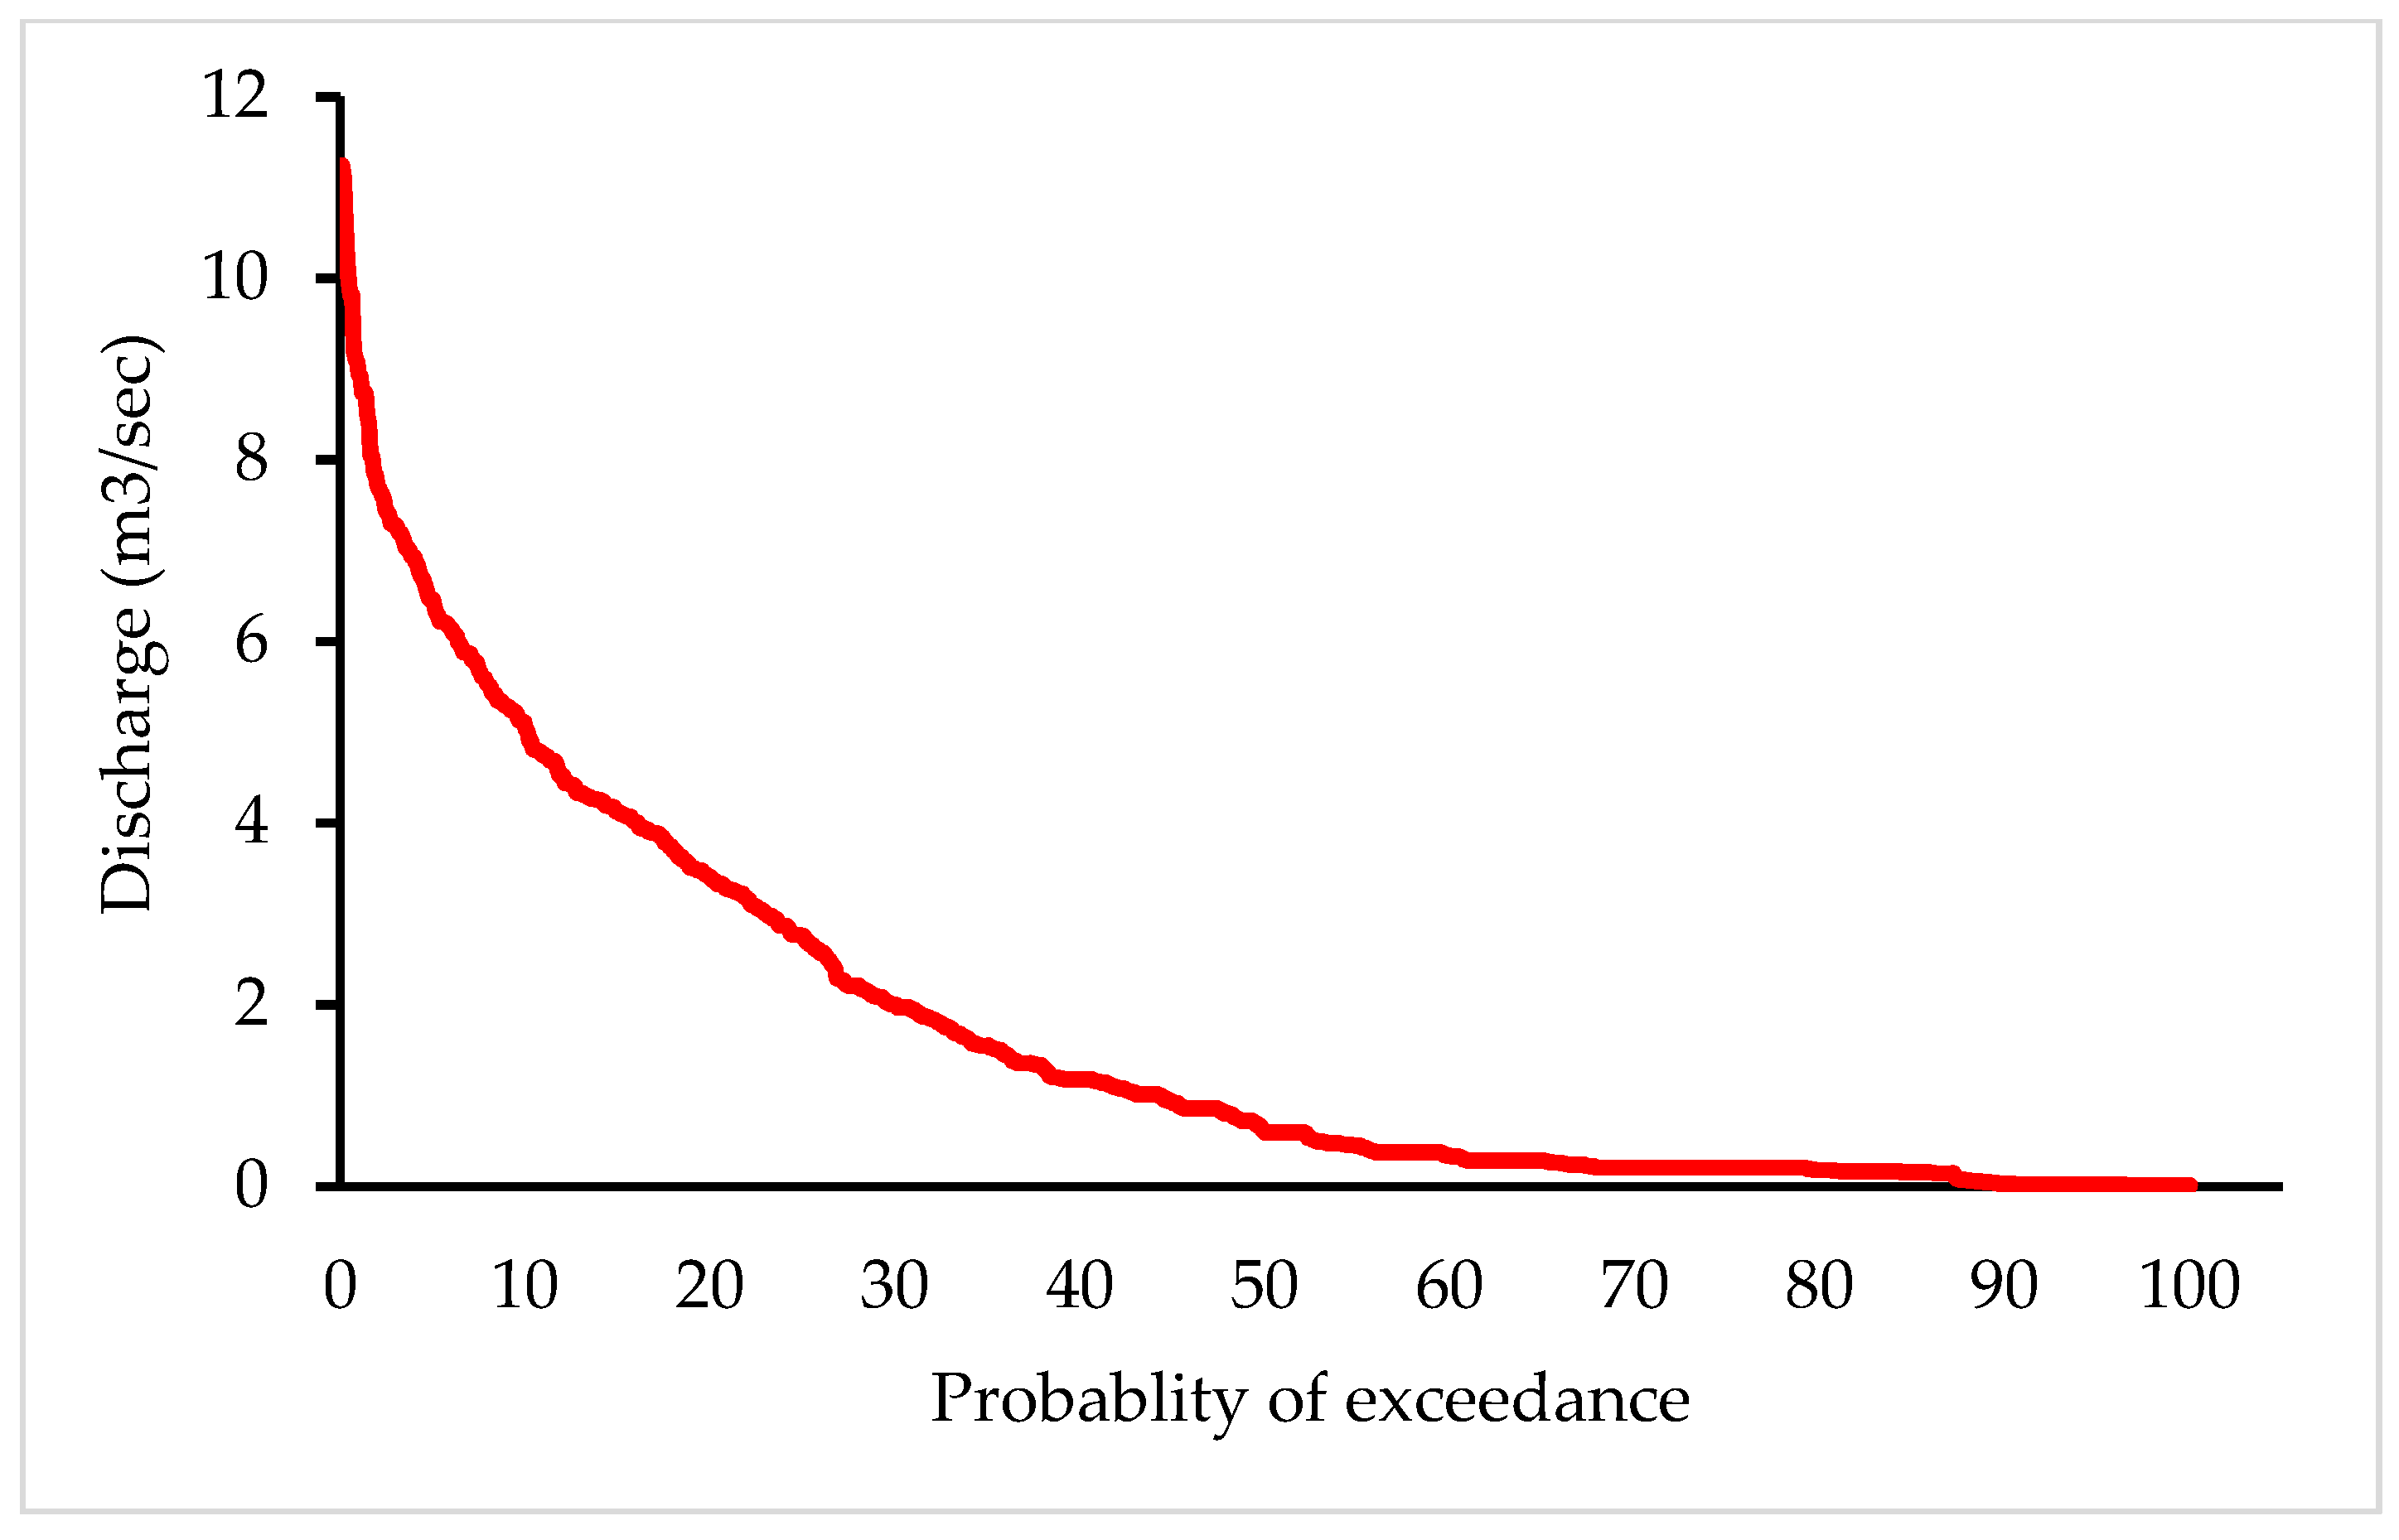
3.3. Low Flow Estimation

The low flow was estimated from the daily streamflow records collected from 2015–2017. The daily streamflow discharge was arranged in descending order and ranked accordingly. The probability of exceedance was computed and plotted against the daily streamflow discharge. The minimum flow was fixed at the 90-percentile flow according to Worqlul et al. [15] and changed to volume to estimate its potential for dry season irrigation.

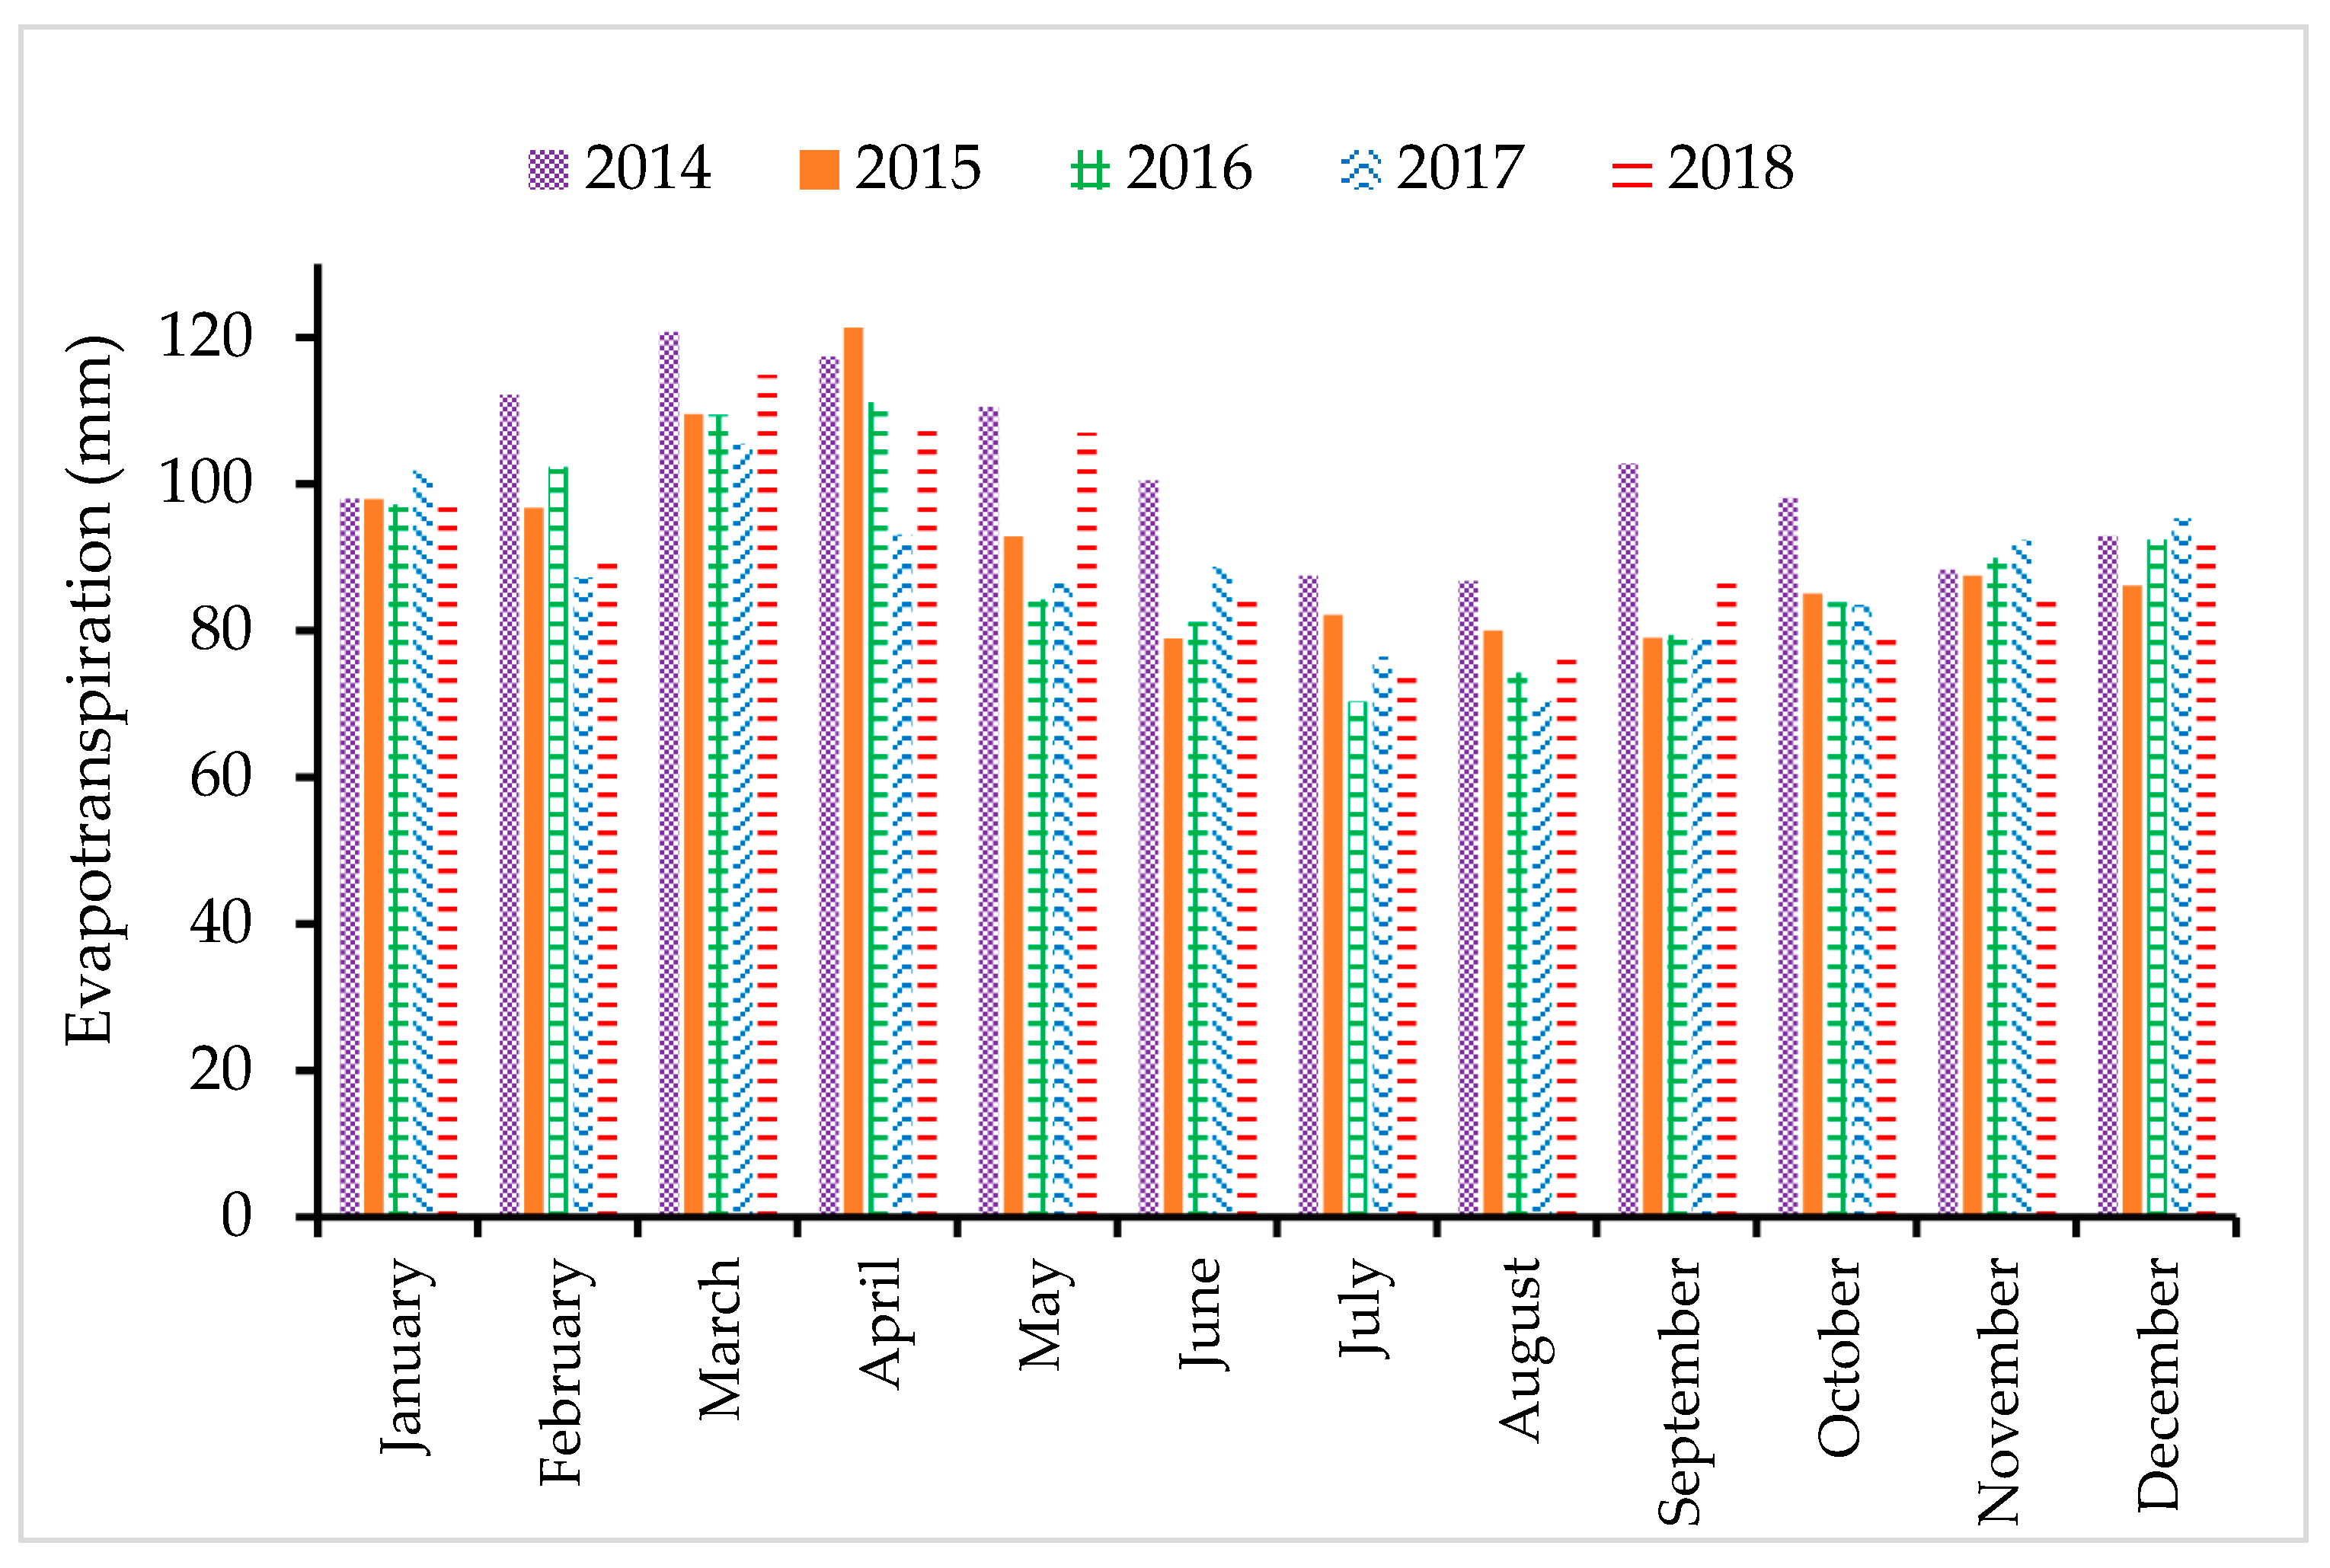
3.4. Evapotranspiration Estimation (ETo)

Climatic data (i.e., rainfall, wind speed, sunshine hours, relative humidity, maximum and minimum temperature) were obtained from the Ethiopian National Meteorological Agency (ENMA) for the town of Dangila (which is close to Dangishta watershed) from 2014 to 2018 on a daily basis. The reference evapotranspiration (ETo) was computed using the Penman–Monteith method [50] as shown in Equation (4).
E T o = 0.408 Δ ( R n G ) + γ 900 T + 273   u 2 ( e s e a ) Δ + γ ( 1 + 0.34 u 2 ) .  
where ETo, Rn, G, T, u2, es, ea, Δ, γ are reference evapotranspiration (mm day−1), net radiation at the crop surface (MJ m−2 day−1), soil heat flux density (MJ m−2 day−1), air temperature (°C), wind speed at height of 2 m (m s−1), saturation vapor pressure (KPa), actual vapor pressure (KPa), slope vapor pressure curve (KPa °C−1), and psychometric constant (KPa °C−1), respectively.

3.5. Crop Evapotranspiration (ETc)

Consumptive use of crops (ETc) was computed using Equation (5) for vegetable crops grown in the Dangishta watershed. The crop coefficient of the dominant vegetables was developed by Yimam et al. [37] considering the various growth stages for CA and CT systems under drip irrigation conducted on experimental plots with a size of 10 by 10 m, replicated ten times. Then consumptive use was computed using Equation (5).
E T c = K c × E T o
where Kc, ETc, and ETo are crop coefficient, crop evapotranspiration, and reference evapotranspiration, respectively.

3.6. Estimation of Potential Irrigable Land

This analysis was undertaken for CA and CT systems, considering overhead and drip irrigation water application techniques. About 90% water application efficiency can be obtained from drip irrigation [51], whereas 80% application efficiency is attained using traditional overhead irrigation in Ethiopia [38]. The potential of low flow for irrigation was computed as the quotient of low flow volume and net irrigation requirement. Net irrigation requirement for overhead irrigation was computed using Equation (6) for 20% inefficiency; for drip irrigation techniques, net irrigation requirement was computed for 10% inefficiency as shown in Equation (7). The effect of CA and CT systems on irrigation requirements was compensated for by the crop coefficient in Equations (6) and (7) developed by Yimam et al. [37] for major vegetables.
NIR = 1.2 ×   Kc   ×   ETo ER  
NIR = 1.1 ×   Kc   ×   ETo ER  
( E R = 0.8 × P 25 ,     P > 75 m m / m o n t h     E R = 0.6 × P 10 ,     P < 75 m m / m o n t h )
where NIR, Kc, ETo, ER, Pe, and P, are net irrigation requirement, crop coefficient, evapotranspiration, effective rainfall, and rainfall, respectively. Kc is unitless whereas all other units are in mm.
The amount of groundwater recharge that is usable to meeting the irrigation demand is hereafter called net annual groundwater recharge. The net annual groundwater was estimated by deducting the groundwater abstraction for household consumption and cattle use, and also the contribution of recharge to the streamflow. Eshete et al. [52] reported up to 1% of groundwater recharge in the Dangishta watershed was abstracted for household consumption and cattle use. Tilahun et al. [25] stated for proper planning of dry season irrigation using groundwater, the amount of baseflow should be accounted for. Research undertaken on the upper Blue Nile, Ethiopia, by Asmerom et al., 2008 [53] stated that 15% of the annual total flow observed at the watershed outlet comes from shallow aquifers, which was determined using recursive digital filters and a physical BASF model. Therefore, net annual groundwater recharge for irrigation was computed as the difference between baseflow and abstraction from the potential groundwater recharge estimated using the water table fluctuation method. The potential irrigable land estimated from shallow groundwater recharge was computed as the quotient of net annual groundwater recharge volume to net irrigation requirement. The groundwater recharge volume was computed by multiplying the annual recharge computed by water level fluctuation with the area of the watershed underlining the aquifer. The area of the watershed underlining the aquifer was estimated using the parametric efficient distributed model (PED) according to Tilahun et al. [25], and we considered 87% of the watershed to be an aquifer area. The parametric efficient distributed (PED) hydrological model was developed specifically for hillslope watersheds of monsoon climate [54]. The model assumes that in the upper portions of the watershed where bedrock is exposed, the degraded part is potentially generating overland flow. This area is periodically saturated and the perched groundwater table can be found during rain, whereas the portion of the watershed that underlines the aquifer is sufficiently conductive so that rainfall infiltrates to the aquifer plus the formation of lateral flow that is lost as interflow. This model has been validated and used in the Ethiopian highlands [54,55,56]. Similarly, the potential of runoff for irrigation was estimated considering evaporation losses. According to Jensen [57], 10% evaporation loss can be assumed for a depth of open water bodies from 0.5 to 2 m. Thus, 90% of the runoff was taken as net runoff potential. Finally, the net runoff volume was divided by the net irrigation requirement to determine potentially irrigable land from runoff sources.

4. Results

We present the potential of net groundwater recharge, direct runoff, and low flow, and crop evapotranspiration for major vegetables cultivated in the region. The potential irrigable land estimated under CA and CT systems, and drip and overhead irrigation are shown.

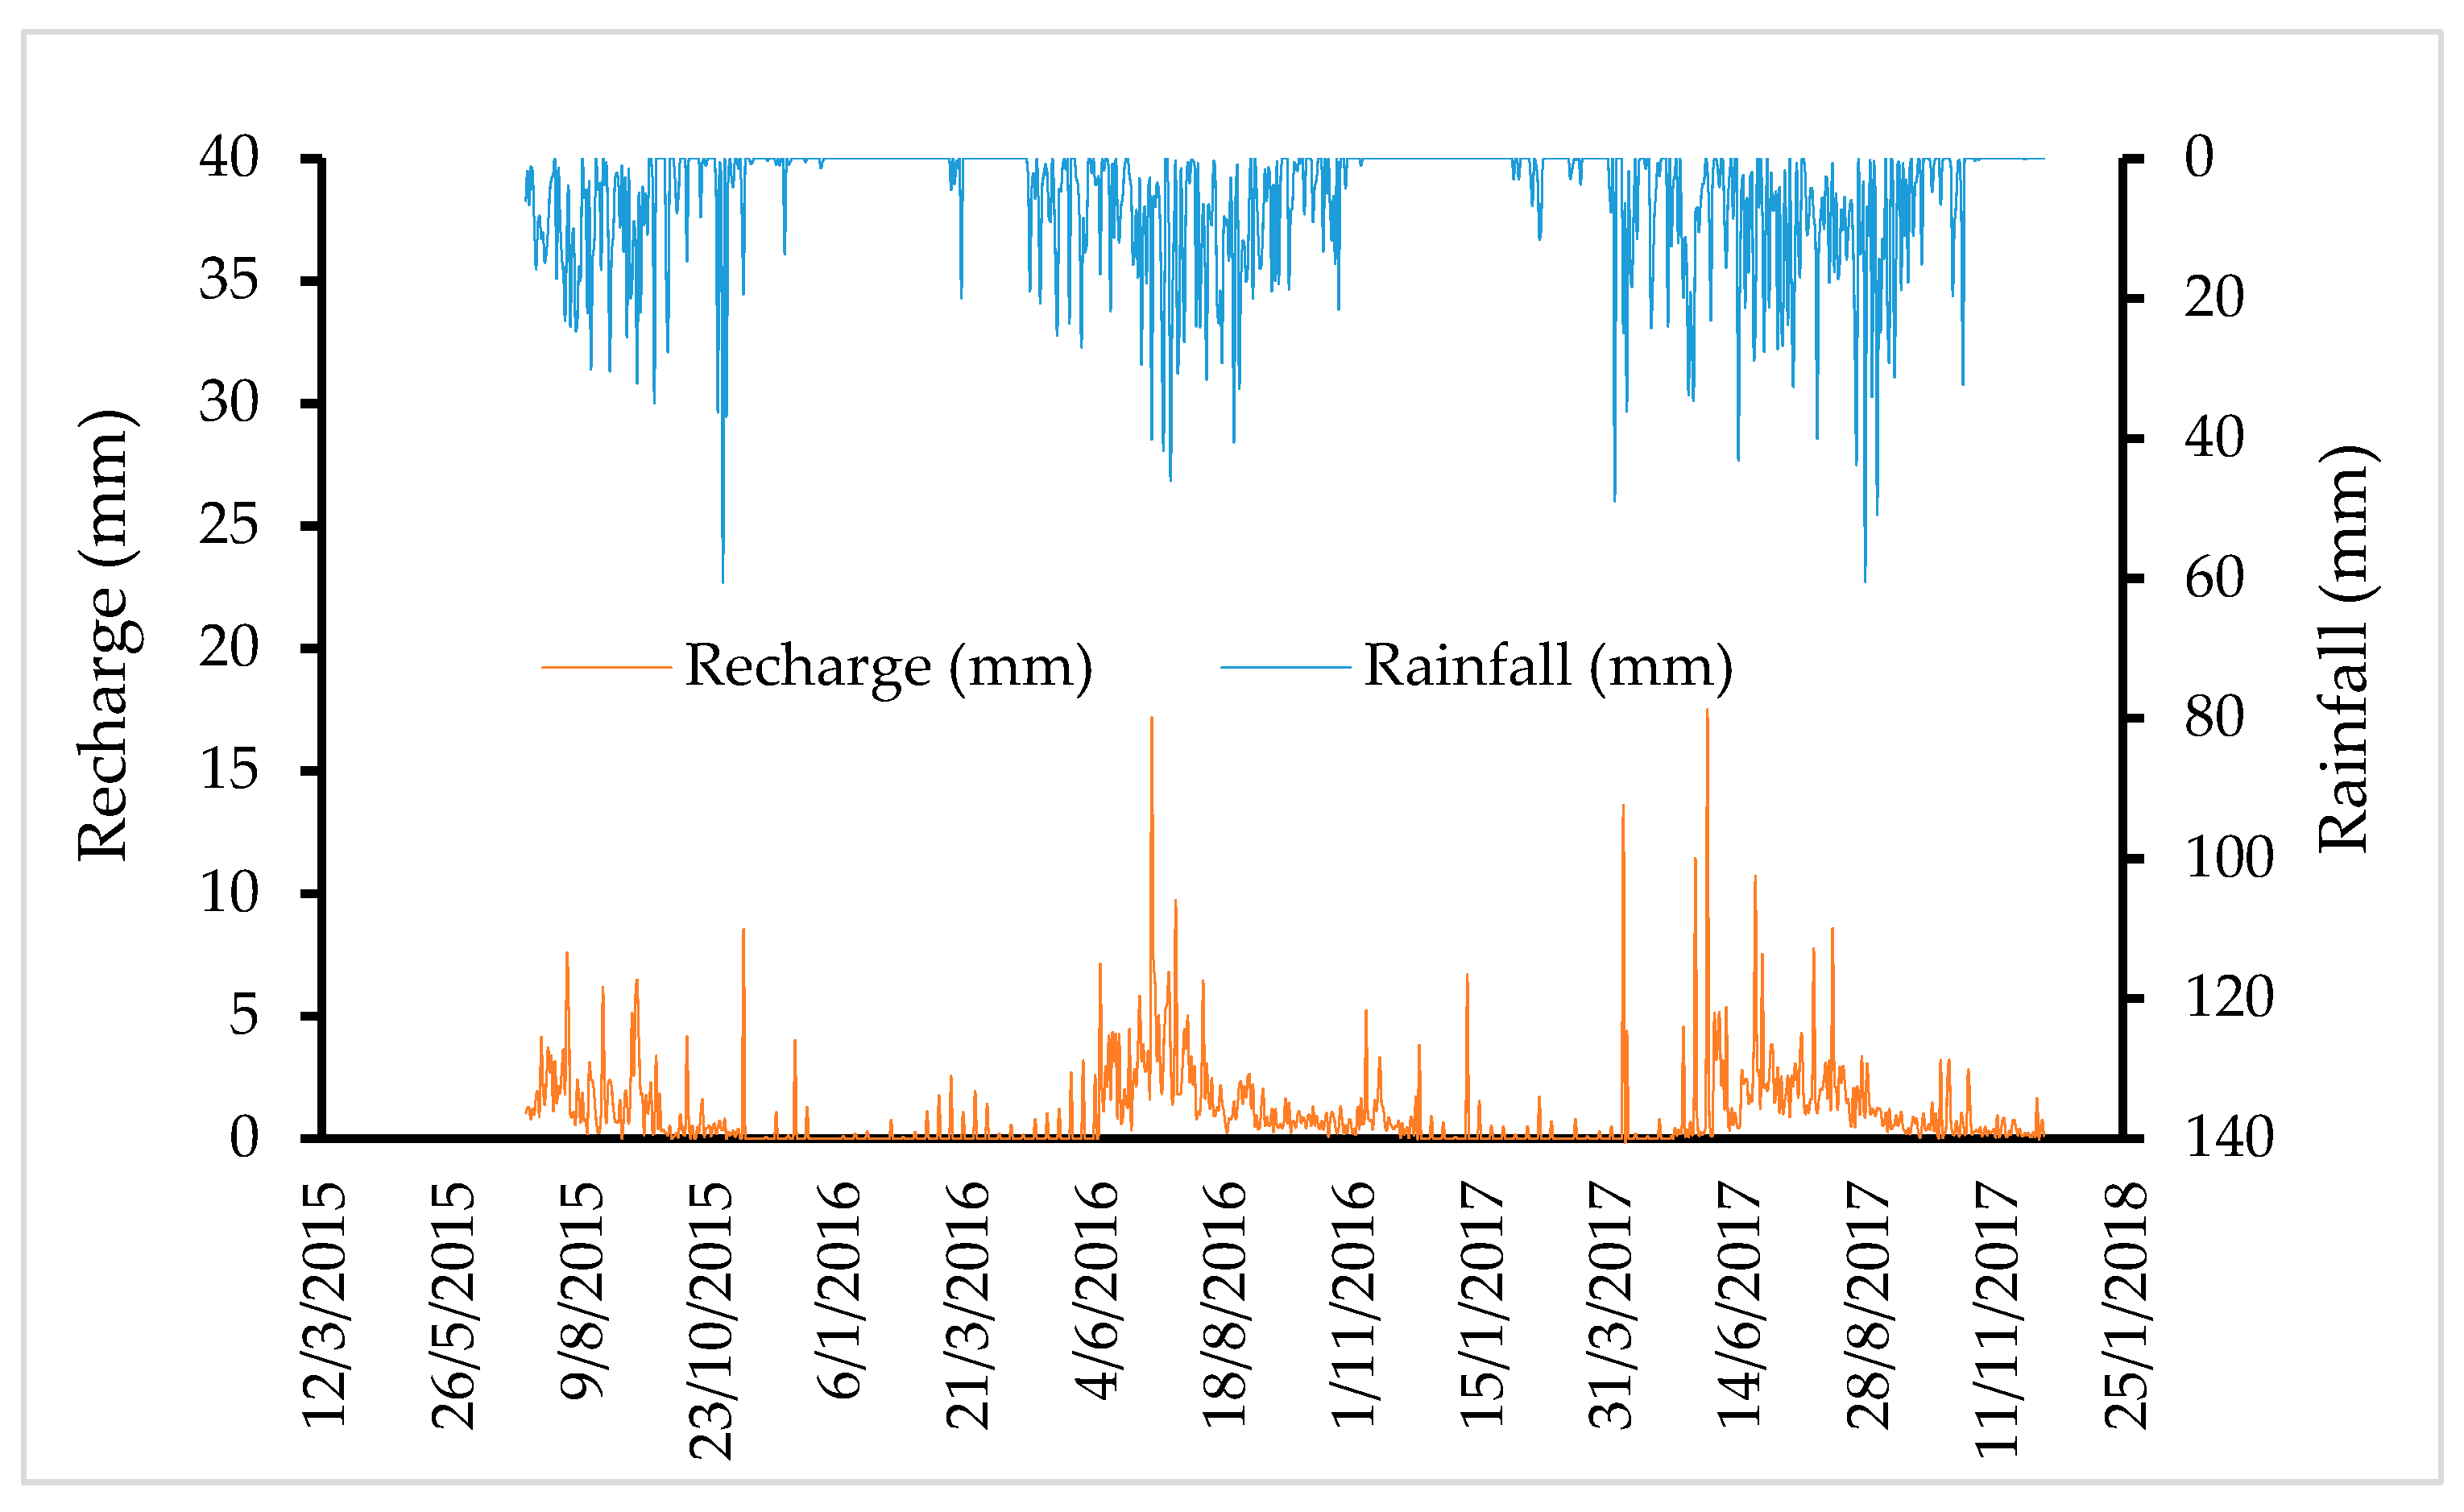
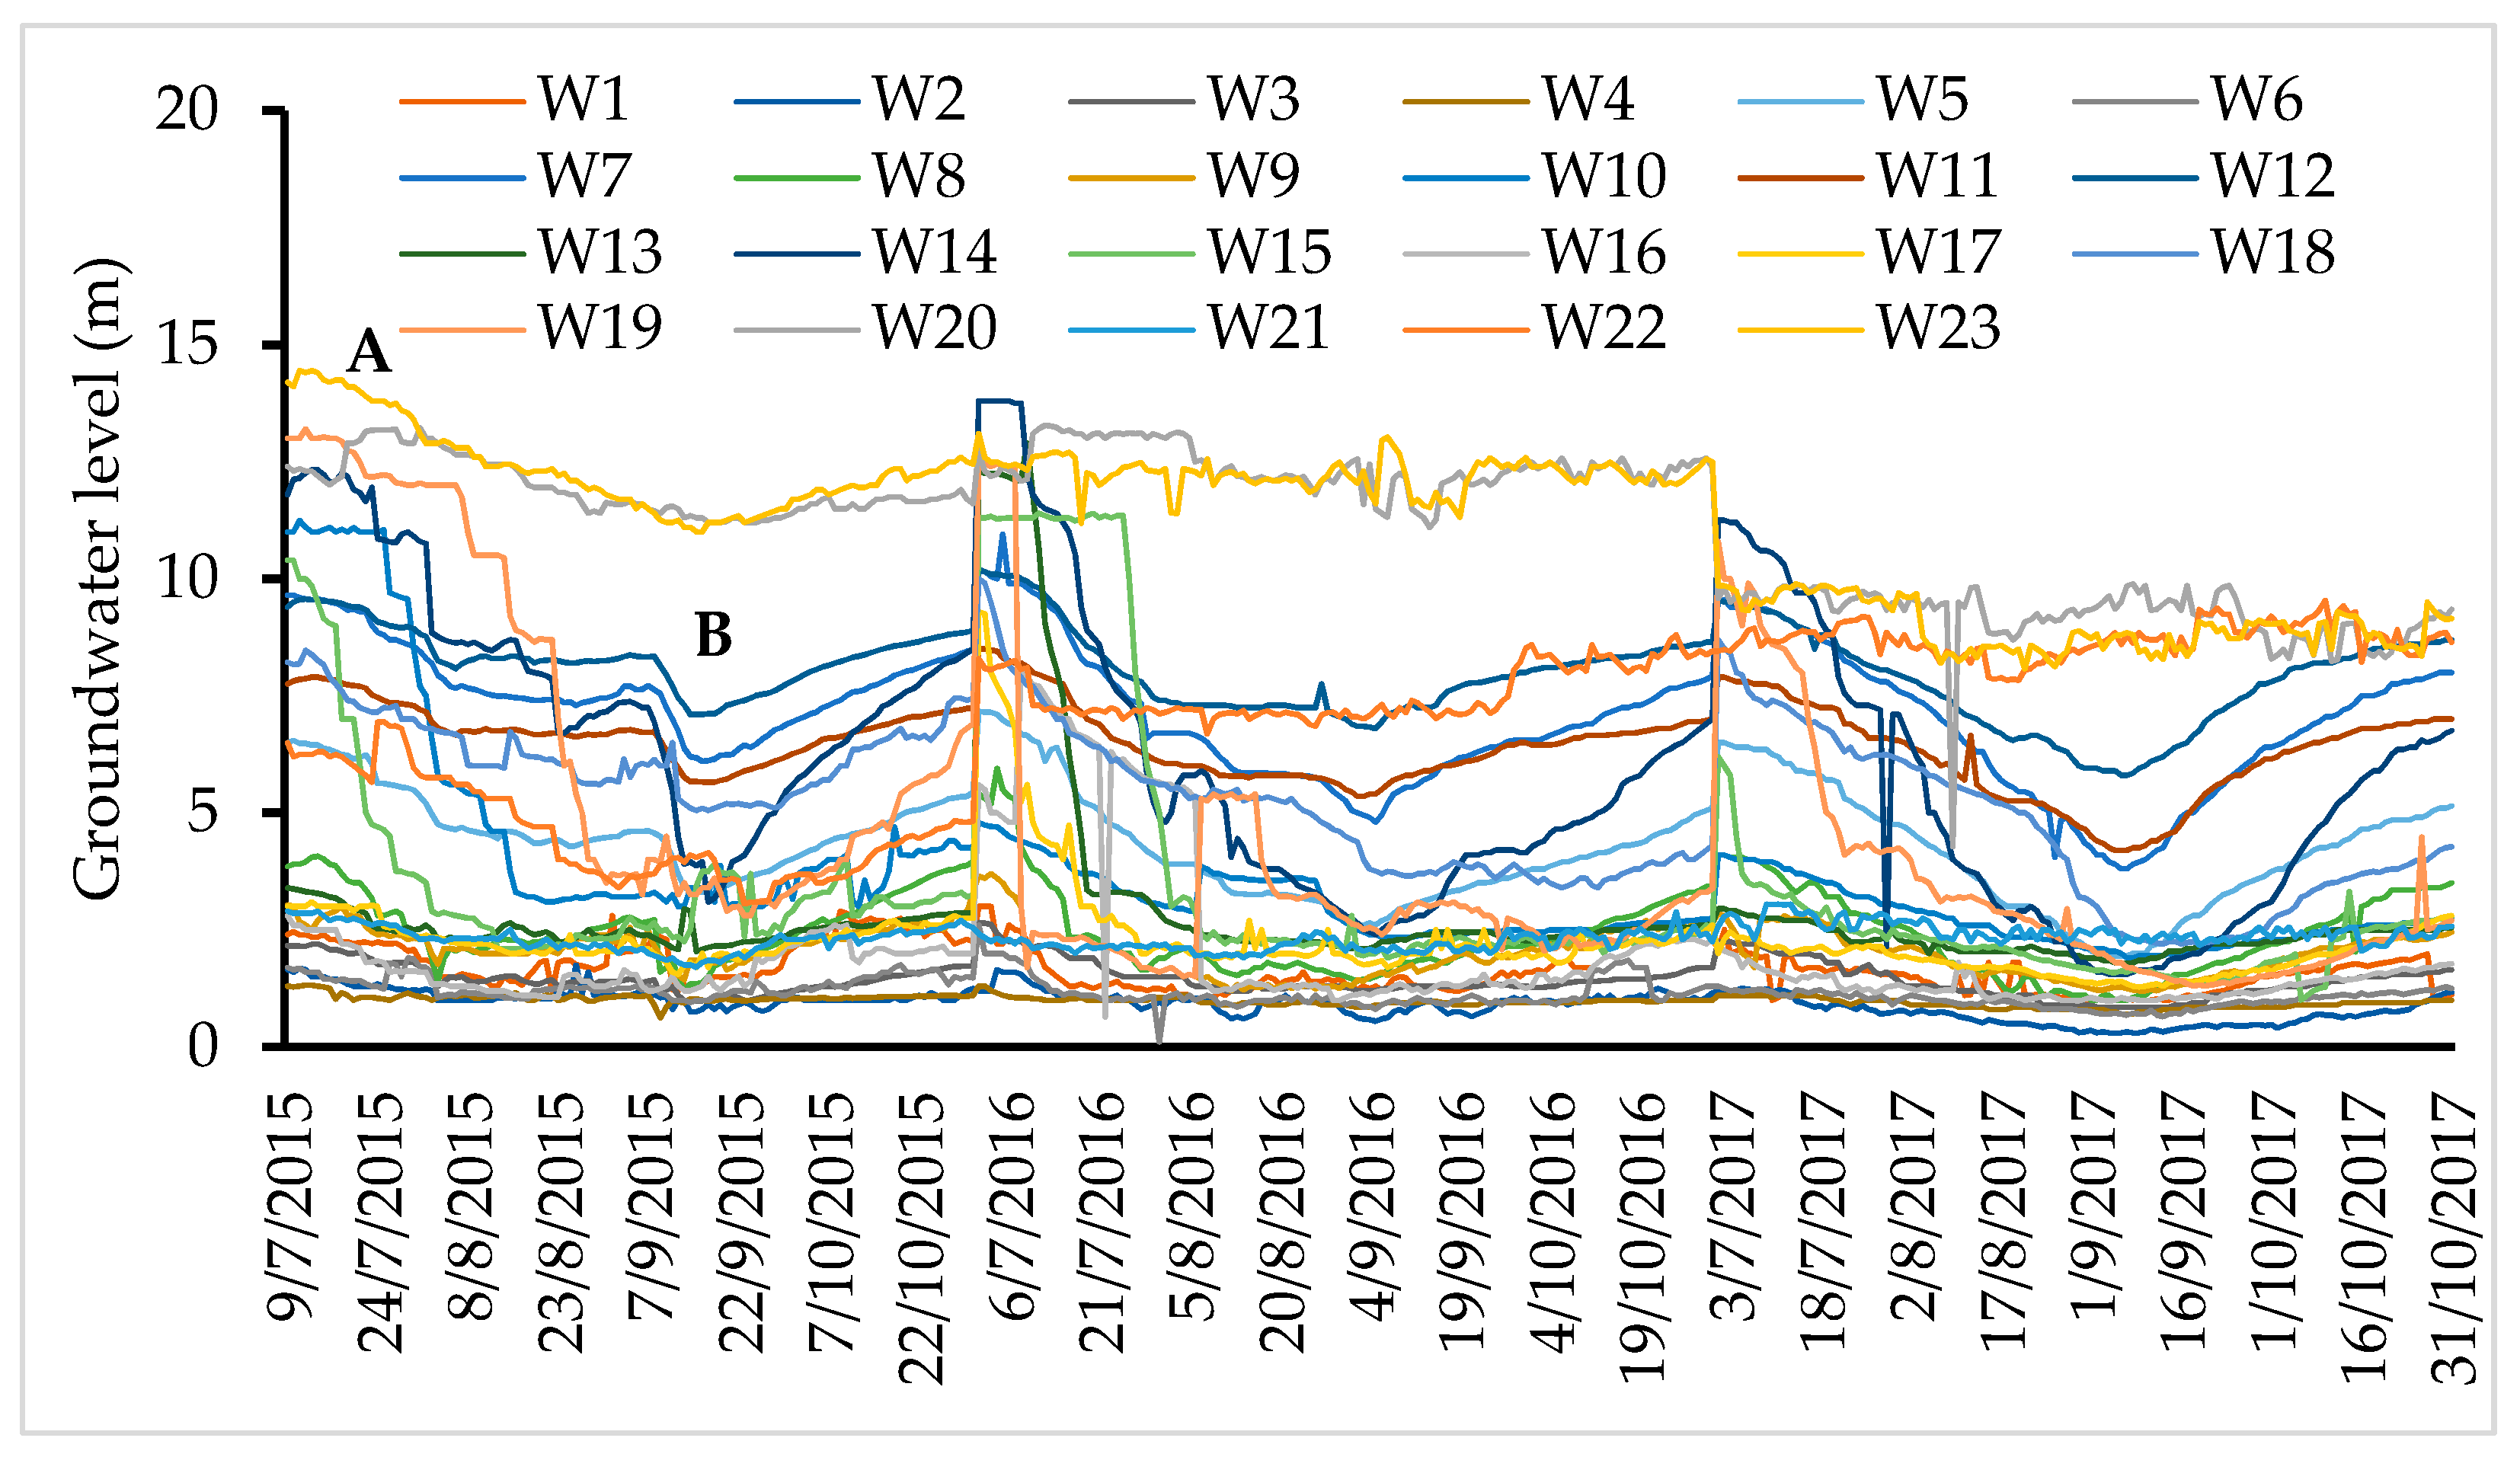
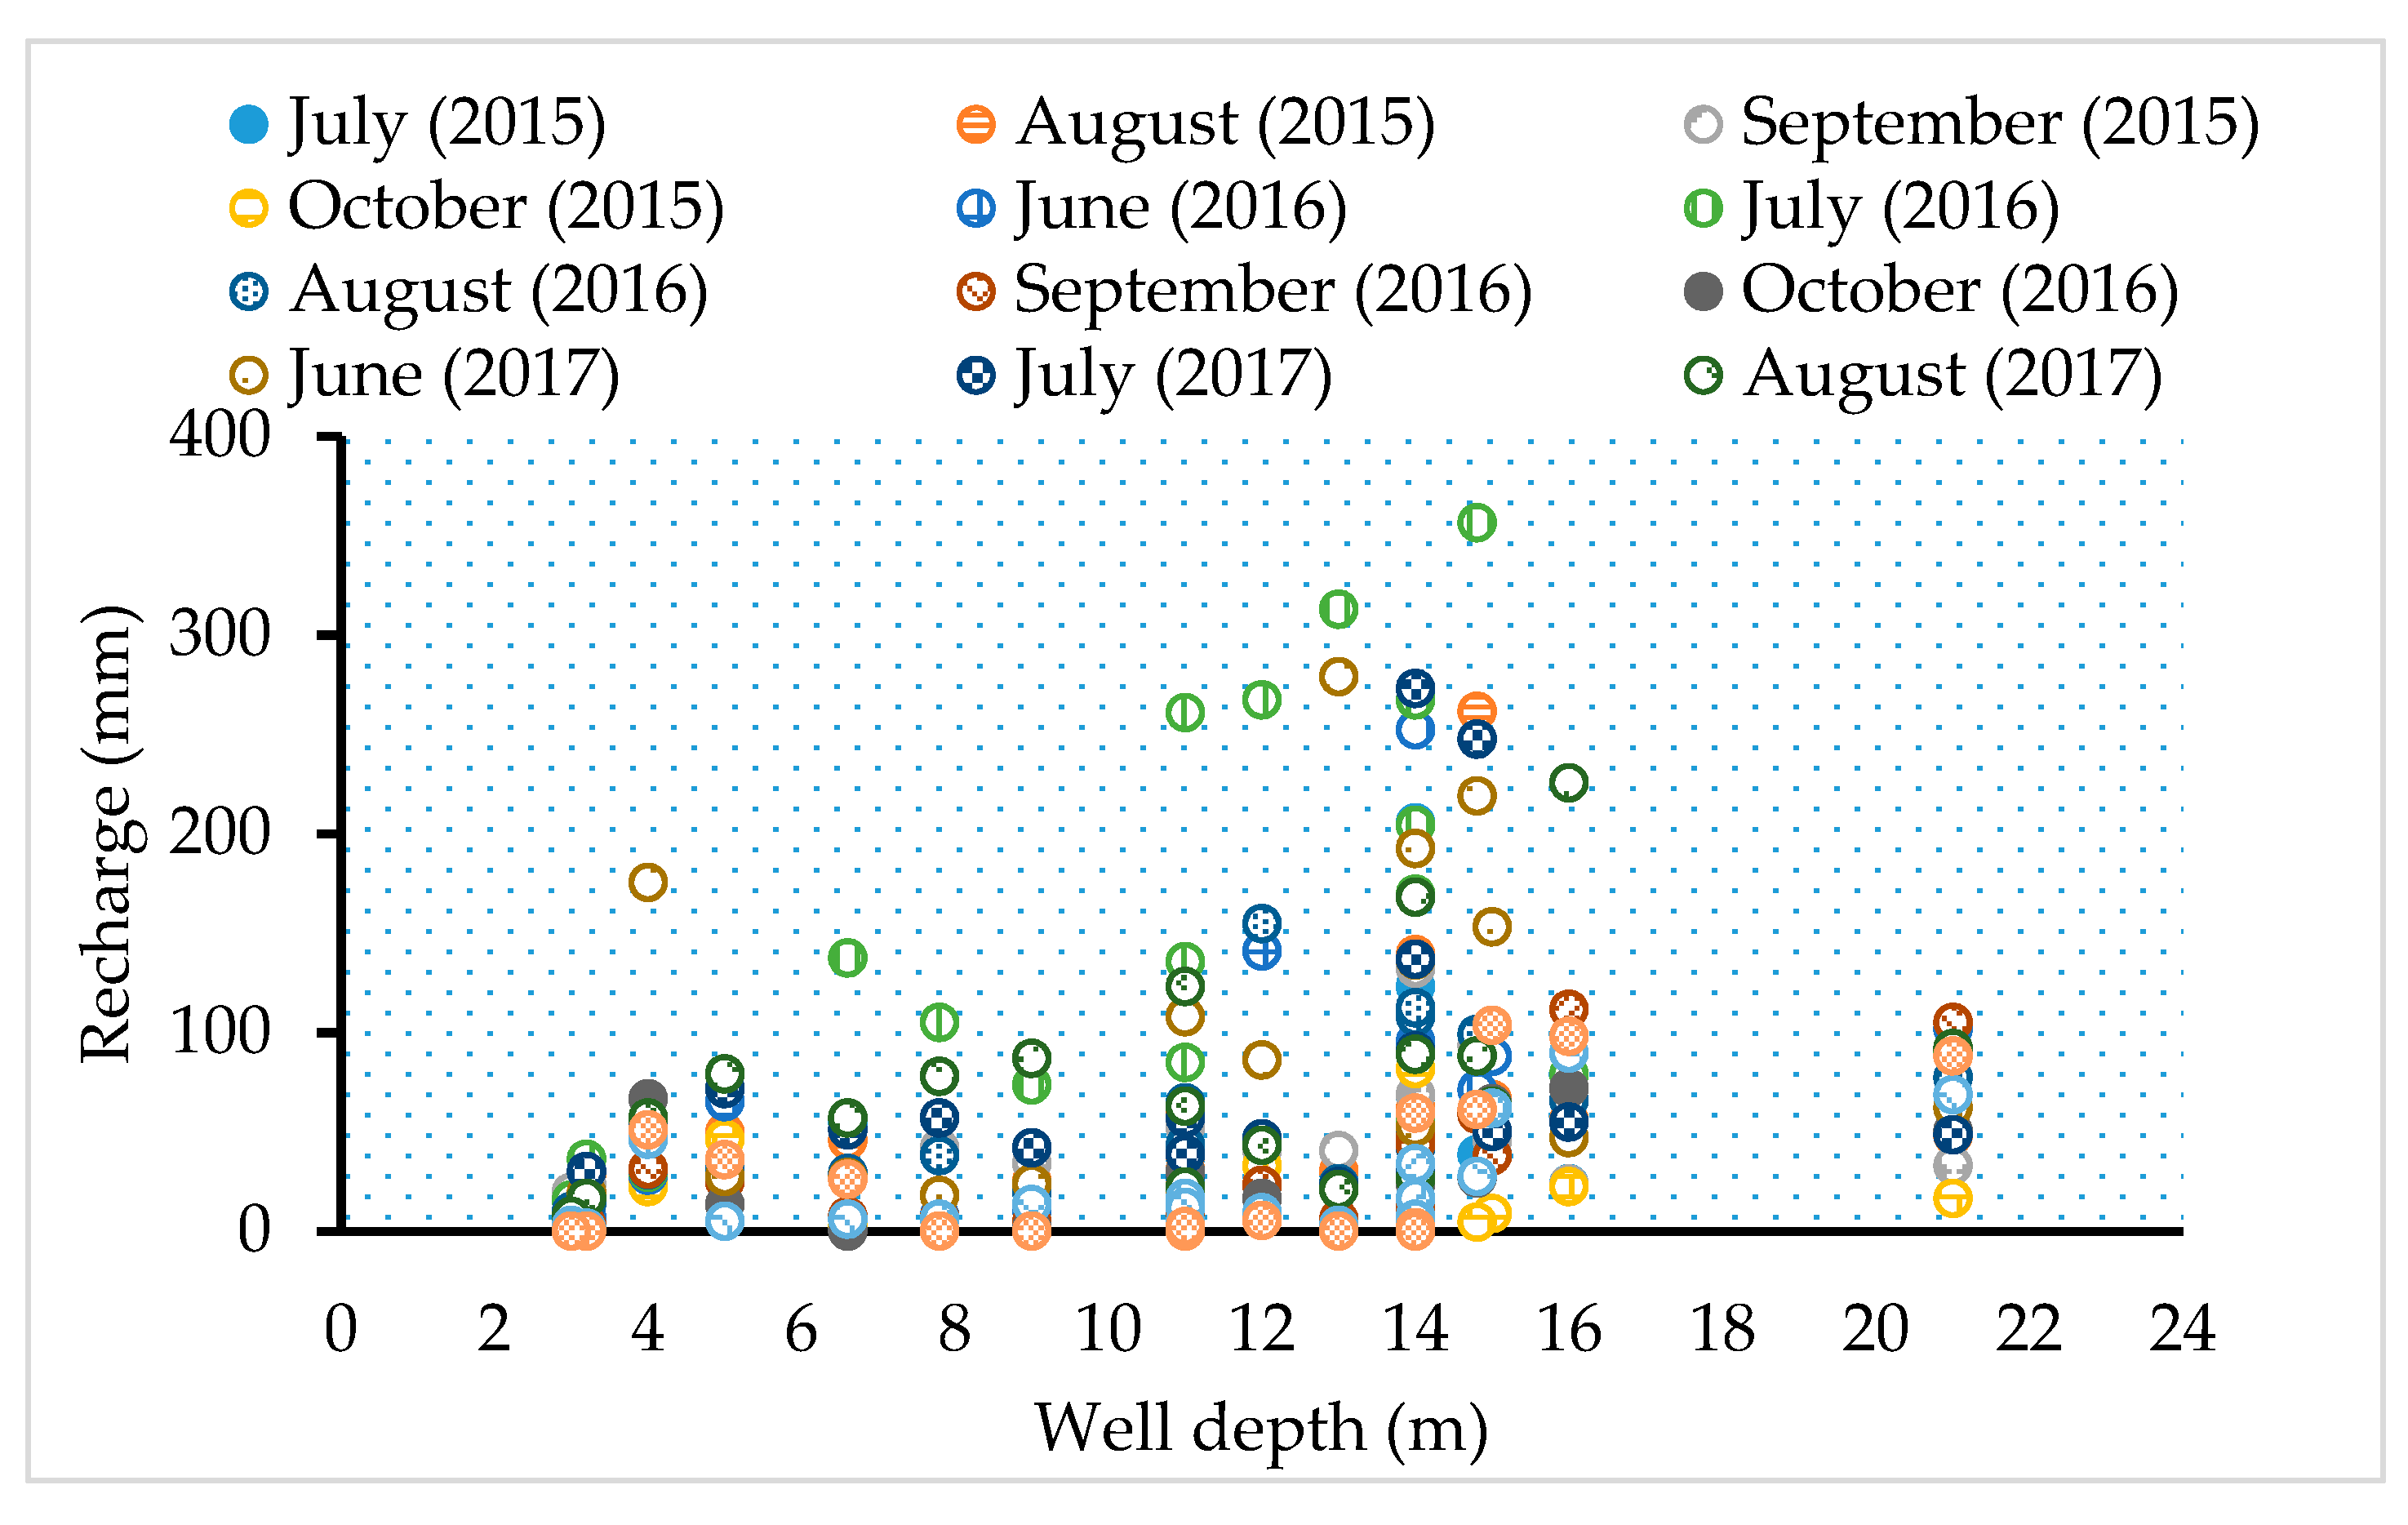
4.1. Shallow Groundwater Recharge

The average specific yield computed by pressure plate and standing tube methods was 0.03 (Table 1). In the pressure plate method, 2.4% to 3.6% specific yield was estimated, whereas 2.24% to 4.08% of specific yield was estimated using the standing tube approach. The variation in specific yield may be due to variation in grain size, grain shape, and soil compaction as indicated in [58]. Annual groundwater recharge for the three consecutive years (2015, 2016, and 2017) was 320, 358, and 347 mm, respectively. This estimate is equivalent to 18%, 22%, and 17% of the annual rainfall.
The maximum daily recharge observed in the main rainy season was found to be 17.5 mm for 2017 (28 May 2017) with a maximum daily rainfall of 60.5 mm for 2017 (28 August 2017) (Figure 3). Similarly, for 2015 and 2016, the maximum daily recharge was 9 mm (13 November 2015) and 17.1 mm (8 July 2016), and 60.6 mm (1 November 2015) and 46 mm (19 July 2016) maximum daily rainfall. However, most of the rainfall occurred between May and August. It was observed that the daily recharge values were increased for all the monitoring wells in the main rainy season (June to September), and started to decline in October.
A reduction in water level was observed from the middle of October to June each year (Figure 4), labeled with “A”. In the main rainy season, water level fluctuation increased to the surface (Figure 4), labeled with “B”. The response of water level variation was highly influenced by rainfall. During the rainfall season, all the monitoring wells showed an increment in water level towards the surface and later decreased during the dry periods.
The highest monthly recharge was observed in July and August for all monitoring wells (Figure 5). The study found a maximum monthly recharge of 20 to 176 mm from (3 to 10 m well depth) and 85 to 356 mm of recharge from (11 to 21 m well depth). The monthly average recharge of monitoring wells ranged from 8 to 118 mm from a monitoring well of depth 3 to 21 m.

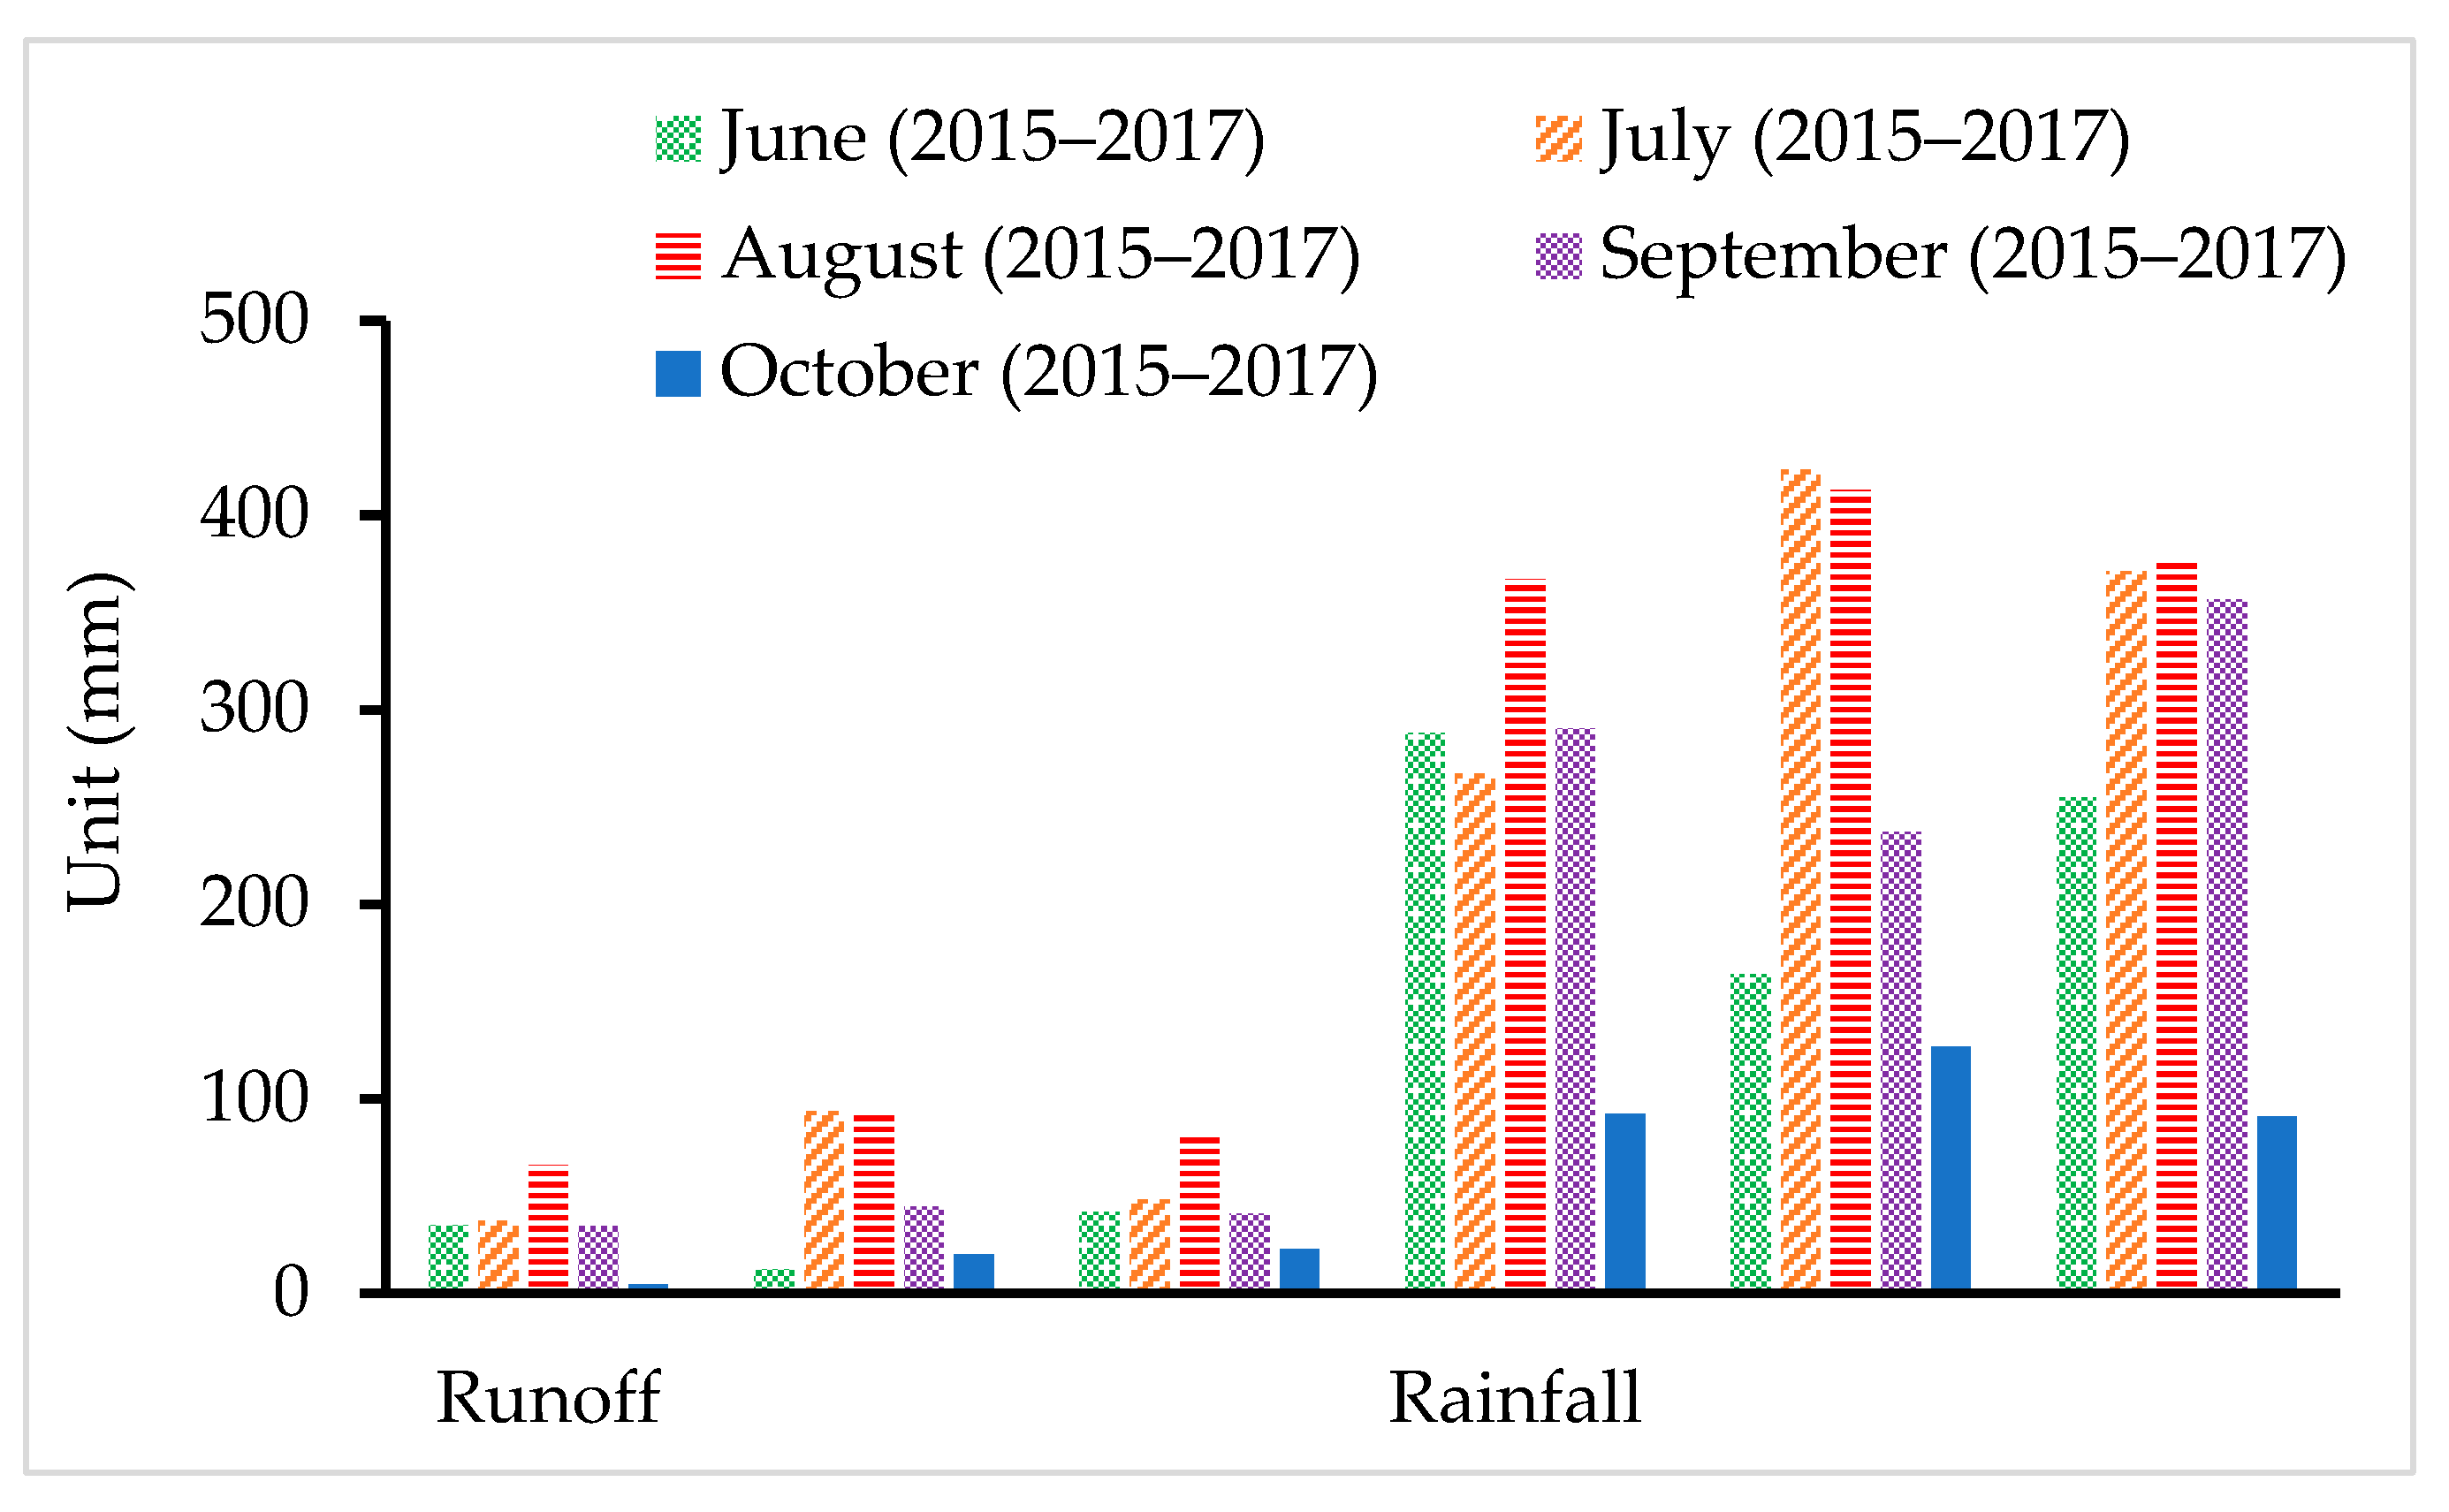
4.2. Direct Runoff and Low Flow Potential

The maximum monthly rainfall in 2015, 2016, and 2017 was 367, 423, and 377 mm respectively. Corresponding maximum runoff depths were 66, 94, and 83 mm, respectively. Annual runoff depths for 2015, 2016, and 2017, were 192, 268, and 257 mm, respectively (Figure 6). During the study period, the annual rainfall received during 2015, 2016, and 2017 was 1731, 1595, and 2025 mm, respectively.
A stage–discharge relationship (Figure 7) was developed and used to convert the streamflow stage measurement at the watershed outlet to a flow rate (discharge) using the developed regression equation (Figure 7). The peak stream flow rates (m3/s) in the main rainy seasons of 2015, 2016, and 2017, were 8.9, 10.7, and 11.2, respectively (Figure 8). The associated maximum base flow rates (m3/s) for 2015, 2016, and 2017 were 3.4, 4.7, and 4.8, respectively. The recharge and streamflow discharge reached their maximum values in 2017.
From the daily measurement of streamflow recorded at the watershed outlet, a flow duration curve (FDC) was prepared to determine the minimum flow that will exist in the river (Figure 9). The 90-percentile flow (flow exceeded 90% of the time) was 0.028 m3/s. This estimate is equivalent to 88.3 hectare-meters of water, and was considered for irrigation water availability assessment without the need for a water storage structure for dry season production.

4.3. Crop Evapotranspiration

Evapotranspiration (ETo) was computed from 2014 to 2018 using the Penman–Monteith method (Figure 10). An increment in evapotranspiration was observed for the driest months (January to May) and decreased for the wet months (June to October). During the study period, the lowest monthly evapotranspiration (70.4 mm) was observed in July 2016 and the highest value (121.4 mm) was observed in April 2015. The results showed annual evapotranspiration of 1217, 1098, 1077, 1061, and 1101 mm for 2014, 2015, 2016, 2017, and 2018, respectively.
The mean crop evapotranspiration was evaluated for the first irrigation season (October to February) and the second irrigation season (March to June) during 2015, 2016, and 2017, as shown in Table 2. In the first irrigation season, the crop evapotranspiration showed an increment of 9% to 15% for onion, and 13% to 16% for garlic, but only 14% for cabbage, and 13% for pepper under CT compared to the CA system from 2015 to 2017. Similarly, in the second irrigation season (March to June) the same increment in crop evapotranspiration was observed for onion, garlic, cabbage, and pepper by 15%, 16%, 14%, and 13%, respectively, under CT compared to CA from 2015 to 2017.

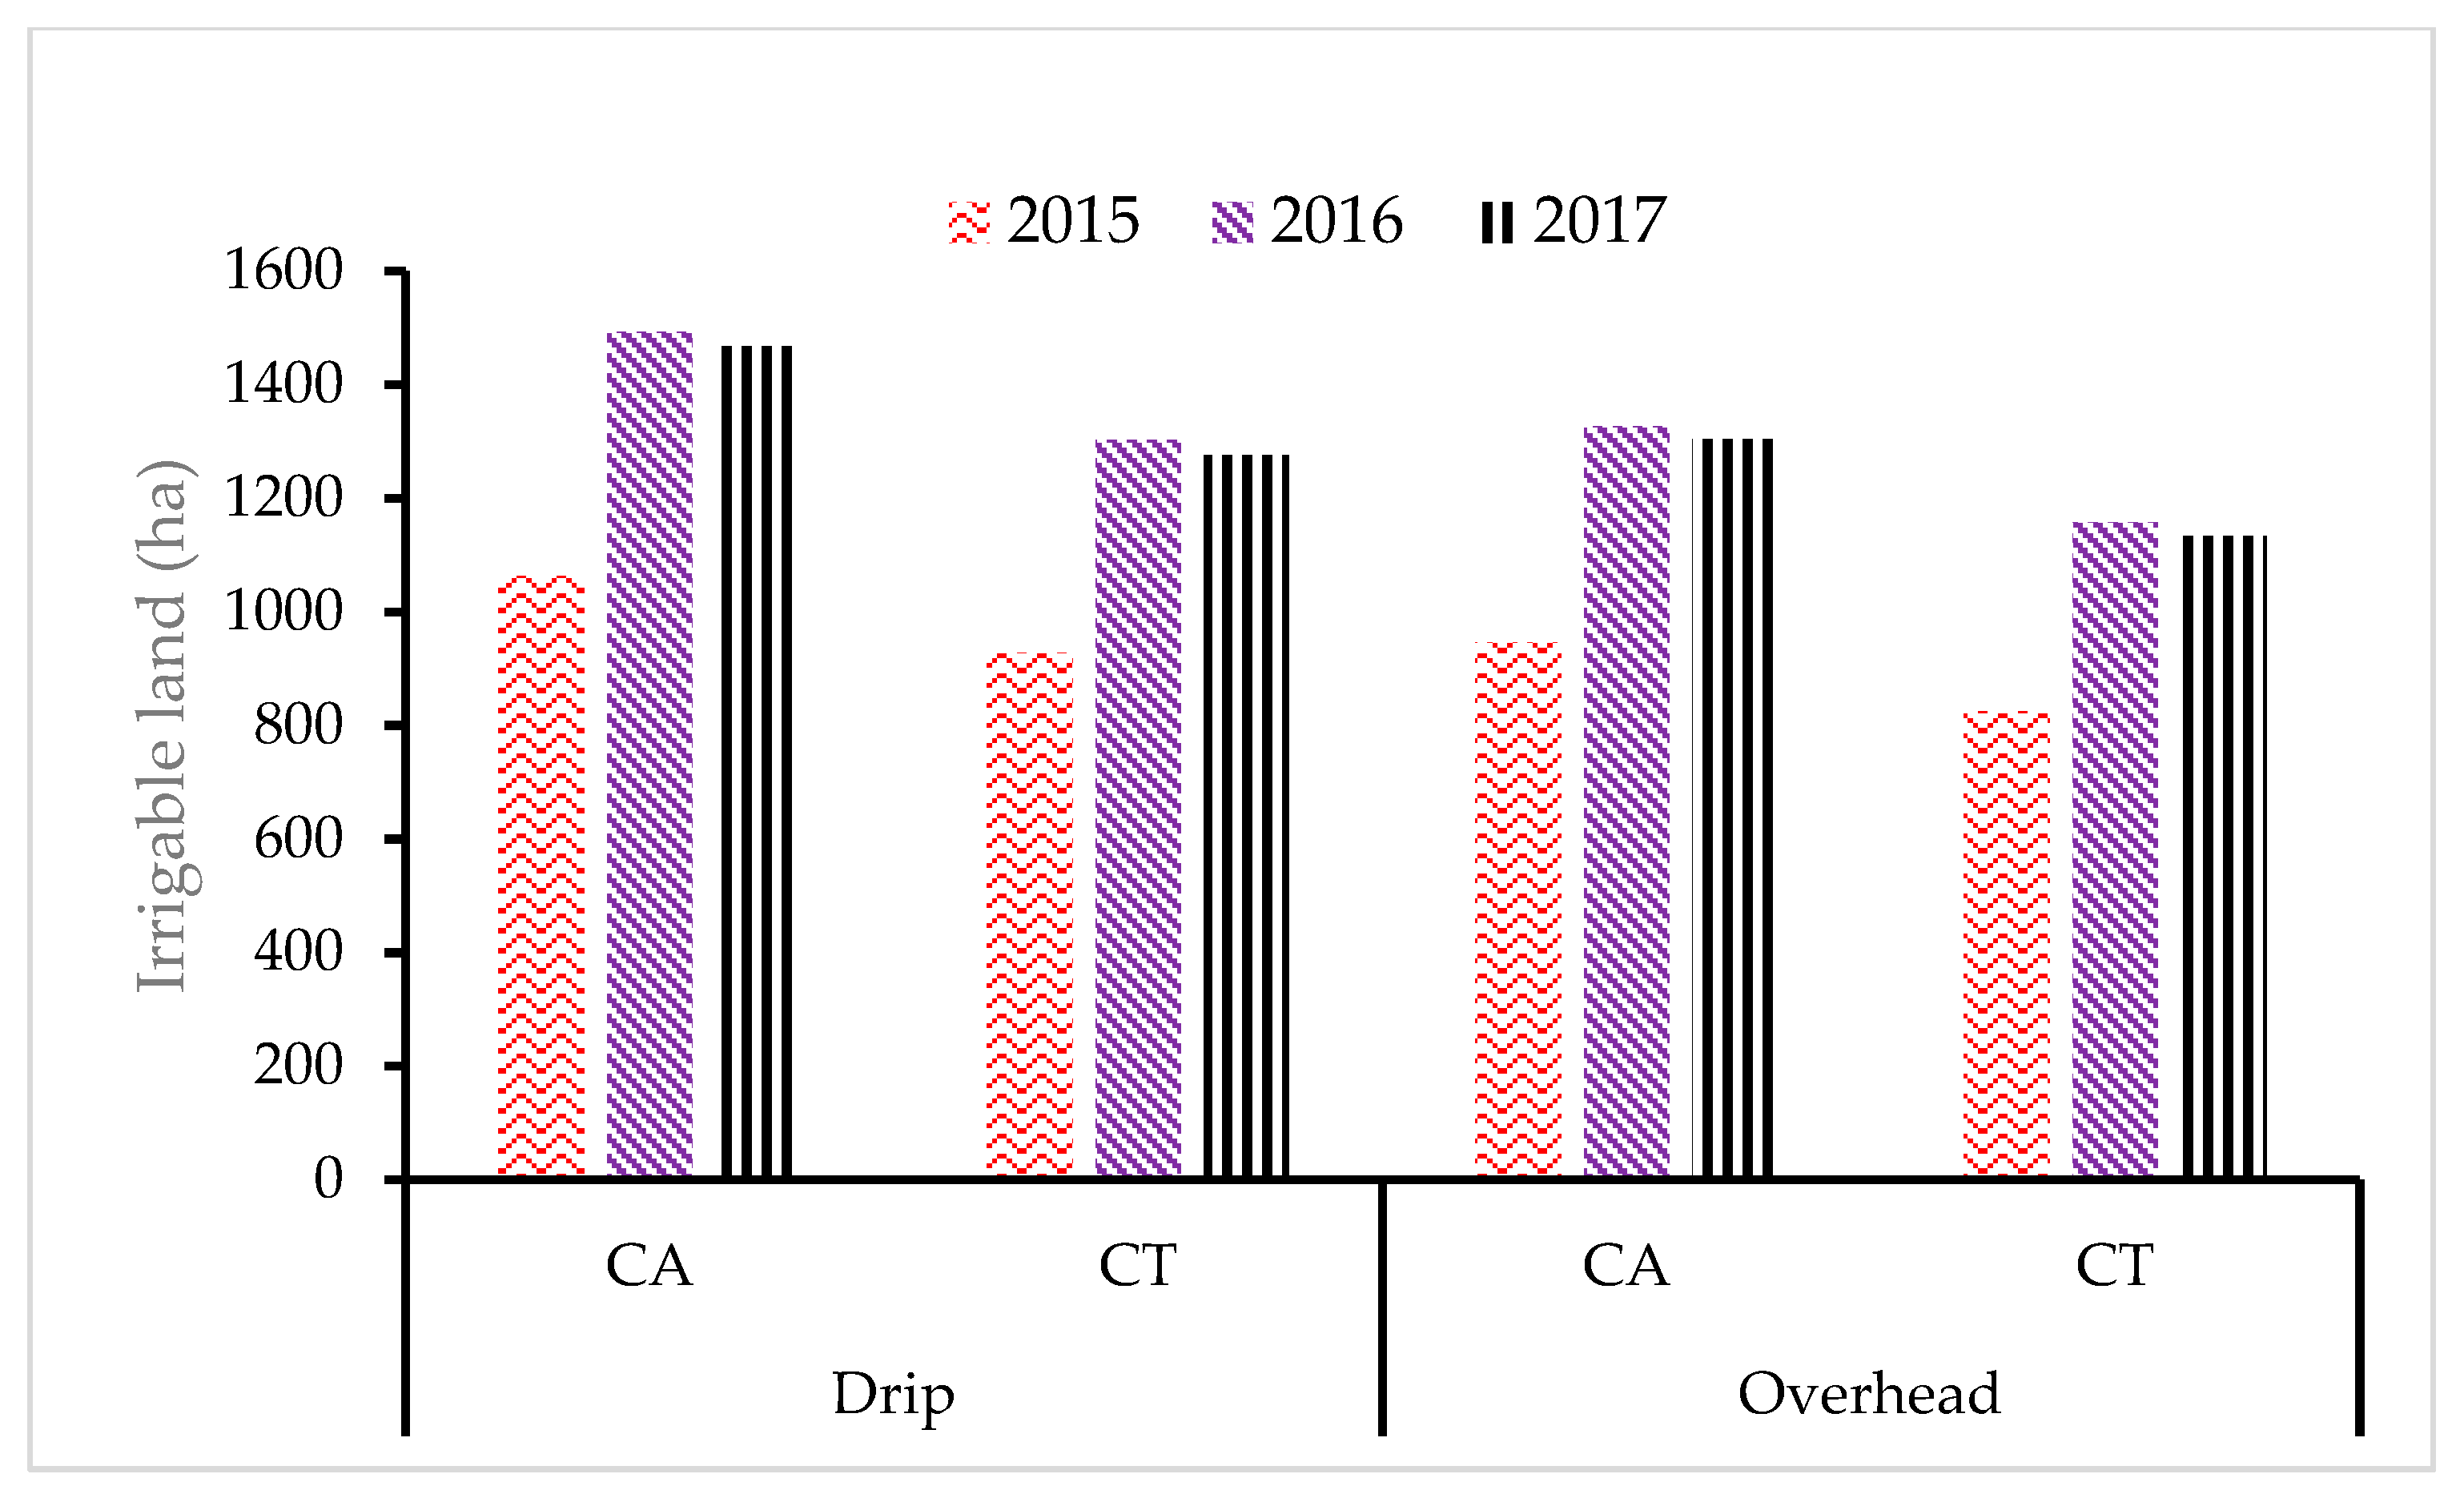
4.4. Estimation of Potential Irrigable Land

The maximum one-season potential irrigable land from the low flow was 199 ha under CA and 173 ha under CT practice, both under drip irrigation. To sustain irrigation, groundwater and runoff potential were tested for dry season irrigation. The maximum potential irrigable area that could be irrigated from groundwater recharge was 2001 ha for CA and 1746 ha for the CT practice, both under overhead irrigation (Table 3). Similarly, 2660 and 2321 ha maximum potential irrigable areas could be irrigated from runoff under CA and CT farming systems, respectively. By comparison, under drip irrigation, the maximum irrigable area that could be irrigated from groundwater recharge and runoff using the CA system was 2251 and 2992 ha, respectively. About 1965 and 2611 ha of land (maximum) could be irrigated based on CT from groundwater and runoff sources, respectively, both using a drip system. The potentially irrigable land showed a 13% increment under CA practices. Similarly, the drip irrigation water application method showed an increase in the potentially irrigable land by 56% compared to overhead irrigation.
The potential irrigable land for two-season irrigation is presented in Table 4. The results showed that under overhead irrigation, a maximum of 989 ha with CA farming and 863 ha with CT farming could be irrigated using groundwater sources. Similarly, about 1327 ha of land with CA farming and 1158 ha of land with CT farming could be irrigated using runoff with overhead irrigation. By comparison, using the drip irrigation system, a maximum of 1112 ha of land with CA farming and 971 ha of land with CT could be irrigated from groundwater. The irrigation potential from runoff was found to be about 1492 ha of land with CA farming and 1302 ha with CT farming when using the drip irrigation system.

5. Discussion

5.1. Water Resource Potential

The potential of groundwater recharge increased by 8% in 2017 and 11% in 2016 compared to 2015. Similarly, the runoff potential increased during 2016 and 2017 compared to 2015 due to the high amount of rainfall received during the wet months. The amount of runoff increased mostly during August. At the beginning of the rainy period, the amount of runoff was smaller because the rainfall infiltrates to fill the soil moisture deficit. As the rainfall season progressed, the amount of surface runoff increased. As a result of additional rain, the soil surface layer becomes saturated with each event of incoming precipitation and turns into runoff. During such cases, any peak rainfall falling on the surface does not result in a corresponding peak in groundwater recharge. This is because the soil is saturated due to continuous rainfall events that limited further infiltration to the subsoil. The water level of most of the shallow wells was near to the ground surface and did not show any water level fluctuations for any incoming precipitation. Annual runoff potential of 195 to 301 mm and 284 to 456 mm annual groundwater recharge potential were reported by Worqlul et al. [6] using an integrated decision support system (IDSS); these results support our findings. The potential of low flow was 5% of the recharge in 2015. During 2016 and 2017, the potential of low flow was only 4% of the recharge observed in the consecutive years. By comparison, the potential of low flow in the Dangishta watershed was around 8% of the runoff in 2015, and 6% of the runoff for each of 2016 and 2017.

5.2. Effects of CA on Crop Evapotranspiration

Evapotranspiration of crops decreased in the CA compared to the CT. In the CT practice, an increment of consumptive use from 9% to 16% was observed. The potential benefit of the CA on water saving, improvement of soil fertility, and crop productivity was reported by Hobbs [59]. According to Belay et al. [38], irrigation water use efficiency of CA was 40% higher than that of the CT practice. Similarly, Belay et al. [39] reported a 13% to 29% reduction in irrigation water use, and 29% to 51% reduction in runoff, using CA compared to CT, thus supporting the findings from our study.

5.3. Effects of CA and Drip Irrigation on Irrigable Land Potential

Potential irrigable land increased by 13% under CA compared to CT. By comparison, drip irrigation increased the potentially irrigable land by 56% relative to overhead irrigation. Therefore, a combined use of CA and drip irrigation could enhance irrigable potential by 69% compared to CT with overhead irrigation. Drip irrigation improves water-saving by avoiding runoff and applying water directly to the plant roots. Similarly, CA enhances the moisture content of the soil by limiting soil evaporation and improving soil fertility [37]. In both cases, the potential irrigable land could be enhanced if properly managed; for example, by using thick mulch cover for the CA system. Our previous research also showed that CA saves water, improves soil fertility, reduces evaporation, and improves productivity in the region [37,41]. Similarly, drip irrigation is advocated as an efficient water application technology, resulting in minimal runoff and improved water saving [60] for the same region, thus supporting our claim.

5.4. Potential Irrigable Land from Groundwater Recharge and Runoff

The potential of recharge and runoff to sustain irrigation was tested for two seasons of irrigation: the first irrigation season (October to February) and the second irrigation season (March to June) for 2015, 2016, and 2017. The potential of groundwater recharge and runoff to sustain two irrigation seasons (October to June) was also evaluated for 2015, 2016, and 2017. Under CA using the groundwater potential, about 1771 to 2001 ha of land could be irrigated using the overhead irrigation system in the first irrigation season (October to February). This estimate slightly varied in the second irrigation season (March to June), with values from 1800 to 1973 ha of land. By comparison, under CT the potentially irrigable land using overhead irrigation ranged from 1545 to 1746 ha of land in the first irrigation season and 1560 to 1722 ha of land in the second irrigation season, from 2015 to 2017. The variations in potentially irrigable land between the two irrigation seasons were due to variations in crop water requirements on a seasonal basis. In the drip water application system, about 1992 to 2251 ha of land and 2025 to 2219 ha of potentially irrigable land could be irrigated in the first and second irrigation seasons, respectively, both under CA. Similarly, under CT, about 1739 to 1965 ha of land and 1755 to 1937 ha of land could be irrigated in the first and second irrigation seasons, respectively. The potential of groundwater to sustain dry season irrigation was also evaluated for two irrigation seasons (October to June) during 2015, 2016, and 2017. Using overhead irrigation, about 776 to 863 ha of land and 893 to 989 ha of land could be irrigated under the CT and CA systems, respectively, from 2015 to 2017. A 56% increment in potentially irrigable land was observed using the drip irrigation application system. Under CA, about 1004 to 1112 ha irrigable land could be irrigated, whereas about 873 to 971 ha of irrigable land could be irrigated under CT. According to Worqlul et al. [14], only 8% of the suitable land for irrigation could be irrigated using the available shallow groundwater recharge in Ethiopia, indicating limited groundwater resources in the region, and thus favoring the use of water-saving techniques. The amounts of two-season potential irrigable land from runoff using the overhead and drip irrigation water application and CA and CT are presented. (Figure 11). Using overhead irrigation, about 893 to 989 ha of land could be irrigated with CA, and 825 to 1158 ha of land could be irrigated with CT. Using the drip application system, about 1063 to 1492 ha of land could be irrigated with CA and 928 to 1302 ha with CT. According to Worqlul et al. [15], although potentially irrigable land is abundant in the region, less than 3% of the potentially irrigable land could be irrigated through runoff from the river systems, which emphasizes the use of water-saving techniques to enhance the amount of irrigable land.

5.5. Irrigation Potential of Low Flow

Under CA, about 171 to 177 ha of land could be irrigated using the overhead irrigation system in the first irrigation season (October to February). This estimate slightly varied during the second irrigation season (March to June), from 162 to 176 ha of land. Under the CT system, the potential irrigable land using the overhead irrigation ranged from 151 to 154 ha of land in the first irrigation season, and 142 to 152 ha of land in the second irrigation season. By comparison, using the drip water application system, about 192 to 199 ha of land and 183 to 198 ha of potential irrigable land could be irrigated in the first and second irrigation seasons, respectively, both under CA. Similarly, in the CT system, about 170 to 173 ha of land and 159 to 171 ha of land could be irrigated in the first and second irrigation seasons, respectively. The potential of low flow to sustain dry season irrigation was also evaluated for two irrigation seasons (October to June) from 2015 to 2017. When using the overhead irrigation, about 85 to 87 ha of land and 74 to 76 ha of land could be irrigated under the CA and CT, respectively. By comparison, in the drip irrigation system, 95 to 98 ha of land under CA and 83 to 85 ha of land under the CT could be irrigated from the low flow. The potentially irrigable land from the low flow with overhead irrigation could be increased up to 94% using the CA practice and drip irrigation from groundwater recharge.

6. Conclusions

This study was carried out to investigate the potential irrigable land using surface and groundwater resources. Groundwater recharge potential during three consecutive years of 2015, 2016, and 2017 was 320, 358, and 347 mm, respectively, which was about 18%, 22%, and 17% of the annual rainfall. The maximum irrigable land that could be irrigated in one season of irrigation using groundwater recharge was found to be 2251 ha using the drip water application and CA system. To further enhance the potentially irrigable land, surface runoff potential was estimated to be 2992 ha of land (maximum) for one season of irrigation when using a drip system. Our findings for the two irrigation seasons (October to June) from 2015 to 2017 showed that irrigation could sustain about 1112 ha of land using groundwater and drip irrigation water application techniques under the CA system. The maximum one-season low flow irrigable potential was 199 ha under CA using drip irrigation. Irrigable land using the low flow (90 percentile flow) could be increased up to 94% through the use of groundwater sources with drip irrigation managed with CA. Therefore, the potential of water resources in the region was found to be sufficient to sustain the dry season irrigation in Dangishta watershed. Finally, the contribution of CA and drip irrigation can contribute significantly to sustaining dry season crop irrigation in the region for high-value vegetable crops (cash crops). Decision makers should consider various strategies to make use of groundwater and surface runoff resources to maximize dry season production, and thus help smallholder farmers increase their yield and income, ensure their food security, and alleviate their poverty. A more refined understanding of the potential of water resources for irrigation can be obtained by considering a data record from a long period and climate change scenarios to capture long-term trends in irrigation availability. The method of estimating irrigation potential used in this study can be transferred to other agricultural watersheds through tailored use of catchment inputs. However, caution should be applied to aquifer conditions in the case of estimating net groundwater potential for irrigation.

Author Contributions

A.Y.Y. contributed to the experimental design, data analysis, and interpretation, and drafted the manuscript; T.T.A. contributed to the experimental design, data acquisition, and analysis, and revised the manuscript for the scientific content; F.K.S. contributed to data collection and analysis; S.A.T. contributed to the experiment, data analysis, and interpretation, and revised the manuscript; M.R.R. contributed to data acquisition and revised the manuscript; P.V.V.P. contributed to data acquisition and revised the manuscript. All authors have read and agreed to the published version of the manuscript.

Funding

This research was funded by the Appropriate Scale Mechanization Consortium of Feed the Future Innovation Lab for Collaborative Research on Sustainable Intensification (Cooperative Agreement No. AID-OAA-L-14-00006, Kansas State University) funded by United States Agency for International Development (USAID). The opinions expressed herein are those of the author(s) and do not necessarily reflect the views of the USAID or Kansas State University or any other institution.

Institutional Review Board Statement

Not applicable.

Informed Consent Statement

Not applicable.

Data Availability Statement

The data presented in this study is available on request from the corresponding author.

Acknowledgments

We would like to acknowledge the Ethiopian National Metrological Agency (ENMA) and International Water Management Institute (IWMI) for providing quality data for this research. Contribution no. 21-234-J from Kansas Agricultural Experiment Station.

Conflicts of Interest

The authors declare no conflict of interest.

References

  1. Makombe, G.; Namara, R.E.; Awulachew, S.B.; Hagos, F.; Ayana, M.; Kanjere, M. An analysis of the productivity and technical efficiency of smallholder irrigation in Ethiopia. Water SA 2017, 43, 48–57. [Google Scholar] [CrossRef] [Green Version]
  2. Jouzi, Z.; Azadi, H.; Taheri, F.; Zarafshani, K.; Gebrehiwot, K.; Van Passel, S.; Lebailly, P. Organic Farming and Small-Scale Farmers: Main Opportunities and Challenges. Ecol. Econ. 2017, 132, 144–154. [Google Scholar] [CrossRef] [Green Version]
  3. Nata, T.; Bheemalingeswara, K. Prospects and Constraints of Household Irrigation Practices, Hayelom Watershed, Tigray, Northern Ethiopia. Momona Ethiop. J. Sci. 2010, 2, 86–109. [Google Scholar] [CrossRef]
  4. Mengistie, D.; Kidane, D. Assessment of the impact of small-scale irrigation on household livelihood improvement at Gubalafto district, North Wollo, Ethiopia. Agriculture 2016, 6, 27. [Google Scholar] [CrossRef] [Green Version]
  5. Tilahun, H.; Teklu, E.; Michael, M.; Fitsum, H.; Awulachew, S.B. Comparative performance of irrigated and rainfed agriculture in Ethiopia. World Appl. Sci. J. 2011, 14, 235–244. [Google Scholar]
  6. Worqlul, A.W.; Dile, Y.T.; Schmitter, P.; Jeong, J.; Meki, M.N.; Gerik, T.J.; Srinivasan, R.; Lefore, N.; Clarke, N. Water resource assessment, gaps, and constraints of vegetable production in Robit and Dangishta watersheds, Upper Blue Nile Basin, Ethiopia. Agric. Water Manag. 2019, 226, 105767. [Google Scholar] [CrossRef]
  7. Belachew, T.; Hadley, C.; Lindstrom, D.; Gebremariam, A.; Lachat, C.; Kolsteren, P. Food insecurity, school absenteeism and educational attainment of adolescents in Jimma Zone Southwest Ethiopia: A longitudinal study. Nutr. J. 2011, 10, 29. [Google Scholar] [CrossRef] [Green Version]
  8. Abiyu, A. Challenges and Opportunities of Small-Scale Irrigation Utilization in Rift Valley Basin, Humbo Woreda, Ethiopia. J. Econ. Sustain. Dev. 2016, 7, 56–64. [Google Scholar]
  9. Bossio, D.; Erkossa, T.; Dile, Y.; McCartney, M.; Killiches, F.; Hoff, H. Water implications of foreign direct investment in Ethiopia’s agricultural sector. Water Altern. 2012, 5, 223–242. [Google Scholar]
  10. Tesfaye, A.; Bogale, A.; Namara, R.E.; Bacha, D. The impact of small-scale irrigation on household food security: The case of Filtino and Godino irrigation schemes in Ethiopia. Irrig. Drain. Syst. 2008, 22, 145–158. [Google Scholar] [CrossRef]
  11. Gebrehiwot, N.T.; Mesfin, K.A. Small-scale Irrigation: The Driver for Promoting Agricultural Production and Food Security (The Case of Tigray Regional State, Northern Ethiopia). Irrig. Drain. Syst. Eng. 2015, 4, 141. [Google Scholar] [CrossRef] [Green Version]
  12. Van Den Berg, M.; Ruben, R. Small-scale irrigation and income distribution in Ethiopia. J. Dev. Stud. 2006, 42, 868–880. [Google Scholar] [CrossRef]
  13. Assefa, T.; Jha, M.; Worqlul, A.W.; Reyes, M.; Tilahun, S. Scaling-up conservation agriculture production system with drip irrigation by integrating MCE technique and the APEX model. Water 2019, 11, 2007. [Google Scholar] [CrossRef] [Green Version]
  14. Worqlul, A.W.; Jeong, J.; Dile, Y.T.; Osorio, J.; Schmitter, P.; Gerik, T.; Srinivasan, R.; Clark, N. Assessing potential land suitable for surface irrigation using groundwater in Ethiopia. Appl. Geogr. 2017, 85, 1–13. [Google Scholar] [CrossRef]
  15. Worqlul, A.W.; Collick, A.S.; Rossiter, D.G.; Langan, S.; Steenhuis, T.S. Assessment of surface water irrigation potential in the Ethiopian highlands: The Lake Tana Basin. Catena 2015, 129, 76–85. [Google Scholar] [CrossRef]
  16. Descheemaeker, K.; Amede, T.; Haileslassie, A.; Bossio, D. Analysis of gaps and possible interventions for improving water productivity in crop livestock systems of Ethiopia. Exp. Agric. 2011, 47, 21–38. [Google Scholar] [CrossRef]
  17. Awulachew, S.B.; Ayana, M. Performance OF irrigation: An assessment at different scales in Ethiopia. Exp. Agric. 2011, 47, 57–69. [Google Scholar] [CrossRef]
  18. Siebert, S.; Burke, J.; Faures, J.M.; Frenken, K.; Hoogeveen, J.; Döll, P.; Portmann, F.T. Groundwater use for irrigation—A global inventory. Hydrol. Earth Syst. Sci. 2010, 14, 1863–1880. [Google Scholar] [CrossRef] [Green Version]
  19. Nakawuka, P.; Langan, S.; Schmitter, P.; Barron, J. A review of trends, constraints, and opportunities of smallholder irrigation in East Africa. Glob. Food Sec. 2018, 17, 196–212. [Google Scholar] [CrossRef]
  20. Walker, D.; Parkin, G.; Schmitter, P.; Gowing, J.; Tilahun, S.A.; Haile, A.T.; Yimam, A.Y. Insights from a Multi-Method Recharge Estimation Comparison Study. Groundwater 2019, 57, 245–258. [Google Scholar] [CrossRef] [Green Version]
  21. Razack, M.; Furi, W.; Fanta, L.; Shiferaw, A. Water resource assessment of a complex volcanic system under semi-arid climate using numerical modeling: The Borena basin in Southern Ethiopia. Water 2020, 12, 276. [Google Scholar] [CrossRef] [Green Version]
  22. Meresa, E.; Taye, G. Estimation of groundwater recharge using GIS-based WetSpass model for Birki watershed, the eastern zone of Tigray, Northern Ethiopia. Sustain. Water Resour. Manag. 2019, 5, 1555–1566. [Google Scholar] [CrossRef] [Green Version]
  23. Kerebih, M.S.; Keshari, A.K. GIS-Coupled Numerical Modeling for Sustainable Groundwater Development: Case Study of Aynalem Well Field, Ethiopia. J. Hydrol. Eng. 2017, 22, 05017001. [Google Scholar] [CrossRef]
  24. Andualem, T.G.; Demeke, G.G. Groundwater potential assessment using GIS and remote sensing: A case study of Guna tana landscape, upper Blue Nile Basin, Ethiopia. J. Hydrol. Reg. Stud. 2019, 24, 100610. [Google Scholar] [CrossRef]
  25. Tilahun, S.A.; Yilak, D.L.; Schmitter, P.; Zimale, F.A.; Langan, S.; Barron, J.; Parlange, J.Y.; Steenhuis, T.S. Establishing irrigation potential of a hillside aquifer in the African highlands. Hydrol. Process. 2020, 34, 1741–1753. [Google Scholar] [CrossRef] [Green Version]
  26. Healy, R.W.; Cook, P.G. Using groundwater levels to estimate recharge. Hydrogeol. J. 2002, 10, 91–109. [Google Scholar] [CrossRef]
  27. Yenehun, A.; Nigate, F.; Belay, A.S.; Desta, M.T.; Van Camp, M.; Walraevens, K. Groundwater recharge and water table response to changing conditions for aquifers at different physiography: The case of a semi-humid river catchment, northwestern highlands of Ethiopia. Sci. Total Environ. 2020, 748, 142243. [Google Scholar] [CrossRef]
  28. Novita, E.; Wahyuningsih, S. Preliminary Study on Baseflow Separation at Watersheds in East Java Regions. Agric. Agric. Sci. Procedia 2016, 9, 538–550. [Google Scholar] [CrossRef]
  29. Shao, G.; Zhang, D.; Guan, Y.; Sadat, M.A.; Huang, F. Application of different separation methods to investigate the baseflow characteristics of a semi-arid sandy area, Northwestern China. Water 2020, 12, 434. [Google Scholar] [CrossRef] [Green Version]
  30. Kissel, M.; Schmalz, B. Comparison of baseflow separation methods in the German low mountain range. Water 2020, 12, 1740. [Google Scholar] [CrossRef]
  31. Arnold, J.G.; Allen, P.M. Automated methods for estimating baseflow and ground water recharge from streamflow records. J. Am. Water Resour. Assoc. 1999, 35, 411–424. [Google Scholar] [CrossRef]
  32. Stewart, R.D.; Bhaskar, A.S.; Parolari, A.J.; Herrmann, D.L.; Jian, J.; Schifman, L.A.; Shuster, W.D. An analytical approach to ascertain saturation-excess versus infiltration-excess overland flow in urban and reference landscapes. Hydrol. Process. 2019, 33, 3349–3363. [Google Scholar] [CrossRef]
  33. Wen, Y.; Hu, C.; Zhang, G.; Jian, S. Response of the parameters of excess infiltration and excess storage model to land use cover change. J. Hydrol. Hydromech. 2020, 68, 99–110. [Google Scholar] [CrossRef]
  34. Saffarpour, S.; Western, A.W.; Adams, R.; McDonnell, J.J. Multiple runoff processes and multiple thresholds control agricultural runoff generation. Hydrol. Earth Syst. Sci. 2016, 20, 4525–4545. [Google Scholar] [CrossRef] [Green Version]
  35. Tilahun, S.A.; Mukundan, R.; Demisse, B.A.; Guzman, C.; Tarakegn, B.C.; Engda, T.A.; Easton, Z.M.; Collick, A.S.; Zegeye, A.D.; Schneiderman, E.M.; et al. A saturation excess erosion model. ASABE Int. Symp. Eros. Landsc. Evol. 2011, 56, 381–389. [Google Scholar] [CrossRef] [Green Version]
  36. Assefa, T.; Jha, M.; Reyes, M.; Worqlul, A.W. Modeling the impacts of conservation agriculture with a drip irrigation system on the hydrology and water management in Sub-Saharan Africa. Sustainability 2018, 10, 4763. [Google Scholar] [CrossRef] [Green Version]
  37. Yimam, A.Y.; Assefa, T.T.; Adane, N.F.; Tilahun, S.A.; Jha, M.K.; Reyes, M.R. Experimental evaluation for the impacts of conservation agriculture with drip irrigation on crop coefficient and soil properties in the Sub-Humid Ethiopian Highlands. Water 2020, 12, 947. [Google Scholar] [CrossRef] [Green Version]
  38. Belay, S.A.; Schmitter, P.; Worqlul, A.W.; Steenhuis, T.S.; Reyes, M.R.; Tilahun, S.A. Conservation agriculture saves irrigation water in the dry monsoon phase in the Ethiopian highlands. Water 2019, 11, 2103. [Google Scholar] [CrossRef] [Green Version]
  39. Belay, S.A.; Assefa, T.T.; Vara Prasad, P.V.; Schmitter, P.; Worqlul, A.W.; Steenhuis, T.S.; Reyes, M.R.; Tilahun, S.A. The response of water and nutrient dynamics and of crop yield to conservation agriculture in the Ethiopian highlands. Sustainability 2020, 12, 5989. [Google Scholar] [CrossRef]
  40. Assefa, T.; Jha, M.; Reyes, M.; Tilahun, S.; Worqlul, A.W. Experimental evaluation of conservation agriculture with drip irrigation for water productivity in Sub-Saharan Africa. Water 2019, 11, 530. [Google Scholar] [CrossRef] [Green Version]
  41. Assefa, T.; Jha, M.; Reyes, M.; Worqlul, A.W.; Doro, L.; Tilahun, S. Conservation agriculture with drip irrigation: Effects on soil quality and crop yield in sub-Saharan Africa. J. Soil Water Conserv. 2020, 75, 209–217. [Google Scholar] [CrossRef]
  42. Yuan, Z.Q.; Zhang, R.; Wang, B.X.; Gao, B.Q.; Ayana, G.; Abera, D.; Ashraf, M.; Li, F.M. Film mulch with irrigation and rainfed cultivations improves maize production and water use efficiency in Ethiopia. Ann. Appl. Biol. 2019, 175, 215–227. [Google Scholar] [CrossRef]
  43. Johnson, A.I. Compilation of Specific Yields for Various Materials; U.S. Geological Survey: Reston, VA, USA, 1966.
  44. Neuman, S.P. On Methods of Determining Specific Yield. Groundwater 1987, 25, 679–684. [Google Scholar] [CrossRef]
  45. Uhunmwangho, R.; Odje, M.; Okedu, K.E. Comparative analysis of mini hydro turbines for Bumaji Stream, Boki, Cross River State, Nigeria. Sustain. Energy Technol. Assess. 2018, 27, 102–108. [Google Scholar] [CrossRef]
  46. Arnold, J.G. Automated Methods for estimating baseflow and recharge. 1999, 35, 13353–13366. [Google Scholar]
  47. Nathan, R.J.; McMahon, T.A. Evaluation of automated techniques for base flow and recession analyses. Water Resour. Res. 1990, 26, 1465–1473. [Google Scholar] [CrossRef]
  48. Hagedorn, B. Hydrograph separation through multi objective optimization: Revealing the importance of a temporally and spatially constrained baseflow solute source. J. Hydrol. 2020, 590, 125349. [Google Scholar] [CrossRef]
  49. Lyne, V.D.; Hollick, M. Stochastic time-variable rainfall-runoff modelling. In Proceedings of the Institute of Engineers Australia National Conference, Barton, Australia, September 1979; pp. 89–93. [Google Scholar]
  50. Allen, R.G.; Pruitt, W.O.; Wright, J.L.; Howell, T.A.; Ventura, F.; Snyder, R.; Itenfisu, D.; Steduto, P.; Berengena, J.; Yrisarry, J.B.; et al. A recommendation on standardized surface resistance for hourly calculation of reference ETo by the FAO56 Penman-Monteith method. Agric. Water Manag. 2006, 81, 1–22. [Google Scholar] [CrossRef]
  51. Wu, I.P.; Gitlin, H.M. Drip irrigation application efficiency and schedules. Trans. Am. Soc. Agric. Engrs. Gen. Edn. 1983, 26, 92–99. [Google Scholar] [CrossRef]
  52. Eshete, D.G.; Tilahun, S.A.; Moges, M.A.; Petra, S.; Dokou, Z.; Sinshaw, B.G.; Atalay, E.B.; Moges, M.A.; Takele, D.Y.; Getie, W.A. Evaluation of shallow ground water recharge and its potential for dry season irrigation at Brante Watershed, Dangila, Ethiopia. In Proceedings of the Lecture Notes of the Institute for Computer Sciences, Social-Informatics and Telecommunications Engineering; Springer: Cham, Switzerland, 2020; Volume 308, pp. 148–168. [Google Scholar]
  53. Asmerom, G.H. Groundwater contribution and recharge estimation in the upper blue nile flows, Ethiopia. Master’s Thesis, International Institute for Geo-Information Science and Earth Observation, Enschede, The Netherlands, 2008. [Google Scholar]
  54. Steenhuis, T.S.; Collick, A.S.; Easton, Z.M.; Leggesse, E.S.; Bayabil, H.K.; White, E.D.; Awulachew, S.B.; Adgo, E.; Ahmed, A.A. Predicting discharge and sediment for the Abay (Blue Nile) with a simple model. Hydrol. Process. 2009, 23, 3728–3737. [Google Scholar] [CrossRef]
  55. Guzman, C.D.; Tilahun, S.A.; Zegeye, A.D.; Steenhuis, T.S. Suspended sediment concentration-discharge relationships in the (sub-) humid Ethiopian highlands. Hydrol. Earth Syst. Sci. 2013, 17, 1067–1077. [Google Scholar] [CrossRef] [Green Version]
  56. Tilahun, S.A.; Guzman, C.D.; Zegeye, A.D.; Dagnew, D.C.; Collick, A.S.; Yitaferu, B.; Steenhuis, T.S. Distributed discharge and sediment concentration predictions in the sub-humid Ethiopian highlands: The Debre Mawi watershed. Hydrol. Process. 2015, 29, 1817–1828. [Google Scholar] [CrossRef]
  57. Jensen, M. Estimating Evaporation from Water Surfaces. In Proceedings of the CSU/ARS Evapotranspiration Workshop, Fort Collins, CO, USA, 15 March 2010; pp. 1–27. [Google Scholar]
  58. Song, J.; Chen, X. Variation of specific yield with depth in an alluvial aquifer of the Platte River valley, USA. Int. J. Sediment. Res. 2010, 25, 185–193. [Google Scholar] [CrossRef]
  59. Hobbs, P.R. Conservation agriculture: What is it and why is it important for future sustainable food production? J. Agric. Sci. 2007, 145, 20–24. [Google Scholar]
  60. Assefa, T.T.; Adametie, T.F.; Yimam, A.Y.; Belay, S.A.; Degu, Y.M.; Hailemeskel, S.T.; Tilahun, S.A.; Reyes, M.R.; Prasad, P.V.V. Evaluating Irrigation and Farming Systems with Solar MajiPump in Ethiopia. Agronomy 2021, 11, 17. [Google Scholar] [CrossRef]
Figure 1. Map of the study area (Dangishta watershed in Ethiopia) showing different monitoring systems.
Water 13 01645 g001
Figure 2. Overall methodology and workflow of the research. ER, ETc, and NIR are effective rainfall, crop evapotranspiration, and net irrigation requirement, respectively.
Water 13 01645 g002
Figure 3. Mean daily shallow groundwater recharge of the monitoring wells and rainfall (2015 to 2017).
Water 13 01645 g003
Figure 4. Daily shallow groundwater level variation of all monitoring wells (2015–2017). “A” refers to the dry season and “B” refers to the wet season. The letter “W” stands for wells. The altitude varies for the wells: W1 to W10 (2035 to 2050 AMSL), W11 to W20 (2050 to 2100 AMSL), and W21 to W23 (up to 2123 AMSL).
Water 13 01645 g004
Figure 5. Monthly shallow groundwater recharges (2015 to 2017) for all monitoring wells. The values of recharge indicated were for the specific monitoring wells (point value).
Water 13 01645 g005
Figure 6. Monthly runoff (left) and rainfall (right) values during the study period (2015 to 2017).
Water 13 01645 g006
Figure 7. Stage–discharge relationship (rating curve) for Brantie River.
Water 13 01645 g007
Figure 8. Streamflow, base flow, and rainfall values during 2015 to 2017.
Water 13 01645 g008
Figure 9. Flow duration curve (FDC) for Brantie river using 2015 to 2017 streamflow data.
Water 13 01645 g009
Figure 10. Monthly evapotranspiration from 2014 to 2018.
Water 13 01645 g010
Figure 11. Potential of runoff to sustain two-season irrigation (October to June) using overhead and drip water application techniques under the conservation agriculture (CA) and conventional tillage (CT) systems for 2015, 2016, and 2017.
Water 13 01645 g011
Table 1. Specific yield (%) was obtained from the pressure plate and standing tube methods.
MethodSoil Moisture at Saturation (%)Soil Moisture after Draining (Vol %)Specific Yield (%)
Standing Tube51.649.02.6
54.551.33.2
55.552.53.0
60.457.62.8
61.357.24.1
57.855.62.2
Pressure Plate5046.93.1
51.147.53.6
56.854.42.4
54.351.33.0
56.053.03.0
48.044.53.5
Average3
Table 2. Crop evapotranspiration (mm) for onion, garlic, cabbage, and pepper under a conservation agriculture (CA) and conventional tillage (CT) experiment conducted during two irrigation seasons: first phase (October–February) and second phase (March–June).
First Phase Irrigation (mm)Second Phase Irrigation (mm)
Farming SystemCrop Type201520162017201520162017
CAOnion286292300338327299
Garlic253270267298273265
Cabbage311322318339323315
Pepper400414409435416402
CTOnion316345343399386354
Garlic289321317353324315
Cabbage360372367392374364
Pepper458474468499477464
Table 3. Estimation of potentially irrigable land (hectares) using groundwater recharge (R) and runoff volume (Q) under overhead and drip irrigation application techniques under conservation agriculture (CA) and conventional tillage (CT) during 2015, 2016, and 2017.
First Phase Irrigation (ha)Second Phase Irrigation (ha)
Irrigation MethodFarming System201520162017201520162017Source of Water
OverheadCA197426602587181326472630Q
200119831771183919731800R
CT172223212257158223102278Q
174617301545160517221560R
DripCA222029922910204029772958Q
225122301992206922192025R
CT193826112539178025982563Q
196519471739180519371755R
Table 4. Estimation of potentially irrigable land (ha) using groundwater recharge (R) and runoff (Q) to sustain two-season irrigation using overhead and drip water applications under conservation agriculture (CA) and conventional tillage (CT) during 2015, 2016, and 2017.
Two Season Irrigation (October–June) in ha of Land
Irrigation MethodFarming System201520162017Source of Water
OverheadCA94513271304Q
958989893R
CT82511581134Q
836863776R
DripCA106314921467Q
107811121004R
CT92813021276Q
941971873R
Publisher’s Note: MDPI stays neutral with regard to jurisdictional claims in published maps and institutional affiliations.

