Article

Baseline Study on Microplastics in Indian Rivers under Different Anthropogenic Influences

by
Simone Lechthaler
1,2,*,
Kryss Waldschläger
1,3,
Chavapati Gouse Sandhani
4,
S. A. Sannasiraj
4,
V. Sundar
4,
Jan Schwarzbauer
5 and
Holger Schüttrumpf
1
1
Institute of Hydraulic Engineering and Water Resource Management, RWTH Aachen University, 52074 Aachen, Germany
2
Chair of Physical Geography and Geoecology, RWTH Aachen University, 52062 Aachen, Germany
3
Hydrology and Quantitative Water Management Group, Wageningen University, 6708 PB Wageningen, The Netherlands
4
Institute of Ocean Engineering, IIT Madras, Chennai, Tamil Nadu 600036, India
5
Laboratory for Organic-Geochemical Analysis, Institute of Geology and Geochemistry of Petroleum and Coal, RWTH Aachen University, 52056 Aachen, Germany
*
Author to whom correspondence should be addressed.
Water 2021, 13(12), 1648; https://doi.org/10.3390/w13121648
Submission received: 30 March 2021 / Revised: 4 June 2021 / Accepted: 8 June 2021 / Published: 11 June 2021
(This article belongs to the Special Issue Microplastics in Water Bodies and in the Environment)

Abstract

:
Microplastic particles are found in environmental compartments all over the world and receive a great deal of attention, especially in the aquatic environment. Currently, a particularly high input of microplastics via Asian rivers is assumed, but so far, there are hardly any data through field measurements. Three rivers in South India were considered for this purpose to focus on their microplastic load. The emphasis was on the comparison of microplastic concentrations in urban and rural rivers. While two rivers in the megacity Chennai (Tamil Nadu) were found to have an average microplastic concentration of 0.4 microplastic particles/L, a rural river near Munnar (Kerala) had an average concentration of 0.2 microplastic particles/L. Rough estimates of annual microplastic discharge from the Adyar River (Chennai) into the Bay of Bengal are found to be as high as 11.6 trillion microplastic particles. This study should be one of the first baseline studies for microplastic loads in South Indian streams and should be complemented with further environmental sampling before, during and after the monsoon season to get more detailed information on the storage and transportation of fluvial microplastics under different weather conditions.

1. Introduction

Microplastics (MPs), plastic particles with a diameter ≤5 mm [1], are ubiquitous anthropogenic contaminants that have spread into the aquatic, terrestrial and atmospheric environment [2,3,4,5,6,7]. MP is released into the environment via various sources and entry paths [8] either as primary MP, already in sizes smaller than 5 mm, or it degrades as secondary MP from larger pieces of plastic into smaller ones [1]. Fluvial systems are regarded as an important transport path for MPs from domestic sources into the oceans [9,10,11].
Lebreton et al. [11] used numerical simulations to assess the input of plastics into the oceans by rivers. They concluded that a high percentage of the plastic discharged via rivers comes from Asian rivers. The main reasons for the accumulation of plastics in the environment was cited as being the durability of the material, low recycling rates, poor waste management and maritime use. The simulation was therefore based on rates of mismanaged waste, population densities, monthly catchment runoff as well as the presence of artificial barriers such as dams. However, they did not include environmental sampling in their study.
According to Lebreton et al. [11], the second most polluted river of the world is claimed to be the Ganges (India), which discharges up to 1.05 × 10⁵ tons of plastic annually into the Indian Ocean. Napper et al. [12] took samples along the Ganges River and reported that the Ganges could release up to 1–3 billion MPs into the Indian Ocean on a daily basis. India, which inhabits currently 1.35 billion people, is the second most populated country in the world, and has insufficient waste management and wastewater treatment [13], leading to a high MP generation. When looking at the pollution potential, the so-called megacities, in which more than 10 million inhabitants have occupied in a comparatively small area, and wherein rapid economic development is in progress, are of particular interest. In Indian megacities, immigrants from rural areas often settle, adjoining the waterways [14]. In addition to informal settlements, which are generally not connected to the sewer systems, only 5% of the municipal solid waste and municipal waste water was treated in 2007, while the rest was directly discharged into the water bodies, carrying pollutants like heavy metals [13]. For this reason, studies on the heavy metal contents in Indian rivers have been increasingly carried out in recent years [13]. However, there are hardly any studies on environmental MP concentrations in Indian watercourses to date [12,15], since the focus was on MP in marine environments [16,17,18,19,20]. It can be assumed that, on the one hand, the effluents discharged contain MP and that, on the other hand, solid waste degrades to MP once introduced into the environment and thus enters freshwater systems, too.
In a recent review on microplastic research in India, Veerasingam et al. [21] highlighted the missing knowledge on baseline levels of microplastics in major rivers. The aim of this study was therefore a first insight into the MP pollution in Southern Indian rivers. The focus was on the effects of differently populated areas, which is why fluvial water samples were taken both in a megacity (Chennai, Tamil Nadu) and in a sparsely populated, rural area (Munnar, Kerala).

2. Materials and Methods

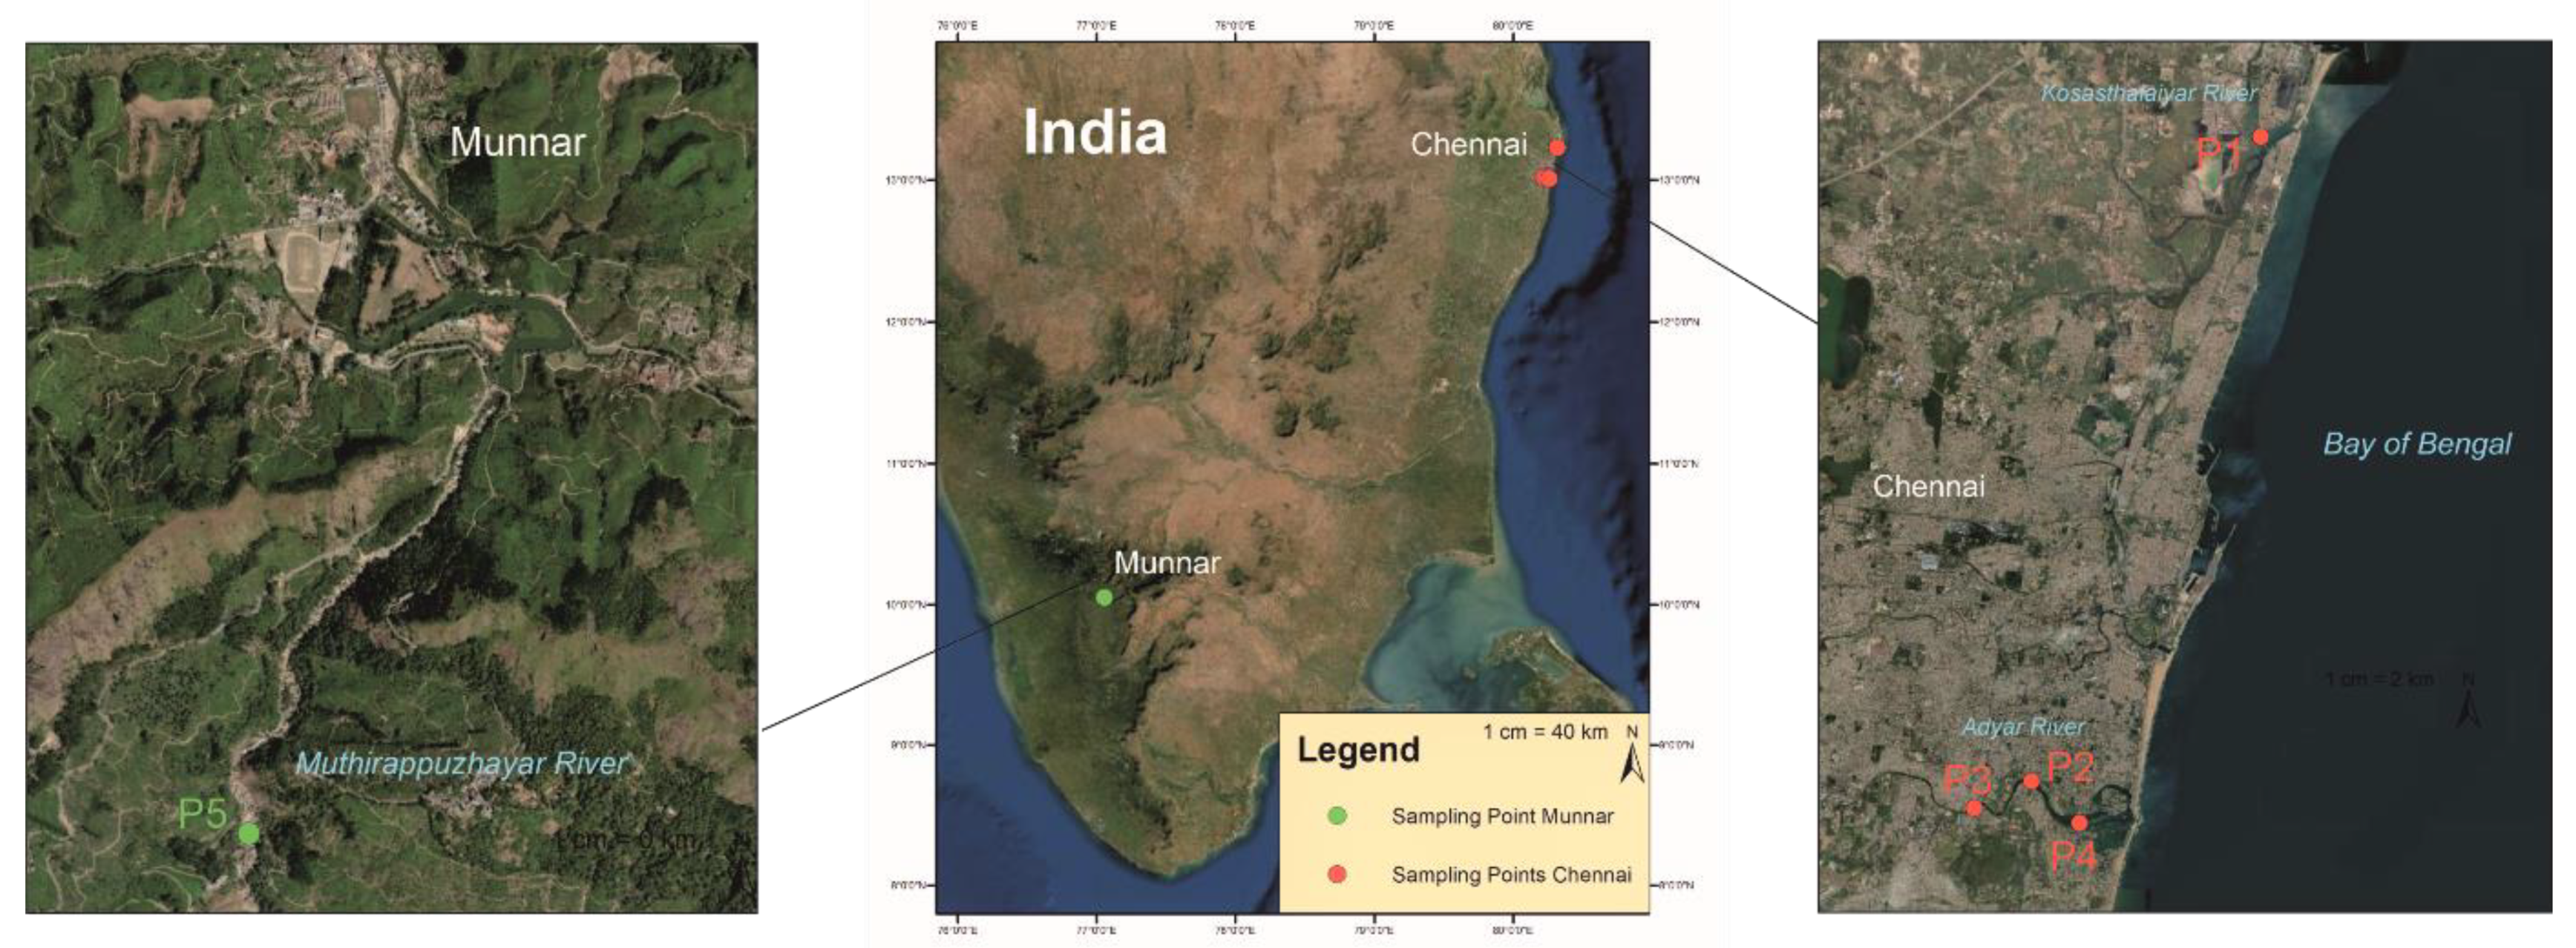
2.1. Selected Rivers
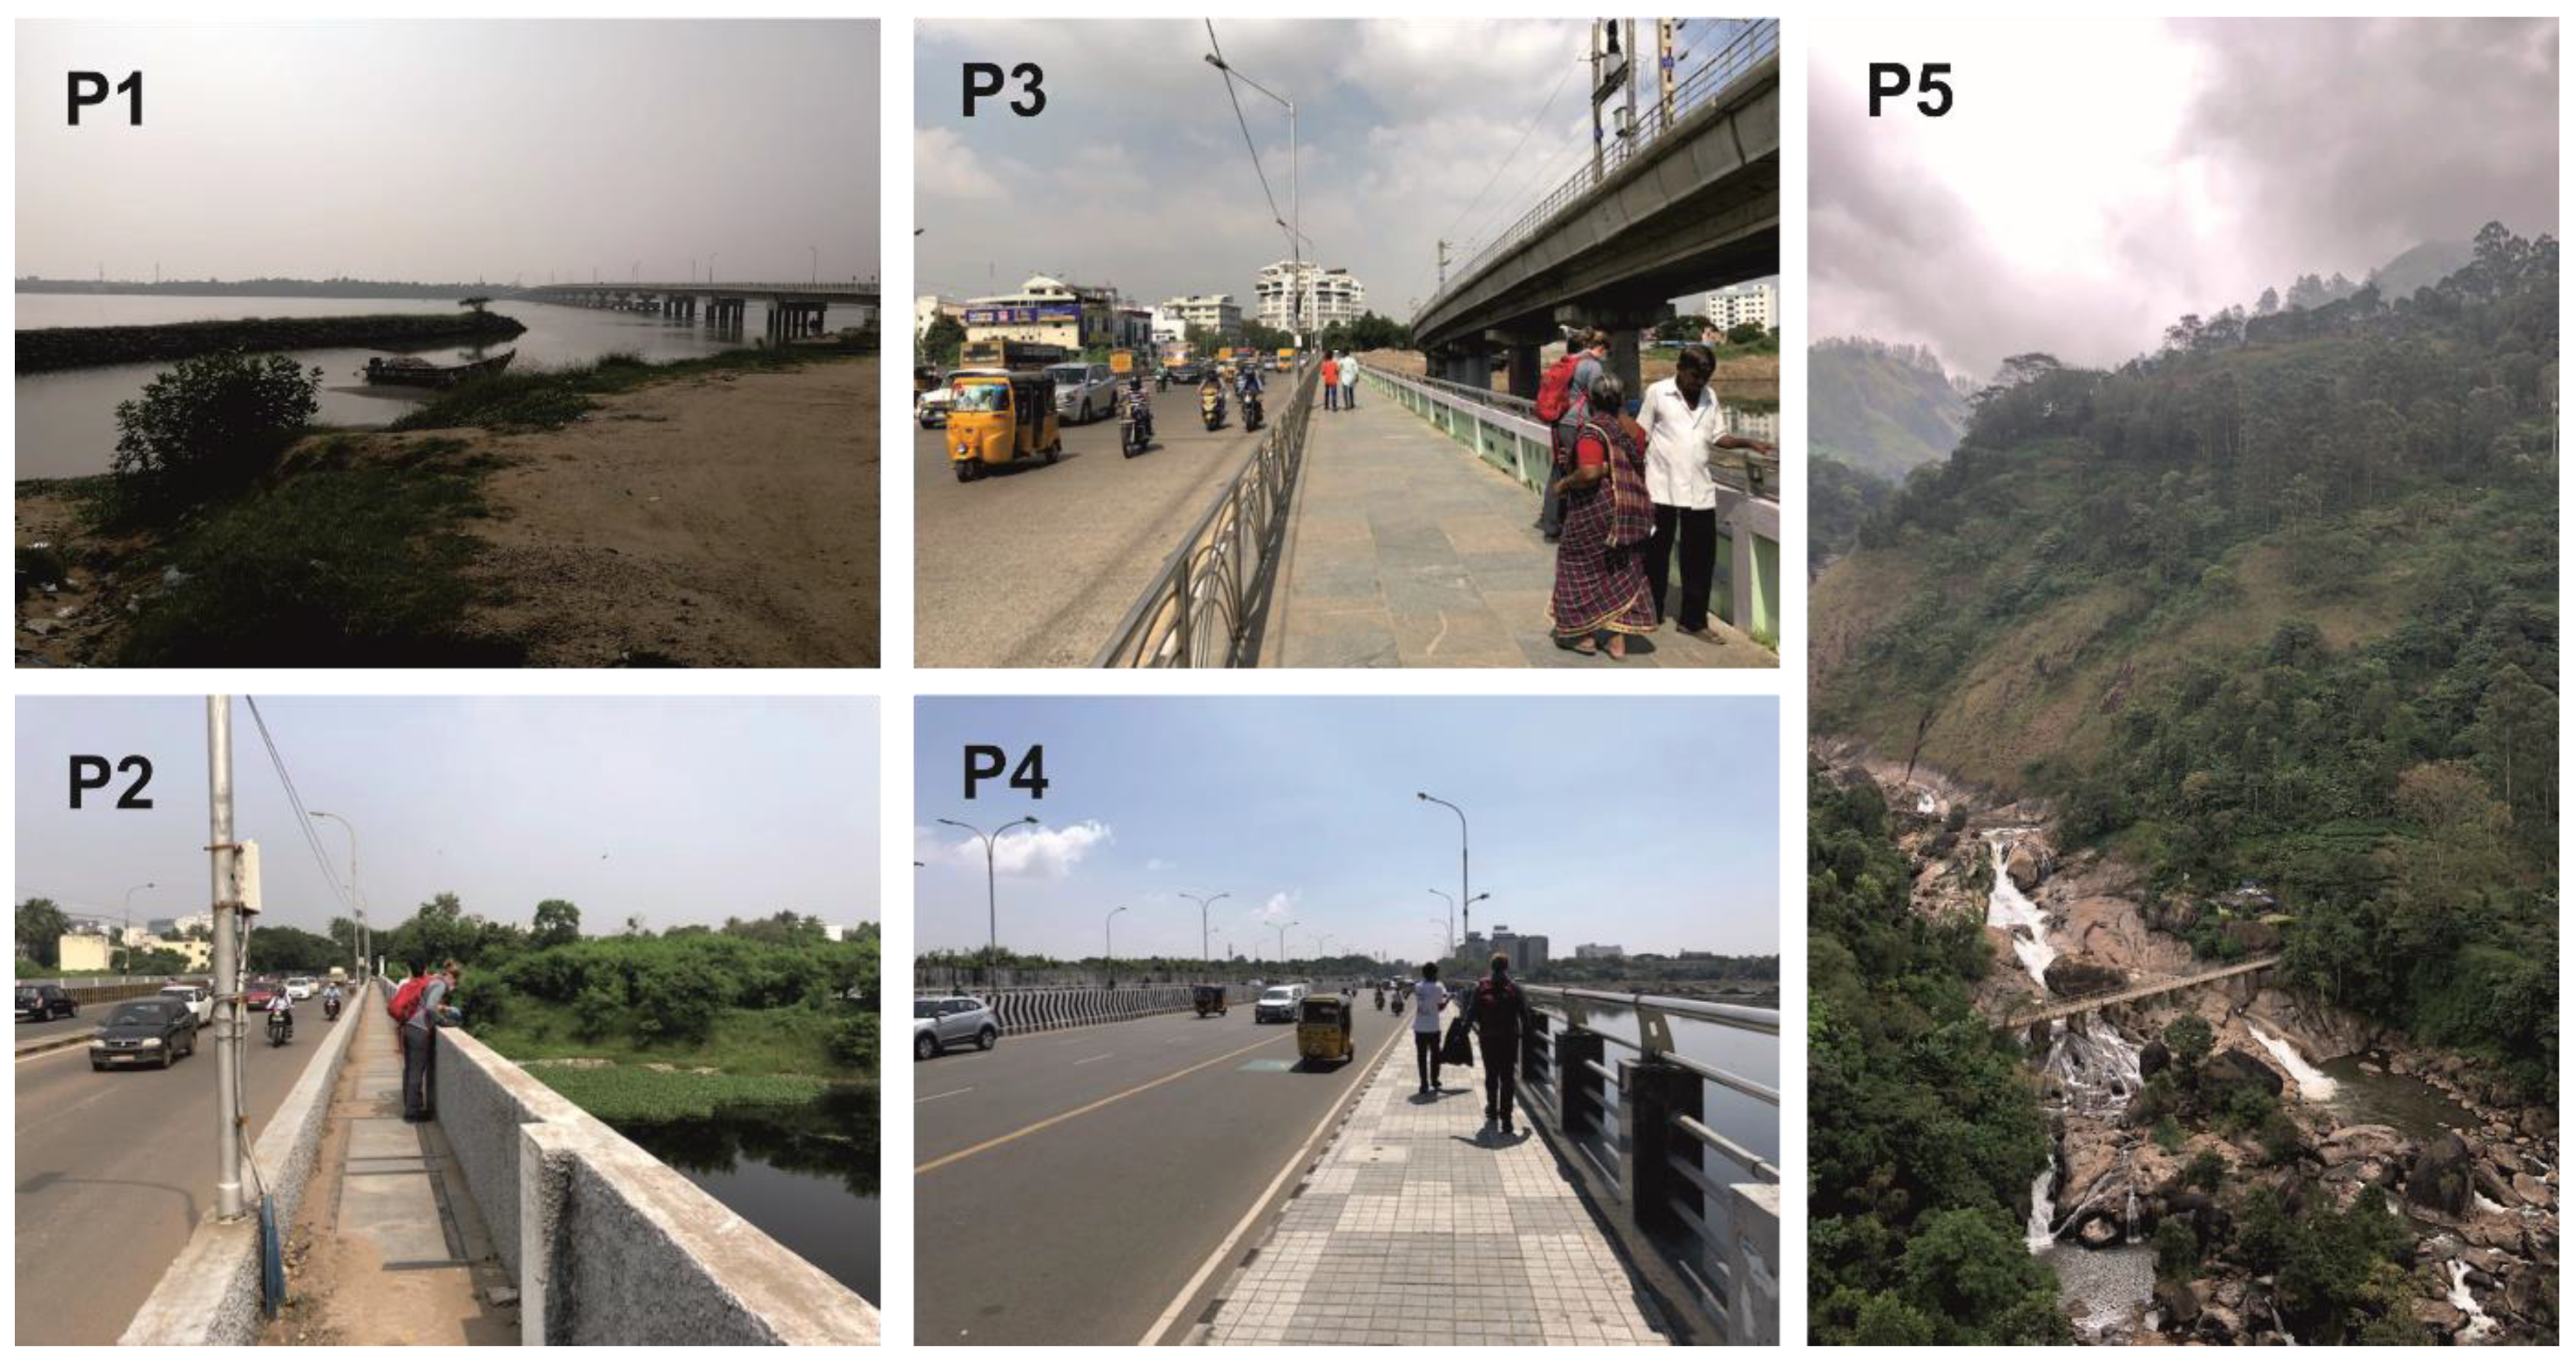
Two rivers, the Kosasthalaiyar River and the Adyar River, in the megacity Chennai (“13°4′57.72″ N, “80°16′14.52″ E) along the southeast, and one river, namely, the Muthirappuzhayar River in a rural area near Munnar (“10°5′20.04″ N, “77°3′34.2″ E) along the southwest coast of the Indian peninsula, were selected for MP sampling (see Figure 1) due to their highly differing catchment areas. With these two locations, it was possible to sample different anthropogenic influences determined by settlement areas and industrial or wastewater discharges.
Kosasthalaiyar River. The Kosasthalaiyar River, also known as the Kortalaiyar River, is one of the three major rivers in the Chennai metropolitan area and plays an important role in the water supply, food security and economic development of the city [22]. It has a length of 136 km, and flows, in addition to the city area, through a large industrial area north of the city before entering the Bay of Bengal at Ennore Creek, close to one of Chennai’s two major ports [22]. The catchment area is 3625 km2, and the river is between 150 and 250 m wide [23]. It only flows during the monsoon season between November and February, with little motion during the other periods of the year [23].
Adyar River. The Adyar River is one of the three big rivers in Chennai. Starting from Malaipattu Dam, it flows after almost 50 km and drain into the Bay of Bengal with the Adyar estuary at the end [14]. The catchment area of the Adyar, in which 200 lakes, small rivers and rainwater drain, is about 850 km2 large [24].
During the whole year barring the northeast monsoon season, the river is almost stagnant in the urban area and backwater forms in the Adyar Creek due to strong littoral drift of sand in front of the estuary, which closes the river mouth periodically [14,24]. If a current occurs in the river outside of monsoon season, it is mostly due to the discharge from sewage treatment plants and untreated discharge of wastewater and other waste from storm water outlets [24].
Contamination of the river by industrial and domestic effluents as well as saline water intrusion has been proven in the past [14,24]. In 1995, about 0.775 × 10⁶ litres/day of industrial effluents and about 8.1 × 10⁶ litres/day of domestic sewage were legally discharged into the Adyar [25]. With a rising population density from 5.93 M in 1995 to 10.71 M in 2019, an increased discharge quantity of those effluents may be assumed [26]. The rapid industrialisation and urbanisation has led to heavy pollution of the river, which is additionally intensified by informal settlements along the river banks [13,14]. Almost 19% of the city’s total population, estimated at 820,000 people, are living in such settlements [26]. Thus, the illegal discharge of wastewater and solid waste accounts for a sizeable part towards the pollution of the river. About 10% of the untreated wastewater in Chennai is discharged into the Adyar, with the remainder being discharged into the Buckingham Canal and the Cooum River [13]. In addition, a large proportion of the city’s solid waste is discharged into the river, too [13].
Muthirappuzhayar River. The Muthirappuzhayar River, also known as the Muthirapuzha River, is a main tributary of the Periyar River, which is the longest river in Kerala [27]. Located along the southern Western Ghats, it can be categorised as a remote mountain river with low anthropogenic influence [27]. In the river basin, land use/land cover is a mixture of mixed deciduous forests, scrubland, grassland and tea plantations [28]. The river has a total length of 37.81 km and the river basin, which lies in the Idukki district, spans over 275.71 km² [27,29]. The elevation of the river is between 740 and 2690 m above mean sea level, due to which the river has many waterfalls [27].

2.2. Sampling Sites

The sampling sites were located along the rivers in Chennai and Munnar and the samples were taken from five different bridges (see Figure 2). The Kosastalaiyar River was sampled three times (6th, 8th and 11th of November 2019) from Ennore Creek Flyover Bridge (cf. Table 1).
Along the Adyar River, samples were taken at three bridges, the Thiru-Vi-Ka Bridge, Kotturpuram Bridge and Anna Salai Bridge, within the urban area. All three sampling points are heavily frequented by motorised traffic and offer a pedestrian path. The individual sampling points were sampled three times over a period of 6 days with sampling on the 6th, 8th and 11th of November 2019 (see Table 1). While the river was almost stagnant at the Thiru-Vi-Ka Bridge and the Kotturpuram Bridge, there was a low current at the Anna Salai Bridge, caused by a discharge below the bridge.
The sampling point of the Muthirappuzhayar River was a bridge across the Attukad waterfalls, which is occasionally used by motorised vehicles and serves as a tourist destination. Next to the river is a small cafe, but there is no other building directly above the sampling area. About 8 km above of the sampling location, the river runs through Munnar, where two rivers, Nallathanni and Kundaly, flow into the Muthirappuzhayar River. According to Thomas et al. [27], who sampled at the same location as this study, the water in the Muthurappuzhayar river basin is suitable for drinking as the hydrochemical parameters are within the threshold values of WHO.
The rivers were sampled on 5 successive days, 22 to 26 November 2019 (cf. Table 1).

2.3. Meteorological Conditions

The sampling was carried out in November 2019, so that Chennai was supposed to be under the influence of the northeast monsoon season. Usually, Chennai receives significant rainfall during the month of November, but in 2019, it could receive just 355.3 mm during the months October to November, compared to an average of 567.8 mm, which corresponds to a deficit of 37% [30]. Therefore, pre-monsoon conditions need rather be assumed for Chennai.
Slightly different meteorological conditions apply to the second sampling location, Munnar in Kerala. The average annual rainfall in the sampled river basin is 3700 mm, with two major rainy seasons, the southwest monsoon (June–September) and the northeast monsoon (October–November), accounting for more than 85% of the annual rainfall. During the months of October and November 2019, the Idukki district had about 8.56% less rain than usual, with 520.4 mm being normal and 475.83 mm being the actual rainfall [31]. Thus, although it hardly rained during the sampling time, the northeast monsoon season can be assumed for the rural samples near Munnar.

2.4. Sampling Methodology

The water surface samples were taken with a Neuston Net (HYDRO-BIOS 438 217-001) including a detachable cod end (HYDRO-BIOS 438 930). The net bag of dimensions, 0.147 m high, 0.294 m wide and an opening of A = 0.043 m², was employed for the data collection. Although the mesh size of 335 μm was chosen based on common sampling methods [32], it needs to be mentioned that this relatively large mesh size can lead to flushing through of fibres and small particles and hence cause an underestimation of MP concentration [33]. To measure the total water flow for sampling, a mechanical flow meter (HYDRO-BIOS 438 110) was installed in the opening of the net. Thus, the flow rate for each sample was measured.
The sampling MP in rivers is either dynamic or stationary [34] and is commonly done with trawls from bridges [35] or towing trawls from a boat [36], which therefore requires a continuous flow [37]. Here, we used the Neuston Net stationary from the bridges at P1 and P5, in the presence of continuous flow, and also towed the net along the bridges at P2, P3 and P4 where, due to silting of the Adyar River’s estuary, no continuous flow was reached. Each sampling was conducted over 15 min.
Due to local conditions, it was not possible to implement a uniform sampling strategy (e.g., 3 measuring points per river each, equal time intervals between measurements in rural and urban environments). Thus, the results of the samplings provide a first insight into the microplastic loads in Indian rivers, but they must be viewed with caution under the influence of local and temporal variations.

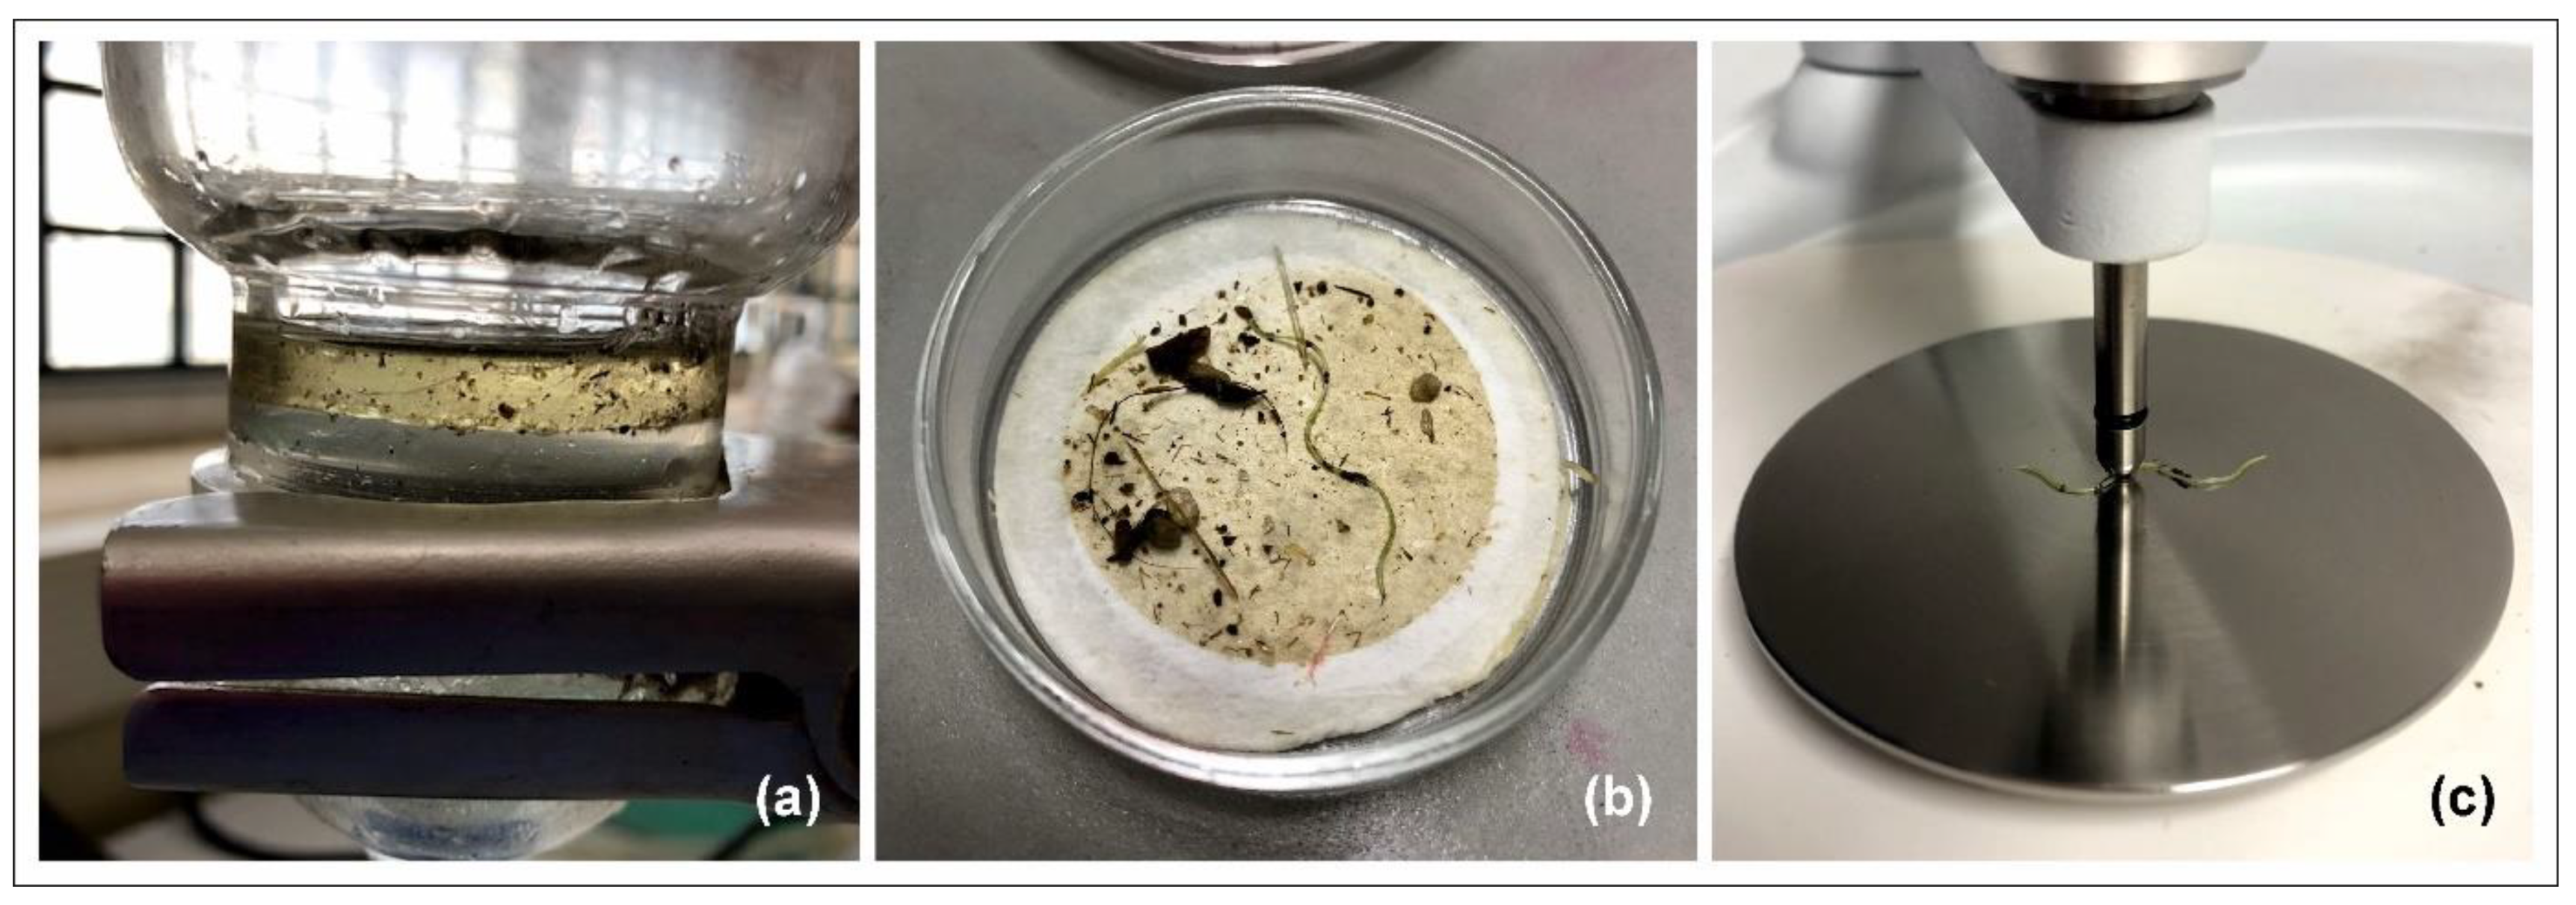
2.5. Sample Preparation and Analysis

All samples were prepared to separate MP particles from the river water and evaluated by microscope and partially with Fourier-transform infrared spectroscopy (FT-IR) analysis (cf. Figure 3).
The sample separation was done with oil extraction following the protocol of Lechthaler et al. [38] with canola oil to extract the possible MP particles from each sample, vacuum filtrate the oil layer on glass microfibre filters (Whatman® GF/F filters, pore size 0.7 µm, d = 47 mm) and rinsing these filters later with ethanol (96%) to avoid interferences with the following polymer identification by FT-IR analysis. The efficiency of this methodological procedure was shown in an extensive method validation [38] and already applied to numerous environmental samples from marine [39] and fluvial environments [40], thus the oil separation method was used in the present study. Due to the limited laboratory equipment on site, a beaker had to be used instead of the separation unit, which was covered during the settling time, from which the oil layer was subsequently decanted and vacuum-filtered on a glass microfibre filter. Additionally, blank samples (n = 6) were prepared and evaluated to identify possible cross contamination, which can occur during sample preparation in the laboratory [41] and cannot be totally excluded during sampling [42]. After separating the water samples with oil extraction, each filter was microscopically analysed according to the evaluation principles for microscopic MP identification [43,44,45] and all possible MP particles were counted, including information on shapes and colours. To include possible misidentification of MP particles, the microscopically counted particles were adjusted based on the MPs identified in the blank samples (shapes: 77.9% fibres, 22.1% fragments; colours: 67.4% black, 13.7% transparent, 6.3% blue, 6.3% red, 3.2% brown, 2.1% grey, 1.1% purple).
Partially, infrared spectroscopy was carried out to identify polymers (n = 23, corresponds to 5% of all microscopically identified particles). A FT-NIR Spectrometer by Perkin Elmer FT-IR Spotlight 400 with an ATR Imaging Accessory with a Germanium crystal and a Mercury Cadmium Telluride detector (MCT) was used. The database consisted of the most common polymers PE, PP, PET, PS, PMMA, PA, PU and PVC, a match of ≥70% was set for a correct polymer identification. Using the information about the polymers and the evaluation of the blank samples, the visually identified results were additionally corrected to identify MP concentrations. With the number of correctly identified MP particles by FT-IR analysis in relation to the total number of measured particles (n = 23) with diameters ≥0.5 mm (concerning fibres the diameter is equal to the fibres’ length), an error ratio perror was calculated according to Lechthaler et al. [40] by displaying the percentage of correctly identified polymers. In a second step, the average contamination per sample determined by the blank samples and corrected with perror (MPblank = 2.6 MP particles) was subtracted from the visually identified MP count (MPvis). Thus, the MP concentration (MPcorr) was calculated, which was later set in relation to the filtered flow volume to get the concentration of MP particles per litre. The following formula was used:
MPcorr = ((MPvis * perror) − MPblank)/V
with
MPvis [n/sample]:
Number of microscopically identified MP particles
perror [%]:
Theoretical error ratio of polymer identification
MPblank [n]:
Average number of MP particles occurring by cross contamination
V [L]:
Sampling volume determined by the mechanical flow meter
The MPcorr values determined in the unit MP particles /L are used subsequently as MP load.

2.6. Statistical Analysis

To consider possible correlations between microplastic concentrations and various influencing parameters, Pearson’s t-tests were run. Since the data need to be distributed normally for this test, first Kolmogorov–Smirnov tests were used to prove normal distribution with a significance level of α = 0.01. The sample size for the t-tests varied between n = 17 and n = 12, and all results were presented with r and p-values indicated to show if there is a correlation (r) and if it is significant (p < 0.05).

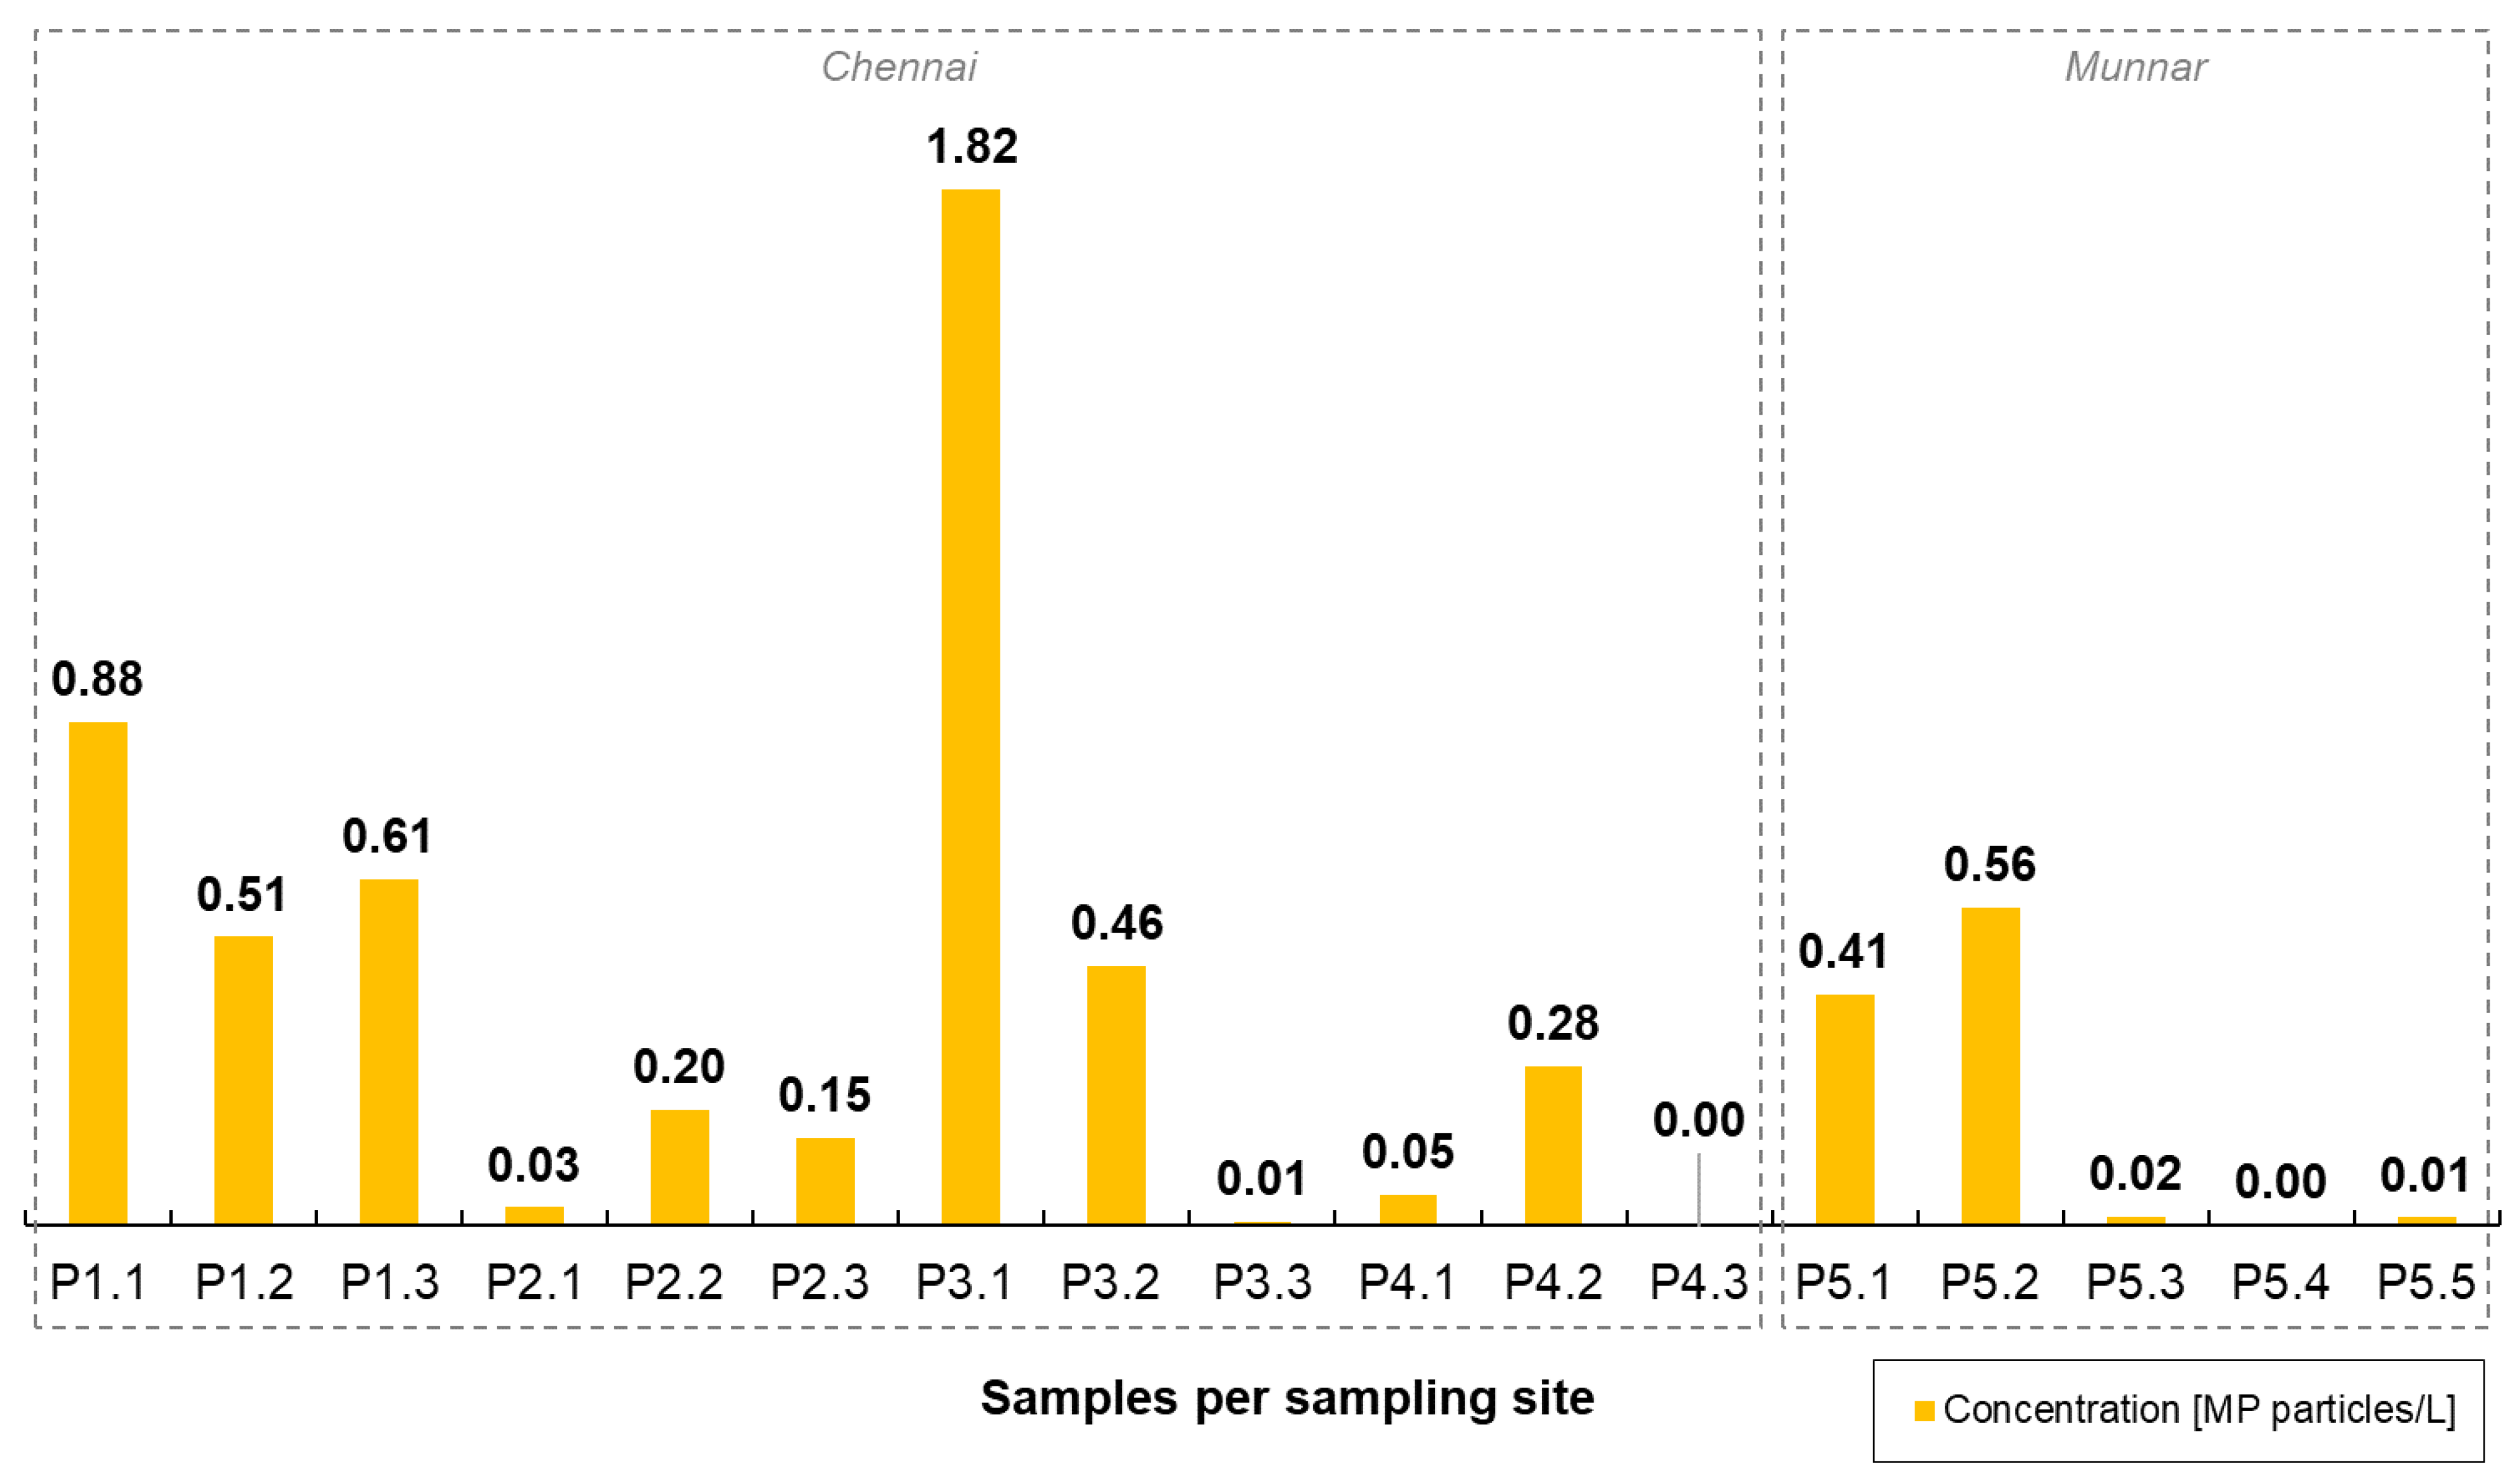
3. Results and Discussion

As described above, an error ratio perror was calculated (65.2%) by displaying the percentage of correctly identified polymers. The microscopic analysis corrected by the evaluation of the blank samples led to a total number of 447 MP particles; the major portion were fibres (64.1%), followed by films (21.7%), fragments (12.0%) and pellets (2.2%). Regarding the different colours of the MP particles including the correction based on the blank samples, most of them were black (44.8%), followed by red (30.4%) and white (14.2%). The MP particles had diameters between 335 µm and 5 mm (upper MP size limit) whereof particles with a diameter ≥0.5 mm were partially analysed by infrared spectroscopy. With the FT-IR analysis, three different polymers were identified, with PE (46.7%) being the most abundant polymer among all particles investigated, followed by PP (46.7%) and PS (6.7%). An overview of all the occurring shapes, colours and polymers is presented in Figure 4.
Including the calculation formula, the concentrations of MP particles per litre were determined for each of the samples (cf. Figure 5).
The highest MP load (1.82 particles/L) was detected in a sample from the Adyar River (P3.1), while the lowest MP load (0.00 particles/L) was determined for a sample from the Adyar River (P4.3) and for a sample from the Multhirappuzhayar River (P5.4). About the average MP concentration per sampling site, the concentrations were 0.11 particles/L (P4), 0.13 particles/L (P2), 0.20 particles/L (P5), 0.67 particles/L (P1) and 0.76 particles/L (P3), respectively. The average MP concentrations per litre for the three different rivers were 0.67 particles/L at the Kosasthalaiyar River, 0.33 particles/L at the Adyar River and 0.20 particles/L at the Multhirappuzhayar River.
A comparison of the two rivers in Chennai shows that the Kosasthalaiyar River (P1) has MP concentrations about twice as high as the Adyar River (P2, P3, P4), which might be due to its larger catchment area (3625 km² vs. 850 km²) and due to industrialisation around its catchment. Along the Adyar River, there were three sampling sites and the concentrations along the river course can thus be considered, too. The results demonstrated a decrease in MP concentration downstream from 0.76 particles/L (P3) to 0.13 particles/L (P2), to the lowest concentration of 0.11 particles/L (P4). This decrease can be explained by the retention of MP by sediment as a common process of MP transport in fluvial systems [46]. Since there was a very low flow rate in the Adyar River during sampling, no remobilisation could have taken place with an increasing flow velocity [46,47,48]. Therefore, previously deposited MP is not further transported and stored in the fluvial sediment as a temporary sink [8]. Additionally, it should be noted that due to the highly varying weather conditions in the study area, namely, the change from the monsoon and dry seasons, highly variable MP concentrations in the rivers can be assumed because of the changing flow velocities. In the Chennai area, the northeast monsoon usually occurs between October and December, while the rest of the year has less rain [49]. This study was supposed to sample in the monsoon time, but as no rain occurred during the sampling time in November, the samples probably represent the lower pollution limit for the rivers. The influence of the missing flow velocity and the associated remobilization of MP is additionally shown in the downstream decrease of MP concentration in the Adyar River. In any case, further long-term studies in the watercourses of the study area are necessary to get a comprehensive picture of the pollution in dependence to rain-induced flow rates of the rivers.
Comparing the MP load in the urban area of Chennai to the detected MP concentrations in the rural area of Munnar, the average concentrations show more MP in Chennai with high anthropogenic influences (0.40 particles/L) in contrast to Munnar with a lesser anthropogenic influence (0.20 particles/L).

3.1. Statistical Analyses

Another data evaluation was done by several statistical analyses. Pearson’s t-tests were run based on Kolmogorov–Smirnov tests that showed that the data were distributed normally (α = 0.01). Since the number of MPs in water surface samples is influenced by different parameters, the total corrected MP count (MPtotal, n = 17) as well as the number of corrected MP particles per particle shape (fibres, pellets, fragments, films, each with n = 17) were correlated with the flow volume V [L]. In general, the different influences during sampling are the chosen mesh size of the used net, which can lead to a smaller number of sampled MP particles. Besides the mesh size, the sampling depth and the flow volume also affect the occurrence of MPs and especially fibres [33]. In addition, the corrected MP concentrations CMP [MP particles/L] were correlated with the distance D from the sampling points P1–P4 to the river’s mouth (n = 12), to see whether the MP load is related to the location of the sampling site.
The correlation coefficients (r) as well as the p-values (p) of all analyses showed no significant correlations between MP particles, their shapes, sampled flow volume or the sampling location along the river. The related data are shown in Table 2. Although an influence of fibres in particular was expected with regard to the MP concentration, this could not be proven by the statistical tests.

3.2. Comparison to Other Studies

Regarding the sampled rivers. The rivers considered in this study have not yet been investigated about their MP load. There is only one 2021 study which analysed sediment from backwater near Chennai and detected 18 MP particles within one sample. The predominant polymer that has been identified was PET [50]. The detection of MP in sediment is thus retrospectively also an indication of the MP presence in water.
However, not only plastic itself, but also additives which can leach out in the water medium, can be a problem. Mukhopadhyay et al. [51] investigated the occurrence of important additives, namely plasticizers including PAEs (phthalic acid esters), DEHA (bis(2-ethyl hexyl adipate)) as well as bisphenol A, in two rivers in Chennai, the Adyar and Cooum rivers, and found high concentrations in the river sediments—although lower than the recommended serious risk concentration for human and for ecotoxicology. Recent studies revealed elevated concentrations of the plasticizer Mesamoll® (alkylsulfonic acid phenyl esters) of up to 10 µg/g (Helm et al. in prep). The elevated levels of these additives in the water were mostly at high wastewater activities and at places where plastic waste was burnt along the rivers. Additionally, there are already studies on heavy metal pollution in the Adyar River. As can be expected for the MP concentrations, Venugopal et al. [14] were able to show high seasonal differences in heavy metal concentrations along the Adyar River. Furthermore, Gowri et al. [52] found the highest transport rates of cadmium, lead and zinc during November, possibly due to heavy rains and strong surface runoff.
Concerning microplastic in Indian rivers. Napper et al. [12] detected an average MP contamination of 0.038 particles/L, with 91% of those particles being fibres from the samples from the surface water of the Ganges River in Northern India and Bangladesh. However, this concentration is much lower than the detected MP concentrations from the present study. It is to be mentioned that the former study used a different measuring technique—hand-operated bilge pump, filtered pre- and post-monsoon—which might influence the detected particle number.
Table 3 compares the concentrations from the present study with that detected from earlier MP concentrations in different aquatic environments in India.
Several studies, including the present study, found predominantly fibres, ranging from 37.9% [50], over 51.6% [15] and 64% (this study) up to 91% [12]. In this context, the difficulty of visually identifying fibres as MP must be pointed out. This can lead to incorrect classification, e.g., identifying natural fibres as synthetic cellulose fibres [33,41,42,58]. In addition, fibres may have entered the samples via cross contamination, such as contamination from the air, which can occur in laboratories [41] or during sampling [42].
Based on the mean MP concentration data and the average discharge in the Adyar River [59], the daily input of MP particles into the Bay of Bengal only though the Adyar River is estimated at about 31.8 billion. That accumulates to an annual discharge of 11.6 trillion (1012) MP particles. To compare the daily MP load of the Adyar River, Napper et al. [12] estimated a lower daily input of 1–3 billion MP particles by the Ganges River into the Bay of Bengal. However, there is no continuous flow in the Adyar River over the year, leading to the assumption that a huge amount of MP is stored within the river sediments during minimum flow rates. During the monsoon season, these can be remobilised again, which is why the input of MPs from the Adyar River into the Bay of Bengal may be concentrated over different time periods during the year and is strongly related to the weather conditions.

4. Conclusions

The studies on the MP concentrations in three different rivers in the south of the Indian peninsula, two under different high (urban) and one low (rural) anthropogenic influence are reported in this paper. Furthermore, the influences of additional external factors (flow rates, weather conditions) are demonstrated as well as the difficulty of missing the standardisation concerning MP sampling and evaluation. Nevertheless, the results from statistical analyses did not additionally prove the influences of external factors regarding MP concentrations in water surface samples. It must also be mentioned that, in terms of sampling strategy, the three rivers were not studied equally, as in the Kosasthalaiyar and Muthirappuzhayar rivers, one site was sampled continuously, whereas the Adyar River was sampled at three sites within the city. Thus, more sampling sites are needed in the Kosasthalaiyar and Muthirappuzhayar rivers in the future to further verify the results and derive more comprehensive conclusions, especially with regard to microplastic contamination along the watercourse.
There is a need for understanding the plastic pollution of the aquatic environment, especially of the fluvial environment, as pointed out by Wagner and Lambert [59]. Due to the rapid increase in population, the high level of industrial production as well as the low level of wastewater treatment and waste disposal infrastructure, the MP pollution of the aquatic environment along the study area is of interest. To the best of the knowledge of the authors, the present study is the first to compare urban and rural Indian rivers and to show that urban rivers are more heavily polluted.
The rough estimate of annual MP input of 11.6 trillion MP particles via the Adyar River into the Bay of Bengal is alarming and significantly higher than the input value for the Ganges, as reported by Napper et al. [12]. In a global comparison, Eriksen et al. [60] estimated that 5.25 trillion plastic pieces might be afloat at sea, which does not match the discharges quantity of MP particles determined herein. This highlights the uncertainties in MP research, as extrapolations are often made from small amounts of data, which greatly reduces their reliability [8]. To improve the accuracy of the data, further environmental sampling must be carried out in the future, the results of which should be combined with the basic information on transport behaviour of MP and through numerical simulations.

Author Contributions

Conceptualization, S.L., K.W. and H.S.; methodology, S.L., K.W. and C.G.S.; investigation, S.L., K.W. and C.G.S.; resources, S.A.S., J.S. and H.S.; writing—original draft preparation, S.L. and K.W.; writing—review and editing, S.L., K.W., V.S., J.S. and H.S.; supervision, S.A.S., V.S. and H.S. All authors have read and agreed to the published version of the manuscript.

Funding

This paper has received funding by the Indo-German Centre for Sustainability (IGCS) by travel grants for S.L. and K.W.

Institutional Review Board Statement

Not applicable.

Informed Consent Statement

Not applicable.

Data Availability Statement

Not applicable.

Acknowledgments

The authors gratefully acknowledge the scholarship of the Indo-German Centre for Sustainability (IGCS) provided to the visiting authors from Germany who made this research trip possible. Furthermore, they thank Mandana Mahjouri Rahimabadi and Christina Schwanen for their support during microplastic analysis. In addition, S.L. thanks the RWTH Scholarships for Doctoral Students and K.W. the DBU.

Conflicts of Interest

The authors declare that they have no known competing financial interests or personal relationships that could have appeared to influence the work reported in this paper.

References

  1. Arthur, C.; Baker, J.; Bamford, H. Proceedings of the International Research Workshop on the Occurrence, Effects and Fate of Microplastic Marine Debris, Tacoma, WA, USA, 9–11 September 2008.
  2. Horton, A.A.; Svendsen, C.; Williams, R.J.; Spurgeon, D.J.; Lahive, E. Large microplastic particles in sediments of tributaries of the River Thames, UK–Abundance, sources and methods for effective quantification. Mar. Pollut. Bull. 2017, 114, 218–226. [Google Scholar] [CrossRef] [Green Version]
  3. Van Cauwenberghe, L.; Vanreusel, A.; Mees, J.; Janssen, C.R. Microplastic pollution in deep-sea sediments. Environ. Pollut. 2013, 182, 495–499. [Google Scholar] [CrossRef]
  4. Claessens, M.; De Meester, S.; Van Landuyt, L.; De Clerck, K.; Janssen, C.R. Occurrence and distribution of microplastics in marine sediments along the Belgian coast. Mar. Pollut. Bull. 2011, 62, 2199–2204. [Google Scholar] [CrossRef]
  5. Peeken, I.; Primpke, S.; Beyer, B.; Gütermann, J.; Katlein, C.; Krumpen, T.; Bergmann, M.; Hehemann, L.; Gerdts, G. Arctic sea ice is an important temporal sink and means of transport for microplastic. Nat. Commun. 2018, 9, 1–12. [Google Scholar] [CrossRef] [Green Version]
  6. Dris, R.; Imhof, H.; Sanchez, W.; Gasperi, J.; Galgani, F.; Tassin, B.; Laforsch, C. Beyond the ocean: Contamination of freshwater ecosystems with (micro-)plastic particles. Environ. Chem. 2015, 12, 539–550. [Google Scholar] [CrossRef]
  7. Gasperi, J.; Wright, S.L.; Dris, R.; Collard, F.; Mandin, C.; Guerrouache, M.; Langlois, V.; Kelly, F.J.; Tassin, B. Microplastics in air: Are we breathing it in? Curr. Opin. Environ. Sci. Health 2018, 1, 1–5. [Google Scholar] [CrossRef] [Green Version]
  8. Waldschläger, K.; Lechthaler, S.; Stauch, G.; Schüttrumpf, H. The way of microplastic through the environment–Application of the source-pathway-receptor model (review). Sci. Total Environ. 2020, 713. [Google Scholar] [CrossRef] [PubMed]
  9. Meijer, L.J.J.; van Emmerik, T.; van der Ent, R.; Schmidt, C.; Lebreton, L. More than 1000 rivers account for 80% of global riverine plastic emissions into the ocean. Sci. Adv. 2021, 7. [Google Scholar] [CrossRef] [PubMed]
  10. Rech, S.; Macaya-Caquilpán, V.; Pantoja, J.; Rivadeneira, M.; Madariaga, D.J.; Thiel, M. Rivers as a source of marine litter–A study from the SE Pacific. Mar. Pollut. Bull. 2014, 82, 66–75. [Google Scholar] [CrossRef]
  11. Lebreton, L.C.M.; Van Der Zwet, J.; Damsteeg, J.-W.; Slat, B.; Andrady, A.; Reisser, J. River plastic emissions to the world’s oceans. Nat. Commun. 2017, 8, 15611. [Google Scholar] [CrossRef] [PubMed]
  12. Napper, I.E.; Baroth, A.; Barrett, A.C.; Bhola, S.; Chowdhury, G.W.; Davies, B.F.; Duncan, E.M.; Kumar, S.; Nelms, S.E.; Niloy, N.H.; et al. The abundance and characteristics of microplastics in surface water in the transboundary Ganges River. Environ. Pollut. 2021, 274. [Google Scholar] [CrossRef]
  13. Malik, N.; Biswas, A.K. Heavy metal pollution in surface water bodies of india: A review. Res. Environ. Life Sci. 2014, 7, 37–46. [Google Scholar]
  14. Venugopal, T.; Giridharan, L.; Jayaprakash, M. Characterization and Risk Assessment Studies of Bed Sediment of River Adyar: An Application of Speciation Study. Int. J. Environ. Res. 2009, 3, 581–598. [Google Scholar]
  15. Amrutha, K.; Warrier, A.K. The first report on the source-to-sink characterization of microplastic pollution from a riverine environment in tropical India. Sci. Total Environ. 2020, 739. [Google Scholar] [CrossRef] [PubMed]
  16. Karthik, R.; Robin, R.; Purvaja, R.; Ganguly, D.; Anandavelu, I.; Raghuraman, R.; Hariharan, G.; Ramakrishna, A.; Ramesh, R. Microplastics along the beaches of southeast coast of India. Sci. Total Environ. 2018, 645, 1388–1399. [Google Scholar] [CrossRef]
  17. Edward, J.P.; Mathews, G.; Raj, K.D.; Laju, R.; Bharath, M.S.; Kumar, P.D.; Arasamuthu, A.; Grimsditch, G. Marine debris—An emerging threat to the reef areas of Gulf of Mannar, India. Mar. Pollut. Bull. 2020, 151. [Google Scholar] [CrossRef]
  18. Robin, R.; Karthik, R.; Purvaja, R.; Ganguly, D.; Anandavelu, I.; Mugilarasan, M.; Ramesh, R. Holistic assessment of microplastics in various coastal environmental matrices, southwest coast of India. Sci. Total Environ. 2020, 703. [Google Scholar] [CrossRef]
  19. Vidyasakar, A.; Neelavannan, K.; Krishnakumar, S.; Prabaharan, G.; Priyanka, T.S.A.; Magesh, N.; Godson, P.; Srinivasalu, S. Macrodebris and microplastic distribution in the beaches of Rameswaram Coral Island, Gulf of Mannar, Southeast coast of India: A first report. Mar. Pollut. Bull. 2018, 137, 610–616. [Google Scholar] [CrossRef]
  20. Sruthy, S.; Ramasamy, E. Microplastic pollution in Vembanad Lake, Kerala, India: The first report of microplastics in lake and estuarine sediments in India. Environ. Pollut. 2017, 222, 315–322. [Google Scholar] [CrossRef]
  21. Veerasingam, S.; Ranjani, M.; Venkatachalapathy, R.; Bagaev, A.; Mukhanov, V.; Litvinyuk, D.; Verzhevskaia, L.; Guganathan, L.; Vethamony, P. Microplastics in different environmental compartments in India: Analytical methods, distribution, associated contaminants and research needs. TrAC Trends Anal. Chem. 2020, 133. [Google Scholar] [CrossRef]
  22. Bhuvana, N.; Savitha, S.; Durga Devi, G.; Prakash, P. A Correlation Study of the Major and Trace metals present in the riverine sediments of the river Kortalaiyar in Tamilnadu, India. Int. J. Chem. Tech. Res. 2015, 7, 3121–3125. [Google Scholar]
  23. Jagadeshan, G.; Anandasabari, K.; Poornavel, S. Groundwater quality of kosasthalaiyar river basin, thiruvallur district, Tamil Nadu, India. Int. J. Innov. Res. Eng. Technol. 2015, 4, 1164–1170. [Google Scholar]
  24. Ramesh, R.; Ramachandran Purvaja, G.; Chand Parashar, D.; Kumar Gupta, P.; Prasad Mitra, A. Anthropogenic Forcing on methane efflux from Polluted Wetlands (Adyar River) of Madras City, India. Ambio 1997, 26, 369–374. [Google Scholar]
  25. Nammalwar, P.; Pakshirajan, P. Ecotoxicological effects of industrial pollution in the estuarine Grey mullets with reference to aquaculture along the Madras coast. In Proceedings of the IV National Symposium on Environment, Madras, India, 7–10 February 1995. [Google Scholar]
  26. World Population Review. Chennai Population. 2019. Available online: http://worldpopulationreview.com/world-cities/chennai/ (accessed on 26 November 2019).
  27. Thomas, J.; Joseph, S.; Thrivikramji, K.P.; Manjusree, T.M.; Arunkumar, K.S. Seasonal variation in major ion chemistry of a tropical mountain river, the southern Western Ghats, Kerala, India. Environ. Earth Sci. 2013, 71, 2333–2351. [Google Scholar] [CrossRef]
  28. Prasannakumar, V.; Vijith, H.; Geetha, N.; Shiny, R. Regional Scale Erosion Assessment of a Sub-tropical Highland Segment in the Western Ghats of Kerala, South India. Water Resour. Manag. 2011, 25, 3715–3727. [Google Scholar] [CrossRef]
  29. Thomas, J.; Joseph, S.; Thrivikramji, K.P.; Abe, G.; Kannan, N. Morphometrical analysis of two tropical mountain river basins of contrasting environmental settings, the southern Western Ghats, India. Environ. Earth Sci. 2011, 66, 2353–2366. [Google Scholar] [CrossRef]
  30. India Meteorological Department. Seasonal Rainfall Distribution for Tamil Nadu & Puducherry of Date 26.11.2019. 2019. Available online: http://www.imdchennai.gov.in/dailyweekly.pdf (accessed on 26 November 2019).
  31. Meteorological Centre Thiruvananthapuram. Performance of North East Monsoon 2019 over Idukki: From 01-Oct-2019 to 26-Nov-2019. 2019. Available online: https://www.imdtvm.gov.in/index.php?option=com_content&task=view&id=63&Itemid=89 (accessed on 26 November 2019).
  32. Hidalgo-Ruz, V.; Gutow, L.; Thompson, R.C.; Thiel, M. Microplastics in the marine environment: A review of the methods used for identification and quantification. Environ. Sci. Technol. 2012, 46, 3060–3075. [Google Scholar] [CrossRef]
  33. Ryan, P.G.; Suaria, G.; Perold, V.; Pierucci, A.; Bornman, T.G.; Aliani, S. Sampling microfibres at the sea surface: The effects of mesh size, sample volume and water depth. Environ. Pollut. 2020, 258. [Google Scholar] [CrossRef]
  34. Campanale, C.; Savino, I.; Pojar, I.; Massarelli, C.; Uricchio, V.F. A Practical Overview of Methodologies for Sampling and Analysis of Microplastics in Riverine Environments. Sustainability 2020, 12, 6755. [Google Scholar] [CrossRef]
  35. Faure, F.; Demars, C.; Wieser, O.; Kunz, M.; De Alencastro, L.F. Plastic pollution in Swiss surface waters: Nature and concentrations, interaction with pollutants. Environ. Chem. 2015, 12, 582. [Google Scholar] [CrossRef]
  36. Mani, T.; Hauk, A.; Walter, U.; Burkhardt-Holm, P. Microplastics profile along the Rhine River. Sci. Rep. 2016, 5, 1–7. [Google Scholar] [CrossRef]
  37. Prata, J.C.; da Costa, J.P.; Duarte, A.C.; Rocha-Santos, T. Methods for sampling and detection of microplastics in water and sediment: A critical review. TrAC Trends Anal. Chem. 2019, 110, 150–159. [Google Scholar] [CrossRef]
  38. Lechthaler, S.E.; Hildebrandt, L.; Stauch, G.; Schüttrumpf, H. Canola oil extraction in conjunction with a plastic free separation unit optimises microplastics monitoring in water and sediment. Anal. Methods 2020, 12, 5128–5139. [Google Scholar] [CrossRef] [PubMed]
  39. Lechthaler, S.; Schwarzbauer, J.; Reicherter, K.; Stauch, G.; Schüttrumpf, H. Regional study of microplastics in surface waters and deep sea sediments south of the Algarve Coast. Reg. Stud. Mar. Sci. 2020, 40. [Google Scholar] [CrossRef]
  40. Lechthaler, S.E.; Esser, V.; Schüttrumpf, H.; Stauch, G. Why analysing microplastics in floodplains matters: Application in a sedimentary context. Environ. Sci. Process. Impacts 2021, 23, 117–131. [Google Scholar] [CrossRef]
  41. Wesch, C.; Elert, A.M.; Wörner, M.; Braun, U.; Klein, R.; Paulus, M. Assuring quality in microplastic monitoring: About the value of clean-air devices as essentials for verified data. Sci. Rep. 2017, 7, 1–8. [Google Scholar] [CrossRef] [PubMed]
  42. Scopetani, C.; Esterhuizen-Londt, M.; Chelazzi, D.; Cincinelli, A.; Setälä, H.; Pflugmacher, S. Self-contamination from clothing in microplastics research. Ecotoxicol. Environ. Saf. 2020, 189. [Google Scholar] [CrossRef]
  43. Noren, F. Small Plastic Particles in Coastal Swedish Waters. 2008. Available online: https://www.researchgate.net/publication/284312290 (accessed on 26 November 2019).
  44. Kanhai, L.D.K.; Officer, R.; Lyashevska, O.; Thompson, R.C.; O’Connor, I. Microplastic abundance, distribution and composition along a latitudinal gradient in the Atlantic Ocean. Mar. Pollut. Bull. 2017, 115, 307–314. [Google Scholar] [CrossRef] [PubMed]
  45. Lusher, A.L.; Bråte, I.L.N.; Munno, K.; Hurley, R.R.; Welden, N.A. Is It or Isn’t It: The Importance of Visual Classification in Microplastic Characterization. Appl. Spectrosc. 2020, 74, 1139–1153. [Google Scholar] [CrossRef]
  46. Waldschläger, K.; Schüttrumpf, H. Erosion Behavior of Different Microplastic Particles in Comparison to Natural Sediments. Environ. Sci. Technol. 2019, 53, 13219–13227. [Google Scholar] [CrossRef]
  47. Hurley, R.; Woodward, J.; Rothwell, J.J. Microplastic contamination of river beds significantly reduced by catchment-wide flooding. Nat. Geosci. 2018, 11, 251–257. [Google Scholar] [CrossRef]
  48. Nizzetto, L.; Bussi, G.; Futter, M.N.; Butterfield, D.; Whitehead, P.G. A theoretical assessment of microplastic transport in river catchments and their retention by soils and river sediments. Environ. Sci. Process. Impacts 2016, 18, 1050–1059. [Google Scholar] [CrossRef] [PubMed]
  49. Selvam, V.; Hariprasad, V.; Mohan, R.; Ramasubramanian, R. Diurnal variations in the water quality of sewage polluted Adyar mangrove water, east coast of India. Indian J. Mar. Sci. 1994, 23, 94–97. [Google Scholar]
  50. Konechnaya, O.; Schwanen, C.; Schwarzbauer, J. Application of multi-step approach for comprehensive identification of microplastic particles in diverse sediment samples. Water Sci. Technol. 2021, 83, 532–542. [Google Scholar] [CrossRef] [PubMed]
  51. Mukhopadhyay, M.; Sampath, S.; Muñoz-Arnanz, J.; Jiménez, B.; Chakraborty, P. Plasticizers and bisphenol A in Adyar and Cooum riverine sediments, India: Occurrences, sources and risk assessment. Environ. Geochem. Health 2020, 42, 2789–2802. [Google Scholar] [CrossRef]
  52. Gowri, V.S.; Ramachandran, S.; Ramesh, R.; Pramiladevi, I.R.R.; Krishnaveni, K. Application of GIS in the study of mass transport of pollutants by Adyar and Cooum Rivers in Chennai, Tamilnadu. Environ. Monit. Assess. 2007, 138, 41–49. [Google Scholar] [CrossRef] [PubMed]
  53. Gopinath, K.; Seshachalam, S.; Neelavannan, K.; Anburaj, V.; Rachel, M.; Ravi, S.; Bharath, M.; Achyuthan, H. Quantification of microplastic in Red Hills Lake of Chennai city, Tamil Nadu, India. Environ. Sci. Pollut. Res. 2020, 27, 33297–33306. [Google Scholar] [CrossRef]
  54. Srinivasalu, S.; Natesan, U.; Ayyamperumal, R.; Kalam, N.; Anbalagan, S.; Sujatha, K.; Alagarasan, C. Microplastics as an emerging threat to the freshwater ecosystems of Veeranam lake in south India: A multidimensional approach. Chemosphere 2021, 264. [Google Scholar] [CrossRef]
  55. Ganesan, M.; Nallathambi, G.; Srinivasalu, S. Fate and Transport of Microplastics from Water Sources. Curr. Sci. 2019, 117, 1879. [Google Scholar] [CrossRef]
  56. Patterson, J.; Jeyasanta, K.I.; Sathish, N.; Booth, A.M.; Edward, J.P. Profiling microplastics in the Indian edible oyster, Magallana bilineata collected from the Tuticorin coast, Gulf of Mannar, Southeastern India. Sci. Total Environ. 2019, 691, 727–735. [Google Scholar] [CrossRef]
  57. Eriksen, M.; Liboiron, M.; Kiessling, T.; Charron, L.; Alling, A.; Lebreton, L.; Richards, H.; Roth, B.; Ory, N.C.; Hidalgo-Ruz, V.; et al. Microplastic sampling with the AVANI trawl compared to two neuston trawls in the Bay of Bengal and South Pacific. Environ. Pollut. 2018, 232, 430–439. [Google Scholar] [CrossRef] [PubMed]
  58. Comnea-Stancu, I.R.; Wieland, K.; Ramer, G.; Schwaighofer, A.; Lendl, B. On the Identification of Rayon/Viscose as a Major Fraction of Microplastics in the Marine Environment: Discrimination between Natural and Manmade Cellulosic Fibers Using Fourier Transform Infrared Spectroscopy. Appl. Spectrosc. 2017, 71, 939–950. [Google Scholar] [CrossRef] [PubMed]
  59. Wagner, M.; Lambert, S. Microplastics Are Contaminants of Emerging Concern in Freshwater Environments: An Overview. In Freshwater Microplastics: Emerging Environmental Contaminants? Wagner, M., Lambert, S., Eds.; Springer: Berlin, Germany, 2018; pp. 1–24. [Google Scholar]
  60. Eriksen, M.; Lebreton, L.C.M.; Carson, H.S.; Thiel, M.; Moore, C.J.; Borerro, J.C.; Galgani, F.; Ryan, P.G.; Reisser, J. Plastic Pollution in the World’s Oceans: More than 5 Trillion Plastic Pieces Weighing over 250,000 Tons Afloat at Sea. PLoS ONE 2014, 9. [Google Scholar] [CrossRef] [PubMed] [Green Version]
Figure 1. Overview map of all sampling sites in Chennai (urban area: high anthropogenic influence) and Munnar (rural area: low anthropogenic influence) (data basis: Arc GIS Basemap).
Water 13 01648 g001
Figure 2. Sampling sites: P1—Ennore Creek Flyover Bridge (Chennai), P2—Anna Salai Bridge (Chennai), P3—Kotturpurnam Bridge (Chennai), P4—Thiru-Vi-Ka Bridge (Chennai), P5—Attukad Waterfalls Bridge (Munnar).
Water 13 01648 g002
Figure 3. Images of the different separation and evaluations steps: (a) oil extraction, (b) microscopic analysis and (c) polymer identification.
Water 13 01648 g003
Figure 4. Percentages of shapes, colours and polymers of the identified MPs from all samples.
Water 13 01648 g004
Figure 5. Average and corrected MP concentrations per litre at each sampling site of the urban area in Chennai (P1–P4) and the rural area in Munnar (P5).
Water 13 01648 g005
Table 1. Sampling parameters of the five sampling sites.
RiverSampling PointNumberCoordinatesSampling Dates
Kosasthalaiyar (Chennai)Ennore Creek Flyover Bridge (P1)3“13°13′45.88″ N″ “80°19′8.08″ E″06, 08, 11 November 2019
Adyar
(Chennai)
Anna Salai Bridge (P2)3“13°1′33.80″ N″ “80°14′37.27″ E″06, 08, 11 November 2019
Adyar
(Chennai)
Kotturpurnam Bridge (P3)3“13°1′2.44″ N″ “80°13′30.15″ E″06, 08, 11 November 2019
Adyar
(Chennai)
Thiru-Vi-Ka Bridge (P4)3“13°0′46.98″ N″ “80°15′33.18″ E″06, 08, 11 November 2019
Muthirappuzhayar (Munnar)Attukad Waterfalls Bridge (P5)5“10°3′12.39″ N″ “77°3′31.47″ E″22, 23, 24, 25, 26 November 2019
Table 2. Correlation analyses with Pearson’s t-test for filtered flow volume V [L] with the total MP number (MPtotal) and the number of different shapes as well as the MP concentration CMP [MP particles/L] in contrast to the distance D from sampling points to the river’s mouth.
ParameterMPtotal/VFibres/VPellets/VFragments/VFilms/VCMP/D
r [-]−0.06−0.090.15−0.050.11−0.20
p [-]0.8290.7270.5570.8490.6610.559
Table 3. Comparison of the detected concentrations of MP in aquatic environments with data from literature.
CompartmentLocationAverage MP ConcentrationReference
River Adyar River, Tamil Nadu0.33 particle/LThis study
Kosasthalaiyar River, Tamil Nadu0.67 particle/LThis study
Multhirappuzhayar River, Kerala0.20 particle/LThis study
Ganges, India/Bangladesh0.038 particle/LNapper et al. (2021) [12]
Netravathi River, Karnataka288 pieces/m³Amrutha and Warrier (2020) [15]
LakeRed Hills Lake, Tamil Nadu5.9 particles/LGopinath et al. (2020) [53]
Veeranam Lake, Tamil Nadu28 items/km2Bharath K et al. (2021) [54]
CoastIn front of Kerala, southwest coast of India1.25 ± 0.88 particles/m3Robin et al. (2020) [18]
Chennai marina11 items/LGanesan et al. (2019) [55]
Tuticorin, Gulf of Mannar12.14–31.05 items/LPatterson et al. (2019) [56]
Offshore of Bay of Bengal16,107 ± 47,077 items/km2Eriksen et al. (2018) [57]
Publisher’s Note: MDPI stays neutral with regard to jurisdictional claims in published maps and institutional affiliations.

