Article

Flash Flood Susceptibility Assessment and Zonation Using an Integrating Analytic Hierarchy Process and Frequency Ratio Model for the Chitral District, Khyber Pakhtunkhwa, Pakistan

1
National Engineering Research Center for Geographic Information System (NERCGIS), School of Geography, China University of Geosciences, Wuhan 430074, China
2
Key Laboratory of Digital Earth Science, Aerospace Information Research Institute, Chinese Academy of Sciences, Beijing 100094, China
3
State Key Laboratory of Information Engineering in Surveying, Mapping and Remote Sensing (LIESMARS), Wuhan University, Wuhan 430079, China
4
Airborne Remote Sensing Center, Aerospace Information Research Institute, Chinese Academy of Sciences, Beijing 100094, China
*
Author to whom correspondence should be addressed.
The two authors listed share first authorship.
Water 2021, 13(12), 1650; https://doi.org/10.3390/w13121650
Submission received: 8 March 2021 / Revised: 4 June 2021 / Accepted: 8 June 2021 / Published: 12 June 2021
(This article belongs to the Section Hydrology)

Abstract

:
Pakistan is a flood-prone country and almost every year, it is hit by floods of varying magnitudes. This study was conducted to generate a flash flood map using analytical hierarchy process (AHP) and frequency ratio (FR) models in the ArcGIS 10.6 environment. Eight flash-flood-causing physical parameters were considered for this study. Five parameters were based on the digital elevation model (DEM), Advanced Land Observation Satellite (ALOS), and Sentinel-2 satellite, including distance from the river and drainage density slope, elevation, and land cover, respectively. Two other parameters were geology and soil, consisting of different rock and soil formations, respectively, where both layers were classified based on their resistance against water percolation. One parameter was rainfall. Rainfall observation data obtained from five meteorological stations exist close to the Chitral District, Pakistan. According to its significant importance in the occurrence of a flash flood, each criterion was allotted an estimated weight with the help of AHP and FR. In the end, all the parameters were integrated using weighted overlay analysis in which the influence value of the drainage density was given the highest value. This gave the output in terms of five flood risk zones: very high risk, high risk, moderate risk, low risk, and very low risk. According to the results, 1168 km2, that is, 8% of the total area, showed a very high risk of flood occurrence. Reshun, Mastuj, Booni, Colony, and some other villages were identified as high-risk zones of the study area, which have been drastically damaged many times by flash floods. This study is pioneering in its field and provides policy guidelines for risk managers, emergency and disaster response services, urban and infrastructure planners, hydrologists, and climate scientists.

1. Introduction

Flood disasters have become the most frequent natural phenomenon due to climate change and environmental factors. There is a significant threat to human lives worldwide because most countries are susceptible to flood hazards, and it causes different types of damage, such as physical, social, and economic damage. Floods cause damage everywhere, especially in agricultural areas and infrastructure sectors near rivers. This phenomenon may be due to no proper mapping or preventive measures or different parameters, such as the drainage density and slope. Floods occur due to several reasons. Heavy rainfall is one of the significant reasons behind floods. Floods are caused when it rains heavily and discharge exceeds the capacity of rivers, dams, and canals [1,2,3]. Flood risk modeling is an essential strategy for flood management and mitigation [4,5]. Furthermore, some human factors affect recurrent floods, among which are changes in land use, channel manipulation, construction of bridges, barrages, agriculture practices in river beds, and deforestation [6,7,8]. Therefore, initial measures should be taken to minimize flood hazard damage. Such susceptibility analysis needs to be done, and risk analysis should be performed as early as possible [9,10].
Nowadays, susceptibility analysis has become famous in GIS (Esri Inc., Redlands, CA, USA) and remote sensing techniques [11,12]. Remote sensing helps to gather information about features of topographic surfaces, the vegetation cover, the land, the effects of climate change, and many other relevant data of various regions. Simultaneously, GIS techniques help to prepare a spatial database by using remote sensing data for flood mapping. RS (Remote Sensing) and GIS (Geographic Information System) techniques have been useful for urban flood hazards throughout the world by using multi-criteria zoning decision analysis in the Argentinian province of Tucuman [13]. For flood susceptibility, zonation images are gathered through remote sensing, such as Landsat 5 (Thematic Mapper), Landsat 7 (Enhanced Thematic Mapper Plus), Landsat 8 (Operational Land Imager), and Satellite Pour Observation Terre (SPOT) [14,15]. The ANN (Artificial Neural Network) model for flood imitation with GIS was utilized in the Johor River Basin (Malaysia). The flood susceptibility mapping was predicted and validated using the frequency ratio model and GIS techniques in the Johor River Basin [16,17]. In India, while analyzing Kosi river basin mapping of flood risk evaluation, [16] used GIS and RS techniques. Furthermore, GIS is used for predicting spatial areas susceptible to flooding [12]. It is also used for flood susceptibility analysis, as well as for its validations [13]. In Iran, flood mapping using GIS-based frequency ratio models and flood susceptibility assessments was done in the province of Golestan [18,19]. Therefore, numerous research works integrate GIS and RS techniques that were beneficial for mapping flood risk management.
The results of various GIS-based statistical analyses are more acceptable, accurate, and logical than only using a spatial database. The analytical hierarchy process (AHP) with GIS for the mapping of floods has become popular [20,21]. The logistic regression [22], Shannon’s entropy model [16], decision tree [19,23], ANN [18], FRM [8,12], fuzzy logic [19], and AHP models were utilized for susceptibility mapping of floods. The AHP model is a widely used efficient technique that is easily utilized and understandable [18,21,24,25,26]. Furthermore, for the bivariate statistical technique, frequency ratio (FR) is an important quantifiable method and acknowledged in the study of natural disasters [8,12,27].
There have been sporadic disasters and emergencies in the last ten years due to flash floods, landslides, avalanches, and glacier lake outburst floods (GLOFs), resulting in the loss of human and animal lives, and partial or complete damage to infrastructure [28]. Pakistan is exposed to various hazards, including waterlogging, riverbank erosion, floods, cyclones, earthquakes, drought, desertification, landslides, heatwaves, GLOFs, and water salinity. Pakistan has experienced 25 calamities from 2000–2015 in which floods, earthquakes, and landslides were the most common [20,23,29,30,31,32]. During the last six years, there have been glacier outbursts in two major areas: upper Chitral Sonoghour and Booni. Recently, on 2 August 2013, unusually heavy rain in the upper pastures of Reshun village caused an unprecedented flash flood. Similarly, in July 2015, the heavy rainfall on the upper barren land of low altitude pasture above the village changed the rill into a heavy flash flood. Structures were destroyed, irrigation channels and linking roads were damaged, and gardens, crops, and orchards were washed away [2].
Modeling flood susceptibility is one of the latest strategies used for dealing with flood disasters. The study area (Chitral District) experiences recurrent floods, which cause damage to infrastructure, standing crops, and earning sources, and even lead to human casualties. There is a lack of flood susceptibility assessment and mapping. Flood modeling could also be considered to develop routing of floodwater by considering the interaction of physical parameters. Flood risk modeling is essential in river management [33]. It involves factors such as drainage density, slope, land use, elevation, rainfall deviation, lithology, and land use/cover. All these factors can be used with the help of Multi Criteria Analysis-Analytic Hierarchy Process (MCA-AHP) and FR to identify very high to very low susceptibility zones. This study was an attempt to model the risk susceptibility and zonation in the floodplain of Chitral District. With the integration of GIS, many hydraulic models have been used for flood hazard evaluation. Flood modeling is a central part of flood risk reduction that aims to reduce the weakness of components in danger. This study was pioneering research in its field since no such study has been carried out so far in Pakistan, especially in the study area. Hence, it will provide guidelines for policymakers dealing with flood hazards, particularly in Chitral District.
Due to its river, Chitral’s floodplain is highly susceptible to recurrent flooding during the summer season. Almost every year, severe damage is caused to standing crops and infrastructure, as well as causing animal and human casualties. Population settlements are encroaching toward risky locations in the study area. A considerable number of villages are next to the river catchment. One main problem is that there are no known accurate flood zone methods in the Chitral municipality that provide information about floods to the municipal department, leaving Chitral more vulnerable to significant environmental, economic, and social damage [34]. Historical data indicate that three extreme and seven moderate flood incidences occurred between 2010 and 2015 in Pakistan’s Chitral region, which destroyed natural resources and thousands of lives. To emphasize this problem, attempts were made to research certain factors to better identify and forecast areas that are more vulnerable to flooding. This study was conducted to reduce flood disasters in the Chitral river of Chitral District, as no such study has been conducted in this area before. This research also identified the spatial pattern of flash flood hazards through AHP and FR models [35]. This research highlights the flood hazards and provides information for flood risk management policies to policymakers or the local government of Khyber Pakhtunkhwa province, Pakistan.
The key objective of this analysis was based on developing and applying quantitative analysis techniques with the integration of GIS for flood-susceptible mapping in the Chitral region of Khyber Pakhtunkhwa (KPK), Pakistan, and to estimate areas at risk. The GIS, FR, and AHP analysis results were further used for the detection and spatial mapping of flood risk areas for the Chitral region. FR and AHP models were used to evaluate the possible areas that were flood-prone. These results will be beneficial for planners, researchers, and the local government for impact assessment to predict the flood zones in the future and mitigate the risk of flood by developing different strategies. Therefore, the study used FR and MCA by utilizing AHP with GIS to generate flash flood hazard zonation to specify the high-risk areas and identify the most critical factor responsible for flash floods in the study area.

2. Materials and Methods

Chitral is located within 35°14′00″ N to 36°56′00″ N and 71°11′00″ E to 73°42′00″ E, with an area of 14,850 km2 [36]. Geographically, on the eastern side of Chitral, the Ghizer District of Gilgit Baltistan and the Swat District are situated. Afghanistan is on the northwest side of Chitral, and on the southern side, Upper Dir is situated. Khyber Pakhtunkhwa (KPK) is the northwestern province of Pakistan and Chitral is the biggest district in this province [21,37,38]. This city is also known as Chitral and Qashqai. Chitral is undoubtedly the most sentimental, dazzling, and captivating spot in the lofty Hindukush Range. Chitral is one of the most elevated areas of KPK Province. Chitral’s elevation sweeps from 1094 m at Arandu to 7726 m at Tirchmir. There are more than 40 peaks in Chitral. Tirchmir is the most noteworthy pinnacle of the Hindu Kush, with a height of 7708.08 m. The terrain of Chitral is hilly. Timberland covers nearly 4.8% of Chitral’s land and mountains.
Chitral River has diversity in the riverbed, channel gradient, and channel width. The river valley is broad, having a mild incline and sidelong disintegration at certain upper reaches. Furthermore, the stream valley of Chitral is thin and is characterized by horizontal and vertical disintegration. The whole area of Chitral is a sloping landscape. This area has significant flood-causing factors, such as snow, liquefying glaciers, and high amounts of monsoon rain. The immediate effects of obliterating floods include human, property, and infrastructure loss. The degraded sub-tropical scour woods secure the low-elevation regions, while temperate forests secure the higher height zones. However, the study region is presented with numerous hydro-meteorological calamities, mostly flash floods and riverine floods [37,39].

3. Collection and Preparation of Data

3.1. Inventory of Flash Floods

The accuracy of established flash flood susceptibility maps is significantly impaired by the inaccurate mapping of previous flash flood events. To forecast potential flash flood events in a city, records of the area’s previous flash flood events must be available [40]. These events depend on many factors, including the distance from the river, drainage density, slope, elevation, rainfall, soil, geology, and land-use/cover activities. These factors are essential for planning the inventory of flash floods and the forecast of possible flash flood events. In this analysis, 300 flood and non-flood points were randomly chosen from the flooded region and low-flood-likelihood high-altitude areas used for training and testing data sets (Figure 1 and Figure 2). These points were arbitrarily split into 70% for training data points and 30% for validation purposes.

3.2. Conditioning Factors of Flash Floods

In order to achieve acceptable and the best outcomes, the most vital stage of any risk assessment and zonation is to select appropriate factors or decision criteria to get suitable and best results.
Natural disasters, such as floods, landslides, and cyclones, are mostly dependent on several conditions being present. It is vital to select effective variables to map flood hazards based on any catchment area [16]. It is often seen as a complicated challenge to choose parameters to create flood susceptibility maps [12]. Therefore, a field survey was conducted to determine the most relevant flood-triggering variables. The most flood-prone areas were visited during a month-long field visit in 2015, and personal opinions from residents were collected, which played a constructive role in planning the inventory map. A total of eight parameters, namely, distance from the river, drainage density, slope, elevation, rainfall, soil, geology, and land use land cover (LULC), were included in the modeling in this report. All these maps were transformed to a 12.5 × 12.5 m pixel raster image (format), which was up to DEM resolution for the model studies (Table 1). The cell size of each parameter was kept as 12.5 m in the resampling method such that the overlay analysis would get the pixel at the same scale and the output was also the same as the input. The maps acquired at different scales were digitized and while converting them to the raster format, the resolution of the pixels was kept at 12.5 m. The reason for keeping the resolution at 12.5 m for all raster parameters was to match the pixel size. Most of the parameters were extracted from the DEM that had a resolution of 12.5 m, and all other parameters were brought to the same resolution. Below is a comprehensive overview of the mentioned variables.

3.2.1. Distance from the River

Particularly, the area which is close to the rivers is more prone to flooding in both cases of normal flood and flash flood within the river basin as water flows from higher elevation and accumulates at lower elevations. Mostly during heavy rain, the areas that are nearby terrestrial water places become flooded, such as dams, ponds, and lakes. Furthermore, the nearby terrains of water bodies are mostly flat. The 2500 m distance was given to the most susceptible areas, while areas more than 10,000 m away were considered as being at no risk (Figure 3a).

3.2.2. Drainage Density

Drainage density is expressed as the total length per unit area of the river network. In this research area, the stream order was conducted using the system suggested by Strahler [41]. During the research, high weightage was allocated to low-drainage-density areas, and lower weights were allocated to areas with sufficient drainage. In the five sub-groups, the drainage density layer was further reclassified into five (5) classes. Those areas having low drainage density were categorized with a score of 5, and those with very high drainage density were classified with a score of 1. We used a kernel density to identify the river density within 0.303–3.618 km to generate a raster cell, as displayed in Figure 3b [42,43].

3.2.3. Slope

Many factors affect catchment hydrologic characteristics, which ultimately influence the production of surface runoff. It governs overland movement, penetration, and subsurface flow length. The slope angles’ combination defines the slope shape and its relation with the lithology, composition, soil form, and drainage. A slope chart was prepared in this study using ALOS PALSAR DEM and slope generation tools in ArcGIS. Due to the almost flat terrain, the slope classes with less value were given a higher level, while the class with the maximum value was classified as lower due to its comparatively high runoff. The outcomes of the initial classification and the layers of reclassification of the slope and elevation are shown in Figure 3c for the case study.

3.2.4. Elevation

The tendency of water accumulation is from higher to lower elevations. Elevation information shows how the stature of the ground changes over a region. The areas with lower elevations are mostly susceptible to flash floods due to simultaneous rainwater accumulation. The ALOS PALSAR DEM was utilized to extricate various factors. High elevation areas are most susceptible to pluvial flash floods. A map based on elevation was generated from the DEM using five classes in this research. The raster map in Figure 3d shows the elevation map obtained for the Chitral District.

3.2.5. Rainfall Deviation

Flood susceptibility and heavy rainfall are both positively correlated with flood occurrences. Havoc flooding triggers flash flooding. The rainfall rate rises from July to September for the study region, and in this way, flooding months are detected, i.e., sessions of monsoon in the Chitral District, Pakistan. In the estimation of flood types that are flashy, rapid, and of short duration, the amount of surface runoff is critical due to heavy rainfall [8]. Here, the variance in rainfall was regarded as an initiating factor for the study of flood susceptibility because a positive deviation of rainfall can cause floods, whereas a negative deviation of rainfall causes a shortage of rainfall, leading to the possibility of drought. For the estimation of variance and spatial mapping, the annual average with reported annual precipitation of the Chitral region was taken from 2010–2015. The deviation of rainfall was calculated from the recorded average rainfall of each rain gauge station using the following Equation (1):
Q = L Z × 100 z      
where L is the recorded rainfall, Z indicates the average rainfall, and Q represents the rainfall deviation.
The rainfall deviation was calculated based on the data of five rain gauge stations, i.e., Chitral, Drosh, Kalam, Saidu, and Dir. The technique of inverse distance weight (IDW) interpolation was used in ArcGIS to make the map of rainfall deviations for Chitral (Figure 3e).

3.2.6. Soil

The essential soil components and characteristics are soil structure and moisture. Soil textures significantly affect floods, as water is quickly drained by sandy soil and little runoffs occur. This means that areas marked by clay soils influence flooding more. The probability of flood risk rises with a decline in soil penetration, which allows the surface runoff to rise. The soil map was listed for this case study based on infiltration capabilities. Three broad categories were considered for the soil types discovered within the district: extremely infiltrated, mildly infiltrated, and less infiltrated. To assign a weight to each soil class, a weighted soil map was prepared such that the soil type with a higher capability to cause a high flood rate was ranked as 3, with a low flood rate capacity being ranked as 1 (Figure 3f).

3.2.7. Geology

Basin geology affects the hydrological response. The main geological characteristic for runoff surfaces is soil absorptivity. In comparison to a permeable layer, impermeable soil causes rapid and significant surface runoff. The geology of the lower catchments of the study area comprises Chitral Slate, Reshun conglomerate, Koghuzi Greenschist, Calcareous Phyllite, and Purit Formation, which have low infiltration and cause higher chances of flooding. Rock formation and soil permeability were used to analyze the role of each layer of spatial data regarding the occurrence of flood events. Clay is more resistive as compared to sandy soil, which allows for more water infiltration. Weights were allotted to each class parameter, and afterward, the chosen parameters were added to build up a flood susceptibility guide (Figure 3g).

3.2.8. Land Use and Land Cover (LULC)

Land use/cover is also one of the main variables in flood mapping. It reflects the current use of the land, its pattern, and types of its use, and hence its importance for soil stability and infiltration. Land cover, such as soil vegetation cover, whether permanent grassland or another crop cover, has a significant impact on the soil’s ability to act as water storage. Rainwater flooding is much more common on bare fields than on those with decent crop cover. In other words, different forms of land use act as resistant covers, reducing water retention time; in most cases, it increases the peak release of water, resulting in a more precise flood. This means that LULC is a critical variable in determining the likelihood of flood events. In this study, an exceptionally high value was given to water bodies, while a low value was given to snow cover (Figure 3h).

4. Methodology

4.1. Analytical Hierarchal Process (AHP)

In the AHP, the primary task is the creation of a matrix representing the importance of all selected alternatives. Based on its relevance and meaning in such phenomena, it allows policymakers to make reasonable decisions. In AHP the problem can be recognized as how to derive weights, rankings or importance in a set of alternatives according to their value for occurring in some instances. This is a widely applicable multicriteria decision-making (MCDM) approach [19,44].

4.2. Frequency Ratio (FR)

FR is one of the main bivariate analysis techniques, which is well accepted for use in flood susceptibility analysis. The spatial association between dependent and independent variables is the basis of FR as a bivariate statistical study. The spatial associations between the dependent factors were based on the training points selected for the flood-causing determinants, including climatological, topographic, and local factors, which were added as independent factors that were analyzed in this research. The frequency ratio model was successfully used in the study of the susceptibility of flood and insecurity in various flood-prone regions worldwide [8,18].
The study methodology is highlighted in several key steps below: (1) collection of data and its preparation, (2) training and testing the datasets’ generation, (3) AHP modeling and the selected class weight values, (4) SCWV and FR models, (5) validating the models, and (6) and flash flood susceptibility maps’ generation (Figure 4). These steps are described in the details given below.

4.3. Collection of Data and Its Preparation

Inventory maps of flash floods and the conditioning factors were produced in the raster format with 12.5 m pixel size. In order to calculate the frequency ratio values of every conditioning factor class using the frequency ratio method, the inventory map was then overlaid with the conditioning factor maps. The weights of the class of variables were then calculated using the frequency ratio values. The selection of correlation-based features was used to validate and select the significant factors and evaluate the relative significance of these factors for flash flood modeling.

4.4. Training and Testing Datasets’ Generation

The susceptibility to flash floods was divided into two sections with ratios of 70% and 30%. Among these elements, 70% of the susceptibility data was used to sample the conditioning factors assigned to the training dataset generation weights. In comparison, the remaining 30% was used to sample the conditioning factors assigned to the weights for the evaluation dataset generation. The collection ratios can influence a model’s efficiency regarding the training division and test inventory. The ratio of 70/30 was used in this analysis as it is a typical ratio used in modeling [24,26]. These steps were carried out in the ArcGIS 10.6 environment.

4.5. AHP Modeling and the SFWV

In the present analysis, the AHP approach was used to help the judgment by comparing the selected flood-causing variables by calculating the selected factor weight values (SFWVs). A survey of residents was conducted and observations from the field were made to understand the relative significance of various flood factors in the Chitral area and position their rank based on given preferences. The challenge in AHP can be described as determining how to assign weights, ranks, or significance to a collection of alternatives based on their likelihood of occurrence in specific situations. One of these variables was calculated based on a numerical scale [45] (Table 2).
A pairwise contrast matrix was built based on the meanings or importance of the flood variables. Of the seven total flood-causing variables chosen, values were allocated to every rank on a scale from 1 to 9. These weights were assigned based on their relative significance in this occurrence. The value assigned to one alternative was reciprocal to its opposite relation (i.e., 1/2 to 1/9) (Table 3).
For the hierarchical arrangement of the flood-affecting factors, the AHP technique was applied and the eigenvector of chosen weight factor values was evaluated and modified by calculating the consistency ratio (CR) [23,46]. Once each factor’s relative rank was determined, the factor weight values for classified sub-factors were computed in order to assess the accuracy while considering the scale of significance. Hence, the eigenvector was calculated by considering the Equation (2):
A x = λ m a x X
where λ is the eigenvalue, x is the eigenvector of n criteria, and A is the comparison matrix of n criteria. The largest eigenvalue (λmax) for a stable reciprocal matrix equals the number of comparisons n. Therefore, it is mandatory to determine the consistency ratio (CR) for the same. Saaty [45] suggested that the judgment collection is “inconsistent” if the CR reaches “0.1” and needs to be replicated. Similarly, if the CR equals “0,” the decision is completely consistent; moreover, any value between 0 and 0.1 is often called consistent [45]. The ratio of consistency is determined using the following Equation (3):
C R = C I R I            
If the consistency ratio is based on CR, the consistency index is CI, and the random index is RI. RI was used from [45]; however, CI was determined by using the following Equation (4):
C I = λ m a x N   N I
where the total number of sub-factors is λmax, which is equal to the average of x criteria, and N is the total number of subfactors. AHP has the capacity to be implemented in different fields where several factors are responsible for the occurrence of an incidence, such as assessments for ecotourism [31], for the selection and evaluation of industrial land use [47], for the evaluation of residential LULC suitability [48] in post-harvest technology selection [49], in irrigation network maintenance [16], choosing the right underground mining technique [17], for disease risk mapping and transmission [16].

4.6. FR Model and the SCWV

In this research, to calculate the frequency ratio (FR) for every class of all selected factors, the following Equation (5) was used:
F R = P p i x E P p i x T Σ p i x E Σ p i x T  
Ppixe shows the number of pixels p in the concerned areas of a flood class, whereas PpixT represents the count of pixels in the research area, Σ p i x E is the count of all pixels for the flood class, Σ p i x T is the overall number of pixels in the research area. If the resulting value of FR was more than 1.0, it means that there was a fair and robust association between the flood training points and the relevant factor and high flood risk class involved, while a value of FR < 1 indicated a negative relationship and a low flood risk importance [50]. The FR value for each class was assumed to be the chosen class weight value in the present analysis (SCWV). The flood vulnerability index (FVI) was also calculated to display the expanded flood susceptibility importance from very high to very low flood risk areas in the current AHP and FR model analysis. In order to calculate the FVI using the following Equation (6), the SCWV representing every class of all the selected variables and the SFWV selected for the flood occurrences were taken into account:
F S I = n = 1 n w i × F R  
In this equation, n is the total number of variables chosen (n = 7), wi is the weight of variables (i.e., the SFWV), and FR is the value of the frequency ratio of each class (i.e., the SCWV).

5. Results and Discussion

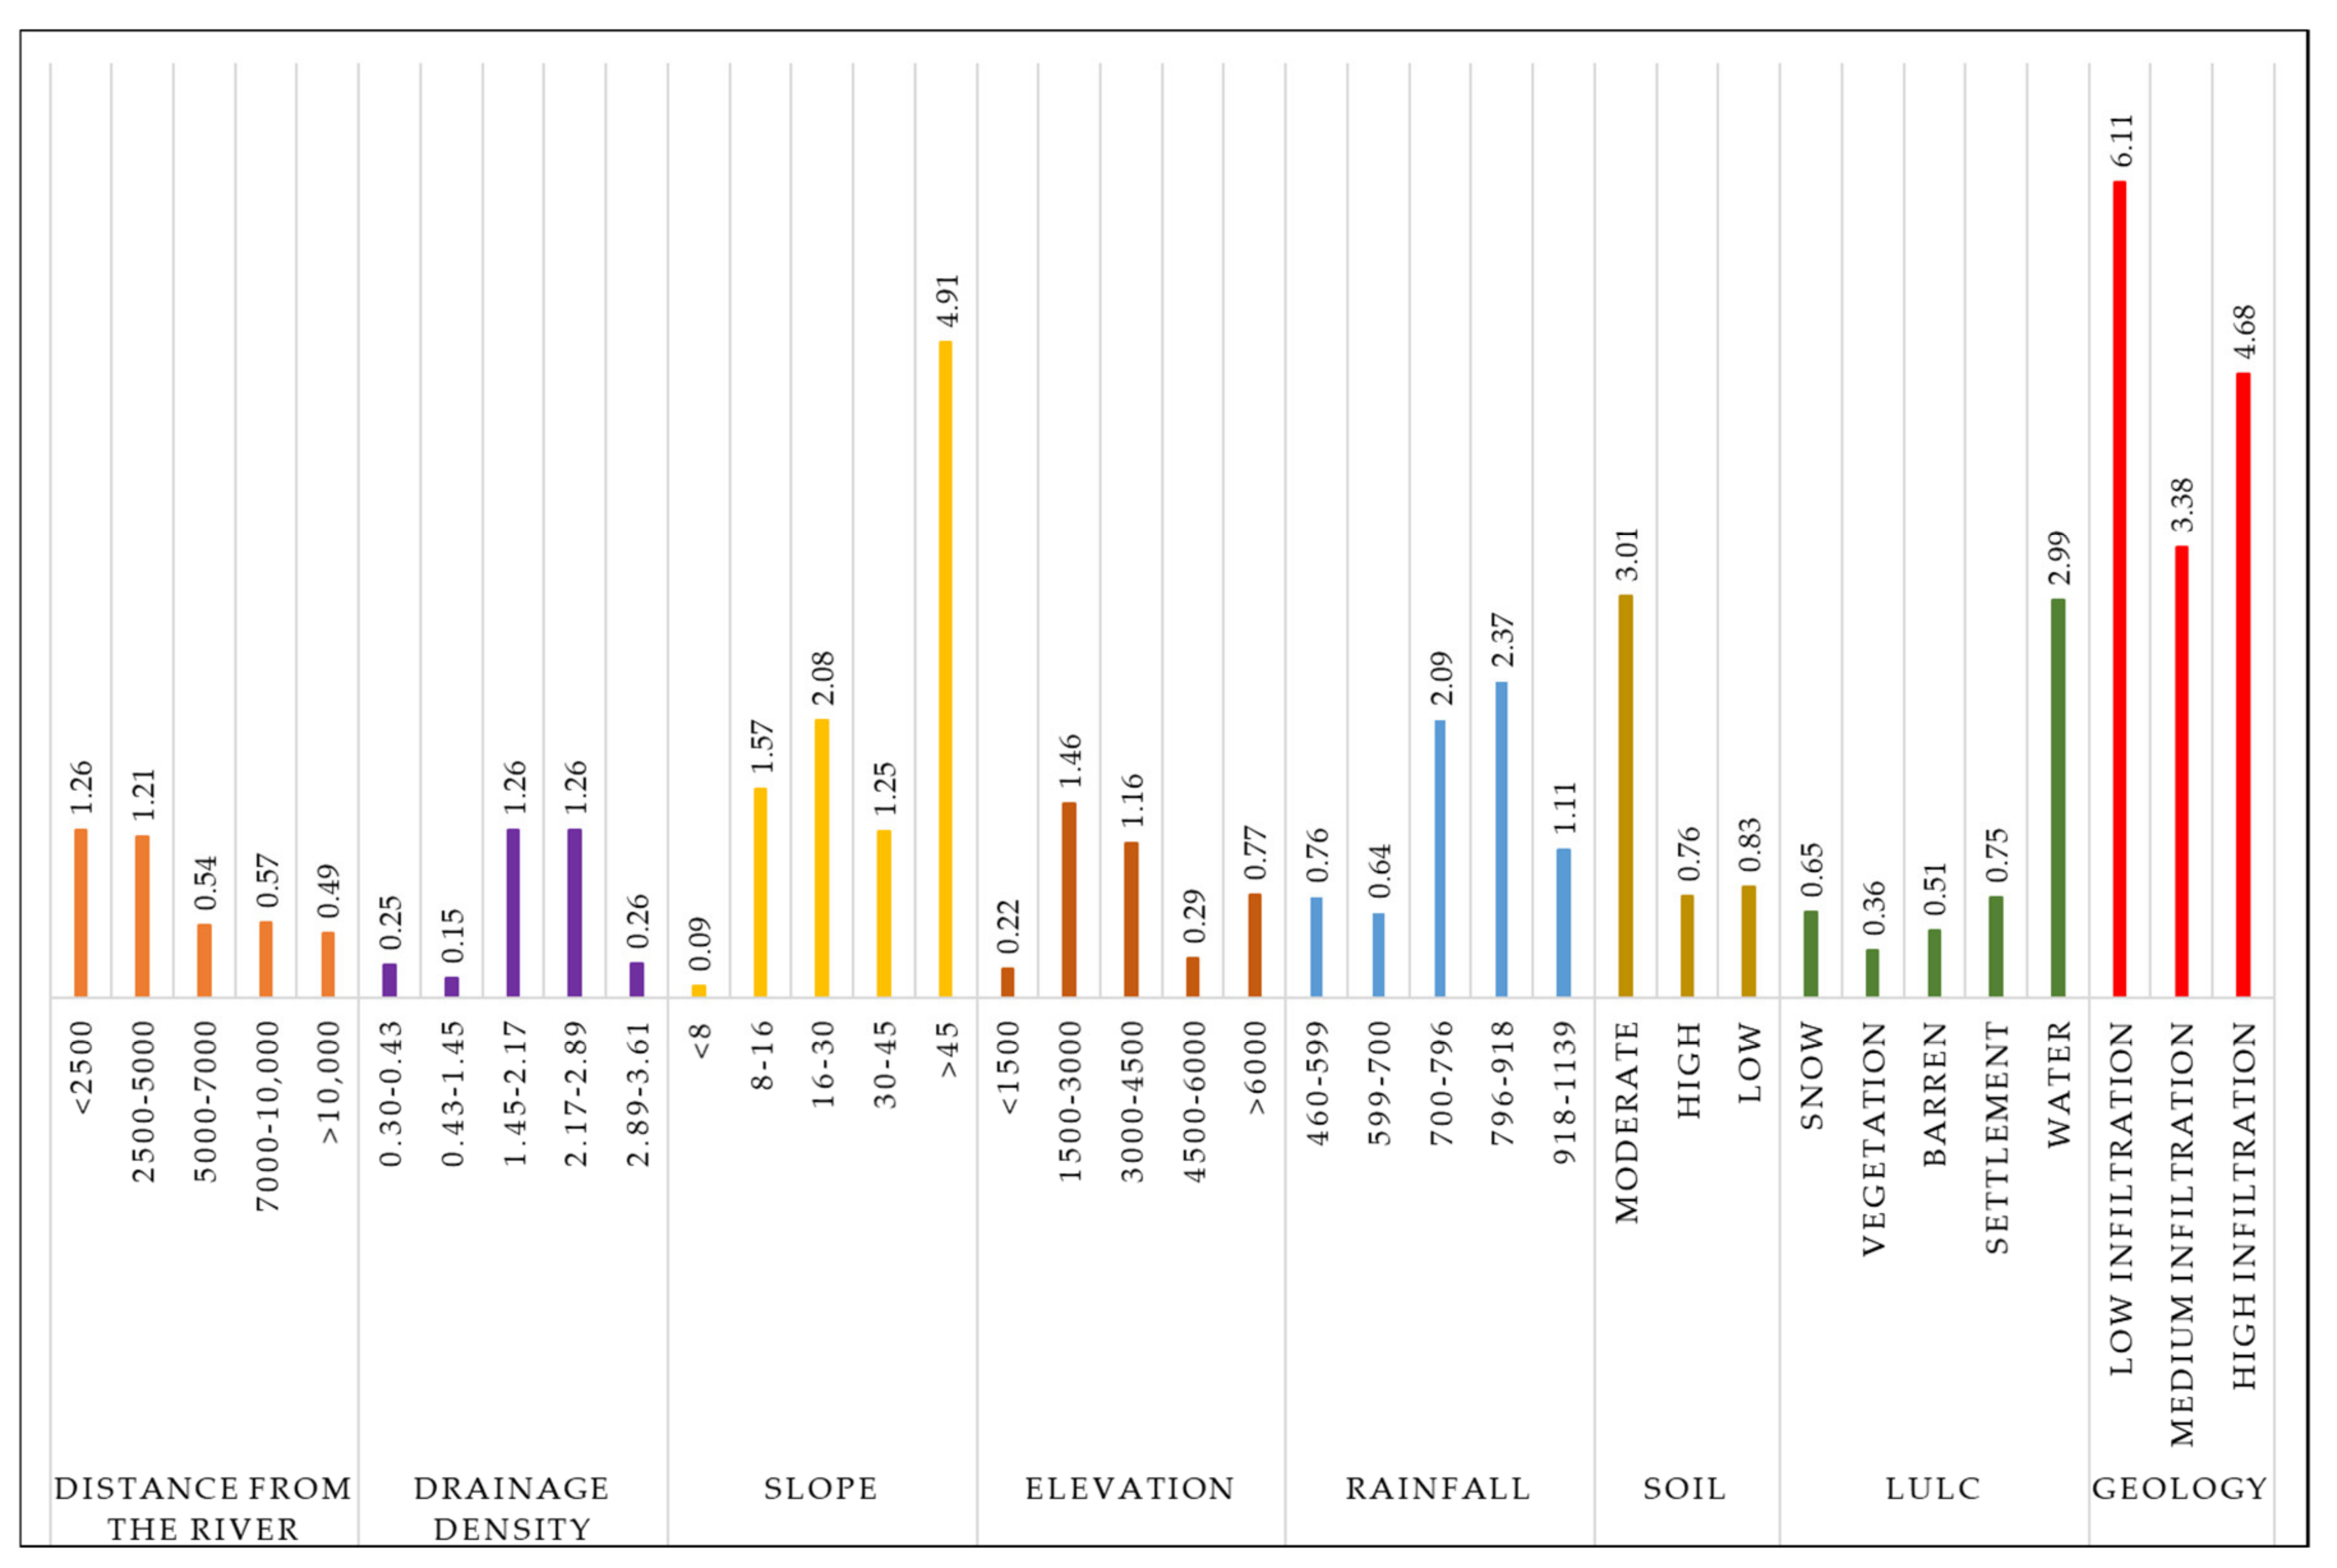
5.1. Effect Weight of Each Class of Flash Flood Susceptibility Variables Found Using the FR Method

Flood susceptibility mapping is an approach for making plans and managing pre-hazards, which is needed to decrease the risk factors. Because of the high altitude, the region of Chitral is often called a flood-prone location. With some intervals and return dates, there are many signs of catastrophic flooding in this area. This study highlighted the analysis of flood vulnerability based on decision making approach, i.e., analytic hierarchy process and frequency ratio. Several independent causes induce/condition flooding and play essential roles in flood evaluation. Thus, a statistical databank was prepared for all eight selected conditioning factors (river distance, drainage density, slope, elevation, rainfall, soil, geology, and LULC) with the corresponding subclasses (Figure 5). Their spatial relations with flood risk were calculated precisely and are given below. Relationships between flood-susceptible and flood-inducing variables were made to make spatial comparisons between flood-susceptible regions and flood-inducing variables. In this respect, the values for class weight and factor weight were considered. A factor’s weight value shows the relative significance of each factor chosen for and determined using the AHP. The class’s weight value shows the importance based on each factor for every individual class and provides valuable details for understanding the role of flood generation.
Based on the quantitative analysis of the relationships between this site of historic flooding and the topographical and geo-environmental variables influencing flash flood events, each variable type’s impact weight was determined (Figure 5). The study showed that the altitude class vector’s maximum weight belonged to the 500–3500 m elevation class. The weight for a slope above 45° was the maximum weight for the angle of the soil slope. The northwest slope orientation has a greater weight than the other slope directions. Weights had a more significant impact than other groups in the vector distance from the fault class of 400 to 500 m. Examination of the river’s vector distance found that much of the weight associated with the flood was in the <2500 m class. The rainfall layer had the second-highest weight, as seen in Table 3. This implies that the threshold value for the frequency of flash flooding belonged to this rainfall class. Depending on the length, higher rainfall above this value may also cause flash flooding in conjunction with other variables. The vegetation and residential land-use types and being situated next to the river area and on moderate slopes had the higher weighting factors relative to other land uses. Geological research shows that the soil’s weight at the beginning is greater than that of the rocky outcrops. In this area, the geology had a more significant weight than other parameters.

5.2. Relationships between Flood Susceptibility and Flood-Inducing Factors

Efforts were made to spatially associate flood-susceptible zones and flood-inducing factors. Factor weight values were measured. Rainfall was found to be a good indicator for drought and flood (positive range indicates more than normal rainfall and negative range indicates less than normal rainfall). The factor’s weight value shows the relative significance of each factor chosen for and determined using the AHP. The class’s weight value shows the relative importance of individual classes for each factor and provides valuable details to understand the role of flood generation. The individual class frequency ratio for each factor is shown in Figure 5. In terms of climate, rainfall still plays an essential part in the study of flood vulnerability. To identify the risk of flood, rainfall variance was taken into consideration because rainfall deviation is considered the best predictor of flood areas. Figure 3e and Figure 5 show that there was a deviation of rainfall ranges from 918 to 1139 mm, which shows an FR value of <1, indicating these regions were more prone to floods relative to low-rainfall-deviated areas. The FR values for the elevation of land between 2 and 5 m were >1, suggesting a favorable association with flood vulnerability. The angle of the slope of the sample area ranged from 8° to 45°. The estimated FR value was located between 2.077 and 4.91 in the slope gradient between above 45° and 16–30°, suggesting that this section was very strongly prone to flooding. In the places along the riverbank, the flood rate was more significant and less so in those regions far away from the river. The analysis of proximity was conducted to produce a specific river distance interval. This analysis shows that a distance of 2500 m from the river has values of FR ranging from 0.54, 0.56, 1.21, 1.26, and 0.48, respectively, which shows that the areas far from the river had lower FR values, meaning a lower risk of flooding.

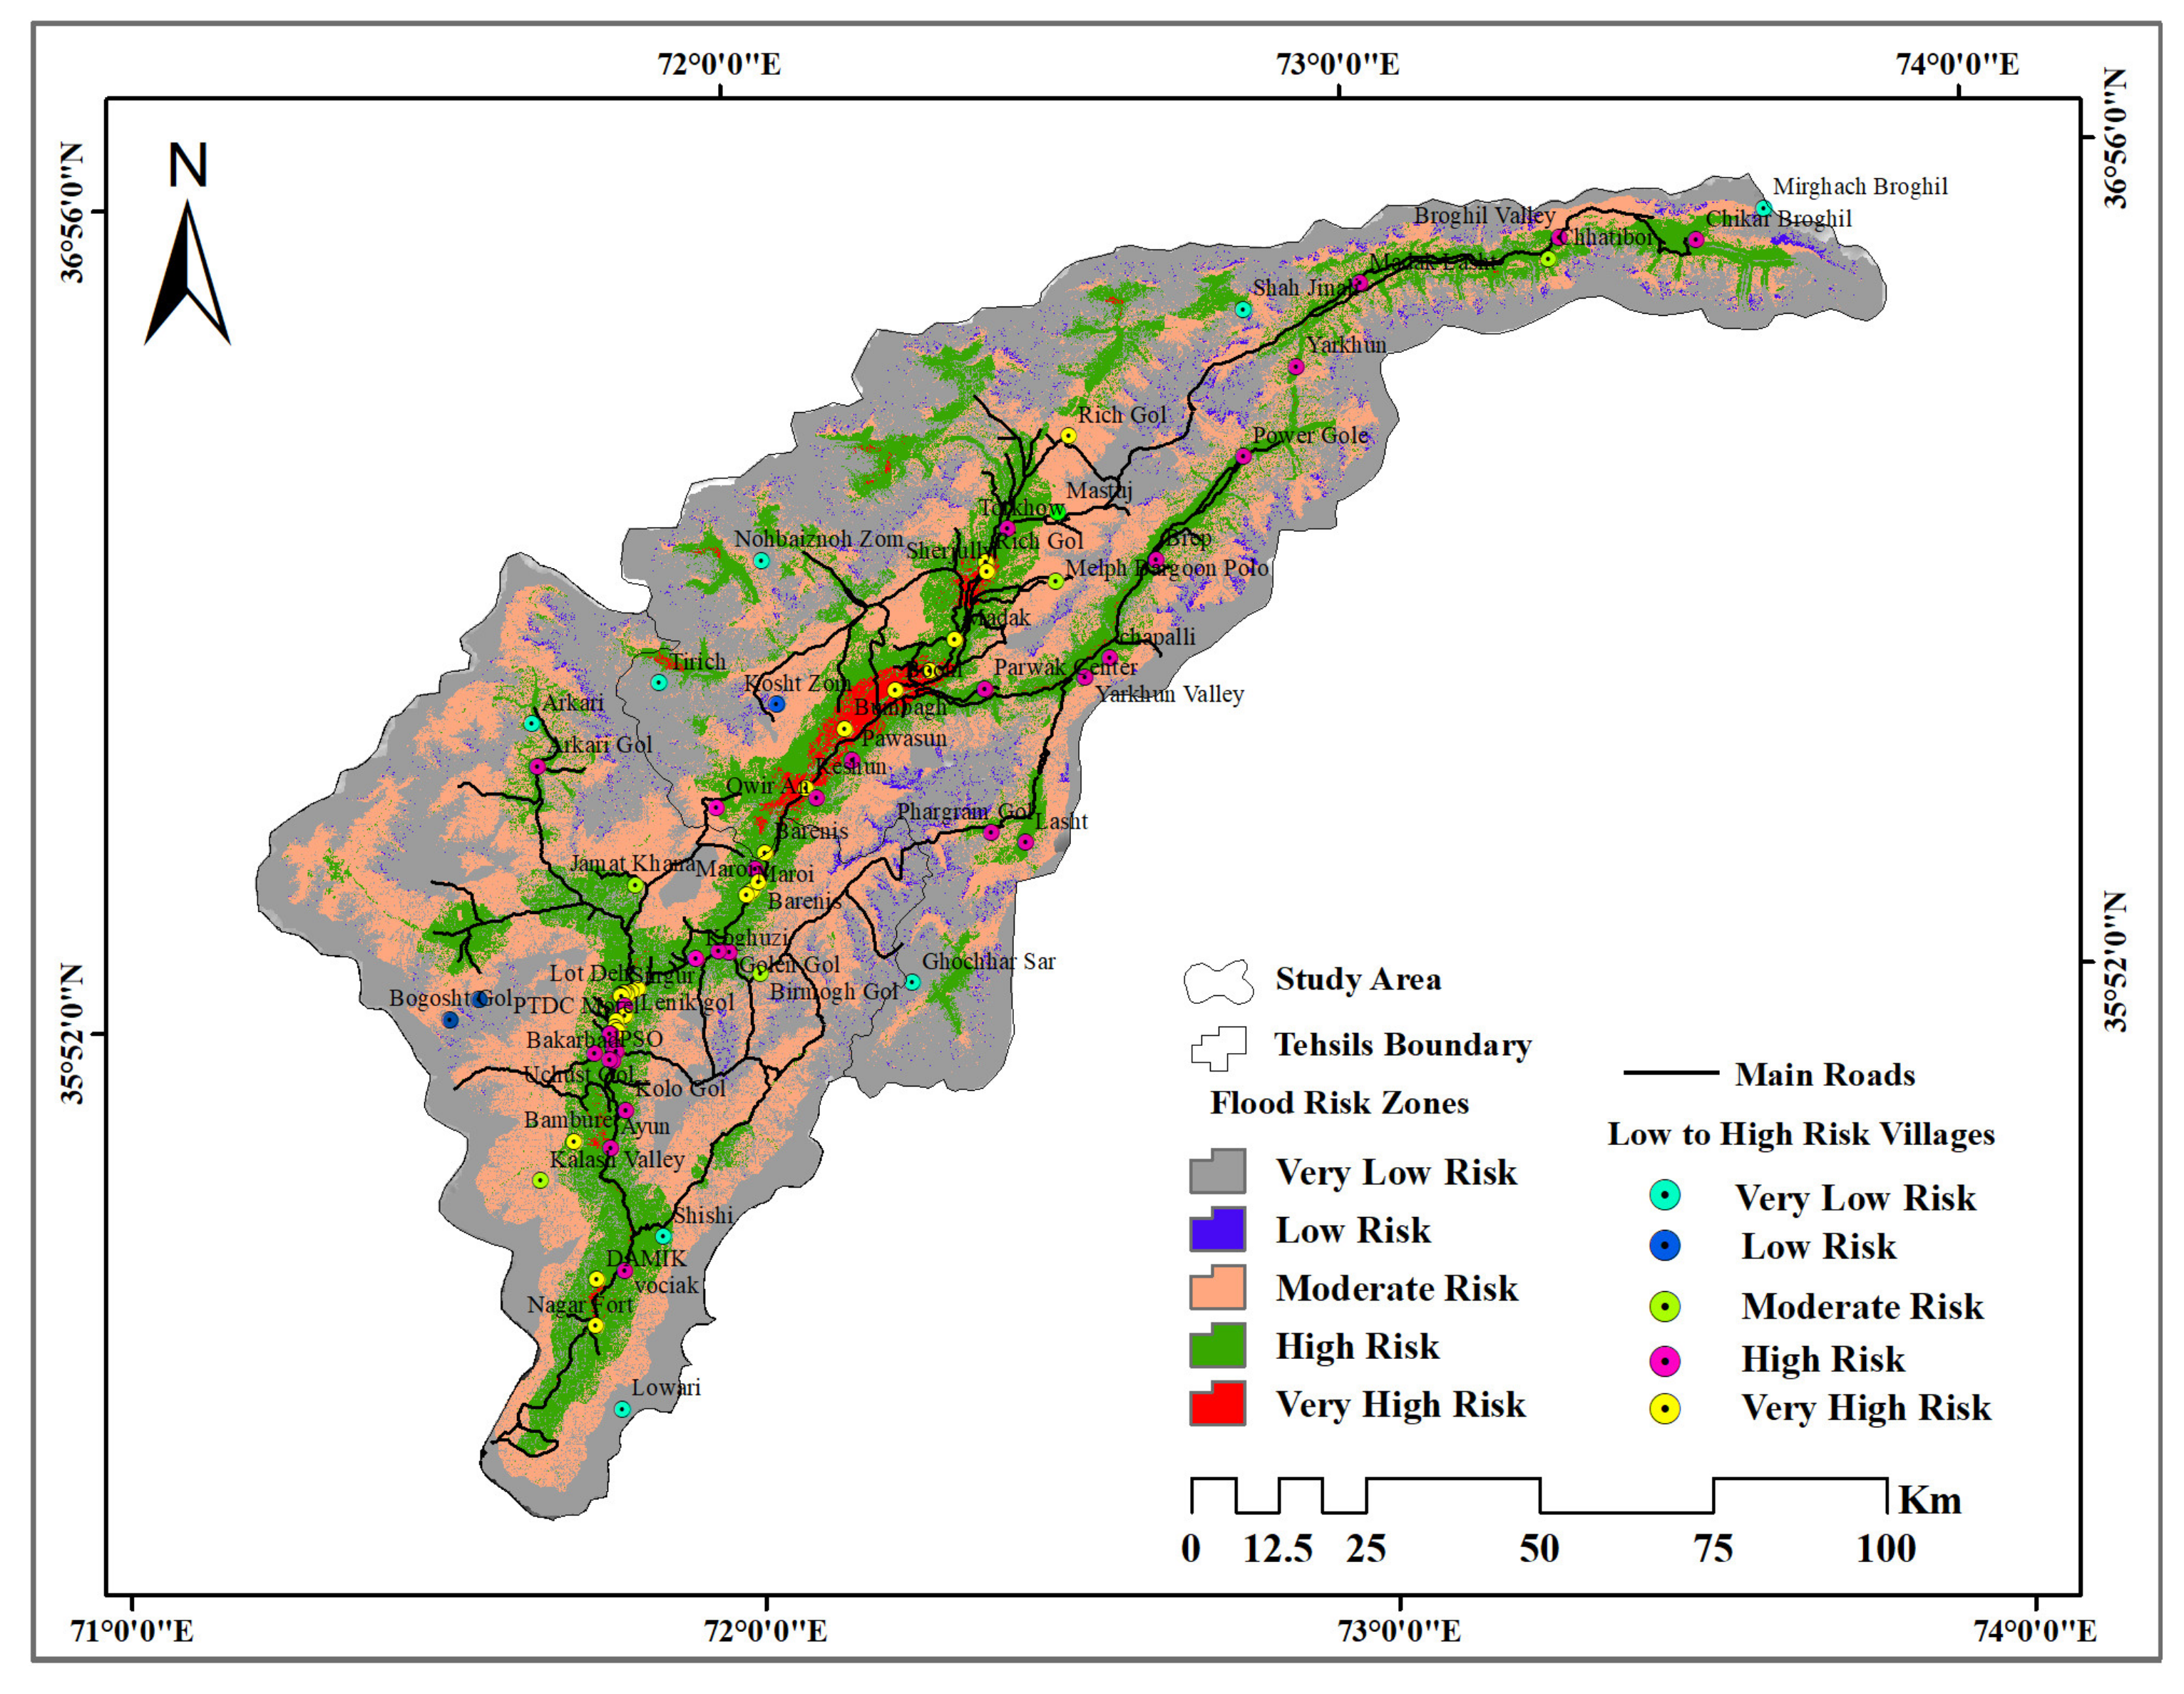
5.3. Susceptibility Mapping of Flood and Estimation of Risk Area

First, via an overlay analysis, final susceptibility zones were generated in GIS environments based on the values of the factor weights and the class values collected from the FR and AHP analyses. For the same variables, the SCWV of each subset of all chosen factors was used, as seen in Figure 5. The flood susceptibility index (FSI) was then determined by summing up the FR value for every flood-causing factor identified. A higher FSI value indicates a greater susceptibility to flooding events. Conversely, lower FSI values suggest less susceptibility to the occurrence of flooding. To recognize the Chitral District’s spatial flood risk zones, the FSI database was reclassified into five susceptibility zones. The output zones were categorized into very low, low, moderate, high, and very high risk, covering 7457.5, 1502.56, 2833.69, 1888.036, and 1168.11 km2, respectively (Figure 6 and Table 4). During the affected areas visits, some severely damaged villages were identified (Figure 6). Riverside areas of Madak, Booni, Resham, Owiran, Marot, Mario, PSO, Lot Deh, Ayun, and Singur were shown to be at high flood risk. Second, parts of the western side of Rich Gol, Torkhov, Nohbaiznoh Zom, Chapalli, and Last were identified as having low to extremely low susceptibility to flooding. The low to high susceptibility classes for flooding suggest that these regions were more susceptible to incidences of severe floods.

5.4. Validation

In risk management and susceptibility research, assessing the accuracy and validation of retrieved findings is a key task. The validation of the analysis and model applied is given using an accuracy evaluation. There are various methods for measuring accuracy and validation, including area under the curve (AUC), prediction accuracy (PA), and success rate (SR). [5,25,27]. PA and SR were considered in the current study to assess the precision using flood training and test points that were measured using the following Equations (7) and (8):
P A = Σ a p Σ t p
S R = Σ s p Σ t n p
where a p —accurate testing points, which were considered for food vulnerability; t p —total food testing points; s p —considered training points for success rate; t n p —total training points; P A —prediction accuracy; S R —success rate.
By applying the above equations, if the accuracy value was a perfect 1.0, this implies total precision and the capacity of the model was managed without considering any bias; however, a value >0.75 is considered as standard [22]. Prediction accuracy was measured in the current study using 90 (30%) flood locations that were not taken during the FR simulation, and 210 (70%) locations of the flood were utilized to measure the success rate. Similarly, groups ranging from low to very high risk were taken as possible flood areas that could occur in the future. The accuracy and success rate of the forecast were estimated as 0.81 (81%) and 0.84 (84%), respectively (Table 5). Therefore, the forecast accuracy was found to be >80 percent, which validates the use of the frequency ratio model used for the analysis in this Chitral area flood susceptibility study.
Dynamic shifts that can be caused by human activity in the form of changes in land use, infrastructure growth, and climate change were included in this study. These changes can affect the normal hydrological cycle and thus flood patterns, especially flash floods in populated areas that affect the affected communities’ lives and property. The lack of dynamic consideration of evolving parameters relating to physical changes, flow rates, direction, erosion, sedimentation, obstruction of the drainage system, etc., in flood modeling and its causative impact on land growth and flood control is a weakness of the model analysis. However, more research on the estimation, prediction, and mapping of flash floods by applying other variations of hybrid artificial intelligence models in various fields using high-resolution geo-spatial data for the improved development of maps of vulnerability to flash floods has considerable potential.

6. Concluding Remarks

Accurate flash flood susceptibility maps must be used in flash flood management studies by governing departments and decision makers for effective flash flood prevention and organized growth of the Chitral District. This flood susceptibility mapping analysis was performed to identify specific areas that are at risk of flooding. The flood susceptibility map design’s essential purpose was to raise awareness among the public, municipal authorities, and other organizations of the risk of flooding. In this analysis, we used computational approaches for FR and AHP learning to forecast the probabilities of flash flood events. In total, eight flash flood conditioning variables (river size, drainage density, slope, elevation, rainfall, land use, soil types, and geology) were taken into account in the preparation and testing of the proposed models. To determine the maximum and minimum weights, the AHP technique was performed on the selected factors that mainly cause floods.
Furthermore, a frequency ratio was performed to analyze the past flood occurrence incidents based on flood- and non-flood-based points. We conducted a comprehensive study using multi-source geospatial data in this research; many limitations remain in this data configuration study. We used the publicly available ALOS-PALSER DEM spatial resolution of 12.5 m; a higher DEM resolution will offer a more accurate flood map that could be more valuable for the practical application of flood mitigation strategies. It was observed from the study review that selected flood-inducing factor weight values were high for distance from the river (0.245), rainfall variance (0.315), land use/cover (0.256), and soil clay content (0.521), which suggested that these were the most critical factors causing floods in the Chitral area. The SFWV was 0.1235 for slope angle and 0.325 for elevation, which also played a part in flooding as contributing variables. The study demonstrates that, compared to the topographic factors (elevation and slope), the climate (rainfall) and local-based factors have a much more significant contribution since the Chitral area is flat near the river Chitral. The validation outcome based on flood position points showed that the prediction accuracy was 81% and the success rate was 84%.
To assess its practical use in diverse terrains and habitats, this analysis needs to be applied to other locations. Dynamic shifts that can be caused by human activity in the form of changes in land use, infrastructure growth, and climate change was also included in this study. These changes can affect the normal hydrological cycle and thus flood patterns, especially flash floods in populated areas that affect the affected communities’ lives and property. However, more research on the estimation, prediction, and mapping of flash floods by applying other variations of hybrid artificial intelligence models in various fields using high-resolution geo-spatial data for improved development of maps of vulnerability to flash floods has considerable potential. Along with public knowledge, the development plan often proves to be an obstacle. However, a high-risk area that shows a great response using a variety of strategies, such as flood-proofing steps, flood emergency preparation, flood shelter facility, and evacuation planning, which can be forecast and identified through the creation and use of practical methodologies for susceptibility analysis, can display significant flood preparedness. Therefore, multiple computational models based on multiple criteria may be implemented to reduce the flood risk load in future studies.

Author Contributions

Conceptualization, H.W., A.T., L.L. and Q.L.; methodology, H.W., A.T., L.L. and Q.L.; software, H.W., A.T., L.L. and Q.L.; validation, M.F.B. and J.X.; formal analysis, H.W., A.T., L.L. and Q.L.; investigation, H.W., A.T., L.L., Q.L., M.F.B. and J.X.; data curation, H.W., A.T., L.L. and Q.L.; writing—original draft preparation, H.W., A.T., L.L. and Q.L.; writing—review and editing, H.W., A.T., L.L., Q.L., M.F.B. and A.S.; visualization, H.W., A.T., L.L., Q.L., M.F.B. and J.X.; supervision, A.T., L.L. and Q.L.; funding acquisition, L.L. and Q.L. All authors have read and agreed to the published version of the manuscript.

Funding

This work is supported by the National Natural Science Foundation of China (grant no. 42071321) and the National Key Research and Development Program of China (grant no. 2019YFE0127700).

Institutional Review Board Statement

Not applicable.

Informed Consent Statement

Not applicable.

Data Availability Statement

The data presented in this study are available on request from the first and corresponding author. The data are not publicly available due to the thesis that is being prepared from these data.

Acknowledgments

We are also thankful to Shazada Adnan, Pakistan Meteorological Department, Islamabad, Pakistan; they provided all flood data related to this research. We also admire Muhammad Imran, Institute of Geo-Information and Earth Observation, PMAS, UAAR, Pakistan, for their facilitation at various analysis and writing stages. Finally, we acknowledge the three anonymous reviewers and editors of the journal who provided very helpful comments that helped improved the final version of the manuscript.

Conflicts of Interest

The authors declare no conflict of interest.

References

  1. Braimah, M.M.; Abdul-Rahaman, I.; Sekyere, D.O.-; Momori, P.H.; Abdul-Mohammed, A.; Dordah, G.A. Assessment of Waste Management Systems in Second Cycle Institutions of the Bolgatanga Municipality, Upper East, Ghana. Int. J. Pure Appl. Biosci. 2014, 2, 189–195. [Google Scholar]
  2. Soriano, I.R.S.; Prot, J.-C.; Matias, D.M. Expression of tolerance for Meloidogyne graminicola in rice cultivars as affected by soil type and flooding. J. Nematol. 2000, 32, 309. [Google Scholar] [PubMed]
  3. Ullah, K.; Zhang, J. GIS-based flood hazard mapping using relative frequency ratio method: A case study of panjkora river basin, eastern Hindu Kush, Pakistan. PLoS ONE 2020, 15, e0229153. [Google Scholar] [CrossRef] [Green Version]
  4. Ec.europa.eu. Best Practices on Flood Prevention, Protection; Ec.Europa.Eu: Copenhagen, Denmark, 2003; pp. 1–29. [Google Scholar]
  5. Vivekanandan, N. Comparison of probability distributions in extreme value analysis of rainfall and temperature data. Environ. Earth Sci. 2018, 77, 1–10. [Google Scholar] [CrossRef]
  6. Potsdam Institute for Climate Impact Research (PIK). Potsdam Institute for Climate Impact Research (PIK); Biennial Report 2000/2001; Potsdam Institute for Climate Impact Research: Potsdam, Germany, 2000. [Google Scholar]
  7. Santanello, J.A., Jr.; Peters-Lidard, C.D.; Garcia, M.E.; Mocko, D.M.; Tischler, M.A.; Moran, M.S.; Thoma, D.P. Using remotely-sensed estimates of soil moisture to infer soil texture and hydraulic properties across a semi-arid watershed. Remote Sens. Environ. 2007, 110, 79–97. [Google Scholar] [CrossRef] [Green Version]
  8. Tariq, A.; Shu, H.; Saddiqui, S.; Mousa, B.G.; Munir, I.; Nasri, A.; Waqas, H.; Baqa, M.F.; Lu, L. Forest fire Monitoring using spatial-statistical and Geo-spatial analysis of factors determining Forest fire in Margalla Hills, Islamabad, Pakistan. Geomat. Nat. Hazards Risk 2021, 12. [Google Scholar] [CrossRef]
  9. Relief, D. Executive Summary Hazard. Mitigation Is Defined as Any Action Taken to Reduce or Eliminate the Long Term Risk to Human Life and Property; Florida Division of Emergency Management: Florida, FL, USA, 2013. [Google Scholar]
  10. Siddayao, G.P.; Valdez, S.E.; Fernandez, P.L. Analytic hierarchy process (AHP) in spatial modeling for floodplain risk assessment. Int. J. Mach. Learn. Comput. 2014, 4, 450. [Google Scholar] [CrossRef]
  11. Thomas, V. Climate Change and Natural Disasters. Clim. Chang. Nat. Disasters 2017, 8, 81–94. [Google Scholar] [CrossRef] [Green Version]
  12. Tariq, A.; Shu, H.; Siddiqui, S.; Imran, M.; Farhan, M. Monitoring Land Use and Land Cover Changes Using Geospatial Techniques, A Case Study of Fateh Jang, Attock, Pakistan. Geogr. Environ. Sustain. 2021, 14, 41–52. [Google Scholar] [CrossRef]
  13. Zhao, G.; Pang, B.; Xu, Z.; Peng, D.; Xu, L. Assessment of urban flood susceptibility using semi-supervised machine learning model. Sci. Total Environ. 2019, 659, 940–949. [Google Scholar] [CrossRef] [PubMed]
  14. Zope, P.E.; Eldho, T.I.; Jothiprakash, V. Hydrological impacts of land use–land cover change and detention basins on urban flood hazard: A case study of Poisar River basin, Mumbai, India. Nat. Hazards 2017, 87, 1267–1283. [Google Scholar] [CrossRef]
  15. Kheradmand, S.; Seidou, O.; Konte, D.; Barmou Batoure, M.B. Evaluation of adaptation options to flood risk in a probabilistic framework. J. Hydrol. Reg. Stud. 2018, 19, 1–16. [Google Scholar] [CrossRef]
  16. Ali, S.A.; Khatun, R.; Ahmad, A.; Ahmad, S.N. Application of GIS-based analytic hierarchy process and frequency ratio model to flood vulnerable mapping and risk area estimation at Sundarban region, India. Model. Earth Syst. Environ. 2019, 5, 1083–1102. [Google Scholar] [CrossRef]
  17. Lee, S.; Pradhan, B. Landslide hazard mapping at Selangor, Malaysia using frequency ratio and logistic regression models. Landslides 2007, 4, 33–41. [Google Scholar] [CrossRef]
  18. Khosravi, K.; Nohani, E.; Maroufinia, E.; Pourghasemi, H.R. A GIS-based flood susceptibility assessment and its mapping in Iran: A comparison between frequency ratio and weights-of-evidence bivariate statistical models with multi-criteria decision-making technique. Nat. Hazards 2016, 83, 947–987. [Google Scholar] [CrossRef]
  19. Pham, B.T.; Avand, M.; Janizadeh, S.; Phong, T.V.; Al-Ansari, N.; Ho, L.S.; Das, S.; Le, H.V.; Amini, A.; Bozchaloei, S.K.; et al. GIS based hybrid computational approaches for flash flood susceptibility assessment. Water 2020, 12, 683. [Google Scholar] [CrossRef] [Green Version]
  20. Liu, M.; Chen, N.; Zhang, Y.; Deng, M. Glacial lake inventory and lake outburst flood/debris flow hazard assessment after the gorkha earthquake in the Bhote Koshi Basin. Water 2020, 12, 464. [Google Scholar] [CrossRef] [Green Version]
  21. Khan, F.A. An Analysis of Lessons Learnt and Best Practices, a Review of Selected Biodiversity Conservation and NRM Projects from the Mountain Valleys of Northern Pakistan; Government of Khyber Pakhtunkhwa: Khyber Pakhtunkhwa, Pakistan, 2013.
  22. Pradhan, B.; Oh, H.J.; Buchroithner, M. Weights-of-evidence model applied to landslide susceptibility mapping in a tropical hilly area. Geomat. Nat. Hazards Risk 2010, 1, 199–223. [Google Scholar] [CrossRef]
  23. Aoki, K.; Uehara, M.; Kato, C.; Hirahara, H. Evaluation of Rugby Players’ Psychological-Competitive Ability by Utilizing the Analytic Hierarchy Process. Open J. Soc. Sci. 2016, 4, 103–117. [Google Scholar] [CrossRef] [Green Version]
  24. Shahabi, H.; Jarihani, B.; Tavakkoli Piralilou, S.; Chittleborough, D.; Avand, M.; Ghorbanzadeh, O. A Semi-Automated Object-Based Gully Networks Detection Using Different Machine Learning Models: A Case Study of Bowen Catchment, Queensland, Australia. Sensors 2019, 19, 4893. [Google Scholar] [CrossRef] [Green Version]
  25. Dang, N.M.; Babel, M.S.; Luong, H.T. Evaluation of food risk parameters in the Day River Flood Diversion Area, Red River Delta, Vietnam. Nat. Hazards 2011, 56, 169–194. [Google Scholar] [CrossRef]
  26. Le, L.M.; Ly, H.B.; Pham, B.T.; Le, V.M.; Pham, T.A.; Nguyen, D.H.; Tran, X.T.; Le, T.T. Hybrid artificial intelligence approaches for predicting buckling damage of steel columns under axial compression. Materials 2019, 12, 1670. [Google Scholar] [CrossRef] [Green Version]
  27. Mondal, S.; Maiti, R. Integrating the Analytical Hierarchy Process (AHP) and the frequency ratio (FR) model in landslide susceptibility mapping of Shiv-khola watershed, Darjeeling Himalaya. Int. J. Disaster Risk Sci. 2013, 4, 200–212. [Google Scholar] [CrossRef] [Green Version]
  28. Ishaq, M.; Leghari, I.U. Political/Power Structure and Vulnerability to Natural Disaster in North Western Pakistan. Res. J. Soc. Sci. Econ. Rev. 2020, 1, 389–400. [Google Scholar]
  29. Kirkby, M.; Bracken, L.; Reaney, S. The influence of land use, soils and topography on the delivery of hillslope runoff to channels in SE Spain. Earth Surf. Process. Landf. J. Br. Geomorphol. Res. Gr. 2002, 27, 1459–1473. [Google Scholar] [CrossRef]
  30. Technical, E.E.A. Mapping the Impacts of Natural Hazards and Technological Accidents in Europe an Overview of the Last Decade; European Environment Agency: Copenhagen, Denmark, 2010; ISBN 9789292131685. [Google Scholar]
  31. Alexakis, D.D.; Sarris, A. Integrated GIS and remote sensing analysis for landfill sitting in Western Crete, Greece. Environ. Earth Sci. 2014, 72, 467–482. [Google Scholar] [CrossRef]
  32. Ahmad, D.; Afzal, M. Flood hazards and factors influencing household flood perception and mitigation strategies in Pakistan. Environ. Sci. Pollut. Res. 2020, 27, 1–13. [Google Scholar] [CrossRef]
  33. Dewan, T.H. Societal impacts and vulnerability to floods in Bangladesh and Nepal. Weather Clim. Extrem. 2015, 7, 36–42. [Google Scholar] [CrossRef] [Green Version]
  34. Pimentel, S.; Flowers, G.E. A numerical study of hydrologically driven glacier dynamics and subglacial flooding. Proc. R. Soc. A Math. Phys. Eng. Sci. 2011, 467, 537–558. [Google Scholar] [CrossRef]
  35. Ouma, Y.O.; Tateishi, R. Urban flood vulnerability and risk mapping using integrated multi-parametric AHP and GIS: Methodological overview and case study assessment. Water 2014, 6, 1515–1545. [Google Scholar] [CrossRef]
  36. Khatoon, R.; Hussain, I.; Anwar, M.; Nawaz, M.A. Diet selection of snow leopard (Panthera uncia) in Chitral, Pakistan. Turkish J. Zool. 2017, 41, 914–923. [Google Scholar] [CrossRef]
  37. Tariq, A.; Shu, H. CA-Markov Chain Analysis of Seasonal Land Surface Temperature and Land Use Landcover Change Using Optical Multi-Temporal Satellite Data of Faisalabad, Pakistan. Remote Sens. 2020, 12, 3402. [Google Scholar] [CrossRef]
  38. Tariq, A.; Riaz, I.; Ahmad, Z. Land surface temperature relation with normalized satellite indices for the estimation of spatio-temporal trends in temperature among various land use land cover classes of an arid Potohar region using Landsat data. Environ. Earth Sci. 2020, 79, 1–15. [Google Scholar] [CrossRef]
  39. Wu, C.Y.; Mossa, J. Decadal-scale variations of thalweg morphology and riffle-pool sequences in response to flow regulation in the lowermost Mississippi River. Water 2019, 11, 1175. [Google Scholar] [CrossRef] [Green Version]
  40. Choubin, B.; Moradi, E.; Golshan, M.; Adamowski, J.; Sajedi-Hosseini, F.; Mosavi, A. An ensemble prediction of flood susceptibility using multivariate discriminant analysis, classification and regression trees, and support vector machines. Sci. Total Environ. 2019, 651, 2087–2096. [Google Scholar] [CrossRef]
  41. Strahler, A.N. Dynamic Basis of Geomorphology. Bull. Geol. Am. 1952, 63, 923–939. [Google Scholar] [CrossRef]
  42. Bui, D.T.; Tsangaratos, P.; Ngo, P.-T.T.; Pham, T.D.; Pham, B.T. Flash flood susceptibility modeling using an optimized fuzzy rule based feature selection technique and tree based ensemble methods. Sci. Total Environ. 2019, 668, 1038–1054. [Google Scholar] [CrossRef]
  43. Hoang, L.P.; Biesbroek, R.; Tri, V.P.D.; Kummu, M.; van Vliet, M.T.H.; Leemans, R.; Kabat, P.; Ludwig, F. Managing flood risks in the Mekong Delta: How to address emerging challenges under climate change and socioeconomic developments. Ambio 2018, 47, 635–649. [Google Scholar] [CrossRef] [PubMed] [Green Version]
  44. Tariq, A.; Shu, H.; Kuriqi, A.; Siddiqui, S.; Gagnon, A.S.; Lu, L.; Thi, N.; Linh, T.; Pham, Q.B. Characterization of the 2014 Indus River Flood Using Hydraulic Simulations and Satellite Images. Remote Sens. 2021, 13, 2053. [Google Scholar] [CrossRef]
  45. Saaty, T.L. How to make a decision: The analytic hierarchy process. Eur. J. Oper. Res. 1990, 48, 9–26. [Google Scholar] [CrossRef]
  46. Saaty, T.L. A scaling method for priorities in hierarchical structures. J. Math. Psychol. 1977, 15, 234–281. [Google Scholar] [CrossRef]
  47. Bozdağ, A.; Yavuz, F.; Günay, A.S. AHP and GIS based land suitability analysis for Cihanbeyli (Turkey) County. Environ. Earth Sci. 2016, 75. [Google Scholar] [CrossRef]
  48. Rikalovic, A.; Cosic, I.; Lazarevic, D. GIS Based Multi-criteria Analysis for Industrial Site Selection. Procedia Eng. 2014, 69, 1054–1063. [Google Scholar] [CrossRef] [Green Version]
  49. Markantonis, V.; Meyer, V.; Lienhoop, N. Evaluation of the environmental impacts of extreme floods in the Evros River basin using Contingent Valuation Method. Nat. Hazards 2013, 69, 1535–1549. [Google Scholar] [CrossRef]
  50. Roopnarine, R.; Opadeyi, J.; Eudoxie, G.; Thong, G.; Edwards, E. GIS-based flood susceptibility and risk mapping Trinidad using weight factor modeling. Caribb. J. Earth Sci. 2018, 49, 1–9. [Google Scholar]
Figure 1. Geo-location of the study area and points show the training and testing points that were used in this research.
Water 13 01650 g001
Figure 2. Damage caused by a flash flood in Chitral.
Water 13 01650 g002
Figure 3. In this study, maps of flash flood conditioning variables were used: (a) distance from the river, (b) drainage density, (c) slope, (d) elevation, (e) rainfall deviation, (f) soil resistivity, (g) geology infiltration, and (h) land use/cover.
Water 13 01650 g003
Figure 4. Flow chart of the methodology used in this study.
Water 13 01650 g004
Figure 5. Flood-inducing factors for mapping flood susceptibility based on class frequency ratios.
Water 13 01650 g005
Figure 6. Flood risk zones map of the study area using the FP and AHP models.
Water 13 01650 g006
Table 1. The sources from which various data were gathered and their implementation purpose.
S. NoPrimary DataSpatial ResolutionFormatSource of DataDerived Map
1Sentinel-210 mRaster(https://earthexplorer.usgs.gov; accessed on 20 June 2018)Land-use map, extraction of drainage basin
2ALOS-PALSAR (DEM)12.5 mRasterhttps://search.asf.alaska.edu/; accessed on 12 August 2019Slope, drainage density, elevation, flow accumulation, distance from the river
4Geological data1:10,000VectorGeological Survey of PakistanGeological map
5Soil data1:100,000VectorSoil Survey of PakistanSoil map
6Rainfall data1:100,000RasterPakistan Meteorological DepartmentRainfall deviation map
Table 2. Comparison of two factors that can induce flooding in the form of a numerical scale.
S. NoExplanation/DefinitionsImportance Intensity
01Extremely more important8 and 9
02Very strongly more important6 and 7
03Strongly more important4 and 5
04Moderately more important3 and 2
05Equally important1
Table 3. For the flood susceptibility mapping, the flood-causing variables and their selected factor weight values (SFWVs) are shown.
S. NoClasses (Abbreviations)DRDDSLERSoGLULCSFWV
1Distance from the river (DR)113243310.3390
2Drainage density (DD)3120.50.24410.1256
3Slope (SL)20.3410.340.33330.250.0562
4Elevation (E) 10.250.510.25220.250.0376
5Rainfall (R)0.50.20.340.2510.50.3430.2144
6Soil (So)0.340.170.250.20.510.50.250.1190
7Geology (G)0.250.170.20.170.50.3410.350.1850
8Land use/cover (LULC)0.20.150.170.140.50.250.1310.1480
Table 4. Flood susceptibility risk classes and estimated area in square kilometers and percentages.
ValueClassEstimated Risk Area (km2)Estimated Risk Area (%)
1Very low risk7457.550
2Low risk1502.5610
3Moderate risk2833.6919
4High risk1888.03613
5Very high risk1168.118
Total area14,849.905100
Table 5. Flood susceptibility mapping estimation of prediction accuracy and success rate.
Susceptible ClassFlood Testing Points (30%)Accurate Points in Class Prediction AccuracyFlood Training Points (70%)Accurate Points in ClassSuccess Rate
Very low risk7670.81 (81%)151890.84 (84%)
Low risk9 18
Moderate risk2119
High risk2584
Very high risk2874
Total90210
Publisher’s Note: MDPI stays neutral with regard to jurisdictional claims in published maps and institutional affiliations.

