Article

Spatial Distribution Characteristics and Sources of Nutrients and Heavy Metals in the Xiujiang River of Poyang Lake Basin in the Dry Season

1
School of Resources Environment & Chemical Engineering, Nanchang University, Nanchang 330031, China
2
Key Laboratory of Poyang Lake Environment and Resources Utilization, Ministry of Education, Nanchang 330031, China
3
Jiangxi Institute of Geo-Environment Monitoring, Nanchang 330095, China
4
School of Hydraulic and Ecological Engineering, Nanchang Institute of Technology, Nanchang 330099, China
*
Authors to whom correspondence should be addressed.
Water 2021, 13(12), 1654; https://doi.org/10.3390/w13121654
Submission received: 28 April 2021 / Revised: 7 June 2021 / Accepted: 7 June 2021 / Published: 12 June 2021

Abstract

:
In December of 2019, a total of 114 river water samples were collected from 38 sampling sites in the Xiujiang River of the Poyang Lake Basin for three consecutive days. The temperature (T), pH, dissolved oxygen (DO), chemical oxygen demand (CODCr), five-day biochemical oxygen demand (BOD5), total nitrogen (TN), ammonia nitrogen (NH4+-N), total phosphorus (TP), and concentrations of heavy metals (Cr, Cu, Zn and As) of the samples were measured. The results showed that the average concentrations of heavy metals in the mainstream of the Xiujiang River were Cu > Zn > Cr > As, and those in the main tributary of Xiujiang River (named as the Liaohe tributary) were Zn > Cu > Cr > As, which met the class III of the Environmental Quality Standards for Surface Water in China. However, it was founded that TN and NH4+-N in some agricultural areas had not met the class III standard of surface water. Hierarchical clustering analysis grouped sampling sites into four clusters. Clusters 1, cluster 2, cluster 3, and cluster 4 corresponded to an urban industrial area, rural mountainous area, primitive mountainous area, and agricultural area, respectively. The majority of the sampling sites were classified as mountainous rural areas less impacted by human activities, while the Liaohe tributary were urban industrial areas impacted more by human activities. Principal component analysis and correlation analysis results showed that variation of heavy metals and nutrient elements in Xiujiang River is related to the heterogeneity of human activities, which is mainly affected by urban industrial and agricultural pollution, and natural environments of the river with different background values. The results obtained in the current study will potentially provide a scientific basis for the protection and management of freshwater resources and aquatic ecosystems in the Xiujiang River and Poyang Lake Basin.

1. Introduction

River systems play important roles in the sustainable development of the biophysical environment, and the human activities and natural processes along the river will have a long-term impact on the river system [1]. Anthropogenic activities, such as municipal and industrial emissions, agricultural activities, and mineral development processes, combined with natural processes, such as precipitation, erosion, and weathering, will determine the river water quality [2,3]. River nutrition and heavy metal contents are important factors affecting river water quality. Previous research results have shown that agricultural activities are the main sources of suspended solids and inorganic nutrients (phosphate and nitrate) in rivers, and agricultural fertilization is also considered the main source of heavy metals [4,5,6]. In addition, industrial wastewater contains a variety of heavy metals [7,8,9], and municipal discharges will also have significant impacts on the nutrient elements and heavy metal content in rivers [10,11,12]. Nutrients and heavy metals pollution in rivers will not only lead to the loss of biodiversity and environmental degradation, but also pose a serious threat to human health. The analyses of spatial distribution and source of nutrients and heavy metals have become hot topics in recent years [5,12,13,14,15].
As one of the five major rivers in Jiangxi Province, the Xiujiang River provides an important guarantee for the maintenance of water resources and water ecological security of Poyang Lake Basin. However, due to the development of exploitation of mineral resources, industry and agriculture, and urban growth, water system of the Poyang Lake presents different pollution degrees [16,17,18,19]. It has been reported that the TN and TP contents in waters at the estuary of the Xiujiang River are 1.34 mg/L and 0.09 mg/L, respectively, which are only lower than the Raohe River in the five major rivers of Poyang Lake Basin [20]. Concentrations of two dissolved heavy metals (Zn and Cd) in the Xiujiang River are the highest in the five major rivers of Poyang Lake Basin, and the Xiujiang River is severely polluted with Zn [20]. However, the following problems are still encountered in the study of water pollution in the Xiujiang River: (1) Previous studies have only investigated a few sections of the Xiujiang River, and the spatial variation characteristics, influencing factors and sources of nutrient elements and heavy metals in the whole river are still unclear; (2) Previous researches focused on dissolved heavy metals in waters of the Xiujiang River, and the total content of heavy metals in the water body, which includes dissolved and colloidal heavy metals, has not been studied.
Therefore, based on this study’s systematic sampling of the Xiujiang River, the contents of nutrient elements and heavy metals (dissolved and colloidal elements) in waters were analyzed to ascertain the spatial distribution characteristics and pollution status in the Xiujiang River. The natural or anthropogenic sources of the nutrients and heavy metals in the Xiujiang River were analyzed using multivariate statistical analysis methods. The results can provide scientific reference for the future protection and management of freshwater resources and the aquatic ecosystem of the Xiujiang River and the Poyang Lake Basin.

2. Materials and Methods

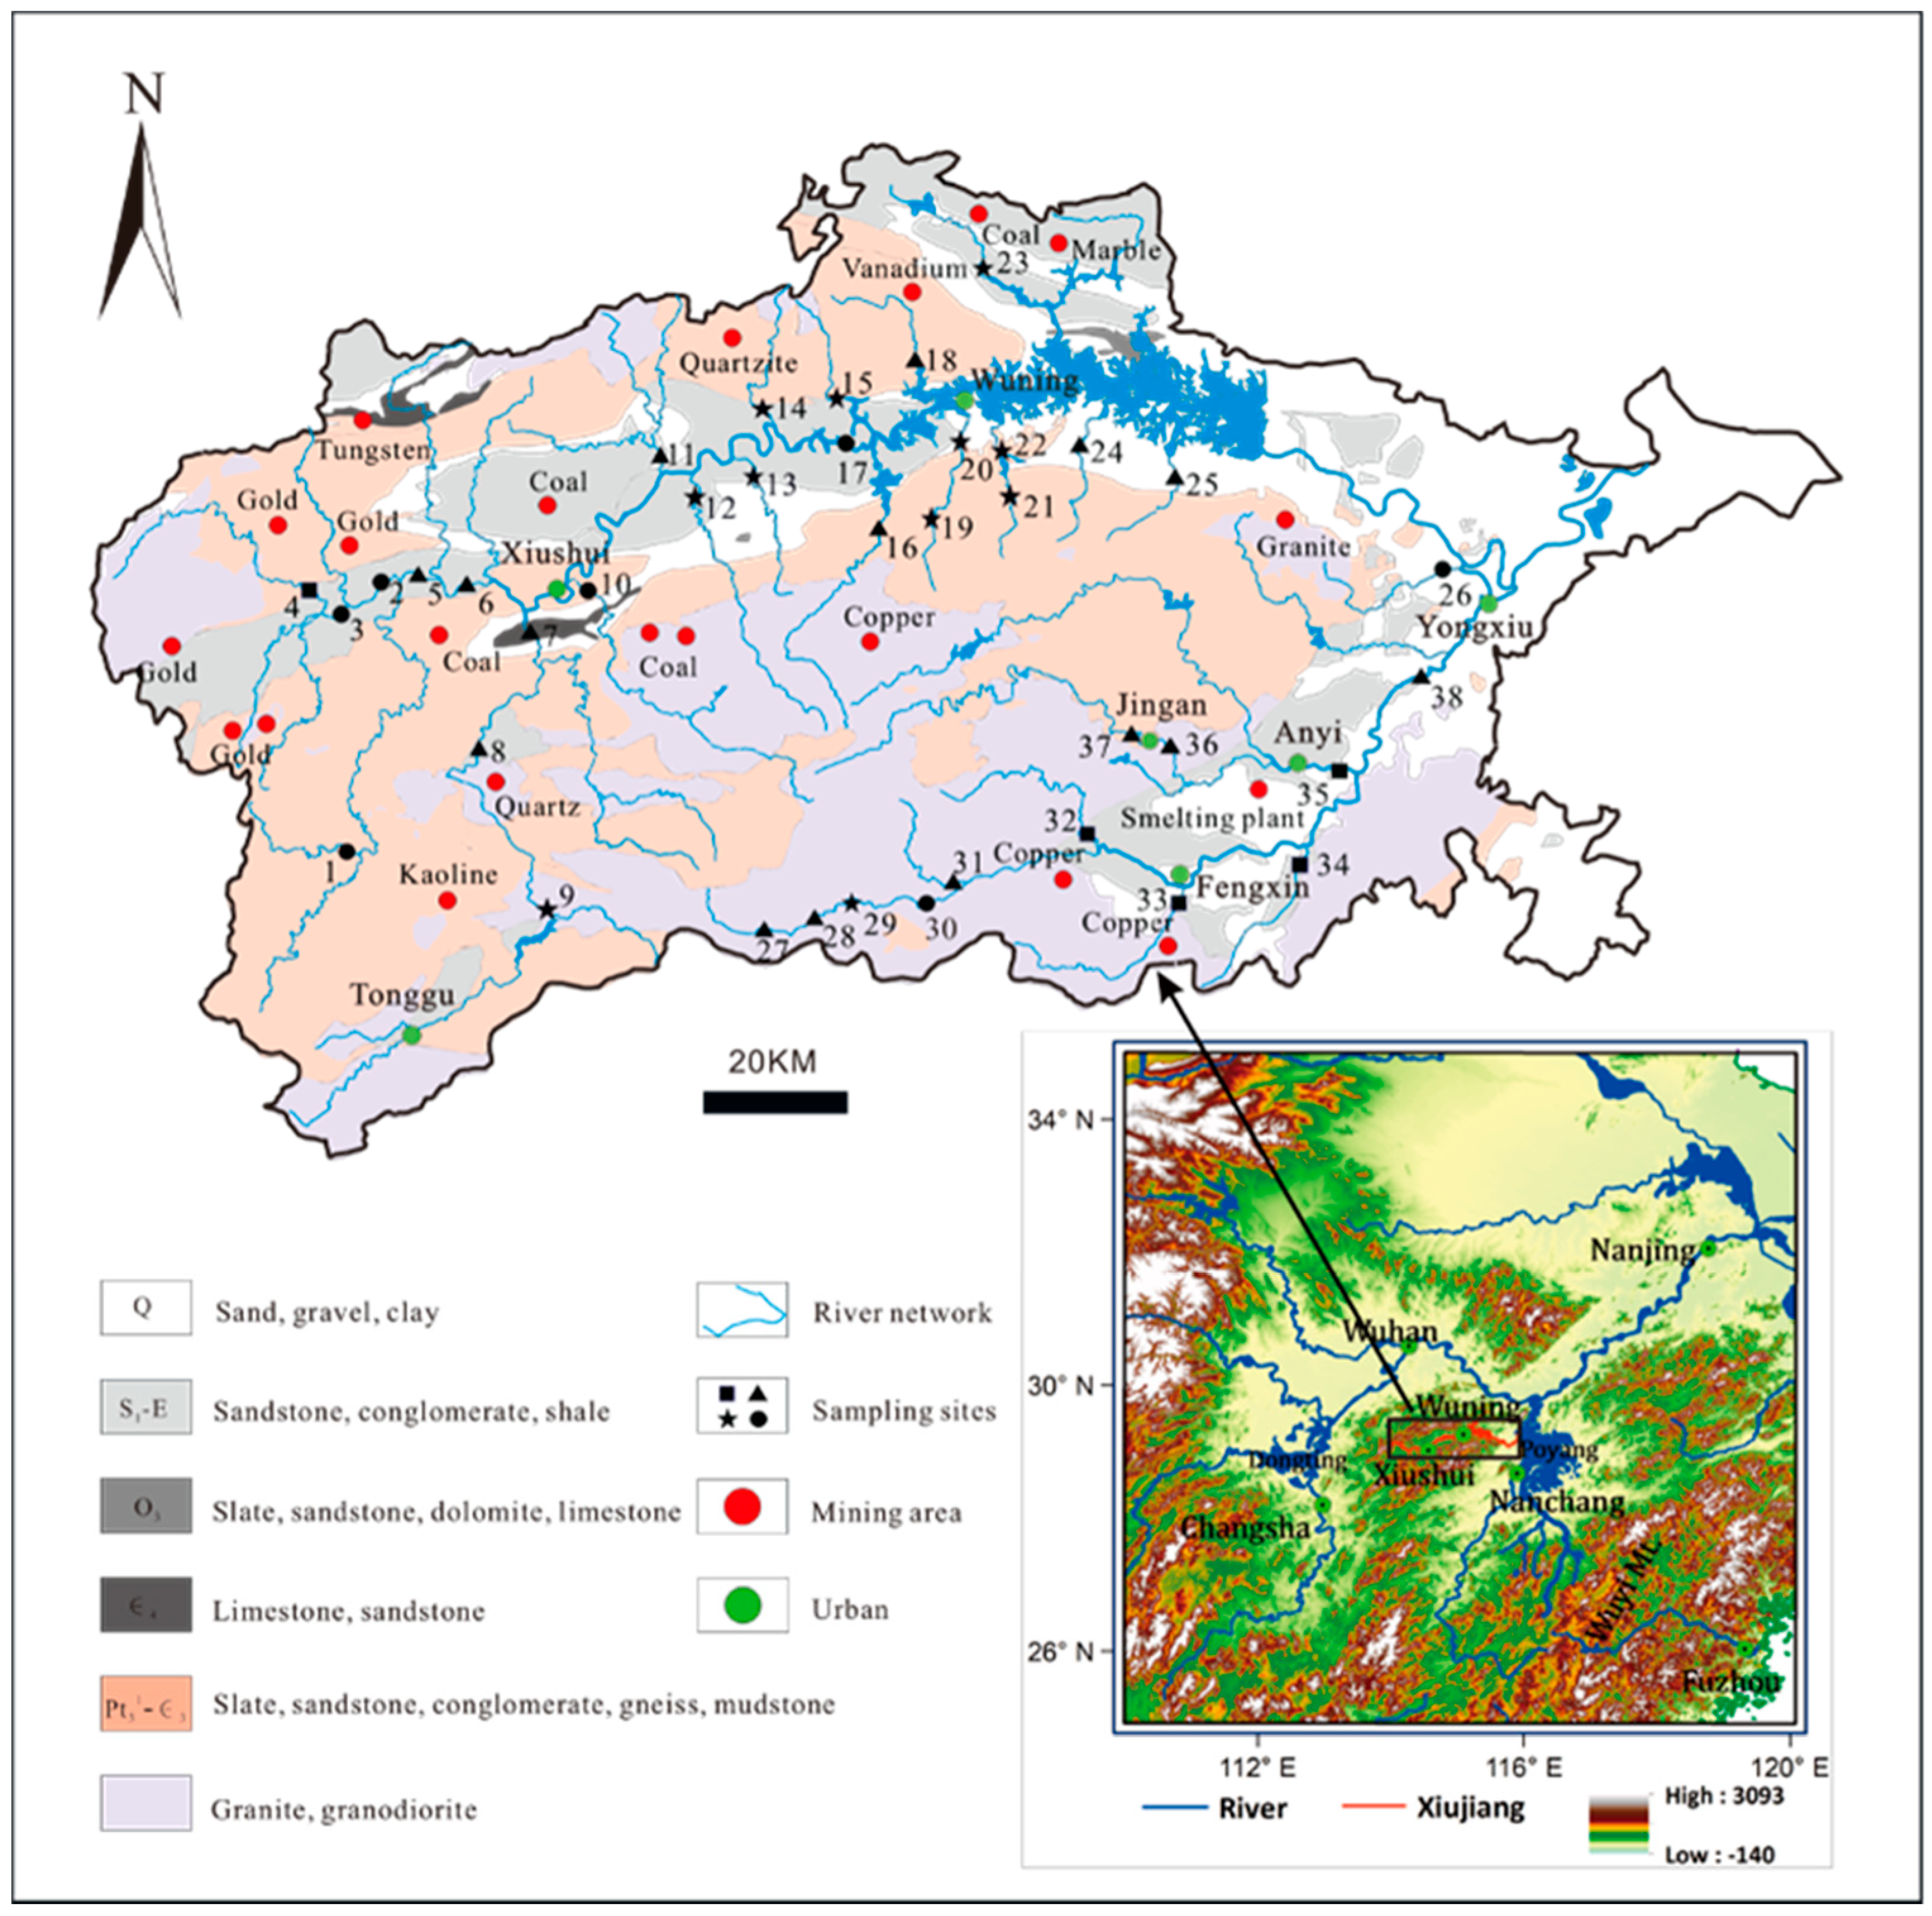
2.1. Destription of the Study Area

The Xiujiang River is in the northwestern Jiangxi Province and west of Poyang Lake between longitudes 113°56′ and 116°01′ E and latitudes 28°23′ and 29°32′ N. It originates from Yejiashan area in Tonggu County, northwest of Daweishan Mountain in Jiuling Mountain Range (Figure 1). The mainstream flows through the counties of Tonggu, Xiushui, Wuning and Yongxiu, and then joins the Poyang Lake through Wucheng Town. The upstream, middle stream and downstream are divided from headwater to Xiushui County, Xiushui county to Wuning County, and Wuning county to Poyang Lake, respectively. The total length of the mainstream is 419 km, and the drainage area is 14,797 km2 [21]. The Xiujiang River belongs to a mid-subtropical humid monsoon climate zone, with an average annual precipitation of 1663 mm and an average annual runoff of 135.05 × 10⁸ m3. The runoff from April to September accounts for 74.2% of the total annual runoff.
The Xiujiang River formed after the strong uplift of the Himalayas and other geological tectonic movements three million years ago. The mainstream flows from west to east between Jiuling Mountain Range and Mufu Mountain Range. After that, the Xiujiang River was further uplifted by the Himalayan movement, which gradually formed the Xiujiang River drainage system dominated by cutting and erosion. The current landforms of the Xiujiang River are composed of 15% of mountainous areas, 48% of hilly areas, and 37% of alluvial plains. Lithology composition in upper, middle, and downstream is magmatic rocks, granite and carbonate rocks, and carbonate and clastic rocks. The population in the Xiujiang River area exceeds 2.35 million, and the cultivated land area accounts for 6.7% of the areas. In addition, since the economy of the study area is undeveloped and dominated by forestry and agricultural activities, the city and industry scales tend to be small, with the mineral resources mainly distributed in the upper reaches of the basin, as illustrated in Figure 1.

2.2. Samples and Methods

In December of 2019, 38 sampling points were set up in the mainstream of the Xiujiang River and the Liaohe tributary (Figure 1). Samples were collected from each sampling point for three consecutive days, with a total of 114 water samples collected. All of the samples were clear water samples which were collected at a depth of 0.5 m and then loaded into polyethylene plastic sample bottles after being moistened and washed with river water. The samples were transferred to this study’s laboratory facilities and maintained for a 24-h period for the purpose of obtaining the supernatant liquor. The temperature (T), pH, and dissolved oxygen (DO) values of the river water were measured on site. The five-day biochemical oxygen demand (BOD5) was measured after incubation at 20 ± 1 ℃ for 5 days and determined using an YSI portable water quality analyzer (YSI pro1020, USA), with an error rate of approximately 0.01. The water samples used for the heavy metal determinations were first acidified with high grade pure nitric acid (pH 2 to 3), and the concentrations of Zn, Cu, Cr, As, Hg, Cd and Pb were determined were measured through inductively coupled plasma mass spectrometry (NexION300, PerkinElmer, Waltham, MA, USA) in State Key Laboratory of Hydrology-Water Resources and Hydraulic Engineering, Hohai University. The concentrations of Hg, Cd and Pb in some samples are lower than the instrument detection limit. Therefore, only Cr, Cu, Zn and As are used in this study. The measurement reproducibility was determined by repeated analysis of samples and standards, and the relative standard deviation (RSD) is ±5%.
Multivariate analysis and geostatistical methods are widely used to study the modeling of the spatial variability of river water chemistry, as well as spatial distribution and risk assessments. These methods include cluster analysis (CA); principal component analysis (PCA); factor analysis (FA); analysis of variance (ANOVA); correlation analysis; and discriminant analysis (DA) [22]. Cluster analysis (CA) is a multivariate statistical analysis technique and a powerful pattern recognition tool, which classifies or clusters objects according to the similarities and differences of the samples [23]. Discriminant analysis (DA) is used to further evaluate the spatial changes in water quality and to divide two or more variable groups [24]. Factor analysis and principal component analysis (FA/PCA) methods have been widely used to characterize spatial and temporal changes [25,26]. It has been found that the use of a variety of multivariate analysis methods can not only obtain the relationships between the variables but can also verify the conclusions of the different methods [27]. The total 114 observations during three consecutive days were treated statistically using SPSS 25.0 for Windows (IBM Corporation, Armonk, NY, USA).

3. Results

3.1. Hydro-Chemical Characteristics of the Xiujiang River

The analysis results showed that the pH values of the mainstream of the Xiujiang River ranged from 6.17 to 7.23, with an average value of 6.72, and the pH value of the Liaohe ranged between 7.13 and 7.37, with an average value of 7.21, as shown in Table 1 and Table 2. The mainstream of the Xiujiang River was mainly located in a mountainous area. Meanwhile, the Liaohe was in an area with relatively active urban industry, where the acidity of the water was easily neutralized due to wastewater discharges [13]. As shown in Figure 2, the water temperature in the mainstream of the Xiujiang River was higher than those of the Liaohe tributary. The variation ranges of the DO concentrations in the mainstream and the Liaohe tributary were 5.37–8.86 and 5.76–6.91 mg/L, with average concentrations of 6.77 and 6.40 mg/L, respectively. There were only minimal changes in the DO observed across the river basin. The variation ranges of the CODCr values in the mainstream and the Liaohe tributary were determined to be 0.0–17.87 and 0–16.88 mg/L, with averages of 6.13 mg/L and 6.14 mg/L, respectively, as shown in Table 1 and Table 2. The variation ranges of the BOD5 contents in the mainstream and the Liaohe tributary were 0.73 to 3.7 mg/L and 1.27 to 3.63, respectively, with averages of 2.67 and 3.00 mg/L, respectively (Table 1 and Table 2). The average CODCr and BOD5 values in the upper and lower reaches of the mainstream and the Liaohe tributary were higher than those in the middle reaches of the mainstream. However, the DO values were just the opposite (Table 1). The reason for this was determined to be that the upper reaches of the mainstream were located in a mountainous area where the river water had strong scouring power, and there were more sediment and organic matter in the water body. Meanwhile, the lower reaches and the Liaohe tributary were located in areas of human activities, where urban industries and agricultural processes were located, with sewage discharges containing increased amounts of organic matter and microorganisms. In contrast, the middle reaches of the mainstream were mainly original hilly landforms [13].
By comparison with the hadrochemical characteristics of the other rivers in the Poyang Lake Basin, the CODCr values in the Xiujiang River were lower. However, the CODCr and BOD5 values are higher than the average value of waters in Poyang Lake, while the DO values were the opposite (Table 2), which indicated that the higher the pollution degree of the water, the lower the contents of dissolved oxygen [29]. When compared with the Yangtze River Basin and its tributaries, the CODCr and BOD5 values in the Xiujiang River were found to be higher than those in the Guagongshan section of the Yangtze River and its Jinsha River tributary, and close to those in MinjiangRiver and the Yangtze River estuary [36]. In addition, when compared with the Xiangjiang River Basin, the CODCr values of the Xiujiang River were observed to be smaller. However, the DO values were higher [35]. The CODCr values of the Xiujiang River were found to be three times that of the background values of the mainstream and tributaries of the Yangtze River Basin from 1991 to 2000, which reflected the impacts of human activities on the water quality in recent years [37]. It was found from this study’s comparison results that the DO, CODCr, and BOD5 values in the Xiujiang River Basin were better than China’s Class III and the WHO drinking water standards, as detailed in Table 2 and Figure 2.
The coefficient of variation (CV) of the DO in the Xiujiang River was small (Table 2), which indicated that the spatial fluctuations were small (Figure 2). The CV of the CODCr and BOD5 in the upper reaches of Xiujiang River were determined to be much smaller than those in the middle and lower reaches and the Liaohe River tributary, which indicated that the influencing factors of CODCr and BOD5 values in the upper reaches were relatively singular. Meanwhile, those of the Liaohe River tributary, with its developed cities and towns, were significantly affected by human activities, and the CV of the CODCr could be as high as 1.03. The CV of the TP and TN in the lower reaches of Xiujiang River’s mainstream and its Liaohe tributary were significantly higher than those in the upper and middle reaches of the Xiujiang’s mainstream, which indicated that the sources of nitrogen and phosphorus in the plain dominated lower reaches of the Xiujiang River were more complex (Table 1 and Figure 2).

3.2. Changes in the Nitrogen and Phosphorus Contents in the Xiujiang River

The average contents of the TP, TN, and NH4+-N in the mainstream and the Liaohe tributary were 0.13, 0.51, 0.336 mg/L, and 0.098, 0.52, 0.207 mg/L, respectively, as shown in Table 1 and Table 2. The spatial variations and average content of the three nutrient elements in the upper, middle, and lower reaches of the mainstream and the Liaohe tributary were observed to change little (Table 1 and Figure 3).
In the Poyang Lake Basin, the TN and NH4+-N contents of the Xiujiang River were found to be lower than those of the Xinjiang River and the Raohe River; higher than those of the Ganjiang River; and similar to those of the Fuhe River. The TP of the Xiujiang River was higher than that of the Xinjiang River, Ganjiang River, and Fuhe River, and lower than that of the Raohe River [20]. The contents of NH4+-N and TP in the Xiujiang River were higher than those in Poyang Lake. Meanwhile, its TN was only half of that in Poyang Lake [29]. In addition, when compared with the Yangtze River Basin and its tributaries, the TP content in the Xiujiang River Basin was determined to be close to that of the Gongshan section of the Yangtze River, as well as the Jinsha River and the Minjiang River tributary during the dry seasons. Additionally, when compared with the Guagongshan section of the Yangtze River, the NH4+-N contents in the Xiujiang River Basin were observed to be similar, although its TN content were noticeably lower [38]. Furthermore, the NH4+-N and TP contents in the Xiujiang River was close to that of the adjacent Xiangjiang River, while the TN content was only 25% that of the Xiangjiang River [35].
In the present research investigation, with the exception of the samples obtained from the SW26 and SW30 sampling points, the average contents of TP, TN, and NH4+-N in the Xiujiang River were found to be higher than the class III of the Environmental Quality Standards for Surface Water in China and WHO water quality requirements (Table 2). Moreover, the contents of TP, TN, and NH4+-N at the SW26 sampling point, and those of TN and NH4+-N at the SW30 sampling point, were approximately three times that of the average value of the Xiujiang River, respectively. Those two sampling points were located in relatively flat terrain areas, which were mainly affected by phosphorus and nitrogen fertilizer from agricultural activities [13,29], or by sewage discharges and nitrification processes [39,40,41].

3.3. Characteristics and Spatial Distributions of the Dissolved Heavy Metals in the Rivers

The average contents of Cu, Zn, Cr, and As in the mainstream of the Xiujiang River were determined to be 60.5, 37.8, 5.15, and 2.89, respectively, and those in the Liaohe tributary were 85.0, 102.1, 5.56, and 1.88 μg/L, respectively, as detailed in Table 2. It was revealed that the average contents of heavy metals in the mainstream of Xiujiang River had displayed the relationship of Cu > Zn > Cr > As. Meanwhile, that of the Liaohe tributary had the relationship of Zn > Cu > Cr > As (Table 2). It was found that, from the upper reaches to the lower reaches, the contents of the Cu and Zn in the mainstream of the Xiujiang River changed little, while the contents of Cr and As increased slightly (Table 1 and Figure 2). Generally speaking, the Cu, Zn, Cr, and As content values of the Liaohe tributary were higher than those in the mainstream basin of the Xiujiang River, among which the Zn was nearly three times higher and the As was six times higher (Table 2). Figure 2 showed that the fluctuations of the heavy metal elements in the mainstream were relatively small. This study found that only the SW4 and SW5 samples in the upper reaches had higher Cu and Zn contents, while the content of Cu, Zn, and As in the SW34 and SW35 samples from the Liaohe tributary were observed to be 2–3 times that of their average values, In addition, the content of As in the SW32 and SW33 samples are 3 to 4 times that of their average values. In summary, the heavy metal pollution in the Liaohe tributary was considered to be relatively more serious. However, the pollution was still better than the national Class III water quality and WHO standards.
In the Poyang Lake Basin, the average Cu content in the Xiujiang River was found to be close to that of the Fuhe River, but higher than that of Poyang Lake and its tributaries. The average content value of Zn in the mainstream of the Xiujiang River was lower than that of Poyang Lake and its tributaries [20,28,29]. The average content of Cr in the Xiujiang River was higher than that of the Le’an River, and the average content of As was lower than that in the Le’an River [28]. This study found that when compared with the contents of dissolved Cu, Zn, and Cr in the Xiujiang River Basin in 2010, the contents of heavy metals in this study’s tests were relatively higher. In particular, the contents of Cu were dozens of times higher, indicating that there were large amounts of colloidal heavy metals in the unfiltered water [31,42]. In addition, when compared with the Yangtze River and its tributaries, the average contents of Cu and Zn in the Xiujiang River Basin were found to be higher than those observed in the Hunan section of the Yangtze River and the Xiangjiang River, and much higher than the background values of the Yangtze River Basin. Meanwhile, the average contents of Cr and As were found to be the opposite. Further, the concentration of As in the Xiujiang river is lower than dissolved As content in the Ganjiang River [18]. On the hand, these differences could be attributed to the distributions of natural minerals in the region, and on the other hand, the differences could potentially reflect the increases in human input or the changes in the weathering processes [31,43].
The CV of the Cu and Zn in the middle and lower reaches of the Xiujiang’s mainstream tended to be moderate to weak, which indicated that the sources were relatively stable. However, the Liaohe tributary and the upper reaches of Xiujiang’s mainstream displayed high variability (Table 2). The CV of the Zn in the upper reaches of the mainstream and the Liaohe tributary were 1.31 and 1.57, respectively, which reflected the complex background of the river basin and human influences. The CV of the Cr in the Xiujiang River was observed to be moderate to high. However, that of the As was high, with the exception of the upper reaches of the mainstream, which indicated that the sources of Cr and As in the Xiujiang River were also affected by different factors [13]. Similarly, the spatial oscillations of the hydro-chemical elements in the Xiujiang River were considered to reflect the differences in the sources (Figure 2).

4. Discussion

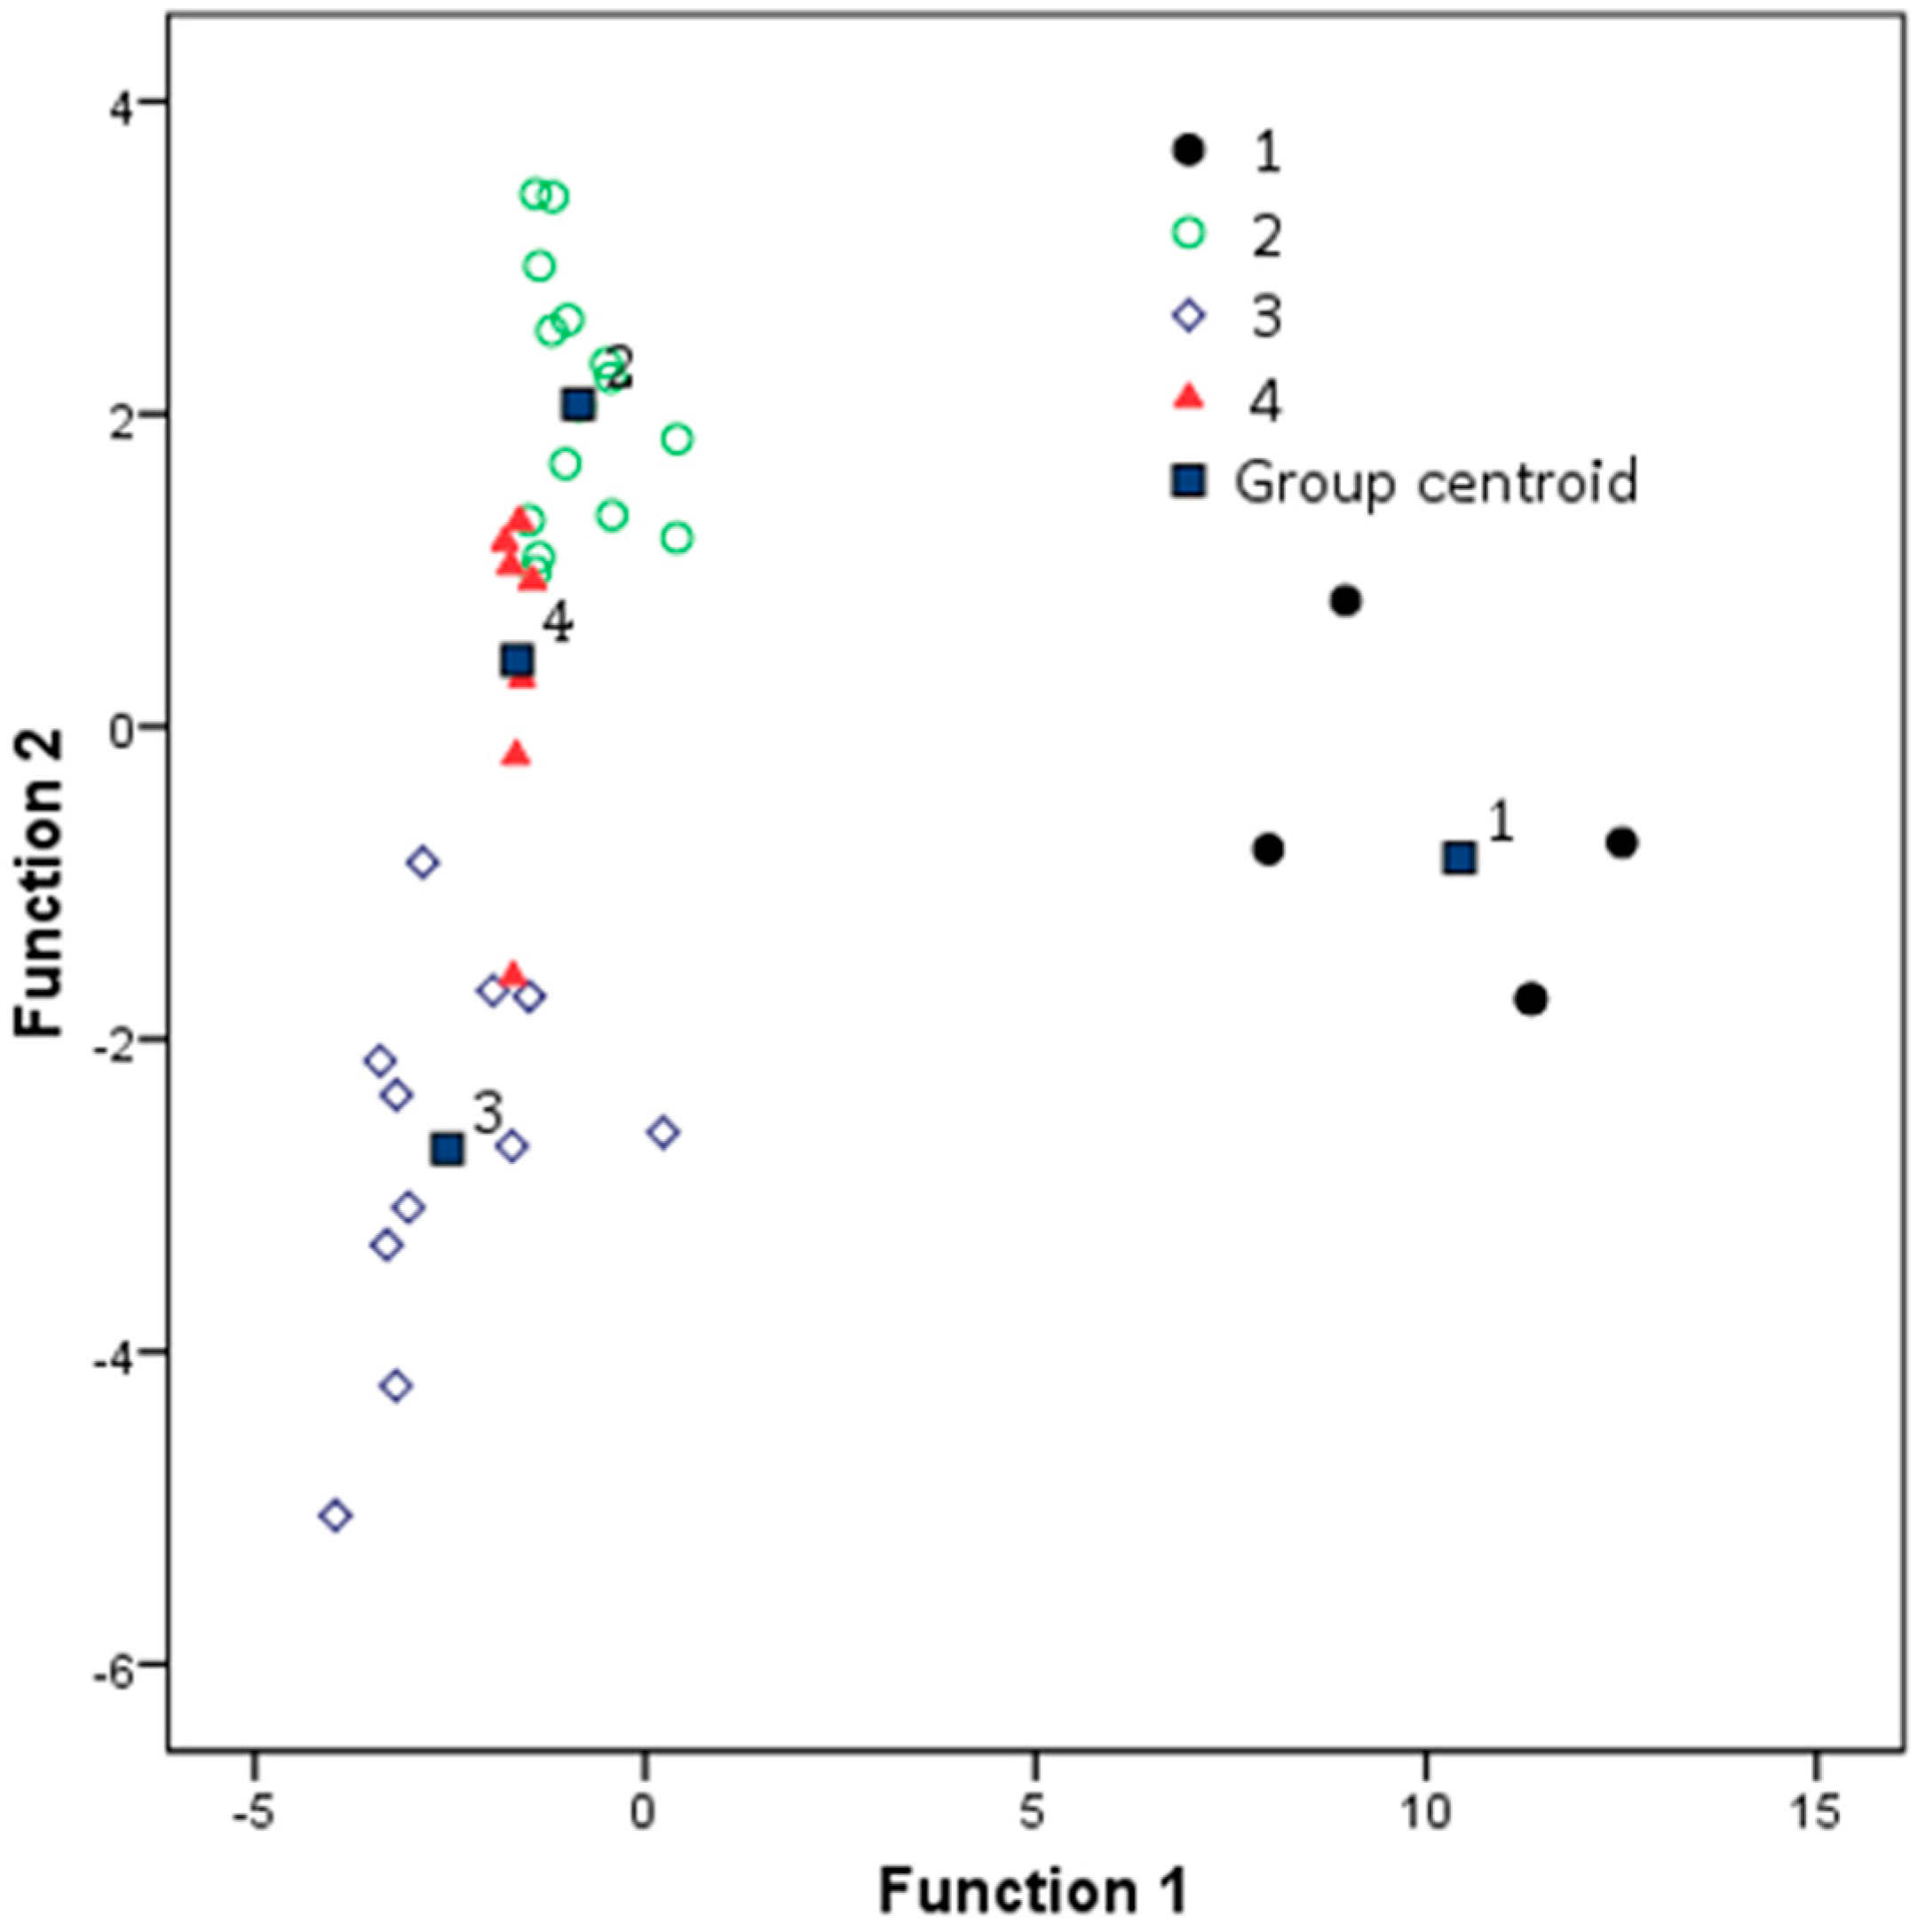
4.1. Cluster and Discriminant Analyses

Many successful applications of cluster analysis (CA) in water quality assessments have been reported [18,40,44]. The analysis results have shown that this technique can provide reliable water quality classifications and the best strategy for spatial sampling techniques [45]. In the present study, the hierarchical cluster analysis method was used to group 38 sampling points and 11 measurement variables. The Ward Method was used to group the data, and the square Euclidean distance was used to quantify the similarities between objects and obtain a tree diagram (Figure 3). A large number of previous studies have shown that the same types of sampling points tend to have similar pollutant sources [18,46].
A cluster analysis method was adopted in this study, and the sampling points were divided into CA1, CA2, CA3, and CA4 Groups. These groups were composed of sampling points (4, 32, 33, 34, 35); (5, 6, 7, 8, 11, 16, 18, 24, 25, 27, 28, 31, 36, 37, 38); (9, 12, 13, 14, 15, 19, 20, 21, 22, 23, 29); and (1, 2, 3, 10, 17, 26, 30), respectively, as detailed in Figure 3. Table 3 shows that, with the exception of the T, pH, TP, and Zn, there were significant differences in the heavy metals and nutrients among the different groups.
The average contents of CODCr, Cu, and As in the CA1 Group were the highest among the four clusters, which were 12.23 mg/L, 164.67 mg/L, and 3.94 mg/L, respectively. These findings reflected the influencing effects of the copper processing and mining in the Liaohe tributary (Figure 1). The CA1 Group was mainly located in towns in the lower reaches of the river basin, or in the plains where the mining industry was relatively developed. The towns along the Liaohe tributary are relatively developed, and the wastewater from human activities is directly discharged into the river. Therefore, the degradation in water quality was caused by anthropogenic influences, such as the mining and processing of the copper mine in the Liaohe tributary. The contents of Zn in the CA2 were was the highest, with an average content of 102.4 mg/L. Additonally, the contents of DO were higher, and those of BOD5 were lower, indicating that the water quality was better in the CA2 Group. The CA2 Group was located in a rural mountainous area, and the results reflected that human activities were not strong. The findings also indicated that slightly polluted rivers have self-purification abilities [47]. The Zn may have mainly originated from the natural weathering processes in the basin (Figure 1 and Table 3). The DO of the CA3 Group was found to be the highest and its BOD5 contents were the lowest, which indicated that the water quality was also better in the CA3. This was attributed to the group’s primitive mountain landforms, which were rarely impacted by human activities. The CA4 Group was located in a rural area with flat terrain, and human activities were mainly associated with agricultural production. This had resulted in the CA4 Group having the highest average content of NH4+-N, TN, and Cr among the four clusters, which were 0.66 mg/L, 0.77 mg/L, and 8.52 mg/L, respectively. In addition, the DO values of the CA4 Group were the lowest and the BOD5 values were the highest, which also indicated that the water quality in that group had been affected by human activities, as detailed in Figure 1 and Table 3.
This study’s discriminant analysis (DA) produced a variance of 89.6% for two discriminant functions (Function 1 and Function 2), and the 38 sampling points and 12 variables were discriminated into four different groups, which were also associated with the urban industrial area, rural mountainous area, primitive mountainous area, and agricultural area. These groups were well in agreement with the results of the four groups divided by the CA, indicating the correctness of the classification results [48]. Further, Group 2 and Group 4, representing the rural mountainous area and agricultural area, respectively, were located adjacent to each other, as shown in Figure 4. It can be inferred that their environmental backgrounds were relatively similar.

4.2. Identification of the Heavy Metal and Nutrient Sources

It has been proved that the principal component analysis method can effectively identify the main sources of the hydro-chemical elements in river waters on the basis of the correlation analysis results [13]. In this study, the results of the principal component analysis (Table 4) revealed that 74.2% of the variation information of the 12 variables in the Xiujiang River could be reflected by five principal components with eigenvalues greater than 1.Therefore, according to the absolute load values of >0.75, 0.75–0.5, and 0.5–0.3, it could be divided into strong loads, medium loads, and weak loads, respectively [49].

4.3. Source Contributions

This study found that Principal Component 1 explained 21.0% of the variance variations, in which NH4+-N, TN, and Cr had strong positive loads (Table 4), and these variables were highly correlated with each other (Table 5). Meanwhile, the DO had weak negative loads. In addition, the NH4+-N and TN were considered to mainly originated from urban sewage discharges and agricultural activities [29,50], making agricultural fertilizer and urban sewage also important sources of Cr [4,5,11,12]. Therefore, Principal Component 1 mainly represented the pollution of agricultural and municipal sources, and also verified the DO load caused by the pollution. This had corresponded with the cluster analysis results that the hydro-chemical characteristics of the CA4 Group were affected by human activities dominated by agricultural activities in a rural area with flat terrain.
It was determined that Principal Component 2 explained 15.9% of variance differences, in which the T and pH had strong positive loads and negative loads, but also had good correlation, and the As had weak positive loads (Table 4 and Table 5). These correlations and principal component loading characteristics indicated that pH values were controlled by temperature, but the As content in the river water was only weakly correlated with temperature (Table 5). It reflected that the As content in the river water was affected by temperature to a certain extent.
Principal Component 3 explained 15.5% of the variance differentiation, in which the CODCr, Cu, and As had strong and medium positive loads, respectively (Table 4). The Cu and As mainly originated from urban and industrial activities, such as energy production, mining, metal smelting and refining, manufacturing processes, automobile exhausts, and waste incineration [39,51,52]. The CODCr has been found to be a good measurement of the redox conditions [53]. The As was only significantly correlated with CODCr (Table 5). On the one hand, it revealed that CODCr was related to the heavy metal pollution of Cu and As. On the other hand, it indicated that the sources of Cu were related to copper production and mining processes in the Liaohe tributary, which was different from the sources of As.Principal Component 4 explained 11.1% of the variance differentiation, in which the BOD5 and DO had strong positive loads and medium negative loads, respectively (Table 4), and the variables were negatively correlated (Table 5). This reflected the negative relationship between the dissolved oxygen and the oxygen demands of the river water.
Principal Component 5 explained 10.6% of variance differentiation, where the TP and Zn had moderate positive loads and strong negative loads, respectively (Table 4). The negative relationship between the TP and Zn (in terms of loads) indicated that the Zn was the external input source of the TP [40]. TP stands for nutrient processes, and domestic sewage or sewage treatment plants, along with agricultural inorganic fertilizers, are the main sources of phosphorus in river courses [39,54]. It has been widely reported that Zn originates from urban sewage [55], or agricultural combustion and fungicide [56,57]. TP and Zn are not correlated with other elements (Table 5), indicating that the TP in the Xiujiang River was mainly from agricultural inorganic phosphate fertilizers, while the Zn was mainly related to the mineral exploitation and natural weathering in the river basin. The significant spatial differences in the Zn content levels in the Xiujiang River may have been related to the background values of different rock types (Figure 1). Therefore, Principal Component 5 could be attributed to a mixture of anthropogenic and petrogenic sources.
The results of spatial principal component analysis and correlation analysis in the Xiujiang River showed that the chemical elements of the river water varied with different river sections or tributaries due to the variations in the natural environments, such as geological characteristics, and heterogeneity of anthropogenic activities [44]. However, the majority of the hydro-chemical elements in the river water were successfully explained by one or more sources, which could be considered as the results of single or mixed origins, such as municipal and mining effluents, agricultural fertilizer pollution, natural weathering, and so on.

5. Conclusions

The water quality of the Xiujiang River Basin was evaluated in this study by the determination of the heavy metal and nutrient content levels. The results showed that the pollution levels were relatively low, but there was significant spatial variability in the water chemistry among the different river sections. A combination of cluster analysis, principal component analysis and correlation analysis were used to identify the sources of nutrients and heavy metals and showed effective and consistent results.
Hierarchical clustering analysis grouped sampling sites into four clusters. The CA1 Group was mainly located in the lower reaches of the Liaohe River tributary, where the mining and processing of copper and other minerals in the river had reached a certain scale. The contents of Cu, Zn, and As in the SW32–SW35 samples were found to be 2–4 times that of the average values of the river water. The CA4 area was mainly an agricultural area, in which the TN and NH4+-N of the SW30 samples exceeded the national drinking water Class III and WHO water quality requirements and were three times the average value of the basin. The CA2 and CA3 Groups were mainly natural mountainous rural areas. In particular, the CA3 was an undeveloped original landform. The high DO and low BOD5 content levels in the CA3 area reflected that the water quality had not been disturbed by human activities to a certain extent. Principal component analysis and correlation analysis results indicated that the main impacts on water quality originated from scattered point source pollutions (such as the mineral industry and urban sewage) and diffuse source pollutions (such as agricultural activities). The results obtained in this study will potentially provide a scientific basis for the future protection and management of the freshwater resources and aquatic ecosystems in the Poyang Lake Basin.

Author Contributions

Conceptualization, X.C. and C.H.; methodology, C.H.; software, C.X.; validation, F.Z. and X.C.; formal analysis, C.H.; investigation, C.X.; resources, D.W. and H.W.; data curation, F.Z.; writing—original draft preparation, X.C.; writing—review and editing, D.W. and H.W.; visualization, C.H.; supervision, F.Z.; project administration, F.Z.; funding acquisition, F.Z. All authors have read and agreed to the published version of the manuscript.

Funding

This study is financially supported by Survey Program of China Geological Survey (Grant Nos.1212011220990) the Science and Technique Foundation of Water Resources Department of Jiangxi Province (Grant Nos. 202123YBKT10) and the Natural Science Foundation of Jiangxi Province (Grant Nos. 2017BAB213027 and 20181BAB213016).

Data Availability Statement

The authors confirm that the data supporting the findings of this study are available within the article.

Acknowledgments

We would also like to thank Lanzhi Zhao for her help in sampling.

Conflicts of Interest

The authors declare no conflict of interest.

References

  1. Takić, L.; Mladenović-Ranisavljević, I.; Vasović, D.; Đorđević, L. The Assessment of the Danube River Water Pollution in Serbia. Water Air Soil Pollut. 2017, 228, 380. [Google Scholar] [CrossRef]
  2. Giri, S.; Singh, A.K. Risk assessment, statistical source identification and seasonal fluctuation of dissolved metals in the Subarnarekha River, India. J. Hazard. Mater. 2014, 265, 305–314. [Google Scholar] [CrossRef]
  3. Kasimov, N.; Shinkareva, G.; Lychagin, M.; Kosheleva, N.; Chalov, S.; Pashkina, M.; Thorslund, J.; Jarsjö, J. River Water Quality of the Selenga-Baikal Basin: Part I—Spatio-Temporal Patterns of Dissolved and Suspended Metals. Water 2020, 12, 2137. [Google Scholar] [CrossRef]
  4. Gholizadeh, M.H.; Melesse, A.M.; Reddi, L. Water quality assessment and apportionment of pollution sources using APCS-MLR and PMF receptor modeling techniques in three major rivers of South Florida. Sci. Total Environ. 2016, 566–567, 1552–1567. [Google Scholar] [CrossRef]
  5. Chen, L.; Zhou, S.; Wu, S.; Wang, C.; Li, B.; Li, Y.; Wang, J. Combining emission inventory and isotope ratio analyses for quantitative source apportionment of heavy metals in agricultural soil. Chemosphere 2018, 204, 140–147. [Google Scholar] [CrossRef] [PubMed]
  6. Molekoa, M.; Avtar, R.; Kumar, P.; Minh, H.T.; Dasgupta, R.; Johnson, B.; Sahu, N.; Verma, R.; Yunus, A. Spatio-Temporal Analysis of Surface Water Quality in Mokopane Area, Limpopo, South Africa. Water 2021, 13, 220. [Google Scholar] [CrossRef]
  7. Huang, F.; Xu, Y.; Tan, Z.; Wu, Z.; Xu, H.; Shen, L.; Xu, X.; Han, Q.; Qingguo, H.; Hu, Z. Assessment of pollutions and identification of sources of heavy metals in sediments from west coast of Shenzhen, China. Environ. Sci. Pollut. Res. 2018, 25, 3647–3656. [Google Scholar] [CrossRef] [PubMed]
  8. Tu, Y.-J.; You, C.-F.; Kuo, T.-Y. Source identification of Zn in Erren River, Taiwan: An application of Zn isotopes. Chemosphere 2020, 248, 126044. [Google Scholar] [CrossRef]
  9. Gafur, N.A.; Sakakibara, M.; Sano, S.; Sera, K. A Case Study of Heavy Metal Pollution in Water of Bone River by Artisanal Small-Scale Gold Mine Activities in Eastern Part of Gorontalo, Indonesia. Water 2018, 10, 1507. [Google Scholar] [CrossRef] [Green Version]
  10. Dietler, D.; Babu, M.; Cissé, G.; Halage, A.A.; Malambala, E.; Fuhrimann, S. Daily variation of heavy metal contamination and its potential sources along the major urban wastewater channel in Kampala, Uganda. Environ. Monit. Assess. 2019, 191, 52. [Google Scholar] [CrossRef] [PubMed]
  11. Marchenko, A.M.; Pshinko, G.N.; Demchenko, V.Y.; Marchenko, O. Ecological substantiation of invariably high concentrations of heavy metals in municipal wastewater sludges. J. Water Chem. Technol. 2015, 37, 206–210. [Google Scholar] [CrossRef]
  12. Kong, X.; Cao, J.; Tang, R.; Zhang, S.; Dong, F. Pollution of intensively managed greenhouse soils by nutrients and heavy metals in the Yellow River Irrigation Region, Northwest China. Environ. Monit. Assess. 2014, 186, 7719–7731. [Google Scholar] [CrossRef] [PubMed]
  13. Li, R.; Tang, X.; Guo, W.; Lin, L.; Zhao, L.; Hu, Y.; Liu, M. Spatiotemporal distribution dynamics of heavy metals in water, sediment, and zoobenthos in mainstream sections of the middle and lower Changjiang River. Sci. Total Environ. 2020, 714, 136779. [Google Scholar] [CrossRef]
  14. Bhattacharya, B.D.; Nayak, D.C.; Sarkar, S.K.; Biswas, S.N.; Rakshit, D.; Ahmed, K. Distribution of dissolved trace metals in coastal regions of Indian Sundarban mangrove wetland: A multivariate approach. J. Clean. Prod. 2015, 96, 233–243. [Google Scholar] [CrossRef]
  15. Putri, M.S.A.; Lou, C.-H.; Syai’In, M.; Ou, S.-H.; Wang, Y.-C. Long-Term River Water Quality Trends and Pollution Source Apportionment in Taiwan. Water 2018, 10, 1394. [Google Scholar] [CrossRef] [Green Version]
  16. Wu, Z.; Cai, Y.; Zhang, L.; Chen, Y. Spatial and temporal heterogeneities in water quality and their potential drivers in Lake Poyang (China) from 2009 to 2015. Limnologica 2018, 69, 115–124. [Google Scholar] [CrossRef]
  17. Zhang, D.W.; Zhang, L.; He, J.H.; Luo, L.G. Spatial distributions and risk assessment of dissolved heavy metals in Poyang Lake. Acta Ecol. Sin. 2015, 35, 8028–8035, (in Chinese with English abstract). [Google Scholar] [CrossRef]
  18. Zhang, H.; Jiang, Y.; Wang, M.; Wang, P.; Shi, G.; Ding, M. Spatial characterization, risk assessment, and statistical source identification of the dissolved trace elements in the Ganjiang River—Feeding tributary of the Poyang Lake, China. Environ. Sci. Pollut. Res. 2016, 24, 2890–2903. [Google Scholar] [CrossRef] [PubMed]
  19. Chuanqiong, L.; Peng, W.; Bo, C.; Yan, L. Spatial distribution and pollution source of dissolved metals in the Ganjiang River of Lake Poyang Basin. J. Lake Sci. 2018, 30, 139–149. [Google Scholar] [CrossRef] [Green Version]
  20. Liu, J.C.; Hu, W.; Ge, G.; Xiong, Y.; Lai, J.H.; Wu, L. Contents of nutrients and heavy metals in The Poyang Lake during dry season. Resour. Environ. Yantze Basin 2012, 21, 1230–1235, (in Chinese with English abstract). [Google Scholar]
  21. Lang, F.X.; Cai, Q.; Huang, X.J. Current situation analysis and changing trend for waterquality of the trunk stream of Xiuhe River. J. Water Resour. Res. 2013, 34, 41–44, (in Chinese with English abstract). [Google Scholar]
  22. Wang, X.S. Multivariate analysis for discriminating profiles of soil heavy metals as influenced by various contamination sources. Environ. Earth Sci. 2016, 75, 1013. [Google Scholar] [CrossRef]
  23. Rafighdoust, Y.; Eckstein, Y.; Harami, R.M.; Gharaie, M.H.M.; Mahboubi, A. Using inverse modeling and hierarchical cluster analysis for hydrochemical characterization of springs and Talkhab River in Tang-Bijar oilfield, Iran. Arab. J. Geosci. 2016, 9, 241. [Google Scholar] [CrossRef]
  24. Li, Y.; Zhou, Q.; Ren, B.; Luo, J.; Yuan, J.; Ding, X.; Bian, H.; Yao, X. Trends and Health Risks of Dissolved Heavy Metal Pollution in Global River and Lake Water from 1970 to 2017. Rev. Environ. Contam. Toxicol. 2019, 251, 1–24. [Google Scholar] [CrossRef]
  25. López-López, J.A.; Vargas, M.G.; Moreno, C. A chemometric approach to the evaluation of atmospheric and fluvial pollutant inputs in aquatic systems: The Guadalquivir River estuary as a case study. Environ. Pollut. 2011, 159, 1136–1143. [Google Scholar] [CrossRef] [PubMed]
  26. Varol, M. Dissolved heavy metal concentrations of the Kralkızı, Dicle and Batman dam reservoirs in the Tigris River basin, Turkey. Chemosphere 2013, 93, 954–962. [Google Scholar] [CrossRef]
  27. Lv, J.; Liu, Y.; Zhang, Z.; Dai, J.; Dai, B.; Zhu, Y. Identifying the origins and spatial distributions of heavy metals in soils of Ju country (Eastern China) using multivariate and geostatistical approach. J. Soils Sediments 2015, 15, 163–178. [Google Scholar] [CrossRef]
  28. Shu, W.; Wang, P.; Xiao, H.Y.; Liu, J.Z.; Zhao, J.Y. Hydrochemical characteristics and influencing factors in the Le’an River, Poyang Lake Basin. Resour. Environ. Yangtze Basin 2019, 28, 681–690, (in Chinese with English abstract). [Google Scholar] [CrossRef]
  29. Mao-Lan, W.; Wen-Bin, Z.; Chun-Hua, H. Status of nitrogen and phosphorus in waters of Lake Poyang Basin. J. Lake Sci. 2008, 20, 334–338. [Google Scholar] [CrossRef]
  30. Yang, Z.F.; Xia, X.Q.; Yu, T.; Hou, Q.Y.; Cao, T.N.; Zhong, J. Distribution and fluxes of As and trace metals in the Dongting Lake water system, Hunan province, China. Geoscience 2008, 22, 897–908, (in Chinese with English abstract). [Google Scholar]
  31. Licheng, Z.; Kezhun, Z. Background values of trace elements in the source area of the Yangtze River. Sci. Total Environ. 1992, 125, 391–404. [Google Scholar] [CrossRef]
  32. WHO. Guidelines for Drinking-Water Quality, Recommendations Incorporating 1st and 2nd Addenda, 13th ed.; World Health Organization: Geneva, Switerland, 2008. [Google Scholar]
  33. Chinese Ministry of Health (CMH). Chinese State Standards (CSS) for Drinking Water Quality; 5749-2006; CMH: Beijing, China, 2007; (in Chinese with English abstract).
  34. Jinbao, W.; Weiwei, Y.; Ting, X. Research on heavy metals pollution status of Le’an River, Lake Poyang Basin. J. Lake Sci. 2007, 19, 421–427. [Google Scholar] [CrossRef] [Green Version]
  35. Zhang, R.Q.; Tie, B.Q.; Hu, K.C.; Zhou, J.C.; Yuan, X. Effect of Changsha water conservancy project reserviron the water environment quality of Xiangjiang River. Sichuan Environ. 2015, 34, 81–86, (in Chinese with English abstract). [Google Scholar] [CrossRef]
  36. Fu, J.X.; Zhang, X.B.; Yan, D.C. Seasonal variations in TP, COD, BOD5 And CODMn of the Jinshajiang River, Minjiang River and Changjiang River nearby Yinbin city. Earth Environ. 2008, 36, 336–341, (in Chinese with English abstract). [Google Scholar] [CrossRef]
  37. Wang, Z.; Shao, D.; Westerhoff, P. Wastewater discharge impact on drinking water sources along the Yangtze River (China). Sci. Total Environ. 2017, 599–600, 1399–1407. [Google Scholar] [CrossRef]
  38. Gong, Q.L.; Liu, Y.; Tang, B.B. Temporal and spatial Distribution characteristics of water quality in Yibin sec-tion of the Yangtze River. Environ. Sci. Technol. 2016, 39, 111–116, (in Chinese with English abstract). [Google Scholar] [CrossRef]
  39. Fernandes, A.C.P.; Fernandes, L.F.S.; Cortes, R.M.V.; Pacheco, F.A.L. The Role of Landscape Configuration, Season, and Distance from Contaminant Sources on the Degradation of Stream Water Quality in Urban Catchments. Water 2019, 11, 2025. [Google Scholar] [CrossRef] [Green Version]
  40. Li, S.; Zhang, Q. Spatial characterization of dissolved trace elements and heavy metals in the upper Han River (China) using multivariate statistical techniques. J. Hazard. Mater. 2010, 176, 579–588. [Google Scholar] [CrossRef] [PubMed]
  41. Islam, S.; Ahmed, K.; Raknuzzaman, M.; Mamun, H.-A.; Islam, M.K. Heavy metal pollution in surface water and sediment: A preliminary assessment of an urban river in a developing country. Ecol. Indic. 2015, 48, 282–291. [Google Scholar] [CrossRef]
  42. Hu, C.H.; Zhou, P.; Huang, P.; Du, J.; Zhou, W.B. Behavior characteristics of dissolved heavy metals and health risks assessment from Poyang Lake Basin, China. J. Agro-Environ. Sci. 2012, 31, 1009–1014, (in Chinese with English abstract). [Google Scholar]
  43. Xu, S.; Lang, Y.; Zhong, J.; Xiao, M.; Ding, H. Coupled controls of climate, lithology and land use on dissolved trace elements in a karst river system. J. Hydrol. 2020, 591, 125328. [Google Scholar] [CrossRef]
  44. Dević, G.; Sakan, S.; Đorđević, D. Assessment of the environmental significance of nutrients and heavy metal pollution in the river network of Serbia. Environ. Sci. Pollut. Res. 2015, 23, 282–297. [Google Scholar] [CrossRef]
  45. Phung, D.; Huang, C.; Rutherford, S.; Dwirahmadi, F.; Chu, C.; Wang, X.; Nguyen, M.; Nguyen, N.H.; Do, C.M.; Nguyen, T.H.; et al. Temporal and spatial assessment of river surface water quality using multivariate statistical techniques: A study in Can Tho City, a Mekong Delta area, Vietnam. Environ. Monit. Assess. 2015, 187, 1–13. [Google Scholar] [CrossRef] [PubMed]
  46. Prasad, B.; Soni, A.K.; Vishwakarma, A.; Trivedi, R.; Singh, K.K.K. Evaluation of water quality near the Malanjhkhand copper mines, India, by use of multivariate analysis and a metal pollution index. Environ. Earth Sci. 2020, 79, 1–23. [Google Scholar] [CrossRef]
  47. Kotnala, G.; Dobhal, S.; Chauhan, J.S. Monitoring the self-purification capacity of the River Alaknanda stretch at Srinagar, Uttarakhand, India. Int. J. River Basin Manag. 2016, 14, 491–498. [Google Scholar] [CrossRef]
  48. Singh, K.R.; Goswami, A.P.; Kalamdhad, A.S.; Kumar, B. Assessment of surface water quality of Pagladia, Beki and Kolong rivers (Assam, India) using multivariate statistical techniques. Int. J. River Basin Manag. 2020, 18, 511–520. [Google Scholar] [CrossRef]
  49. Ahmad, N.; Pandey, P. Spatio-Temporal Distribution, Ecological Risk Assessment, and Multivariate Analysis of Heavy Metals in Bathinda District, Punjab, India. Water Air Soil Pollut. 2020, 231, 1–32. [Google Scholar] [CrossRef]
  50. Dragićević, S.; Nenadović, S.; Jovanović, B.; Milanović, M.; Novković, I.; Pavić, D.; Lješević, M. Degradation of Topčiderska River water quality (Belgrade). Carpath. J. Earth. Environ. 2010, 5, 177184. [Google Scholar]
  51. Zhang, Y.; Liu, S.; Cheng, F.; Coxixo, A.; Hou, X.; Shen, Z.; Chen, L. Spatial Distribution of Metals and Associated Risks in Surface Sediments Along a Typical Urban River Gradient in the Beijing Region. Arch. Environ. Contam. Toxicol. 2017, 74, 80–91. [Google Scholar] [CrossRef]
  52. Fu, J.; Zhao, C.; Luo, Y.; Liu, C.; Kyzas, G.Z.; Luo, Y.; Zhao, D.; An, S.; Zhu, H. Heavy metals in surface sediments of the Jialu River, China: Their relations to environmental factors. J. Hazard. Mater. 2014, 270, 102–109. [Google Scholar] [CrossRef]
  53. Bian, Z.; Feng, Y.; Li, H.; Du, Z. Removal of chemical oxygen demand (COD) and heavy metals by catalytic ozonation–microbial fuel cell and Acidithiobacillus ferrooxidans leaching in flotation wastewater (FW). Water Sci. Technol. 2019, 79, 2328–2336. [Google Scholar] [CrossRef] [PubMed]
  54. Canela, P.; Clements, T.L.S.; Sobolev, D. High nitrogen to phosphorus ratio in a Texas coastal river: Origins and implications for nutrient pollution sources and exports. J. Coast. Conserv. 2020, 24, 1–7. [Google Scholar] [CrossRef]
  55. De La Cueva, A.V.; Marchant, B.P.; Quintana, J.R.; De Santiago, A.; Lafuente, A.L.; Webster, R. Spatial variation of trace elements in the peri-urban soil of Madrid. J. Soils Sediments 2013, 14, 78–88. [Google Scholar] [CrossRef] [Green Version]
  56. Corbi, J.J.; Trivinho-Strixino, S.; Dos Santos, A. Environmental Evaluation of Metals in Sediments and Dragonflies Due to Sugar Cane Cultivation in Neotropical Streams. Water Air Soil Pollut. 2008, 195, 325–333. [Google Scholar] [CrossRef]
  57. Bhardwaj, V.; Singh, D.S.; Singh, A.K. Environmental repercussions of cane-sugar industries on the Chhoti Gandak river basin, Ganga Plain, India. Environ. Monit. Assess. 2009, 171, 321–344. [Google Scholar] [CrossRef]
Figure 1. Simplified map showing the geology and sampling sites in the Xiujiang River.
Water 13 01654 g001
Figure 2. Spatial variation characteristics of the pH, nutrients, and heavy metals in the water samples obtained from the Xiujiang River.
Water 13 01654 g002
Figure 3. Dendrogram showing the clustering of the sampling sites according to Ward’s Method using the squared Euclidean distance.
Water 13 01654 g003
Figure 4. Canonical discriminant functions for the water quality variables in China’s Xiujiang River.
Water 13 01654 g004
Table 1. Characteristics of the water chemistry and heavy metal parameters of the Xiujiang River.
Site pHTDOCODCrBOD5NH4+-NTPTNCuZnCrAs
mg/Lµg/L
Upper
Reaches of
mainstream
Max6.8011.97.887.383.700.630.170.73240.0167.09.00.57
Min6.1711.65.375.212.570.030.020.3240.00.000.00.33
Mean6.5411.86.375.883.260.380.110.5065.336.94.70.40
SD0.240.100.870.680.410.210.040.1361.748.44.00.08
CV0.040.010.140.120.130.550.340.260.951.310.870.19
Number101010101010101010101010
Middle
reaches of
mainstream
Max7.2312.18.8611.353.430.470.180.6293.356.38.70.53
Min6.6011.65.690.000.730.080.080.3040.028.30.00.00
Mean6.8811.87.195.672.110.280.150.4752.040.15.30.18
SD0.190.140.984.400.950.130.030.1115.68.23.00.24
CV0.030.010.140.780.450.460.230.230.300.210.621.33
Number101010101010101010101010
Lower
reaches of
mainstream
Max6.9313.07.4817.873.831.220.261.3211.741.712.30.53
Min6.5711.86.060.000.830.040.020.4043.327.70.00.00
Mean6.7512.16.737.282.630.360.120.6066.735.45.70.29
SD0.140.4580.576.061.290.440.090.3625.85.05.00.23
CV0.020.0380.090.830.491.200.710.600.390.140.860.81
Number666666666666
Liaohe
tributary
Max7.3711.76.9116.883.630.890.191.13216.7514.087.08.40
Min7.1311.05.760.001.270.040.020.4143.311.30.000.00
Mean7.2111.36.406.143.000.210.100.5285.0102.15.61.88
SD0.070.210.356.310.680.220.060.2062.5160.13.02.59
CV0.010.020.061.030.231.060.610.390.741.570.541.38
Number121212121212121212121212
Table 2. Comparison of the pH values, nutrient elements, and average contents of heavy metals of the Xiujiang River and other rivers.
River/TributarypHDOCODCrBOD5NH4+-NTPTNCuZnCrAsReferences
mg/Lµg/L
Poyang Lake basinXiujiangmainstream6.7 6.77 6.13 2.67 0.336 0.130 0.51 60.5 37.8 5.150.29This study
Liaohe Tributary7.2 6.40 6.14 3.00 0.207 0.098 0.52 85.0 102.1 5.561.88This study
Raohe River6.91-20.6-1.040.253.1448.795.1--[20]
Ganjiang River7.3-21.3-0.220.050.4438.577.1--
Fuhe River7.45-17.6-0.350.0650.5261.4122.8--
Xinjiang River7.54-17.4-0.410.0721.3246.779.3--
Le’an River7.32-3.8–10.1-0.720.062-133.2 a22.2 a [28]
Poyang lake7.0–7.6 b6.9–8.3 b1.1–1.8 b1.0–2.3 b0.100.0671.0645.5 c94.1 c--[29]
Agricultural water----0.928.6313.47----
Municipal sewage----5.481.156.55----
Yangtze RiverHunan station8.1 2.747.32 2.58[30]
Background values 3.016.4612.63.32[31]
Tributary of the Yangtze River
Xiangjiang River
7.85.28 d17.96 d-0.34 d0.11 d2.3 d1.7810.3-12.81[30]
Water quality criteria for drinkingWHO A6.5–8.23.0--0.50.2-200030005010[32]
China (Ⅲ) B6–95.020.04.01.00.21.0100010005050[33]
Note: “A” refers to the WHO drinking water standard [32], “B” refers to the Class III of the Environmental Quality Standards for Surface Water in China [33]; “a” data comes from [34]; “b” data comes from [16]; “c” data comes from [20]; “d” data comes from [35]; The unit of nutrient element content is mg/L; The unit of the heavy metal content is ug/L; “-” indicates that the detection was not conducted.
Table 3. Concentrations, ANOVA and significant test of the four clusters by cluster analysis in the Xiujiang River, China.
VariablesClusters
CA1 (n = 5)CA2 (n = 15)CA3 (n = 11)CA4 (n = 7)Significant Test df = 3
MeanSDMeanSDMeanSDMeanSDMSFP
T11.44 d0.25 11.67 0.32 11.74 0.2311.87 a0.550.19 1.63 0.20
pH7.12 d0.18 6.83 0.38 6.88 0.26 6.76 a0.210.14 1.52 0.23
DO6.24 0.58 6.88 d0.84 6.97 d0.54 5.96 bc0.672.02 4.09 0.01
CODCr12.23 e4.77 2.98 e3.07 6.64 ab3.21 7.72 ab4.64118.49 8.85 0.00
BOD53.48 c0.13 3.17 c0.46 1.58 e0.59 3.32 c0.497.53 31.93 0.00
NH4+-N0.23 d0.19 0.17 d0.12 0.27 d0.11 0.66 e0.30 0.40 13.57 0.00
TP0.08 0.04 0.13 0.05 0.12 0.06 0.14 0.07 0.00 0.99 0.41
TN0.46 d0.10 0.44 d0.070.47 d0.10 0.77 e0.33 0.19 7.56 0.00
Cu164.67 e82.4154.89 a13.68 57.27 a21.64 45.24 a7.16 18,063.7 17.66 0.00
Zn20.87 8.74 102.4142.6 37.88 9.17 21.52 16.78 16,743.91.98 0.14
Cr6.93 b1.01 2.27 e3.05 6.58 b2.75 8.52 b1.83 80.67 11.91 0.00
As3.94 e3.04 0.36 a0.16 0.17 a0.24 0.45 a0.07 19.18 17.15 0.00
Note: The T unit is °C; pH is dimensionless; DO, CODCr, BOD5, NH4+-N, TP, and TN use the unit mg/L; Cu, Zn, Cr, and As use the unit μg/L; SD indicates the mean square error; df refers to the degree of freedom; MS is the mean square.
Table 4. Factor loading and variance values extracted using the varimax rotated factor analysis method for the Xiujiang River.
Component
12345
T0.30 0.82−0.01 0.00 0.02
pH0.15 −0.840.03 0.00 −0.22
DO−0.350.26 −0.10 −0.590.13
CODCr0.25 0.12 0.770.06 0.12
BOD5−0.05 0.12 0.12 0.880.08
NH4+-N0.890.32 0.05 0.12 0.06
TP0.08 0.17 −0.39 0.14 0.72
TN0.880.11 −0.06 0.15 0.05
Cu−0.02 −0.07 0.770.09 −0.11
Zn−0.12 −0.06 −0.32 0.11 −0.79
Cr0.78−0.24 0.22 −0.15 0.13
As−0.14 −0.48 0.580.31 0.15
Eigenvalue2.842.381.461.181.04
% of variance21.015.915.511.110.6
Cumulative %21.036.952.463.574.2
Note: The load values > 0.50 or < −0.5 in bold italics were considered significant.
Table 5. The Spearman correlation matrix of the heavy metals and nutrients in the Xiujiang River Basin.
TpHDOCODCrBOD5NH4+-NTPTNCuZnCrAs
T1.00
pH−0.57 **1.00
DO0.03 −0.22 1.00
CODCr0.08 −0.15 −0.20 1.00
BOD50.06 −0.11 −0.29 −0.03 1.00
NH4+-N0.37 *−0.25 −0.20 0.21 0.04 1.00
TP0.12 −0.23 −0.02 −0.09 0.09 −0.06 1.00
TN0.00 0.14 −0.20 −0.11 0.02 0.70 **−0.05 1.00
Cu−0.11 0.29 −0.02 0.16 0.01 −0.06 −0.23 0.01 1.00
Zn−0.14 0.26 0.09 −0.31 −0.39 *−0.35 *0.03 −0.05 −0.18 1.00
Cr−0.03 0.10 −0.26 0.24 −0.04 0.56 **−0.02 0.50 **0.06 −0.32 1.00
As−0.31 0.16 −0.41 *0.37 *0.38 *−0.01 −0.21 −0.01 0.17 −0.30 0.08 1.00
Note: The bold italics indicate significant correlations; ** indicates significant correlations at the 0.01 level (bilateral); * indicates significant correlations at the 0.05 level (bilateral).
Publisher’s Note: MDPI stays neutral with regard to jurisdictional claims in published maps and institutional affiliations.

