Article

Degradation of Trimethoprim Using the UV/Free Chlorine Process: Influencing Factors and Optimal Operating Conditions

1
School of Municipal and Environmental Engineering, Shenyang Jianzhu University, Shenyang 110000, China
2
Institute of Innovational Education Research, Shenzhen Institute of Information Technology, Shenzhen 518000, China
3
Brook Byers Institute of Sustainable Systems, School of Civil and Environmental Engineering, Georgia Institute of Technology, Atlanta, GA 30332, USA
*
Author to whom correspondence should be addressed.
Water 2021, 13(12), 1656; https://doi.org/10.3390/w13121656
Submission received: 19 April 2021 / Revised: 1 June 2021 / Accepted: 7 June 2021 / Published: 13 June 2021

Abstract

:
Trimethoprim (TMP) is a pharmaceutical compound, which is commonly found in the water environment. The UV/chlorine process forms several reactive species, including hydroxyl radicals (HO•) and reactive chlorine species, to degrade contaminants. The influencing factors and the optimal operational conditions for the degradation of TMP by the UV/chlorine process were investigated. The degradation of TMP was much faster by the UV/chlorine process as compared to the UV alone or free chlorine alone process. A kinetic model was developed to simulate the degradation of TMP and determine the unknown rate constants. This study also predicted the relative contributions of each of the reactive species and photolysis using the developed kinetic model. It was found that the ClO• radical was the major reactant responsible for the degradation of TMP. Furthermore, the most important finding was the identification of the best operational conditions. The best operational conditions resulted in the lowest use of energy and electrical energy per order (EE/O), namely, (1) for the ultrapure water, the optimum intensity of the UV light and the free chlorine dosage were 2.56 Einstein/L·s and 0.064 mM, respectively, with a minimum EE/O of 0.136 kWh/m3; and (2) for the water matrix containing 3 mg/L NOM, the optimum intensity of the UV light and the free chlorine dosage were 3.45 Einstein/L s and 0.172 mM, respectively, with a minimum EE/O of 0.311 kWh/m3.

1. Introduction

In recent years, many emerging contaminants (such as herbicides, odorous substances, pharmaceuticals and personal care products (PPCPs), etc.) have been found in the water environment. Antibiotics are the common PPCPs and now more than 10,000 kinds of antibiotics are widely applied in the treatment and prevention of the bacterial infections [1]. For example, Trimethoprim (TMP) is an antibiotic, which is mainly used in the treatment of the bladder infections [2]. The concentration of TMP has been reported to be 0.1–5 ng/L, 2.2–10.9 ng/L and 0–19.8 ng/L in the effluents of the wastewater treatment plant, surface water and the finished drinking water, respectively [3]. However, once the antibiotics are released into the water matrix, they have some adverse effects on human health and the aquatic ecosystem: (1) Antibiotics entering the soil will directly affect the species, quantity and community structure of microorganisms in the soil environment, thus causing an imbalance in the soil ecological environment. (2) Antibiotics entering the water environment will cause harm to various invertebrates and aquatic plants. (3) Due to the enrichment of food-chain antibiotics in plants and animals, these substances will eventually enter the human body. Antibiotic residues in the human body will cause teratogenicity, carcinogenesis, mutation and immunosuppression. Therefore, pollutants entering the water environment should be minimized. However, the process of biological treatment to degrade these antibiotics is insufficient due to the antibiotics (including the TMP) being persistent organic contaminants. Although many advanced physical chemical treatment processes (e.g., membrane, ion exchange and air stripping) only transfer the fate of the antibiotics from one phase to another, AOPs can mineralize them if appropriately designed [4]. Conventional wastewater treatment technologies (such as ozone oxidation and adsorption) are also unable to effectively remove the antibiotics [1].
Advanced oxidation processes (AOPs) are highly efficient technologies for wastewater treatment. The AOPs are effective to destroy the refractory organic contaminants (such as antibiotics) due to the generation of the various reactive radicals at a certain temperature and pressure. These reactive radicals eventually oxidize organic contaminants into carbon dioxide (CO2) and water (H2O). Recently, the ultraviolet light (UV)/free chlorine (HOCl/OCl) process has become one of the most promising AOPs. In the UV/free chlorine process, the UV irradiation cleaves the bonds in the HOCl to form the hydroxyl radical (HO•) and chlorine radical (Cl•). The HO• is a strong oxidant, which generally reacts with the organic contaminants. The Cl• is a selective oxidant, which rapidly reacts with the compounds containing aromatic rings and double bonds [3]. Subsequently, the ClO• and Cl2 are generated through the chain reactions of the complex radicals, which also oxidize the organic compounds. Many studies have reported that the UV/free chlorine process can successfully remove some of the persistent organic contaminants (such as desethylatrazine, sulfamethoxazole, carbamazepine, diclofenac, benzotriazole, nitrobenzene, trichloroethylene, etc.) [5,6] Furthermore, the UV/chlorine process has also been more effective than the UV/H2O2 process (a common UV-based AOP) to destroy some of the micro-pollutants (such as trichloroethylene) [7]. These previous studies have highlighted the degradation of some selected organic contaminants in the UV/free chlorine process. However, the mechanism of the degradation of TMP in the UV/free chlorine process is still not fully understood, due to which further investigations are needed.
The objectives of this study included (1) to investigate the impacts of the operational conditions and the components of the surface water matrix (such as free chlorine dosage, pH, chloride ion (Cl), bicarbonate/carbonate ions (HCO3/CO32−) and natural organic matter (NOM)) on the degradation rate of TMP; (2) to develop a kinetic model to simulate the degradation of TMP and estimate the unknown rate constants; (3) to explore the relative contributions of each of the reactive species and photolysis; and (4) to optimize the operational conditions towards the lowest energy consumption. Overall, this study further provided insight into the understanding of the mechanisms of the degradation of TMP in the UV/free chlorine process.

2. Materials and Methods

2.1. Experimental Section

2.1.1. Experimental Materials

Ultrapure water was used in the experimentation process except as noted. The below-mentioned chemicals were purchased from Sigma: (1) chromatographically pure methanol; (2) trimethoprim (98%); (3) Suwannee River NOM (natural organic matter) (Cat. No. 2R101N); (4) sodium hypochlorite (with an effective free chlorine concentration of 10%); and (5) sodium thiosulfate. These solutions were buffered using the phosphate solution. All the reagent solutions were prepared using Nanopure water and purified water (Barnstead–Dubuque, Iowa, America). Other chemicals (such as buffers, colorimetric agents, reductants, etc.) used in the experimentations were of reagent-grade quality or better, obtained from Thermo Fisher Scientific, Waltham, MA, USA.

2.1.2. UV Reactor

The UV reactor consisted of three parts (shown in Figure S1), which included (1) a closed cardboard large container; (2) 2 UV low pressure mercury lamps with the power sources of 40 W, which produced 254 nm UV light; and (3) a magnetic stirrer. The temperature was maintained at 25 °C. The UV photon flux (I0), entering the solution was determined to be 0.567 μEs−1 using iodide/iodate chemical actinometry (shown in Figure S2a). The volume of the UV reactor was 0.6 L and the UV intensity (PUV) was determined to be 9.45 × 10⁻⁷ Einstein/L s. The effective path length (L) was determined to be 3.01 cm by measuring the kinetics of the photolysis of the diluted H2O2 (shown in Figure S2b). The average UV fluence rate (EP0) was estimated to be 0.0028 μEs−1 cm−2 (shown in Text S1.3).

2.1.3. Experimental Procedures

In order to prepare the stock solution of TMP, a 0.01-mM TMP was added to 1.0 L water. The TMP solution had a concentration of 2.9 mg/L. The UV lamps were turned on for 60 min before the start of the experiment. A 100-mL TMP solution prepared above was added to the beaker next to the UV lamps and an appropriate dosage of 1 mM of the sodium hypochlorite solution was added to the test solution containing a 2 mM phosphate buffer of 15 mL. The pH value was controlled with the solution of the buffer solution from 6.1 to 8.2. The magnetic stirrer was set at a speed of 400 rpm. The UV lamps irradiated the solution in the beaker for 20 min. At various time intervals within the 20 min, a 1 mL solution sample was taken, followed by the addition of a few drops of 0.1 M sodium thiosulfate into the solution sample in order to quench the residual chlorine. The experimentation processes for the UV alone, UV/hydrogen peroxide (H2O2) and UV/free chlorine were conducted with the same experimental procedures, and the experimentation process for free chlorine alone was similarly conducted without the UV light input.

2.1.4. Analysis Method

The concentrations of TMP were determined using high-performance liquid chromatography. The column used in the experimentation was a symmetry C18 column and the mobile phase was composed of 0.3% acetonitrile and acetic acid with a v/v ratio of 20:80. The detection wavelength was set to 280 nm with the flow rate and the column temperature to 1.0 mL/min and 28 °C, respectively. The detection limit of TMP was 3.2 µg/L.
In this study, the concentration of the H2O2 was measured using the (N,N-diethyl-p-phenylenediamine) DPD colorimetric method. The main measuring principle of the DPD colorimetric method was that in the presence of the catalyst horseradish catalase in the solution, the DPD added to the solution would be rapidly oxidized into a stable reddish substance with the molar absorption coefficient of 2.1 × 10⁴ M−1cm−1 under the condition of UV light with a wavelength of 515 nm. For the specific detection process, a 10 mL tube was prepared, and a 0.5 M phosphate buffer solution was added to it. Then, 3 mL of the sample, which was needed to be tested, was added to the solution, which was diluted to 10 mL and poured into a 3 cm cuvette, followed by the rapid addition of the 50 µL of the DPD solution and mixing for 15 s. It was marked zero at 551 nm with a UV–visible spectrophotometer. Then 50 µL of the POD solution was added and mixed well for 50 s, and the absorbance of the solution was measured at 551 nm with a UV–visible spectrophotometer. The free chlorine stock solution, which was prepared by dilution of the 10% NaOCl solutions, were standardized using iodometry or spectrophotometry [8].

2.2. Equilibrium Calculation

2.2.1. Free Chlorine Equilibrium

The equilibrium concentrations of the free chlorine at various pH values were calculated by Equations (1)–(3).
HOCl OCl + H +
[ HOCl ] = 10 pH 10 pH + 10 pka 1 [ Total   HOCl ]
[ OCl ] = 10 pka 1 10 pH + 10 pka 1 [ Total   HOCl ]

2.2.2. TMP Equilibrium

The equilibrium concentrations of TMP at various pH values were calculated by Equations (4)–(11).
T M P 2 + T M P + + H +                                                   p K a 1 =   3.2  
T M P + T M P + H +                                                         p K a 2 =   7.1
δ T M P 2 + = [ T M P 2 + ] [ T M P 2 + ] + [ T M P + ] + [ T M P ] = 1 1 + [ T M P + ] [ T M P 2 + ] + [ T M P ] [ T M P 2 + ]          = 1 1 + K a 1 [ H + ] + K a 1 K a 2 [ H + ] 2 = [ H + ] 2 [ H + ] 2 + K a 1 [ H + ] + K a 1 K a 2
δ T M P + = [ T M P + ] [ T M P 2 + ] + [ T M P + ] + [ T M P ] = 1 [ T M P 2 + ] [ T M P + ] + 1 + [ T M P ] [ T M P + ]        = 1 [ H + ] K a 1 + 1 + K a 2 [ H + ] = [ H + ] K a 1 [ H + ] 2 + K a 1 [ H + ] + K a 1 K a 2
δ T M P = [ T M P ] [ T M P 2 + ] + [ T M P + ] + [ T M P ] = 1 [ T M P 2 + ] [ T M P ] + [ T M P + ] [ T M P ] + 1        = 1 [ H + ] 2 K a 1 K a 2 + [ H + ] K a 2 + 1        = K a 1 K a 2 [ H + ] 2 + K a 1 [ H + ] + K a 1 K a 2
[ T M P 2 + ] = δ T M P 2 + [ T o T a l   T M P ] = ( 10 p H ) 2 ( 10 p H ) 2 + ( 10 p H ) ( 10 p K a 1 ) + ( 10 p K a 1 ) ( 10 p K a 2 ) [ T o T a l   T M P ]
[ T M P + ] = δ T M P + [ T o T a l   T M P ] = ( 10 p H ) ( 10 p K a 1 ) ( 10 p H ) 2 + ( 10 p H ) ( 10 p K a 1 ) + ( 10 p K a 1 ) ( 10 p K a 2 ) [ T o T a l   T M P ]
[ T M P ] = δ [ T M P ] [ T o T a l   T M P ] = ( 10 p K a 1 ) ( 10 p K a 2 ) ( 10 p H ) 2 + ( 10 p H ) ( 10 p K a 1 ) + ( 10 p K a 1 ) ( 10 p K a 2 ) [ T o T a l   T M P ]
where, δ TMP 2 + , δ TMP + and δ TMP are the distributed decentralization of TMP 2 + , TMP + and TMP , respectively.

2.3. Kinetic Model Development

A kinetic model was developed for the UV/free chlorine process regarding the degradation of TMP. Because the experimental sample data is cumbersome and the numerical value is large, the numerical value calculated by using the sample derivation (SD) is small. The unknown rate constants were estimated by fitting the experimental data and the genetic algorithm (GA) was implemented to minimize the sample derivation (SD) (SD was also the objective function (OF)), which is given by Equation (12).
SD = 1 n 1 [ ( C exp C cal ) / C exp ] 2  
where n is the number of the points in the experimental data and Cexp (mM) and Ccal (mM) are the experimental and calculated concentrations of TMP at each time point, respectively.
In order to describe the kinetic behavior of the degradation of TMP, the mass balance equation of each of the species in the UV/free chlorine process consisted of an ordinary differential equations (ODEs) system. The genetic algorithm was implemented to solve the ODEs system. This method is more accurate and advanced in the process of fitting and modeling, so it is adopted by us. This is not involved in the results of Wu et al. in 2016 [3].
The meaning of Equation (12) is to express the standard relative mean square error limit of the theoretical calculated data and the experimental data. The goal of the objective function’s optimization is to reduce the gap between the theoretical calculated results and the experimental values as far as possible, so as to improve the accuracy of the fitting, characterize the TMP degradation dynamics and solving the ODEs system more accurately. It aims to minimize as much as possible the error between the calculated and experimental values of the differential equation using the fitting rate constant as a parameter. Moreover, the genetic algorithm can deal with any form of target function and has the global search ability in the probabilistic sense, so we use the genetic algorithm to minimize Equation (12). Hence, its convergence performance is better, which is also more advanced in the fitting and modeling process than Wu et al. 2016 [3].

3. Results and Discussion
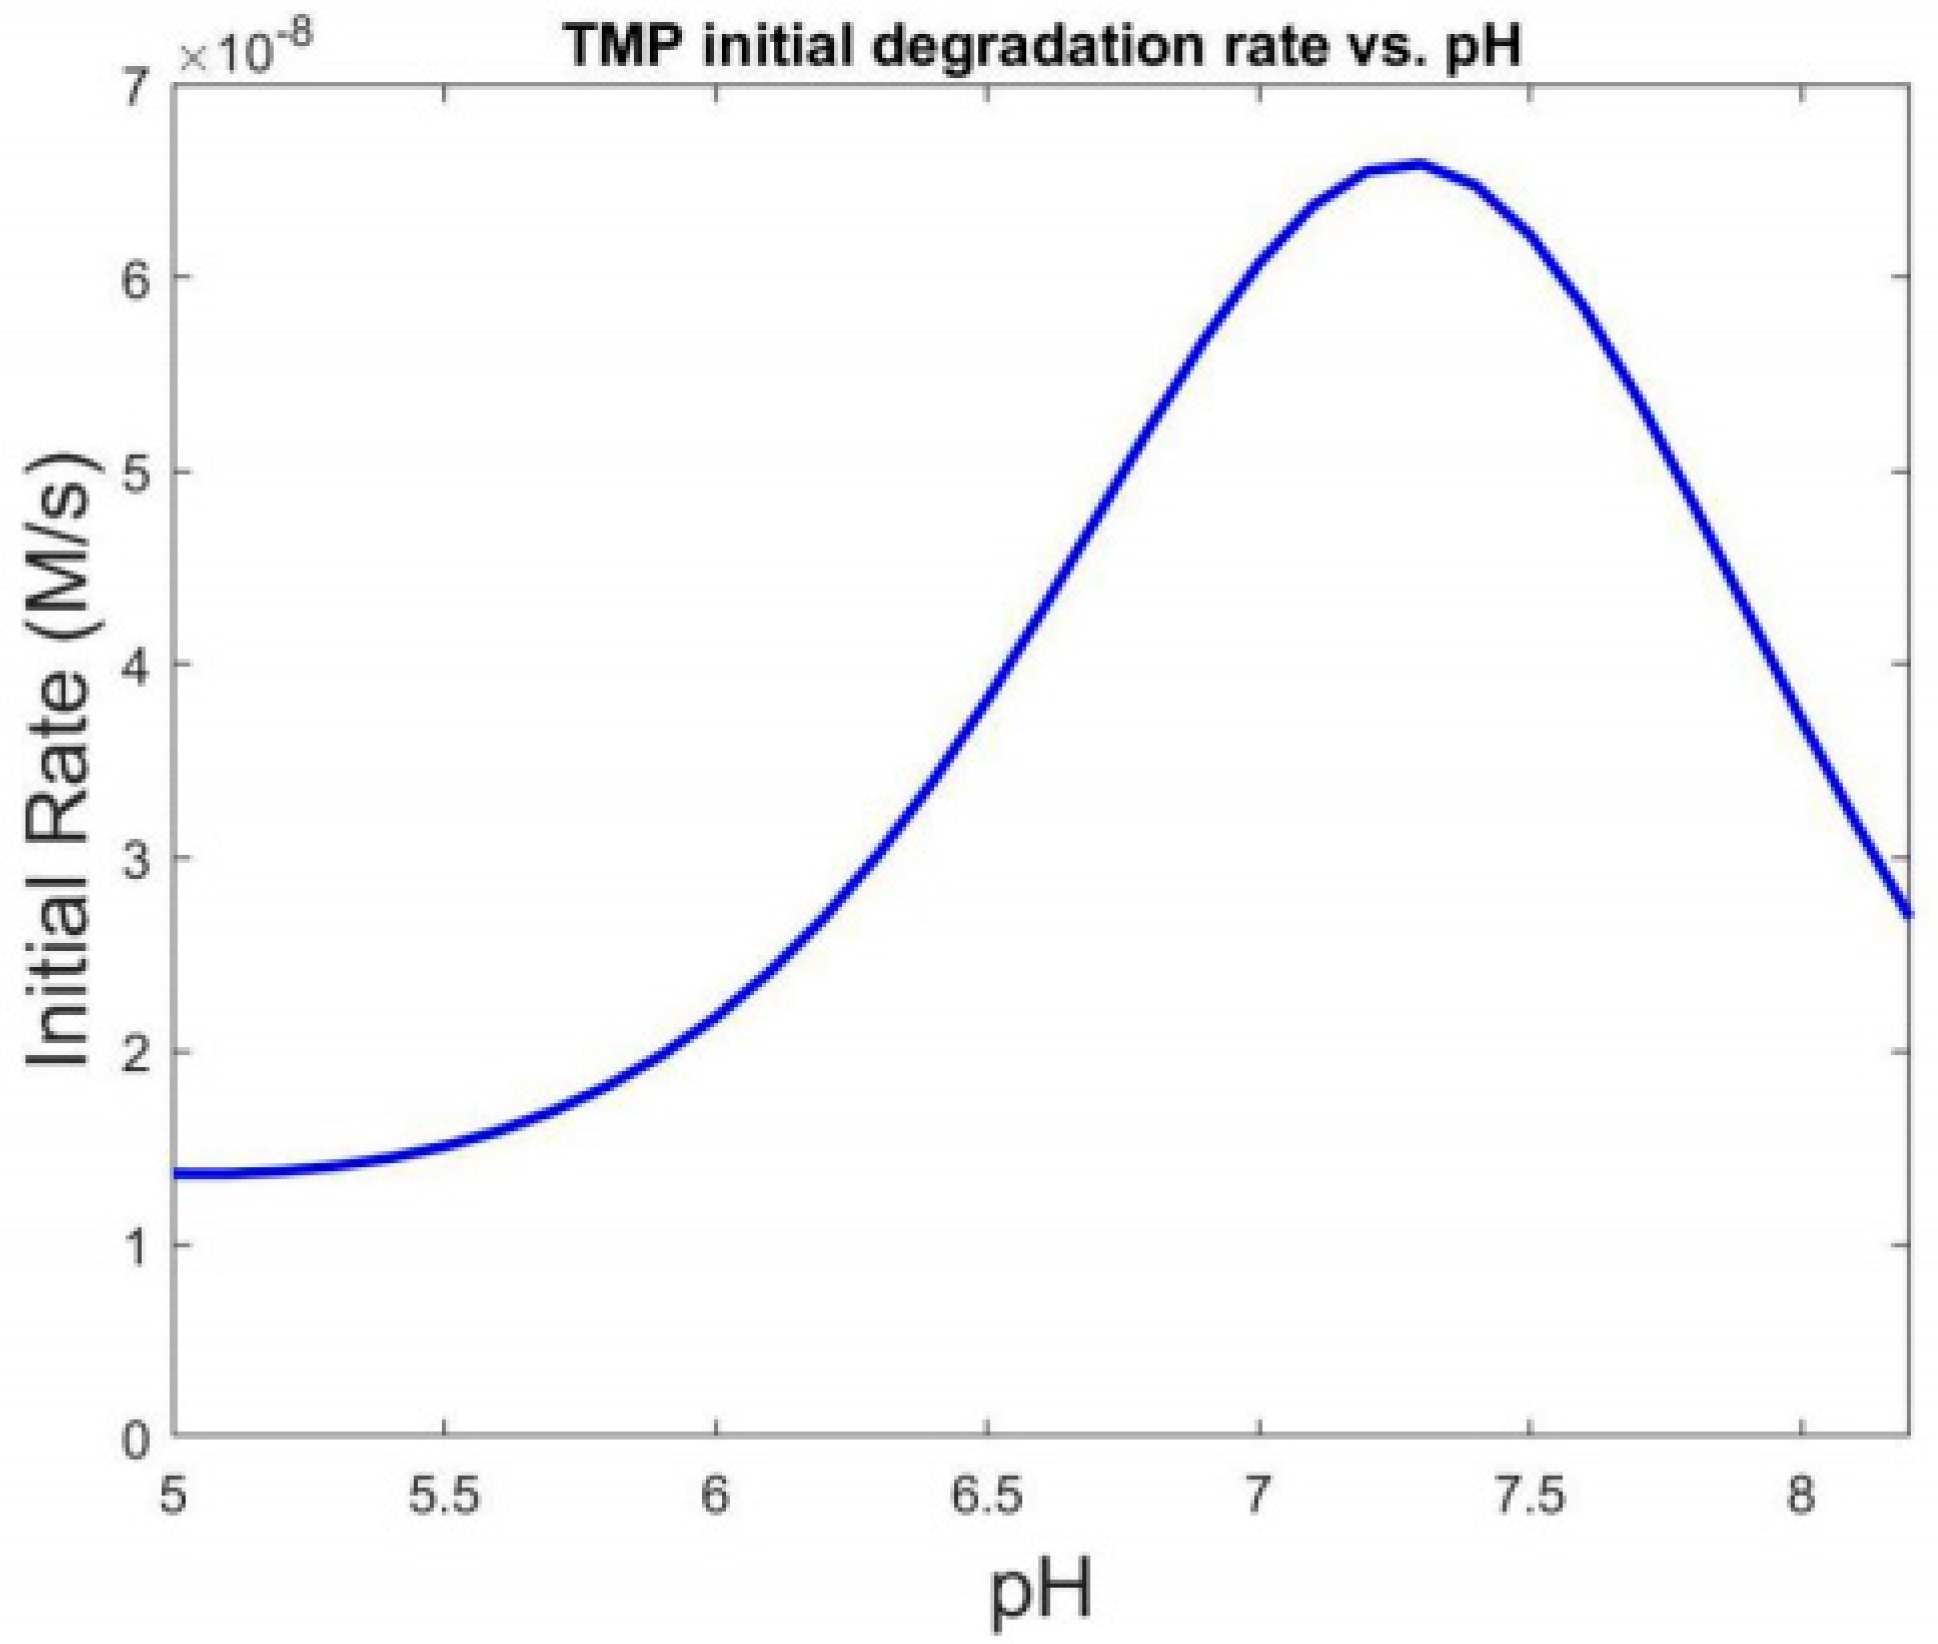
3.1. Effect of pH

According to the literature, the TMP had three forms, such as TMP2+, TMP+ and TMP (shown in Figure S4) [9]. Table 1 lists the molar distributions for the free chlorine and TMP, ranging from pH 5 to pH 8 (calculated according to Equations (1)–(11)). At a pH of 5, the HOCl and TMP+ were the dominant species. As the pH increased to 8, the OCl and TMP became the dominant species.

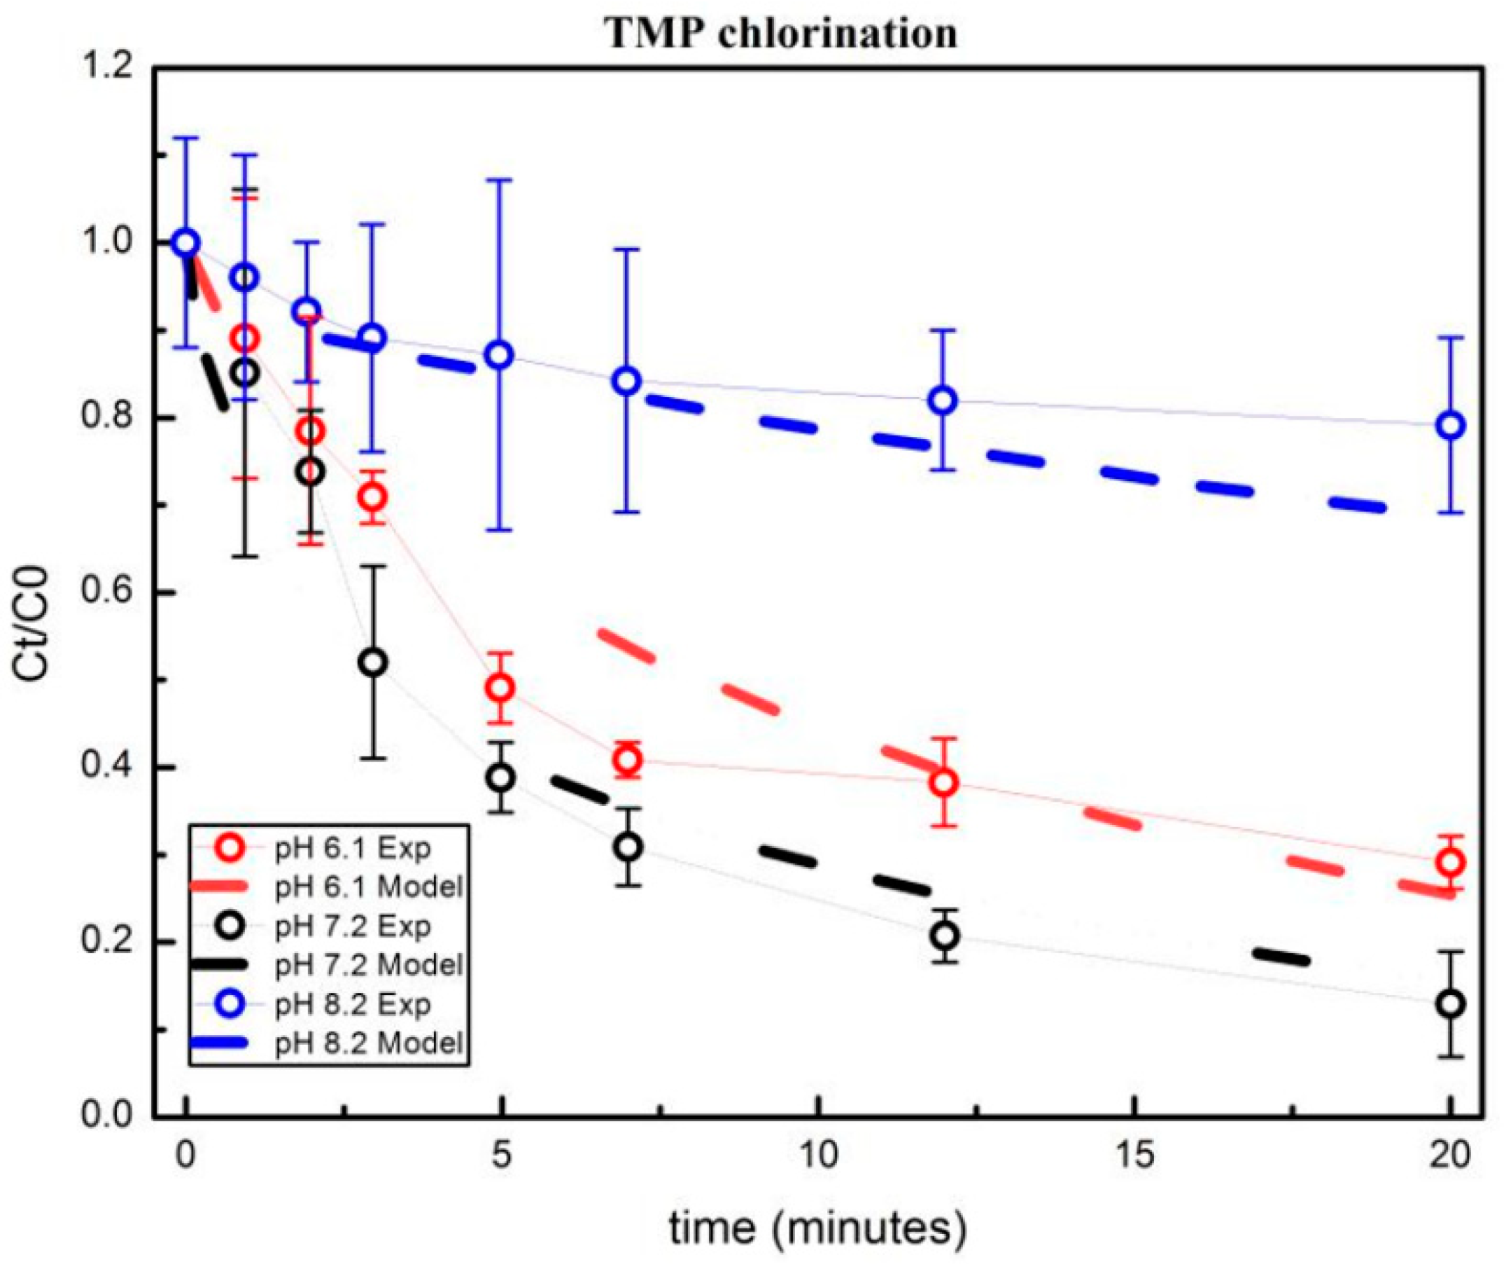
3.1.1. Effect of pH on the Oxidation of the Free Chlorine

The initial degradation rate of the TMP induced by the free chlorine alone (which was the initial chlorination rate of TMP) was calculated by Equation (13).
d [ TMP   Total   ] dt = k HOCl / TMP 2 + [ HOCl ] 0 [ TMP 2 + ] 0 + k HOCl / TMP + [ HOCl ] 0 [ TMP + ] 0 + k HOCl / TMP [ HOCl ] 0 [ TMP ] 0 + k OlC / TMP 2 + [ OlC ] 0 [ TMP 2 + ] 0 + k OlC / TMP + [ OlC ] 0 [ TMP + ] 0 + k OlC / TMP [ OlC ] 0 [ TMP ] 0
where k HOCl / TMP 2 + , k HOCl / TMP + , k HOCl / TMP , k OlC / TMP 2 + , k OlC / TMP + and k OlC / TMP were the estimated rate constants of the second-order reactions between the free chlorine and each form of TMP, measured in M−1s−1; the [HOCl]0 was the initial concentration of the HOCl, measured in M; the [OCl]0 was the initial concentration of the OCl, measured in M; the [TMP2+]0 was the initial concentration of the TMP2+; measured in M; the [TMP+]0 was the initial concentration of the TMP+, measured in M; and the [TMP]0 was the initial concentration of TMP, measured in M. The [HOCl]0, [OCl]0, [TMP2+]0, [TMP+]0 and [TMP]0 were calculated by Equations (1)–(11). The initial chlorination rates of TMP under the various pH conditions are shown in Figure 1. Accordingly, the TMP had the fastest initial chlorination rate at a pH of 7.2. The kinetic model also predicted the time required for the degradation of 90% and 99% of the TMP using the free chlorine alone under the various pH conditions (shown in Figure S7). It was predicted that the TMP needed more than 1000 h to achieve the degradation of 99%, if the pH was maintained at 8.2.
The experimental and calculation data for the oxidation of TMP by the free chlorine alone under the various conditions of the pH are shown in Figure 2. In order to estimate the rate constants for the second-order reactions between the free chlorine and each form of TMP (Reaction Nos. 71–76 in Table S1), all the experimental data of the free chlorine alone, which oxidized TMP, were fitted simultaneously. The GA was used to achieve the minimum objective function (OFmin, Equation (12)), with the value of 0.124. The fitting results are shown in Figure 1. The values of the estimated rate constants are listed in Table S1.
For the oxidation of the free chlorine alone, the impact of pH on the chlorination rate of TMP could be explained as below. The TMP was the best nucleophile (due to the non-protonation of the nucleophilic N groups) and the non-protonated TMP had the largest rate constant with the HOCl. The chlorination of TMP had the fastest rate at a pH of around 7.2 due to the dominancy of the HOCl, TMP+ and TMP species under this condition and the large rate constants between the HOCl and TMP+ or HOCl and TMP. With the increase in pH (which was larger than 8), the chlorination rate of TMP became very slow due to the fact that the OCl and the TMP were the dominant species under this condition, and the rate constant between the OCl and the TMP was very small (0.01 M−1s−1). Therefore, as discussed above, the time required to degrade 99% of TMP was extremely long at a pH larger than 8. However, the UV/free chlorine process can achieve faster degradation of TMP and transform it into small molecules with less toxicity by strong oxidative free radicals.

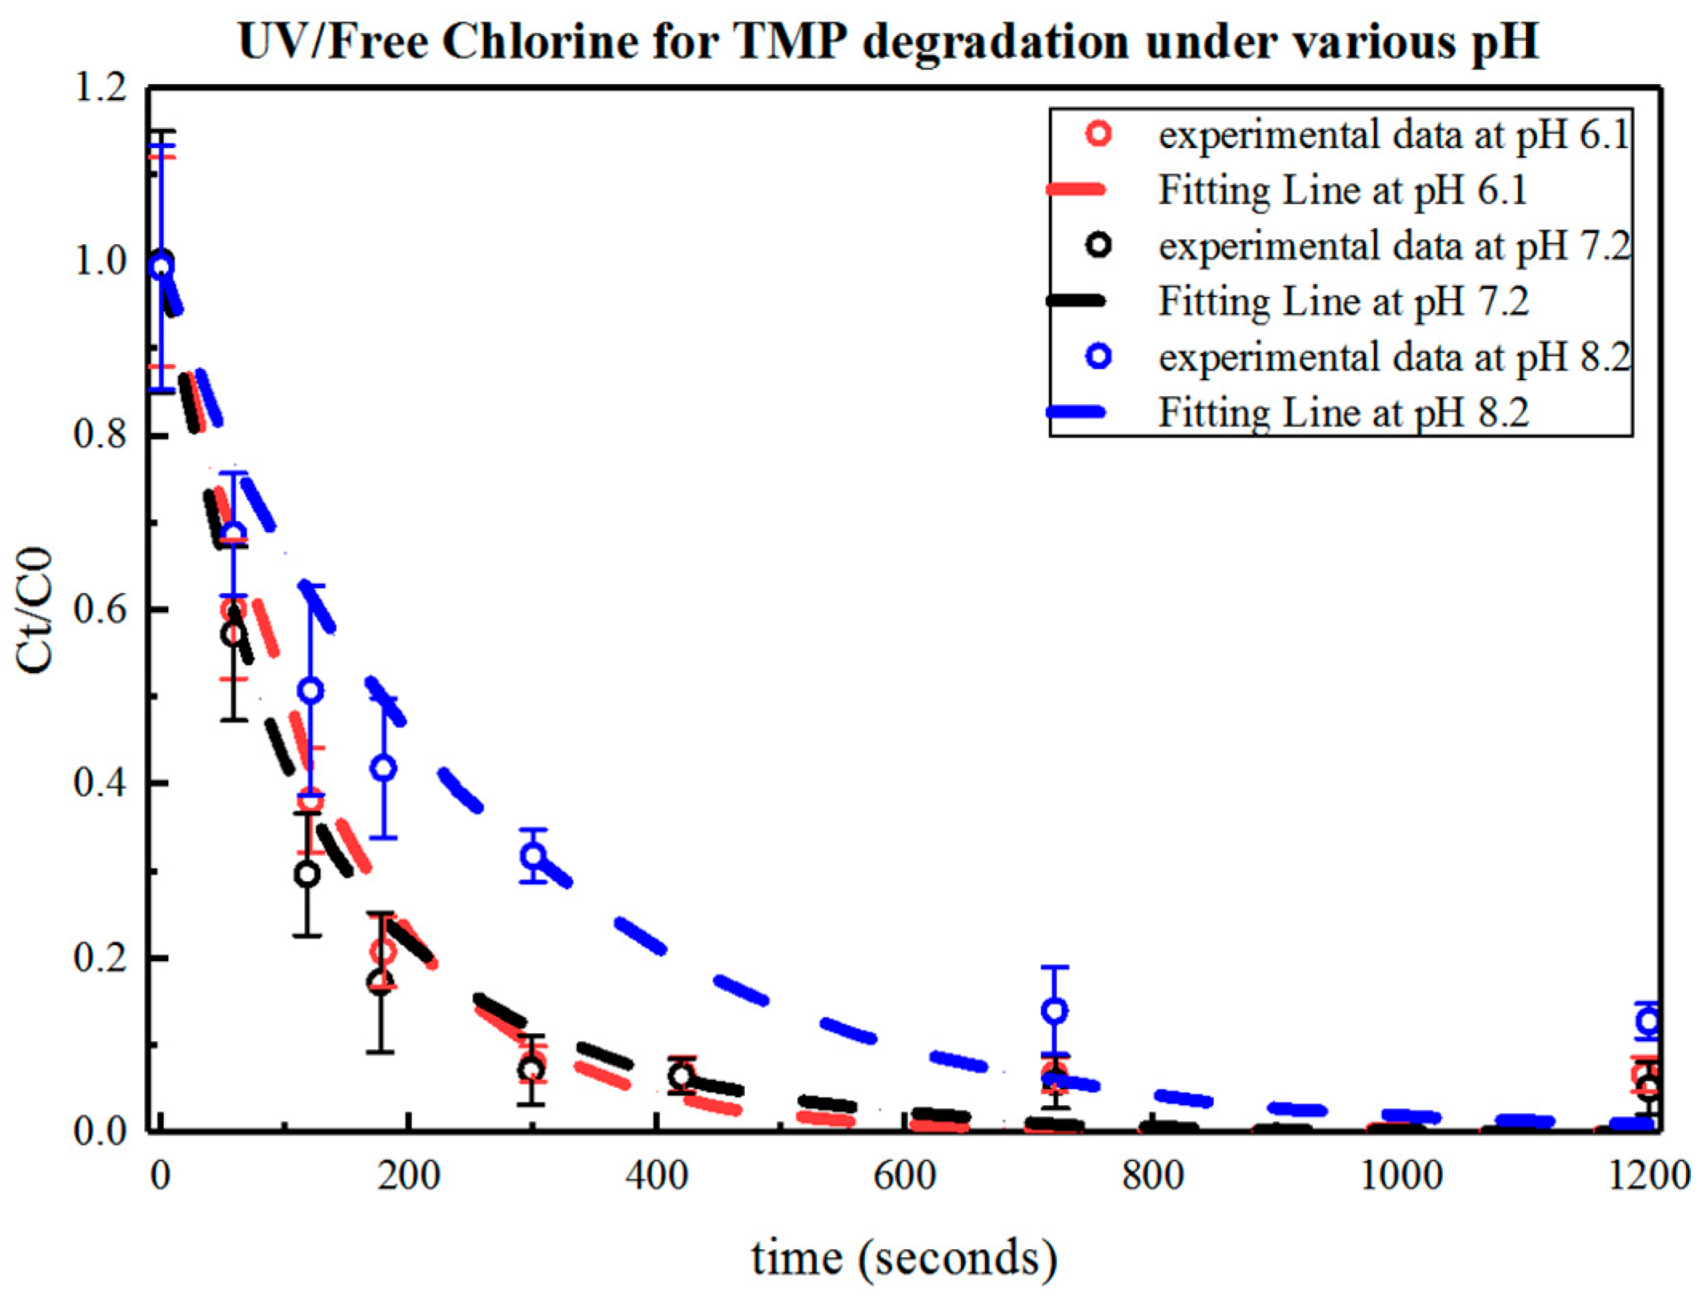
3.1.2. Effect of pH on the UV/Free Chlorine Process

The experimental data for the degradation of TMP in the UV/free chlorine process under the various pH conditions are shown in Figure S5. The kinetic data for the reaction of TMP with each of the reactive radicals has rarely been reported in the literature. Hence, in order to estimate the rate constants of the second-order reactions between theCl•, Cl2 and ClO•, and each form of TMP (Reaction Nos. 59–70 in Table S1), all the experimental data of the UV/free chlorine process, which oxidized TMP under the various pH conditions, were simultaneously fitted. The GA was used to achieve the minimum objective function (OFmin was achieved to be 0.506). The fitting results are shown in Figure 3.
According to Figure 3, for all the pH conditions, the differences between the model simulation and the experimental data were large when the time exceeded 1000 s. After 1000 s, the experimental data showed that the TMP was almost not degraded, which meant that the residual free chlorine was small. However, the results of the model simulation showed that the TMP was still degrading after 1000 s, and the model predicted that the residual free chlorine ranged from 30% to 40% after a time of 1200 s for the pH values ranging from 6.1 to 8.2 (shown in Figure S8). The large differences between the model results and the experimental data were attributed to the fact that the TMP was a large molecule, which generated many by-products during the degradation of TMP and some of the by-products might react rapidly with the free chlorine. However, the current version of the kinetic model did not include the by-products and the relevant reactions.
For the UV/free chlorine process, the higher pH (such as pH > 8) inhibited the degradation rate of TMP due to the fact that the free chlorine existed as the HOCl in the acidic or weakly basic conditions (pH < 7.35); existed as the HOCl and the OCl in the neutral or weakly alkaline conditions (7.35 < pH < 8); and existed as the OCl in the alkaline conditions (pH > 8) [10]. HOCL’s molar absorption coefficient and lower extinction coefficient compared to OCl resulted in an increasing efficiency in UV utilization as well as the generation of more HO• and Cl•. Another reason for the inhibition of the degradation rate of TMP was that the free chlorine alone destroyed TMP slower at a high pH than low pH, as discussed before.

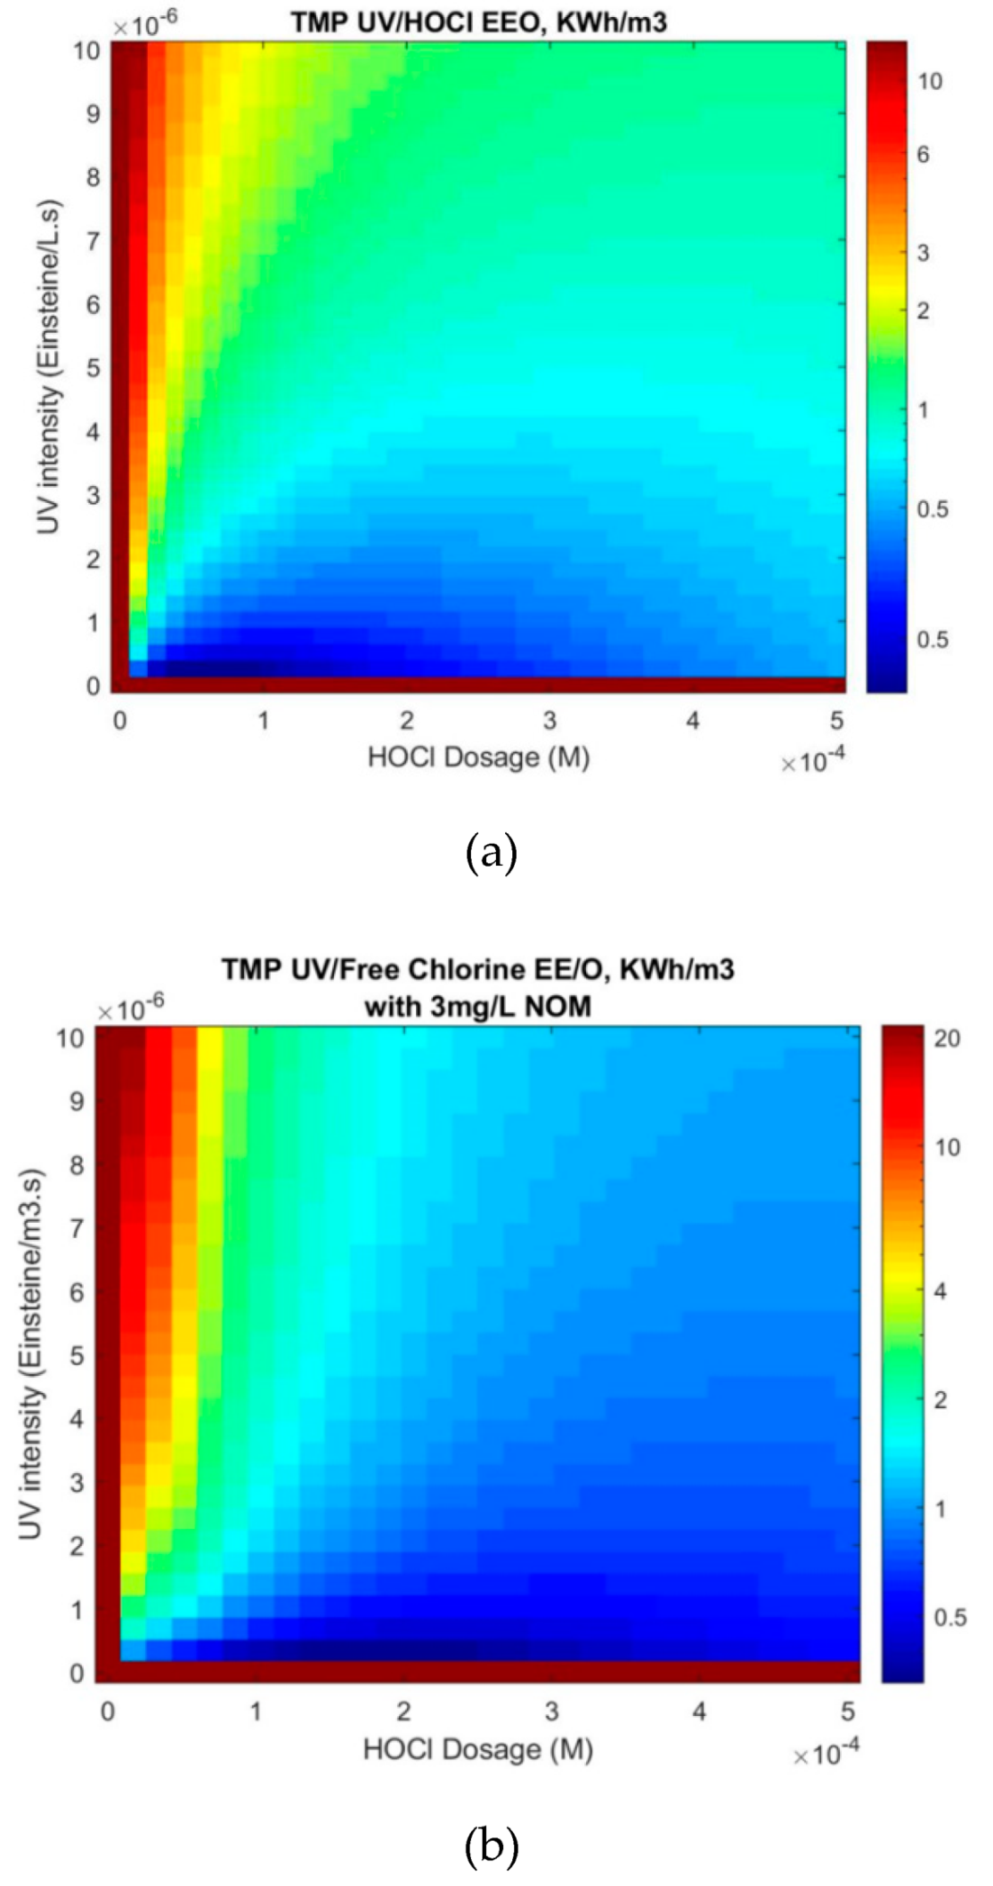
3.2. Effect of Oxidant Dosage on UV/Free Chlorine Process

For the AOPs based on the UV, the oxidant dosage affected not only the degradation rate of the organic contaminant but also the energy consumption and the operational costs. Therefore, it was critical to consider the efficiency of the treatment process combined with the energy consumption. One such measurement was the EE/O, the electrical energy required to decrease the concentration of the organic contaminants by one order of magnitude. In a batch reactor, the EE/O was calculated as given by Equation (14).
EE / O = P   ×   t V   ×   log ( C i / C f ) + C   ×   E   ×   0 . 0022 lb gram log ( C i / C f ) ,
where P is the total power of the lamp, measured in kW; t is the irradiation time, measured in s; V is the working volume; measured in m3; Ci and Cf are the initial and final concentrations of the target organic compound, measured in M; C is the oxidant concentration, measured in g/L; and E is the energy used for the production of the oxidant, measured in kWh/lb. Figure 4a shows the heat map of the EE/O for the degradation of TMP with UV. According to the heat map of the EE/O, there was a minimum EE/O, which depended on the free chlorine dosage and the UV light intensity. For a certain UV light intensity (such as 2.56 ×   10 7 Einstein/L s), a low dosage free chlorine absorbed a very small fraction of the photons and produced the insufficient reactive radicals, which caused the large EE/O. With the increase in the free chlorine dosage, more photons were absorbed, which produced more reactive radicals and decreased the EE/O. With the further increase in the free chlorine dosage from the optimum dosage (such as increasing one time from 0.064 mM to 0.128 mM), the more HO• and Cl• were scavenged by the free chlorine to generate more ClO , which was the dominant species to destroy TMP (as discussed in Section 3.6). However, the concentration of the ClO   increased by less than one fold (which meant that when the free chlorine dosage increased from 0.064 mM to 0.128 mM, the integral average concentration of the ClO increased from 1.16   ×   10 9 M to 1.84   ×   10 9 M), which was due to the slower decay rate of the free chlorine with the increase in its dosage (Figure S9). Overall, the energy consumption by the free chlorine was increased one fold but the degradation rate of TMP was enhanced by less than one fold, which increased the EE/O.

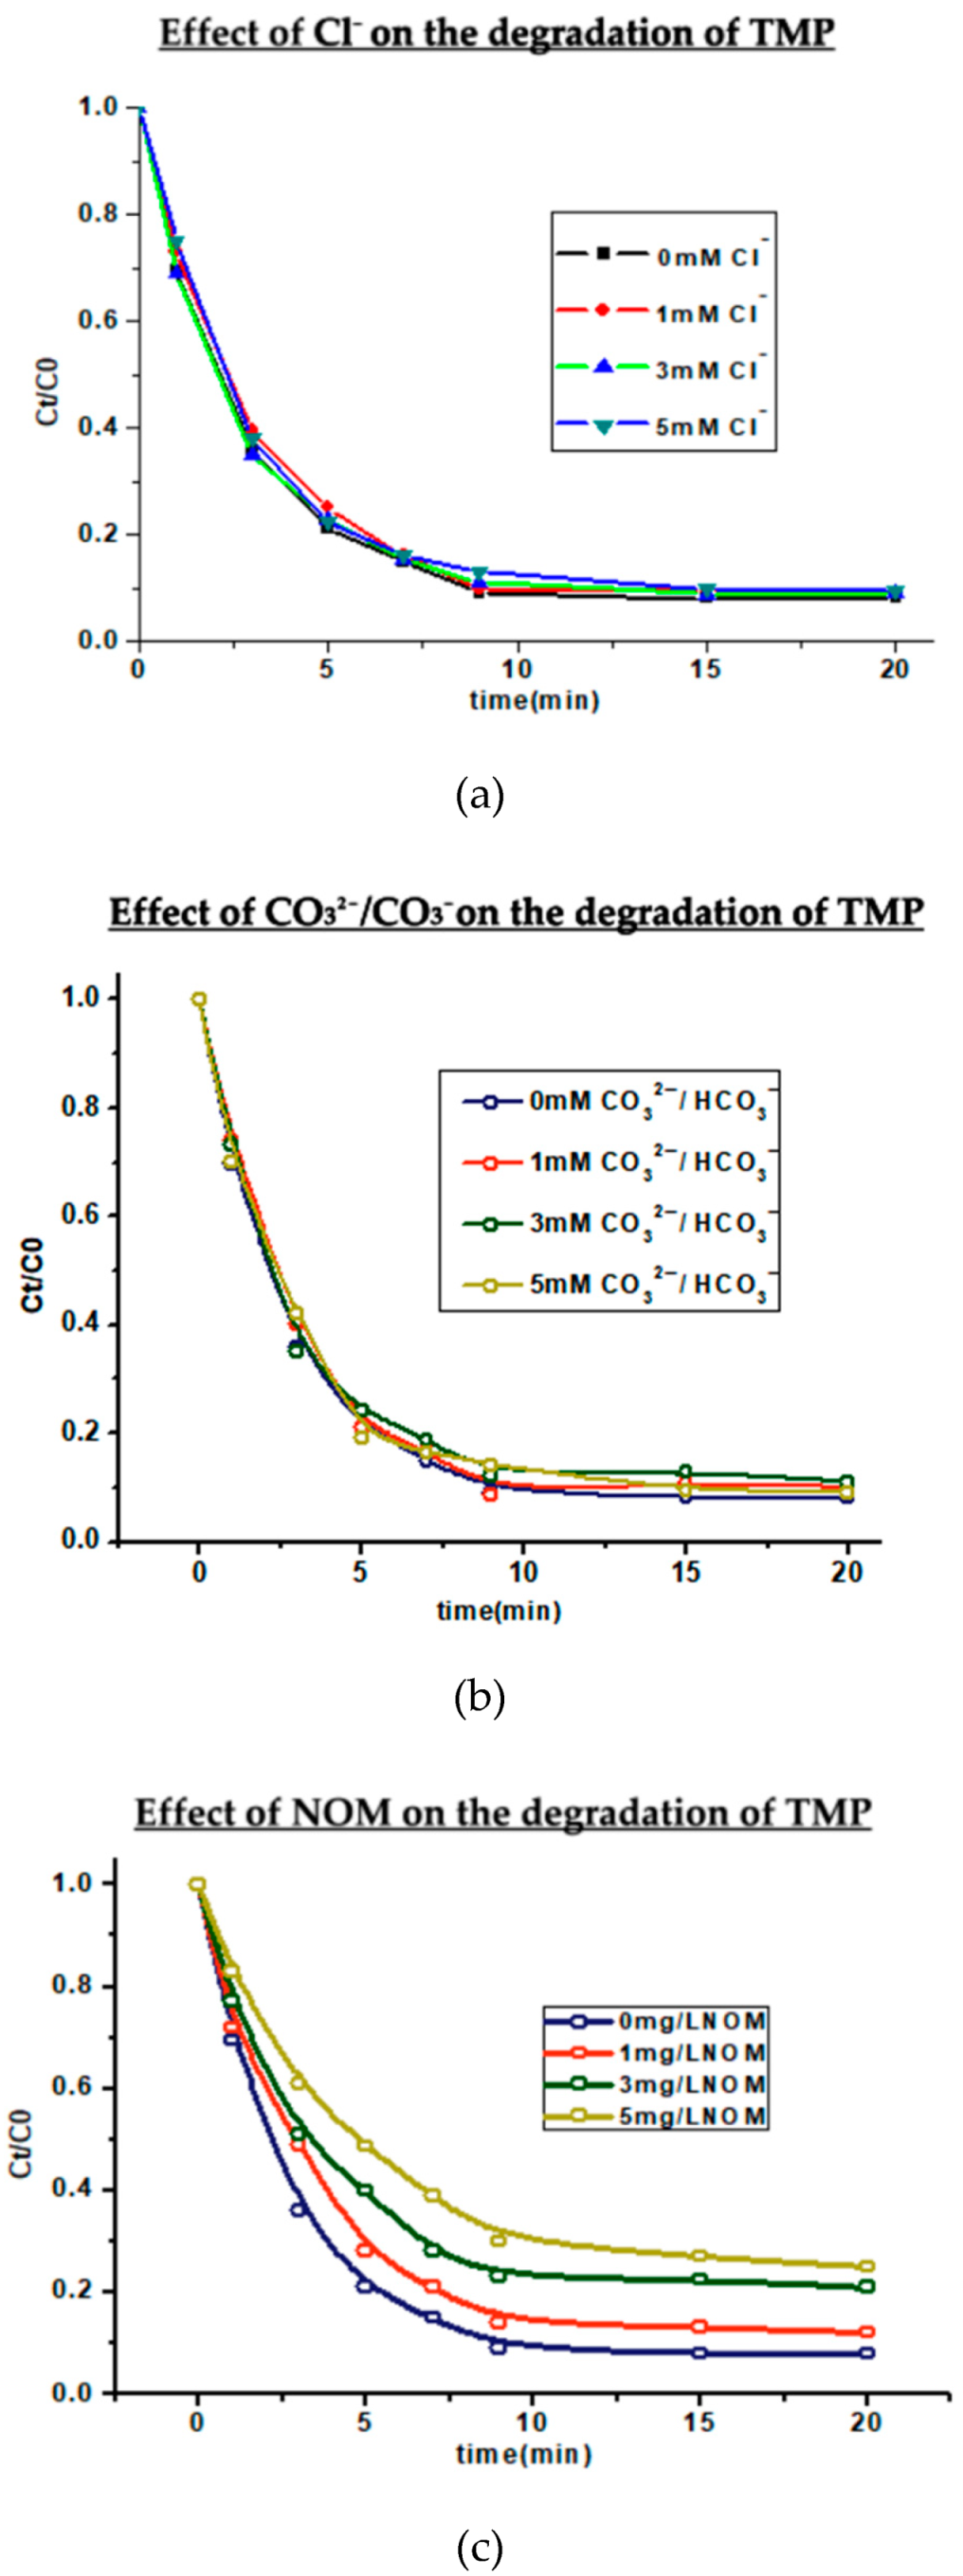
3.3. Effect of Chloride Ion on the UV/Free Chlorine Process

The chloride ion (Cl) was ubiquitous in the surface water. According to Figure 5a, the 1 mM to 5 mM concentration of the Cl slightly reduced the degradation rate of TMP. The Cl had negligible effect due the reasons that (1) the HO was not scavenged by the Cl, as reported by many studies [11]; and (2) the Cl rapidly reacted with the Cl to form the   Cl 2 ( Cl + Cl Cl 2 ). However, the Cl 2 dissociated fast to generate the Cl   again ( Cl 2 Cl + Cl ) rather than reacting fast with the TMP.

3.4. Effect of Bicarbonate/Carbonate on the UV/Free Chlorine Process

The bicarbonate and carbonate ions (HCO3/CO32−) were the common components in the water matrix. At the pH of 7, the molar distribution of the H2CO3 was 17.96%, the molar distribution of the HCO3 was 82% and the molar distribution of the CO32− was 0.04% [12]. Therefore, HCO3 was the dominant species at the neutral condition. The reactions, given in Equations (15)–(18), indicated that HCO3 reacted fast with HO•, Cl•, Cl2 and ClO• to generate CO3.
HO• + HCO3 → H2O + CO3 k = 8.5 × 10⁶ M−1s−1
Cl• + HCO3 → H2O + CO3 k = 2.2 × 10⁸ M−1s−1
Cl2 + HCO3 → CO3+ 2Cl+H+ k = 8.0 × 10⁷ M−1s−1
ClO + H CO 3 = CO 3 +   ClO + H +
As shown in Figure 5b, the 1 mM to 5 mM concentration of the HCO3/CO32− slightly reduced the degradation rate of TMP. The HCO3/CO32− had a negligible effect, which could be explained as below. The reactive radicals were scavenged by the HCO3/CO32−. However, the generated CO3 reacted very fast with the organic compounds containing the amine groups (such as the TMP) [13]. Other previous studies have also reported that the 1 mM concentration of the HCO3 slightly reduced the degradation rate of the antibiotics in the UV/free chlorine process (such as trimethoprim, salbutamol, clenbuterol and ractopamine). HCO3 has the ability to quench free radicals [14]. Therefore, the reaction equilibrium constant is more significant for Cl • radical quenching and Cl • plays an important role in the degradation process of the free chlorine process, which can explain the slight decrease in degradation rate.

3.5. Effect of NOM on the UV/Free Chlorine Process

The NOM was commonly found in the water matrix. Therefore, the impact of the NOM on the UV/free chlorine process was investigated. According to Figure 5c, (1) in the absence of the NOM, the TMP was efficiently removed by 90% in 9 min; and (2) in the presence of the NOM, ranging from 1 mg/L to 5 mg/L, the TMP was removed by 85% to 70% in 9 min. Therefore, the NOM inhibited the degradation rate of TMP due to the reasons that (1) the NOM absorbed the UV light, and its molar absorption coefficient was determined to be 0.041 L/mg cm in this study (shown in Figure S10); and (2) the NOM scavenged each of the reactive radicals. In addition, the time-dependent concentration profiles of the free chlorine under the various concentration conditions of the NOM are shown in Figure S12.
Figure 4b shows the EE/O heat map for the degradation of TMP with 3 mg/L NOM. According to Figure 4b, the minimum EE/O was calculated to be 0.311 kWh/m3, the optimum UV intensity was 3.45 ×   10 7 Einstein/L s and the optimum free chlorine dosage was 0.172 mM. The minimum EE/O and optimum operational conditions for the degradation of TMP with the other concentrations of the NOM (such as 1 mg/L and 5 mg/L) are listed in the Table S1.

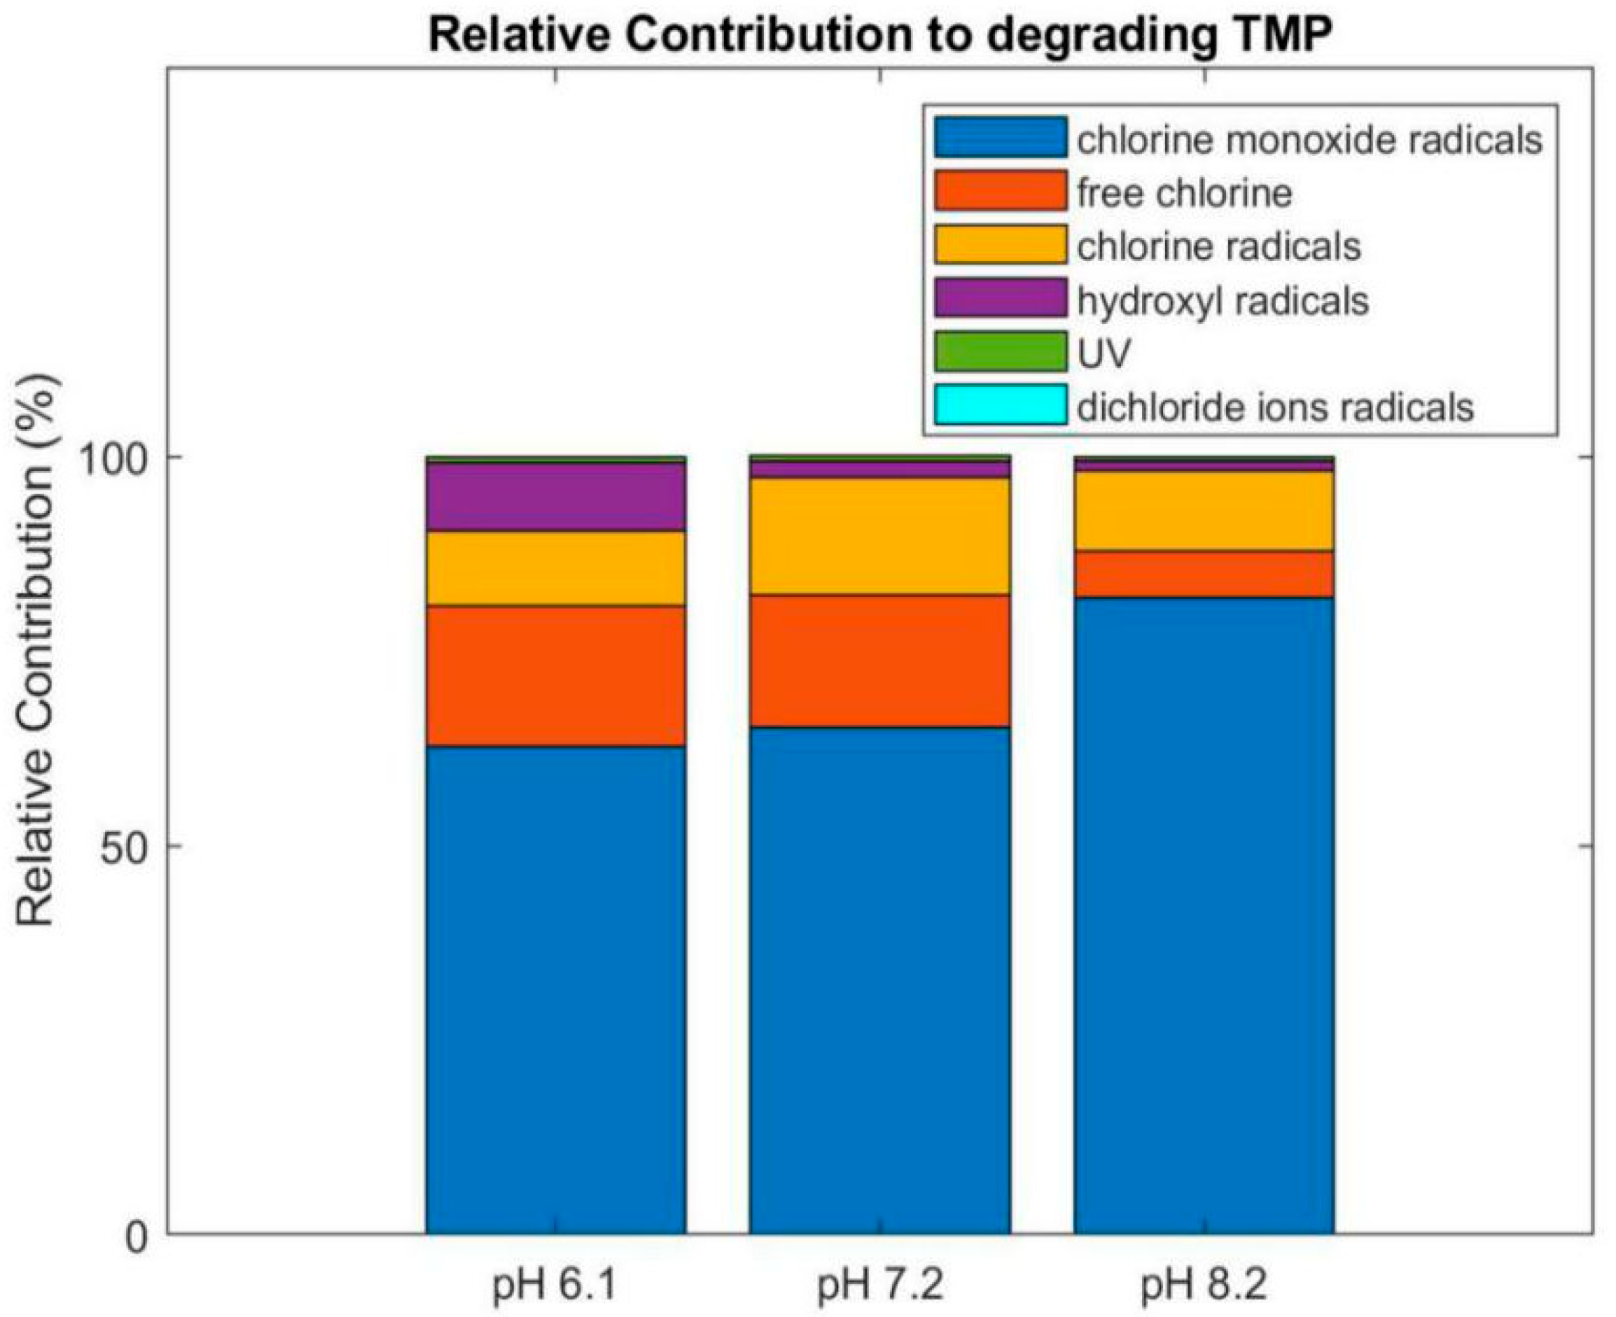
3.6. Relative Contribution of the Reactive Species, Photolysis and Chlorination

In the UV/free chlorine process, the degradation of the TMP was induced by the three factors, which included (1) the oxidation by free chlorine; (2) the photolysis by the ultraviolet light; and (3) the oxidation by the reactive radicals (HO•, Cl•, Cl2 and ClO•). According to the relevant literature reports [15], the relative average contributions of the photolysis, reactive radicals and the free chlorine, which degraded the TMP, are calculated by Equations (19)–(24).
Contribution   of   ClO
= [ t 0 t f ( k ClO / R [ ClO ] [ R ] k HO / R [ HO ] [ R ] + k Cl / R [ Cl ] [ R ] + k Cl 2 / R [ Cl 2 ] [ R ] + k ClO / R [ ClO ] [ R ] + r UV + r HOCl ) dt ] / ( t f t 0 )
Contribution of HO•
= [ t 0 t f ( k HO / R [ HO ] [ R ] k HO / R [ HO ] [ R ] + k Cl / R [ Cl ] [ R ] + k Cl 2 / R [ Cl 2 ] [ R ] + k ClO / R [ ClO ] [ R ] + r UV + r HOCl ) dt ] / ( t f t 0 )
Contribution   of   Cl
= [ t 0 t f ( k Cl / R [ Cl ] [ R ] k HO / R [ HO ] [ R ] + k Cl / R [ Cl ] [ R ] + k Cl 2 / R [ Cl 2 ] [ R ] + k ClO / R [ ClO ] [ R ] + r UV + r HOCl ) dt ] / ( t f t 0 )
Contribution of Cl2
= [ t 0 t f ( k Cl 2 / R [ Cl 2 ] [ R ] k HO / R [ HO ] [ R ] + k Cl / R [ Cl ] [ R ] + k Cl 2 / R [ Cl 2 ] [ R ] + k ClO / R [ ClO ] [ R ] + r UV + r HOCl ) dt ] / ( t f t 0 )
Contribution   of   UV
= [ t 0 t f ( r UV k HO / R [ HO ] [ R ] + k Cl / R [ Cl ] [ R ] + k Cl 2 / R [ Cl 2 ] [ R ] + k ClO / R [ ClO ] [ R ] + r UV + r HOCl ) dt ] / ( t f t 0 )
Contribution   of   free   chlorine
= [ t 0 t f ( r HOCl k HO / R [ HO ] [ R ] + k Cl / R [ Cl ] [ R ] + k Cl 2 / R [ Cl 2 ] [ R ] + k ClO / R [ ClO ] [ R ] + r UV + r HOCl ) dt ] / ( t f t 0 )
where [HO•], [Cl•], [Cl2•], [ClO•] and [R] are the concentrations of the reactive radicals and the TMP as a function of time; rUV is the photolysis rate of the TMP at time t, measured in M·s−1; rHOCl is the chlorination rate of the TMP at time t, measured in M·s−1; and t0 and tf are the initial and final time, respectively, which were 0 s and 1200 s, respectively.
According to Figure 6, the ClO• made the highest contribution to the degradation of TMP for the various pH values. The ClO• had the highest concentration at a pH of 8.2, which was mainly due to the fact that the main form of the free chlorine was ClO under the alkaline conditions. The rate constant of the reaction between the OH• and ClO was 10 times that of the OH• and HClO. Therefore, the ClO• produced at a pH of 8.2 was more than those at a pH of 6.1 and 7.2. The second dominant contributor to the degradation of TMP was the free chlorine at a pH of 6.1 and 7.2, while Cl• was the second dominant contributor at a pH of 8.2. The degradation of TMP induced by the UV and Cl2• was negligible. Therefore, the relative contributions of the UV and Cl2• are not shown in the Figure 6.

4. Conclusions

It was found that the UV/free chlorine process was more effective and faster for the oxidization of TMP than the UV alone or free chlorine alone process. In the UV/free chlorine process, it was concluded that (1) the high pH (pH > 8) and the NOM inhibited the degradation rate of TMP; (2) the HCO3/CO32− (with a concentration of 1 to 5 mM) and Cl (with a concentration of 1 to 5 mM) slightly reduced the degradation rate of TMP; and (3) the increase in the free chlorine dosage enhanced the degradation rate of TMP. A kinetic model was developed to simulate the degradation of TMP, and successfully estimated the unknown rate constants involved in this process. Considering the estimated kinetic data and the predicted concentrations of each of the reactive radicals, it was found that ClO• was the dominant species that degraded the TMP. Furthermore, the operational conditions were also optimized, resulting in the minimum EE/O, namely, (1) for the ultrapure water, the optimum intensity of the UV light and the free chlorine dosage were 2.56 Einstein/L s and 0.064 mM, respectively, with a minimum EE/O of 0.136 kWh/m3; and (2) for the water matrix containing 3 mg/L NOM, the optimum intensity of the UV light and the free chlorine dosage were 3.45 Einstein/L s and 0.172 mM, respectively, with a minimum EE/O of 0.311 kWh/m3. In general, this study can facilitate the most cost-effective application of the UV/free chlorine for practical application in the future.

Supplementary Materials

The following are available online at https://www.mdpi.com/article/10.3390/w13121656/s1, Figure S1: UV Reactor, Table S1: Elementary reactions for the UV/free chlorine process destructing organic contaminants. Figure S2: Determing UV intensity and effective path length. Table S2: the minimum EE/O and optimal operation conditions. Figure S3: Fitting for UV alone for TMP degradation. Figure S4: Three different forms of TMP. Figure S5: Effect of pH on free chlorine and UV/free chlorine system on TMP degradation. Figure S6: TMP initial chlorination rate vs. pH. Figure S7: Time required for TMP chlorination by free chlorine vs. pH. Figure S8: Time-dependent concentration profiles of free chlorine under difference pH conditions. Figure S9: Free chlorine decay under various free chlorine dosge. Figure S10: Absorbance of NOM at 254 nm. pH = 7. Figure S11: Fitting results for the UV/free chlorine process degradation TMP. Figure S12: The time-dependent concentration profiles of free chlorine for various initial concentration of NOM.

Author Contributions

Conceptualization, B.W. and Q.Z.; methodology, B.W.; software, W.Z.; validation, B.W., Q.Z. and Y.F.; formal analysis, J.C.C.; investigation, Q.Z.; resources, Z.R.; data curation, B.W. and Y.F., J.C.C.; writing—original draft preparation, B.W.; writing—review and editing, Y.F.; visualization, W.Z and H.W.; supervision, Y.F.; project administration, Z.R.; funding acquisition, B.W. All authors have read and agreed to the published version of the manuscript.

Funding

This research was financially supported by The National Natural Science Foundation of China (No. 51508343) and Study on three-phase synergistic phosphorus recovery mechanism in anaerobic treatment of phosphorus rich wastewater (2019-ZD-0298), Project of Science and Technology Department of Liaoning Province, 2019 and Food waste induces surplus sludge to enhance the fermentation performance of L-lactic acid bacteria (1nqn202011), Project of Education Department of Liaoning Province, 2020.

Institutional Review Board Statement

Not applicable for studies not involving human or aninmals.

Informed Consent Statement

Not applicable for studies not involving human.

Data Availability Statement

Date is contained within the article or supplementary material. The data presented in this study are available in [insert article or supplementary material here].

Acknowledgments

This research was financially supported by The National Natural Science Foundation of China (No. 51508343), and Study on three-phase synergistic phosphorus recovery mechanism in anaerobic treatment of phosphorus rich wastewater (2019-ZD-0298, Project of Science and Technology Department of Liaoning Province, 2019 and Food waste induces surplus sludge to enhance the fermentation performance of L-lactic acid bacteria (1nqn202011), Project of Education Department of Liaoning Province, 2020. The authors appreciate the support from the Brook Byers Institute for Sustainable Systems, Hightower Chair and Georgia Research Alliance at the Georgia Institute of Technology. The authors also appreciate the funding from Chinese scholarship council. The views and ideas expressed herein are solely those of the authors and do not represent the ideas of the funding agencies in any form.

Conflicts of Interest

The authors declared that they have no conflicts of interest to this work. We declare that we do not have any commercial or associative interest that represents a conflict of interest in connection with the work submitted.

References

  1. Sun, Z.; Gui, N.; Gao, N.; Zhang, Y.; Zhu, M. Research progress on advanced oxidative degradation of antibiotics in water. Sichuan Environ. 2014, 33, 146–153. [Google Scholar]
  2. Eliopoulos, G.M.; Moellering, R.C.J. Antibiotics in Laboratory Medicine; Lorian, V., Ed.; Waverly and Wilkins: Baltimore, MD, USA, 1996; pp. 331–396. [Google Scholar]
  3. Wu, Z.; Fang, J.; Xiang, Y.; Shang, C. Roles of reactive chlorine species in trimethoprim degradation in the UV/chlorine process: Kinetics and transformation pathways. Water Res. 2016, 104, 272–282. [Google Scholar] [CrossRef] [PubMed]
  4. Varanasi, L.; Coscarelli, E.; Khaksari, M.; Mazzoleni, L.R.; Minakata, D. Transformations of dissolved organic matter induced by UV photolysis, hydroxyl radicals, chlorine radicals, and sulfate radicals in aqueous-phase UV-based advanced oxidation processes. Water Res. 2018, 135, 22–30. [Google Scholar] [CrossRef] [PubMed]
  5. Sichel, C.; Garcia, C.; Andre, K. Feasibility studies: UV/chlorine advanced oxidation treatment for the removal of emerging contaminants. Water Res. 2011, 45, 6371–6380. [Google Scholar] [CrossRef] [PubMed]
  6. Wang, Y.R.; Chu, W. Photo-assisted degradation of 2, 4, 5-trichlorophenoxyacetic acid by Fe (II)-catalyzed activation of Oxone process: The role of UV irradiation, reaction mechanism and mineralization. Appl. Catal. B Environ. 2012, 123, 151–161. [Google Scholar] [CrossRef]
  7. Wang, D.; Bolton, J.R.; Hofmann, R. Medium pressure UV combined with chlorine advanced oxidation for trichloroethylene destruction in a model water. Water Res. 2012, 46, 4677–4686. [Google Scholar] [CrossRef]
  8. Wang, T.X.; Margerum, D.W. Kinetics of reversible chlorine hydrolysis—temperature-dependence and general acid base-assisted mechanisms. Inorg. Chem. 1994, 33, 1050–1055. [Google Scholar] [CrossRef]
  9. Dodd, M.C.; Huang, C. Aqueous chlorination of the antibacterial agent trimethoprim: Reaction kinetics and pathways. Water Res. 2007, 41, 647–655. [Google Scholar] [CrossRef] [PubMed]
  10. Klaning, U.K.; Wolff, T. Laser flash photolysis of HClO, C1O-, HBrO, and BrO-in Aqueous Solution Reactions of C1- and Br-Atoms. Berichte Bunsenges. Phys. Chem. Phys. 1985, 89, 243–245. [Google Scholar]
  11. Zhang, W.; Zhou, S.; Sun, J.; Meng, X.; Luo, J.; Zhou, D.; Crittenden, J.C. Impact of chloride ions on UV/H2O2 and UV/persulfate advanced oxidation processes. Environ. Sci. Technol. 2018, 52, 7380–7389. [Google Scholar] [CrossRef] [PubMed]
  12. Kong, X.; Jiang, J.; Ma, J.; Yang, Y.; Liu, W.; Liu, Y. Degradation of atrazine by UV/chlorine: Efficiency, influencing factors, and products. Water Res. 2016, 90, 15–23. [Google Scholar] [CrossRef] [PubMed]
  13. Liu, T.; Yin, K.; Liu, C.; Luo, J.; Crittenden, J.; Zhang, W.; Luo, S.; He, Q.; Deng, Y.; Liu, H. The role of reactive oxygen species and carbonate radical in oxcarbazepine degradation via UV, UV/H2O2: Kinetics, mechanisms and toxicity evaluation. Water Res. 2018, 147, 204–213. [Google Scholar] [CrossRef] [PubMed]
  14. Guo, K.; Wu, Z.; Shang, C.; Yao, B.; Hou, S.; Yang, X.; Song, W.; Fang, J. Radical chemistry and structural relationships of PPCP degradation by UV/chlorine treatment in simulated drinking water. Environ. Sci. Technol. 2017, 51, 10431–10439. [Google Scholar] [CrossRef] [PubMed]
  15. Fang, J.; Fu, Y.; Shang, C. The roles of reactive species in micropollutant degradation in the UV/free chlorine system. Environ. Sci. Technol. 2014, 48, 1859–1868. [Google Scholar] [CrossRef] [PubMed]
Figure 1. The initial chlorination rates of TMP under the various pH conditions.
Water 13 01656 g001
Figure 2. Fitting results of the chlorination of TMP under various pH. Conditions: [TMP]0 = 0.01 mM, [free chlorine]0 = 0.05 mM.
Water 13 01656 g002
Figure 3. Fitting results for the UV/free chlorine process degradation of TMP under various pH levels. Conditions: [TMP]0 = 0.01 mM, [free chlorine]0 = 0.05 mM, UV light intensity = 9.45 × 10⁻⁷ Einstein/L s.
Water 13 01656 g003
Figure 4. EE/O for the degradation of TMP in the UV/free chlorine process. (a) EE/O for the degradation of TMP when NOM was not present; (b) EE/O for the degradation of TMP when NOM was present. Conditions: [TMP]0 = 0.01 mM, [NOM] = 3 mg/L, pH 7.2.
Water 13 01656 g004
Figure 5. Effect of the water matrix components on the degradation of TMP in the UV/free chlorine process. (a) Effect of chloride ion (Cl−), [TMP] 0 = 0.01 mM, [free chlorine] 0 = 0.05 mM, [Cl−]0 = 1 mM to 5 mM; (b) Effect of HCO3 / CO32− [TMP]0 = 0.01 mM [free chlorine]0 = 0.05 mM, [HCO3− / CO32−]0 = 1 mM to 5 mM; (c) effect of NOM, [TMP]0 = 0.01 mM [free chlorine]0 = 0.05 mM, [NOM]0 = 1 mg/L to 5 mg/L. UV light intensity = 9.45 × 10⁻⁷ Einstein/L s.
Water 13 01656 g005
Figure 6. Relative average contribution of the UV, reactive radicals and free chlorine under various pH levels. [TMP] 0 = 0.01 mM, [free chlorine] 0 = 0.05 mM, UV light intensity = 9.45 × 10⁻⁷ Einstein/L s.
Water 13 01656 g006
Table 1. Ionic species of the HOCl and TMP for the various pH values.
pHHOCl (Mole %)OCl (Mole %)TMP+2
(Mole %)
TMP+
(Mole %)
TMP
(Mole %)
599.70600.29401.548097.67600.7760
697.13302.86700.147092.50507.3480
777.213022.78700.009055.726044.2650
825.309074.69100.000211.181688.8183
Publisher’s Note: MDPI stays neutral with regard to jurisdictional claims in published maps and institutional affiliations.

